utah medical products, inc.e).pdf · 2019. 2. 12. · utah medical products, inc., with particular...
TRANSCRIPT

U TA H ME D IC A L P R ODU C T S , IN C .
A N N U A L R E P O R T2017

Utah Medical Products, Inc., with particular interest in health care for
women and their babies, develops, manufactures and markets a broad
range of disposable and reusable specialty medical devices recognized by
clinicians in over one hundred countries around the world as the standard
for obtaining optimal long term outcomes for their patients.
UTAH MEDICAL PRODUCTS, INC.
GROSS PROFITS(millions of dollars)
24
16
8
0 13 14 15 16 17
42
28
14
0
NET SALES(millions of dollars)
13 14 15 16 17
15
10
5
0
OPERATING PROFITS(millions of dollars)
13 14 15 16 17

UTMD2017 11
12.0
9.0
6.0
3.0
0 13 14 15 16 17
NET INCOME(millions of dollars)
■■ REPAT tax & Deferred tax adjustment
3.00
2.00
1.00
0
EARNINGS PER SHARE(dollars)
■■ REPAT tax & Deferred tax adjustment
13 14 15 16 17
5 Year Summary of Operations (In thousands, except per share amounts)
2017 2016 2015 2014 2013
Net sales $41,414 $39,298 $40,157 $41,278 $40,493
Net income – GAAP 8,505 12,128 11,843 11,378 11,406
Net income before REPAT tax & DTL adj's 14,562 12,004 11,493 11,378 10,430
Total assets 92,745 76,191 79,175 81,076 80,711
Long-term debt — — — 973 5,065
Stockholders' equity 78,122 69,243 69,648 64,556 60,581
Earnings per common share – GAAP (diluted) $ 2.28 $ 3.22 $ 3.14 $ 3.02 $ 3.02
Earnings per common share before REPAT tax & DTL adj's (diluted) $ 3.90 $ 3.19 $ 3.05 $ 3.02 $ 2.76
Cash dividends per share $ 1.07 $ 1.05 $ 1.03 $ 1.01 $ .99
Weighted average common shares (diluted) 3,737 3,766 3,772 3,774 3,775
Quarterly Income Statement Summaries (In thousands, except per share amounts)
First Second Third Fourth Quarter Quarter Quarter Quarter
2017
Net sales $10,259 $10,829 $10,125 $10,201
Gross profit 6,535 6,893 6,496 6,470
Net income 3,536 3,870 3,622 (2,522)
Earnings per share $ 0.95 $ 1.04 $ 0.97 $ (0.67)
2016
Net sales $10,301 $10,490 $ 9,655 $ 8,852
Gross profit 6,223 6,252 5,775 5,440
Net income 3,217 3,259 2,935 2,717
Earnings per share $ 0.85 $ 0.86 $ 0.78 $ 0.73
2015
Net sales $10,233 $10,397 $ 9,945 $ 9,582
Gross profit 6,112 6,099 6,079 5,894
Net income 2,667 2,918 3,047 3,211
Earnings per share $ 0.71 $ 0.77 $ 0.81 $ 0.85

In 2017, UTMD concluded a year in which all income
statement measures were close to historical Company
records. Consolidated sales were up a healthy 5.4%,
$2.1 million higher in U.S. Dollar terms. But income
before taxes jumped even more by $2.7 million, due to
leverage in gross profit and operating income margins.
As a result, 2017 Net Income (NI) and Earnings Per
Share (EPS) prior to the impact of recent tax law
changes in the US and UK were up 21% and 22%
respectively. In actual numbers, NI grew by $2.6
million to $14.6 million (35.2% of sales) from $12.0
million (30.5% of sales) in 2016. EPS were $3.90
compared to $3.19 in the prior year.
In addition to the Company’s typical effective
management of manufacturing costs and operating
expenses, this financial growth was the result of
beginning to distribute the Filshie Clip System directly
to end user facilities in Canada and France, rather than
through third party distributors.
UTMD’s investment in new facilities in Canada and the
UK provided the necessary infrastructure for directly
supporting direct distribution in Canada and France.
The Company now owns all of its facilities in the U.S.,
Ireland, United Kingdom, Australia and Canada, which
will serve as a basis for further growth and profitability.
Our employees are proud of these facilities, and invite
stockholders to stop by for a visit if ever in the vicinity.
As one of UTMD management’s stated key objectives,
prospecting for an accretive acquisition has been a
continuous effort in recent years. One way to think of
the 2017 distribution change is that it represented an
“acquisition” which yielded an increase of $2.8 million
in positive cash flow. In the current M&A market,
acquiring a regulatory-approved, well-accepted
and differentiated medical device with that kind of
financial performance would have probably cost
stockholders $30 million or more.
Stockholders no doubt remember that UTMD’s
2011 acquisition of Femcare came with an exclusive
distribution agreement with CooperSurgical Inc.
for the Filshie Clip System in the U.S. market. The
positive financial impact of converting to UTMD
direct distribution in the U.S. would likely be at least
three times that of the 2017 conversion in Canada and
France, as UTMD’s operating infrastructure in the
U.S. is already sufficient to absorb that responsibility.
Looking forward, this represents another highly
accretive “acquisition” that will happen at the latest in
just over five years, without any significant investment
cost to UTMD stockholders.
Thanks to a favorable stock market and UTMD’s
continued growth in EPS, the stock ended the year
at $81.40 per share. When adding dividends paid
to stockholders, the rate of return to stockholders
has been 15% annually compounded growth in
shareholder value for the last nineteen years’ tenure of
the current board of directors, save one person who has
only been a director for the last ten years. I am pleased
that a number of UTMD’s larger institutional investors
have been stockholders for that length of time.
To Our Stockholders
Letter from the President
2 UTMD2017

hit UTMD’s income statement in the fourth quarter of
2017, according to GAAP. The Company can absorb
the substantial assessment without affecting normal
operations, capital allocation plans or longer term
opportunities for growth, and in the future will make
the best of the tax changes for stockholders.
UTMD’s new ability to bring cash generated overseas
to the U.S. without further taxation will be most helpful
if we have an opportunity to repurchase UTMD shares
at a price favorable for continuing stockholders, or to
help fund an acquisition in the U.S. which meets our
investment criteria.
In summary, we hope stockholders are satisfied
with the 2017 results. In 2018, we now have a higher
performance level from which to grow. As the business
and economic environment is ever changing, we
recognize and accept the challenge. Thank you for your
interest and continued ownership in UTMD.
Kevin L. Cornwell
Chairman & CEO
We look forward to discussing UTMD’s pragmatic
approach to consistent growth in shareholder
value and capital allocation at the annual meeting
of stockholders in May. For the first time, we have
received a proposal in the name of “accountability”
submitted by an institutional stockholder, the
California Public Employees’ Retirement System
(CalPERS). I ask that your consideration of UTMD’s
performance should represent the best basis for
accountability rather than some bureaucratic dogma.
The board of directors has always listened carefully to
inputs and suggestions from UTMD stockholders, but
makes decisions based on our joint best judgment of
what will lead to maximizing stockholder value and
achieving its corporate mission. We also do not think
much of “bureaucratic correctness” that might seem
plausible on the surface, but in reality for our company
could be potentially damaging to future performance.
I ask that you vote AGAINST this proposal for the
reasons outlined in the proxy statement.
For more details regarding 2017 results and projections
for 2018, please read the Management Discussion &
Analysis (MD&A) section of this report and UTMD’s 2017
SEC Form 10-K available at http://www.utahmed.com.
The details include the financial impact per U.S.
Generally Accepted Accounting Principles (GAAP)
of the special, one-time repatriation tax assessed on
cumulative foreign earnings and profits as part of the
U.S. “Tax Cuts and Jobs Act”, which was enacted in
December 2017. The entire $6.3 million assessment
3UTMD2017
Currency amounts are in thousands except per-share amounts and
where noted. Currencies are abbreviated as follows: the U.S. Dollar
(USD or $), the Great Britain Pound (GBP or £), the Euro (EUR or €), the
Australian Dollar (AUD or A$) and the Canadian Dollar (CAD or C$).
The following comments should be read in conjunction with
the accompanying financial statements.
OverviewExcellent growth in year 2017 financial results were
accomplished primarily as a result of Utah Medical Products, Inc.
(UTMD) converting from distributing the Filshie Clip System
in the countries of Canada and France through third party
distributors to selling directly to medical facility users. Although
UTMD substantially exceeded management expectations for
2017 financial performance, the results became masked by the
recognition of a one-time repatriation tax (REPAT) on foreign
subsidiary cash and cumulative earnings (E&P). The REPAT
impact of the U.S. “Tax Cuts and Jobs Act”, which was enacted
in December 2017, is included in 2017 results according to U.S.
Generally Accepted Accounting Principles (GAAP). All income
statement categories of UTMD’s 2017 operating performance
were unaffected by the REPAT tax except for provision for income
taxes, Net Income (NI), and Earnings Per Share (EPS).
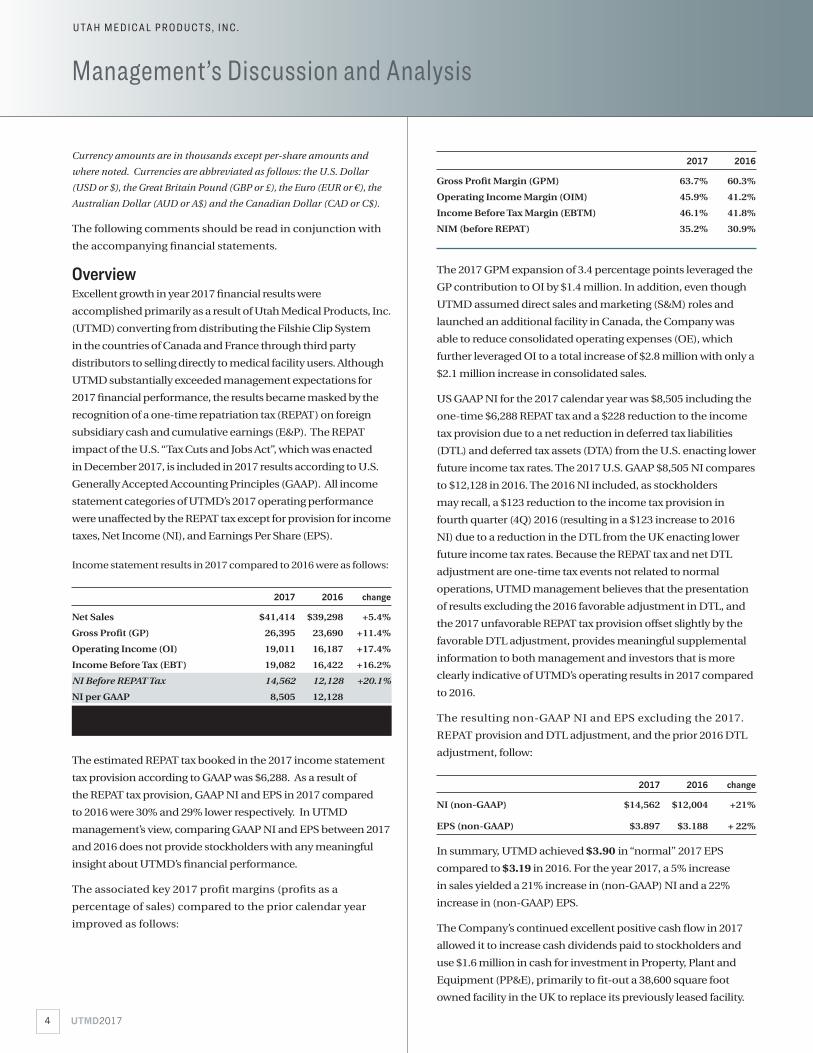
Income statement results in 2017 compared to 2016 were as follows:
2017 2016 change
Net Sales $41,414 $39,298 +5.4%
Gross Profit (GP) 26,395 23,690 +11.4%
Operating Income (OI) 19,011 16,187 +17.4%
Income Before Tax (EBT) 19,082 16,422 +16.2%
NI Before REPAT Tax 14,562 12,128 +20.1%
NI per GAAP 8,505 12,128
EPS Before REPAT Tax 3.897 3.220 +21.0%
EPS per GAAP 2.276 3.220
The estimated REPAT tax booked in the 2017 income statement
tax provision according to GAAP was $6,288. As a result of
the REPAT tax provision, GAAP NI and EPS in 2017 compared
to 2016 were 30% and 29% lower respectively. In UTMD
management’s view, comparing GAAP NI and EPS between 2017
and 2016 does not provide stockholders with any meaningful
insight about UTMD’s financial performance.
The associated key 2017 profit margins (profits as a
percentage of sales) compared to the prior calendar year
improved as follows:
2017 2016
Gross Profit Margin (GPM) 63.7% 60.3%
Operating Income Margin (OIM) 45.9% 41.2%
Income Before Tax Margin (EBTM) 46.1% 41.8%
NIM (before REPAT) 35.2% 30.9%
The 2017 GPM expansion of 3.4 percentage points leveraged the
GP contribution to OI by $1.4 million. In addition, even though
UTMD assumed direct sales and marketing (S&M) roles and
launched an additional facility in Canada, the Company was
able to reduce consolidated operating expenses (OE), which
further leveraged OI to a total increase of $2.8 million with only a
$2.1 million increase in consolidated sales.
US GAAP NI for the 2017 calendar year was $8,505 including the
one-time $6,288 REPAT tax and a $228 reduction to the income
tax provision due to a net reduction in deferred tax liabilities
(DTL) and deferred tax assets (DTA) from the U.S. enacting lower
future income tax rates. The 2017 U.S. GAAP $8,505 NI compares
to $12,128 in 2016. The 2016 NI included, as stockholders
may recall, a $123 reduction to the income tax provision in
fourth quarter (4Q) 2016 (resulting in a $123 increase to 2016
NI) due to a reduction in the DTL from the UK enacting lower
future income tax rates. Because the REPAT tax and net DTL
adjustment are one-time tax events not related to normal
operations, UTMD management believes that the presentation
of results excluding the 2016 favorable adjustment in DTL, and
the 2017 unfavorable REPAT tax provision offset slightly by the
favorable DTL adjustment, provides meaningful supplemental
information to both management and investors that is more
clearly indicative of UTMD’s operating results in 2017 compared
to 2016.
The resulting non-GAAP NI and EPS excluding the 2017.
REPAT provision and DTL adjustment, and the prior 2016 DTL
adjustment, follow:
2017 2016 change
NI (non-GAAP) $14,562 $12,004 +21%
EPS (non-GAAP) $3.897 $3.188 + 22%
In summary, UTMD achieved $3.90 in “normal” 2017 EPS
compared to $3.19 in 2016. For the year 2017, a 5% increase
in sales yielded a 21% increase in (non-GAAP) NI and a 22%
increase in (non-GAAP) EPS.
The Company’s continued excellent positive cash flow in 2017
allowed it to increase cash dividends paid to stockholders and
use $1.6 million in cash for investment in Property, Plant and
Equipment (PP&E), primarily to fit-out a 38,600 square foot
owned facility in the UK to replace its previously leased facility.
UTMD20174
Management’s Discussion and Analysis
U TA H M E D I C A L P R O D U C TS , I N C .

Consolidated Balance Sheet
December 31, 2017 2016
AssetsCurrent assets:
Cash $ 39,875 $ 26,296
Investments, available-for-sale (notes 3 and 4) 80 64
Accounts and other receivables, net (note 2) 3,623 3,211
Inventories (note 2) 5,244 4,542
Prepaid expenses and other current assets 366 361
Total current assets 49,188 34,474
Property and equipment, net (notes 5 and 11) 11,621 9,966
Goodwill 14,092 13,487
Other intangible assets (note 2) 34,805 31,947
Other intangible assets — accumulated amortization (16,961) (13,683)
Other intangible assets — net (note 2) 17,844 18,264
Total assets $ 92,745 $ 76,191`
Liabilities and Stockholders’ EquityCurrent liabilities:
Accounts payable $ 934 $ 906
Accrued expenses (note 2) 4,346 2,116
Total current liabilities 5,280 3,022
Long Term income tax payable (note 8) 5,785 —
Deferred tax liability - intangible assets 3,102 3,209
Deferred income taxes (note 8) 456 716
Total liabilities 14,623 6,947
Commitments and contingencies (notes 7 and 13) — —
Stockholders' equity:
Preferred stock, $.01 par value; 5,000 shares authorized, no shares issued and outstanding — —
Common stock, $.01 par value; 50,000 shares authorized, issued 3,721 shares in 2017 and 3,713 shares in 2016 37 37
Accumulated other comprehensive income (loss) (8,341) (12,243)
Additional paid-in capital 809 378
Retained earnings 85,617 81,072
Total stockholders' equity 78,122 69,244
Total liabilities and stockholders' equity $ 92,745 $ 76,191
See accompanying notes to financial statements.
5UTMD2017
(In thousands)

Measures of the Company’s liquidity and overall financial
condition improved as of the end of 2017 compared to the end
of 2016 as the result of continued strong positive cash flow from
normal operations, but were diluted by the assessment of the
REPAT tax. UTMD increased its cash balances to $40 million
at the end of 2017 compared to $26 million at the end of 2016.
Current assets increased 43% and total assets increased 22%.
Although the Company remained without debt, total liabilities
increased $7,676. The accrued REPAT tax added $6,288, and
delaying the payment date of the 4Q 2017 dividend from late
December to early January added another $1,005 to accrued
liabilities. As a result, UTMD’s total debt ratio (total liabilities to
total assets) was 16% at the end of 2017 compared to 9% at the
end of 2016. Stockholders’ Equity increased to $78.1 million
from $69.2 million at the end of 2016 largely from $8.5 million
in GAAP NI. The return on average Stockholders’ Equity (ROE)
prior to the payment of dividends was 11.5% in 2017 compared
to 17.5% in 2016. Excluding the effect of the REPAT tax on NI
and average stockholders’ equity and before dividends, UTMD’s
2017 ROE was 19% compared to 17% in 2016.
Productivity of Assets and Working Capital AssetsAssets. Year-end 2017 total consolidated assets were $92,745
comprised of $49,188 in current assets, $11,621 in consolidated
net PP&E and $31,936 in net intangible assets. This compares
to $76,191 total assets at the end of 2016 comprised of $34,474
in current assets, $9,966 in consolidated net PP&E and $31,751
in net intangible assets. Total asset turns (total consolidated
sales divided by average total assets for the year) in 2017 were
49%, compared to 50% in 2016. The 2017 increase in assets,
primarily cash, was greater than the increase in sales.
Current assets increased $14,714 due to a $13,595 increase
in cash and investments, a $412 increase in accounts and
other receivables and a $702 increase in year-end inventories.
Year-end 2017 and 2016 cash and investment balances were
$39,955 and $26,360, representing 43% and 35% of total assets,
respectively. Net (after allowance for doubtful accounts) year-
end trade accounts receivable (A/R) balances increased $412
due to $1,349 stronger 4Q 2017 sales than in 4Q 2016. Average
days in A/R from date of invoice on December 31, 2017 were
32 days based on 4Q 2017 shipments, about the same aging as
at the end of 2016. The Company believes any older A/R will
be collected or are within its reserve balances for uncollectible
amounts. Average 2017 consolidated inventory turns were 3.1
compared to 3.6 in 2016 based on the applicable year’s cost of
goods sold. The Company’s cash reserves allowed it to increase
inventories to take advantage of quantity discounts from vendors.
Working capital (current assets minus current liabilities) at
year-end 2017 was 40% higher at $43,909 compared to $31,451
at year-end 2016. Consistent with Federal rules, 2017 ending
current liabilities included $503 (8%) of the total REPAT tax
liability which did not exist at the end of 2016. As the timing of
the required payment of the State portion of the REPAT tax is
still unknown, UTMD divided the estimated liability the same
as for the Federal portion, i.e. 8% current. If all of the State
REPAT tax becomes due within one year, current liabilities
would be $979 higher. Even with $979 higher current liabilities,
the end of 2017 working capital significantly exceeds UTMD’s
needs for normal operations, funding future growth and timely
payment of accrued REPAT tax liabilities.
PP&E includes Utah, Ireland and England manufacturing
molds, production tooling and equipment, test equipment,
and product development laboratory equipment. In
addition, PP&E includes computers and software, warehouse
equipment, furniture and fixtures, facilities and real estate for
all five locations in Utah, Ireland, UK, Canada and Australia,
the fungible market value of which increases UTMD’s
enterprise value relative to most of its industry peers. In
late 2017, UTMD in the UK finished set-up and seamlessly
began operations in a 38,600 square foot facility in Romsey,
Hampshire. The manufacturing facilities in Utah, Ireland and
the UK are standalone buildings, whereas the distribution
facilities in Australia and Canada are part of larger industrial
condominiums. Ending 2017 net consolidated PP&E
(depreciated book value of all fixed assets) increased $1,655 as
a result of capital expenditures of $1,597, depreciation of $660
and the effect of foreign currency exchange (FX) rates on year-
end foreign subsidiary asset balances
The following end-of-year FX rates in USD applied to assets and
liabilities of each applicable foreign subsidiary:
12-31-17 12-31-16
EUR 1.2021 1.0555
GBP 1.3523 1.2338
AUD 0.7815 0.7231
CAD 0.7988 0.7449
The year-end 2017 net book value (after accumulated
depreciation) of consolidated PP&E was 36% of purchase cost.
End-of-year PP&E turns (Net Sales divided by Net PP&E) was
3.6 in 2017 compared to 3.9 in 2016 due to the new facility in
the UK and a weaker USD. The future leverage in productivity
of fixed assets which will not have to be increased to support
new business activity will be a source of future profitability.
In 2018, PP&E purchases to support ongoing operations are
not expected to exceed depreciation of fixed assets.
UTMD20176
Management’s Discussion and Analysis (continued)
U TA H M E D I C A L P R O D U C TS , I N C .

Net intangible assets (after accumulated amortization) are
comprised of the capitalized costs of obtaining patents
and other intellectual property, as well as the value of
identifiable intangible assets (IIA) and goodwill resulting from
acquisitions. Net intangible assets were $31,936 (34% of total
assets) at the end of 2017 compared to $31,751 (41% of total
assets) at the end of 2016. Per US GAAP, intangible assets are
categorized as either 1) IIA, which are amortized over the
estimated useful life of the assets, or 2) goodwill, which is not
amortized or expensed until the associated economic value of
the acquired asset becomes impaired. The two categories of
Femcare intangibles at year-end 2017 were net IIA of $17,764
and goodwill of $6,900. The accumulated amortization of
Femcare IIA as of December 31, 2017 since the March 18,
2011 acquisition was $14,785. UTMD’s goodwill balance
was $14,092 at the end of 2017, 44% of total net intangibles.
Because the products associated with UTMD’s acquisitions of
Columbia Medical in 1997, Gesco in 1998, Abcorp in 2004 and
Femcare in 2011 continue to be viable parts of UTMD’s overall
business, UTMD does not expect the current goodwill value
associated with the four acquisitions to become impaired
in 2018. Amortization of intangibles was $2,113 in 2017
compared to $2,223 in 2016. The 2017 non-cash amortization
expense of Femcare IIA was $2,055 (£1,595) compared to
$2,167 (£1,599) in 2016. The USD difference was essentially
due to the change in USD/GBP FX rate. The 2018 non-cash
amortization expense of Femcare IIA will again be £1,595, or
$2,201 if the USD/GBP average FX rate is 1.3
Liabilities. The $6,288 accrued REPAT tax liability resulting
from the U.S. “Tax Cuts and Jobs Act” (the Tax Act), which was
enacted in December 2017, is included in 2017 end liabilities.
This liability was not present in the 2016 end balance sheet.
The Federal payment requirement is 8% of the REPAT tax
liability per year for the first five years, 15% in the sixth year,
20% in the seventh year and 25% in the eighth year. Because
the State of Utah typically uses Federal taxable income as
a basis, the REPAT provision includes an estimated $1,065
portion payable to the State. Consistent with Federal rules,
eight percent of the total REPAT tax liability ($503) is included
in UTMD’s 2017 end current liabilities, with the remaining
$5,785 in longer term liabilities. If the State, on a worst case
basis for cash flow, decides that its entire REPAT tax levy is to
be paid within one year, then the portion of the total REPAT
tax liability included in 2017 end current liabilities would be
$1,482 ($979 higher current liabilities and $979 lower long
term liabilities). Slightly offsetting the REPAT tax liabilities was
a $230 reduction in UTMD’s U.S. deferred tax liability due to
the Tax Act’s enactment of a lower future income tax rate.
UTMD2017 7
13 14 15 16 17
4.0
3.7
3.4
3.1
2.8
5.0
4.5
4.0
3.5
3.0
■■■ ■■■AVERAGE AVERAGEINVENTORY TURNS($ million) (number of times)
95
90
85
80
75
70
1.0
0.8
0.6
0.4
0.2
0
■■■ ■■■TOTAL END OF YEAR ASSETS TURNS($ million) (number of times)
13 14 15 16 17
11
10
9
8
7
6
5.5
5.0
4.5
4.0
3.5
3.0
■■■ ■■■NET END OF YEARPP&E TURNS($ million) (number of times)
13 14 15 16 17
4.5
4.0
3.5
3.0
2.5
46
42
38
34
30
■■■ ■■■YEAR-END A/RA/R AGING DAYS($ million) (4th quarter base)
13 14 15 16 17
15
12
9
6
3
0
50
40
30
20
10
0
■■■ ■■■YEAR-END TOTALWORKING CURRENTCAPITAL RATIO($ million)
13 14 15 16 17
■■■ ■■■TOTAL TOTALLIABILITIES DEBT RATIO($ million) (% of assets)
30
24
18
12
6
0
50
40
30
20
10
0 13 14 15 16 17
In addition to the liability changes associated with the Tax
Act, UTMD decided to delay the payment of its 4Q 2017
cash stockholder dividend from late December 2017 to early
January 2018, which added another $1,005 to 2017 ending
accrued liabilities that was not present in the year-end 2016
balance sheet.
As a result of the above, using the Federal REPAT tax timing of
payment rules, year-end 2017 current liabilities were $2,258
higher than at the end of 2016. Total liabilities were $7,676
higher at the end of 2017 compared to the end of 2016. The
resulting 2017 year-end total debt ratio was 16% compared to
10% at the end of 2016.
The year-end DTL balance created as a result of the fifteen
year deferred tax consequence of the amortization of
Femcare’s IIA was $3,102, down from $3,209 at the end of
2016. The smaller decline in this DTL, despite $2,055 in 2017
amortization of IIA, was due to a 10% weaker USD compared
to the GBP at the end of 2017 compared to the end of 2016. In
addition to liabilities stated on the balance sheet, UTMD has
operating lease and purchase obligations described in Note 7
to the financial statements.
Results of Operationsa) Revenues. Under accounting standards applicable for 2017,
the Company believed that revenue should be recognized at
the time of shipment as title generally passes to the customer
at the time of shipment, or completion of services performed
under contract. Revenue recognized by UTMD is based upon
documented arrangements and fixed contracts in which the
selling price is fixed prior to acceptance and completion of
an order. Revenue from product or service sales is generally
recognized at the time the product is shipped or service
completed and invoiced, and collectibility is reasonably
assured. Over 99% of UTMD’s revenue is recognized at the
time UTMD ships a physical medical device to a customer,
where the selling price for the item shipped was agreed prior
to UTMD’s acceptance and completion of the customer order.
There are no post-shipment obligations which have been or
are expected to be material to financial results.
There are circumstances under which revenue may be
recognized when product is not shipped, which have
met the criteria of SAB 104: the Company provides
engineering services, for example, design and production of
manufacturing tooling that may be used in subsequent
UTMD manufacturing of custom components for other
companies. This revenue is recognized when UTMD’s service
has been completed according to a fixed contractual agreement.
Management’s Discussion and Analysis (continued)
Beginning on January 1, 2018, the Company adopted ASU
2014-09, the new revenue recognition accounting standard.
Management completed an extensive assessment and
implementation of the standard, including UTMD’s various
contracts with customers and associated performance
obligations and the Company’s conclusions regarding its
revenue recognition practices and procedures. Other items
like commissions and rights of return were also evaluated by
the Company. Management is confident that the Company
has properly evaluated the standard’s requirements and has
arrived at appropriate conclusions in recognizing revenue
in accordance with the new standard. Those practices and
procedures the Company will use to recognize revenue
under the new standard are not significantly different than
the methods used previously since UTMD has traditionally
recognized revenue upon shipping a physical product to
a customer, which is also when the Company has met its
performance obligations under contracts it has with its
customers that represent over 99% of its revenue. While the
Company’s revenue not associated with shipping a physical
product is immaterial, management believes the Company’s
practices in recognizing that revenue is also in accordance
with ASU 2014-09.
Terms of sale are established in advance of UTMD’s
acceptance of customer orders. In the U.S., Ireland, UK and
Australia prior to 2017, UTMD generally accepted orders
directly from and shipped directly to end user clinical
facilities, as well as third party medical/surgical distributors,
under UTMD’s Standard Terms and Conditions (T&C) of
Sale. The same was true in 2017 with the addition of direct
shipments to end user facilities in Canada and France. About
14% of UTMD’s domestic end user sales, excluding Femcare’s
Filshie Clip System sales to its exclusive U.S. distributor,
CooperSurgical Inc. (CSI), go through third party med/surg
distributors which contract separately with clinical facilities to
provide purchasing, storage and scheduled delivery functions
for the applicable facility. UTMD’s T&C of Sale to end user
facilities are substantially the same in the U.S., Canada,
Ireland, UK, France and Australia.
UTMD may have separate discounted pricing agreements
with a specific clinical facility or group of affiliated facilities
based on volume of purchases. Pricing agreements which
are documented arrangements with clinical facilities, or
groups of affiliated facilities, if applicable, are established in
advance of orders accepted or shipments made. For existing
customers, past actual shipment volumes typically determine
the fixed price by part number for the next agreement period
UTMD20178
U TA H M E D I C A L P R O D U C TS , I N C .

Years ended December 31, 2017 2016 2015
Sales, net (notes 10, 12 and 13) $ 41,414 $ 39,298 $ 40,157
Cost of goods sold 15,019 15,608 15,972
Gross profit 26,395 23,690 24,185
Operating expense:
Sales and marketing 1,544 1,673 2,164
Research and development 447 475 522
General and administrative 5,393 5,355 5,848
Operating income 19,011 16,187 15,651
Other income (expense):
Dividend and interest income 17 12 5
Royalty income (note 13) 86 91 93
Interest expense — — (65)
Other, net (32) 132 (139)
Income before provision for income taxes 19,082 16,422 15,545
Provision for income taxes (note 8) 10,577 4,294 3,702
Net income $ 8,505 $ 12,128 $ 11,843
Earnings per common share (basic) (note 1): $ 2.29 $ 3.23 $ 3.16
Earnings per common share (diluted) (note 1): $ 2.28 $ 3.22 $ 3.14
Other comprehensive income:
Foreign currency translation net of taxes of $0 in all periods $ 3,893 $ (6,289) $ (2,724)
Unrealized gain (loss) on investments net of taxes of $6, $3 and $(1) 10 5 (2)
Total comprehensive income $ 12,408 $ 5,844 $ 9,117
See accompanying notes to financial statements.
Consolidated Statement of Income and Comprehensive Income(In thousands except per share amounts)
UTMD2017 9

widely accepted outside the U.S. since 2009 as a result of the
obvious lower risk of infection that is inherent with reused
surgical instruments in laparoscopic procedures, and the
elimination of the need for recalibration and repair of delicate
instruments. Conversion to single use applicators has an
expansive impact on sales.
Domestic OEM sales in 2017 represented 8% of total sales
compared to 7% in 2016. UTMD sold components and
finished devices to 148 different U.S. companies in 2017
compared to 139 companies in 2016, for use in their product
offerings. From a financial perspective, OEM sales help dilute
manufacturing overhead and improve UTMD’s GPM from
better utilization of existing capabilities.
Direct (non-CSI) domestic sales of UTMD finished devices
to U.S. end user facilities were $13,401 (32% of total sales)
compared to $13,624 (35% of total sales) in 2016. By product
category, domestic direct sales of neonatal products were
$4,049 (0% higher), labor & delivery (L&D) products $3,761 (3%
lower), BPM products $934 (7% higher) and gynecology/urology
products excluding the Filshie Clip System $4,657 (4% lower).
OUS Sales. Total OUS sales were up $1,319 (+7%) in 2017, at
$21,129 compared to $19,809 in 2016. Sixty-four percent of
(USD denominated) 2017 OUS sales were invoiced in foreign
currencies compared to 58% in 2016.
UTMD’s FX rates for income statement purposes are
transaction-weighted averages. The average FX rates from the
applicable foreign currency to USD during 2017 compared to
2016 FX rates were:
2017 2016 Change
GBP 1.290 1.360 (5.1%)
EUR 1.133 1.105 +2.5%
AUD 0.767 0.745 +2.8%
Sales Weighted Average (0.6%)
CAD 0.769 n/a
Because a significant portion of UTMD’s sales are invoiced in
foreign currencies, changes in FX rates can potentially have
a material effect on period-to-period USD-denominated
sales. In contrast to the previous three years when the USD
consistently and significantly strengthened relative to other
currencies, the combined net impact of FX changes in the full
year of 2017 was minimal. Because of the BREXIT referendum
in mid-2016, UTMD’s first half (1H) 2017 sales were $282 lower
than they would have been with the 1H 2016 GBP FX rate. After
4Q 2016, the GBP FX rate stabilized and gradually strengthened
relative to the USD so that the negative GBP FX effect on sales
Utah Medical Products, Inc.
of one year. For new customers, the customer’s best estimate
of volume is usually accepted by UTMD for determining the
ensuing fixed prices for the agreement period. Prices are not
adjusted after an order is accepted. For the sake of clarity,
the separate pricing agreements with clinical facilities based
on volume of purchases disclosure is not inconsistent with
UTMD’s disclosure above that the selling price is fixed prior to
the acceptance of a specific customer order.
UTMD’s global consolidated trade sales are comprised of
domestic and outside the U.S. (OUS) sales. Domestic sales
include 1) direct domestic sales, sales of finished devices to
end-user facilities and med/surg distributors in the U.S.; 2)
domestic OEM sales, sales of components or finished products,
which may not be medical devices, to other companies for
inclusion in their products; and 3) sales of the Filshie Clip
System by Femcare UK to CSI. OUS sales are export sales
from UTMD in the U.S. to customers outside the U.S. invoiced
in USD, and all sales from UTMD subsidiaries in Ireland,
Canada, Australia and the UK (other than Femcare UK sales to
CSI) which may be invoiced in EUR, GBP, CAD, AUD or USD.
The term “trade” means sales to customers which are not
part of UTMD. Each UTMD entity except Femcare Australia
and Femcare Canada also had 2017 intercompany sales of
components and/or finished devices
Global consolidated trade sales in 2017 were $41,414
compared to $39,298 in 2016 and $40,157 in 2015. The primary
contributors to the $2,117 (+5.4%) increase were 1) direct sales
to end-user facilities in Canada and France, which were $1,850
higher than 2016 sales to UTMD’s distributors in Canada and
France, and 2) $832 (+28%) higher Filshie Clip System domestic
sales to CSI; offset by 3) a loss of $516 in sales of BPM kits to
an OEM distributor in Germany. In contrast to 2016 compared
to 2015 when the negative impact of FX rates on sales lowered
sales by $600, the negative $68 impact in 2017 was minimal.
Domestic Sales. Total domestic U.S. sales were up $798 (+4%)
in 2017, at $20,286 compared to $19,488 in 2016. Domestic
sales in 2017 were 49% of total consolidated sales compared
to 50% in 2016. The primary contributors to the 2017 higher
domestic sales were $832 (+28%) higher sales to CSI, Femcare’s
US distributor of the Filshie Clip System, and $188 (+6%)
higher sales of components and finished devices used in other
companies’ products (OEM customers). Direct sales of UTMD
finished devices to domestic end-users were $223 (2%) lower.
In 2017, CSI for the first time purchased $476 in Sterishot
single-use Filshie Clip applicator kits, approved by the U.S.
FDA in December 2016. The Sterishot applicators have been
UTMD201710
Management’s Discussion and Analysis (continued)
U TA H M E D I C A L P R O D U C TS , I N C .

in 2017 as a whole was only ($232). In contrast, the EUR and
the AUD strengthened in 2017 compared to 2016, almost
offsetting the negative GBP FX rate impact on sales. As a result,
UTMD’s total consolidated revenues for the year would have
been up only another $68 with combined constant currency
(same FX rates in 2017 as in 2016). Since there were no CAD
sales in 2016, the CAD FX rate change had no impact on the
sales comparison between 2017 and 2016.
As a portion of total sales, 33% of UTMD’s USD-equivalent
2017 sales were invoiced in foreign currencies compared to
29% in 2016. The increase was due to the addition of CAD
sales for sales direct to end user facilities in Canada from
UTMD’s newly established distribution subsidiary, Utah
Medical Products Canada, Inc. (dba Femcare Canada). Sales
of the Filshie Clip System to Femcare’s third party Canada
distributor in 2016 were invoiced in EUR if manufactured and
shipped by UTMD’s Ireland subsidiary, or in GBP if shipped
from UTMD’s UK subsidiary. In 2017, the GBP, EUR, AUD and
CAD converted sales represented 10%, 10%, 6% and 7% of
total 2017 USD sales, respectively. This compares to 12% GBP,
11% EUR and 6% AUD of total 2016 USD sales. There were no
CAD sales in 2016.
USD-denominated trade (excludes intercompany) sales of
devices to OUS customers by UTMD’s Ireland facility (UTMD
Ltd) were $1,712 (25%) lower in 2017 compared to 2016
because 1) $1,390 in 2016 trade sales to UTMD distributors
in Canada and France were converted to intercompany sales
in 2017 (zero trade sales), and 2) BPM kit sales to UTMD’s
Germany OEM distributor, which were $516 in 2016, were
discontinued in 2017 (zero trade sales). In EUR terms, UTMD
Ltd 2017 sales including intercompany shipments were 15%
lower for the year.
USD-denominated 2017 trade sales of devices to domestic
UK, domestic France and international distributor customers
of Femcare-Nikomed, Ltd (UK subsidiary), excluding
intercompany sales, were $1,249 (+16%) higher compared to
2016, due to 1) the fact that 2017 direct trade sales in France
exceeded sales to the France and Canada distributors in
2016 by $828, and 2) sales to CSI, Femcare’s exclusive U.S.
distributor of the Filshie Clip System, were $832 higher
than in 2016. Sales to CSI were in USD currency, but UK
subsidiary foreign currency sales were $157 lower compared
to 2016 as a result of negative FX rates. In GBP terms, UK
subsidiary 2017 sales including intercompany shipments
were 24% higher for the year.
USD-denominated sales of devices to end-users in Australia
by Femcare’s Australia distribution subsidiary (Femcare
Australia) were 4% lower in 2017 compared to 2016. AUD sales
in 2017 were about 7% lower than in 2016.
Sales to distributors in Canada and France in 2016 included a
$500 distributor marketing rights payment which was absent
in 2017. Also, 2017 direct sales in Canada and France were
reduced by a $25 repurchase of distributor inventory.
Looking forward, based on the end of 2017 FX rates, 2018 foreign
currency sales on the whole should benefit in USD terms for the
first time in several years because of a relative USD weakness
compared at least to the first three quarters of 2017.
UTMD groups its sales into four general product categories:
1) obstetrics, comprised of labor and delivery management
tools for monitoring fetal and maternal well-being, for
reducing risk in performing difficult delivery procedures and
for improving clinician and patient safety; 2) gynecology/
electrosurgery/ urology, comprised of tools for gynecological
procedures associated primarily with cervical/ uterine
disease including LETZ, endometrial tissue sampling,
UTMD2017 11
PRODUCT LINE SALES BY SALES CHANNEL
2017 REVENUE BY PRODUCT LINE
(percent of sales)
■■■ BPM ■■■ NEONATAL ■■■ GYNECOLOGY ■■■ OBSTETRICS
56% 11% 18% 15%
GLOBAL SALES BY PRODUCT LINE(millions of dollars)
39
26
13
0 15 16 17
■■■ BPM ■■■ NEONATAL ■■■ GYNECOLOGY ■■■ OBSTETRICS
2017 OUTSIDE THE U.S. REVENUE
BY PRODUCT LINE(percent of sales)
15 16 17
OUTSIDE THE U.S. SALES
BY PRODUCT LINE(millions of dollars)
21
14
7
0
70% 3% 17% 10%
transvaginal uterine sonography, diagnostic laparoscopy,
surgical contraception and other MIS procedures; specialty
excision and incision tools; conservative urinary incontinence
therapy devices; and urology surgical procedure devices; 3)
neonatal critical care, comprised of devices that provide
developmentally-friendly care to the most critically ill
babies, including providing vascular access, enteral feeding,
administering vital fluids, oxygen therapy while maintaining
a neutral thermal environment, providing protection and
assisting in specialized applications; and 4) blood pressure
monitoring/ accessories/ other, comprised of specialized
components as well as molded parts and assemblies sold on
an OEM basis to other companies. In these four categories,
UTMD’s primary revenue contributors enjoy significant brand
awareness by clinical users.
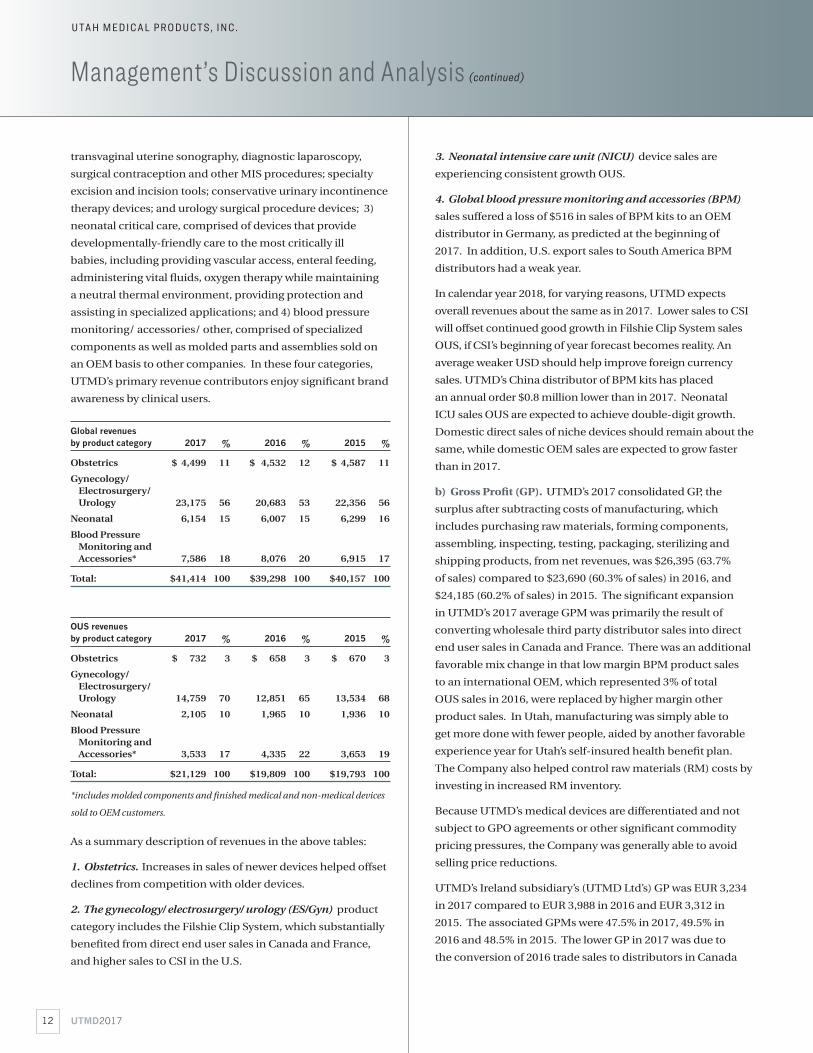
Global revenues by product category 2017 % 2016 % 2015 %
Obstetrics $ 4,499 11 $ 4,532 12 $ 4,587 11
Gynecology/ Electrosurgery/ Urology 23,175 56 20,683 53 22,356 56
Neonatal 6,154 15 6,007 15 6,299 16
Blood Pressure Monitoring and Accessories* 7,586 18 8,076 20 6,915 17
Total: $41,414 100 $39,298 100 $40,157 100
OUS revenues by product category 2017 % 2016 % 2015 %
Obstetrics $ 732 3 $ 658 3 $ 670 3
Gynecology/ Electrosurgery/ Urology 14,759 70 12,851 65 13,534 68
Neonatal 2,105 10 1,965 10 1,936 10
Blood Pressure Monitoring and Accessories* 3,533 17 4,335 22 3,653 19
Total: $21,129 100 $19,809 100 $19,793 100
*includes molded components and finished medical and non-medical devices
sold to OEM customers.
As a summary description of revenues in the above tables:
1. Obstetrics. Increases in sales of newer devices helped offset
declines from competition with older devices.
2. The gynecology/ electrosurgery/ urology (ES/Gyn) product
category includes the Filshie Clip System, which substantially
benefited from direct end user sales in Canada and France,
and higher sales to CSI in the U.S.
3. Neonatal intensive care unit (NICU) device sales are
experiencing consistent growth OUS.
4. Global blood pressure monitoring and accessories (BPM)
sales suffered a loss of $516 in sales of BPM kits to an OEM
distributor in Germany, as predicted at the beginning of
2017. In addition, U.S. export sales to South America BPM
distributors had a weak year.
In calendar year 2018, for varying reasons, UTMD expects
overall revenues about the same as in 2017. Lower sales to CSI
will offset continued good growth in Filshie Clip System sales
OUS, if CSI’s beginning of year forecast becomes reality. An
average weaker USD should help improve foreign currency
sales. UTMD’s China distributor of BPM kits has placed
an annual order $0.8 million lower than in 2017. Neonatal
ICU sales OUS are expected to achieve double-digit growth.
Domestic direct sales of niche devices should remain about the
same, while domestic OEM sales are expected to grow faster
than in 2017.
b) Gross Profit (GP). UTMD’s 2017 consolidated GP, the
surplus after subtracting costs of manufacturing, which
includes purchasing raw materials, forming components,
assembling, inspecting, testing, packaging, sterilizing and
shipping products, from net revenues, was $26,395 (63.7%
of sales) compared to $23,690 (60.3% of sales) in 2016, and
$24,185 (60.2% of sales) in 2015. The significant expansion
in UTMD’s 2017 average GPM was primarily the result of
converting wholesale third party distributor sales into direct
end user sales in Canada and France. There was an additional
favorable mix change in that low margin BPM product sales
to an international OEM, which represented 3% of total
OUS sales in 2016, were replaced by higher margin other
product sales. In Utah, manufacturing was simply able to
get more done with fewer people, aided by another favorable
experience year for Utah’s self-insured health benefit plan.
The Company also helped control raw materials (RM) costs by
investing in increased RM inventory.
Because UTMD’s medical devices are differentiated and not
subject to GPO agreements or other significant commodity
pricing pressures, the Company was generally able to avoid
selling price reductions.
UTMD’s Ireland subsidiary’s (UTMD Ltd’s) GP was EUR 3,234
in 2017 compared to EUR 3,988 in 2016 and EUR 3,312 in
2015. The associated GPMs were 47.5% in 2017, 49.5% in
2016 and 48.5% in 2015. The lower GP in 2017 was due to
the conversion of 2016 trade sales to distributors in Canada
Management’s Discussion and Analysis (continued)
UTMD201712
U TA H M E D I C A L P R O D U C TS , I N C .
and France into intercompany sales in 2017, and to the lower
absorption of overhead as a result of loss of substantial BPM
sales to a Germany OEM customer.
Femcare UK GP was GBP 5,317 in 2017 compared to GBP
4,138 in 2016, and GBP 4,607 in 2015. The increase in 2017
was due to higher sales of Filshie Clip System sales to CSI in
the U.S. and the conversion to selling direct to end users in
France. The GPM improved to 71.7% in 2017 compared to
69.4% in 2016 and 68.8% in 2015.
Femcare Australia and Femcare Canada are purely
distribution operations for UTMD finished devices in their
respective countries. Australia GP was AUD 1,846 in 2017
compared to AUD 2,049 in 2016 and AUD 1,971 in 2015. The
respective Femcare Australia GPMs were 62.7% in 2017, 65.1%
in 2016 and 58.4% in 2015. Canada GP was CAD 2,300 (60.2%
of sales) in 2017.
In the U.S., GP was $12,497 in 2017 compared to $12,547 in
2016 and $12,222 in 2015. GPMs were 55.0% in 2017, 54.3% in
2016 and 54.2% in 2015. The consistent U.S. GPs are largely a
function of UTMD’s experienced manufacturing personnel.
The 2017 GPM improved somewhat from improved
production planning and lower overhead expenses.
A summation of the above 2017 GP of each subsidiary will not
yield consolidated total GP because of elimination of profit
in inventory of intercompany goods. With the same level of
projected sales, UTMD does not expect to be able to maintain
the same GPM in 2018 as in 2017. OUS manufacturing
overhead costs will be higher in USD terms as a result of a
weaker USD. U.S. manufacturing overhead costs will be
higher due to an employee cost of living adjustment in mid-
2017, and an already apparent vendor price increase trend.
c) Operating Income (OI). OI results from subtracting OE
from GP. OI in 2017 was $19,011 (45.9% of sales) compared
to $16,187 in 2016 (41.2% of sales), and $15,651 (39.0% of
sales) in 2015. The substantial improvement in 2017 OIM
was due to 5% higher sales combined with an expanded GPM
and 2% lower consolidated OE. The UTMD Ltd OIM in 2017
was 42.7% compared to 45.9% in 2016, and 44.5% in 2015.
Femcare UK’s 2017 OIM was 40.1% compared to 30.3% in
2016, and 32.5% in 2015. Femcare AUS’s 2017 OIM was 50.0%
compared to 54.3% in 2016, and 46.5% in 2015. Femcare
Canada’s 2017 OIM was 51.5%. UTMD U.S. OIM in 2017 was
39.8% compared to 38.1% in 2016, and 35.4% in 2015.
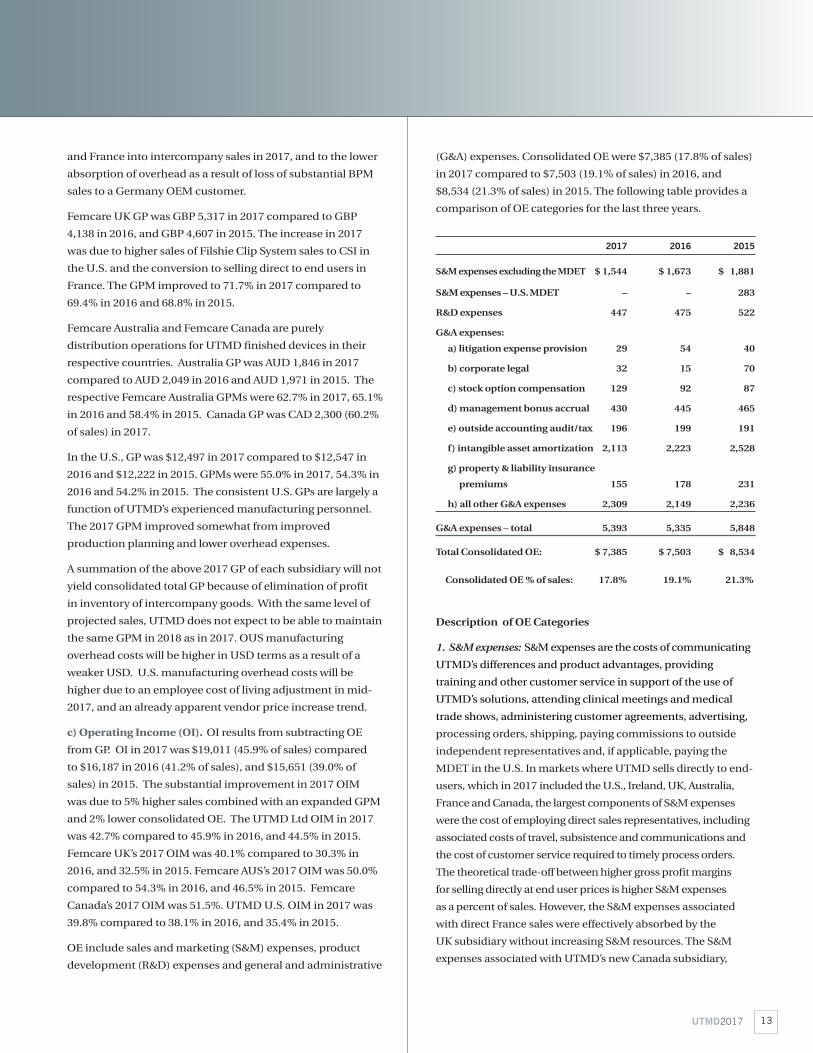
OE include sales and marketing (S&M) expenses, product
development (R&D) expenses and general and administrative
(G&A) expenses. Consolidated OE were $7,385 (17.8% of sales)
in 2017 compared to $7,503 (19.1% of sales) in 2016, and
$8,534 (21.3% of sales) in 2015. The following table provides a
comparison of OE categories for the last three years.
2017 2016 2015
S&M expenses excluding the MDET $ 1,544 $ 1,673 $ 1,881
S&M expenses – U.S. MDET – – 283
R&D expenses 447 475 522
G&A expenses:
a) litigation expense provision 29 54 40
b) corporate legal 32 15 70
c) stock option compensation 129 92 87
d) management bonus accrual 430 445 465
e) outside accounting audit/tax 196 199 191
f) intangible asset amortization 2,113 2,223 2,528
g) property & liability insurance
premiums 155 178 231
h) all other G&A expenses 2,309 2,149 2,236
G&A expenses – total 5,393 5,335 5,848
Total Consolidated OE: $ 7,385 $ 7,503 $ 8,534
Consolidated OE % of sales: 17.8% 19.1% 21.3%
Description of OE Categories
1. S&M expenses: S&M expenses are the costs of communicating
UTMD’s differences and product advantages, providing
training and other customer service in support of the use of
UTMD’s solutions, attending clinical meetings and medical
trade shows, administering customer agreements, advertising,
processing orders, shipping, paying commissions to outside
independent representatives and, if applicable, paying the
MDET in the U.S. In markets where UTMD sells directly to end-
users, which in 2017 included the U.S., Ireland, UK, Australia,
France and Canada, the largest components of S&M expenses
were the cost of employing direct sales representatives, including
associated costs of travel, subsistence and communications and
the cost of customer service required to timely process orders.
The theoretical trade-off between higher gross profit margins
for selling directly at end user prices is higher S&M expenses
as a percent of sales. However, the S&M expenses associated
with direct France sales were effectively absorbed by the
UK subsidiary without increasing S&M resources. The S&M
expenses associated with UTMD’s new Canada subsidiary,
UTMD2017 13

Femcare Canada, in its first year were substantially absorbed by
existing S&M resources in the U.S.
S&M expenses include all customer support costs including
training. In general, training is not required for UTMD’s products
since they are well-established and have been clinically widely
used. Written “Instructions For Use” are packaged with all
finished devices. Although UTMD does not have any explicit
contracts with customers to provide training, it does provide
hospital in-service and clinical training as required and
reasonably requested.
UTMD promises prospective customers that it will provide, at
no charge in reasonable quantities, electronic media and other
instructional materials developed for the use of its products.
UTMD provides customer support from offices in the U.S.,
Canada, Ireland, UK and Australia by telephone to answer user
questions and help troubleshoot any user issues. Occasionally,
on a case-by-case basis, UTMD may utilize the services of an
independent practitioner to provide educational assistance
to clinicians. All in-service and training expenses are routinely
expensed as they occur. Except for the consulting services of
independent practitioners and occasional use of marketing
consultants, all of these services are allocated from fixed S&M
overhead costs included in OE. Historically, marginal consulting
costs have been immaterial to financial results, which is also
UTMD’s expectation for the future.
The MDET, a component of the Patient Protection and Affordable
Care Act, (known commonly as Obamacare) was effective
between 2013 and 2015. In December 2015, U.S. legislators
suspended the MDET for 2016 and 2017, and in January 2018,
further suspended it for 2018 and 2019. The excise tax was 2.3%
of domestic sales of medical devices listed with the FDA. Medical
devices designed for human use were taxed, whether or not they
were sold for human use, e.g. veterinarian uses or laboratory
use were also taxed. The impact of the tax was felt beyond 2.3%,
as costs associated with administering, tracking, collecting and
paying the tax were significant.
S&M expenses in 2017 were $1,544 (3.7% of 2017 sales) compared
to $1,673 (4.3% of sales) in 2016, and $2,164 (5.4% of sales) in 2015.
Lower USD S&M expenses were due in part to the weaker GBP
and in part to UTMD not hiring some replacements for sales reps
in the U.S. that it had previously planned. S&M OE excluding the
MDET were 4.7% of sales in 2015. With the planned addition of
S&M resources in 2018 and a weaker USD, S&M expenses as a
percentage of total revenues are expected to increase.
2. R&D expenses: R&D expenses include the costs of
investigating clinical needs, developing innovative
concepts, testing concepts for viability, validating methods
of manufacture, completing any necessary premarketing
clinical trials, regulatory documentation and other activities
required for design control, responding to customer requests
for product enhancements, and assisting manufacturing
engineering on an ongoing basis in developing new processes
or improving existing processes. R&D expenses were $447
(1.1% of sales) in 2017 compared to $475 (1.2% of sales) in
2016, and $522 (1.3% of sales) in 2015. Although no new UTMD
devices were launched in 2017, R&D played a significant and
continuing role in manufacturing process improvements
that became evident in improved 2017 GPMs, in addition to
continuing work on new product projects. UTMD does not
pre-announce new devices that are being developed. R&D
expenses in 2018 are expected to be higher than in 2017.
3. G&A expenses: G&A expenses include the “front office”
functional costs of executive management and outside directors,
finance and accounting, corporate information systems, human
resources, stockholder relations, corporate risk management,
corporate governance, protection of intellectual property,
amortization of identifiable intangibles and legal costs. G&A
expenses in 2017 were $5,393 (13.0% of sales) compared to
$5,355 (13.6% of sales) in 2016, and $5,848 (14.6% of sales) in
2015. The table above helps clarify several specific categories of
G&A expenses. G&A expenses in Canada’s first year of operation
were $160 higher than in 2016 during set-up. Amortization of the
2011 acquired Femcare IIA is part of G&A expenses. Although
the IIA amortization expense in 2017 was only £4 lower than in
2016, because of the weaker GBP after the BREXIT referendum,
the 2017 USD IIA amortization expense was $112 lower than
in 2016. The resulting G&A noncash amortization expense of
Femcare IIA was 5.0% of total sales in 2017 compared to 5.5%
of sales in 2016. The Femcare IIA amortization expense will
continue until March 2026 (or until the value of any remaining
IIA becomes impaired).
Management’s Discussion and Analysis (continued)
UTMD201714
U TA H M E D I C A L P R O D U C TS , I N C .
15 16 17(millions of dollars)
OPERATING EXPENSE DETAIL ■■■ R&D■■■ G&A■■■ S&M
(percent of sales)
15 16 17
25
20
15
10
5
0
10
8
6
4
2
0

In summary, in 2018 not including unforeseen litigation
expenses or possible acquisition costs, UTMD expects OE to be
higher than in 2017 due to 1) a weaker USD relative to all foreign
currencies, rendering same level foreign subsidiary expenses
higher in USD terms, 2) the addition of S&M resources and 3)
higher R&D expenses.
d) Non-operating Income, Non-operating Expense
and EBT. NOI includes royalties from licensing UTMD’s
technology, rent from leasing underutilized property to
others, income earned from investing the Company’s
excess cash and gains or losses from the sale of assets or
remeasurement of foreign currency bank account balances
into USD, offset by NOE which includes interest on bank
loans, bank service fees and excise taxes. The period-to-
period remeasured value of EUR cash balances held in the
UK and GBP balances held in Ireland generates a gain or loss
which is booked at reporting period end as NOI or NOE.
Net NOI (combination of NOE and NOI) was $71 in 2017
compared to Net NOI of $235 in 2016, and Net NOE of
$105 in 2015. The primary cause of the $164 lower NOI
in 2017 compared to 2016 was a £95 lower gain in the
remeasured value of EUR cash held in the UK, and $28 lower
licensing royalties in the UK. A description of NOE and NOI
components follows.
1. Interest Expense. There was no interest expense in 2017
or 2016. In 2015, $65 in interest expense was incurred on the
remaining balances of loans needed to help acquire Femcare
in 2011. Absent an acquisition or large repurchase of shares
that requires new borrowing, UTMD does not expect any
interest expense in 2018.
2. Investment of excess cash. Consolidated investment
income (including gains and losses on sales of investments)
was $17 in 2017 compared to $12 in 2016, and $5 in 2015.
Cash is generally currently held in non-interest bearing bank
accounts because avoiding the bank operating fees which
would result from lower balances offsets the interest that
can be earned at current interest rates. UTMD estimates
investment income will again be nominal in 2018.
3. Royalties. Femcare receives a royalty from licensing the use
of the Filshie Clip System intangibles to CSI as part of its U.S.
exclusive distribution agreement. Royalties in 2017 were $86
compared to $91 in 2016 and $93 in 2015. UTMD expects to
receive about $86 in CSI royalties in 2018. Presently, there are
no arrangements under which UTMD is receiving royalties
from other parties.
4. Gains/ losses from remeasured currency in bank accounts.
As noted above, UTMD recognized 2017 NOI of $4 and 2016
NOI of $129 from gains on remeasured foreign currency
bank balances, compared to NOE of $141 in 2015 from losses
on remeasured foreign currency bank balances. EUR and
AUD currency cash balances in the UK, and GBP currency
cash bank balances in Ireland, are subject to remeasured
currency translation gains/ losses as a result of period to
period changes in FX rates. Because of UTMD’s subsidiaries’
profitability, the subsidiaries may continue to accumulate
cash until uses of cash that increase stockholder value are
identified. The one-time REPAT tax implemented by the
U.S. Congress in late 2017 imposed a 15.5% tax on all of
UTMD’s cash held OUS. Year-end 2017 foreign currency cash
balances were valued at the following FX rates: 1.2021 USD/
EUR; 0.7988 USD/CAD, 0.7815 USD/AUD and 1.3523 USD/
GBP. No remeasured currency gains or losses are included in
UTMD’s projections for 2018.
5. Other NOI. Income received from renting unused
warehouse space in Ireland and parking lot space in Utah
for a cell phone tower, offset by bank fees, miscellaneous
non-operating expenses and non-MDET excise taxes
resulted in a net NOE of $36 in 2017 compared to NOI of $3
in both 2016 and 2015. UTMD estimates Other NOI will be
nominal in 2018.
Income before Taxes (EBT) results from adding net NOI
or subtracting net NOE from OI. Consolidated EBT was
$19,082 (46.1% of sales) in 2017 compared to $16,422 (41.8%
of sales) in 2016, and $15,545 (38.7% of sales) in 2015. The
EBT of UTMD Ltd. (Ireland) was €2,779 (40.8% of sales) in
2017, €3,489 (43.3% of sales) in 2016, and €2,890 (42.2% of
sales) in 2015. Femcare UK’s 2017 EBT was £3,155 (42.5%
of sales) compared to £2,141 (35.9% of sales) in 2016, and
£2,243 (33.5% of sales) in 2015. Femcare AUS’s 2017 EBT was
AUD 1,473 (50.0% of sales) compared to AUD 1,713 (54.4%
of sales) in 2016, and AUD 1,580 (46.8% of sales) in 2015.
Femcare Canada’s 2017 EBT was CAD 1,906 (49.9% of sales).
As a side note for clarity of results, UTMD’s 2017, 2016 and
2015 EBT, as well as all other income statement measures
above the EBT line in the Income Statements, were
unaffected by the 2017 accrual of the U.S. REPAT tax and the
reduction in the DTL from the Tax Act enacted in late 2017,
and the reduction in the DTL and income tax provision
triggered as a result of changes in UK corporate income
tax rates enacted in 2016 and 2015. Therefore, the year to
year comparisons of GP, OI and EBT are good indicators of
UTMD’s operating performance.
Looking forward, UTMD’s consistently high level of EBT will
help maximize the benefit to stockholders of the lower U.S.
corporate income tax rates recently enacted.
UTMD2017 15

UTMD201716
Management’s Discussion and Analysis (continued)
e) Net Income (NI), EPS and ROE. NI is EBT minus income
taxes, often called the “bottom line”. There were tax law
changes enacted in the U.S. in 2017, and in the UK in both
2016 and 2015 which affected the income tax provisions in
those periods. The lowering of a future income tax rate results
in a reduction in DTL. According to US GAAP, the total effect of
tax rate changes on DTL balances is recorded as a component
of the income tax provision related to continuing operations in
the period in which the law is enacted. The DTL adjustments
which lowered the applicable year’s consolidated income tax
provision were $230 in 2017, $123 in 2016 and $351 in 2015.
In addition, the U.S. “Tax Cuts and Jobs Act” enacted in
December 2017 included a special levy on the cumulative
income (E&P) of UTMD’s foreign subsidiaries. Foreign cash
balances of $29 million were taxed at a 15.5% rate, and the
remaining E&P at an 8% rate for accrued Federal income tax
purposes. Representatives of the State of Utah have indicated
that the State will likely follow the Federal government and also
levy a REPAT tax on half the E&P at the State of Utah corporate
income tax rate of 5%. UTMD’s end of 2017 tax provision was
increased by $6,288 to incorporate the total REPAT tax according
to US GAAP, reducing 2017 NI and EPS accordingly.
Because of the one-time REPAT tax in 2017 and DTL
adjustments in each year, calculating and comparing period-
to-period income tax provisions as a percentage of EBT does
not provide meaningful information to stockholders, in
UTMD’s opinion. Therefore, NI and EPS are presented both
according to US GAAP and also prior to recognition of the
REPAT tax and DTL adjustments.
US GAAP 2017 2016 2015
NI $ 8,505 $12,128 $11,843
NIM 20.5% 30.9% 29.5%
EPS $ 2.276 $ 3.220 $ 3.140
NON-GAAP (prior to tax law changes) 2017 2016 2015
NI $14,562 $12,004 $11,493
NIM 35.2% 30.5% 28.6%
EPS $ 3.897 $ 3.188 $ 3.047
Note: The tax provision adjustments only affected UTMD’s income tax provision,
NI and EPS, not consolidated revenues (sales), GP, OI or EBT.
Ignoring the 2017 REPAT accrued tax provision of $6,288
and 2015 – 2017 DTL adjustments, the (non-US GAAP)
consolidated combined income tax provision rate for 2017
was 23.7% of EBT compared to 26.9% in 2016, and 26.1% in
2015. The US GAAP consolidated income tax provision rate
for 2017 was 55.4% of EBT compared to 26.1% in 2016, and
23.8% in 2015. The non-US GAAP difference in rates was due
primarily to the tax deduction allowed in the UK and Ireland
on the remeasured value of their USD cash balances, as well
as the mix of income generated and actual tax provisions
in sovereignties with varying tax rates. Both UK and Ireland
subsidiaries experienced native currency losses on the value
of their large USD cash balances in 2017. These currency
translation losses are tax deductions in the applicable foreign
jurisdiction, but do not affect UTMD’s EBT (USD are USD).
But the actual tax (lower) provisions of the OUS subsidiaries
do become part of UTMD’s consolidated income tax provision.
In general, year to year fluctuations in the combined tax
rate will result from variation in EBT contribution from
subsidiaries in jurisdictions with different corporate
income tax rates. The UK had an income tax rate of 20% in
1Q 2017 and a rate of 19% thereafter, compared to a rate of
20% in 2016 and a rate of 21% in 1Q 2015 and a rate of 20%
thereafter. The UK also allows a tax deduction for sales of UK
patented products which varies from year-to-year based on
somewhat complicated rules which are sorted out for UTMD
by independent tax accountants. The current UK income tax
rate of 19% is scheduled to decline to 17% beginning April 1,
2020. The income tax rate for AUS has been and is planned
to remain at 30%. The income tax rate for Canada was and is
expected to remain at 25%. Profits of the Ireland subsidiary
are taxed at a 12.5% rate on exported manufactured products,
and a 25% rate on rental and other types of income including
income from sales of medical devices in Ireland domestically.
Further Comments on the U.S. Corporate Tax Rate.
For the benefit of stockholders, UTMD believes that further
discussion of its current understanding of the impact of tax
law changes resulting from the 2017 Act might be helpful.
UTMD’s effective Federal tax rate in the U.S. after allowable
deductions was typically about 29.4% prior to the new
tax law. The State of Utah adds a 5% income tax using the
Federal taxable income as a basis. The predominant reason
that UTMD’s prior effective Federal rate was not 34% was a
“manufacturing profit deduction” (MPD) which equated to
about 8.1% of UTMD’s U.S. EBT. There were other factors
such as the R&D tax credit and accelerated depreciation for
tax purposes which helped reduce UTMD’s effective income
tax rates, and these other benefits will continue under the Tax
U TA H M E D I C A L P R O D U C TS , I N C .
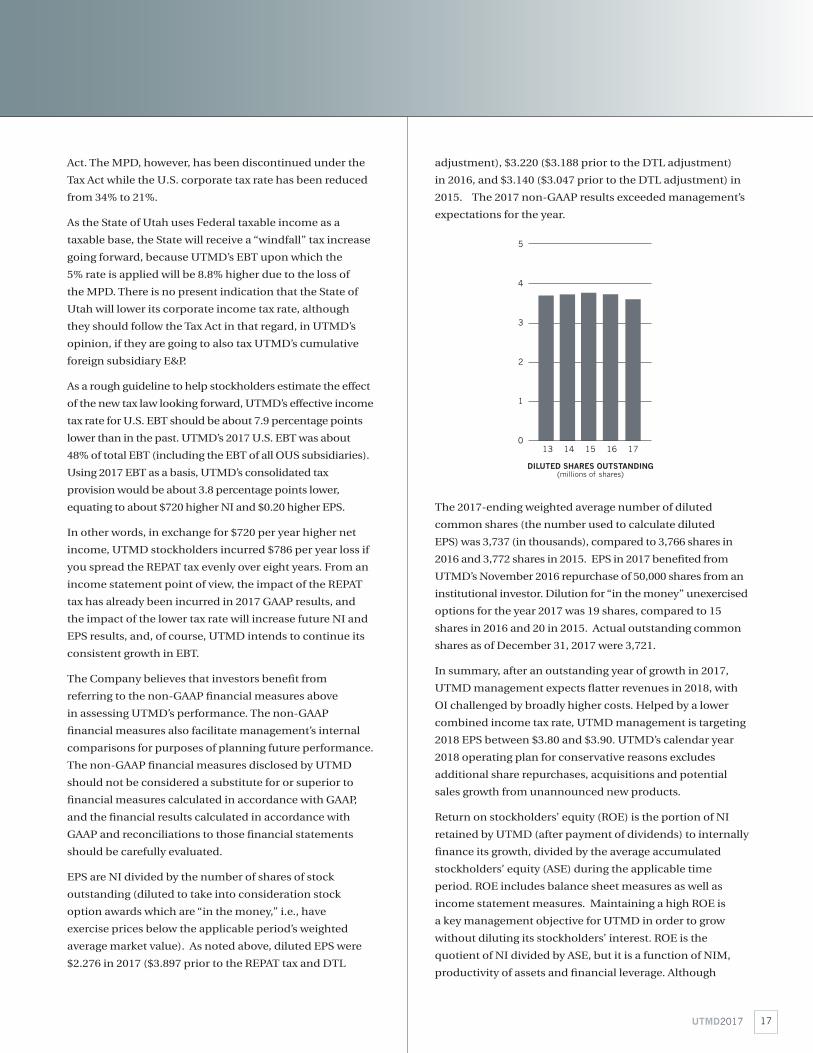
adjustment), $3.220 ($3.188 prior to the DTL adjustment)
in 2016, and $3.140 ($3.047 prior to the DTL adjustment) in
2015. The 2017 non-GAAP results exceeded management’s
expectations for the year.
The 2017-ending weighted average number of diluted
common shares (the number used to calculate diluted
EPS) was 3,737 (in thousands), compared to 3,766 shares in
2016 and 3,772 shares in 2015. EPS in 2017 benefited from
UTMD’s November 2016 repurchase of 50,000 shares from an
institutional investor. Dilution for “in the money” unexercised
options for the year 2017 was 19 shares, compared to 15
shares in 2016 and 20 in 2015. Actual outstanding common
shares as of December 31, 2017 were 3,721.
In summary, after an outstanding year of growth in 2017,
UTMD management expects flatter revenues in 2018, with
OI challenged by broadly higher costs. Helped by a lower
combined income tax rate, UTMD management is targeting
2018 EPS between $3.80 and $3.90. UTMD’s calendar year
2018 operating plan for conservative reasons excludes
additional share repurchases, acquisitions and potential
sales growth from unannounced new products.
Return on stockholders’ equity (ROE) is the portion of NI
retained by UTMD (after payment of dividends) to internally
finance its growth, divided by the average accumulated
stockholders’ equity (ASE) during the applicable time
period. ROE includes balance sheet measures as well as
income statement measures. Maintaining a high ROE is
a key management objective for UTMD in order to grow
without diluting its stockholders’ interest. ROE is the
quotient of NI divided by ASE, but it is a function of NIM,
productivity of assets and financial leverage. Although
UTMD2017 17
DILUTED SHARES OUTSTANDING(millions of shares)
13 14 15 16 17
5
4
3
2
1
0
Act. The MPD, however, has been discontinued under the
Tax Act while the U.S. corporate tax rate has been reduced
from 34% to 21%.
As the State of Utah uses Federal taxable income as a
taxable base, the State will receive a “windfall” tax increase
going forward, because UTMD’s EBT upon which the
5% rate is applied will be 8.8% higher due to the loss of
the MPD. There is no present indication that the State of
Utah will lower its corporate income tax rate, although
they should follow the Tax Act in that regard, in UTMD’s
opinion, if they are going to also tax UTMD’s cumulative
foreign subsidiary E&P.
As a rough guideline to help stockholders estimate the effect
of the new tax law looking forward, UTMD’s effective income
tax rate for U.S. EBT should be about 7.9 percentage points
lower than in the past. UTMD’s 2017 U.S. EBT was about
48% of total EBT (including the EBT of all OUS subsidiaries).
Using 2017 EBT as a basis, UTMD’s consolidated tax
provision would be about 3.8 percentage points lower,
equating to about $720 higher NI and $0.20 higher EPS.
In other words, in exchange for $720 per year higher net
income, UTMD stockholders incurred $786 per year loss if
you spread the REPAT tax evenly over eight years. From an
income statement point of view, the impact of the REPAT
tax has already been incurred in 2017 GAAP results, and
the impact of the lower tax rate will increase future NI and
EPS results, and, of course, UTMD intends to continue its
consistent growth in EBT.
The Company believes that investors benefit from
referring to the non-GAAP financial measures above
in assessing UTMD’s performance. The non-GAAP
financial measures also facilitate management’s internal
comparisons for purposes of planning future performance.
The non-GAAP financial measures disclosed by UTMD
should not be considered a substitute for or superior to
financial measures calculated in accordance with GAAP,
and the financial results calculated in accordance with
GAAP and reconciliations to those financial statements
should be carefully evaluated.
EPS are NI divided by the number of shares of stock
outstanding (diluted to take into consideration stock
option awards which are “in the money,” i.e., have
exercise prices below the applicable period’s weighted
average market value). As noted above, diluted EPS were
$2.276 in 2017 ($3.897 prior to the REPAT tax and DTL

Years Ended December 31, 2017, 2016 and 2015
Accumulated Additional Other Total Common Stock Paid-in Comprehensive Retained Stockholders' Shares Amount Capital Income Earnings Equity
Balance at December 31, 2014 3,748 $ 37 $ 2,890 $ (3,234) $ 64,863 $ 64,556
Shares issued upon exercise of employee stock options for cash 22 0 640 — — 640
Shares received and retired upon exercise of stock options (6) (0) (338) — — (338)
Tax benefit attributable to appreciation of stock options — — 114 — — 114
Stock option compensation expense — — 87 — — 87
Common stock purchased and retired (13) (0) (683) — — (683)
Foreign currency translation adjustment — — — (2,724) — (2,724)
Unrealized holding gain (loss) from investments, available-for-sale, net of taxes — — — (2) — (2)
Common stock dividends — — — — (3,846) (3,846)
Net income — — — — 11,843 11,843
Balance at December 31, 2015 3,751 $ 38 $ 2,710 $ (5,961) $ 72,861 $ 69,648
Shares issued upon exercise of employee stock options for cash 13 0 431 — — 431
Shares received and retired upon exercise of stock options (1) (0) (56) — — (56)
Tax benefit attributable to appreciation of stock options — — 50 — — 50
Stock option compensation expense — — 92 — — 92
Common stock purchased and retired (50) (1) (2,849) — — (2,850)
Foreign currency translation adjustment — — — (6,289) — (6,289)
Unrealized holding gain (loss) from investments, available-for-sale, net of taxes — — — 5 — 5
Common stock dividends — — — — 3,916 3,916
Net income — — — — 12,128 12,128
Balance at December 31, 2016 3,713 $ 37 $ 378 $(12,243) $ 81,072 $ 69,244
Shares issued upon exercise of employee stock options for cash 9 0 327 — — 327
Shares received and retired upon exercise of stock options (0) (0) (25) — — (25)
Stock option compensation expense — — 129 — — 129
Common stock purchased and retired — — — — — —
Foreign currency translation adjustment — — — 3,893 — 3,893
Unrealized holding gain (loss) from investments, available-for-sale, net of taxes — — — 10 — 10
Common stock dividends — — — — (3,960) (3,960)
Net income — — — — 8,505 8,505
Balance at December 31, 2017 3,721 $ 37 $ 809 $ (8,341) $ 85,617 $ 78,122
See accompanying notes to financial statements.
Consolidated Statement of Stockholders’ Equity(In thousands)
UTMD201718
U TA H M E D I C A L P R O D U C TS , I N C .

UTMD2017 19
UTMD’s high NIM is the primary factor that continues to
drive its ROE, a repurchase of 50,000 shares for $2,850 in
4Q 2016, $3,960 in cash dividends to stockholders in 2017
and a reduction as a result of the REPAT tax, all helped
lower ASE, reducing the denominator in calculating
ROE. Although REPAT tax helped the denominator by
lowering ASE $3.1 million, it harmed ROE more in 2017 by
also lowering the NIM numerator from 35.2% to 20.5%.
Average 2017 Stockholders’ Equity was $73,683. Year-end
2017 Stockholders’ Equity was $78,122. Year-end 2017
Stockholders’ Equity increased $8,878 from a year earlier.
UTMD’s 2017 ROE was 6% including dividends and US
GAAP NI, compared to 12% in both 2016 and 2015. Before
dividends, UTMD’s 2017 ROE was 12% compared to 17% in
2016, and 18% in 2015. Using Non-GAAP NI, excluding the
effect of the REPAT tax and before dividends, UTMD’s 2017
ROE was 19%.
Liquidity and Capital ResourcesCash Flows. Net cash provided by operating activities,
including adjustments for depreciation and other non-cash
operating expenses, along with changes in working capital
and the tax benefit attributable to exercise of employee
incentive stock options, totaled $16,908 in 2017, compared
to $14,528 in 2016 and $13,801 in 2015. The largest changes
in 2017 compared to 2016 were all related to the REPAT tax:
the establishment of $5,785 in long-term repatriation tax
payable, a decrease of $3,623 in net income, and a $2,213
benefit to cash from a $1,027 increase in accrued expenses
following a $1,187 decrease in the prior year. The other
significant contributor to the increase in accrued expenses
was the $1,005 dividend payable at year-end 2017. A decrease
in other receivables benefited cash by $895. Other changes
were generally consistent with effective working capital
management and sales activity.
The Company’s notes payable repayment of $4,777 in 2015
was the most significant use of cash that year. The loans were
paid off in early 2015, so no loan principal payments were
required in 2016 or 2017. Loans of $26,934 were obtained in
2011 to help finance the acquisition of Femcare. In investing
activities, during 2017 UTMD used $1,597 for capital
expenditures. During 2017 UTMD fitted-out the 38,600 square
foot facility in the UK it purchased in late 2016 to replace its
leased facility, and moved operations into the new facility late
in the year.
In 2017, UTMD received $302 and issued 8,302 shares of stock
upon the exercise of employee and director stock options.
Employees and directors exercised a total of 8,638 option
shares in 2017, with 336 shares immediately being retired
as a result of optionees trading the shares in payment of
the exercise price of the options. Option exercises in 2017
were at an average price of $37.83 per share. The Company
received a $38 tax benefit from option exercises in 2017,
which is only reflected in net income as a result of adopting a
new accounting standard in 2017. UTMD did not repurchase
any shares of its stock in the open market during 2017. In
2016, UTMD received $376 and issued 11,945 shares of stock
upon the exercise of employee and director stock options.
Employees and directors exercised a total of 12,806 option
shares in 2016, with 861 shares immediately being retired
as a result of optionees trading the shares in payment of the
exercise price of the options. Option exercises in 2016 were at
an average price of $33.68 per share. The Company received
a $50 tax benefit from option exercises in 2016. UTMD
repurchased 50,000 shares of stock in the open market at a
cost of $2,850 during 2016, an average cost of $57.00 per share.
By comparison, in 2015, UTMD received $343 and issued
15,786 shares of stock upon the exercise of employee and
director stock options. Employees and directors exercised
a total of 21,800 option shares in 2015, with 6,014 shares
immediately being retired as a result of optionees trading the
shares in payment of the exercise price of the options and
related taxes. Option exercises in 2015 were at an average
price of $29.36 per share. The Company received a $114 tax
benefit from option exercises in 2015. UTMD repurchased
13,000 shares of stock in the open market at a cost of $683
during 2015, an average cost of $52.54 per share.
Management’s Discussion and Analysis (continued)
U TA H M E D I C A L P R O D U C TS , I N C .
YEAR-END INSTITUTIONAL OWNERSHIP
(percent of total ownership)
13 14 15 16 17
60
45
30
15
0
RETURN ON EQUITY(percent)
■ Dividends paid ■ REPAT Tax
20
15
10
5
0 13 14 15 16 17

Years Ended December 31, 2017 2016 2015
Cash flows from operating activities:
Net income $ 8,505 $ 12,128 $ 11,843
Adjustments to reconcile net income to net cash provided by operating activities:
Depreciation 660 610 619
Amortization 2,113 2,223 2,528
Provision for (recovery of) losses on accounts receivable 4 0 (10)
Loss on disposal of assets 17 5 1
Deferred income taxes (658) (484) (901)
Stock-based compensation expense 129 92 87
(Increase) decrease in:
Accounts receivable (242) 295 137
Other receivables 2 897 (91)
Inventories (467) (360) 422
Prepaid expenses and other current assets 24 23 28
Increase (decrease) in:
Accounts payable 9 286 (265)
Accrued expenses 1,027 (1,187) (597)
Long-term repatriation tax payable 5,785 — —
Net cash provided by operating activities 16,908 14,528 13,801
Cash flows from investing activities:
Capital expenditures for:
Property and equipment (1,597) (3,293) (176)
Intangible assets — (9) (70)
Net cash provided by (used in) investing activities (1,597) (3,302) (246)
Cash flows from financing activities:
Proceeds from issuance of common stock — options 302 376 343
Common stock purchased and retired — (2,850) (683)
Payment of taxes for exchange of stock options — — (42)
Tax benefit attributable to exercise of stock options — 50 114
Repayments of notes payable — — (4,777)
Dividends paid (2,955) (3,916) (3,846)
Net cash provided by (used in) financing activities (2,653) (6,340) (8,891)
Effect of exchange rate changes on cash 921 (1,868) (660)
Net increase in cash and cash equivalents 13,579 3,018 4,004
Cash at beginning of year 26,296 23,278 19,274
Cash at end of year $ 39,875 $ 26,296 $ 23,278
Supplemental Disclosure of Cash Flow Information.
Cash paid during the year for: Income taxes $ 5,151 $ 4,846 $ 5,341
Interest — — 65
See accompanying notes to financial statements.
Consolidated Statement of Cash Flow(In thousands)
U TA H M E D I C A L P R O D U C TS , I N C .
UTMD201720
UTMD did not borrow in any of the three years 2015-2017.
Cash dividends paid were $2,955 in 2017, compared to
$3,916 in 2016 and $3,846 in 2015. The $1,005 cash dividend
declared for 4Q 2017 was paid in early January 2018, a change
from the dividends declared in the 4th quarters of 2016 and
2015, which were paid in late December.
Management believes that future incomsapital will provide
the liquidity needed to finance internal growth plans. In an
uncertain economic environment, UTMD’s cash balances
allow management to operate with the long-term best
interest of stockholders in mind. Planned 2018 capital
expenditures for ongoing operations are expected to be less
than depreciation of current PP&E.
Management plans to utilize cash not needed to support
normal operations in one or a combination of the following:
1) in general, to continue to invest at opportune times
in ways that will enhance future profitability; 2) to make
additional investments in new technology and/or processes;
and/or 3) to acquire a product line or company that will
augment revenue and EPS growth and better utilize UTMD’s
existing infrastructure. If there are no better strategic uses for
UTMD’s cash, the Company will continue to return cash to
stockholders in the form of dividends and share repurchases
when the stock appears undervalued.
Management's OutlookUTMD is small, but its employees are experienced and
remain diligent in their work. UTMD’s passion is in providing
innovative clinical solutions that will help improve the
effectiveness of medical procedures and reduce health risks,
particularly for women and their babies.
The safety, reliability and performance of UTMD’s medical
devices are high and represent significant clinical benefits
while providing minimum total cost of care. UTMD will
continue to leverage its reputation as a device innovator which
will responsively take on challenges to work with clinicians
who use its specialty devices. In doing so, UTMD will continue
to differentiate itself, especially from commodity-oriented
competitors. In 2018, UTMD plans to continue to
1) exploit distribution and manufacturing synergies
by further integrating capabilities and resources in its
multinational operations;
2) introduce additional products helpful to clinicians
through internal new product development;
3) achieve excellent overall financial operating performance;
4) utilize positive cash generation to continue providing
cash dividends to stockholders and make open market share
repurchases if/when the UTMD share price seems undervalued;
and
5) be vigilant for accretive acquisition opportunities which
may be increasingly brought about by difficult burdens on
small, innovative companies.
The Company has a fundamental focus to do an excellent job
in meeting clinicians’ and patients’ needs, while providing
stockholders with excellent returns. In 2017, the value of
UTMD’s stock increased 12%, ending the year at $81.40/ share,
while $1.065 in dividends/ share were paid. Taking a longer
term view, as of the end of 2017 from the end of 1998, UTMD’s
share price increased 1,140%, representing a 14% annually
compounded share price increase over the nineteen year
time span. If additional returns to stockholders from cash
dividends are added, stockholder value increased 1,343%
over the nineteen year time span, representing 15% annually
compounded growth in value. In comparison, the NASDAQ
Composite Index was up 215%, the S&P 500 Index was up
118% and the DJIA was up 169%.
Combining share price appreciation as a result of a long term
profitable financial performance and a capital allocation
strategy that includes opportunistic share repurchases with
steadily growing quarterly cash dividends paid to stockholders
since 2004, longer term UTMD stockholders have experienced
excellent returns. Management is committed to continue that
performance.
UTMD2017 21
Management’s Discussion and Analysis (continued)
U TA H M E D I C A L P R O D U C TS , I N C .

Concentration of Credit Risk. The primary concentration of credit
risk consists of trade receivables. In the normal course of business,
the Company provides credit terms to its customers. Accordingly,
the Company performs ongoing credit evaluations of its customers
and maintains allowances for possible losses which, when realized,
have been within the range of management's expectations as
reflected by its reserves.
The Company's customer base consists of hospitals, medical device
distributors, physician practices and others directly related to
healthcare providers, as well as other manufacturing companies.
Although the Company is affected by the well-being of the global
healthcare industry, management does not believe significant trade
receivable credit risk exists at December 31, 2017 except under an
extreme global financial crisis.
The Company maintains its cash in bank deposit accounts in addition
to Fidelity Investment accounts. The Company has not experienced
any losses in such accounts and believes it is not exposed to a
significant credit risk on cash and cash equivalent balances.
Accounts Receivable. Accounts receivable are amounts due on
product sales and are unsecured. Accounts receivable are carried
at their estimated collectible amounts. Credit is generally extended
on a short-term basis; thus accounts receivable do not bear interest
although a late charge may be applied to such receivables that are
past the due date. Accounts receivable are periodically evaluated for
collectability based on past credit history of customers and current
market conditions. Provisions for losses on accounts receivable are
determined on the basis of loss experience, known and inherent risk
in the account balance and current economic conditions (see note 2).
Inventories. In 2017, the Company adopted Accounting Standard
Update (ASU) 2015-11, “Inventory-Simplifying the Measurement
of Inventory,” which changed how inventory is valued. Finished
products, work-in-process, raw materials and supplies inventories are
stated at the lower of cost and net realizable value (NRV) computed on
a first-in, first-out method. Net realizable value is the estimated selling
price in the ordinary course of business, less reasonably predictable
costs of completion, disposal, and transportation. The adoption of ASU
2015-11 did not have an impact on the Company’s financial statements
(see note 2).
Property and Equipment. Property and equipment are stated
at cost. Depreciation and amortization are computed using the
straight-line method over estimated useful lives as follows:
Building and improvements 15-40 years
Furniture, equipment and tooling 3-10 years
Long-Lived Assets. The Company evaluates its long-lived assets
in accordance with Accounting Standards Codification (ASC) 360,
“Accounting for the Impairment of Long-Lived Assets.” Long-lived
assets held and used by the Company are reviewed for impairment
Note 1. Summary of Significant Accounting PoliciesOrganization. Utah Medical Products, Inc. with headquarters
in Midvale, Utah and its wholly-owned operating subsidiaries,
Femcare Nikomed Ltd located in Romsey, Hampshire, England,
Femcare Australia Pty Ltd located in Castle Hill, NSW, Australia,
Utah Medical Products Canada, Inc. (dba Femcare Canada) located
in Mississauga, Ontario, Canada and Utah Medical Products
Ltd., which operates a manufacturing facility in Athlone, Ireland,
(in the aggregate, the Company) are in the primary business of
developing, manufacturing and globally distributing specialized
medical devices for the healthcare industry. The Company’s broad
range of products includes those used in critical care areas and the
labor and delivery departments of hospitals, as well as outpatient
clinics and physicians’ offices. Products are sold directly to end
user facilities in the U.S., Ireland, UK, Canada, France and Australia,
and through third party distributors in other outside the U.S.
(OUS) markets. Domestically, UTMD has an exclusive distribution
relationship with CooperSurgical, Inc. for the Filshie Clip System.
UTMD also sells subcontract manufactured components and
finished products to over 145 companies in the U.S. for their
medical and non-medical products.
Use of Estimates in the Preparation of Financial Statements.
The preparation of financial statements in conformity with
accounting principles generally accepted in the United States of
America requires management to make estimates and assumptions
that affect the reported amounts of assets and liabilities and
disclosure of contingent assets and liabilities at the date of the
financial statements and the reported amounts of revenues and
expenses during the reporting period. Although actual results could
differ from those estimates, management believes it has considered
and disclosed all relevant information in making its estimates that
materially affect reported performance and current values.
Principles of Consolidation. The consolidated financial statements
include those of the Company and its subsidiaries. All intercompany
accounts and transactions have been eliminated in consolidation.
Cash and Cash Equivalents. For purposes of the consolidated
statement of cash flows, the Company considers cash on deposit
and short-term investments with original maturities of three
months or less to be cash and cash equivalents.
Investments. The Company classifies its investments as “available-
for-sale.” Securities classified as “available-for-sale” are carried in
the financial statements at fair value. Realized gains and losses,
determined using the specific identification method, are included
in operations; unrealized holding gains and losses are reported as a
separate component of accumulated other comprehensive income.
Declines in fair value below cost that are other than temporary are
included in operations. As of December 31, 2017 the Company
retained a freely tradeable investment in Citigroup (C) (see note 3).
Notes to Consolidated Financial Statements(December 31, 2017, 2016 and 2015 — Currency amounts are in thousands except per share amounts, and where noted.)
UTMD201722
U TA H M E D I C A L P R O D U C TS , I N C .

whenever events or changes in circumstances indicate that
their net book value may not be recoverable. When such factors
and circumstances exist, the Company compares the projected
undiscounted future cash flows associated with the related asset
or group of assets over their estimated useful lives against their
respective carrying amounts. Impairment, if any, is based on the
excess of the carrying amount over the fair value of those assets, and
is recorded in the period in which the determination was made.
Intangible Assets. Costs associated with the acquisition of patents,
trademarks, trade names, customer relationships, regulatory
approvals & product certifications, license rights and non-compete
agreements are capitalized, and are being amortized using the
straight-line method over periods ranging from 5 to 20 years.
UTMD’s goodwill is tested for impairment annually, in the fourth
quarter of each year, using a fair value measurement test, in
accordance with ASC 350. UTMD also performs impairment tests
contemporaneously, if circumstances change that would more
than likely reduce the fair value of goodwill below its net book
value. If UTMD determines that its goodwill is impaired, a second
step is completed to measure the amount of the impairment loss.
UTMD does not expect its goodwill to become impaired in the
foreseeable future. Estimated future amortization expense on
intangible assets currently held, using the 2017 year-end 1.3523
USD/GBP and .7815 USD/AUD currency exchange rates, is about
$1,981 in 2018, $1,980 in 2019 and 2020, $1,974 in 2021, and $1,973
in 2022 (see note 2).
Revenue Recognition. The Company recognizes revenue at
the time of product shipment as UTMD meets its contractual
performance obligations to the customer at the time of shipment.
Revenue recognized by UTMD is based upon the consideration
to which UTMD is entitled from its customers as a result of
shipping a physical product, in accordance with the documented
arrangements and fixed contracts in which the selling price was
fixed prior to the Company’s acceptance of an order. Revenue
from service sales, which are immaterial to UTMD, is generally
recognized when the service is completed and invoiced. As
demonstrated by decades of experience in successful and
consistent collections, there is very minor and insignificant
uncertainty regarding the collectability of invoiced amounts
reasonably within the terms of the Company’s contracts. There
are circumstances under which insignificant revenue may be
recognized when product is not shipped, which meet the criteria
of ASU 2014-09: the Company provides engineering services, for
example, design and production of manufacturing tooling that
may be used in subsequent UTMD manufacturing of custom
components for other companies. This revenue is recognized
when UTMD’s performance obligations have been completed
according to a fixed contractual agreement. UTMD includes
handling fees charged to customers in revenues.
Income Taxes. The Company accounts for income taxes under
ASC 740, “Accounting for Income Taxes,” whereby deferred taxes
are computed under the asset and liability method.
In November 2015, the FASB released ASU 2015-17, Income Taxes
(Topic 740): Balance Sheet classification of Deferred Taxes. ASU
2015-17 requires that all deferred income taxes are classified as
noncurrent in a classified statement of financial position. The
Company adopted ASU 2015-17 retrospectively effective January
1, 2017.
On December 22, 2017 the U.S. Tax Cuts and Jobs Act of 2017
(Tax Act) was signed into law. As a result of the Tax Act, the U.S.
statutory tax rate was lowered from 35% to 21% effective January
1, 2018, among other changes. ASC 740 requires companies to
recognize the effect of tax law changes in the period of enactment;
therefore, UTMD was required to revalue its deferred tax assets
and liabilities at December 31, 2017 at the new rate.
The Tax Act contains a deemed repatriation transition tax
(Transition Tax) on accumulated earnings and profits of the
Company’s non-U.S. subsidiaries that have not been subject to
U.S. tax. The Company plans to elect to pay its net Transition Tax
over eight years.
On December 22, 2017, the SEC issued SAB 118 which provides
guidance on accounting for the impact of the Tax Act. SAB 118
provides a measurement period of up to one year from enactment
for a company to complete its tax accounting under ASC 740.
Once a company is able to make a reasonable estimate and record
a provisional amount for effects of the Tax Act it is required to
do so. Such provisional measurement amounts may change as
remaining data is obtained, calculations are prepared and analysis
and review are completed.
During the fourth quarter of 2017, the Company recorded a
provisional tax charge for the Transition Tax of $6,288 and a
provisional tax charge of $228 for the re-measurement of its U.S.
deferred tax balances. Both provisional tax amounts are the
Company’s reasonable estimate of the impact of the Tax Act based
on its understanding and available guidance. These provisional
amounts may change as the Company receives additional
clarification and implementation guidance.
The Company or one of its subsidiaries files income tax returns in
the U.S. federal jurisdiction, in Utah, in the United Kingdom, in
Australia, in Ireland and in Canada.
The Company recognizes interest accrued related to unrecognized
tax benefits in interest expenses and any related penalties in
income taxes. The Company did not recognize any tax-related
interest expense or have any tax penalties in any of the three years
2015 through 2017.
Legal Costs. The Company has been involved in lawsuits which
are an expected consequence of its operations and in the ordinary
course of business. The Company maintains a reserve for legal costs
which are probable and estimated based on previous experience
and known risk. The reserve for legal costs at December 31, 2017 and
2016 was $182 and $134, respectively (see note 2).
UTMD2017 23

Earnings per Share. The computation of basic earnings per
common share is based on the weighted average number of shares
outstanding during each year.
The computation of earnings per common share assuming dilution
is based on the weighted average number of shares outstanding
during the year plus the weighted average common stock
equivalents which would arise from the exercise of stock options
outstanding using the treasury stock method and the average
market price per share during the year.
The shares (in thousands) used in the computation of the Company’s
basic and diluted earnings per share are reconciled as follows:
2017 2016 2015
Weighted average number of
shares outstanding – basic 3,718 3,751 3,752
Dilutive effect of stock options 19 15 20
Weighted average number of shares
outstanding, assuming dilution 3,737 3,766 3,772
Presentation of Sales and Similar Taxes. Sales tax on revenue-
producing transactions is recorded as a liability when the sale
occurs. UTMD is not required to withhold sales tax on OUS sales,
and at least 90% of domestic 2017 sales were to customers who are
tax exempt or who are in jurisdictions where UTMD is not required
to withhold sales tax.
Stock-Based Compensation. At December 31, 2017, the
Company has stock-based employee compensation plans, which
are described more fully in note 9. The Company accounts for
stock compensation under ASC 718, Share-Based Payment. This
statement requires the Company to recognize compensation cost
based on the grant date fair value of options granted to employees
and directors. In 2017, the Company recognized $129 in stock-based
compensation cost compared to $92 in 2016 and $87 in 2015.
Translation of Foreign Currencies. Assets and liabilities of the
Company’s foreign subsidiaries are translated into U.S. dollars
at the applicable exchange rates at year-end. Net gains or losses
resulting from the translation of the Company’s assets and liabilities
are reflected as a separate component of stockholders’ equity. A
negative translation impact on stockholders’ equity reflects a
current relative U.S. Dollar value higher than at the point in time
that assets were actually acquired in a foreign currency. A positive
translation impact would result from a U.S. dollar weaker in value
than at the point in time foreign assets were acquired. Year-end
translation gains or losses of non-functional currency bank account
balances, e.g. EUR and AUD balances held by the UK subsidiary, are
recognized as non-operating income or expense, as applicable.
Income and expense items are translated at the weighted average
rate of exchange (based on when transactions actually occurred)
during the year.
Note 2. Detail of Certain Balance Sheet Accounts
December 31, 2017 2016
Accounts and other receivables:
Accounts receivable $ 3,713 $ 3,289
Income tax receivable – 7
Accrued interest and other 14 11
Less allowance for doubtful accounts (104) (96)
Total accounts and other receivables $ 3,623 $ 3,211
Inventories:
Finished products $ 1,313 $ 1,327
Work-in-process 1,270 942
Raw materials 2,661 2,273
Total inventories $ 5,244 $ 4,542
Other intangible assets:
Patents $ 2,183 $ 2,161
Non-compete agreements 135 123
Trademark & trade names 9,921 9,074
Customer relationships 9,669 8,822
Regulatory approvals & product certifications 12,897 11,767
Total other intangible assets 34,805 31,947
Accumulated amortization (16,961) (13,683)
Other intangible assets, net $17,844 $18,264
Accrued expenses:
Income taxes payable $ 1,259 $ 799
Payroll and payroll taxes 1,199 1,117
Reserve for litigation costs 182 134
Other 1,706 66
Total accrued expenses $ 4,346 $ 2,116
Note 3. InvestmentsThe Company’s investments, classified as available-for-sale consist
of the following:
December 31, 2017 2016
Investments, at cost $ 42 $ 42
Equity securities:
Unrealized holding gains 38 22
Unrealized holding (losses) — —
Investments, at fair value $ 80 $ 64
During the three years 2015 through 2017, UTMD did not have any
proceeds from sales of available-for-sale securities.
Note 4. Fair Value Measurements and Financial InstrumentsThe Company follows a fair value hierarchy that prioritizes the
inputs to valuation techniques used to measure fair value. The
hierarchy gives the highest priority to unadjusted quoted prices
Notes to Consolidated Financial Statement (continued)
UTMD201724
U TA H M E D I C A L P R O D U C TS , I N C .
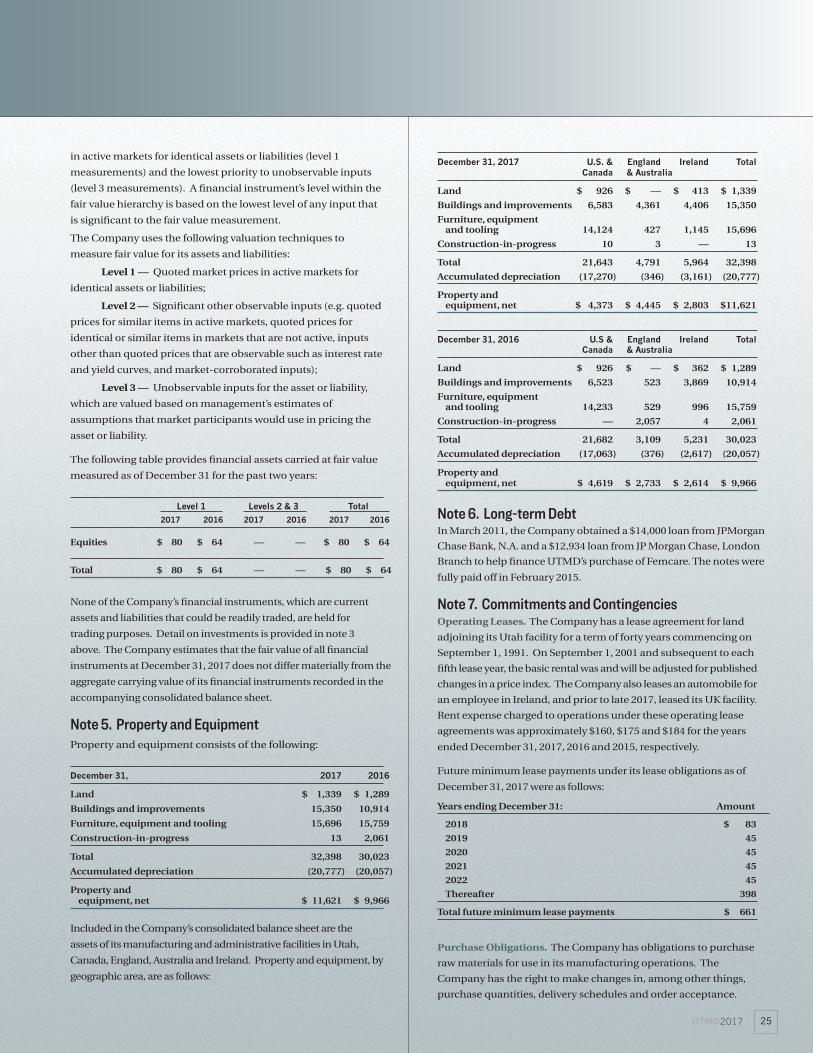
in active markets for identical assets or liabilities (level 1
measurements) and the lowest priority to unobservable inputs
(level 3 measurements). A financial instrument’s level within the
fair value hierarchy is based on the lowest level of any input that
is significant to the fair value measurement.
The Company uses the following valuation techniques to
measure fair value for its assets and liabilities:
Level 1 — Quoted market prices in active markets for
identical assets or liabilities;
Level 2 — Significant other observable inputs (e.g. quoted
prices for similar items in active markets, quoted prices for
identical or similar items in markets that are not active, inputs
other than quoted prices that are observable such as interest rate
and yield curves, and market-corroborated inputs);
Level 3 — Unobservable inputs for the asset or liability,
which are valued based on management’s estimates of
assumptions that market participants would use in pricing the
asset or liability.
The following table provides financial assets carried at fair value
measured as of December 31 for the past two years:
Level 1 Levels 2 & 3 Total 2017 2016 2017 2016 2017 2016
Equities $ 80 $ 64 — — $ 80 $ 64
Total $ 80 $ 64 — — $ 80 $ 64
None of the Company’s financial instruments, which are current
assets and liabilities that could be readily traded, are held for
trading purposes. Detail on investments is provided in note 3
above. The Company estimates that the fair value of all financial
instruments at December 31, 2017 does not differ materially from the
aggregate carrying value of its financial instruments recorded in the
accompanying consolidated balance sheet.
Note 5. Property and EquipmentProperty and equipment consists of the following:
December 31, 2017 2016
Land $ 1,339 $ 1,289
Buildings and improvements 15,350 10,914
Furniture, equipment and tooling 15,696 15,759
Construction-in-progress 13 2,061
Total 32,398 30,023
Accumulated depreciation (20,777) (20,057)
Property and equipment, net $ 11,621 $ 9,966
Included in the Company’s consolidated balance sheet are the
assets of its manufacturing and administrative facilities in Utah,
Canada, England, Australia and Ireland. Property and equipment, by
geographic area, are as follows:
December 31, 2017 U.S. & England Ireland Total Canada & Australia
Land $ 926 $ — $ 413 $ 1,339
Buildings and improvements 6,583 4,361 4,406 15,350
Furniture, equipment and tooling 14,124 427 1,145 15,696
Construction-in-progress 10 3 — 13
Total 21,643 4,791 5,964 32,398
Accumulated depreciation (17,270) (346) (3,161) (20,777)
Property and equipment, net $ 4,373 $ 4,445 $ 2,803 $11,621
December 31, 2016 U.S & England Ireland Total Canada & Australia
Land $ 926 $ — $ 362 $ 1,289
Buildings and improvements 6,523 523 3,869 10,914
Furniture, equipment and tooling 14,233 529 996 15,759
Construction-in-progress — 2,057 4 2,061
Total 21,682 3,109 5,231 30,023
Accumulated depreciation (17,063) (376) (2,617) (20,057)
Property and equipment, net $ 4,619 $ 2,733 $ 2,614 $ 9,966
Note 6. Long-term Debt In March 2011, the Company obtained a $14,000 loan from JPMorgan
Chase Bank, N.A. and a $12,934 loan from JP Morgan Chase, London
Branch to help finance UTMD’s purchase of Femcare. The notes were
fully paid off in February 2015.
Note 7. Commitments and Contingencies Operating Leases. The Company has a lease agreement for land
adjoining its Utah facility for a term of forty years commencing on
September 1, 1991. On September 1, 2001 and subsequent to each
fifth lease year, the basic rental was and will be adjusted for published
changes in a price index. The Company also leases an automobile for
an employee in Ireland, and prior to late 2017, leased its UK facility.
Rent expense charged to operations under these operating lease
agreements was approximately $160, $175 and $184 for the years
ended December 31, 2017, 2016 and 2015, respectively.
Future minimum lease payments under its lease obligations as of
December 31, 2017 were as follows:
Years ending December 31: Amount
2018 $ 83
2019 45
2020 45
2021 45
2022 45
Thereafter 398
Total future minimum lease payments $ 661
Purchase Obligations. The Company has obligations to purchase
raw materials for use in its manufacturing operations. The
Company has the right to make changes in, among other things,
purchase quantities, delivery schedules and order acceptance.
UTMD2017 25

Product Liability. Except for its Filshie Clip System, the Company
is self-insured for product liability risk. “Product liability” is an
insurance industry term for the cost of legal defense and possible
damages awarded as a result of use of a company’s product
during a procedure which results in an injury of a patient. The
Company maintains a reserve for product liability litigation and
damages consistent with its previous long-term experience. Actual
product liability litigation costs and damages during the last three
reporting years have been immaterial, which is consistent with the
Company’s overall history. Femcare’s product liability indemnity
limit through an independent insurer is £5 million each claim and
in the annual aggregate.
The Company absorbs the costs of clinical training and trouble-
shooting in its on-going operating expenses.
Warranty Reserve. The Company’s published warranty is: “UTMD
warrants its products to conform in all material respects to all
published product specifications in effect on the date of shipment,
and to be free from defects in material and workmanship for a
period of thirty (30) days for supplies, or twenty-four (24) months
for equipment, from date of shipment. During the warranty
period UTMD shall, at its option, replace any products shown to
UTMD's reasonable satisfaction to be defective at no expense to
the Purchaser or refund the purchase price.”
UTMD maintains a warranty reserve to provide for estimated costs
which are likely to occur. The amount of this reserve is adjusted,
as required, to reflect its actual experience. Based on its analysis of
historical warranty claims and its estimate that existing warranty
obligations are immaterial, no warranty reserve was made at
December 31, 2017 or December 31, 2016.
Litigation. The Company has been involved in lawsuits which
are an expected consequence of its operations and in the
ordinary course of business. Presently, there is no litigation
or threatened litigation for which the Company believes the
outcome may be material to its financial results. The Company
applies its accounting policy to accrue legal costs that can be
reasonably estimated.
Note 8. Income TaxesDeferred tax assets (liabilities) consist of the following temporary
differences:
2017 2016
Inventory write-downs and differences due to UNICAP $ 56 $ 98
Allowance for doubtful accounts 16 25
Accrued liabilities and reserves 89 147
Other – foreign 4 (23)
Depreciation and amortization (3,789) (4,277)
Unrealized investment gains 66 105
Deferred income taxes, net $ (3,558) $ (3,925)
Notes to Consolidated Financial Statements (continued)
UTMD201726
The components of income tax expense are as follows:
Years ended December 31, 2017 2016 2015
Current $ 10,944 $ 5,467 $ 4,877
Deferred (367) (1,173) (1,175)
Total $ 10,577 $ 4,294 $ 3,702
Income tax expense differed from amounts computed by applying the
statutory federal rate to pretax income as follows:
Years ended December 31, 2017 2016 2015
Federal income tax expense at the statutory rate $ 3,086 $ 2,998 $ 2,704
State income taxes 299 291 262
Foreign income taxes (blended rate) 1,444 1,270 990
ETI, manufacturing deduction and tax credits (303) (287) (257)
Deemed repatriation transition tax 6,288 — —
Effective federal rate change (288) — —
Other (9) 22 3
Total $10,577 $ 4,294 $ 3,702
The domestic and foreign components of income before income tax expense were as follows:
Years ended December 31, 2017 2016 2015
Domestic $ 9,124 $ 8,688 $ 7,973
Foreign 9,958 7,734 7,572
Total $19,082 $16,422 $15,545
Note 9. OptionsThe Company has stock option plans which authorize the grant of
stock options to eligible employees, directors and other individuals
to purchase up to an aggregate of 307 thousand shares of common
stock, of which 54 thousand are outstanding as of December 31,
2017. All options granted under the plans are granted at current
market value at the date of grant, and may be exercised between
six months and ten years following the date of grant. The plans are
intended to advance the interest of the Company by attracting and
ensuring retention of competent directors, employees and executive
personnel, and to provide incentives to those individuals to devote
their utmost efforts to the advancement of stockholder value.
Changes in stock options were as follows:
Shares Price Range (000's) Per Share
2017
Granted — $ — $ —
Expired or canceled 12 49.18 – 58.50
Exercised 9 24.00 – 49.18
Total outstanding at December 31 54 24.00 – 58.50
Total exercisable at December 31 39 24.00 – 58.50
U TA H M E D I C A L P R O D U C TS , I N C .

Shares Price Range (000's) Per Share
2016
Granted 28 $ 58.50 – $ 58.50
Expired or canceled 3 49.18 – 49.18
Exercised 13 24.00 – 49.18
Total outstanding at December 31 75 24.00 – 58.50
Total exercisable at December 31 36 24.00 – 50.72
2015
Granted — $ — $ —
Expired or canceled 7 26.58 – 49.18
Exercised 22 21.68 – 49.18
Total outstanding at December 31 62 24.00 – 50.72
Total exercisable at December 31 41 24.00 – 50.72
For the years ended December 31, 2017, 2016 and 2015, the
Company reduced current income taxes payable by $38, $50 and
$114, respectively, for the income tax benefit attributable to sale
by optionees of common stock received upon the exercise of stock
options.
Stock-Based Compensation. In 2017, the Company recognized
$129 in equity compensation cost, compared to $92 in 2016 and $87
in 2015.
The fair value of each option grant is estimated on the date of grant
using the Black-Scholes option pricing model with the following
weighted average assumptions:
Years ended December 31, 2017 2016 2015
Expected dividend amount per quarter $ — $ .2775 $ —
Expected stock price volatility 28.0%
Risk-free interest rate 1.30%
Expected life of options 4.7 years
The per share weighted average fair value of options granted during
2016 is $12.15. No options were granted in 2017 or 2015.
All UTMD options vest over a four-year service period. Expected
dividend amounts were estimated based on the actual cash
dividend rate at the time the options were granted and an estimate
of future dividends based on past dividend rate changes as well
as management’s expectations of future dividend rates over the
expected holding period of the options. Expected volatility is based
on UTMD’s historical volatility over recent periods of time and trends
in that volatility, giving weight to more recent periods. Risk free
interest rates were estimated based on actual U.S. Treasury Securities
Interest rates as reported by the Federal Reserve Bank for periods of
time equivalent to the holding periods estimated for the options on
the dates the options were granted. Expected term of options were
estimated based on historical holding periods for similar options
previously granted by UTMD to employees and directors.
The following table summarizes information about stock options
outstanding at December 31, 2017:
Options Outstanding Options Exercisable
Weighted Average Weighted Weighted Range of Remaining Average Average Exercise Number Contractual Exercise Number Exercise Prices Outstanding Life (Years) Price Exercisable Price
$24.00 – 33.30 16,361 2.92 $27.42 16,361 $27.72
49.18 – 58.50 37,979 7.44 53.28 22,264 51.02
$24.00 – 58.50 54,340 6.08 $45.50 38,625 $41.02
Note 10. Geographic Sales InformationThe Company had sales in the following geographic areas based
on the customer’s country of domicile:
2017 2016 2015
United States $20,286 $19,488 $20,364
Europe 8,519 7,989 7,720
Other 12,609 11,821 12,073
Note 11. Long-lived Assets by Geographic AreaThe Company’s long-lived assets by geographic area were as follows:
2017 2016 2015
United States $10,866 $11,151 $11,097
England 28,604 26,710 31,901
Ireland 2,803 2,614 2,761
Australia 525 513 543
Canada 759 729 —
Note 12. Revenues by Product CategoryThe Company had revenues in the following product categories:
Product Category 2017 2016 2015
Obstetrics $ 4,499 $ 4,532 $ 4,587
Gynecology/Electrosurgery/Urology 23,175 20,683 22,356
Neonatal 6,154 6,007 6,299
Blood Pressure Monitoring and Accessories 7,586 8,076 6,915
Note 13. Product Sale and Purchase Commitments The Company has had license agreements for the rights to
develop and market certain products or technologies owned by
unrelated parties. The confidential terms of such agreements
are unique and varied, depending on many factors relating to
the value and stage of development of the technology licensed.
Royalties on future product sales are a normal component of such
agreements and are included in the Company’s cost of goods sold
on an ongoing basis.
UTMD2017 27

Notes to Consolidated Financial Statement (continued)
In 2017, 2016 and 2015, UTMD received royalties of $86, $91 and
$93, respectively, for the use of intellectual property of Filshie Clip
System as part of Femcare’s exclusive U.S. distribution agreement
with CooperSurgical Inc.
UTMD had $2,191 in operating lease and purchase commitments
as of December 31, 2017.
Note 14. Employee Benefit PlanThe Company sponsors a contributory 401(k) savings plan for
U.S. employees, and contributory retirement plans for Ireland,
UK, Australia and Canada employees. The Company’s matching
contribution is determined annually by the board of directors.
Company contributions were approximately $153, $151 and $161 for
the years ended December 31, 2017, 2016 and 2015, respectively.
Note 15. Recent Accounting PronouncementsIn March 2016, new accounting guidance was issued to simplify
several aspects of accounting for employee share-based payment
(including stock option) transactions, including the accounting
for income taxes, forfeitures and statutory tax withholding
requirements, as well as classification in the statement of cash
flows. Under the guidance, entities recognize all excess tax
benefits and tax deficiencies as income tax expense or benefit in
the income statement. UTMD adopted this standard on January
1, 2017, which had an insignificant impact on its consolidated
financial statements. UTMD made a determination to continue
to account for forfeitures by estimating the number of awards that
are expected to vest. Because UTMD primarily issues incentive
stock options, excess tax benefits and tax deficiencies have
historically been minimal.
In May 2014, new accounting guidance (ASU 2014-09) was issued
that outlines a single comprehensive model for entities to use in
accounting for revenue arising from contracts with customers
and supersedes most current revenue recognition guidance,
including industry-specific guidance. The guidance is based on
the principle that an entity should recognize revenue to depict
the transfer of goods or services to customers in an amount
that reflects the consideration to which the entity expects to be
entitled in exchange for those goods or services. The guidance
also requires additional disclosure about the nature, amount,
timing and uncertainty of revenue and cash flows arising from
customer contracts, including significant judgments and changes
in judgments and assets recognized from costs incurred to fulfill
a contract. UTMD adopted this new standard on January 1, 2018,
using a full retrospective approach. In accordance with ASU
2014-09, UTMDs revenue recognition is based on its contracts
and the performance obligations identified in them. With very
insignificant and limited exceptions, the Company’s performance
obligation is met when it ships a physical product to a customer.
The basis on which UTMD recognizes revenue was updated on
January 1, 2018, but it did not result in a change to the process
and timing of revenue recognition, because the previous revenue
recognition method complies with ASU 2014-09. Therefore, the
adoption of ASU 2014-09 did not have an impact on UTMD’s
financial statements.
In February 2016, new accounting guidance was issued which
requires recording most leases on the balance sheet. The new
lease standard requires disclosure of key information about lease
arrangements and aligns many of the underlying principles of this
new model with those in the new revenue recognition standard
noted above. This guidance becomes effective for annual reporting
periods beginning after December 15, 2018, with early adoption
permitted. UTMD has yet to assess the impact that this standard
will have on its consolidated financial statements when it is
adopted. The only significant lease the Company anticipates it will
have at that time is for the parking lot at its Utah facility (see Note 7).
Note 16. Subsequent EventsThe Company evaluated its December 31, 2017 financial
statements for subsequent events through the date the financial
statements were issued. The Company is not aware of any
subsequent events which would require recognition or disclosure
in the financial statements.
FORWARD LOOKING INFORMATION This report contains certain forward-looking statements and information
relating to the Company that are based on the beliefs of management
as well as assumptions made by management based on information
currently available. When used in this document, the words “anticipate,”
“believe,” “project,” “estimate,” “expect,” “intend” and similar expressions,
as they relate to the Company or its management, are intended to identify
forward-looking statements. Such statements reflect the current view of
the Company respecting future events and are subject to certain risks,
uncertainties and assumptions, including the risks and uncertainties
stated throughout the document. Although the Company has attempted
to identify important factors that could cause the actual results to differ
materially, there may be other factors that cause the forward statement not
to come true as anticipated, believed, projected, expected, or intended.
Should one or more of these risks or uncertainties materialize, or should
underlying assumptions prove incorrect, actual results may differ
materially from those described herein as anticipated, believed, projected,
estimated, expected or intended. Financial estimates are subject to
change and are not intended to be relied upon as predictions of future
operating results, and the Company assumes no obligation to update or
disclose revisions to those estimates.
RISK FACTORSLegislative healthcare reform in the United States, as embodied in The
Patient Protection and Affordable Care Act and the Health Care and
Education Reconciliation Act of 2010 (the “Acts”) added a substantial
excise tax (MDET) in 2013-2015 that increased administrative costs and
has led to decreased revenues in the U.S.:
UTMD201728
U TA H M E D I C A L P R O D U C TS , I N C .

UTMD2017 29
The voluminous Acts, administrative rules to enforce the Acts and
promised efforts to reform the Acts, make the U.S. medical device
marketplace unpredictable, particularly for the thousands of small medical
device manufacturers including UTMD that do not have the overhead
structure that the larger medical device companies can afford. Fortunately,
the U.S. Congress suspended the MDET for the years of 2016-2019. To the
extent that the Acts will in the future continue to place additional burdens
on small medical device companies in the form of the excise tax on medical
device sales, additional oversight of marketing and sales activities and new
reporting requirements, the result is likely to continue to be negative for
UTMD’s ability to effectively compete and support continued investments
in new product development and marketing of specialty devices in the U.S.
Increasing regulatory burdens including premarketing approval delays
may result in significant loss of revenue, unpredictable costs and loss of
management focus on helping the Company proactively conform with
requirements and thrive:
The Company’s experience in 2001-2005, when the FDA improperly
sought to shut it down, highlights the ongoing risk of being subject to a
regulatory environment which can be arbitrary and capricious. The risks
associated with such a circumstance relate not only to the substantial
costs of litigation in millions of dollars, but also loss of business, the
diversion of attention of key employees for an extended period of
time, including new product development and routine quality control
management activities, and a tremendous psychological and emotional toll
on dedicated and diligent employees.
Since the FDA reserves to itself the interpretation of which vague industry
standards comprise law at any point in time, it is impossible for any
medical device manufacturer to ever be confident that it is operating
within the Agency’s version of the law. The unconstitutional result is that
all companies, including UTMD, are considered guilty prior to proving
their innocence.
Premarketing submission administrative burdens and substantial
increases in “user fees” increase product development costs and result
in delays to revenues from new or improved devices. It recently took two
and a half years to gain FDA approval of the use of a clearly safer single use
Filshie Clip applicator, which had been in use for over seven years OUS,
in lieu of a reused applicator approved in the U.S. since 1996, made of
substantially equivalent materials for the same intended use applying the
same implanted clip.
The growth of Group Purchasing Organizations (GPOs) adds non-
productive costs, typically weakens the Company’s marketing and sales
efforts and may result in lower revenues:
GPOs, theoretically acting as bargaining agents for member hospitals, but
actually collecting revenues from the companies that they are negotiating
with, have made a concerted effort to turn medical devices that convey
special patient safety advantages and better health outcomes, like
UTMD’s, into undifferentiated commodities. GPOs have been granted an
antitrust exemption by the U.S. Congress. Otherwise, their business model
based on “kickbacks” would be a violation of law. These bureaucratic
entities do not recognize or understand the overall cost of care as it
relates to safety and effectiveness of devices, and they create a substantial
administrative burden that is primarily related to collection of their
administrative fees.
The Company’s business strategy may not be successful in the future:
As the level of complexity and uncertainty in the medical device industry
increases, evidenced, for example, by the unpredictable regulatory
environment, the Company’s views of the future and product/ market
strategy may not yield financial results consistent with the past.
As the healthcare industry becomes increasingly bureaucratic it puts
smaller companies like UTMD at a competitive disadvantage:
An aging population is placing greater burdens on healthcare systems,
particularly hospitals. The length of time and number of administrative
steps required in adopting new products for use in hospitals has
grown substantially in recent years. Smaller companies like UTMD
typically do not have the administrative resources to deal with broad
new administrative requirements, resulting in either loss of revenue
or increased costs. As UTMD introduces new products it believes are
safer and more effective, it may find itself excluded from certain clinical
users because of the existence of long term supply agreements for
preexisting products, particularly from competitors which offer hospitals
a broader range of products and services. Restrictions used by hospital
administrators to limit clinician involvement in device purchasing
decisions makes communicating UTMD’s clinical advantages much more
difficult.
A product liability lawsuit could result in significant legal expenses and
a large award against the Company:
UTMD’s devices are frequently used in inherently risky situations to
help physicians achieve a more positive outcome than what might
otherwise be the case. In any lawsuit where an individual plaintiff suffers
permanent physical injury, the possibility of a large award for damages
exists whether or not a causal relationship exists.
The Company’s reliance on third party distributors in some markets may
result in less predictable revenues:
UTMD’s distributors have varying expertise in marketing and selling
specialty medical devices. They also sell other devices that may result in
less focus on the Company’s products. In some countries, notably China,
Pakistan and India not subject to similarly rigorous standards, a distributor
of UTMD’s products may eventually become a competitor with a cheaper
but lower quality version of UTMD’s devices.
The loss of one or more key employees could negatively affect UTMD
performance:
In a small company with limited resources, the distraction or loss of key
personnel at any point in time may be disruptive to performance. The
Company’s benefits programs are key to recruiting and retaining talented
employees. An increase in UTMD’s employee healthcare plan costs, for
example, may cause the Company to have to reduce coverages which in
turn represents a risk to retaining key employees.
Fluctuations in foreign currencies relative to the USD can result in
significant differences in period to period financial results:
Since a significant portion of UTMD’s sales are invoiced in foreign
currencies and consolidated financial results are reported in USD terms,
a stronger USD can have negative revenue effects. Conversely, a weaker
USD would increase foreign subsidiary operating costs in USD terms. For
the portion of sales to foreign entities made in fixed USD terms, a stronger
USD makes the devices more expensive and weakens demand. For the
portion invoiced in a foreign currency, not only USD-denominated sales are
reduced, but also gross profits may be reduced because finished distributed
products and/or U.S. made raw materials and components are likely being
purchased in fixed USD.
Report of Independent Registered Public Accounting Firm
To the Board of Directors and Stockholders of Utah Medical Products, Inc.
Opinions on the Financial Statements and Internal Control over Financial Reporting
We have audited the accompanying consolidated balance sheets of Utah Medical Products, Inc. as of
December 31, 2017 and 2016, and the related consolidated statements of income and comprehensive
income, stockholders’ equity, and cash flows for each of the years in the three-year period ended
December 31, 2017. We also have audited Utah Medical Products, Inc.’s internal control over financial
reporting as of December 31, 2017, based on criteria established in Internal Control—Integrated Framework
(1992) issued by the Committee of Sponsoring Organizations of the Treadway Commission (COSO).
In our opinion, based on our audits and the report of the other auditors, the consolidated financial
statements referred to above present fairly, in all material respects, the financial position of Utah Medical
Products, Inc. as of December 31, 2017 and 2016, and the results of its operations and its cash flows
for each of the years in the three-year period ended December 31, 2017 in conformity with accounting
principles generally accepted in the United States of America. Also in our opinion, based on our audit and
the report of the other auditors, Utah Medical Products, Inc. maintained, in all material respects, effective
internal control over financial reporting as of December 31, 2017, based on criteria established in Internal
Control—Integrated Framework (1992) issued by COSO.
Basis for Opinion
Utah Medical Products, Inc.’s management is responsible for these consolidated financial statements,
for maintaining effective internal control over financial reporting, and for its assessment of the
effectiveness of internal control over financial reporting, included in the accompanying Management’s
Report on Internal Control Over Financial Reporting. Our responsibility is to express an opinion on these
consolidated financial statements and an opinion on Utah Medical Products, Inc.'s internal control
over financial reporting based on our audits. We are a public accounting firm registered with the Public
Company Accounting Oversight Board (United States) (PCAOB) and are required to be independent
with respect to Utah Medical Products, Inc. in accordance with the U.S. federal securities laws and the
applicable rules and regulations of the Securities and Exchange Commission and the PCAOB. We did
not audit portions of the consolidated financial statements and we did not examine the effectiveness
of internal control over financial reporting for portions of Femcare Group Limited, a wholly owned
subsidiary. The portions not audited by us include assets of $26,564,000, and $19,412,000 as of December
31, 2017 and 2016, respectively, and total revenues of $11,371,000, $10,214,000, and $12,548,000,
respectively for each of the years in the three-year period ended December 31, 2017. Those portions of
the consolidated financial statements and the effectiveness of internal control over financial reporting
were audited by other auditors whose reports have been furnished to us, and our opinions, insofar as
they relate to the amounts included for Femcare Group Limited and the effectiveness of Femcare Group
Limited’s internal control over financial reporting, is based solely on the reports of the other auditors.
We conducted our audits in accordance with the standards of the PCAOB. Those standards require that
we plan and perform the audits to obtain reasonable assurance about whether the consolidated financial
statements are free of material misstatement, whether due to error or fraud, and whether effective
internal control over financial reporting was maintained in all material respects.
U TA H M E D I C A L P R O D U C TS , I N C .
UTMD201730

UTMD2017 31
Our audits of the consolidated financial statements included performing procedures to assess the risks
of material misstatement of the consolidated financial statements, whether due to error or fraud, and
performing procedures that respond to those risks. Such procedures included examining, on a test basis,
evidence supporting the amounts and disclosures in the consolidated financial statements, assessing the
accounting principles used and significant estimates made by management, and evaluating the overall
consolidated financial statement presentation. Our audit of internal control over financial reporting
included obtaining an understanding of internal control over financial reporting, assessing the risk that a
material weakness exists, and testing and evaluating the design and operating effectiveness of internal control
based on the assessed risk. Our audits also included performing such other procedures as we considered
necessary in the circumstances. We believe that our audits provide a reasonable basis for our opinions.
Definition and Limitations of Internal Control over Financial Reporting
A company’s internal control over financial reporting is a process designed to provide reasonable
assurance regarding the reliability of financial reporting and the preparation of financial statements
for external purposes in accordance with generally accepted accounting principles. A company’s
internal control over financial reporting includes those policies and procedures that (1) pertain to
the maintenance of records that, in reasonable detail, accurately and fairly reflect the transactions
and dispositions of the assets of the company; (2) provide reasonable assurance that transactions
are recorded as necessary to permit preparation of financial statements in accordance with generally
accepted accounting principles, and that receipts and expenditures of the company are being made
only in accordance with authorizations of management and directors of the company; and (3) provide
reasonable assurance regarding prevention or timely detection of unauthorized acquisition, use, or
disposition of the company’s assets that could have a material effect on the financial statements.
Because of its inherent limitations, internal control over financial reporting may not prevent or detect
misstatements. Also, projections of any evaluation of effectiveness to future periods are subject to the risk
that controls may become inadequate because of changes in conditions, or that the degree of compliance
with the policies or procedures may deteriorate.
JONES SIMKINS LLC
We have served as Utah Medical Products, Inc.’s auditor since 2003.
Logan, Utah
March 5, 2018
Management of the Company is responsible for establishing and maintaining adequate internal control over
financial reporting as defined in Rules 13a-15(f) and 15d-15(f) under the Securities Exchange Act of 1934. The
Company's internal control over financial reporting is designed to provide reasonable assurance regarding
the reliability of financial reporting and the preparation of financial statements for external purposes in
accordance with accounting principles generally accepted in the United States of America ("GAAP"). The
Company's internal control over financial reporting includes those policies and procedures that:
• pertain to the maintenance of records that, in reasonable detail, accurately and fairly reflect the
transactions and dispositions of the assets of the Company;
• provide reasonable assurance that transactions are recorded as necessary to permit preparation of financial
statements in accordance with GAAP, and that receipts and expenditures of the Company are being made only
in accordance with authorizations of management and directors of the Company; and
• provide reasonable assurance regarding prevention or timely detection of unauthorized acquisition, use or
disposition of the Company's assets that could have a material effect on the financial statements.
Because of its inherent limitations, internal control over financial reporting may not prevent or detect
misstatements. Also, projections of any evaluation of effectiveness to future periods are subject to the risk that
controls may become inadequate because of changes in conditions, or that the degree of compliance with the
policies or procedures may deteriorate.
The Company’s management assessed the effectiveness of the Company's internal control over financial
reporting as of December 31, 2017. In making this assessment, management used the criteria set forth by the
Committee of Sponsoring Organizations of the Treadway Commission (COSO) in Internal Control-Integrated
Framework (1992).
Based on its assessment and those criteria, management believes that the Company maintained effective
internal control over financial reporting as of December 31, 2017.
The Company's independent registered public accounting firm, Jones Simkins LLC, has audited the
Company's internal control over financial reporting as of December 31, 2017, and its report is shown on the
preceeding page.
Kevin L. Cornwell Paul O. Richins Chief Executive Officer Principal Financial Officer
U TA H M E D I C A L P R O D U C TS , I N C .
Management’s ReportOn Internal Control Over Financial Reporting
UTMD201732
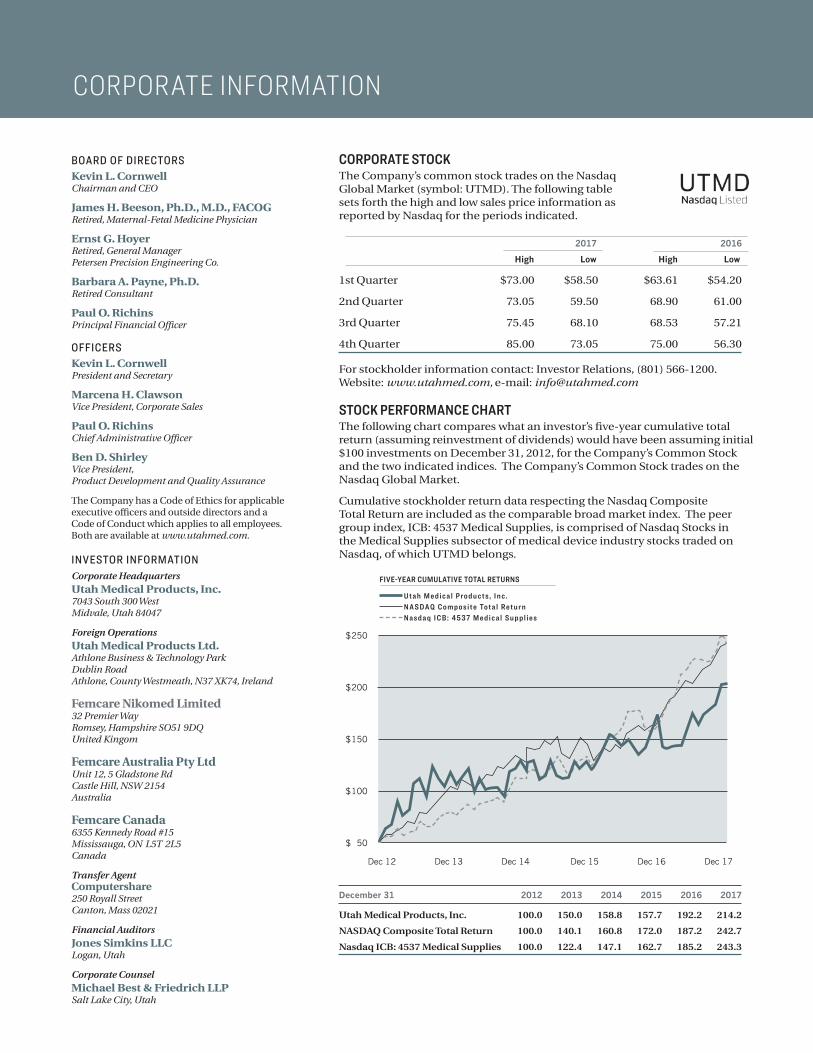
CORPORATE STOCKThe Company’s common stock trades on the Nasdaq Global Market (symbol: UTMD). The following table sets forth the high and low sales price information as reported by Nasdaq for the periods indicated. 2017 2016
High Low High Low
1st Quarter $73.00 $58.50 $63.61 $54.20
2nd Quarter 73.05 59.50 68.90 61.00
3rd Quarter 75.45 68.10 68.53 57.21
4th Quarter 85.00 73.05 75.00 56.30
For stockholder information contact: Investor Relations, (801) 566-1200. Website: www.utahmed.com, e-mail: [email protected]
STOCK PERFORMANCE CHARTThe following chart compares what an investor’s five-year cumulative total return (assuming reinvestment of dividends) would have been assuming initial $100 investments on December 31, 2012, for the Company’s Common Stock and the two indicated indices. The Company’s Common Stock trades on the Nasdaq Global Market.
Cumulative stockholder return data respecting the Nasdaq Composite Total Return are included as the comparable broad market index. The peer group index, ICB: 4537 Medical Supplies, is comprised of Nasdaq Stocks in the Medical Supplies subsector of medical device industry stocks traded on Nasdaq, of which UTMD belongs.
December 31 2012 2013 2014 2015 2016 2017
Utah Medical Products, Inc. 100.0 150.0 158.8 157.7 192.2 214.2
NASDAQ Composite Total Return 100.0 140.1 160.8 172.0 187.2 242.7
Nasdaq ICB: 4537 Medical Supplies 100.0 122.4 147.1 162.7 185.2 243.3
BOARD OF DIRECTORSKevin L. CornwellChairman and CEO
James H. Beeson, Ph.D., M.D., FACOGRetired, Maternal-Fetal Medicine Physician
Ernst G. HoyerRetired, General Manager Petersen Precision Engineering Co.
Barbara A. Payne, Ph.D.Retired Consultant
Paul O. RichinsPrincipal Financial Officer OFFICERSKevin L. CornwellPresident and Secretary
Marcena H. ClawsonVice President, Corporate Sales
Paul O. RichinsChief Administrative Officer
Ben D. ShirleyVice President, Product Development and Quality Assurance
The Company has a Code of Ethics for applicable executive officers and outside directors and a Code of Conduct which applies to all employees. Both are available at www.utahmed.com.
INVESTOR INFORMATIONCorporate HeadquartersUtah Medical Products, Inc.7043 South 300 West Midvale, Utah 84047
Foreign OperationsUtah Medical Products Ltd.Athlone Business & Technology Park Dublin Road Athlone, County Westmeath, N37 XK74, Ireland Femcare Nikomed Limited32 Premier Way Romsey, Hampshire SO51 9DQ United Kingom Femcare Australia Pty LtdUnit 12, 5 Gladstone Rd Castle Hill, NSW 2154 Australia Femcare Canada6355 Kennedy Road #15 Mississauga, ON L5T 2L5 Canada Transfer Agent Computershare250 Royall Street Canton, Mass 02021
Financial AuditorsJones Simkins LLCLogan, Utah
Corporate CounselMichael Best & Friedrich LLPSalt Lake City, Utah
CORPORATE INFORMATION
FIVE-YEAR CUMULATIVE TOTAL RETURNS
U t a h M e d i c a l P r o d u c t s , I n c . N A S D A Q C o m p o s i t e To t a l R e t u r n N a s d a q I C B : 4 5 3 7 M e d i c a l S u p p l i e s
Dec 12 Dec 13 Dec 14 Dec 15 Dec 16 Dec 17
$250
$200
$150
$100
$ 50

7043 South 300 West | Midvale, Utah 84047 U.S.A.
www.utahmed.com | e-mail: [email protected] TA H M E D I C A L P R O D U C TS , I N C . 7043 South 300 West | Midvale, Utah 84047 U.S.A. | www.utahmed.com | e-mail: [email protected]
0 0 4 C T N 2 1 A 5