using the software - united states home | keysight … the network analyzer and place it in an excel...
TRANSCRIPT
1
Using the Software
Software for Agilent Technologies Vector Series Network Analyzers
Software Overview
The IntuiLink Vector Series Network Analyzer (VNA) software offers a set of connectivity tools that enable you to quickly and easily move data from your vector series network analyzers to your PC. Whether you are an experienced programmer or would prefer not to program at all, the IntuiLink software is designed to give you a high-level of instrument control using software applications that you are probably already using on your PC.
For the Non-Programmer — A Simple Toolbar Add-In for Excel and Word
The IntuiLink VNA software provides an easy-to-use toolbar that enables you to connect to your network analyzer from either Microsoft® Excel® or Microsoft® Word®. Once connected, you can perform simple trace data capture and instrument display image transfers directly into your spreadsheet or document. You can save the data and images in spreadsheets, graphs, or image files for use in all Microsoft® Office® products, including PowerPoint and Microsoft Project. This is a real time-saver when creating presentations, staff reports, and regulatory reports.
In both Word and Excel, the toolbar lets you save settings from the network analyzer. You can then restore those settings to the network analyzer. In this way, you can replicate frequently-used measurements and cut down on test time.
The toolbar also lets you set up a series of automatic "snapshots" of your data. When you use the Repeated Measurement feature, you can capture data from the network analyzer at intervals of your choice, providing a history of measurement data.
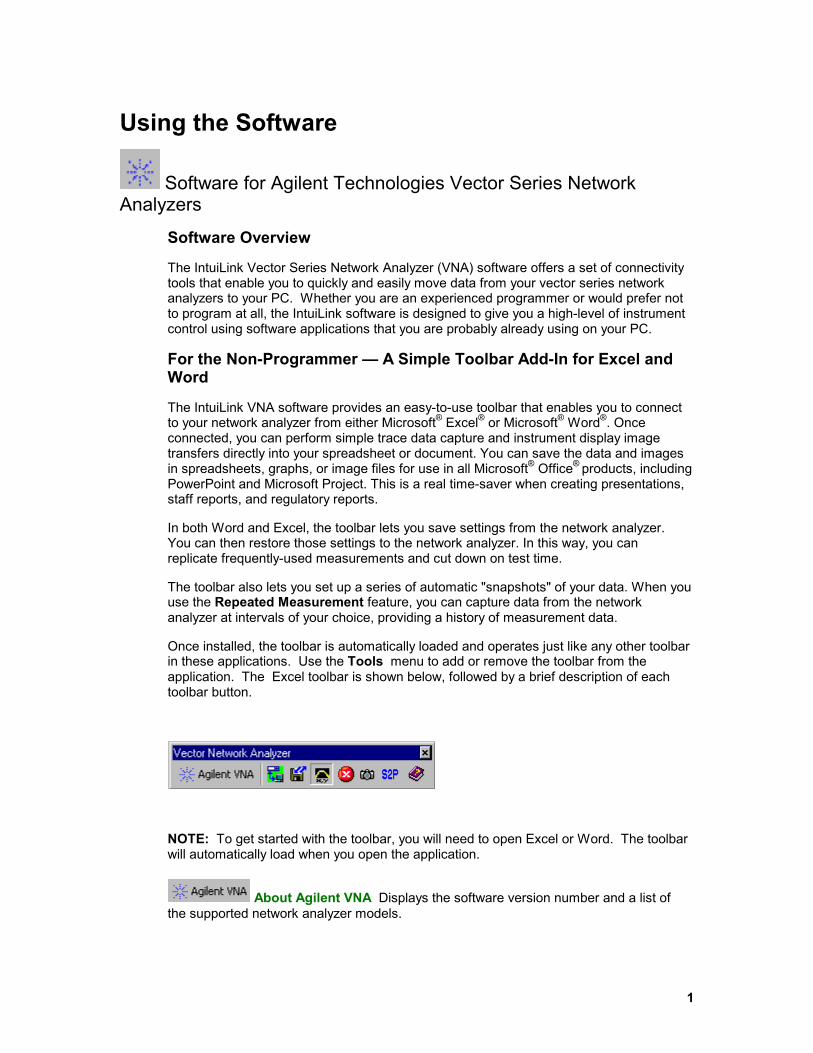
Once installed, the toolbar is automatically loaded and operates just like any other toolbar in these applications. Use the Tools menu to add or remove the toolbar from the application. The Excel toolbar is shown below, followed by a brief description of each toolbar button.
NOTE: To get started with the toolbar, you will need to open Excel or Word. The toolbar will automatically load when you open the application.
About Agilent VNA Displays the software version number and a list of the supported network analyzer models.
2
Connect to Network Analyzer Configures the I/O connection to the network analyzer.
Capture/Restore Settings Captures the network analyzer settings and stores them in the document or worksheet, or to an external file. Restores the saved settings to the network analyzer. Allows you to edit the name of saved states or delete saved states.
Get Data Uploads data from the network analyzer to the active worksheet in Excel. Also allows you to obtain repeated measurements.
Stop Repeated Measurements Stops gathering repeated measurement data from the network analyzer.
Get Screen Image Gets an image of the network analyzer's display and places it in the active worksheet or document.
Save S2P Data Gets SxP data from the network analyzer and saves it in an S1P, S2P, or S3P text file for use with device-simulation software packages. Toolbar Help Provides step-by-step explanations to help you learn to use the toolbar.
For the Programmer — A Powerful Automation Server
For more sophisticated programming, an ActiveX™ Automation Server is provided with IntuiLink software to make it easy to program your network analyzer using common programming environments such as Visual Basic®.
To help you become familiar with the structure and operation of the Automation Server, we have included a help file. To access this help file, navigate to:
Start | Programs | Agilent IntuiLink | VNA | Agilent IntuiLink VNA
Automation Help
See Also
Installation
Troubleshooting
Connect to Network Analyzer The IntuiLink software makes it easy to establish an interface connection between your network analyzer and your PC. Whether you are connecting to the network analyzer using an HP-IB (GPIB) port (RS-232 not supported for VNA) IntuiLink does the work for you.

3
Simply select an interface address, press the Identify Instrument(s) button and IntuiLink determines which instruments are connected to your PC. The Connect button establishes a connection to a selected instrument. When you are connected, the icon in the toolbar has a green background, as shown above. The box shows the connection status (in the figure below, Not Connected).
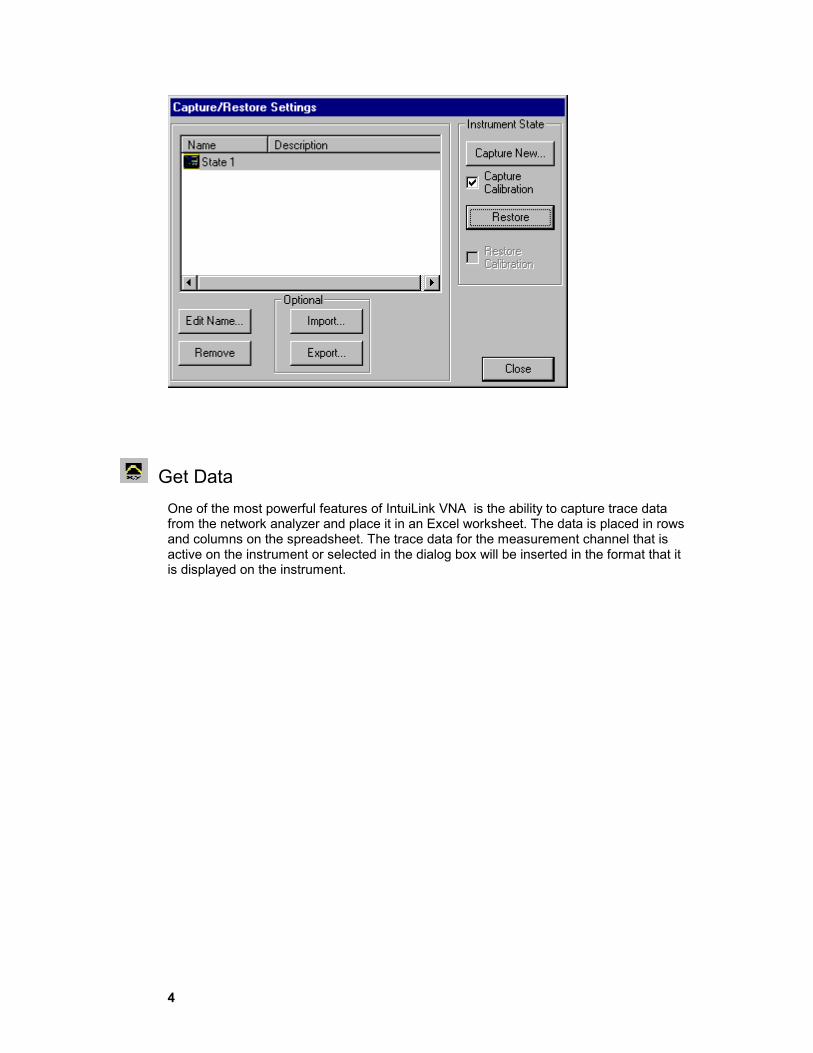
Capture/Restore Network Analyzer Settings IntuiLink VNA gives you the ability to store the current network analyzer settings, including the calibration settings, with the document or worksheet, or to a file on your PC. You can restore settings to the network analyzer from either the PC file or from the stored settings within the document or worksheet. The network analyzer settings saved to a PC file are stored in a binary format (.sta file extension).
4
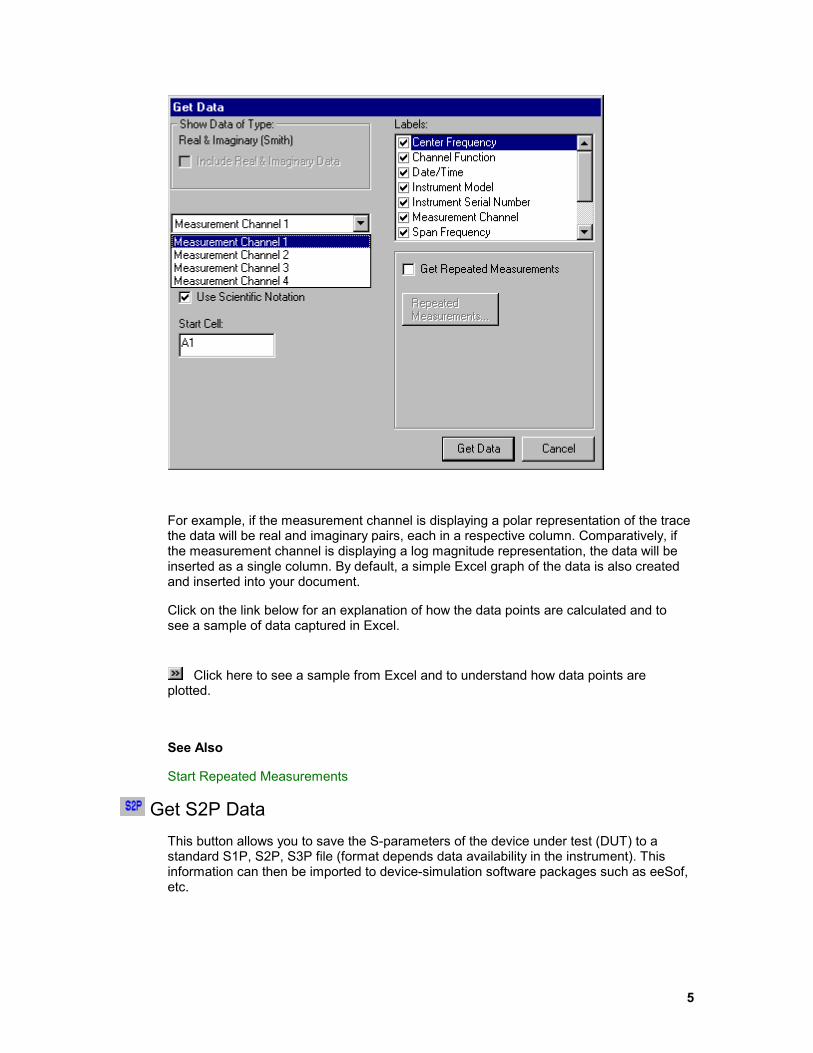
Get Data One of the most powerful features of IntuiLink VNA is the ability to capture trace data from the network analyzer and place it in an Excel worksheet. The data is placed in rows and columns on the spreadsheet. The trace data for the measurement channel that is active on the instrument or selected in the dialog box will be inserted in the format that it is displayed on the instrument.
5
For example, if the measurement channel is displaying a polar representation of the trace the data will be real and imaginary pairs, each in a respective column. Comparatively, if the measurement channel is displaying a log magnitude representation, the data will be inserted as a single column. By default, a simple Excel graph of the data is also created and inserted into your document.
Click on the link below for an explanation of how the data points are calculated and to see a sample of data captured in Excel.
Click here to see a sample from Excel and to understand how data points are plotted.
See Also
Start Repeated Measurements
Get S2P Data This button allows you to save the S-parameters of the device under test (DUT) to a standard S1P, S2P, S3P file (format depends data availability in the instrument). This information can then be imported to device-simulation software packages such as eeSof, etc.
6
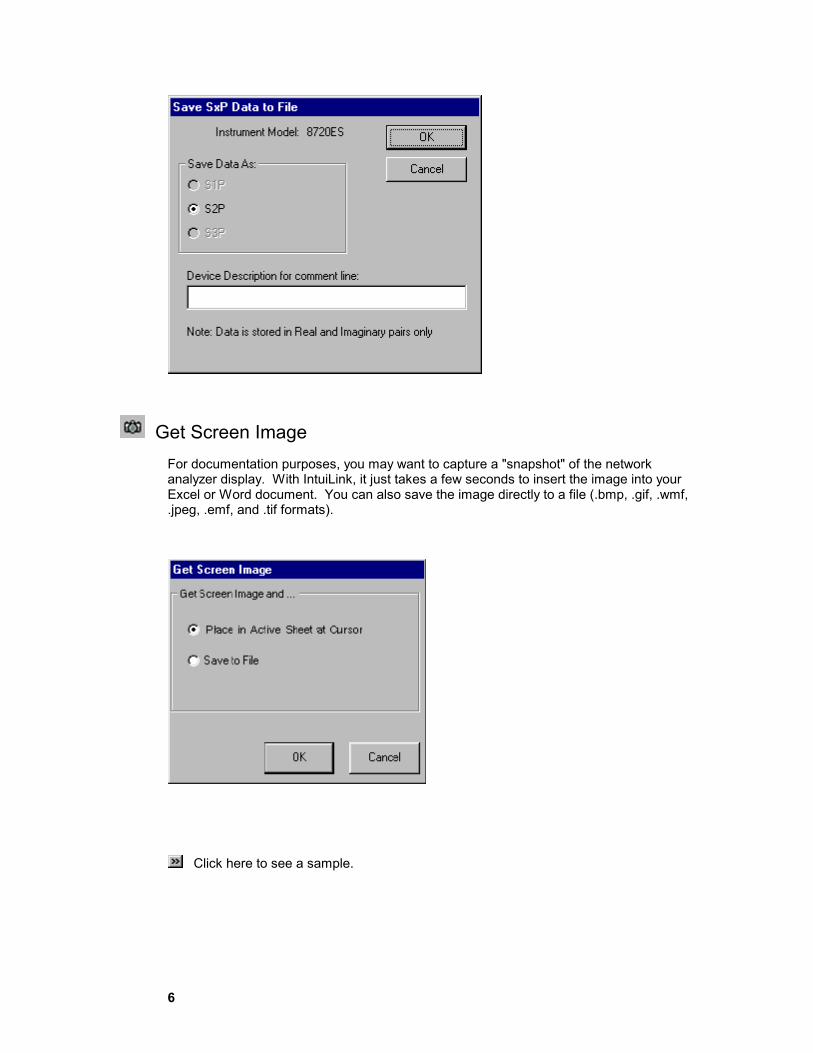
Get Screen Image For documentation purposes, you may want to capture a "snapshot" of the network analyzer display. With IntuiLink, it just takes a few seconds to insert the image into your Excel or Word document. You can also save the image directly to a file (.bmp, .gif, .wmf, .jpeg, .emf, and .tif formats).
Click here to see a sample.

7
Start Repeated Measurements The IntuiLink VNA Excel toolbar gives you the ability to capture measurement data from the network analyzer at intervals that you specify. You can specify a start time for data capture, and either the intervals or the number of times that you want data captured.
The tab on the worksheet displays a time stamp of when the data was captured. The status bar shows the progress of the repeated measurements.
See Also
Stop Repeated Measurements
Stop Repeated Measurements To stop gathering data, press this button. If this button is unavailable, then there are no repeated measurements being taken.
8
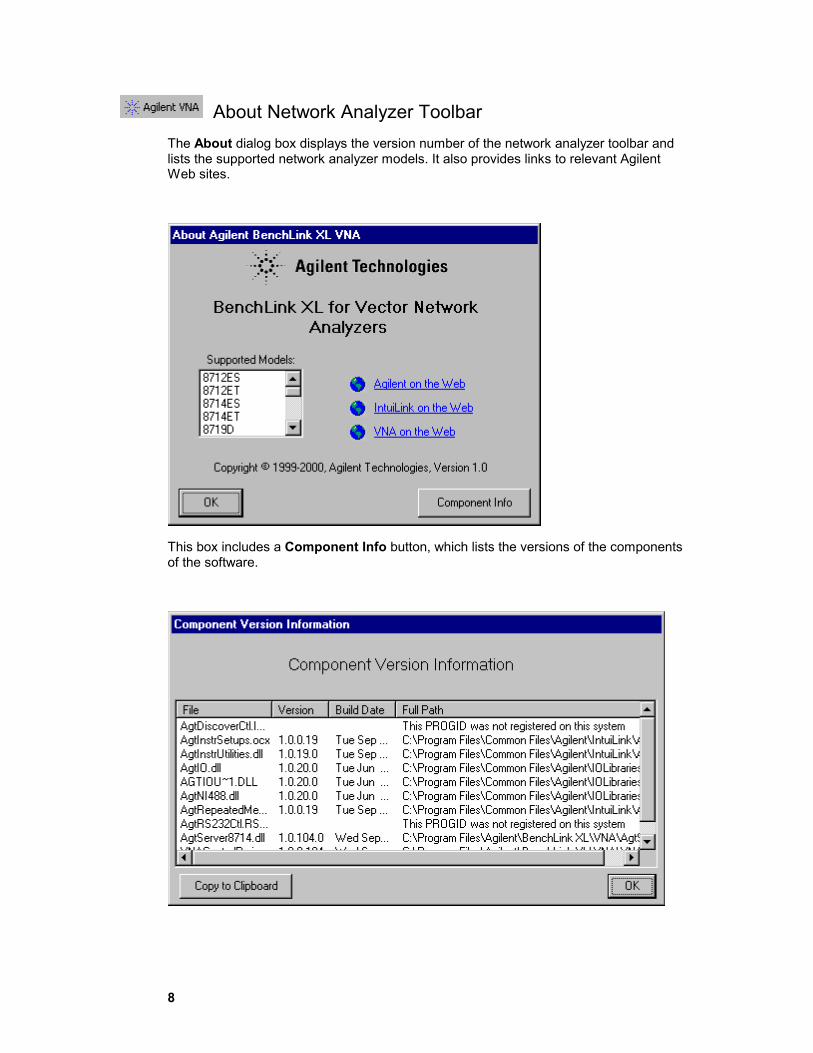
About Network Analyzer Toolbar The About dialog box displays the version number of the network analyzer toolbar and lists the supported network analyzer models. It also provides links to relevant Agilent Web sites.
This box includes a Component Info button, which lists the versions of the components of the software.
9
Toolbar Help Like most PC applications, a help system is included with the IntuiLink software to assist you with the operation of the toolbar. Click on the help icon to view the help system.
Note
In Excel, you must dock the toolbar when displaying the help window. Otherwise, the toolbar may disappear.
Installation Minimum System Requirements
Operating System
Windows® 95, Windows® 98, Windows® 2000 or Windows NT® 4.0, Service Pack 4
Hardware
Pentium PC, 200 MHz or greater
32 MB RAM (64 MB recommended)
20 MB free disk space (40 MB recommended)
Environments Supported
Applications
Microsoft Office, Service Release 2 to support:
Microsoft Excel 97
Microsoft Word 97
Microsoft Office 2000 to support:
Microsoft Excel 2000
Microsoft Word 2000
Software Development
Visual Basic 6.0
HP VEE 5.0 or greater
10
Installing IntuiLink Software You can install the IntuiLink software from the CD-ROM included with your network analyzer's interface module or you can download the software from the Agilent Web site (accessible from the About box). Software updates and future releases will also be available from this web site.
For more information on using the IntuiLink server with Visual Basic, refer to the help file included with the server. You need to have an Agilent or National Instruments GP-IB card installed on your PC.
See Also
Minimum System Requirements
Supported Instruments
Supported Instruments Network Analyzer Models Supported
Model 8712ES/ET
Model 8714ES/ET
Model 8719D/ES/ET
Model 8720D/ES/ET
Model 8722D/ES/ET
Model 8753D/E/ES/ET
Complimentary Start-Up Assistance Terms and Conditions
Agilent Technologies will provide Start-Up Assistance at no charge to resolve questions relating to the installation, operation, and use of this software product. Start-Up Assistance is available to help you install the software on your PC, establish communication with a compatible instrument, and answer questions relating to the functionality of the software components provided by Agilent Technologies. Start-Up Assistance does not support requests to modify or enhance the functionality of the software. For services not covered by Start-Up Assistance, you may be referred to fee-based services for advanced assistance.
Agilent Technologies will make reasonable efforts to respond to each customer request for Start-Up Assistance within two working days, but is under no obligation to respond within a prescribed time frame. Requests for Start-Up Assistance are handled in the order in which they were received. Agilent Technologies will make reasonable efforts to solve customer problems, but cannot guarantee success.
11
Agilent Technologies reserves the right to terminate Start-Up Assistance at any time without notice.
Contacting Agilent Technologies for Technical Support To find the address and phone number of your nearest support representative, visit the Agilent Web site accessible from the About box, and follow the links to support.
Troubleshooting Troubleshooting
Following are some potential problems that you could encounter when using IntuiLink.
Click on an item below for information about that topic.
Instrument Address is Not Listed
Can't Connect/Lost Connection to the Network Analyzer
Problems with Captured Data/Screen Image
Toolbar Disappeared/Does Not Function
Enabling DCOM Server Interface in Windows NT 4.0 and Windows 2000
The IntuiLink software is designed to provide easy access to the instrument through a layered design. Included in this design is the use of Component Object Model (COM) interfaces between layers. Some of these interfaces can be made accessible from a remote machine via Distributed COM (DCOM). DCOM is a technology that is supported on all Windows platforms beginning with the service releases of Windows 95. Full implementation of DCOM is really only available on the Windows NT and Windows 2000 platforms due to the lack of security features in Windows 95/98. Because of this, the server portion of IntuiLink VNA can provide remote access only when running on the Windows NT/2000 platforms, while the client portion can be run on Windows 95, 98, NT 4.0, and 2000.
Each LAN is unique and has unique security requirements, thus you must determine and perform the security configuration of the DCOM interface used by the server portion of IntuiLink. Administrative privileges are required to perform these steps. Contact your system or network administrator before making any changes. The following steps are provided as a guideline for doing the configuration:
1. Launch DCOMCnfg by using Start|Run. In the Open: box, type DCOMCnfg and click OK.
2. In the Distributed COM Configuration Properties (DCOMCnfg) dialog box, select the Agilent IO Manager and click Properties.
3. Select the Security tab and select the Use custom access permissions radio button
4. Click Edit.
12
5. Click Add to add a user or group of users to whom you will grant access to the I/O configuration on that machine. You can also select individuals or groups of users to deny access to. Make sure that you have an entry for the "SYSTEM" user. Add it if necessary.
6. Click OK when all of the user permissions for access have been configured.
7. Select the Use custom launch permissions radio button, and then click Edit.
8. Select the users to whom you would like to grant or deny the ability to launch the I/O Manager server. Typically you should allow at least the people that have access permissions. Do not remove launch permissions for "INTERACTIVE", "SYSTEM", or "<hostname>\Administrators".
9. Click OK when finished to return to the Agilent IO Manager Properties dialog box.
10. Click OK to return to the Distributed COM Configuration Properties dialog box.
11. If you will be programming applications that use the Agilent IntuiLink EZ COM interface, repeat the steps above for the Agilent EZ listed in the DCOMCnfg dialog box.
Connecting to Remote DCOM Servers
To connect the IntuiLink VNA toolbar to a remote server you must specify which server to use. The following are the necessary steps to establish the connection:
1. Make sure that the server has been configured using the guidelines described above.
2. On the client machine, start Microsoft Word or Excel, and click Connect on the IntuiLink toolbar.
3. In the Connect dialog box, click Advanced. The Advanced dialog box appears
4. In the Hosts field, type in the name or IP address of the remote server.
5. Click OK to return to the Connect dialog box. The list of instruments available for connection will now be the instruments connected to the remote server. You may select any of these for identification and, if appropriate, connection.
Note: Only the Agilent IO Manager DCOM interface configuration is required to enable the Microsoft Word and Excel toolbar add-ins to access remote servers.
Instrument Address is Not Listed If the instrument address that you want to connect to is not listed in the Select Instrument Address list in the Connect box, check the following:
• Did you choose to connect to a network analyzer on your computer or on a remote computer? Look at the label above the Identify Instruments button. It will list either "My Computer" or the name or IP address of a remote host. If it does not show the host that you want to connect to, press the Advanced button. Then follow the instructions in Connect to a network analyzer on a remote host.

13
• If you are listing addresses for the desired computer (either My Computer or a remote computer), you need to verify that the instrument is present at the specified address on that computer. Use the Configure I/O tool, which is part of the HP I_O Libraries, to configure or verify the I/O address. Once you have configured the address, close the Connect box, then re-open it and try again.
• If you are using both the Agilent (HP) I/O Libraries and the National Instruments (NI) I/O drivers (specifically if you are using the HP I/O Libraries for creating a LAN client and the NI drivers for a local NI GPIB card) there may be conflicts when trying to identify instruments. Each set of libraries/drivers will assign GPIB addresses independently. For example, an Agilent LAN client may be set up on GPIB0 in the Agilent (HP) I/O Libraries, but the NI driver has set up the local NI GPIB card as GPIB0. When the IntuiLink software is started and an attempt to identify the instrument located at GPIB0 is made, the software will not recognize any instrument. To remedy this situation, manually change the GPIB address(es) in either the HP I/O Libraries or the NI driver so that none are the same.
To do this in the HP I/O Libraries:
1. Open the HP I/O Libraries Control and choose Run I/O Config (or open the HP I_O Libraries menu item from the Start menu and choose I_O Config).
2. In the I/O Config dialog, highlight the conflicting address in the Configured Interfaces section, then click the Edit button.
3. In the Edit dialog box, find the VISA Interface Name and, using the up/down arrows, change the address number for the interface.
4. After a satisfactory number has been chosen, click OK to close the Edit dialog. You should see the new GPIB address in the Configured Interfaces section. If not, return to step 2 and chose another setting.
5. Click OK to close the I/O Config dialog.
IntuiLink VNA should now be able to correctly identify the instrument connected at the non-conflicting GPIB address.
Can't Connect/Lost Connection to the Network Analyzer There are three categories of problems relating to connections to the network analyzer. Click on the topic below that most closely resembles the problem you are experiencing.
Connection problems to a local instrument
14
Connection problems to a remote instrument
Connection was dropped
Problems with Captured Data/Screen Image
Data is Not What You Expected
If the measurement data that you captured from the network analyzer is not what you expected, check the following:
• Are the settings on the instrument control panel set to capture the kind of data that you want? Reset the display on the network analyzer and try again.
• Are you connected to the network analyzer from which you want to collect data? To verify, press the Connect icon on the toolbar. In the Connect dialog box, look in the Identified Instruments list for the network analyzer with the Connect icon next to it.
• Because of Excel limitations, Smith charts cannot be accurately represented, as the background reticule cannot be plotted. If you want the background reticule, use the Get Screen Image feature.
• In Excel, charts with no data points less that 0,0, always start at 0,0 regardless of the actual starting data point. If you want the chart to accurately represent the network analyzer screen, use the Get Screen Image feature.
Screen Image is Not What You Expected
If the screen image that you captured from the network analyzer is not what you expected, check the following:
• Are the settings on the instrument control panel set to display the kind of data that you want? Reset the network analyzer and try again.
• Are you connected to the network analyzer from which you want to collect data? To verify, press the Connect icon on the toolbar. In the Connect dialog box, look in the Identified Instruments list for the network analyzer with the Connect icon next to it.

15
Toolbar Disappeared or Does Not Function Following are some reasons that the IntuiLink toolbar might disappear or not function as expected.
• If you do not have the toolbar docked while working in Excel, and you open the online help, the toolbar may disappear. This behavior is particular to Excel. You should dock the toolbar if you want it to be visible while using the online help.
• If you clicked the X in the upper right corner of the toolbar, the toolbar will close in the same way that a dialog box will close. To re-open the toolbar, go to the View menu in the application, select Toolbars, and put a checkmark next to the toolbar.
• You might have unloaded the toolbar for this instance of your application. If so, go to the Tools menu, select Add-Ins (Excel) or Templates and Add-Ins (Word) and place a checkmark next to the VNA item.
• In Excel, when you double-click in a cell for editing, or when your cursor is in the formula bar, the toolbar and the Excel Tools menu are disabled. This behavior is particular to Excel and occurs with different Add-in products. There is no work-around to this problem.
• Microsoft Windows 95 systems, and other systems with power management features, may encounter problems when an instrument is connected and the computer switches to the power-save mode. When the computer is re-activated, the instrument connection may be lost or corrupted, resulting in a loss of the toolbar functionality. In this case, you must close the Excel worksheet or the Word document, restart the application, and reconnect to the instrument using the toolbar. To avoid this problem, turn off the power management features when using the toolbar.
How Data is Plotted in Excel By default, the data that is transferred from the network analyzer is plotted using basic plotting mechanisms available in Excel. These simple plots provide a quick check to verify that the data that was transferred to the spreadsheet represents what is displayed on the instrument screen. Complex graticules, such as the Smith Chart, are not available in Excel, but the shape of the plot will approximate the one displayed on the instrument.

16
When collecting repeated measurements, each new measurement collection is displayed in a new Excel worksheet. The worksheet is named the same as the time of the measurements, and a time stamp is placed on the tab for the worksheet. Note that the timestamp is based on the time at the PC, not the time at the network analyzer (if there is a difference). There is a limit of 500 worksheets per workbook. In Excel 97, the limit is 62 worksheets per workbook.
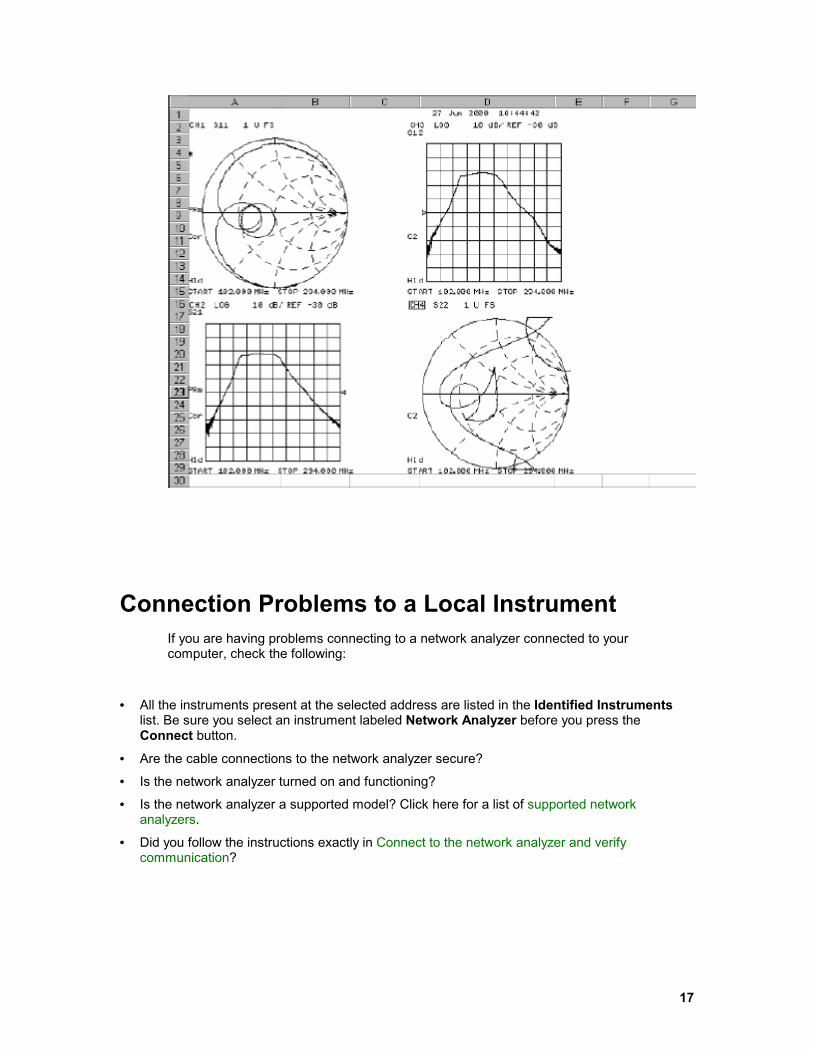
Because of limitations in Excel graphs, if you want a true picture of the network analyzer data, use the Get Screen Image feature of IntuiLink.
Screen Image Captured from Network Analyzer You can insert an image of the network analyzer screen into an Excel worksheet or a Word document.
17
Connection Problems to a Local Instrument If you are having problems connecting to a network analyzer connected to your computer, check the following:
• All the instruments present at the selected address are listed in the Identified Instruments list. Be sure you select an instrument labeled Network Analyzer before you press the Connect button.
• Are the cable connections to the network analyzer secure?
• Is the network analyzer turned on and functioning?
• Is the network analyzer a supported model? Click here for a list of supported network analyzers.
• Did you follow the instructions exactly in Connect to the network analyzer and verify communication?
18
Connection Problems to a Remote Instrument If you are trying to connect to an instrument on a remote host, check the following in addition to Connection Problems to a Local Instrument:
• Do you have communication with the remote host? Try PINGing the remote host and see if you get a response.
• Do you have permission to connect to the remote host? If you are not sure or need to be given permission, see your system administrator.
• Is the IntuiLink software installed on the remote host? It must be installed to connect via the software.
• Is another instance of IntuiLink VNA already connected to the address on the remote host?
• If you entered a name in the Remote Host field in the Advanced dialog box, try entering the IP address instead.
• Is there a problem with the LAN or any of its switches? Contact your network administrator to find out.
• If the remote host uses DCOM, see the section Enabling DCOM Server Interface in Windows NT 4.0 and Windows 2000.
Connection was Dropped If you have lost the connection to the network analyzer:
• The IntuiLink VNA connection to a network analyzer is through the workbook where you made the initial connection. If you open a new workbook, you must establish a connection from the new workbook to the network analyzer.
• Microsoft Windows 95 systems and other systems with power management features may encounter problems when an instrument is connected and the computer switches to the power-save mode. When the computer is re-activated, the instrument connection may be lost or corrupted, resulting in a loss of the IntuiLink toolbar functionality. In this case, you must close the Excel worksheet or the Word document, restart the application, and reconnect to the instrument using the toolbar. To avoid this problem, turn off the power management features when using the IntuiLink toolbar.

19