using the fine structure constant to push on the...
TRANSCRIPT

Lecture 5: Using the Fine Structure Constantto Push on the Standard Model
The 64th Compton Lecture Series
Unsolved Mysteries of the Universe:Looking for Clues in Surprising Places
THE ENRICO FERMI INSTITUTE
Brian Odom
http://kicp.uchicago.edu/~odom/compton.htm

Oct. 21, 2006 Brian Odom Compton Lecture 5
The Fine Structure Constant2e
cα =
2P
1S
2P
1S
Hydrogen Energy Levels
Predicted Emission Spectrum
If there were no fine structure
With fine structure
10.2 eV (121.6 nm)10.2 eV (121.6 nm)
4.5 x 10⁻⁵ eV

Oct. 21, 2006 Brian Odom Compton Lecture 5
Coupling Constants
The fine structure constant quantifies the strength of the coupling of light to matter, or the strength of electromagnetism.
We will talk only aboutthe low-energy limit
Oct. 21, 2006 Brian Odom Compton Lecture 5
What is its Value?
“It has been a mystery ever since it was discovered more than fifty years ago, and all good theoretical physicists put this number up on their wall and worry about it.”
- Richard Feynman
It is “one of the greatest damn mysteries of physics: a magic number that comes to us with no understanding by man."
- Richard Feynman
Despite many attempts, α remains one of the free parameters of the standard model. We cannot predict it; we must measure it.

Oct. 21, 2006 Brian Odom Compton Lecture 5
What is its Value?
1137
α ≈
…but not quite
1 137α − ≈or
1 137.035 999 710 (96)α − ≈Gabrielse, Hanneke, Kinoshita, Nio, and Odom, Phys Rev Lett 97, 030802 (2006)

Oct. 21, 2006 Brian Odom Compton Lecture 5
A Good Thing that it is Small1 1
137α ≈
1st order:
This allows us to use perturbation theory for calculations
2nd order:
3rd order:
+ +
+ …

Oct. 21, 2006 Brian Odom Compton Lecture 5
Old Quasar Light…Is it Really Constant?
Murphy, et. al. Mon. Not. R. Astron Soc. 345 (2003)
( figure from Chris Churchill )

Oct. 21, 2006 Brian Odom Compton Lecture 5
Old Quasar Light…Is it Really Constant?
figure from Chris Churchill
Srianand, et al. Phys. Rev. Lett.. 92, 12 (2004)
… systematics errors can be tricky

Oct. 21, 2006 Brian Odom Compton Lecture 5
Is it Really Constant?
α αΔzexperiment α α≈ (yr -1)
< 6 x 10-17< 6 x 10-70.4 – 2.3QSO absorp., Srianand et. al.64 (14) x 10-17
< 20 x 10-17< 0.5 x 10⁻¹⁷< 200 x 10-17
54 (12) x 10-70.5 – 3.5QSO absorp., Murphy et. al.
< 8 x 10-70.45Meteorite Re/Os abundance< 0.1 x 10-70.14Oklo nuclear phenomenon< 6 x 10-150Lab atomic transitions (Yb/Cs)
< 6 x 10-17< 6 x 10-70.4 – 2.3QSO absorp., Srianand et. al.64 (14) x 10-17
< 20 x 10-17< 0.5 x 10⁻¹⁷< 200 x 10-17
54 (12) x 10-70.5 – 3.5QSO absorp., Murphy et. al.
< 8 x 10-70.45Meteorite Re/Os abundance< 0.1 x 10-70.14Oklo nuclear phenomenon< 6 x 10-150Lab atomic transitions (Yb/Cs)
So far, there is no evidence that α varies with time. But, it does vary in some theories. …We keep looking.
(…but I heard yesterday that the lab results have improved substantially)
An interesting note: these experiments have fantastic sensitvity to variations of α, but they are not the best ways to measure its actual value

Oct. 21, 2006 Brian Odom Compton Lecture 5
Electron Magnetic Moment
If the electron is a point particle (has no size), the Standard Model allows precise prediction of the magnetic moment, provided we know α
0th order:
1st order: + …
Oct. 21, 2006 Brian Odom Compton Lecture 5
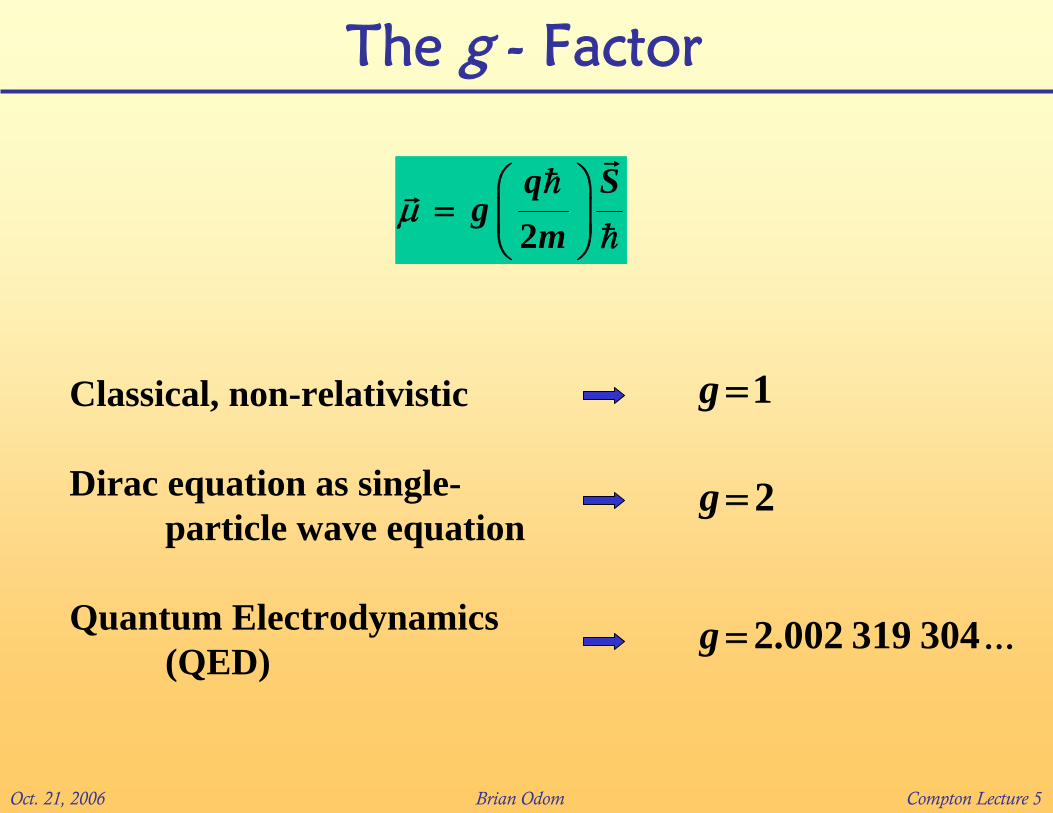
The g - Factor
Classical, non-relativistic
Dirac equation as single-particle wave equation
Quantum Electrodynamics (QED)
2.002 319 304g = ...
2g =
1g =
2q S
gm
μ⎛ ⎞
= ⎜ ⎟⎝ ⎠

Oct. 21, 2006 Brian Odom Compton Lecture 5
Why Measure the g - Factor?
• Determination of α, using QED calculations
• Precision test of QED
• Probe for electron sub-structure
• Precision test of Lorentz, CPT symmetry
• Complement to the muon g – factor measurement
(which is a great search for new particles)
• Prospects for improved proton to electron mass
ratio

Oct. 21, 2006 Brian Odom Compton Lecture 5
Does the Electron Have Size?
So far we have no reason to believe it has size… but we keep looking.

Oct. 21, 2006 Brian Odom Compton Lecture 5
Testing Quantum Electrodynamics
α-1137.03599 137.03600 137.03601
Δα / α (ppb)-100-50050100
muonium h.f. structure
electron g, UW 1987
quantum Hall effect
ac Josephson effect & γp,h
h / mn
h / mCs, optical trans- itions, mass ratios
electron g, Harvard 2006
h / mRb, mass ratios

Oct. 21, 2006 Brian Odom Compton Lecture 5
Different Levers for New Physics
α αΔzexperiment α α≈ (yr -1)
< 6 x 10-17< 6 x 10-70.4 – 2.3QSO absorp., Srianand et. al.64 (14) x 10-17
< 20 x 10-17< 0.5 x 10⁻¹⁷< 200 x 10-17
54 (12) x 10-70.5 – 3.5QSO absorp., Murphy et. al.
< 8 x 10-70.45Meteorite Re/Os abundance< 0.1 x 10-70.14Oklo nuclear phenomenon< 6 x 10-150Lab atomic transitions (Yb/Cs)
< 6 x 10-17< 6 x 10-70.4 – 2.3QSO absorp., Srianand et. al.64 (14) x 10-17
< 20 x 10-17< 0.5 x 10⁻¹⁷< 200 x 10-17
54 (12) x 10-70.5 – 3.5QSO absorp., Murphy et. al.
< 8 x 10-70.45Meteorite Re/Os abundance< 0.1 x 10-70.14Oklo nuclear phenomenon< 6 x 10-150Lab atomic transitions (Yb/Cs)
Some people use high precision over short times. Some people use enormous times and less precision.
(…but I heard yesterday that the lab results have improved substantially)

Oct. 21, 2006 Brian Odom Compton Lecture 5
Different Levers for New Physics
Higher energy means shorter wavelength—and the ability to look for even smaller structure
… or we can do precision measurements, like measurement of the g - factor

Oct. 21, 2006 Brian Odom Compton Lecture 5
g from the Standard Model2 3 4
1 2 3 41 ...2g C C C C non QEDα α α α
π π π π⎛ ⎞ ⎛ ⎞ ⎛ ⎞ ⎛ ⎞= + + + + + + −⎜ ⎟ ⎜ ⎟ ⎜ ⎟ ⎜ ⎟⎝ ⎠ ⎝ ⎠ ⎝ ⎠ ⎝ ⎠

Oct. 21, 2006 Brian Odom Compton Lecture 5
An Electron in a Penning Trap
B Field E Field magnetronmotion
axialmotion
cyclotronmotion
0.02 Hz7.2 K149.0 GHzcyclotron
10-17 Hz6.4 μK130 kHzmagnetron
10-12 Hz7.2 K149.2 GHzspin
1 Hz9.6 mK200 MHzaxial
dampinghυ/kbfrequencymotion

Oct. 21, 2006 Brian Odom Compton Lecture 5
Do a Frequency Measurement!
( )( ) ( )
2 1a z c 2
21 1c z c2 2
2=1
2 2g ω ω ω δ
ω δ ω ω δ− +
++ + +
s
c2g ω
ω=
g in free space:
g-2 in free space:
a
c
21 12 2g g ω
ω−= + = +
g-2 in a Penning trap:
[ Brown and Gabrielse. Rev. Mod. Phys. 58, 1 (1986) ](3 orders of magnitude for free)
2q S
gm
μ⎛ ⎞
= ⎜ ⎟⎝ ⎠
Definition:

Oct. 21, 2006 Brian Odom Compton Lecture 5
Cylindrical Penning Trap Construction

Oct. 21, 2006 Brian Odom Compton Lecture 5
Dilution Refrigerator and Magnet
10'1"
x10

Oct. 21, 2006 Brian Odom Compton Lecture 5
The Lab

Oct. 21, 2006 Brian Odom Compton Lecture 5
A tabletop experiment …if you have a high ceiling

Oct. 21, 2006 Brian Odom Compton Lecture 5
Detection of a Single Electron•The axial oscillator is coupled to a tuned-circuit amplifier
Signal Out
−20 −10 0 10 20
0.0
0.4
ampl
itude
(a. u
.)
−20 −10 0 10 20−0.5
0.0
0.5
frequency − νz (Hz)
•Axial motion is driven to increase signal

Oct. 21, 2006 Brian Odom Compton Lecture 5
Single Quantum Jumps
decay time (s)0 10 20 30 40 50 60
num
ber o
f n=1
to n
=0 d
ecay
s
0
10
20
30
time (s)0 100 200 300
axia
l fre
quen
cy s
hift
(Hz)
-3
0
3
6
9
12
15τ = 16 s
•In free space, cyclotron lifetime = 0.08 s
•In our cylindrical traps, we have
achieved a 16 s lifetime
[ Peil and Gabrielse. Phys. Rev. Lett. 83, 1287 (1999) ]

Oct. 21, 2006 Brian Odom Compton Lecture 5
Benefits of Cooling Down
Relativistic Corrections
•Eliminates relativistic errorfrom ωc uncertainty
Thermal Jumps4.2 K
012
3.2 K
012
2.0 K
012
1.6 K
012
.08 K
time (minutes)0 5 10 15 20 25 30 35 40 45 50
cycl
otro
n qu
antu
m n
umbe
r
012
[ Peil and Gabrielse. Phys. Rev. Lett. 83, 1287 (1999) ]
•Reducing thermal jumps permits single-quantum cyclotron spectroscopy

Oct. 21, 2006 Brian Odom Compton Lecture 5
T-Dependent Magnetism…BAD
An unpleasant surprise:
•We observed a huge shift of B-field vs. trap temperature
•Heat load changes are unavoidable as:
•Amplifier cycles on/off
•Anomaly drive is applied
•10 ppb / mK is far too much!
tem
pera
ture
(mK
)
707580859095
100105
time (hours)0 2 4 6 8 10
B fi
eld
shift
(ppb
)
-300-250-200-150-100
-500
Shift of -10 ppb / mK at 75 mK !!!

Oct. 21, 2006 Brian Odom Compton Lecture 5
It’s the Trap!
temperature (Kelvin)
0.0 0.5 1.0 1.5 2.0
mag
netic
fiel
d sh
ift (p
pb)
-100
0
100
200
300
400
500
600
700
temperature-1 (Kelvin-1)
0 5 10 15-100
0
100
200
300
400
500
600
700
•Nuclear paramagnetism makes standard Penning trap materials (copper, MACOR) incompatible with a stable B-field below 1 K

Oct. 21, 2006 Brian Odom Compton Lecture 5
New Silver Trap

Oct. 21, 2006 Brian Odom Compton Lecture 5
Prototype Silver Tripod

Oct. 21, 2006 Brian Odom Compton Lecture 5
Silver Trap Improvement
temperature (Kelvin)
0.0 0.5 1.0 1.5 2.0
mag
netic
fiel
d sh
ift (p
pb)
-100
0
100
200
300
400
500
600
700
copper trapsilver trap
temperature-1 (Kelvin-1)
0 5 10 15-100
0
100
200
300
400
500
600
700
copper trapsilver trap
0.0 0.5 1.0 1.5 2.0
expa
nded
200
x
-10
0
10
20
30
•New silver trap decreases T-dependence of the field by ~ 400•With the silver trap, sub-ppb field stability is easily achieved

Oct. 21, 2006 Brian Odom Compton Lecture 5
More Benefits of Cooling Down
frequency - 146 832 090.270 kHz-0.5 0.0 0.5 1.0 1.5
quan
tum
jum
p fr
actio
n
0.00
0.05
0.10
0.15
0.20
2 ppb
frequency - 146 832 090.270 kHz-4 -2 0 2 4 6 8
quan
tum
jum
p fr
actio
n
0.00
0.05
0.10
0.15
0.20
10 ppb
Harvard cyclotron line
[ Van Dyck et al., QED, Kinoshita, ed. 1990]
101500150B2 (T/m2)
200
0.6
Harvard
0.09
0.1
60υz (MHz)
6Tz (K)
U. Wash. H
UW
ΔΔ
H
UW0.09Δ
Δ =

Oct. 21, 2006 Brian Odom Compton Lecture 5
Scatter of Measurements
uWave power (a.u.)0 20 40 60 80
176
178
180
182
184
186
UW 1991
uWave power (a.u.)0 20 40 60 80
176
178
180
182
184
186
Harvard 2006UW 1987

Oct. 21, 2006 Brian Odom Compton Lecture 5
Cavity Shift Systematic
• Parametric response of large e- cloud maps cavity mode structure
• Modes coupling to centered single e- cloud are easily identified[ Tan and Gabrielse. App. Phys. Lett. 55, 2144 (1989) ]
TE1n1TM1n1

Oct. 21, 2006 Brian Odom Compton Lecture 5
Lifetime Shifts
Q = 6500E
Q = 1400M
• Perform single e- experiments between TE127 and TM143
• Cyclotron lifetime data shows qualitatively correct behavior
• Fixing mode ω s and fitting for Qs gives reasonable results

Oct. 21, 2006 Brian Odom Compton Lecture 5
Apparent g – Factor Shift

Oct. 21, 2006 Brian Odom Compton Lecture 5
And the Number is …Harvard g-factor measurement:• Fully quantum measurement eliminates relativistic shift
( 1 ppt per quantum level )
• Low temperature allows quantum spectroscopy and narrows lines
• Cylindrical trap allows first quantitative treatment of cavity shift
g / 2 = 1.001 159 652 180 85 (76)(0.76 ppt)
α = 137.035 999 710 (90) (32)137.035 999 710 (96)
(0.70 ppb)
-1
Results :

Oct. 21, 2006 Brian Odom Compton Lecture 5
New Value for α