using surface geopolymerisation reactions to strengthen
TRANSCRIPT

Using Surface Geopolymerisation Reactions to Strengthen Athabasca Oil
Sands Mature Fine Tailings
by
Saeed El Khair Nusri
A thesis submitted in partial fulfillment of the requirements for the degree of
Master of Science
in
Chemical Engineering
Department of Chemical and Materials Engineering
University of Alberta
© Saeed El Khair Nusri, 2015

ii
Abstract
Bitumen extraction from oil sands operation in Fort McMurray, Canada produces an
immense quantity of slurry waste that is discharged to tailings ponds. These ponds now stretch
over a region which is roughly 1.5 times the area occupied by Vancouver city mainly due to slow
consolidation process of the mature fine tailings (MFT). The MFT comprises of a mixture of
water and fine solids that is characteristically known for very low shear strength. While the
current research on tailings consolidation has been focused on removing water from the settled
tailings sludge, there is presently no known technology to effectively consolidate tailings and
strengthen it for land reclamation.
This dissertation describes a novel method to address the oil sands tailings reclamation
problems using surface geopolymerisation reactions. Geopolymerisation involves dissolution of
aluminosilicates and re-solidification reactions that result in the formation of three dimensional
inorganic polymers, which have significant strengths. Since the fine solids in oil sands mature
fine tailings (MFT) mainly consist of aluminosilicate minerals (clays), it is hypothesized that by
adding appropriate reagents, the surfaces of the clay minerals can be activated to go through
geopolymerisation reactions. The resulting geopolymers formed on the surfaces of the clay
minerals bind the clay particles together and strengthen the tailings even without further
dewatering and consolidation.
Characterizations conducted on kaolinite samples, which was chosen as model solids for
MFT, showed that under the test conditions the geopolymerisation reactions only occurred on the
surface of the kaolinite mineral. The “surface geopolymers” held the kaolinite particles together
leading to an increase in shear strength.

iii
The results also indicate that shear strength of MFT is considerably increased on addition
of NaOH and Na2SiO3, or alkali activators, at the optimum dosage. When a 51 wt% solids
centrifuged MFT was treated with 1 mole/L sodium hydroxide and 0.5 moles/L sodium silicate,
it was found that the shear strength increased from 115 Pa to 4,880 Pa after 90 days. At the same
activator concentrations, the original un-centrifuged MFT (37.9 wt% solids) saw an increase of
its shear strength from 19 Pa to 1,245 Pa. Similarly, the shear strength of a 48 wt% solids MFT
sample flocculated by adding 1000 g/t of A3335 polymer flocculant increased from 395 Pa to
3,950 Pa 90 days after the addition of the same concentration of alkali activators. Addition of
A3335 polymer flocculant to the MFT is observed to hamper the surface geopolymerisation
process leading to a lower than expected increase in shear strength. However, low capillary
suction time is seen when coupling flocculation with surface geopolymerisation, indicating that
the treated MFT is amenable for water release.

iv
v
Acknowledgement
To begin with, my deepest gratitude goes to my supervisor, Dr. Qi Liu, for his invaluable
guidance and support throughout the course of my research. I would also like to thank my co-
supervisor, Dr. Phillip Choi, who always had his office doors open for immediate assistance and
advice.
In addition, Dr. Xiaoli Tan has been most instrumental in guiding me through the
technicalities of my research. His amicable personality and his readiness to engage in a variety of
new experimental ventures made my research experience a truly memorable one. I genuinely
thank him for his advice, guidance, and help.
In addition, I am downright grateful to Mirjavad Geramain, who took out time from his
busy schedule to assist me in the sample preparation and analysis of quantitative XRD
characterization. I am also thankful to the lab technicians, Jeremiah Bryksa and Lisa Brandt, for
providing me with the necessary training and instruments to successfully run my experiments.
I would also like to acknowledge the financial support from Canada’s Oil Sands
Innovation Alliance (COSIA), and the Institute for Oil Sands Innovation (IOSI). The provision
of mature fine tailings from Syncrude Canada Limited from its Fort McMurray operations is
acknowledged too.
I am also very grateful to all my fellow graduate students. Their companionship made
graduate school a fun and a stimulating place to be. However, I express my special gratitude to
Sarang Gumfekar for his camaraderie and his integral support in providing me with valuable
insights to my research and thesis.

vi
Finally, I thank Mubaraka Husain, whose friendship, love and support helped me through
the course of my masters. And above all, I thank my doting parents, Umme Hani and Najmuddin
Nusri, and my sisters, Anne and Naamah. Their confidence in me has been paramount to all the
accomplishments in my life. To them, I dedicate this thesis.

vii
Table of Contents
Chapter 1 - Introduction .................................................................................................................. 1
1.1 General statement ............................................................................................................. 1
1.2 Objective and scope of Thesis .......................................................................................... 2
1.3 Organization of thesis....................................................................................................... 3
Chapter 2 - Literature Review ......................................................................................................... 5
2.1 Canadian oil sands ............................................................................................................ 5
2.2 Surface mined oil sands extraction................................................................................... 9
2.3 Tailings ponds and mature fine tailings ......................................................................... 13
2.4 Regulatory requirements ................................................................................................ 14
2.5 Present tailings treatment technologies .......................................................................... 16
2.5.1 Physical or mechanical processes ........................................................................... 16
2.5.2 Chemical treatment (thickened tailings) ................................................................. 18
2.5.3 Natural process (freeze and thaw)........................................................................... 18
2.5.4 Mixtures/co-disposal (composite tailings process) ................................................. 19
2.5.5 Permanent storage (water capping) ......................................................................... 20
2.6 Geopolymerisation ......................................................................................................... 21
2.6.1 Introduction to geopolymerisation .......................................................................... 21
2.6.2 Aluminosilicates and geopolymers ......................................................................... 22
2.6.3 Chemistry involved ................................................................................................. 24
2.7 Aluminosilicate minerals in MFT .................................................................................. 27
2.8 Geopolymerisation in oil sands tailings ......................................................................... 31
Chapter 3 - Materials and Experimental Methods ........................................................................ 34
3.1 Materials ......................................................................................................................... 34

viii
3.1.1 Kaolinite .................................................................................................................. 34
3.1.2 Mature fine tailings (MFT) ..................................................................................... 35
3.1.3 Chemicals ................................................................................................................ 36
3.2 Methods .......................................................................................................................... 37
3.2.1 Sample preparation ................................................................................................. 37
3.3 Characterization techniques ........................................................................................... 42
3.3.1 Shear strength measurements .................................................................................. 42
3.3.2 Fourier Transform Infrared spectrometry (FTIR) ................................................... 47
3.3.3 Particle size distribution by laser diffraction .......................................................... 48
3.3.4 ICP-OES ................................................................................................................. 48
3.3.5 Powder XRD & quantitative XRD ......................................................................... 48
3.3.6 TEM/EDX/SAED ................................................................................................... 49
3.3.7 Moisture analyzer.................................................................................................... 50
3.3.8 Dean stark analysis ................................................................................................. 51
3.3.9 Capillary suction time ............................................................................................. 52
Chapter 4 - Results and Discussion .............................................................................................. 53
4.1 Kaolinite ......................................................................................................................... 53
4.1.1 Shear strength measurement ................................................................................... 53
4.1.2 Characterization results ........................................................................................... 56
4.1.3 The Anomaly of B-1-3 ............................................................................................ 63
4.2 Mature fine tailings ........................................................................................................ 69
4.2.1 Preliminary test series ............................................................................................. 69
4.2.2 Shear strength of different MFT at optimum ratio.................................................. 73
4.2.3 Hypothesis behind increase in shear strength ......................................................... 74
4.2.4 Differences in shear strength .................................................................................. 77

ix
4.2.5 Dewaterability ......................................................................................................... 79
Chapter 5 - Conclusions ................................................................................................................ 80
Chapter 6 - Scope of Further Study .............................................................................................. 82
Bibliography ................................................................................................................................. 84
Appendix A ................................................................................................................................... 93
Appendix B - Preliminary Compressive Strength Measurements Using Penetrometer ............... 96
Appendix C- Photos from the Study ........................................................................................... 102

x
List of Figures
Figure 1: Areas in Northern Alberta with oil sands deposits (AER, 2014) .....................................5
Figure 2 : A representative illustration of Athabasca oil sands (Takamura, 1982) .........................7
Figure 3: Comparison of temperature dependent viscosity in centistokes (1cSt = 1cP) of dilbit
with light, medium-heavy and heavy conventional oil (Tsaprailis & Zhou, 2013) .......8
Figure 4: Generalized scheme for oil sands processing using CHWE bitumen extraction process
(Masliyah et al., 2004) .................................................................................................12
Figure 5: Typical oil sands tailings pond denoting different layers present in the pond
(Government of Alberta, 2009) ....................................................................................13
Figure 6: Ponds utilized by Syncrude over the last two decades to test water capping technology
(Syncrude, 2012) ..........................................................................................................20
Figure 7: Simple breakdown of geopolymerisation into three stages: Dissolution of Si-Al source
material, reorientation of silicate and aluminate precursors and solidication of the
final geopolymer network (Yao et al., 2009) ...............................................................26
Figure 8: Illustration of the layers present in kaolinite (Britannica, 2015) ....................................27
Figure 9: (a) TEM/SAED of Ward’s kaolin showing its crystallinity (b) XRD of Ward’s kaolin
matched with kaolin peaks from the ICDD® database in JADE™. ............................35
Figure 10: Sample set A-1 screw capped and labelled in polycarbonate containers. ....................38
Figure 11: Subsampling procedure of MFT in which MFT is mixed thoroughly using a
mechanical impeller mixer to remove lumps and produce a homogenous mixture. One
kilogram of MFT is then weighed into plastic containers similar to the one shown in
the image. .....................................................................................................................39
Figure 12: Schematic of shear strength measurement using vane tool (Burns et al., 2010) ..........42
Figure 13: Torque versus time plot which can be used to obtain shear strength of solid samples
(Burns et al., 2010).......................................................................................................43
Figure 14: Shear strength measurement setup using Malvern™ Lab+ rheometer .........................46
Figure 15: Illustration of Dean Stark Apparatus. (1) Toluene (2) Round-bottomed Flask (3)
Holder for Froth Thimble (4) Thermometer (5, 6, 7) Reflux Condenser (8, 9) Reflux
Collector (10) Receiver flask to collect water (Dean & Stark, 1920) ..........................51

xi
Figure 16: Shear strength of kaolinite with varying concentrations of Na2SiO3 and 1 mol/L of
NaOH. ..........................................................................................................................53
Figure 17: Shear strength of kaolinite with varying concentration of Na2SiO3 and NaOH. M is
the concentration multiplier with M = 1 at 1 mol/L NaOH and 0.33 mol/L Na2SiO3. 55
Figure 18: Change in shear strengths of kaolinite/water samples over a period of 90 days after
being treated with optimum molar ratio of Na2SiO3:NaOH of 0.5:1. The NaOH
dosage was 4 wt%. .......................................................................................................56
Figure 19: Change in supernatant ion concentration of sample A-1-6 with time of (a) Silicon &
Aluminum (b) Sodium .................................................................................................58
Figure 20: Reaction mechanism of kaolinite with NaOH (Cheng & Hazlinda, 2011) ..................59
Figure 21: FTIR spectra of kaolinite and sample A-1-6. The latter exhibits a peak typically
pronounced by sodium carbonate which denotes the presence of unreacted sodium
ions on the surface .......................................................................................................60
Figure 22: Quantitative XRD results of sample kaolinite and sample A-1-6. Results indicate a
decrease in the quantity of crystalline kaolinite in A-1-6. ...........................................61
Figure 23: Transmission electron microscopy, selective area electron diffraction and energy
dispersive X-ray of reacted and unreacted kaolinite at 200 kV accelerating voltage
with (a) amorphous aluminosilicate grains characteristic of geopolymer found on the
periphery of grain clusters in the reacted sample (b) characteristic hexagonal shaped
grains and high crystallinity observed in unreacted kaolinite structure. ......................62
Figure 24: XRD pattern of the sample B-1-3 solids (Green) and kaolinite (Red) generated from
JADE™. The two spectra have similar peaks denoting that B-1-3 solids are quite
similar to unreacted kaolinite. ......................................................................................65
Figure 25: (a) Surface response plot for the effects of pH and Na-silicate dosage on solubility of
(a) aluminum (b) Silicon from kaolin (time = 13 h, wt% solids = 35) (A. Zaman et al.,
2003) ............................................................................................................................68
Figure 27: Shear strength of centrifuged MFT (51 wt% solids) with varying concentration of
Na2SiO3 and NaOH. M is the concentration multiplier with M = 1 at 1 mol/L NaOH
and 0.33 mol/L Na2SiO3. .............................................................................................71
Figure 28: Change of shear strength of centrifuged MFT (51 wt% solids) with varying
concentrations of NaOH without the presence of Na2SiO3 .........................................72

xii
Figure 29: Shear strengths of MFT samples treated with optimum molar ratio of Na2SiO3: NaOH
of 0.5:1 .........................................................................................................................74
Figure 30: Graphic explanation of the surface geopolymerisation reaction processes upon the
addition of alkali activators. The surface geopolymerisation reactions led to the
gradual increase in the shear strength of the mature fine tailings. ...............................76
Figure 31: Effect of water to solid ratio on compressive strength at differing curing temperature
(Khale & Chaudhary, 2007) .........................................................................................77
Figure 32: The presence of polymer flocculant on the surface of the clay particles hinders the
alkali activators from reaching the clay mineral surface and initiating the
geopolymerisation reactions ........................................................................................78
Figure 33: TEM/SAED of kaolinite solids at 200 kV....................................................................94
Figure 34: FTIR analysis done on kaolin solids with peak assignments of vibrational modes for
kaolinite found in literature ..........................................................................................95
Figure 35: Field Penetrometer .......................................................................................................96
Figure 36: Compressive strength of Kaolin/water mixture in different silicate to hydroxide ratio
( Sample series A-1) measure over a period of five weeks ..........................................97
Figure 37: Compressive strength of centrifuged MFT (51 wt% solids) in different silicate to
hydroxide ratio (Sample series A -2) measured over a period of five weeks ..............98
Figure 38: Compressive strength of Kaolin/water mixture in increasing silicate and hydroxide
concentration at a fixed ratio (Sample series B-1) measured over a period of five
weeks. Samples B-1-1 and B-1-3 had negligible compressive strength and could not
be recorded ...................................................................................................................99
Figure 39: Compressive strength of centrifuged MFT (51 wt% solids) in increasing silicate and
hydroxide concentration at a fixed ratio (Sample series B-1) measured over a period
of five weeks ..............................................................................................................100
Figure 40: Compressive strength of centrifuged MFT (51 wt% solids) in different NaOH
concentrations (w/o Silicate) measured over a period of five week ..........................101
Figure 41: Field penetrometer set ................................................................................................102
Figure 42: Mastersizer 3000 used for laser particle size analysis ................................................102
Figure 43: Dean Stark extraction set up for determining bitumen, water and solids content ......103
Figure 44: CST apparatus from Triton Electronics......................................................................103

xiii
Figure 45: Heidolph™ Electronic Overhead Stirrer (RZR 2052 Control) ..................................104
Figure 46: Thermoscientic Nicolet 6700 Fourier Transform Infrared (FTIR) spectrometer .......104
Figure 47: Mettler Toledo HB43-S Halogen Moisture Analyzer ................................................105
Figure 48: Philips CM20 FEG TEM/STEM transmission electron microscope (IFW, 2015) ....105

xiv
List of Tables
Table 1: Initial volume In-place, established reserves and production highlights of crude bitumen
reserve at the end of 2013 (unit: million m3) (AER, 2014) ............................................. 6
Table 2: Silicates and aluminosilicates reported in the oils sands literature. Adopted from
Kaminsky (2009). .......................................................................................................... 30
Table 3: Mineralogical composition of mature fine tailings from Syncrude Canada Ltd.
determined by quantitative XRD ................................................................................... 36
Table 4: Kaolinite and centrifuged MFT sample concentration of alkali activators in test series
A-1, A-2, B-1, B-2 and C-1. .......................................................................................... 41
Table 5: Constraints for using vane tool using shear strength measurements .............................. 45
Table 6: Comparison of ionic concentration in a solution mixture of 1 mole/L NaOH and 0.5
mol/L Na2SiO3 with the supernatant of sample A-1-6 as measured by ICP-OES. ........ 57
Table 7: Particle size distribution of kaolinite and dried solids of sample B-1-3. The table shows
how the particle size distribution dropped for kaolinite sample after sonication. ......... 64
Table 8: Results of ICP-OES of the supernatant of sample B-1-3 compared to the amount of ions
initially present in the solution mixture contributed by added sodium silicate and
sodium hydroxide........................................................................................................... 66
Table 9: CST results of three types of MFT ................................................................................. 79
Table 10: Shear strengths of kaolinite and centrifuged MFT samples in test series A-1, A-2, B-1,
B-2 and C-1. ................................................................................................................... 93

1
Chapter 1
Introduction
1.1 General statement
Canadian oil sands deposits of northern Alberta consist of vast hydrocarbon deposits that
occupy an area of around 142,000 km2. While this amounts to 293.1×10
9 m
3 of bitumen in-place,
only 28.1×10⁹ m
3 of the crude bitumen have been deemed as economically recoverable based on
current unconventional oil production technology (AER, 2014). Currently, bitumen is extracted
through either in-situ method or open pit mining method.
In open pit mining method, the oil sands ores are mined and processed to extract bitumen
and remove sand, water, mineral particles and other materials. The extraction of bitumen from
oil sands through surface mining results in slurry tailings with high water content that are
pumped in large quantities to surface tailings ponds. The tailings are composed mainly of sands,
clays and other minor minerals, water, and unrecovered bitumen. Upon discharging to the
tailings ponds, the sand aggregates settle quickly, while the fine particle slurry, also called the
thin fine tailings (TFT), moves towards the center of the tailings ponds (BGC Engineering Inc.,
2010). After 2 to 3 years, the tailings gradually settle to the bottom of the tailings ponds from 8
percent solid content to 30 percent solid content to form the mature fine tailings (MFT). MFT is
characteristically known for its poor water release ability, poor consolidation, low permeability
and low shear strength.
It is because of this nature of the MFT that has ensued in the inevitable growth of the
tailings ponds across the Fort McMurray region where the oil sands operations are taking place,

2
such that now they cover a total area of more than 176 km2
(CAPP, 2015). This has caused
serious environmental concerns regarding their effects on public health, land use, water supply
and air quality. Subsequently, various regulations and requirements have been put in place. One
of the most significant regulations pertinent to this thesis research is the Alberta Energy
Regulators Directive 074 established in 2009 (Alberta Energy Regulator, 2009).
The main objectives of oil sands tailings management is to consolidate MFT such that its
load bearing surface is trafficable and the dedicated disposal areas (DDAS) are substantially
reduced. In order to determine the ideal technique for tailings management, it is imperative to
gauge the consolidation rates and shear strength of MFT before and after treatment. At the same
time, treatment time and expenses are two important factors that should be taken into
consideration during the evaluation process for the consolidation and strengthening techniques.
1.2 Objective and scope of Thesis
The purpose of the present study is to determine the feasibility of a novel method for
consolidating and strengthening MFT using geopolymerisation so that it meets the requirements
of Directive 074. Geopolymerisation has been used in past to treat copper mine tailings but the
concept is relatively new for Albertan oil sands tailings.
Hence, the first objective will be to determine if geopolymerisation would work on oil
sands tailings. This will require adding reagents, or alkali activators, that will initiate
geopolymerisation in MFT and recording the increase in strength. Once determined, the next step
would be to optimize the concentration of the activators so that an acceptable strength can be
achieved. This will ensure that the requirement of Directive 074 is met with the best economics.

3
Besides, in order to understand the strengthening mechanism, a simplified model system
for MFT will be chosen. Fundamental characterization will be carried out with the model system
to understand the behavior of the geopolymerised sample.
Finally, in order to simulate industrial scenarios, geopolymerisation will be carried out on
different types of MFT, with varying solid content and with or without polymer treatment, to
gauge the load bearing performance of the reacted MFT.
In order to achieve the objectives of this thesis, sodium hydroxide and sodium silicate are
determined as alkali activators. Also, kaolinite is chosen as a model solid to emulate MFT
because it is the most abundant aluminosilicate mineral found in MFT. Shear strength is
measured for both the model system and MFT samples. The shear strength measurements are
carried out using ASTM D2573 standard. Fourier transform infrared spectroscopy (FT-IR),
inductively coupled plasma spectrophotometer with optical emission spectroscopy (ICP-OES),
laser particle size distribution, quantitative X-ray diffraction (XRD), and transmission electron
microscopy with selective area electron diffraction and energy dispersive X-ray
(TEM/SAED/EDX) are used to examine and understand the behavior of the formed geopolymers
from kaolinite. Dewaterability of the treated MFT is also studied using capillary suction time
apparatus. Experimentation and most characterizations are carried at the Institute for Oil Sands
Innovation at the University of Alberta.
1.3 Organization of thesis
This thesis is divided into five chapters. While Chapter One gives an introduction to the
thesis, Chapter Two focuses on literature review. Eight sections are included in Chapter Two:
Section One discusses the Canadian oil sands resources; Section Two introduces currently used
4
oil sands extraction technologies; Section Three provides an introduction to tailings surface
ponds, MFT and their characteristics; Section Four discusses Alberta’s regulatory requirement
for tailings management; Section Five provides an overview of current challenges and
opportunities in tailings management; Section Six elaborates exclusively on geopolymerisation;
Section Seven mentions the aluminosilicate minerals present in oil sands tailings; and finally,
Section Eight briefs on how geopolymerisation can be applied to oil sands tailings.
Chapter 3 elaborates on the Materials and Experimental method. Section one states the
materials used and Section Two details on the experimental method. Subsequently, Section
Three explains the various analytical techniques used in strength measurement and
characterization.
Chapters 4 then discusses the results obtained from shear strength measurements of both
MFT and kaolinite, and expounds on the results of characterization of kaolinite. Also, Section 2
of this chapter further elaborates on the difference in shear strength measurement between
different types of MFT and briefly discusses their dewaterability.
Finally, conclusions and scope of further research have been discussed in Chapter 5 and
Chapter 6, respectively. Table of shear strength measurements, preliminary compressive
strength measurement data and other relevant photos from the study have been included in
Appendix B.

5
Chapter 2
Literature Review
2.1 Canadian oil sands
Oil sands resources of Canada comprises of a significant proportion of unconventional oil
reserves in the world, with deposits covering over an area of 142,000 km2
(NEB, 2004). These
reserves are spread over northern Alberta region and, based on their geology, geography and
bitumen content, are mainly located in three principal areas: Athabasca, Peace River and Cold
Lake.
Figure 1: Areas in Northern Alberta with oil sands deposits (AER, 2014)
Alberta Energy Regulator (AER) has estimated the total initial volume in place for oil
sands to be 293.1 billion cubic metres, from which 20.8 billion cubic metres can be surface
mined and the remaining 272.3 billion cubic metres are categorized as amendable to in situ

6
recovery methods. Deposits are classified as in situ or mineable based the thickness of the
overburden above the deposits (Masliyah et al., 2011). Oil sands operation first started in 1967
with the Great Canadian Oil Sands project. Today, it has become one of the biggest bitumen
extraction industries in the world with a myriad of companies directly or indirectly involved in
operations. It has been forecasted that the production would increase from 1.9 million barrels per
day (MBPD), as recorded in 2012, to 3.7 MPBD by 2020 (Chalaturnyk et al., 2002). Table 1
shows the amount of initial volume of bitumen in place, established reserves and production
change highlights of crude bitumen reserves at the end of 2013 (AER, 2014).
Table 1: Initial volume In-place, established reserves and production highlights of crude bitumen
reserve at the end of 2013 (unit: million m3) (AER, 2014)
Resource
type
Initial Volume
in Place
Initial Established
Reserves
Cumulative
Production
Remaining
Established Reserves
Annual
Production
Mineable 20,800 6,157 931 5,226 57
In situ 273,300 21,935 596 21,339 64
Total 293,000 28,092 1,527 26,565 121
Rich grade oil sands ores comprise of approximately 85 wt% solids, which include sands
and fine clays, and 8-14 wt% bitumen, with a small amount of water. The water in oil sands is
likely present either as clusters or as 10 nm thin film covering the sand particle (NEB, 2000;
Shaw et al., 1996; Takamura, 1982). Figure 2 illustrates a diagram of the Athabasca oil sands
structure.
The oil sands bitumen is trapped among the sand particles that are surrounded by a film
of water. This water film is stabilized by an electrical double layer between water-bitumen and
sand-water. However, the bond between water and bitumen is weaker compared to that between
sand and the water film, allowing the bitumen to be recovered by the use of water-based
extraction process (Shaw et al., 1996).

7
Figure 2 : A representative illustration of Athabasca oil sands (Takamura, 1982)
The quality of oil sands deposits are based on its bitumen content and can be classified
into three main categories (Ng et al., 2000):
Rich grade: 13-16 wt% bitumen
Medium grade: 10-12 wt% bitumen
Low grade: 7-9 wt% bitumen
Bitumen content lower than 7 wt% is not considered ore-grade as the production is not
considered to be economically viable.
The oil sands bitumen is very heavy and has a higher specific gravity than water, unlike
other types of oils (Chastko, 2004). The scale for density measurement for oil in the petroleum
industry is defined by ᵒAPI given by Equation (1) (ASTM-IP D1250, 1952):

8
°API = 145
specific gravity at 15.6℃− 131.5 =
1.415 ∗ 105
ρ(kg ∗ m−3)
(1)
Bitumen with high ᵒAPI is ideally desired. If it has high dynamic viscosity (> 100 cP) and
ᵒAPI lower than 22.3, it is considered to be heavy (Masliyah et al., 2011).
The Canadian bitumen is about 6 to 12 ᵒAPI and is highly viscous in nature. But its
viscosity drops immensely with temperature (Figure 3). The dynamic viscosity (μ) of bitumen is
about 106 cP at reservoir temperature making it practically immobile, but this also gives oil sands
enough strength to make it mineable. Also, to make bitumen easy to transport, bitumen is diluted
using natural gas condensates such as naphtha. The diluted bitumen is also referred to as dilbit.
Figure 3: Comparison of temperature dependent viscosity in centistokes (1cSt = specific gravity of
bitumen * cP) of dilbit with light, medium-heavy and heavy conventional oil (Tsaprailis & Zhou,
2013)

9
The Canadian Association of Petroleum Producers (CAPP), which represents member
companies responsible for producing about 90 per cent of Canada’s natural gas and crude oil,
claim that the blend made from bitumen and a diluent should have a density less than 800 kg/m3
to meet the pipeline viscosity and density specifications (CAPP, 2015). Figure 3 displays a graph
of dynamic viscosity of dilbit as a function of temperature and compares it to other conventional
crude oil (Tsaprailis & Zhou, 2013).
2.2 Surface mined oil sands extraction
Oil sands deposits having less than 75 meters of overburden are excavated by open pit
surface mining, and then bitumen is extracted using Clark Hot Water Extraction (Masliyah et al.,
2011). Once the deposit is designated for open pit mining, layers of muskeg and surface
vegetation are first removed. Then the overburden under the muskeg, consisting of rocks, sands
and clay, are removed to reveal the oil sands deposit underneath (NEB, 2000). The mined ores
are transported to massive double roll crushers using large transport trucks and power shovels,
where the ore is crushed to about 45 cm. A typical transport truck has the capability of carrying
as much as 400 tonnes of oil sands in a single trip. The crushed ore is then transferred to a
storage silo using capacity conveyor belts and later mixed with warm water (45°C to 55°C) at a
pH between 7 and 8.5 in rotary drum blenders. The resulting slurry is then hydrotransported to
the extraction facility. The concept of mixing the oil sands ore with water and caustic comes
from the Clark Hot Water Extraction (CHWE) process, developed by Karl Clark, who started
experimenting the process from the 1920s (Clark & Pasternack, 1932).

10
At the extraction facility, the conditioned ore mixture is then stored in large separation
vessels, called primary separation vessels (PSV), where the various components of oil sands ore
are separated. The heavier components along with any sediment such sands and rocks settle to
the bottom of the vessel while the bitumen, floats to the top. At the same time, a layer consisting
of a mixture of clay, sand, water and bitumen, called the middlings, sits in the middle of the
PSV. To quicken the separation process, air is sparged through the PSV, allowing bitumen
droplets to attach with the air bubbles and travel upwards. The separated bitumen sits at the top
of the PSV with the froth, which is skimmed off and treated further. The froth typically contains
60 vol% bitumen, 30 vol% water and 10 vol% solids. The bitumen froth is treated with solvents,
like naphtha or paraffin, to separate the bitumen from water and solids.
The coarse effluent and middlings from the separation cells are sent for tailings oil
recovery (TOR) where the residual oil trapped in the tailings are recovered before being directed
towards large containment areas called the tailings ponds. Tailings are also generated from the
froth treatment process, but has different composition and properties compared to the tailings
generated from the PSV. The froth treatment tailings are rich in titanium and zirconium minerals
and can be a potential source for these commodities (Liu et al., 2006). However, they comprise
of water, unrecovered solvent and fine solids and are also discharged to the tailings ponds.
Though oil sands extraction is a fairly effective process with bitumen recovery exceeding
90%, the efficiency of extraction is dependent on several factors including the water chemistry,
mineralogy of the ore, and bitumen chemistry (Kasperski, 2001). Figure 4 depicts a generalized
process flow sheet for the warm-water extraction process used in open pit mining.

11
The bitumen after froth treatment is then sent for upgrading where it is refined into high
quality synthetic crude. This is achieved by coking, desulphurization and hydrogen addition to
the tar-like viscous bitumen (Masliyah et al., 2011). The extraction process is very water-
intensive; for every barrel (0.16 m3) of oil produced, two tonnes of ore and 2.6 m
3 of water are
required. While approximately 2 m3 of water is eventually recovered as free recycled water, the
remaining water is trapped in the waste, or tailings, generated by the extraction process
(MacKinnon, 1989).

12
Figure 4: Generalized scheme for oil sands processing using CHWE bitumen extraction process (Masliyah et al., 2004)

13
2.3 Tailings ponds and mature fine tailings
As mentioned in the previous section, tailings, which are mixture of water, solids and
fugitive bitumen remaining after recovery process, are referred to as tailings are discharged from
the extraction plant to large containment areas referred to as tailings ponds.
The typical tailings pond is depicted in Figure 5. The coarse sands in the tailings are used
in construction of the dykes and beaches of tailings ponds since they deposit rapidly. On the
other hand, the fines and clays (<44 µm fraction) flow to the center of the pond as a relatively
dilute slurry of approximately 8 wt% solids (BGC Engineering Inc., 2010). It takes
approximately ten years for these fines to settle to about 30 wt% solids until no further
consolidation takes place (Carter, 2009). Once the tailings have reached this state they are
referred to as mature fine tailings (MFT). Such tailings have been found to remain stable for
several decades and are characteristically known for their poor water release ability, poor
consolidation, low permeability and low strength (Scott et al., 1985).
Figure 5: Typical oil sands tailings pond denoting different layers present in the pond (Government
of Alberta, 2009)

14
It has been estimated that to produce each barrel of bitumen, 1.5 barrels of tailings wastes
are generated, leading to an estimated 950,000 m3 of tailings produced daily (Flanagan & Grant,
2013; MacKinnon, 1989). Furthermore, the slow consolidating properties of the MFT causes the
accumulation of substantial volumes of fluid tailings. As of 2011, tailings ponds have displaced
almost 170 km2 of former boreal forest (WWF-Canada, 2010).
The mineralogy of MFT is an important attribute that helps to predict their behavior
under different conditions. MFT consist of sand, clays, amorphous oxides, and trace metals
(Mikula et al., 1996). The sand in MFT comprises 97.5-99% quartz, 0.5-0.9% of aluminum
hydroxide, and 1-0.9% of iron. Clay minerals found in MFT include kaolinite and illite, with
traces of smectites, chlorite, vermiculite, and mixed layer clays. The amounts and types of these
clay minerals in tailings ponds may vary considerably but kaolinite and illite are the ones
predominantly present. Some of the heavy metals detected in the oil sands tailings of Alberta
include Ti, Zr, Fe, V, Mg, Mn, Al, Pb, Zn, Nb, and Mo. (Mikula & Omotoso, 1996)
2.4 Regulatory requirements
The water in the tailings pond contains a myriad of pollutants which are acutely toxic to
the environment. Some of these pollutants include naphthenic acids, polycyclic aromatic
hydrocarbons, benzene and toluene as well as inorganic elements such as lead and arsenic (Allen,
2008). Furthermore, there have been serious concerns with the expanding size of the tailings
ponds which are increasingly making these areas uninhabitable (Ferguson et al., 2009). Hence,
remediating the tailings problems has become necessary. In 2009, the Alberta Energy Regulator
issued the Directive 074, mandating oil sands operators to reduce their tailings generated and
convert the fluid tailings into trafficable deposits suitable for reclamation of the landscape. In
brief, the directive states the following objectives (Alberta Energy Regulator, 2009) :

15
• To create trafficable landscape from the area occupied by the current ponds. The
landscape should have at least 5 kPa of undrained shear strength at the end of first year
and 10 kPa in 5 years
• To reduce and eventually eliminate the storage of tailings to facilitate progressive
reclamation of land occupied by tailings ponds
• To maximize the water recycling and decrease freshwater consumption
• To reduce contaminants from tailings operations and reduce the impact of the pollutants
on water storage areas
• To ensure that the liability is managed by oil sands operators
With Directive 074, the AER has a stringent supervision over all mining operations to
eliminate growth of tailings ponds.
This has led to the active development and implementation of new tailings treatment
technologies. Although many tailings treatment technologies have been studied, there has not
been a single technology to completely address the tailings problem. Recently, a comprehensive
report, the Oil Sands Tailings Technology Deployment Roadmap (TTDR), which listed more
than 500 technologies aimed to remediate the tailings problem, was presented to Alberta
Innovates Energy and Environment Solutions (AI-EES) by six leading industry consulting firms
(Sobkowicz, 2012). Out of the list, only few were deemed useful and even fewer have been
recently been implemented as pilot projects (BGC Engineering. July 2010). Also, to proactively
address the tailings problem, seven major oil sands operators, namely Total E&P Canada,
Imperial Oil, Shell Canada, Syncrude Canada, Teck Resources, Suncor Energy, Canadian
Natural Resources Limited, formed the Oil Sands Tailings Consortium (OSTC) in December
2010. The focus of OSTC is to work with universities, research institutions and consultant
16
companies to find innovative solutions for tailings issue (Sobkowicz, 2013). Moreover, another
alliance of 13 oil sands producers known as Canada’s Oil Sands Innovation Alliance (COSIA)
was formed in March 2012 to solve the issues of tailings, land reclamation, and greenhouse gases
(GHGs) emission. The original OSTC was merged into the Tailings Environmental Priority Area
of COSIA and it is now commonly referred to as COSIA Tailings EPA.
2.5 Present tailings treatment technologies
Over the years, various methods have been developed to reduce the impact of tailings and
tailings pond. While many of them have remained at the laboratory scale due to certain
limitations, some of them have been implemented and are currently being used to treat tailings.
These techniques are categorized into five different groups (BGC Engineering Inc., 2010):
1. Physical or mechanical processes
2. Chemical or biological amendments
3. Natural processes
4. Mixtures/co-disposal
5. Permanent storage
The following are a brief description of some of the prominent tailings treatment
technologies.
2.5.1 Physical or mechanical processes
2.5.1.1 Centrifuged Fine Tailings
This process uses centrifugation to separate the particles from liquid and involves two
steps of separation. Firstly, an industrial centrifuge is used along with flocculants to produce two

17
streams: very high water content slurry with 0.5 to 1 wt% slurry and a cake with up to 60 wt%
solids. The cake then undergoes further natural dewatering process, such as evaporation and
freeze/thaw (BGC Engineering Inc., 2010).
The results of the laboratory and bench scale tests have turned out to be promising.
Therefore, commercial-scale demonstration of the centrifuged fine tailings technology was
started by Syncrude in 2012 and full-scale commercial plant is anticipated to start operations in
2015 (Syncrude, 2012).
2.5.1.2 Filtration
Filtration is one of the simple solid-liquid separation technologies and can take place
using pressure or a vacuum. Filtration results in the generation of a filter cake with a
significantly high solid content. The hydraulic conductivity and permeability of the cake are
important variables that determine the quality and duration of the filtration. At the end of the
filtration process, the filter cakes are removed for disposal or reuse in a site (BGC Engineering
Inc., 2010).
The main challenge of this method is that the filter cake typically has extremely low
hydraulic conductivity. However, this issue can be resolved by the addition of coagulants or
flocculants. Also, filtration of tailings depends on the fine content of the tailings, with lesser
fines favoring better filtration. It has been estimated that the filtration of original tailings with
more than 4 wt% fine particles is industrially not practical (Xu et al., 2008).

18
Despite several tests and studies aimed to improve the filterability of tailings, filtration of
tailings method has never been carried out to maturation due to inefficiency of the designed
systems in dealing with large amounts of tailings (BGC Engineering Inc., 2010).
2.5.2 Chemical treatment (thickened tailings)
Another commonly used technology is the Thickened Tailings (TT) Technology, which is
also known as gel technology. In this method, chemical additives, called flocculants, are used to
flocculate the fine fractions in the tailings and release water that can immediately be reused in
the extraction process. TT technology takes very little time to increase the solids content of fine
fractions of the extraction process effluent to 30 wt%.
Flocculation is used to describe the process by which certain polymers can adsorb on
different particles simultaneously, causing it to aggregate as loosely-bound agglomerates called
floccules or flocs. Generally, flocs that are produced by polymers are strongly held together. On
a microscopic level, flocculation causes fine colloidal particles to agglomerate and settle down as
suspension (Xu & Hamza, 2003). However, this treatment still does not meet AER requirements
and further treatment is needed. Also, the high cost and large number of educated operators are
desirable. Another technical drawback is the accumulation of coarse materials at the thickeners
feed well which can dramatically affect the efficiency of the process with time (BGC
Engineering Inc., 2010).
2.5.3 Natural process (freeze and thaw)
Freeze-thaw dewatering is a natural process that occurs throughout Alberta’s summer and
winter cycles. Thin layers of MFT are frozen at low temperatures and on thawing the water
separates and drains from it. The first ice aggregates that form result in negative pressure and

19
produce a strong suction which drives the water from tailings towards the newly formed ice. This
occurs because of compaction of the solids within the ice network formed as water expands
before freezing. Simultaneously, the moving mass of water creates a network of path through
which the water drains while thawing (Proskin et al., 2010; Dawson et al., 1999; Johnson, 1993).
The freeze-thaw process is reported to result in low strength deposits of up to 14kPa in
one year, which opens up this technology for land reclamation purposes. The process, however,
is labor intensive and requires a large area to deposit the thin layers due to the long periods of
each freeze/thaw cycle.
2.5.4 Mixtures/co-disposal (composite tailings process)
In the composite tailings (CT) process, a coagulant, typically gypsum is added to a
mixture of coarse sand and fine tailings to form a mixture which rapidly dewaters into a dense
deposit. This process has been quite effective in treatment of MFT (Mikula & Omotoso, 2006).
A possible modification to the existing CT process is to add CO2 along with typical
coagulants to further enhance the consolidation of the tailings and, simultaneously, sequester
CO2 emissions. The enhancement of consolidation by CO2 is primarily due to the decrease in pH
resulting in a reduction of zeta potential of the fine clays (Mikula et al. , 2004).
Equation (2) shows the chemical reaction that takes place on addition of CO2 to tailings
mixed with gypsum (Chalaturnyk et al., 2002):
Ca(OH)2 + CO2 → CaCO3 + H2O (2)
CaCO3 would adsorb the ultrafine particles suspended in the liquid and precipitates.

20
Despite its efficiency, CT process has been reported to have a negative impact on the
quality of water released from the tailings. The added gypsum increases the amount of calcium
ions in the recycled water which is detrimental to bitumen recovery (BGC Engineering Inc.,
2010).
2.5.5 Permanent storage (water capping)
Water capping involves pumping fresh water over the deposits of fine tailings to form a
lake. The MFT is capped with a layer of water with a sufficient depth to prevent the layer from
mixing and allowing the formation of a self-sustaining lake ecosystem.
Figure 6: Ponds utilized by Syncrude over the last two decades to test water capping
technology (Syncrude, 2012)
Research has pointed out that these lakes have the capability to evolve into natural
ecosystems, and support healthy communities of aquatic plants, animals and fish (BGC
Engineering Inc., 2010). Figure 6 shows the image of water capped ponds developed by

21
Syncrude to test this technology. In 2012, demonstration of the water capping technology was
commissioned in the former West Mine area (Syncrude, 2012).
Studies done in laboratories and the field scale have pointed out water capping as an
efficient remediation method for addressing the issue of MFT. However, one of the
disadvantages include the emission of gas by biological activity that can result in mixing of fluid
tailings and overlying water (BGC Engineering Inc., 2010).
2.6 Geopolymerisation
Having been studied for only around three decades, the concept of geopolymerisation is a
relatively new topic. Since this thesis focuses on assessing the feasibility of geopolymerisation in
MFT, it is important to provide an introduction to geopolymers and aluminosilicate minerals,
discuss the relation between the two and point out their significance to treating mature fine
tailings. The following sections give an introduction to geopolymerisation and the common
aluminosilicate minerals present in MFT. Also, the chemistry involved in geopolymerisation
reaction has been briefly discussed to help understand the work described in this thesis.
2.6.1 Introduction to geopolymerisation
Geopolymer, a term first coined in 1976 by Joseph Davidovits, is a kind of inorganic
polymer with AlO4 and SiO4 structurally linked in tetrahedral configuration (Davidovits, 1988).
These inorganic polymers show a high potential to substitute traditional cement in the near future
due to their excellent mechanical strength and fire, acid and bacterial resistance properties
(Davidovits, 1991, 1994). Besides, geopolymers can be produced from waste materials like fly
ash, furnace slag, construction waste and, more importantly, tailings. Because of this attribute,

22
manufacturing of geopolymer can be environmentally friendly because it can help with waste
management and, simultaneously, reduce greenhouse gas emission by cutting down the CO2
produced from the manufacture of Portland cement (Duxson et al., 2007). Because of these
advantages, geopolymerisation have been studied for past few years and the techniques of
manufacturing geopolymers have moved from using solely kaolinite and metakaolinite as source
material to any material containing silicon and aluminum. Naturally occurring aluminosilicate
minerals are the most abundant Al and Si sources existing in the world.
2.6.2 Aluminosilicates and geopolymers
Both silicon and aluminium are the most common elements existing on earth comprising
of more than three quarters of the continental crust (Dietrich & Skinner, 1979). Silicon has the
oxidation state +4 which means that each silicon atom is nearly always found bonded to four
oxygen atoms under normal conditions of temperature and pressure. Thus, a single unit of Si
found in silicates and aluminosilicates simply exists as SiO4. The tetrahedral units of Si have a
strong tendency to polymerise each other by eliminating one oxygen and sharing another one to
form silicate minerals.
Aluminium is a highly electropositive element and it occurs exclusively as Al3+
in
combination with oxygen atoms (Cox, 1995). As the covalent radii for silicon is smaller than
aluminium (1.17 Å and 1.26 Å, respectively), it is possible for Si atoms to be replaced by Al
atoms during polymerisation of SiO4 from the view point of the atomic size (Atkins, 2010).
However, the negative charge will increase; for instance the layer [Si2O5]2-
becomes [Si3AlO10]5-
when one in four silicon atoms is substituted by aluminium. In this case, other positive metal

23
ions are needed to balance the net charge, giving aluminosilicates an enormous variety of
formulae and structures.
Loewenstein has indicated (Lowenstein, 1954) that the substitution of silicon in three-
dimensional frameworks and plane networks of tetrahedral aluminosilicate oxide by aluminium
cannot exceed 50%. Hence, aluminosilicate minerals with tetrahedral framework and plane
network structured are always silicon rich minerals.
Silicon is always tetrahedrally structured as SiO4-, while aluminium can exist in
tetrahedral or octahedral configuration. For most of octahedral structured aluminosilicate
minerals, for instance, andalusite (Al2SiO5), and mullite (Al6Si2O13), there can be more Al than
Si atoms (Deer et al., 1992).
Aluminosilicate minerals are a large group of minerals that comprise Al and Si oxides,
but possess differences in chemical composition, crystal structure, density and hardness.
Basically, aluminosilicate minerals can be classified on the basis of their structural groups as:
ortho- and ring, chain, sheet and framework groups (Deer et al., 1992)
A first detailed introduction on geopolymerisation, geopolymeric products and their
properties and structures was presented by Davidovits based on his studies which covered
geopolymeric matrices, resins and composite materials (Davidovits, 1991). These geopolymeric
binders were aluminosilicates made up of poly-sialate (silicon-oxo-alumintae) network that
consists of SiO4 and AlO4 tetrahedra linked by sharing oxygen atoms. Positive ions such as Na+,
K+, Ba
2+, Ca
2+, H3O
+, NH4
+ are present in the framework to balance the negative charge of AlO4
-
with the representative empirical formula being:

24
M(−(SiO2)z − AlO2−)𝑛. wH2O (3)
z here can be either 1, 2 or 3, n is the degree of poly-condensation and M is the monovalent
cation such as K+ and Na
+ (Barbosa et al., 2000). Apart from poly-sialate (-Si-O-Al-O-), poly-
sialate-siloxo (-Si-O-Al-O-Si-O-) and poly-sialate-disiloxo (-Si-O-Al-O-Si-O-Si-O-) are also
possible structural units for geopolymers when the amount of silicate reactants increases in the
reaction system.
The development in the field of geopolymerisation and geopolymeric products over the
years has changed the meaning of terminology specified initially by Davidovits, which only
included geopolymeric binder. A geopolymeric binder is a specific kind of geopolymer which is
synthesised by complete transformation of metakaolinite (calcined kaolinite) from the solid
phase to gel phase. Such geopolymer has a certain stoichiometric composition like poly-sialate,
poly-(sialate-siloxo), or poly-(sialate-disiloxo) and possesses amorphous to semi-crystalline
structure.
Nevertheless, the meaning of geopolymer nowadays not only encompasses geolymeric
binders but also includes any mixtures comprising of geopolymeric gel and solid source Al and
Si materials (van Jaarsveld et al., 2000; Xu & Van Deventer, 2000). Equation (4) describes what
geopolymerisation means nowadays. Here, M is a monovalent cation.
Al − Si materials + nMOH +M2SiO3Mixing, setting & hardening⇒ Geopolymer or Geopolymeric Product (4)
2.6.3 Chemistry involved
Geopolymerisation involves reactions that forms tri-dimensional aluminosilicates by
naturally occurring aluminosilicates at low temperature and relatively short time (Khale &

25
Chaudhary, 2007; Silva et al., 2007; Xu & Van Deventer, 2002) . Geopolymeric products do not
have stoichiometric composition and comprise of a mixture of amorphous to semi-crystalline
structure Al-Si particles. In general, geopolymerisation reaction involved leaching, diffusing,
condensation and hardening steps. When aluminosilicate materials come in contact with alkaline
solution, leaching of both Al and Si starts. The extents of leaching for both Al and Si are
dependent on factors like concentration of the alkaline solution, alkali metal cation in alkaline
solution, stirring speed, leaching period as well as the structure and composition of source
materials (Davidovits, 1991, 1994). However, the properties of the source materials and the
concentration of alkaline solutions are believed to be dominant out of all these stated factors.
After being leached, Al and Si species diffuse into the gel phase, which reduces the
concentrations of Al and Si species on aluminosilicate surface resulting further leaching of Al
and Si. During the diffusion step, the time and intensity of stirring are dominant factors. Hence,
the removal of dissolved Al and Si complexes can be maximized by longer leaching period and a
more intense stirring. This helps to kinetically break the barrier between the Al-Si particle
surface and the gel phase so as to accelerate diffusion of Al and Si complexes.
Additional silicate (whether solid or liquid) is used to enhance geopolymerisation as it
makes Si complexes more amenable to polymerisation with aluminate. Since the activation
energy for forming an Al-O-Si linkage is lower than that of Si-O-Si linkage, polymerisation
between Al complexes and Si complexes is preferred over the polymerisation between Si
complexes (Barrer, 1982). Therefore, a simultaneous condensation between Al and Si complexes
occurs along with leaching and diffusion of Al and Si complexes from the source materials.
It is reported that temperature, pH and cations are three main factors affecting the
condensation stage during geopolymerisation. Higher temperature, higher pH (or higher

26
concentration of alkaline solution) and alkali metal cation with a larger atomic size favor the
condensation step and hence promote the geopolymerisation to a complete stage.
Finally, during the hardening of geopolymerisation, temperature and air circulation are
two main factors determining whether geopolymeric products have higher mechanical strength
or possess cracks. Another depiction of the geopolymerisation process has been illustrated by
Yao et al. (2009) as shown in Figure.7.
Figure 7: Simple breakdown of geopolymerisation into three stages: Dissolution of Si-Al source
material, reorientation of silicate and aluminate precursors and solidication of the final geopolymer
network (Yao et al., 2009)
Here, geopolymerisation process has been simplified into three main stages: dissolution,
reorientation and solidification.

27
2.7 Aluminosilicate minerals in MFT
The MFT contains a variety of alumninosilicate minerals as illustrated by Table 2.
However, out of all these aluminosilicates, clay minerals are most abundant source of Si and Al
present in MFT. The focus of this research is to induce geopolymerisation in MFT with clay
minerals as the Al and Si source for this process.
Clay minerals consists of repeating sheets of silicon bonded to oxygen in a tetrahedral
arrangement and aluminum bonded to oxygen and hydroxyl groups in an octahedral arrangement
as shown in Figure 8. The clay type depends not only on the chemical composition of its layers
but also on the ratio of octahedral to tetrahedral layers. Kaolinite, for instance, has a 1:1 ratio of
tetrahedral to octahedral layers, while illite and smectite clays have a 2:1 ratio. Clays with 2:1
ratios such as illite and smectite also have a layer of cations between each of the clay layers. The
layered structure of clays results in clay particles having flat, plate-like structure with distinct
edges and faces (basal planes) with differing surface properties (van Olphen, 1977).
Figure 8: Illustration of the layers present in kaolinite (Britannica, 2015)

28
Mixed-layer minerals, such as illite-smectite, are minerals where the interlayer or layer
type differs within the mineral (Srodon, 1999). When naming mixed layer minerals, the minerals
are named by the mineral types of the two components; the mineral with the smallest d-spacing
is named first (Srodon, 1999). The surface area and cation exchange capacities of these minerals
are similar to a mixture of the mixed layer minerals. However, other geotechnical properties are
very different from those predicted from a physical mixture of minerals, indicating that the
mixed-layer minerals do indeed form a unique structure.
Imperfection in the crystal lattice can result in silicon or aluminum atoms being replaced
by lower valence cations (Na+, K
+, Mg
+2 and Ca
+2) in a process called isomorphic substitution.
Due to the deficit in positive charges, the lower valence of the cation leads to a permanent
negative charge on the clay basal plane (Zbik & Smart, 1998). On the edges of clay, lattice
bonds are broken to form silanol and aluminol sites which react with water. This gives the clay
surface a pH dependent charge characteristic (Masliyah et al., 2011).
Since clay particles in water can have a different charge on their edges compared to their
faces depending on the pH of the suspension, under the right conditions it is possible for the
edges of clays to have a charge opposite to that of the clay faces. Under these conditions it can be
expected that clay edges and faces will attach to one another, forming a porous “house of cards”
structure which can result in the gelation of the suspension (van Olphen, 1977).
An important property of clays is the cation exchange capacity (CEC), whereby the
cations in the interlayer that balance the net charge on the clay mineral, due to isomorphic
substitution, are exchangeable. For example, clay minerals such as kaolinite have low CEC
because there is a low degree of ion adsorption corresponding to a lower degree of isomorphic

29
substitution. In illite, however, charge is balanced by potassium which fits perfectly between the
oxygen atoms that make up the base of a tetrahedron in the tetrahedral sheet (Mitchell & Soga,
2005). This excellent fit, coupled with the local charge created by tetrahedral substitution,
ensures that the potassium is tightly bound within the structure, giving illite a low CEC.

30
Table 2: Silicates and aluminosilicates reported in the oils sands literature. Adopted from
Kaminsky (2009).
Mineral
Group
Mineral Name Chemical Formula Reference
- Andalusite Al2SiO5 Hepler & Hsi (1989)
- Kyanite Al2SiO5 Hepler&Hsi(1989)
- Sillimanite Al2SiO5 Bichard(1987)
- Staurolite Fe2Al9Si4O22(OH)2 Bichard(1987)
Amphibole XY2Z5(Si, Al, Ti)8O22(OH,F)2 Bichard(1987)
Analcime Wairakite CaAl2Si2Si4O22(OH)4 Hepler&Hsi(1989)
Chloritoid Chloritoid Fe21.2Mg0.6Mn2+0.2Al14Si2O10(OH)4 Bichard(1987)
Clays
Kaolinite Al2(Si2O5)(OH)4 Mercier et al. (2008)
Illite K0.65Al2[Al0.65Si3.35O10](OH)2 Mercier et al. (2008)
Chlorite (Mg,Fe,Li)6AlSi3O10(OH)8 Omotoso et al. (2006)
Vermiculite Mg1.8Fe2+
0.9Al4.3SiO10(OH)2 Omotoso et al. (2006)
Montmorillonite (Na,Ca)0.33(Al,Mg)2(Si4O10)(OH)2 Omotoso et al. (2006)
Epidote
Clinozoisite Ca2Al3Si3O12(OH) Hepler&Hsi(1989)
Epidote Ca2(Al, Fe)3(SiO4)3(OH) Bichard(1987)
Zoisite Ca2Al3(SiO4)3(OH) Bichard(1987)
Feldspars
Albite NaAlSi3O5 Hepler&Hsi(1989)
Anorthite CaAl2Si2O8 Hepler&Hsi(1989)
Microcline KAlSi3O8 Hepler&Hsi(1989)
Feldspathoid Nepheline NaAlSiO4 Hepler&Hsi(1989)
Garnet (Ca,Fe,Mn,Mg)3(Al,Fe,Cr,Ti)2(SiO4)3 Bichard(1987)
Lawsonite Lawsonite CaAl2Si2O6(OH)4 Hepler&Hsi(1989)
Mica
Paragonite NaAl3Si3O5(OH)2 Hepler&Hsi(1989)
Biotite K(Mg,Fe)3(Al,Fe)Si3O10(F, OH)2 Hepler&Hsi(1989)
Glauconite (K,Na)(Al,Fe,Mg)2(Al,Si)4O10(OH)2 Bichard(1987)
Muscovite KAl3Si3O10(OH)2 Hepler&Hsi(1989)
Nepheline Kalsilite KAlSiO4 Hepler&Hsi(1989)
Pyrophyllite-
talc Talc Mg3Si4O10(OH)2 Hepler&Hsi(1989)
Pyroxenoid Wollastonite CaSiO3 Hepler&Hsi(1989)
Quartz Quartz SiO2 Hepler&Hsi(1989)
Titanite Titanite
(Sphene)
CaTiSiO5 Bichard(1987)
Zeolites
Analcime NaAlSi2O5(OH)2 Hepler&Hsi(1989)
Laumontite CaAl2Si4O8(OH)8 Bichard(1987)
Phillipsite KAlSi2O6.4H2O Hepler&Hsi(1989)
Zircon
Thorite ThSiO4 Alberta Chamber of
Resources(1996)
Zircon ZrSiO4 Bichard(1987)

31
However, for smectite clays there is a greater degree of substitution in the octahedral
layers which allows ions to be readily exchanged. Since cations are often hydrated by a layer of
water molecules, the high CEC of smectite clays causes significant amounts of water to enter
into the interlayer spaces causing the clays to swell (Brady & Krumhansl, 2001). Beside, due to
the increased ion concentration in the interlayer spaces, osmotic pressure causes more water to
enter the clay. These types of clays can absorb water and swell to double their original volume
(van Olphen, 1977). Such clays are known to have poor settling rates and poor sediment
consolidation, thus hindering remediation of tailings containing these types of clays (McFarlane
et al., 2008).
2.8 Geopolymerisation in oil sands tailings
The idea of employing geopolymerisation on oil sands tailings shows a lot of promise,
especially when compared to technologies like Composite Tailings (CT) and Thickened Tailings
(TT). Also, technologies like CT and TT have been in the industry for decades. Because of such
a prolonged presence, a lot of research efforts have already gone into improving these
technologies, leaving very little scope for further improvement (Mikula & Omotoso, 2006). Long
et al. (2006) demonstrated the importance of colloidal interaction in CT and TT but had, in fact,
not proposed any important optimization parameter that could improve these methods of oil
sands tailings treatment . They only elaborated on the importance of colloidal interactions in oil
sands tailings treatment.
It is important to point out that geopolymerisation achieves consolidation of tailing
through a totally different concept in comparison to TT and CT. CT and TT rely on aggregation
of particles, which are predominantly determined by intermolecular forces predicted by the

32
DLVO theory (Long et al., 2006). But in the case of geopolymerisation, an entirely new species
is formed by using the aluminosilicate sources inherently present in MFT.
So far the research on using geopolymerisation on tailings has been restricted to copper
mine tailings and reservoir sludge (Lee et al., 2014; Zhang et al., 2011; Phair & van Deventer,
2002; van Jaarsveld et al., 2000). Application of geopolymerisation concept on Athabasca oil
sands tailings has been reported in the open literature as patents (Canadian Patent No. 2873992.,
2014; US Patent No. 20130019780, 2013; Canadian Patent No. 2684155A1 , 2013). But their
approach is completely different from one proposed here. The idea here is to add the optimal
amount of alkali activators so that geopolymerisation in the clays present in MFT only
progresses to a small extent to prevent the formation of very high strength material similar to
concrete.
Hence, this study investigates the feasibility of ‘surface’ geopolymerisation of Athabasca
oil sands tailings sludge of three different categories: 40 wt% solids untreated mature fine
tailings, 50 wt% solids centrifuged MFT and 50 wt% solids polymer flocculated MFT. The
rationale behind this is to gauge how the water content and flocculant polymer affect the
geopolymerisation process. Since the Fort McMurray bitumen extraction operation uses large
amount of caustic soda for its operation, the following study has been limited to using sodium
hydroxide (NaOH) and sodium metasilicate (Na2SiO3) as alkali activators to produce the
intended geopolymer binder. Many studies cite the importance of M2O:SiO2 molar ratio (where
M is either Na or K) in the activation solution. Swaddle (2001) state that the M2O:SiO2 ratio
affects the degree of polymerization of the dissolved species and Provis and van Deventer (2007)
report that a variation in silica content can be used to optimize the rate of geopolymersation.
However, varying this ratio in the silicate solution is beyond the scope of this study. A simplistic

33
approach is used which involves varying monosilicate to NaOH ratio and the concentration of
these alkali activators to determine the optimal technique.
34
Chapter 3
Materials and Experimental Methods
In order to investigate geopolymerisation in MFT, kaolinite was chosen as a model solid
system. The methods used in characterisation include, FTIR, particle size distribution, ICP-OES,
powder XRD, TEM/EDX/SAED. Solid content in MFT was calculated after Dean Stark
extraction. The extracted solids were sent for quantitative XRD characterization to gauge the
mineral content in MFT. Dean stark analysis and moisture analyzer were used to measure the
solid content and moisture content, respectively, in different types of MFT. Also, shear strength
measurements of all the samples were carried out using ASTM D2573 standard. Preliminary
tests were also done using a field penetrometer to measure the compressibility of the reacted
samples. The explanation of the method used and the results of preliminary compressibility
measurements are included in Appendix B. Dewaterability of different types of MFT was
determined using capillary suction time apparatus.
This chapter provides a detailed discussion on materials, instruments and methodologies
used to carryout out and understand surface geopolymerisation in model kaolinite system and
mature fine tailings (MFT).
3.1 Materials
3.1.1 Kaolinite
In order to understand the mechanism of geopolymerisation in MFT, a simplified model
system is required. MFT is a mixture of various chemical species which makes it difficult to
study specific reaction pertaining to one chemical group, which in this case is aluminosilicates.
Because of its predominant presence as a clay mineral in MFT, kaolinite is deemed as the

35
appropriate model material to simplify this complex system of solid aluminosilicates present in
MFT (K. L. Kasperski & Mikula, 2011).
Kaolinite was obtained as kaolin from Ward’s Science (Twigg County, Georgia, USA)
and was used to emulate the solids in MFT. The kaolinite sample has a high purity and
crystallinity, as shown by XRD and TEM analyses in Figure 9.
Figure 9: (a) TEM/SAED of Ward’s kaolin showing its crystallinity (b) XRD of Ward’s kaolin
matched with kaolin peaks from the ICDD® database in JADE™.
3.1.2 Mature fine tailings (MFT)
MFT was obtained from Syncrude Canada Ltd. in its operations in Fort McMurray,
Alberta, Canada. The solid content of the MFT sample was measured to be 37.9 wt% using Dean
Stark analysis. Table 3 shows the mineralogical composition of the MFT sample determined by
quantitative XRD.
The MFT samples used for geopolymerisation reactions was either as is, after
centrifugation, or after flocculation by a 30% anionic polyacrylamide commercial flocculants

36
(A3335). First, the MFT sample was homogenized and sub-sampled into 1,500 gram batches
which were stored in polypropylene containers.
Table 3: Mineralogical composition of mature fine tailings from Syncrude Canada Ltd. determined
by quantitative XRD
Minerals Wt%
Non-Clays
K-feldspar 2.6
Quartz 27.4
Siderite 3.2
Clays Illite 30.7
Kaolinite 36.0
Centrifuged MFT samples were prepared by centrifugation of the subsampled MFT at
3000 G for 60 minutes using Avanti J-30 I centrifuge (Beckman Coulter, USA). The centrifuged
MFT was found to contain 51 wt% solids using Dean Stark analysis. The flocculated MFT
sample was obtained by treating the MFT with A3335 at a dosage of 1000 g/t. The treated MFT
was left to settle for 48 hours, and the released water was decanted. The final settled sludge was
found to contain 48 wt% solids.
3.1.3 Chemicals
Since the Fort McMurray extraction operation uses large amount of caustic soda for its
operation, the following study has been limited to using sodium hydroxide (NaOH) and sodium
silicate (Na2SiO3) as alkali activators to produce the intended geopolymer binders.
Sodium hydroxide (NaOH) and sodium silicate (Na2SiO3) are reagent grade chemicals (>
95% purity) purchased from Fisher Scientific. The reagents were dissolved in de-ionized water
into various concentrations and varying NaOH:Na2SiO3 ratios, and used for the surface

37
geopolymerisation of kaolinite. For the geopolymerisation reactions of MFT samples, the
reagents were added directly to the MFT samples as powders accompanied by vigorous
mechanical stirring. Analytical grade chemicals and distilled water were used throughout the
geopolymerisation and chemical analyses. A3335 is an anionic polyacrylamide macropolymer
obtained from SNF, with an average molecular weight of 17 x 106 g/mol.
3.2 Methods
3.2.1 Sample preparation
3.2.1.1 Kaolinite
As stated before, mild conditions are required to carry out this reaction because the
intention is to achieve geopolymerisation on the surface with shear strength much lower than that
of construction grade geopolymer. Two categories are classified. Category A-1 evaluates the
effect of varying NaOH:Na2SiO3 ratio on the shear strength and category B-1 assesses the
increase in the concentration of the alkali activators while the NaOH:NaSiO3 mass ratio is kept
constant. Details of the samples in each category have been presented in Table 4. Each kaolinite
sample was prepared by placing 100 g of kaolinite in 250 mL polycarbonate jars and adding 100
mL of solution mixture of NaOH and Na2SiO3 to the solids. The resulting slurry was mixed
using Heidolph™ Electronic Overhead Stirrer (RZR 2052 Control) with a stainless steel impeller
at 1000 rpm for 5 min to ensure the alkali activators properly mixed with the kaolinite.
Once the optimum ratio of the NaOH: Na2SiO3 was determined in category A-1, twelve
kaolin samples were prepared with the optimum concentration of the alkali activators using the
procedure mentioned above. Periodic shear strength measurements were carried out separately

38
on the samples over a span of 90 days. Each sample was discarded after the measurement
because shear strength measurement is a destructive measurement.
Figure 10: Sample set A-1 screw capped and labelled in polycarbonate containers.
3.2.1.2 Mature Fine Tailings
Similar investigation on MFT was carried out to determine the effect of changing NaOH
and Na2SiO3 ratio and the effect of increasing concentration of these activators. Hence, two
categories are set up: A-2 and B-2. An additional category, C-1, are also set up for MFT samples
to demonstrate the influence of the absence of sodium silicate. For consistency in solid to liquid
ratio with the kaolinite categories, 50 wt% centrifuged MFT is chosen for this preliminary study.
Table 4 displays all the preliminary samples that were prepared with MFT.
After the subsampled MFT were centrifuged, the samples were placed in 2 propylene
containers and thoroughly mixed to remove all lumps and produce a homogenous mixture. The
final moisture content was measured to be 47 wt%. Figure 11 depicts the subsampling process.
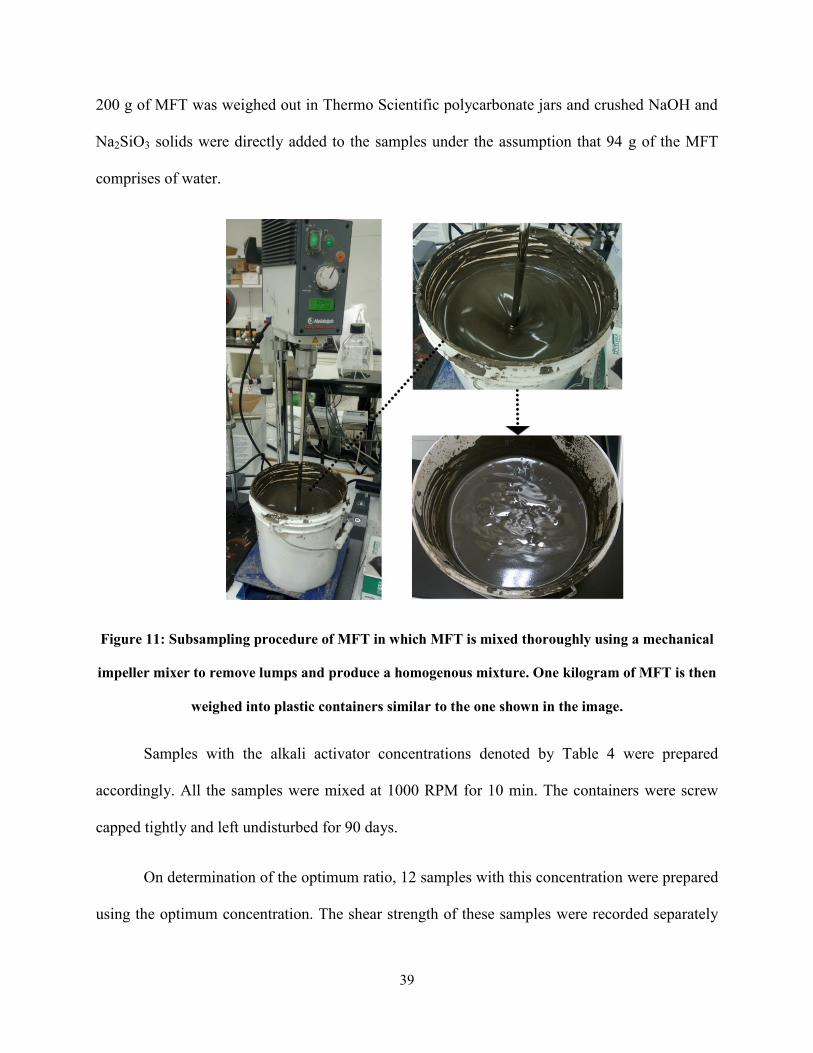
39
200 g of MFT was weighed out in Thermo Scientific polycarbonate jars and crushed NaOH and
Na2SiO3 solids were directly added to the samples under the assumption that 94 g of the MFT
comprises of water.
Figure 11: Subsampling procedure of MFT in which MFT is mixed thoroughly using a mechanical
impeller mixer to remove lumps and produce a homogenous mixture. One kilogram of MFT is then
weighed into plastic containers similar to the one shown in the image.
Samples with the alkali activator concentrations denoted by Table 4 were prepared
accordingly. All the samples were mixed at 1000 RPM for 10 min. The containers were screw
capped tightly and left undisturbed for 90 days.
On determination of the optimum ratio, 12 samples with this concentration were prepared
using the optimum concentration. The shear strength of these samples were recorded separately

40
at regular time intervals over a span of 90 days. Each sample was discarded after respective
measurements.
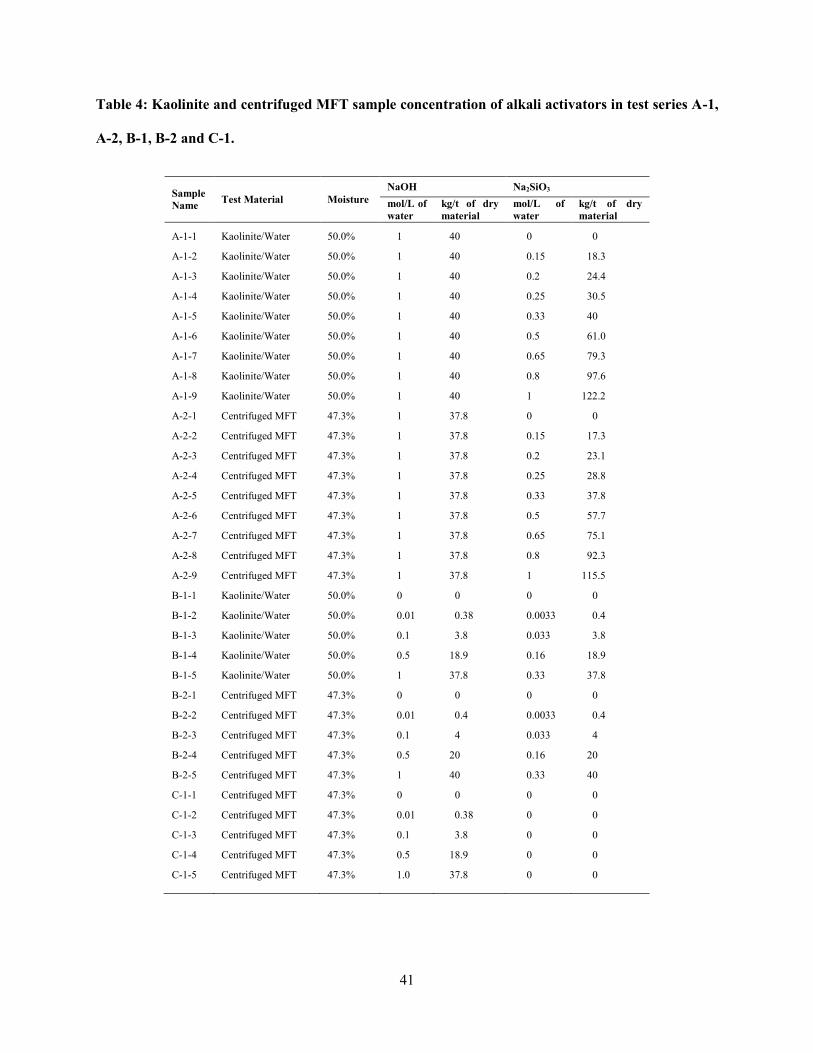
41
Table 4: Kaolinite and centrifuged MFT sample concentration of alkali activators in test series A-1,
A-2, B-1, B-2 and C-1.
Sample
Name Test Material Moisture
NaOH Na2SiO3
mol/L of
water
kg/t of dry
material
mol/L of
water
kg/t of dry
material
A-1-1 Kaolinite/Water 50.0% 1 40 0 0
A-1-2 Kaolinite/Water 50.0% 1 40 0.15 18.3
A-1-3 Kaolinite/Water 50.0% 1 40 0.2 24.4
A-1-4 Kaolinite/Water 50.0% 1 40 0.25 30.5
A-1-5 Kaolinite/Water 50.0% 1 40 0.33 40
A-1-6 Kaolinite/Water 50.0% 1 40 0.5 61.0
A-1-7 Kaolinite/Water 50.0% 1 40 0.65 79.3
A-1-8 Kaolinite/Water 50.0% 1 40 0.8 97.6
A-1-9 Kaolinite/Water 50.0% 1 40 1 122.2
A-2-1 Centrifuged MFT 47.3% 1 37.8 0 0
A-2-2 Centrifuged MFT 47.3% 1 37.8 0.15 17.3
A-2-3 Centrifuged MFT 47.3% 1 37.8 0.2 23.1
A-2-4 Centrifuged MFT 47.3% 1 37.8 0.25 28.8
A-2-5 Centrifuged MFT 47.3% 1 37.8 0.33 37.8
A-2-6 Centrifuged MFT 47.3% 1 37.8 0.5 57.7
A-2-7 Centrifuged MFT 47.3% 1 37.8 0.65 75.1
A-2-8 Centrifuged MFT 47.3% 1 37.8 0.8 92.3
A-2-9 Centrifuged MFT 47.3% 1 37.8 1 115.5
B-1-1 Kaolinite/Water 50.0% 0 0 0 0
B-1-2 Kaolinite/Water 50.0% 0.01 0.38 0.0033 0.4
B-1-3 Kaolinite/Water 50.0% 0.1 3.8 0.033 3.8
B-1-4 Kaolinite/Water 50.0% 0.5 18.9 0.16 18.9
B-1-5 Kaolinite/Water 50.0% 1 37.8 0.33 37.8
B-2-1 Centrifuged MFT 47.3% 0 0 0 0
B-2-2 Centrifuged MFT 47.3% 0.01 0.4 0.0033 0.4
B-2-3 Centrifuged MFT 47.3% 0.1 4 0.033 4
B-2-4 Centrifuged MFT 47.3% 0.5 20 0.16 20
B-2-5 Centrifuged MFT 47.3% 1 40 0.33 40
C-1-1 Centrifuged MFT 47.3% 0 0 0 0
C-1-2 Centrifuged MFT 47.3% 0.01 0.38 0 0
C-1-3 Centrifuged MFT 47.3% 0.1 3.8 0 0
C-1-4 Centrifuged MFT 47.3% 0.5 18.9 0 0
C-1-5 Centrifuged MFT 47.3% 1.0 37.8 0 0
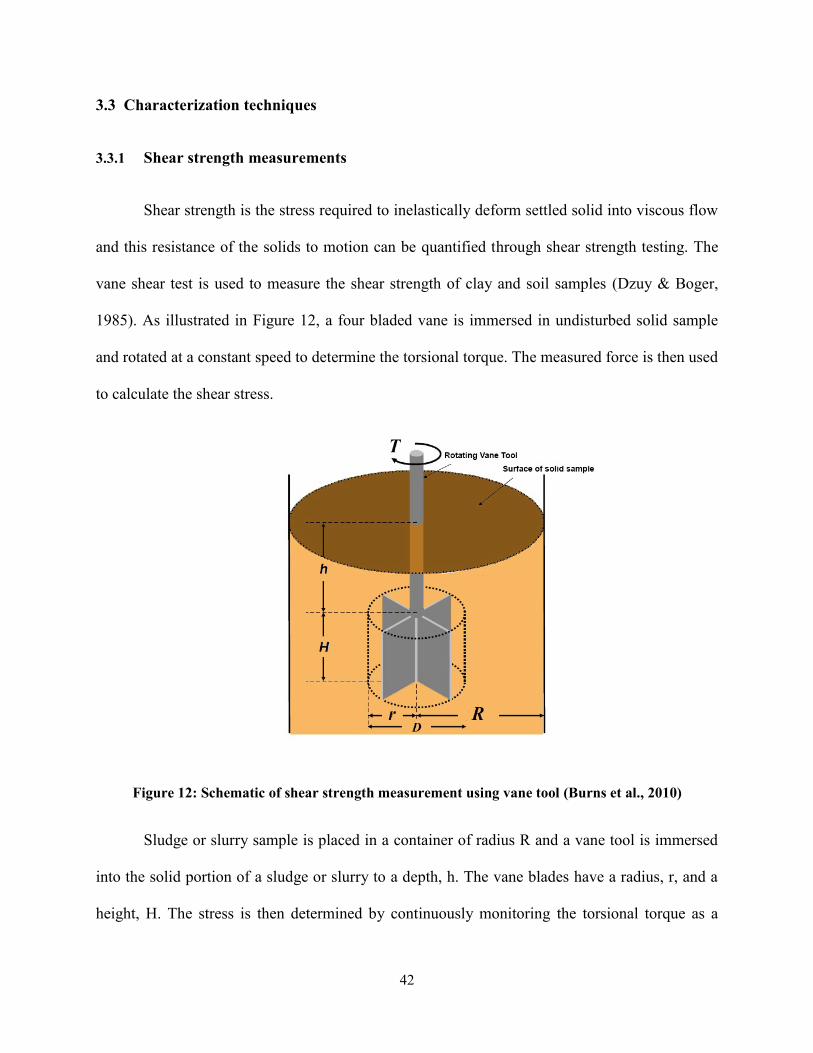
42
3.3 Characterization techniques
3.3.1 Shear strength measurements
Shear strength is the stress required to inelastically deform settled solid into viscous flow
and this resistance of the solids to motion can be quantified through shear strength testing. The
vane shear test is used to measure the shear strength of clay and soil samples (Dzuy & Boger,
1985). As illustrated in Figure 12, a four bladed vane is immersed in undisturbed solid sample
and rotated at a constant speed to determine the torsional torque. The measured force is then used
to calculate the shear stress.
Figure 12: Schematic of shear strength measurement using vane tool (Burns et al., 2010)
Sludge or slurry sample is placed in a container of radius R and a vane tool is immersed
into the solid portion of a sludge or slurry to a depth, h. The vane blades have a radius, r, and a
height, H. The stress is then determined by continuously monitoring the torsional torque as a

43
function of time. The shear strength of the material is then associated to the maximum torque
measured once a steady-state vane rotation has been achieved. This is under the assumption that
there is uniform stress distribution on the known vane tool geometry.
An example shear stress against time curve is shown in Figure 13. The peak of this plot
corresponds to the onset of plastic deformation in the solid sample. The maximum torque
required for plastic deformation is dependent on vane geometry.
Figure 13: Torque versus time plot which can be used to obtain shear strength of solid samples
(Burns et al., 2010)
To account for vane geometry effects, the shear strength is expressed as an isotropic and
uniform stress acting over the entire surface area of the cylinder of rotation swept out by the
vane. This shear strength is related to the maximal torsional torque during the steady state motion
given by Equation (5), (6) and (7) (ASTM Standard D2573, 2002):
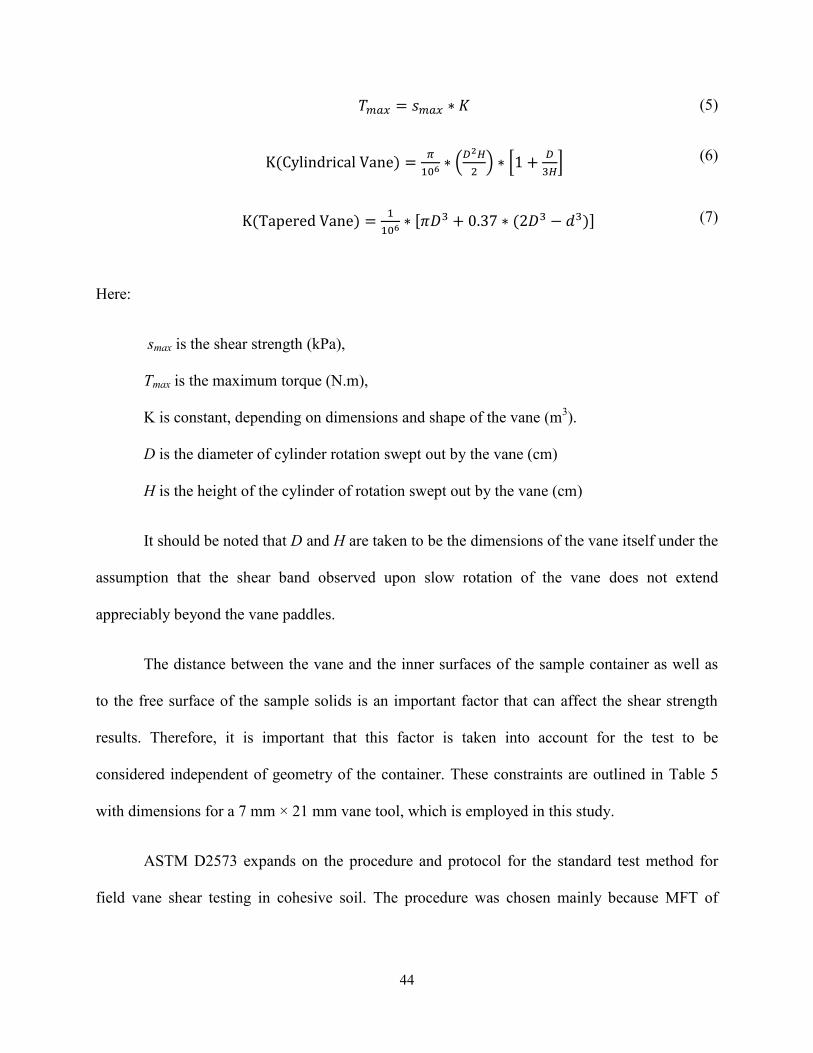
44
𝑇𝑚𝑎𝑥 = 𝑠𝑚𝑎𝑥 ∗ 𝐾 (5)
K(Cylindrical Vane) =𝜋
106∗ (
𝐷2𝐻
2) ∗ [1 +
𝐷
3𝐻] (6)
K(Tapered Vane) =1
106∗ [𝜋𝐷3 + 0.37 ∗ (2𝐷3 − 𝑑3)] (7)
Here:
smax is the shear strength (kPa),
Tmax is the maximum torque (N.m),
K is constant, depending on dimensions and shape of the vane (m3).
D is the diameter of cylinder rotation swept out by the vane (cm)
H is the height of the cylinder of rotation swept out by the vane (cm)
It should be noted that D and H are taken to be the dimensions of the vane itself under the
assumption that the shear band observed upon slow rotation of the vane does not extend
appreciably beyond the vane paddles.
The distance between the vane and the inner surfaces of the sample container as well as
to the free surface of the sample solids is an important factor that can affect the shear strength
results. Therefore, it is important that this factor is taken into account for the test to be
considered independent of geometry of the container. These constraints are outlined in Table 5
with dimensions for a 7 mm × 21 mm vane tool, which is employed in this study.
ASTM D2573 expands on the procedure and protocol for the standard test method for
field vane shear testing in cohesive soil. The procedure was chosen mainly because MFT of

45
various solid content as well as kaolinite slurries possess similar rheological characteristics to
that of cohesive soil.
Table 5: Constraints for using vane tool using shear strength measurements
Constraints Criterion For 7x21mm (rxH)
vane
Measurement
conditions used
Vane height (H) to
radius (r) H ≤ 7r H ≤ 49 mm H = 21 mm
Container radius (R) to
vane radius (r) R ≥ 2r R ≥ 14 mm R = 140 mm
Immersion depth to
vane height h ≥ H h ≥ 21 mm h = 195 mm
One of the important aspects of the standard stipulates that the torsional torque be
measured at a rotational rate of not more than 0.1°/s. Furthermore, depending on the nature of the
soil, the test should take up 2 to 5 minutes for failure, except in very soft clays where the time to
failure may be as much as 10 min. In harder materials, it is advisable to reduce the rotational
speed to obtain a more resolved stress against time curve. It has also been recommended to
record intermediate values of torque at intervals of 15 s or at lesser frequency if conditions
require (ASTM Standard D2573, 2002).
Furthermore, it is important to consider the friction of the vane rod and instrument to
avoid the friction to be improperly recorded as soil strength. Friction measurements under no-
load conditions can be carried out using blank stem instead of the vanes. The vane rod should
also have sufficient rigidity so that it does not twist under full load conditions. Correspondingly,
corrections for rod deformation must be made for plotting torque rotation curves.
The shear strengths of MFT and kaolinite samples were measured using the Malvern
Kinexus Lab+ rheometer which is a modular, highly intelligent and robust rotational rheometer.

46
The rSpace software installed on a computer is used to remotely control the rheometer and
acquire data. The rSpace software serves as a central program for obtaining, processing, and
recording the data from Kinexus Lab+ measuring system. rSpace automatically converts the
torque into shear stresses based on the appropriate K constant and provides the user with a stress
versus time plot.
On attaching the shear vane to the rheometer, the rSpace software automatically detects
the geometry, using the unique microchip present within the vane tool, and prompts the user to
load the sample. For convenience shear strength measurements for this study were carried out
directly in the sample container in which the sample is prepared. Figure 14 shows the setup used
to do shear strength measurements. Shear strength measurements employed a 7 mm × 21 mm
tapered shear vane tool.
Figure 14: Shear strength measurement setup using Malvern™ Lab+ rheometer

47
The rSpace software also allows post-measurement processing and interpretation of the
collected data. Specifically, it can be used to obtain maxima point in shear stress versus time
curves, i.e. the shear strength. Shear strength of all the samples was tracked using the Malvern
Kinexus Lab+ rheometer with 7 x 21mm vane tool. Measurements were done using the
procedures described in the ASTM D2573. Samples were sheared at the rate of 0.01 s-1
under the
assumption that the samples were characteristic to soft clay.
3.3.2 Fourier transform infrared spectrometry (FTIR)
Variations in the kaolinite microstructure were examined using the Thermoscientic
Nicolet 6700 Fourier Transform Infrared (FTIR) spectrometer. Kaolinite sample was mixed with
KBr in the range of approximately 0.5 wt% of the sample and ground with a mortar and pestle to
obtain a homogenous solid mixture. Using hydraulic press the mixture was then made into a disc,
which was then mounted onto the sample holder of the FTIR. It is important to not use high
concentration of sample since it can cause difficulties in obtaining clear pellets. Cloudy pellets
completely absorb or scatter the IR from the sample resulting in very noisy spectra (Northern
Illinois University - Chemistry Analytical Lab, 2007).
Reacted kaolinite samples were centrifuged at 5000 rpm for 60 minutes. The supernatant
was decanted and the solids were kept for overnight vacuum drying at 70°C to remove moisture.
The dried samples were prepared for FTIR using the procedure mentioned above. The infrared
spectra of the ground samples were recorded using the OMNIC software with scan speed of 2.5
kHz and 256 scans were run.
48
3.3.3 Particle size distribution by laser diffraction
The particle size distributions of kaolinite and reacted samples was measured using
Malvern’s Mastersizer™ 3000. Particle size analysis by laser diffraction can denote if a reaction
has taken place, specifically dissolution, showing a reduction in particle size.
Dry kaolinite or centrifuged and dried reacted sample were mixed with deionized water at
a concentration of approximately 1 wt% particle. The suspension was analyzed by the
Mastersizer™ 3000 and the data obtained is further analyzed using the Mastersizer™ 3000
software.
3.3.4 Inductively coupled plasma optical emission spectrometry (ICP-OES)
The ionic concentration of the liquid phase of the sample represent the amount of the Al-
Si source minerals leached by the addition of alkali activators. To analyze the ionic concentration
of the liquid, samples were centrifuged at 5000 rpm for 60 minutes and the supernatant was
analysed by a Perkin Elmer Optima 3000 inductively coupled plasma spectrometer (ICP-OES).
Spectral lines used were Si: 251.607 nm; Al 308.215 nm; Na: 588.983 nm; Fe: 259.933 nm
(Sarojam, 2010) .
3.3.5 Powder X-ray diffraction (XRD) & quantitative XRD
Kaolinite samples and MFT solids were analyzed by X-ray diffraction (XRD) for the
identification of their crystalline phases and amount of minerals present. For quantitative XRD of
the minerals present in MFT, the method proposed by Omotoso and Eberl (2009) was used.
MFT sample was dried at 75°C in a vacuum oven for 12 hours to remove all moisture. The dried
solids were passed through 250 µm sieve to obtain uniform grain sizes. 1.000 g of the solids was

49
then mixed with 0.250 g conundrum and ethanol and wet milled using McCrone micronizing
mill. The slurry was then left for overnight drying at 80ºC and vertrel was then added to the dried
solids before it was sieved again. The sample was finally side loaded in a modified sample
holder against frosted glass and examined from 5 to 65 degrees 2 using Cu K1.2 radiation, with
the step size of 0.02 degrees 2 and scan rate of 2°/minute. The characterization results were
entered into RockJock™ and analyzed to give the weight percent of the minerals present in the
sample.
Kaolinite and reacted kaolinite samples were prepared using the above mentioned sample
preparation procedure. Quantitative X-ray diffraction results of the kaolinite samples were
recorded and compared before and after the geopolymerisation reactions to observe any changes
in the crystal structure. The obtained spectra were analyzed using Material’s Data Inc. (MDI)
JADE™ software with ICDD® database. All the samples were characterized by Rigaku Ultima
IV X-Ray Diffractometer with Cu tube as X-ray source operating at 40 kV and 44 mA.
3.3.6 Transmission electron microscopy/ Energy-dispersive X-ray/ Selected area electron
diffraction (TEM/EDX/SAED)
The geopolymers formed in this work are mixtures of amorphous phase and crystalline
particles, and traditional XRD methods are not effective in studying these phases. Hence
TEM/SAED is applied to identify the crystalline particles and to gauge the extent to which
reaction has taken place. Furthermore, TEM/EDX is used for carrying out elemental analysis of
the formed geopolymers. Sample preparation for TEM analysis involves grinding the sample and
depositing it from an alcohol suspension on carbon covered copper grids. TEM/SAED and
50
TEM/EDX analyses are conducted using a Philips CM20 FEG TEM/STEM transmission
electron microscope at an accelerating voltage of 200 kV.
The quality of TEM results is highly dependent on sample preparation. There are certain
factors that must be accounted for while preparing clay minerals like kaolinite for TEM analysis.
These include their property of electrical insulation and their corrosion resistance which limits
their possibility of using chemical polishing during preparation. Also, to keep interlayer spacing
homogenous in the kaolinite sample, it is important that samples prepared for TEM analysis are
homoionic with only one type of cation present in the interlayer. This can be achieved by
repeatedly washing the sample with 1.0 M solution of NaCl and then deionized water to remove
the excess chloride. For more details on sample preparation of clay minerals for TEM the reader
is referred to article by Buseck and Iijima (1975). In any case, interpreting TEM images of clay
minerals can be a difficult task, as demonstrated by O’Keefe et al. (1978) through simulation.
Unreacted kaolinite and reacted solids were centrifuged and dried overnight before they
were sent to Alberta Center of Surface Engineering and Science (ACSES) for TEM/EDX/SAED
analysis.
3.3.7 Moisture analyzer
Moisture measurements in MFT samples were carried out using a Mettler Toledo HB43-
S Halogen Moisture Analyzer. Approximately 3 g of the wet sample are placed onto the
aluminum pan that fits inside the instrument. The analyzer weighs the samples and heats using
the integral halogen heating module. During the drying process, the mass of the sample is
constantly measured and the amount of reduction in moisture is directly reported in the display.
On completion of the run, the final moisture content of the sample is displayed.
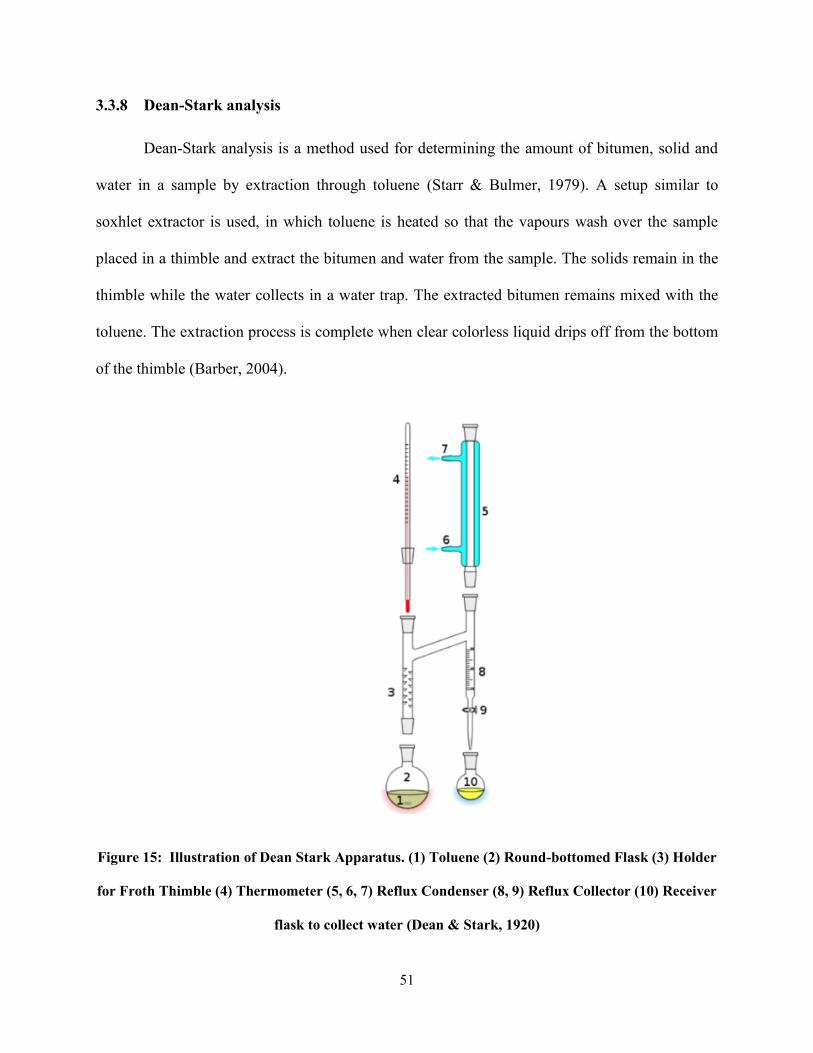
51
3.3.8 Dean-Stark analysis
Dean-Stark analysis is a method used for determining the amount of bitumen, solid and
water in a sample by extraction through toluene (Starr & Bulmer, 1979). A setup similar to
soxhlet extractor is used, in which toluene is heated so that the vapours wash over the sample
placed in a thimble and extract the bitumen and water from the sample. The solids remain in the
thimble while the water collects in a water trap. The extracted bitumen remains mixed with the
toluene. The extraction process is complete when clear colorless liquid drips off from the bottom
of the thimble (Barber, 2004).
Figure 15: Illustration of Dean Stark Apparatus. (1) Toluene (2) Round-bottomed Flask (3) Holder
for Froth Thimble (4) Thermometer (5, 6, 7) Reflux Condenser (8, 9) Reflux Collector (10) Receiver
flask to collect water (Dean & Stark, 1920)

52
Figure 15 illustrates a schematic of a typical Dean Stark analysis setup. Approximately
200 mL of toluene is used in the analysis and heated above the boiling point (110.6 °C). One of
the important considerations during this process is to regularly drain the water from the trap.
After the extraction process, the amount of water collected is weighed and so is the solids
remaining in the thimble. The amount of bitumen is determined from the toluene remaining in
the flask. This analysis has specifically been employed to measure the solid content in the MFT
sample.
3.3.9 Capillary suction time
Capillary suction time (CST) of MFT was measured using a Triton Type 319 Multi-
purpose capillary suction timer with 5 single radius test heads. CST assesses the resistance of
MFT samples to filtration and gives an idea of the reacted MFT samples’ dewatering capability.
Higher CST denotes more resistance and lower CST denotes otherwise.
In theory, the capillary suction time (CST) apparatus measures the time taken for water
from the sample to travel a fixed radial direction through a porous filter paper. This is achieved
using electrodes arranged in triangular manner. The time starts when the fluid reaches the first
two electrodes and it stops when it reaches the third. The measured time is the capillary suction
time. MFT samples were placed inside single radius cell heads with 10 mm diameter and 7x9
cm Triton filter paper was used to gauge the dewaterability of different types of MFT.

53
Chapter 4
Results and Discussion
4.1 Kaolinite
4.1.1 Shear strength measurement
The shear strengths were measured 90 days after the samples were mixed with the alkali
activators. The shear strengths of the kaolinite and centrifuged MFT samples in the different
series of tests are summarized in Table 10. Figure 16 shows the change in shear strength with the
changing Na2SiO3 concentration while NaOH concentration has been kept constant.
Figure 16: Shear strength of kaolinite with varying concentrations of Na2SiO3 and 1 mol/L of
NaOH.

54
It should be noted that the optimum concentration refers to the concentration of alkali
activators, NaOH and Na2SiO3, at which the highest shear strength of sample is obtained. The
optimum molar ratio of Na2SiO3 to NaOH for kaolin/water mixture was found to be 0.5 to 1.
This concentration was used for sample A-1-6 (refer to Table 4).
The literature reports a variety of optimum ratios. While many sources have pointed out
the optimum mass ratio of Na2SiO3 to NaOH to be 1 or higher, some studies claim values to be
below 1. For instance, Chindaprasirt et al. (2007) and Khale and Chaudhary (2007) stated that a
mass ratio for Na2SiO3:NaOH of 0.67-1 gives the best compressibility, whereas Hardjito and
Wallah (2004) published experimental results that denote the optimum mass ratio as high as 2.5.
Our test results indicated an optimum molar ratio of Na2SiO3 to NaOH to be 0.5 to 1, or an
optimum mass ratio of 1.5 to 1. Our results were more in line with those of Hardjito and Wallah
(2004).
The B-1 series, as mentioned in Chapter 3, was set up to gauge the effect of increasing
concentration of the alkali activators on shear strength of the samples while maintaining the same
ratio of sodium silicate to sodium hydroxide. The results of this experimental series are
illustrated in Figure 17.
The concentration multiplier, M, refers to a certain concentration of the alkali activators.
For instance, when M is equal to 0.5, the concentration of NaOH is 0.5 mol/L and that of
Na2SiO3 is 0.16 mol/L. The results from this series illustrate that the shear strength does not
increase with the increasing concentration of alkali activator. The shear strength at the highest
concentration was lower than that recorded at M of 0.5. Besides, a strange behavior was noted at
M of 0.1, which will be discussed further in this chapter.

55
Figure 17: Shear strength of kaolinite with varying concentration of Na2SiO3 and NaOH. M is the
concentration multiplier with M = 1 at 1 mol/L NaOH and 0.33 mol/L Na2SiO3.
In order to study the change in shear strength with time, 12 samples were prepared at the
optimum concentration, and the shear strength of these samples were measured separately over a
span of 90 days. The results are shown in Figure 18.
The shear strength is observed to increase with time, with the maximum increase
occurring in the first twenty days after the start of the experiment then slacken after 20 days. This
indicates that most of the reactions take place in first few days after the addition of the activators.
The reaction is observed to slow down as the increase in shear strength gradually flattens.
However, based on the trend, an increase is expected 90 days after the experiment was begun.

56
Figure 18: Change in shear strengths of kaolinite/water samples over a period of 90 days after
being treated with optimum molar ratio of Na2SiO3:NaOH of 0.5:1. The NaOH dosage was 4 wt%.
4.1.2 Characterization results
The results of ICP-OES analysis of the supernatant of sample A-1-6 for kaolinite are
shown in Table 6, together with the theoretical composition of a solution containing 1.0 mol/L
NaOH and 0.5 mol/L Na2SiO3. The results show that the concentration of aluminum ions
increased from 0 to 109 ppm, clearly due to the dissolution of the kaolinite sample. Interestingly,
while the solution of 1.0 mol/L NaOH and 0.5 mol/L Na2SiO3 should contain 14,000 ppm of Si
and 46,000 ppm of Na, the actual measured concentrations of Si and Na in sample A-1-6 were
2,915 ppm and 23,651 ppm, respectively. The results seem to indicate that there was indeed the
dissolution of the kaolinite sample, but the dissolved ionic species must have re-solidified which
consumed the Si and Na ions.

57
Table 6: Comparison of ionic concentration in a solution mixture of 1 mole/L NaOH and 0.5 mol/L
Na2SiO3 with the supernatant of sample A-1-6 as measured by ICP-OES.
Al Si Na
A-1-6 Supernatant (ppm) 109 2,915 23,651
Expected amount if no reaction
takes place (ppm) 0 14,000 46,000
Zaman and Mathur (2004) studied the solubility of kaolinite under various pH conditions.
The following reactions illustrate the dissolution in acidic and basic conditions respectively:
Acidic
Al2Si2O5(OH)4 + 6H+ → 2Al3+ + 2H4SiO4 + H2O (8)
Basic
Al2Si2O5(OH)4 + 2OH− + 5H2O → 2Al(OH)4
− + 2H4SiO4 (9)
Zaman and Mathur (2004) pointed out that while the silicon concentration decreases with
increasing pH, aluminum ion concentration was comparatively low in the solution over the entire
range of the pH studied. This may be a result of the formation of Al(OH)3 precipitate which is
amphoteric and has low water solubility in the pH range of 4.5-8.5. Also, an aluminosilicate gel
can form which can further decrease the concentration of Al3+
in the supernatant. They also
observed further dissolution of kaolinite to release Al3+
and Si4+
ions in the presence of sodium
silicate as a dispersing agent.

58
In another detailed study, Zaman et al. (2003) have elaborated how the dissolution of
kaolinite and the release of Al3+
and Si4+
is dependent on the types of dispersing agents,
dispersant dosages and pH. Hence, this explains the deduction from the results obtained from the
ICP-OES about the dissolution of silicon and aluminum from the kaolinite structure. To further
study ion content of the samples, the samples that were prepared for separate shear strength
measurements were centrifuged and the supernatant was decanted and its ion content was
analyzed by ICP-OES.
Figure 19: Change in supernatant ion concentration of sample A-1-6 with time of (a) Silicon &
Aluminum (b) Sodium
The concentration of the ions are seen to decrease indicating that Si and Al ions might be
re-solidifying, forming the geopolymeric species. Decrease in the ionic concentration of Na+
further denote to the formation of a polysialate molecule hypothesized by Davidovits (2011).
Due to the negative charge on tetrahedral aluminate, the polysialate molecules need monovalent
cation to balance the net charge as denoted by reaction mechanism of kaolinite with NaOH in
Figure 20.
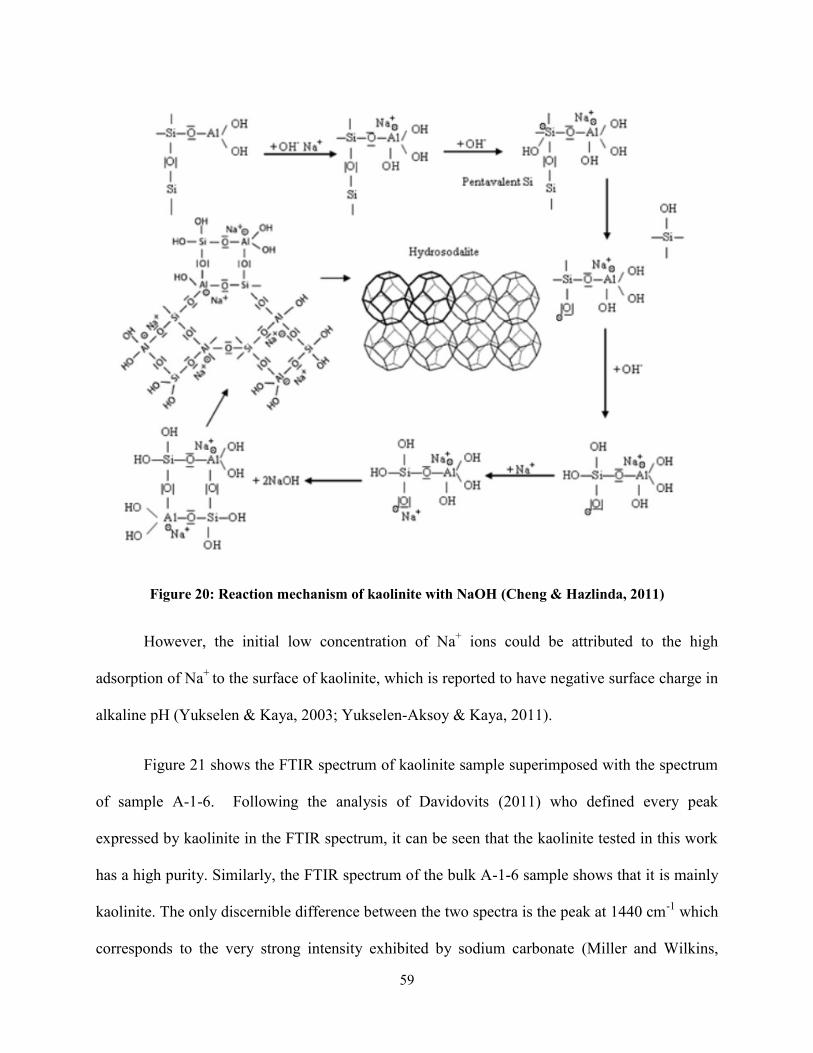
59
Figure 20: Reaction mechanism of kaolinite with NaOH (Cheng & Hazlinda, 2011)
However, the initial low concentration of Na+ ions could be attributed to the high
adsorption of Na+
to the surface of kaolinite, which is reported to have negative surface charge in
alkaline pH (Yukselen & Kaya, 2003; Yukselen-Aksoy & Kaya, 2011).
Figure 21 shows the FTIR spectrum of kaolinite sample superimposed with the spectrum
of sample A-1-6. Following the analysis of Davidovits (2011) who defined every peak
expressed by kaolinite in the FTIR spectrum, it can be seen that the kaolinite tested in this work
has a high purity. Similarly, the FTIR spectrum of the bulk A-1-6 sample shows that it is mainly
kaolinite. The only discernible difference between the two spectra is the peak at 1440 cm-1
which
corresponds to the very strong intensity exhibited by sodium carbonate (Miller and Wilkins,

60
1952). The presence of sodium carbonate is indicative of unreacted sodium hydroxide. Sodium
hydroxide might have reacted with the atmospheric carbon dioxide to produce the sodium
carbonate during the drying stage of sample preparation for FTIR (Jaarsveld & Deventer, 1999).
The low intensity points out that sodium hydroxide is present in very small quantities. Most of
the peaks associated with sodium carbonate could have been overlapped by strong kaolinite
signals. Also, the peaks exhibited by the formed geopolymeric product might also been
overlapped by kaolinite for the same reason.
Figure 21: FTIR spectra of kaolinite and sample A-1-6. The latter exhibits a peak typically
pronounced by sodium carbonate which denotes the presence of unreacted sodium ions on the
surface

61
Figure 22 depicts the XRD patterns of kaolinite and sample A-1-6. Like the FTIR results,
the XRD spectrum shows that sample A-1-6 is mainly unreacted crystalline kaolinite. However,
the results from the quantitative XRD analysis done by RockJock™ shows a decrease in
crystallinity. The amount of the ordered and branched kaolinite has decreased by 2.8 and 5
percentage points, respectively, denoting modification of the kaolinite crystal structure on
addition of the activators. About 7.8% of the kaolinite has been converted to an amorphous
species which cannot be detected by XRD.
Figure 22: Quantitative XRD results of sample kaolinite and sample A-1-6 generated from
JADE™. Results indicate a decrease in the quantity of crystalline kaolinite in A-1-6.

62
This hypothesis is further supported by results from TEM results as seen in Figure 3a.
While the bulk of the material has remained in the crystalline state, the selective area electron
diffraction shows the presence of amorphous grains on the periphery of the A-1-6 sample.
Figure 23: Transmission electron microscopy, selective area electron diffraction and energy
dispersive X-ray of reacted and unreacted kaolinite at 200 kV accelerating voltage with (a)
amorphous aluminosilicate grains characteristic of geopolymer found on the periphery of grain
clusters in the reacted sample (b) characteristic hexagonal shaped grains and high crystallinity
observed in unreacted kaolinite structure.
Furthermore, energy dispersive x-ray (EDX) spectroscopy indicated that these grains
were aluminosilicate in nature. It should be noted that the appearance of copper in the EDX is
due to the copper grid on which the samples were mounted. Amorphous grains have been

63
reported to be characteristic to geopolymers (Davidovits, 2011). The presence of these
amorphous grains was repeatedly seen on the edges of the bulk crystalline material.
The TEM/EDX/SAED, coupled with ICP-OES and XRD results, indicate that the
kaolinite has undergone chemical changes even at much lower concentration of the ‘alkali
activators’ used in this work than reported in the literature. The presence of geopolymer grains
further corroborate in explaining the increase in shear strength of kaolinite.
Hence it is seen that at this concentration of alkali activators, the geopolymerzation
reactions are only taking place on the surface of the aluminosilicate minerals. Nevertheless, the
newly formed geopolymer grains act like a matrix holding the crystalline clay particles together.
4.1.3 The Anomaly of B-1-3
In sample series B-1, sample B-1-3 did not strengthen during the geopolymerisation
treatment. This sample was a 50 wt% kaolinite suspension mixed with the alkali activators at
concentrations of 0.1 mol/L sodium hydroxide and 0.033 mol/L sodium silicate. On mixing the
alkali activators with kaolinite, the resulting suspension immediately turned serous, showing
negligible mechanical strength. This condition remained as such indefinitely even after the
sample was kept untouched for several weeks. Therefore, to understand this behavior,
characterization techniques of ICP-OES, particle size distribution, and XRD were carried out on
B-1-3.
The B-1-3 sample was first centrifuged to separate the solids from the supernatant. The
supernatant was then decanted and kept aside for ICP-OES analysis while the solids were
divided into two equal portions. One portion of the solids was characterized for particle size

64
distribution by laser diffraction and the results were compared to a control kaolin sample. The
results are summarized in Table 7.
It was found that B-1-3 solids possessed slight smaller particle size distribution than
unreacted kaolinite solids. Sonication was required for the kaolinite control sample, which
otherwise showed a higher average particle size possibly due to aggregation. This was not
observed for the B-1-3 solids which showed a consistent particle size distribution even after
sonication.
Table 7: Particle size distribution of kaolinite and dried solids of sample B-1-3. The table shows
how the particle size distribution dropped for kaolinite sample after sonication.
Kaolin Sample B-1-3
Without Sonication
Dv (10) 1.74 µm 0.556 µm
Dv (50) 12.8 µm 4.38 µm
Dv (90) 43.9 µm 23.1 µm
After Sonication
Dv (10) 0.881 µm 0.561 µm
Dv (50) 5.45 µm 4.38 µm
Dv (90) 24.0 µm 21.2 µm
The other portion of solids was vacuum dried and was sent for XRD analysis. The
obtained results were compared to the spectrum of the of kaolin sample that was initially used for
preparing B-1-3. The results generated from JADE™ software are shown illustrated in Figure 9.
The XRD results denote that B-1-3 solids are mainly unreacted. The ICP-OES analysis of
the supernatant showed the presence of aluminum ions which were not initially present in the
solution. Also, the amount of silicon ions were seen to be much higher than predicted from the

65
added sodium silicate. Hence, there is a possibility that some amount of dissolution of kaolinite
has taken place on addition of the alkali activators. The characterization results from the ICP-
OES are illustrated in Table 8.
Figure 24: XRD pattern of the sample B-1-3 solids (Green) and kaolinite (Red) generated from
JADE™. The two spectra have similar peaks denoting that B-1-3 solids are quite similar to
unreacted kaolinite.
From the results of the characterization, it can be concluded that the phenomenon
exhibited by B-1-3 is deflocculation. Commercial ‘deflocculants’, or ‘dispersants’, are used in
the ceramic industry to reduce the attraction forces between clay particles in a suspension so that

66
the resulting ‘slip’ can be easily pumped (Andreola et al., 2006; Rodrigues et al., 2002). Such
‘deflocculants’ includes silicates, sodium tripolyphosphates and polyacrylate.
Table 8: Results of ICP-OES of the supernatant of sample B-1-3 compared to the amount of ions
initially present in the solution mixture contributed by added sodium silicate and sodium
hydroxide.
Al Fe Na Si
Expected amounts from solution (ppm) 0 - 5316.4 919
ICP-OES of Supernatant (ppm) 1549 153.8 1161 1880
Rodrigues et al. (2002) pointed out that deflocculation of clay can be achieved by one or
more of the following mechanisms: electrostatic repulsion, steric hindrance and cation capture
through chelation. The principle mechanism, however, used here is electrostatic repulsion. On
the addition of a monovalent salt, with alkali metal ions like Na+
or Li+, the zeta potential of the
suspended clay increases. The Na+ ions, which are large and have a small charge, are highly
hydratable and adsorb on the clay particle to create a thick double layer. The repulsive forces
between the particles have a wide field of action and appear at a distance where the attraction
forces are negligible, as per the DLVO theory, causing repulsion. Since, the alkali activators,
sodium hydroxide and sodium silicate, used in sample B-1-3 possess Na+, they both contribute to
deflocculation. Besides, an increase in pH caused by hydroxide ions increases the negative
charge on the edges of the clay. The highly charged surface of the clay causes strong long-range
repulsion further aiding in deflocculation.
The role of sodium silicate in deflocculation can also be explained by work done by Diz
et al. (1989). In their study, they elucidated the deflocculation mechanism of kaolinite by
polyanions like sodium silicate, sodium pyrophosphate and sodium polyacrylate. The silicate

67
species, as they postulated, is first adsorbed on the kaolinite surface in one or more of the
following ways:
Electrostatic attractive interaction between negatively charged ions and positive edges
(possible only at low pH in kaolinite)
Intermolecular interactions, like hydrogen bonds and van der Waals bonds between the
ions and the basal plane or the edge surface atoms
Condensation reaction between silanol group of silicate and kaolinite surface hydroxyls
Once the silicate species has been adsorbed, the increased stern potential results in a
larger energy barrier to aggregation of clay particles. But again, slight variation in the conditions
can lead to desorption and decrease in the stern potential, eventually leading to aggregation.
In order to study as to which of the two reagents are more effective in ‘deflocculation’,
two different samples were prepared. One containing kaolinite in 0.033 mol/L of sodium silicate,
while the other containing kaolinite in 0.1 mol/L sodium hydroxide. It was observed that both the
samples showed consistencies quite similar to B-1-3. This denotes that a change in pH alone can
also cause deflocculation and it is consistent with the results provided by Yukselen-Akdoy and
Kaya (2011) who clearly demonstrate that the surface charge of kaolinite becomes increasingly
negative above pH 7. Also, a summary of various zeta potentials studies of kaolinite at high pH
indicate that kaolinite surface is negative at alkaline pH (Yukselen & Kaya, 2003). Not
surprisingly, the 0.033 M sodium silicate sample alone also caused the deflocculation and this
result matches the one obtained from the study done by Diz et al. (1989) in which a
concentration of 0.04 mol/L of sodium silicate was considered to be a critical point beyond
which aggregation of the clay particle was observed. This is because high silicate concentration
increases the ionic strength of the solution, causing the electrical double layer of the kaolinite
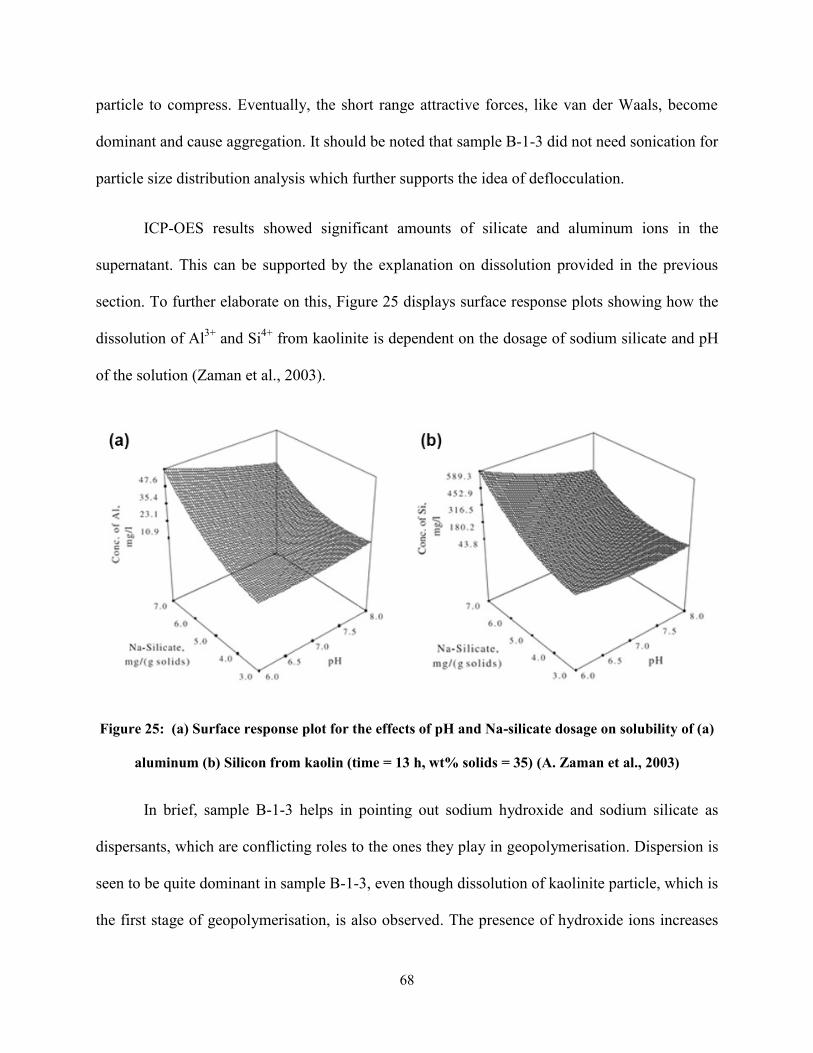
68
particle to compress. Eventually, the short range attractive forces, like van der Waals, become
dominant and cause aggregation. It should be noted that sample B-1-3 did not need sonication for
particle size distribution analysis which further supports the idea of deflocculation.
ICP-OES results showed significant amounts of silicate and aluminum ions in the
supernatant. This can be supported by the explanation on dissolution provided in the previous
section. To further elaborate on this, Figure 25 displays surface response plots showing how the
dissolution of Al3+
and Si4+
from kaolinite is dependent on the dosage of sodium silicate and pH
of the solution (Zaman et al., 2003).
Figure 25: (a) Surface response plot for the effects of pH and Na-silicate dosage on solubility of (a)
aluminum (b) Silicon from kaolin (time = 13 h, wt% solids = 35) (A. Zaman et al., 2003)
In brief, sample B-1-3 helps in pointing out sodium hydroxide and sodium silicate as
dispersants, which are conflicting roles to the ones they play in geopolymerisation. Dispersion is
seen to be quite dominant in sample B-1-3, even though dissolution of kaolinite particle, which is
the first stage of geopolymerisation, is also observed. The presence of hydroxide ions increases

69
the pH of the system, while the sodium ions and silicate polyanion get adsorbed on the kaolinite
surface, leading to dispersion by electrostatic repulsion. This prevents the clay particles from
approaching each other to propagate geopolymerisation reaction.
Hence, it is crucial to understand the balance between dispersion and geopolymerisation
reaction, especially in this context since low concentrations of the alkali activators are being
used. The optimum concentration found in this study, however, is significantly above the
deflocculation concentration. Increased shear strength was observed at the optimum
concentration and geopolymeric species were also found to be formed. While the prime function
of alkali activators should be to initiate geopolymerisation in clay minerals, it is imperative to
note that the same reagents can be used to deflocculate clays and particular importance should be
placed in controlling dosage for achieving surface geopolymerisation.
4.2 Mature fine tailings
4.2.1 Preliminary test series
Centrifuged MFT samples with 51 wt% solids were prepared, treated with alkali
activators, and kept for 90 days before shear strength measurements were carried. Figure 26
shows the results of the preliminary series, A-2 (see Table 4), prepared to find the optimum
concentrations of the alkali activators.
The optimum concentration for Na2SiO3 and NaOH was found to be 0.5 mol/L and 1
mol/L, or an optimum mass ratio of 1.5 to 1. This is the same concentration which was found for
kaolinite/water samples as mentioned previously.

70
Figure 26: Shear strength of centrifuged MFT (51 wt% solids) with varying concentrations of
Na2SiO3 and 1 mol/L of NaOH
Nevertheless, the B-2 series (see Table 4), which was prepared to determine the effect of
increasing concentration on shear strength while maintaining a fixed ratio of sodium silicate
versus sodium hydroxide, displayed a different trend from the kaolinite/water mixture series of
B-1. The results of the B-2 series are shown in Figure 27. In series B-1, deflocculation was
observed at M of 0.1 and the maximum shear strength was obtained at M of 0.5. However, in the
B-2 series the shear strength is seen to increase with the increasing concentration of the alkali
activators. Moreover, unlike kaolinite/water samples, no deflocculation is observed at any
concentration in MFT samples.

71
Figure 27: Shear strength of centrifuged MFT (51 wt% solids) with varying concentration of
Na2SiO3 and NaOH. M is the concentration multiplier with M = 1 at 1 mol/L NaOH and 0.33 mol/L
Na2SiO3.
It is also observed that the shear strength of the MFT samples is significantly higher than
the kaolin/water samples even though the solids contents were similar. This is probably due to
the fact that MFT contains a variety of alumninosilicate minerals besides kaolinite, as depicted
by Table 2. These alumninosilicates, like quartz, feldspar and other clay minerals, are abundantly
present as Al-Si source materials for geopolymerisation reaction to take place. Also, it should be
noted that the octahedral aluminum in kaolinite is reported to resist the attack of alkali (Swaddle,
2001). The octahedral aluminate contributes in slowing the dissolution process and,
consequently, geopolymerisation as a whole giving kaolinite a lower shear strength. However,
the presence of several other aluminosilicate minerals in MFT with aluminum in possibly more

72
reactive tetrahedral state can give a higher extent of geopolymerisation reactions (Sperinck et al.,
2011; Kasperski and Mikula, 2011).
An extra set of samples was prepared for MFT and was named C-1 (see Table 4). This
series tracked the increase in shear strength with the increase in the concentration of NaOH in the
absence of Na2SiO3. The results are illustrated in Figure 28.
Figure 28: Change of shear strength of centrifuged MFT (51 wt% solids) with varying
concentrations of NaOH without the presence of Na2SiO3
An increasing trend is observed in shear strength with the maximum strength being
observed at 1 mol/L of NaOH. However the maximum shear strength is lower in this series than
that observed for the optimum concentration in Series A-2. In addition, 1 mol/L was the highest

73
sodium hydroxide concentration tested, so that it clearly cannot be considered as the optimum
dosage.
The results from the three series, A-2, B-2 and C-1, point out the importance of the
synergistic effect of NaOH with Na2SiO3 in obtaining high shear strength. While sodium
hydroxide is indispensable in initiating the reaction, the presence of Na2SiO3 is important in
providing additional sodium and silicate ions in progressing the reaction as illustrated by
hypothetical reaction mechanism shown in Figure 20.
4.2.2 Shear strength of different MFT at optimum ratio of activators
To observe the evolution of shear strength, the recipe of sample with series A-1 with the
highest shear strength, A-2-6, was used for centrifuged MFT (51 wt% solids), polymer (A3335)
flocculated MFT (48 wt% solids) and untreated MFT (37.9 wt% solids). Twelve samples were
prepared and their shear strengths were measured at different time points over a period of 90
days after the alkali activators were added. Shear strength measurements of different types of
MFT recorded over a span of 90 days show an increasing trend with maximum shear strength
being recorded at 4,880 Pa for centrifuged MFT. Untreated MFT had a shear strength of 1,244
Pa and MFT treated with polymer flocculant was found to have a shear strength of 3,952 Pa. The
results have been displayed by the plot in Figure 29.
The results indicate that the shear strength of untreated MFT sample was higher than that
of kaolinite, even when its solid content was lower (37.9 wt% for MFT and 50 wt% for
kaolinite). The higher shear strength, as mentioned before, could be attributed to the presence of
other sources of aluminosilicate minerals besides kaolinite. These clays provide an adequate

74
supply of aluminosilicates with active tetrahedral sites required for geopolymerisation, leading
higher degree of geopolymerisation (MacKenzie et al., 2008).
Figure 29: Shear strengths of MFT samples treated with optimum molar ratio of Na2SiO3: NaOH of
0.5:1
4.2.3 Hypothesis behind increase in shear strength
By using the deductions from the fundamental study done on the model kaolinite system,
the increase in the shear strength in MFT can be explained. Figure 30 gives a graphical
description of how the geopolymerisation reactions on the mineral surfaces contribute to an
increase in the overall shear strength of MFT. The graphic representation also demonstrates how
the geopolymeric species acts as a matrix (glue) and increases the load bearing strength of MFT.

75
The shear strength also depends on the extent to which the reactions have taken place. In
the span of time period over which the measurements were done, an increasing trend is observed.
Literature reports an increase in compressive strength of samples over 30 days after the start of
the reaction (Lizcano et al. , 2011; Van Riessen et al. , 2013; Wang et al., 2005). In the study by
Chen et al. (2011), compressive strength of various geopolymers was reported to increase over a
span of 90 days. The shear strength is observed to have increased for 90 days in this study and it
seems to be still on the rise beyond 90 days. It is possible that the sodium hydroxide can activate
polymerisation of Na2SiO3 forming a silica gel structure (Iler, 1979). This gelation of Na2SiO3
can itself contribute to increase in shear strength in samples especially if it polymerizes into
chains and three-dimensional networks.

76
Figure 30: Graphic explanation of the surface geopolymerisation reaction processes upon the
addition of alkali activators. The surface geopolymerisation reactions led to the gradual increase in
the shear strength of the mature fine tailings.
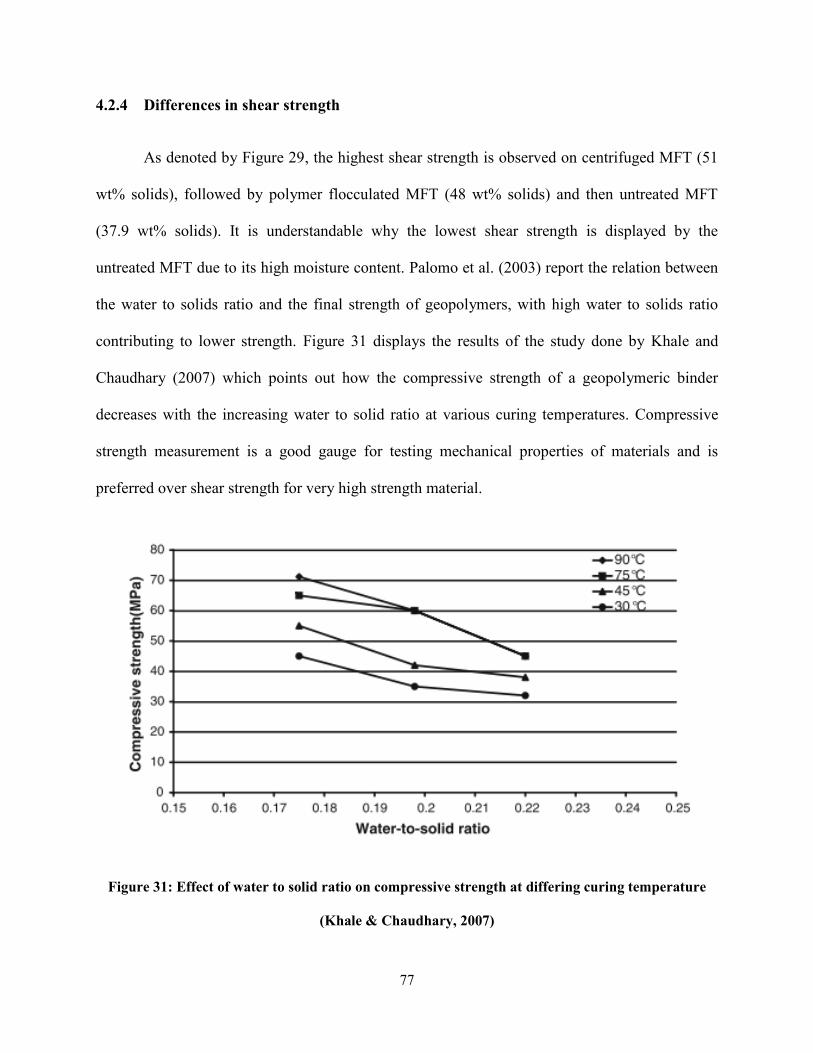
77
4.2.4 Differences in shear strength
As denoted by Figure 29, the highest shear strength is observed on centrifuged MFT (51
wt% solids), followed by polymer flocculated MFT (48 wt% solids) and then untreated MFT
(37.9 wt% solids). It is understandable why the lowest shear strength is displayed by the
untreated MFT due to its high moisture content. Palomo et al. (2003) report the relation between
the water to solids ratio and the final strength of geopolymers, with high water to solids ratio
contributing to lower strength. Figure 31 displays the results of the study done by Khale and
Chaudhary (2007) which points out how the compressive strength of a geopolymeric binder
decreases with the increasing water to solid ratio at various curing temperatures. Compressive
strength measurement is a good gauge for testing mechanical properties of materials and is
preferred over shear strength for very high strength material.
Figure 31: Effect of water to solid ratio on compressive strength at differing curing temperature
(Khale & Chaudhary, 2007)

78
Geopolymers produced from metakaolin and cured at different temperatures showed the
same behavior of low compressive strength at high water to solid ratio. It also explains why the
initial shear strength of untreated MFT was recorded to be the lowest among the different
categories of MFT.
On the other hand, the initial shear strength of polymer flocculated MFT was measured to
be highest among the three groups but the final value was recorded to be much lower than
centrifuged MFT even though centrifuged MFT and polymer flocculated MFT had similar water
to solid ratio. The initial strength of polymer flocculated MFT was measured to be 395 Pa,
whereas 115 Pa was measured for centrifuged MFT and 19 Pa for untreated MFT.
Figure 32: The presence of polymer flocculant on the surface of the clay particles hinders the alkali
activators from reaching the clay mineral surface and initiating the geopolymerisation reactions
High initial shear strength of the polymer flocculated MFT is mainly due to the polymer
bridge between clay particles, which clump the particles together and increase the overall
strength. However, the final lower shear strength could be attributed to the polymer flocculant
covering the surface of the clay minerals and hindering the alkali activators from propagating the
geopolymerisation process. It is also possible that the addition of polymers flocculant yields flocs

79
of MFT instead of dispersed clay particles, which blocks some reactive sites to
geopolymerisation. This leads to low degree of geopolymerisation. Since geopolymerisation, as a
whole, is affected by the addition of the polymer flocculant, the final shear strength is lower than
when the polymers were absent – i.e., the centrifuged MFT samples. Figure 32 graphically
depicts this hypothesis.
4.2.5 Dewaterability
The dewaterability of the samples was tested using the capillary suction time apparatus.
CST tests were carried out only on the MFT samples with the optimum concentration of the
alkali activators. The results are summarized in Table 9.
Table 9: CST results of three types of MFT
Sample Average CST (seconds)
Centrifuged MFT 3604
Flocculated MFT 574
Untreated MFT 2573
The results from CST tests clearly indicate that polymer flocculated MFT treated with
alkali activators has the best dewatering capabilities. This is in line with the fact that formation
of flocs increases the hydraulic conductivity of MFT allowing faster consolidation and water
release. The addition of the akali activators after flocculation of MFT could help with increasing
the shear strength of the consolidated solids, thus increasing the strength of the pores in the
sediments, which facilitates water release. Hence, the synergy of flocculation and
geopolymerisation can prove to be quite viable in the reclamation process of tailings ponds but
assessing the implications of such technology is beyond the scope of this thesis.

80
Chapter 5
Conclusions
1. Preliminary tests were carried out on kaolinite/water mixture with 1:1 weight ratio and
MFT centrifuged to 51 wt% solids. Two series for kaolinite/water and three series for
centrifuged MFT were set up:
o A-1 series: Kaolinite/water mixture with increasing Na2SiO3 concentration and 1
mol/L of NaOH to determine the optimum ratio of the alkali activators
o B-1 series: Kaolinite/water mixture with increasing concentration of Na2SiO3 and
NaOH at a fixed molar ratio of 0.33:1, or mass ratio of 1:1
o A-2 series: Centrifuged MFT with increasing Na2SiO3 concentration and 1 mol/L
of NaOH to determine the optimum ratio of alkali activators
o B-2 series: Centrifuged MFT with increasing concentration of Na2SiO3 and
NaOH at a fixed molar ratio of 0.33:1, or mass ratio of 1:1
o C-1 series: Centrifuged MFT with increasing concentration of NaOH in the
absence of Na2SiO3
2. The combination of 1 mol/L NaOH and 0.5 mol/L of Na2SiO3 was found to be the
optimum concentration for both kaolinite/water mixture and centrifuged MFT as
determined by series A-1 and A-2 respectively. The shear strength increased from 115 Pa
to 4,880 Pa for centrifuged MFT (51 wt% solids) at the optimum activator
concentrations. At the same activator concentrations, the original un-centrifuged MFT
(37.9 wt% solids) only saw an increase of its shear strength from 19 Pa to 1,245 Pa.
3. The optimum concentration of the activators were added to MFT sample flocculated by
adding 1000 g/t of A3335 polymer flocculant. While the solid content of the flocculated
81
MFT after 48 h sedimentation increased to 48 wt%, its shear strength increased from 395
Pa (without adding alkali activators) to 3,950 Pa (90 days after adding the alkali
activators).
4. Fundamental studies conducted on kaolinite sample using quantitative X-ray diffraction,
transmission electron microscopy coupled with selected area electron diffraction and
energy dispersive X-ray spectroscopic analyses showed that under the test conditions, the
geopolymerisation reactions only occurred on the surface of the kaolinite mineral. The
“surface geopolymers” held the kaolinite particles together leading to an increase in shear
strength from 110 Pa to 1,010 Pa at 50 wt% solids at the optimum alkali activator
dosages (1 mol/L sodium hydroxide and 0.5 mol/L sodium silicate). ICP-OES analyses
done on the supernatant of geopolymerised sample showed that Al, Si and Na species
dissolved and re-solidified.
5. The addition of polymer flocculant such as A3335 impedes the geopolymerisation
process and reduces the final shear strength of MFT, compared with centrifuged MFT.
The presence of the polymers on the surface of the clay particles may hinder the
functions of the alkali activators on the clay surfaces.
6. A method of using surface geopolymerisation reactions to strengthen oil sands mature
fine tailings (MFT) was proposed.

82
Chapter 6
Scope of Further Study
In most studies done on geopolymerisation, metakaolin has been the main focus of
research interest. Metakaolin is the dehydroxylated amorphous derivative of kaolinite that has
shown a lot of promise in producing construction grade products in the recent years. Studies on
geopolymerisation involving only kaolinite, however, has been quite limited. It is integral to
delve deeper into exploring this process to have sound understanding of mechanisms involved in
the increase of strength in kaolinite at such a low concentration of alkali activators.
Since geopolymerisation on tailings sludge is an innovative approach to solve the tailings
problem, there are many aspects that are yet to be explored. Some of the aspects include the
study of:
Activators other than NaOH and Na2SiO3 on the initiation of the geopolymerisation
process and how their concentration can affect the process;
Long range and short range forces that affect the strength of the geopolymer and a
detailed account of the underlying colloidal chemistry during the geopolymerisation
processes;
The effect of the presence of species other than aluminosilicates on the surface
geopolymerisation reaction.
Furthermore, to commercialize the process, this understanding needs to be safely
translated into mature fine tailings to allow optimization of the necessary parameters involved in
geopolymerisation reactions. Such parameters include different Si/Al ratios etc.

83
Some studies also pointed out the importance of cations in the geopolymerisation process
(Komnitsas and Zaharaki, 2007; Silva et al., 2007). Although the majority of them assumed that
cations are the main part of the process, their importance in the reaction process has not been
well understood. While some studies report on cations acting as a charge balancer for the
tetrahedral aluminate, others illustrate their importance as precursors of certain steps in the
reaction mechanism (Lee and van Deventer, 2002; Gastuche et al., 1963; Cheng and Hazlinda,
2011). Understanding the roles of cation is further necessitated by their inherent presence in
MFT, especially sodium ions. Clark Hot Water Extraction process, used in obtaining bitumen
from tar sands, leaves significant quantities of sodium hydroxide in the tailings rejects.
Preliminary experiments were also carried out to assess the synergistic effect of surface
geopolymerisation with polymer flocculation followed by filtration. The feasibility of this project
can be further examined. Polymer flocculation with filtration is a relatively new process for
dewatering oil sands tailings that can be quite promising (Alam et al., 2011;Wang et al., 2010;
Y. Xu et al., 2008). However, there is still a lot of scope for improvement in this technology. Xu
et al., (2008) point out the importance of specific filtration resistance in obtaining best results in
dewatering of oil sands tailings with filterability decreasing with the increasing specific
resistance. Flocculation has been reported to considerably decrease the specific resistance of
tailings. High filtration pressure, however, can crack the cake during the filtration process and
hamper the dewatering process. Hence flocculation, coupled with surface geopolymerisation, can
be used to considerably decrease the specific resistance while retaining enough mechanical
strength at high filtration pressure to obtain the recommended high solid content in the
consolidated mature fine tailings.

84
Bibliography
AER. (2014). ST98-2014 Alberta’ s Energy Reserves 2013 and Supply/Demand Outlook 2014-
2023. Alberta Energy Regulator (AER). Retrieved April 20, 2015 from
http://www.aer.ca/data-and-publications/statistical-reports/st98
Alam, N., Ozdemir, O., Hampton, M. A., & Nguyen, A. V. (2011). Dewatering of coal plant
tailings: Flocculation followed by filtration. Fuel, 90(1), 26–35.
Alberta Chamber of Resources. (1996). Mineral developments agreement co-products study :
final report. Alberta: H.A. Simons.
Alberta Energy Regulator. (2009). Directive 074: Tailings Performance Criteria and
Requirements for Oil Sands Mining Schemes, Energy Resources Conservation Board,
Calgary, AB.
Allen, E. W. (2008). Process water treatment in Canada’s oil sands industry: I. Target pollutants
and treatment objectives. Journal of Environmental Engineering and Science, 7(2), 123–
138.
Andreola, F., Romagnoli, M., Castellini, E., Lusvardi, G., & Menabue, L. (2006). Role of the
Surface Treatment in the Deflocculation of Kaolinite. Journal of the American Ceramic
Society, 89(3), 1107–1109.
ASTM Standard D2573. (2002). Standard Test Method for Field Vane Shear Test in Cohesive
Soil. West Conshohocken, PA: ASTM International.
ASTM-IP petroleum measurement tables : ASTM designation D1250, IP designation 200.
(1952). Philadelphia : American Society for Testing Materials.
Atkins, P. W. (2010). Shriver & Atkins’ inorganic chemistry. New York : W. H. Freeman and
Co.
Barber, M. (2004). AST Dean Stark procedure : determination of bitumen, water and solids.
Devon, AB: Natural Resources Canada.
Barbosa, V. F. ., MacKenzie, K. J. ., & Thaumaturgo, C. (2000). Synthesis and characterisation
of materials based on inorganic polymers of alumina and silica: sodium polysialate
polymers. International Journal of Inorganic Materials, 2(4), 309–317.
Barrer, R. M. (1982). Hydrothermal chemistry of zeolites. London, England : Academic Press.
BGC Engineering Inc. (2010). Review of Reclamation Options for Oil Sands Tailings Substrates.
OSRIN Report No. TR-2., (July), 59 pp.

85
Bichard, J. A. (1987). Oil sands composition and behaviour research. Edmonton, Alta. :
AOSTRA.
Brady, P. V, & Krumhansl, J. L. (2001). The Surface Chemistry of Clay Minerals. Surfactant
Science Series, (103), 281–302.
Burns, C. A., Guaglitz, P. A., & Russell, R. L. (2010). Shear Strength Correlations for Kaolin /
Water Slurries : A Comparison of Recent Measurements with Historical Data. Oak Ridge.
Buseck, P. R., & Iijima, S. (1975). High Resolution Electron Microscopy of Silicates. American
Mineralogist, 59, 1–21.
CAPP. (2015). Alberta Oil Sands Bitumen Valuation Methodology 2015. Calgary, Alberta.
Retrieved from http://www.capp.ca/publications-and-statistics/publications/261786
CAPP. (2015). Taling Ponds 2015. Calgary, Alberta. Retrieved from
http://www.capp.ca/publications-and-statistics/publications/261786
Carter, R. A. (2009). Oil sands operators tackle tailings management challenges. E&MJ -
Engineering & Mining Journal VO - 210, (4), 54.
Chalaturnyk, R. J., Don Scott, J., & Özüm, B. (2002). Management of Oil Sands Tailings.
Petroleum Science and Technology, 20(9-10), 1025–1046.
Chastko, P. A. (2004). Developing Alberta’s oil sands. [electronic resource] : from Karl Clark to
Kyoto. Calgary, Alta. : University of Calgary Press, c2004. Retrieved from
http://login.ezproxy.library.ualberta.ca/login?url=http://search.ebscohost.com/login.aspx?dir
ect=true&db=cat03710a&AN=alb.4333609&site=eds-live&scope=site
Chen, J.-H., Huang, J.-S., & Chang, Y.-W. (2011). Use of reservoir sludge as a partial
replacement of metakaolin in the production of geopolymers. Cement and Concrete
Composites, 33(5), 602–610.
Cheng, Y., & Hazlinda, K. (2011). Potential application of kaolin without calcine as greener
concrete: a review. Austrailian Journal of Basic and Applied Sciences, 5(7), 1026–1035.
Chindaprasirt, P., Chareerat, T., & Sirivivatnanon, V. (2007). Workability and strength of coarse
high calcium fly ash geopolymer. Cement and Concrete Composites, 29(3), 224–229.
Clark, K. A., & Pasternack, D. S. (1932). Hot Water Seperation of Bitumen from Alberta
Bituminous Sand. Industrial & Engineering Chemistry, 24(12), 1410–1416.
clay mineral. (2015). In Britannica. Retrieved from http://www.britannica.com/science/clay-
mineral
86
Cox, P. A. (1995). The elements on earth : inorganic chemistry in the environment. Oxford ;
New York : Oxford University Press.
Davidovits, J. (1988). Soft Mineralurgy and Geopolymers. In J. Davidovits & J. Orlinski (Eds.),
Proceedings of the 1st International Conference on Geopolymer ’88, (Vol. 1, pp. 19–23).
Compiegne, France.
Davidovits, J. (1991). Geopolymers - Inorganic Polymeric New Material. Journal of Thermal
Analysis and Calorimetry, 37(8), 1633–1656.
Davidovits, J. (1994). Geopolymers: Man-Made Rock Geosynthesis and the Resulting
Development of Very Early High Strength Cement. Journal of Materials Education,
16(2/3), 91
Davidovits, J. (2011). Geopolymer chemistry and applications / Joseph Davidovits. Saint-
Quentin : Institut Géopolymère.
Dawson, R., Sego, D., & Pollock, G. (1999). Freeze-thaw dewatering of oil sands fine tails.
Canadian Geotechnical Journal, 36(4), 587–598.
Dean, E. W., & Stark, D. D. (1920). A Convenient Method for the Determination of Water in
Petroleum and Other Organic Emulsions. Journal of Industrial & Engineering Chemistry,
12(5), 486–490.
Deer, W. A., Howie, R. A., & Zussman, J. (1992). An introduction to the rock-forming minerals.
Harlow, Essex, England : Longman Scientific & Technical ; New York, NY : Wiley.
Dietrich, R. V., & Skinner, B. J. (1979). Rocks and rock minerals. New York : Wiley.
Diz, H. M., & Rand, B. (1989). The variable nature of isoelctric point of edge surface of
kaolinite. British Ceramic: Transactions and Journal, 88, 162–166.
Don Scott, J., Dusseault, M. B., & David Carrier, W. (1985). Behaviour of the
clay/bitumen/water sludge system from oil sands extraction plants. Applied Clay Science,
1(1-2), 207–218.
Duxson, P., Provis, J. L., Lukey, G. C., & van Deventer, J. S. J. (2007). The role of inorganic
polymer technology in the development of “green concrete.” Cement and Concrete
Research, 37(12), 1590–1597.
Dzuy, N. Q., & Boger, D. V. (1985). Direct Yield Stress Measurement with the Vane Method.
Journal of Rheology, 29(3), 335.
Esmaeili, P., Speirs, B. C., Ghosh, M., Lin, C., & Stea, G. (2014). Canadian Patent No.
2873992. Canadian Intellectual Property Office.

87
Ferguson, G. P., Rudolph, D. L., & Barker, J. F. (2009). Hydrodynamics of a large oil sand
tailings impoundment and related environmental implications. Canadian Geotechnical
Journal Revue Canadienne de Geotechnique, 46(12), 1446–1460.
Flanagan, E., & Grant, J. (2013, July). Losing Ground: Why the problem of oilsands tailings
waste keeps growing. Pembina Institute, 1–6.
Gastuche, B. M. C., Toussaint, F., Fripiat, J. J., Touilleuax, R., & Meersche, M. V. (1963). Study
of intermediate stages in the kaolin to metakaolin transformation, 227–236.
Government of Alberta. (2009). Environmental Management of Alberta’s Oil Sands:
Resourceful. Responsible. Edmonton.
Hardjito, D., & Wallah, S. (2004). On the development of fly ash-based geopolymer concrete.
ACI Materials Journal, (101), 467–472.
Hepler, L. G., & Hsi, C. (1989). AOSTRA technical handbook on oil sands, bitumens and heavy
oils. [Edmonton, Alta.] : Alberta Oil Sands Technology and Research Authority.
IFW Dresden. (2015). TEM CM 20 FEG. Retrieved June 20, 2015, from https://www.ifw-
dresden.de/?id=311
Iler, R. K. (1979). The chemistry of silica : solubility, polymerization, colloid and surface
properties, and biochemistry. New York : Wiley.
Jaarsveld, J. G. S. van, & Deventer, J. S. J. van. (1999). Effect of the alkali metal activator on the
properties of fly ash-based geopolymers. Industrial and Engineering Chemistry Research,
38(10).
Johnson, R. L. (1993). Oil sands sludge dewatering by freeze-thaw and evapotranspiration.
Edmonton, Alta.
Kaminsky, H. A. (2009). Characterization of an Athabasca oil sand ore and process streams.
[Thesis Dissertation] University of Alberta.
Karimi, G., & Macdonald, D. (2013). US Patent No. 20130019780. Google Patents.
Kasperski, K. L. (2001). A review of oil sands aqueous extraction research : draft. [S.l.] :
CANMET, Western Research Centre.
Kasperski, K. L., & Mikula, R. J. (2011). Waste Streams of Mined Oil Sands: Characteristics and
Remediation. Elements, 7(6), 387–392.
Khale, D., & Chaudhary, R. (2007). Mechanism of geopolymerisation and factors influencing its
development: a review. Journal of Materials Science, 42(3), 729–746.
88
Komnitsas, K., & Zaharaki, D. (2007). Geopolymerisation: A review and prospects for the
minerals industry. Minerals Engineering, 20(14), 1261–1277.
Lee, J. K., Shang, J. Q., Wang, H., & Zhao, C. (2014). In-situ study of beneficial utilization of
coal fly ash in reactive mine tailings. Journal of Environmental Management, 135, 73–80.
Lee, W. K. W., & van Deventer, J. S. J. (2002). The effects of inorganic salt contamination on
the strength and durability of geopolymers. Colloids and Surfaces A: Physicochemical and
Engineering Aspects, 211(2-3), 115–126.
Liu, Q., Cui, Z., & Etsell, T. (2006). Characterization of Athabasca oil sands froth treatment
tailings for heavy mineral recovery. Fuel, 85(5-6), 807–814.
Lizcano, M., Kim, H. S., Basu, S., & Radovic, M. (2011). Mechanical properties of sodium and
potassium activated metakaolin-based geopolymers. Journal of Materials Science, 47(6),
2607–2616. 4
Long, J., Li, H., Xu, Z., & Masliyah, J. H. (2006). Role of colloidal interactions in oil sand
tailings treatment. AIChE Journal, 52(1), 371–383.
Lowenstein, W. (1954). The distribution of aluminium m the tetrahedral of silicates and
aluminates. American Mineralogist, 39, 92–96.
MacKenzie, K. J. D., Komphanchai, S., & Vagana, R. (2008). Formation of inorganic polymers
(geopolymers) from 2:1 layer lattice aluminosilicates. Journal of the European Ceramic
Society, 28(1), 177–181.
MacKinnon, M. D. (1989). Development of tailings pond at Syncrude’s oil sands plant: 1978-
1987. AOSTRA Journal of Research, 5(2), 109–133.
Masliyah, J. H., Xu, Z., Czarnecki, J. A., & Dabros, M. (2011a). Handbook on theory and
practice of bitumen recovery from Athabasca Oil Sands. Cochrane, Alta. : Kingsley
Knowledge Pub.
Masliyah, J., Zhou, Z. J., Xu, Z., Czarnecki, J., & Hamza, H. (2004). Understanding Water-
Based Bitumen Extraction from Athabasca Oil Sands. The Canadian Journal of Chemical
Engineering, 82(4), 628–654.
McFarlane, A., Yeap, K. Y., Bremmell, K., & Addai-Mensah, J. (2008). The influence of
flocculant adsorption kinetics on the dewaterability of kaolinite and smectite clay mineral
dispersions. Colloids and Surfaces A: Physicochemical and Engineering Aspects, 317(1-3),
39–48.
Mercier, P. H. J., Le Page, Y., Tu, Y., & Kotlyar, L. (2008). Powder X-ray Diffraction
Determination of Phyllosilicate Mass and Area versus Particle Thickness Distributions for
Clays from the Athabasca Oil Sands. Petroleum Science and Technology, 26(3), 307–321.

89
Mikula, R. J., Kasperski, K. L., Burns, R. D., & MacKinnon, M. D. (1996). Nature and fate of oil
sands fine tailings. Suspensions: Fundamentals and Applications in the Petroleum Industry,
251, 677–723.
Mikula, R. J., Zrobok, R., & Omotoso, O. (2004). The potential for carbon dioxide sequestration
in oil sands processing streams. Journal of Canadian Petroleum Technology, 43(8), 48–52.
Mikula, R., & Omotoso, O. (2006). Role of Clays in Controlling Oil Sands Tailings Processing.
Clay Science, 12(2), 177–182.
Miller, F. A., & Wilkins, C. H. (1952). Infrared spectra and characteristic frequencies of
inorganic ions. Analytical Chemistry, 24(8), 1253–1294.
Mitchell, J. K., & Soga, K. (2005). Fundamentals of soil behavior. Hoboken, NJ : John Wiley &
Sons Inc.
Moffett, R. H., & Andrin, P. (2013). Canadian Patent No.2684155A1 . Google Patents.
NEB. (2000). Canada’s oil sands: A supply and market outlook to 2015. Alberta, Canada.
NEB. (2004). Canada’s oil sands: Opportunities and challenges to 2015: an update. Alberta,
Canada.
Ng, S., Warszynski, P., Zembala, M., & Malysa, K. (2000). Bitumen-air aggregates flow to froth
layer: II. Effect of ore grade and operating conditions on aggregate composition and
bitumen recovery. Minerals Engineering, 13(14-15), 1519–1532.
Northern Illinois University - Chemistry Analytical Lab. (2007). FT-IR sample preparation.
Retrieved July 21, 2014, from
http://www.niu.edu/analyticallab/ftir/samplepreparation.shtml
O’Keefe, M. A., Buseck, P. R., & Iijima, S. (1978). Computed crystal structure images for high
resolution electron microscopy. Nature, 274(5669), 322.
Omotoso, O., Eberl, D., Canmet, E., & US Geological. (2009). Sample preparation and data
collection strategies for x-ray diffraction quantitative phase analysis of clay-bearing rocks.
In 6th Annual Clay Minerals Society Meeting (p. 125). Billings, MT.
Omotoso, O., Mikula, R., Urquhart, S., Sulimma, H., & Stephens, P. (2006). Characterization of
Clays from Poorly Processing Oil Sands using Synchrotron Techniques TT -
Characterization of Clays from Poorly Processing Oil Sands using Synchrotron Techniques.
Clay Science, 12(2), 88–93.
Palomo, A., Fernandez-Jimenez, A., & Criado, M. (2003). “Geopolymers”: same basic
chemistry, different microstructures. Materiales De Construccion, 15(275), 77-91

90
Phair, J. W., & Van Deventer, J. S. J. (2002). Effect of the silicate activator pH on the
microstructural characteristics of waste-based geopolymers. International Journal of
Mineral Processing, 66, 121–143.
Proskin, S., Sego, D., & Alostaz, M. (2010). Freeze-thaw and consolidation tests on Suncor
mature fine tailings (MFT). Cold Regions Science and Technology, 63(3), 110–120.
Provis, J. L., & van Deventer, J. S. J. (2007). Geopolymerisation kinetics. 2. Reaction kinetic
modelling. Chemical Engineering Science, 62(9), 2318–2329.
Rodrigues J B, Oliveira A.P., Alarcon O.E., Pozzi P., A. F. (2002). Comparative Study of
Deflocculation Mechanisms in Colloidal Clay Suspensions. Qualicer 2002, 283-300.
Sarojam, P. (2010). ICP-Optical Emission Spectroscopy. Shelton, CT 06484 USA.
Shaw, R. C., Schramm, L. L., & Czarnecki, J. (1996). Suspensions in the hot water flotation
process for Canadian oil sands. Suspensions: Fundamentals and Applications in the
Petroleum Industry, 251, 639–675.
Silva, P. De, Sagoe-Crenstil, K., & Sirivivatnanon, V. (2007). Kinetics of geopolymerisation:
Role of Al2O3 and SiO2. Cement and Concrete Research, 37(4), 512–518.
Sobkowicz, J. (2012). The Oil Sands Tailings Technology Roadmap and Action Plan:
Introduction and Key Recommendations. In Third International Oil Sands Tailings
Conference (pp. 13–22). Oil Sands Tailings Research Facility, University of Alberta.
Sobkowicz, J. (2013). Oil sands tailings technology deployment roadmaps. [electronic
resource]. Alberta Innovates, Energy and Environment Solutions, Edmonton. Retrieved
from
http://login.ezproxy.library.ualberta.ca/login?url=http://search.ebscohost.com/login.aspx?dir
ect=true&db=cat03710a&AN=alb.6177377&site=eds-live&scope=site
Sperinck, S., Raiteri, P., Marks, N., & Wright, K. (2011). Dehydroxylation of kaolinite to
metakaolin—a molecular dynamics study. Journal of Materials Chemistry, 21(7), 2118.
Srodon, J. (1999). Nature of mixed-layer clays and mechanisms of their formation and alteration.
Annual Review of Earth and Planetary Sciences, 27, 19–53.
Starr, J., & Bulmer, J. T. (1979). Syncrude analytical methods for oil sand and bitumen
processing. Edmonton : Alberta Oil Sands Technology and Research Authority, 1979.
Swaddle, T. W. (2001). Silicate complexes of aluminum(III) in aqueous systems. Coordination
Chemistry Reviews, 219-221, 665–686.
Syncrude. (2012). Tailings Management. Retrieved from
http://www.syncrudesustainability.com/2012/environment/tailings-management/
91
Takamura, K. (1982). Microscopic structure of athabasca oil sand. The Canadian Journal of
Chemical Engineering, 60(4), 538–545.
Tsaprailis, H., & Zhou, J. (2013). Properties of Dilbit and Conventional Crude Oils. Alberta
Innovates. Retrieved from http://www.ai-
ees.ca/media/10927/properties_of_dilbit_and_conventional_crude_oils_-_aitf_-
_final_report.pdf
Van Jaarsveld, J. G. S., Lukey, G. C., van Deventer, J. S. J., & Graham, A. (2000). The
stabilisation of mine tailings by reactive geopolymerisation. Minprex 2000: International
Congress on Mineral Processing and Extractive Metallurgy, 2000(5), 363–371.
Van Olphen, H. (1977). An introduction to clay colloid chemistry for clay technologists,
geologists, and soil scientists. Natl. Acad. Sci., Washington, D.C., United States: John
Wiley & Sons.
Van Riessen, A., Jamieson, E., Kealley, C. S., Hart, R. D., & Williams, R. P. (2013). Bayer-
geopolymers: An exploration of synergy between the alumina and geopolymer industries.
Cement and Concrete Composites, 41, 29–33.
Wang, H., Li, H., & Yan, F. (2005). Synthesis and mechanical properties of metakaolinite-based
geopolymer. Colloids and Surfaces A: Physicochemical and Engineering Aspects, 268(1-3),
1–6.
Wang, X. (Tara), Feng, X., Xu, Z., & Masliyah, J. H. (2010). Polymer aids for settling and
filtration of oil sands tailings. The Canadian Journal of Chemical Engineering, 88(3), 403–
410.
WWF-Canada. (2010). Tailings , A Lasting Oil Sands Legacy. Retrieved May 20, 2015 from
http://awsassets.wwf.ca/downloads/wwf_tailings_report_october_2010_final.pdf
Xu, H., & Van Deventer, J. S. J. (2000). The geopolymerisation of alumino-silicate minerals.
International Journal of Mineral Processing, 59(3), 247–266.
Xu, H., & Van Deventer, J. S. J. (2002). Geopolymerisation of multiple minerals. Minerals
Engineering, 15(12), 1131–1139.
Xu, Y., Dabros, T., & Kan, J. (2008). Filterability of oil sands tailings. Process Safety and
Environmental Protection, 86, 268–276.
Yao, X., Zhang, Z., Zhu, H., & Chen, Y. (2009). Geopolymerisation process of alkali–
metakaolinite characterized by isothermal calorimetry. Thermochimica Acta, 493(1-2), 49–
54.
Yukselen, Y., & Kaya, A. (2003). Zeta potential of kaolinite in the presence of alkali, alkaline
earth and hydrolyzable metal ions. Water, Air, and Soil Pollution, 145, 155–168.

92
Yukselen-Aksoy, Y., & Kaya, a. (2011). A study of factors affecting on the zeta potential of
kaolinite and quartz powder. Environmental Earth Sciences, 62(4), 697–705.
Zaman, A., Demir, F., & Finch, E. (2003). Effects of process variables and their interactions on
solubility of metal ions from crude kaolin particles: Results of a statistical design of
experiments. Applied Clay Science, 22(5), 237–250.
Zaman, A., & Mathur, S. (2004). Influence of dispersing agents and solution conditions on the
solubility of crude kaolin. Journal of Colloid and Interface Science, 271(1), 124–130.
Zbik, M., & Smart, R. S. C. (1998). Nanomorphology of kaolinites; comparative SEM and AFM
studies. Clays and Clay Minerals, 46(2), 153–160.
Zhang, L., Ahmari, S., & Zhang, J. (2011). Synthesis and characterization of fly ash modified
mine tailings-based geopolymers. Construction and Building Materials, 25(9), 3773–3781.

93
Appendix A
Table 10: Shear strengths of kaolinite and centrifuged MFT samples in test series A-1, A-2, B-1, B-2
and C-1.
Sample
Name
Test Material Moisture
NaOH Na2SiO3
Shear strength
after 90 days (Pa) mol/L of
water
kg/t of dry
material
mol/L of
water
kg/t of dry
material
A-1-1 Kaolinite/Water 50.0% 1 40 0 0 545
A-1-2 Kaolinite/Water 50.0% 1 40 0.15 18.3 532
A-1-3 Kaolinite/Water 50.0% 1 40 0.2 24.4 507.9
A-1-4 Kaolinite/Water 50.0% 1 40 0.25 30.5 513
A-1-5 Kaolinite/Water 50.0% 1 40 0.33 40 612
A-1-6 Kaolinite/Water 50.0% 1 40 0.5 61.0 1013
A-1-7 Kaolinite/Water 50.0% 1 40 0.65 79.3 958
A-1-8 Kaolinite/Water 50.0% 1 40 0.8 97.6 1006
A-1-9 Kaolinite/Water 50.0% 1 40 1 122.2 976
A-2-1 Centrifuged MFT 47.3% 1 37.8 0 0 1501
A-2-2 Centrifuged MFT 47.3% 1 37.8 0.15 17.3 2064
A-2-3 Centrifuged MFT 47.3% 1 37.8 0.2 23.1 3525
A-2-4 Centrifuged MFT 47.3% 1 37.8 0.25 28.8 3865
A-2-5 Centrifuged MFT 47.3% 1 37.8 0.33 37.8 4427
A-2-6 Centrifuged MFT 47.3% 1 37.8 0.5 57.7 5641
A-2-7 Centrifuged MFT 47.3% 1 37.8 0.65 75.1 3920
A-2-8 Centrifuged MFT 47.3% 1 37.8 0.8 92.3 4414
A-2-9 Centrifuged MFT 47.3% 1 37.8 1 115.5 3918
B-1-1 Kaolinite/Water 50.0% 0 0 0 0 329
B-1-2 Kaolinite/Water 50.0% 0.01 0.38 0.0033 0.4 304
B-1-3 Kaolinite/Water 50.0% 0.1 3.8 0.033 3.8 -
B-1-4 Kaolinite/Water 50.0% 0.5 18.9 0.16 18.9 431
B-1-5 Kaolinite/Water 50.0% 1 37.8 0.33 37.8 848
B-2-1 Centrifuged MFT 47.3% 0 0 0 0 114
B-2-2 Centrifuged MFT 47.3% 0.01 0.4 0.0033 0.4 352
B-2-3 Centrifuged MFT 47.3% 0.1 4 0.033 4 777

94
B-2-4 Centrifuged MFT 47.3% 0.5 20 0.16 20 3564
B-2-5 Centrifuged MFT 47.3% 1 40 0.33 40 3573
C-1-1 Centrifuged MFT 47.3% 0 0 0 0 119
C-1-2 Centrifuged MFT 47.3% 0.01 0.38 0 0 507
C-1-3 Centrifuged MFT 47.3% 0.1 3.8 0 0 803
C-1-4 Centrifuged MFT 47.3% 0.5 18.9 0 0 1158
C-1-5 Centrifuged MFT 47.3% 1.0 37.8 0 0 1458
Figure 33: TEM/SAED of kaolinite solids at 200 kV

95
Figure 34: FTIR analysis done on kaolin solids with peak assignments of vibrational modes for
kaolinite found in literature

96
Appendix B - Preliminary Compressive Strength Measurements Using
Penetrometer
Compressive strength measurements were carried out on preliminary test series A-1, B-1,
A-1, A-2 and C-1 using a field penetrometer shown in Figure 35.
Figure 35: Field Penetrometer
The results of the measurements carried out using this device have been illustrated from
Figure 36 to 40. The compressibility was calculated by multiplying the penetrometer reading
with gravitational acceleration (9.8m/s2) and dividing the resultant value by the area of the tip.

97
Figure 36: Compressive strength of Kaolin/water mixture in different silicate to hydroxide ratio ( Sample series A-1) measure over a
period of five weeks
0
5
10
15
20
25
30
35
40
45
0 5 10 15 20 25 30 35 40
Co
mp
ress
ibili
ty (
kPa)
Days from start
A-1-1
A-1-2
A-1-3
A-1-4
A-1-5
A-1-6
A-1-7
A-1-8
A-1-9

98
Figure 37: Compressive strength of centrifuged MFT (51 wt% solids) in different silicate to hydroxide ratio (Sample series A -2)
measured over a period of five weeks
0
10
20
30
40
50
60
70
80
90
0 5 10 15 20 25 30 35 40
Co
mp
ress
ibili
ty (
kPa)
Number of Days
A-2-1
A-2-2
A-2-3
A-2-4
A-2-5
A-2-6
A-2-7
A-2-8
A-2-9

99
Figure 38: Compressive strength of Kaolin/water mixture in increasing silicate and hydroxide concentration at a fixed ratio (Sample
series B-1) measured over a period of five weeks. Samples B-1-1 and B-1-3 had negligible compressive strength and could not be recorded
0
5
10
15
20
25
30
35
40
0 5 10 15 20 25 30 35 40
Co
mp
ress
ibili
ty (
kPa)
Numbr of days from start
B-1-1
B-1-2
B-1-4
B-1-5

100
Figure 39: Compressive strength of centrifuged MFT (51 wt% solids) in increasing silicate and hydroxide concentration at a fixed ratio
(Sample series B-1) measured over a period of five weeks
0
5
10
15
20
25
30
35
40
45
50
0 5 10 15 20 25 30 35 40
Co
mp
ress
ibili
ty (
kPa)
Days from start
B-2-1
B-2-2
B-2-3
B-2-4
B-2-5

101
Figure 40: Compressive strength of centrifuged MFT (51 wt% solids) in different NaOH concentrations (w/o Silicate) measured over a
period of five week
0
5
10
15
20
25
30
35
40
0 5 10 15 20 25 30 35
Co
mp
ress
ibilt
y (k
Pa)
Days from start
C-1-1
C-1-2
C-1-3
C-1-4

102
Appendix C- Photos from the Study
Figure 41: Field penetrometer set
Figure 42: Mastersizer 3000 used for laser particle size analysis

103
Figure 43: Dean Stark extraction set up for determining bitumen, water and solids content
Figure 44: CST apparatus from Triton Electronics

104
Figure 45: Heidolph™ Electronic Overhead Stirrer (RZR 2052 Control)
Figure 46: Thermoscientic Nicolet 6700 Fourier Transform Infrared (FTIR) spectrometer

105
Figure 47: Mettler Toledo HB43-S Halogen Moisture Analyzer
Figure 48: Philips CM20 FEG TEM/STEM transmission electron microscope (IFW, 2015)