using outcomes to measure quality in head...
TRANSCRIPT

Using Outcomes to Measure Quality in Head Start
Emmalie DropkinOctober 2015

Center for Policy, Data, and Research
Our vision is to lead - to be the untiring voice that will not be quiet until every vulnerable child is served with the Head Start model of support for the whole child, the family and the community – and to advocate – to work diligently for policy and institutional changes that ensure all vulnerable children and families have what they need to succeed. Our mission is to coalesce, inspire, and support the Head Start field as a leader in early childhood development and education.
A strong and sustainable future for Head Start will mean the success of generations of children who might otherwise struggle throughout their lives. Their future success rests on the knowledge, commitment and collaboration of families, programs, researchers, and policymakers.
To that end, the mission of the Center for Policy, Data, and Research is to curate knowledge about Head Start to support Head Start programs as leaders and to share their wisdom and experience widely; to generate new analyses and reflections on program and policy priorities; and to strengthen dialogue and collaboration between Head Start practitioners and researchers.

Agenda
• Outcomes & Continuous Quality Improvement
• Investing in Impact Working Group
• Designation Renewal System Outcomes
• Parent, Family, and Community Engagement Study
• Discussion & Questions

Defining TermsInputs – the components that go into operating a strong program (facilities, partnerships, funding, etc.)
Outputs – the actions taken or services accessed (children enrolled, home visits completed – most of PIR is composed of outputs)
Outcomes – measures of behavior change as a result of a program (child cognitive development over a year or changes in parents’ discipline)
Impacts – long-term outcomes due to the program (third grade test scores, high school graduation rates)
From Breakthroughs in Shared Measurement and Social Impact
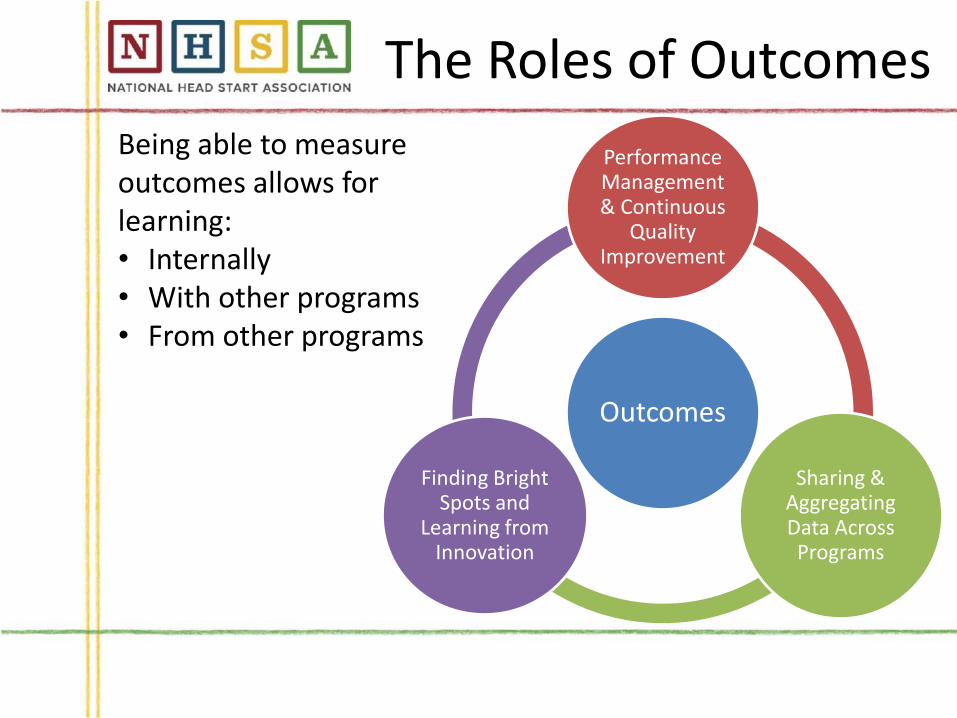
The Roles of Outcomes
Outcomes
Performance Management & Continuous
Quality Improvement
Sharing & Aggregating Data Across Programs
Finding Bright Spots and
Learning from Innovation
Being able to measure outcomes allows for learning:• Internally• With other programs• From other programs

Continuous Quality Improvement
• Federal studies
– Head Start Leadership, Excellence, and Data Systems (LEADS)
– Building Capacity to Use Linked Data (BCULD)
• Training and Technical Assistance (PMFO)
– Creating a Culture that Embraces Data
– Digging into Data
• Proposed Standards
– §1302.102 Achieving program performance goals
• Establishing program performance goals
• Monitoring program performance
• Using data for continuous improvement

Investing in ImpactMission
The Investing in Impact Working Group has been formed to think critically about the role for Head Start in various early learning proposals, the means of measuring and demonstrating Head Start's impact, and how the program should evolve and grow in the context of a stronger national early learning system while remaining true to its core mission and values.

Leadership and MembershipCo-Chairs:Gayle Kelly, Executive Director, MN Head Start AssociationRobin Britt, Executive Director, Guilford Child Development
NHSA Staff:Yasmina Vinci, Emmalie Dropkin, Lisa Stewart, Tommy Sheridan
Vanessa Rich Blanca Enriquez Aaron Lieberman Bruce Liggett Char Schank
Charlotte Brantley Cleo Rodriguez, Jr. Damon Carson Dana Lundy Darin Preis
Duane Yoder Erick Vaughn Tonya Williams Jo Pepper Joan Christnot
Joel Ryan Jose Villarreal Kathy Cruse Khari Garvin Lori Pittman
Luz Flores Mancole Fedder Monica Ortiz Pam Kuechler Robin Bozek
Sonja Lennox Biz Steinberg Erin Trenbeath-Murray

Process to Date• September-October – Conversation with policy makers and
authorizing staff• December – Focus on common language, first draft of Logic
Model• January – Second draft of logic model• March – Narrower focus on outcomes and potential
approaches• May – Selection of most critical outcomes to focus on for
potential measurement, development of rationale• May – Sharing progress and gathering input from Head
Start field• Summer – Use of rationale and other documents so far to
inform policy conversations

The Head Start community is rooted in and committed to the following core concepts:• High quality, comprehensive early education services support healthy early brain
development and provide young children and their families the experiences needed to be successful in school and later in life.
• A two-generation approach to early education, which includes parents, leads to a greater potential return on investment than focusing on the child alone.
• Children and families who are experiencing the greatest challenges benefit from early education services that are specifically designed to address the obstacles they face.
• The Head Start model provides a balance of local innovation and flexibility with compliance with national standards which results in a uniform standard of quality that can be measured and monitored while meeting the unique needs of the children, families and communities served.
Logic Model Framing

Logic Model

Focus on Outcomes
Note: (list) indicates where we spelled out particular services – we expect you all know what they are!
Why outcomes?• Confirm that “Head Start Works”• Used for accountability and Continuous Quality
Improvement• Respond to policy makers and Congress• Can be measured by programs over the course of
a year
What about inputs, outputs, and impacts?• Of course these are also important to measure,
but are outside the scope of this project• Impacts, some of which are of high interest, are
outside the scope of what programs could universally collect
To focus our work, we had to narrow the list. That doesn’t mean eliminating the outcomes, just selecting a subset of priorities that are plausible to measure.
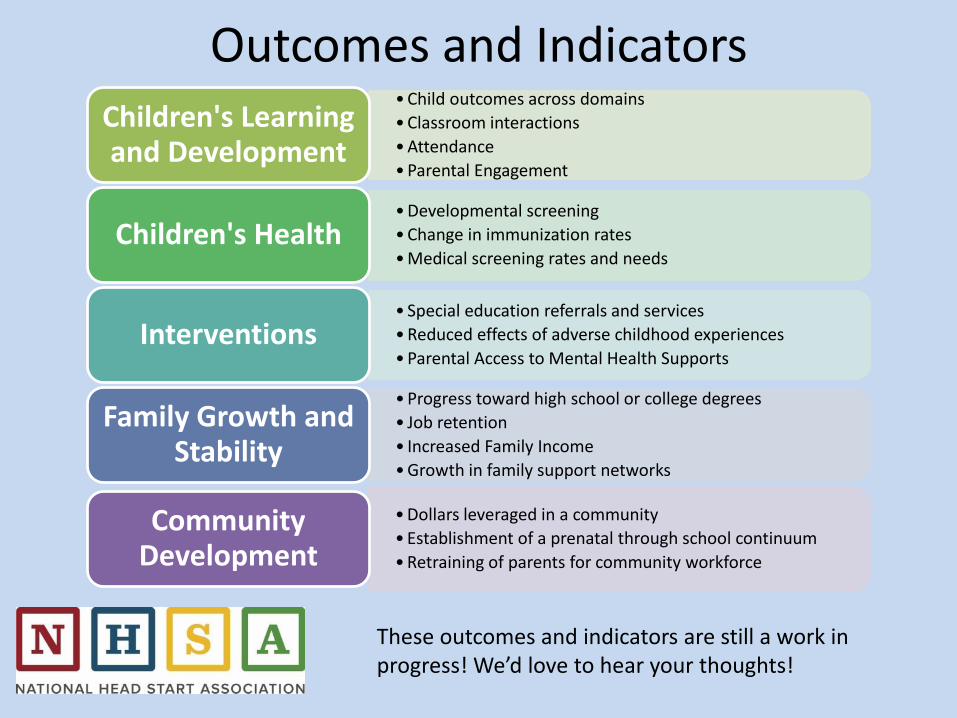
Outcomes and Indicators• Child outcomes across domains
• Classroom interactions
• Attendance
• Parental Engagement
Children's Learning and Development
• Developmental screening
• Change in immunization rates
• Medical screening rates and needsChildren's Health
• Special education referrals and services
• Reduced effects of adverse childhood experiences
• Parental Access to Mental Health SupportsInterventions
• Progress toward high school or college degrees
• Job retention
• Increased Family Income
• Growth in family support networks
Family Growth and Stability
• Dollars leveraged in a community
• Establishment of a prenatal through school continuum
• Retraining of parents for community workforce
Community Development
These outcomes and indicators are still a work in progress! We’d love to hear your thoughts!

Measurement Considerations
• Design of measures may differ for accountability or CQI• Demographic data is important to collect for thorough
analysis • Benchmarks or goals may be different for children and
families with different risk factors• Any measurement tools must be appropriate for culturally
and linguistically diverse populations• Collection and analysis of national must account for local
flexibility to identify tools and measures and for differences in communities’ ability to access different resources

Webinar Feedback
85.2%
13.0%
3.7%
0.0%
I’m excited to see what’s next
I think there are toomany here
I think a couple thingsshould be added
I don't think we shouldbe focusing on
outcomes
If outcomes are the future of measurement in Head Start,
how do you feel about this list?
0.0% 0.0%
10.3%
46.2%
41.0%
1 2 3 4 5
On a scale of 1 to 5, how well does this set of outcomes
capture what you think Head Start should focus on
measuring?

Next Steps• Inform other policy conversations about which outcomes
Head Start should focus on• Work with researchers and measurement experts on
articulating indicators and measurement practices• Pilot efforts to standardize and aggregate data collection
across a small number of programs• Consider the feasibility of collection and analysis of data at
the state, regional, or national association levels• Plan for how this work can inform NHSA’s positions during
reauthorization


History• 2007 Reauthorization called for grantees who were “not
delivering high-quality” to compete for new 5 year grants• 2010 NPRM for Designation Renewal proposed 25% of grantees
would compete each year based on 8 triggers• 2011 Final Rule removed the 25% requirement but introduced
the 10% threshold part of the CLASS trigger• First cohort announced in December 2011 – 129 grantees• Second cohort announced in January 2013 – 125 grantees• Third cohort announced in February 2014 – 103 grantees
Note: the fourth cohort was announced this past winter but has not yet begun the application process and is not included in the following analyses
Note: American Indian/Alaska Native grantees with deficiencies or concerns go through a separate process to strengthen quality and are not included in the following analyses

DRS TriggersTrigger Cohort
One*
Cohort
Two
Cohort
Three
Deficiency 129 83 52
School Readiness
Goals
0 0 0
CLASS – Below
Thresholds
0 9 18
CLASS – Lowest
10%
0 46 50
Revocation of
License
0 1 0
Suspension by
OHS
0 0 0
Debarment from
Funds
0 0 0
Failure as a Going
Concern
0 2 4
Total Programs in
DRS
129 125 103
The Final Rule on Designation Renewal spells out seven triggers that cause programs to go into competition:• A deficiency on a review conducted under
Section 641A• Failure to establish program goals for
improving the school readiness of children and take steps to achieve those school readiness goals
• Low CLASS scores as described in 1307.3(c) –either below set thresholds on the three domains of CLASS or in the lowest 10% of programs monitored in a given year
• Revocation of a License to Operate• Suspension by the Office of Head Start• Debarred from receiving state or federal
funds for Disqualified from CACFP• Audit finding of being at risk of failing to
continue functioning as a Going Concern
*The School Readiness and CLASS triggers were not implemented for cohort one. The Deficiency trigger was retroactive 2 ½ years for cohort one.

Design and Implementation Issues
• Deficiency trigger – unequal deficiencies
• CLASS trigger – inconsistent 10% cut-offs
• Inconsistent relationship between triggers and systemic “low-quality”
• Delays in forecasts, funding opportunities, negotiations, and announcements
• Changing process for 5 year grants
• Successful development of Birth to Five application design

Demographics Across Cohorts
• Despite state and regional variation in the rates at which programs have competed, programs in competition are generally reflective of the Head Start field as a whole in terms of:– Program auspices (non-profit, community action, school system,
government agency)– Program size– Grants held (EHS, HS, MSHS)– Racial, ethnic, and linguistic diversity of children served
• With the exceptions that:– Early Head Start-only grantees have been less likely to go into
competition– Grantees with lower levels of BA teachers seem more likely to
compete for low Instructional Support scores
• Information is not currently available to examine cost per child are it relates to competition, but this may play a role.

Competition Outcomes for Programs
69%
77%
70%
65%
5%
4%
2%
7%
17%
13%
20%
19%
2%
2%
3%
2%
6%
6%
5%
7%
2%
0%
0%
5%
All Competed Programs
Cohort Three
Cohort Two
Cohort One
Comparison Across Cohorts for DRS Outcomes
Grant Restored in Full Grant Restored in Part
Grant Lost or Relinquished Grant Competed Again Under CDI
Grant Competed Again Under Same Agency Birth to 5 Competition
• Overall, about 74% of grantees in the first three cohorts of DRS have had their grants restored in full or in part
• About 17% of the grantees in these three cohorts have lost their grants• About 8% have had their service area competed a second time• Why so high?
• Particularly with questionable triggers, some programs can easily demonstrate they are high-quality
• Commitment and knowledge of Head Start make many organizations the best competitors in their communities

Competition Outcomes for Programs by Trigger(s)
100%
50%
33%
92%
83%
83%
75%
40%
50%
72%
100%
50%
100%
33%
12%
17%
25%
20%
18%
33%
8%
5%
40%
50%
8%
Unknown (1 program)
License Revoked + <CLASS Threshold + CLASS 10% (1program)
Going Concern + Deficiency + CLASS 10% (2 programs)
Going Concern + <CLASS Threshold (1 program)
Going Concern (3 programs)
CLASS <Threshold + CLASS 10% (13 programs)
CLASS 10% (66 programs)
CLASS Threshold (6 programs)
Deficiency + CLASS <Threshold + CLASS 10% (4 programs)
Deficiency + CLASS 10% (10 programs)
Deficiency + CLASS <Threshold (2 programs)
Deficiency Only (248 programs)
DRS Outcomes by Trigger(s) - All Cohorts
Grant Restored in Full or In Part Grant Lost or Relinquished Grant Competed Again

Competition Outcomes for Programs with Deficiencies
80%
63%
77%
12%
21%
15%
8%
13%
6%
Immediate Deficiency (one or more) (110 programs)
Multiple Deficiencies (103 programs)
Single Deficiency (157 programs)
DRS Outcomes by Single/Multiple Deficiencies - All Cohorts
Grant Restored in Full or In Part Grant Lost (or Relinquished) Grant Competed Again
Note: Grantees with immediate deficiencies also appear in the rows for single or multiple deficiencies
60%
65%
50%
65%
68%
61%
75%
24%
24%
32%
21%
23%
13%
16%
13%
12%
18%
10%
6%
16%
10%
Monitoring, Systems & Records (45 programs)
Staff (51 programs)
Governance (22 programs)
Fiscal (48 programs)
Facilities, Vehicles, & Playgrounds (31 programs)
Program Delivery & Comprehensive Services (31 programs)
Health & Safety (122 programs)
DRS Outcomes by Deficiency Type - All Cohorts
Grant Restored in Full or In Part Grant Lost (or Relinquished) Grant Competed Again
Note: Grantees with deficiencies in multiple areas are included in multiple rows.

Competition Outcomes for Programs by Program Features
90%
78%
72%
67%
5%
15%
15%
25%
5%
11%
7%
School System (41 programs)
Government Agency (27 programs)
Community Action Agency (167 programs)
Private/Public Non-Profit (122 programs)
DRS Outcomes by Program Auspices
Grant Restored in Full or In Part Grant Lost or Relinquished Grant Competed Again
83%
69%
72%
76%
71%
19%
14%
15%
24%
8%
12%
9%
4%
5000+ children (6 programs)
1000-4999 children (59 programs)
500-999 children (78 programs)
200-499 children (135 programs)
<200 children (78 programs)
DRS Outcomes by Program Size
40%
78%
100%
48%
72%
20%
12%
0%
43%
19%
40%
7%
5%
9%
HS, EHS, and MSHS (5 programs)
HS & EHS (169 programs)
Migrant/Seasonal Head Start (3 programs)
Early Head Start (21 programs)
Head Start (158 programs)
DRS Outcomes by Types of Grants Held

Competition Outcomes for Programs by Population Density
86%
83%
100%
75%
79%
77%
68%
14%
10%
19%
10%
15%
22%
7%
6%
9%
9%
8%
Low and High Density (7 programs)
Low, Medium, and High Density (30 programs)
Low Density (1 program)
Low and Medium Density (16 programs)
Medium Density (58 programs)
Medium and High Density (47 programs)
High Density (190 programs)
DRS Outcomes by Population Density of Counties Served
Grant Restored in Full or In Part Grant Lost or Relinquished Grant Competed Again
Rural-Urban Continuum Codes
High
Density
1 Metro - Counties in metro areas of 1 million population or more
2 Metro - Counties in metro areas of 250,000 to 1 million population
3 Metro - Counties in metro areas of fewer than 250,000 population
Medium
Density
4 Nonmetro - Urban population of 20,000+, adjacent to a metro area
5 Nonmetro - Urban population of 20,000+, not adjacent to a metro area
6 Nonmetro - Urban population of 2,500-19,999, adjacent to a metro area
7 Nonmetro - Urban population of 2,500-19,999, not adjacent to a metro area
Low
Density
8 Nonmetro - Completely rural or < 2,500 urban population, adjacent to a metro area
9 Nonmetro - Completely rural or <2,500 urban population, not adjacent to a metro area

Outcomes for Communities
• In addition to examining the experience of the grantees going into competition, it is important to examine the impact on communities
• Because the number of awards made may be different than the number of grantees in competition analyses of awards are conducted separately from analyses of grantees entering DRS
• Overall, between 72 and 81% of awards for each cohort have gone to incumbent grantees or delegates and the majority of the rest have gone to other established Head Start or Early Head Start providers
65%
80%
68%
54%
9%
1%
4%
16%
19%
11%
18%
25%
7%
9%
8%
5%
All Cohorts (419Awards)
Cohort Three (104Awards)
Cohort Two (136Awards)
Cohort One (179Awards)
Competition Outcomes for Communities
Existing Grantee Existing Delegate Other Established HS/EHS Provider Provider New to Head Start

Broad Effects on Head Start
• Changing levels of quality– Decreasing deficiencies, increasing CLASS scores– On-going evaluation about program behavior– No data available about changes in particular communities
• New grantees– 29 total, only 15 awarded before this past summer– Out of 29, 15 school systems and 14 non-profits
• Competition and morale– Competition with former friends and partners– Constant stress across all programs– Focus on compliance rather than innovation or research
• Lessons for Local Design– Birth to Five flexibility

Conclusions
Over the first three years of implementation of the Designation Renewal System, about a quarter of Head Start, Early Head Start, and Migrant/Seasonal Head Start grantees entered competition, and the majority of these grantees demonstrated through the competitive process that they were the best organizations in their communities to provide Head Start services to children and families.
• The Designation Renewal System does not yet fully meet Congressional intent of targeting competition at struggling programs.
• Basic reforms are needed to make the Designation Renewal System consistent, reasonable, and predictable.
• Conceptual reforms are needed to support programs in working toward high-quality, not compliance.

Symposium Recommendations
While a number of issues were discussed over the course of the symposium, these were the two strongest recommendations that garnered widespread agreement:
1. Rather than have moving targets from year to year, the thresholds for required competition due to CLASS should be increased to levels reflective of minimum quality requirements and the 10% trigger should be removed. Then thresholds should be revisited every five years and updated based on data collected by the Office of Head Start.
– Would these be reasonable? 5.5 for Emotional Support, 5 for Classroom Organization, and 2.5 for Instructional Support. They would be above the national averages for each domain in studies of early childhood and pre-K settings conducted by the designers of the CLASS tool.
2. For grantees with deficiencies, the Office of Head Start should establish a review committee to examine whether those issues are (1) addressed immediately by a program's systems, (2) quickly addressed and not repeated, (3) systemic or nonsystemic, and (4) minor to severe. During this process grantees should be able to provide context and insight about the concern. Based on the findings of the review committee, programs should be issued corrective action plans and required to compete if the corrective action is not completed; if the issue is repeated; or if the issue is truly systemic or severe.

Want to share Analysis of the Designation Renewal System: Cohorts One to Three with colleagues at home? Find it online at go.nhsa.org/DRSanalysis.
Has your program been through the Designation Renewal System or are you preparing to compete? Join NHSA’s DRS Listserv to support other grantees and continue today’s conversations!
Contact Emmalie at [email protected].

NORC Project• Originated by the Region V Head Start Association,
supported by Region V, NHSA, the Ford Foundation, and the Rainin Foundation
• Goal: to learn from parent narratives about Head Start’s most valuable contributions to their families, and use those themes to create a survey or assessment tool to measure engagement and effects with future families
• Pilot testing of the survey tool is complete• Questionnaire and web portal are nearly complete• A sample of programs across the country have been asked
to help by gathering 5-10 parent narratives each• Stay tuned, and please participate!

Discussion & Questions
Want to read and share Analysis of the Designation Renewal System: Cohorts One to Three? Find it online at go.nhsa.org/DRSanalysis.
Stay in touch!Emmalie DropkinDirector of Policy, Data, and [email protected].