using logistic regression to predict retention at a ... · using logistic regression to predict...
TRANSCRIPT
Using Logistic Regression to Predict
Retention at a Technical College
Koji Fujiwara and Douglas Olney
Office of Institutional Research and Effectiveness
Bemidji State University & Northwest Technical College
October 28, 2011

2
About Northwest Technical College (NTC)
Northwest Technical College grew very quickly since 2004 – but now has stabilized.
Fall 2004 Headcount = 794
Fall 2010 Headcount = 1,420
NTC and Bemidji State University (BSU) share our president and some offices and services such as Resident Housing, Finance Division, Student Services, Institutional Research, etc.
NTC has an open enrollment policy.
2

3
Fall Semester Headcount
1,217
1,373
1,604
1,420
0
200
400
600
800
1,000
1,200
1,400
1,600
1,800
Fall 07 Fall 08 Fall 09 Fall 10
Headcount
Source: ISRS ST_TERM_DATA 30th day
4
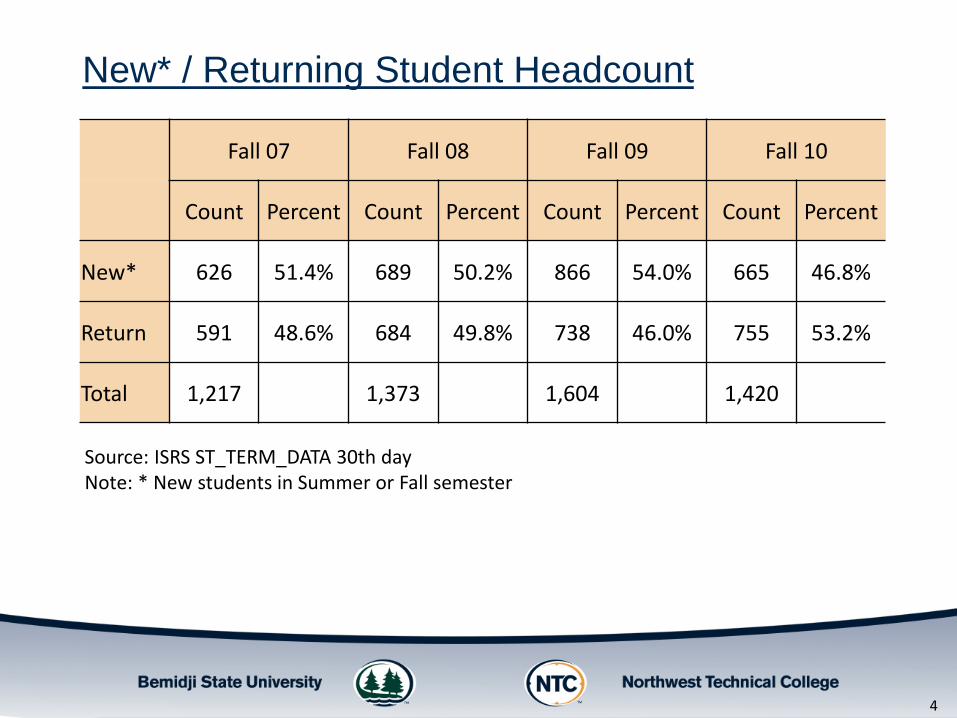
New* / Returning Student Headcount
Source: ISRS ST_TERM_DATA 30th day Note: * New students in Summer or Fall semester
Fall 07 Fall 08 Fall 09 Fall 10
Count Percent Count Percent Count Percent Count Percent
New* 626 51.4% 689 50.2% 866 54.0% 665 46.8%
Return 591 48.6% 684 49.8% 738 46.0% 755 53.2%
Total 1,217 1,373 1,604 1,420
5
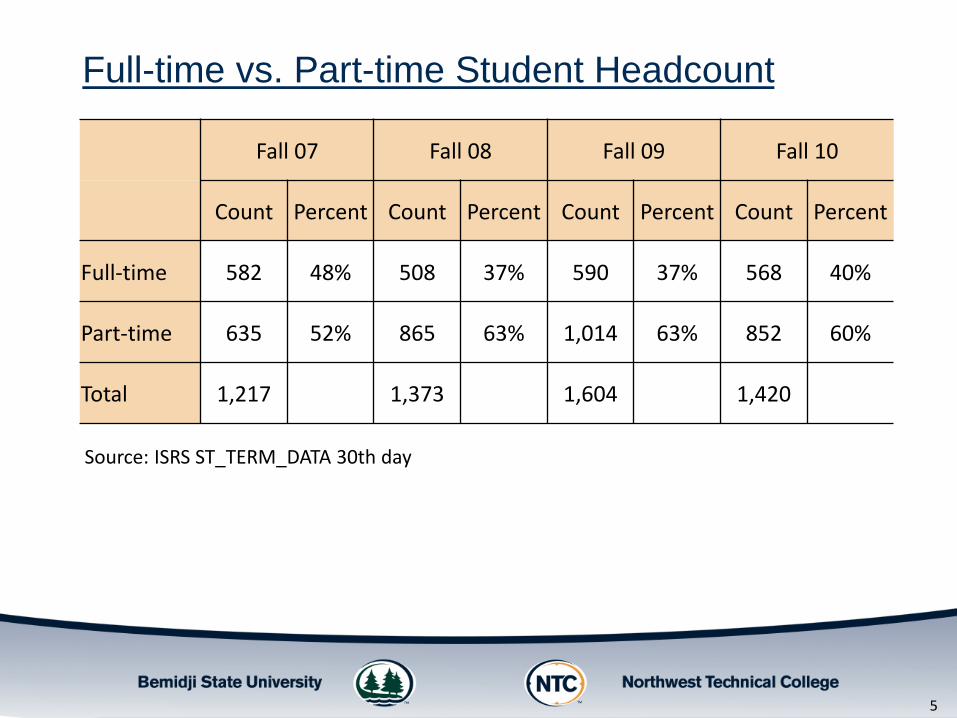
Full-time vs. Part-time Student Headcount
Fall 07 Fall 08 Fall 09 Fall 10
Count Percent Count Percent Count Percent Count Percent
Full-time 582 48% 508 37% 590 37% 568 40%
Part-time 635 52% 865 63% 1,014 63% 852 60%
Total 1,217 1,373 1,604 1,420
Source: ISRS ST_TERM_DATA 30th day

6
Student FTE vs. Course Location
Fall 07 Fall 08 Fall 09 Fall 10
FTE Percent Count Percent Count Percent Count Percent
On-campus 655.3 84.1% 573.4 77.1% 662.6 77.2% 584.2 71.4%
Off-campus 123.8 15.9% 170.4 22.9% 196.0 22.8% 234.4 28.6%
Total 779.1 743.8 858.6 818.6
Note: FTE = Undergraduate Semester Hours / 15.

7
The Purpose of this Study
Using student’s “Success Status” (to be explained later) in stead of retention status
Including “transfer students” in the study
Introducing student’s “College Ready” status by using the Accuplacer tests results
Sentence Skills (≥ 86)
Reading Comprehension (≥ 78)
Arithmetic Test (≥ 65)
Considering when students registered on their first courses
Registered after August 1st: Late Registration

8
DATA
Fall 2009 first-year, full-time, degree seeking students data
In this study, we included first-time regular students and transfer students whose attempted transferred credits ≤ 6.
# regular students = 168
# transfer students = 112
# total students = 280

9
Target Variable
Target Variable: Second Fall Success
Define “Second Fall Success = Success” if
At the beginning of 2nd Fall
Students came back to NTC (retained) or
Students transferred out to another institution (transferred) or
Students completed the program (graduated)
In our data,
# students came back = 122
# students transferred out = 12
# students graduated = 46 Success Rate = 64.3%

10
The Reasons to Use Success Status
In standard retention study,
the students who went to another institution
the students who graduated
were excluded.
NTC offers 19 one-year certificate programs (19/55 total programs).
If we conduct a standard retention study, we need to throw away 58 samples (21% of the data).
Retention Rate = 55%

11
The Reasons to Include Transfer Students
# Attempted Transfer Credits to NTC vs. # Transfer Students
# Credits 0 credit 1 credit 2 credits 3 credits 6 credits
# Students 98 7 1 4 2
Were they well experienced college students?
Were they already at risk?
There was no difference in the student’s success status for “Regular” students and “Transfer” students.
About 50% of “Transfer” students were categorized as underprepared.
About 30% of “Transfer” students registered after Aug. 1st (Late Registration).

12
Logistic Regression – Initial Predictors
1. Age
2. Gender (Female/Male)
3. College Ready Status (Ready/Underprepared)
• if a student needed to take at least one college readiness course, then he/she was categorized as “Underprepared” student.
4. Pell Status (Yes/No)
5. Enrolled Semester GPA
6. Enrolled Semester Credit Completion Rate
7. Late Registration Status (before or after August 1st)

13
Descriptive Statistics for Numerical Predictors
SECOND FALL SUCCESS
Not Successful Successful
Mean SEM Mean SEM
Age 24.54 0.90 26.40 0.81
GPA *** 2.49 0.11 3.27 0.50
Completion *** 41.47 3.99 93.07 1.19
Note: *** p < 0.001, t-test; SEM = Standard Error of Mean
Effect Size
GPA: Eta-squared = 0.19, large effect
Completion: Eta-squared = 0.46, large effect
“Age” was excluded from the predictor list.

14
Descriptive Statistics for Categorical Predictors
SECOND FALL SUCCESS
Not Successful Successful
Count Row N % Count Row N %
Gender Female 48 37.2% 82 62.8%
Male 52 34.7% 98 65.3%
College Ready **
Ready 30 26.3% 84 73.7%
Not Ready 70 42.2% 96 57.8%
PELL * No 24 26.7% 66 73.3%
Yes 76 40.0% 114 60.0%
Late Registration ***
No 60 29.7% 142 70.3%
Yes 40 51.3% 38 48.7%
Note: * p < 0.05, ** p < 0.01, *** p < 0.001, Chi-square Test & Fisher’s Exact Test.

15
Descriptive Statistics for Categorical Predictors
Interpretations College Ready: Underprepared students were less likely to succeed
than college ready students (Odds Ratio = 0.49).
PELL Status: The students with PELL status were less likely to succeed than the students without PELL status (Odds Ratio = 0.55).
Late Registration: The students whose first registration happened after Aug. 1st were less likely to succeed than the students who first registered after Aug. 1st (Odds Ratio = 0.40).
Note: “Odds Ratio” is the ratio of the odds of an event occurring. “Gender” was excluded from the predictor list.

16
Final Predictors
1. College Ready Status (Ready/Underprepared)
2. Pell Status (Yes/No)
3. Enrolled Semester GPA
4. Enrolled Semester Credit Completion Rate
5. Late Registration Status (before or after August 1st)

17
Stepwise Logistic Regression
We entered all the predictor variables into the model and found the most important predictors using a stepwise logistic regression with forward selection method.
95% Confidence Interval
Odds Ratio Lower Upper P-value
GPA 2.24 1.35 3.71 < 0.0001
Credit Comp. Rate
1.04 1.03 1.06 < 0.0001
Sample Interpretation
GPA: The students were 2.24 times more likely to be successful as their 1st semester college GPA increased by 1 point.

18
Final Model with GPA and Credit Comp. Rate
The final logistic model with GPA and Credit Completion Rate correctly predicted 84% of the sample data.
Sensitivity: 94% Prob. that the model classified as “Successful” when given to a
group of students who were “Successful”
Specificity: 55% Prob. that the model classified as “not Successful” when given to a
group of students who were not “Successful”
The Area Under an ROC Curve: 0.82 ROC = Receiver operating characteristic
The value of 0.82 indicated this is a good model.

19
Model Prediction: Success Prob. ≥ 50%

20
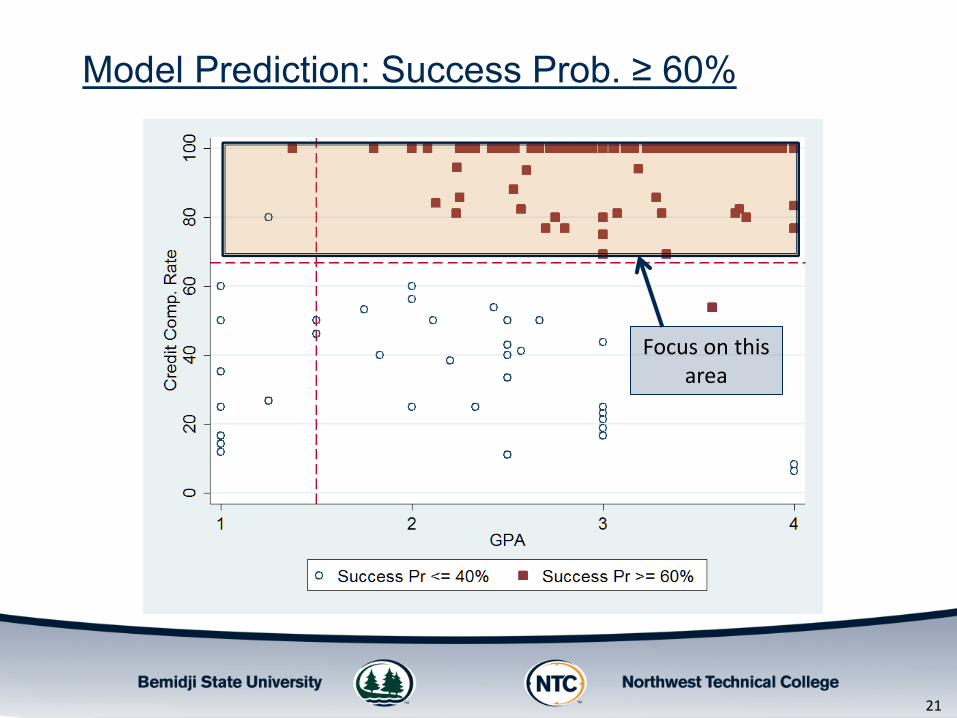
Model Prediction: Success Prob. ≥ 60%
21
Model Prediction: Success Prob. ≥ 60%
Focus on this area

22
Model for Credit Comp. Rate
The student’s 1st semester credit completion rate was analyzed using a
2 (success status: successful vs. not successful) ×
2 (college ready status: ready vs. underprepared) ×
2 (late registration status: regular vs. late)
ANOVA.

23
3-way Interaction (F(1, 272) = 3.73, p = 0.054)
0
10
20
30
40
50
60
70
80
90
100
Standard Reg Late Reg Standard Reg Late Reg
Underprepared College Ready
Not Successful SuccessfulCredit Comp. Rate

24
3-way Interaction (F(1, 272) = 3.73, p = 0.054)
0
10
20
30
40
50
60
70
80
90
100
Standard Reg Late Reg Standard Reg Late Reg
Underprepared College Ready
Not Successful SuccessfulCredit Comp. Rate
No interaction
No diffs
***
Late Reg. × Success

25
3-way Interaction (F(1, 272) = 3.73, p = 0.054)
0
10
20
30
40
50
60
70
80
90
100
Standard Reg Late Reg Standard Reg Late Reg
Underprepared College Ready
Not Successful SuccessfulCredit Comp. Rate
Focus on these students as well.

26
Results
3-way Interaction
2-way Interactions Success × Late Registration
In “not successful” group, Standard Reg. > Late Reg. But, no diff. in “Successful” group.
Success × College Ready
In “not successful” group, Ready > Underprepared. But, no diff. in “Successful” group.
Main Effects Success: Successful > Not Successful
Late Registration: Standard > Late
College Ready: Ready > Underprepared

27
Summary and Conclusion
In this study, we included transfer students because we believed some of them were already at risk when they transferred to NTC.
We also used the student’s success status instead of retention status because we wanted to use the information from the students who completed the program and the students who transferred out.
A stepwise regression revealed that 1st semester credit completion rate and its GPA were the factors for student’s success status.

28
Conclusions (contd.)
The final model (based on the graphics) suggested that the credit completion rate might influence student’s success status.
We assessed a 3-way ANOVA for the credit completion rate and found that student’s late registration status might be the factor.

29
Future Research
The most updated data will be available next month.
We will get the similar data from our sister institutions.
Mixed Model?
Use different cut-off date for “Late Registration”
June 1st