using laptops to facilitate middle school science learning
TRANSCRIPT
ES
EA
RC
HR
IEF
Sarah E. Wintle Alexis M. Berry
Maine Education Policy Research Institute in collaboration with
Bristol Consolidated School and
Maine International Center for Digital Learning University of Southern Maine
Using Laptops to Facilitate Middle School Science Learning:
The Results of Hard Fun
Copyright © 2009, Center for Education Policy, Applied Research, and Evaluation.
Published by the Center for Education Policy, Applied Research, and Evaluation (CEPARE) in the College of Education and Human Development, University of Southern Maine and the Maine International Center for Digital Learning (MICDL). CEPARE provides assistance to school districts, agencies, organizations, and university faculty by conducting research, evaluation, and policy studies. In addition, CEPARE co‐directs the Maine Education Policy Research Institute (MEPRI), an institute jointly funded by the Maine State Legislature and the University of Maine System. The Maine International Center for Digital Learning is designed to provide information, research, and technical assistance in the field of ubiquitous 1:1 digital education to educators and policy makers around the world. Statements and opinions by the authors do not necessarily reflect a position or policy of the Maine Education Policy Research Institute, nor any of its members, and no official endorsement by them should be inferred. The University of Southern Maine does not discriminate on the basis of race, color, religion, sex, sexual orientation, national origin or citizenship status, age, disability, or veteran’s status and shall comply with Section 504, Title IX, and the A.D.A. in employment, education, and in all other areas of the University. The University provides reasonable accommodations to qualified individuals with disabilities upon request.
A Center of the College of Education and Human Development
99 School Street, Gorham, Maine 04038(207) 780‐5044; FAX (207) 228‐8143; TTY (207) 780‐5646
www.cepare.usm.maine.eduA member of the University of Maine System

RESEARCH BRIEF
Using Laptops to Facilitate Middle School Science Learning:
The Results of Hard Fun
Prepared by:
Alexis M. Berry Research Assistant
Sarah E. Wintle
Policy Research Analyst
Center for Education Policy, Applied Research, and Evaluation
University of Southern Maine
in collaboration with
Bristol Consolidated School

Table of Contents
Executive Summary ........................................................................................................................................... i
Introduction .......................................................................................................................................................... 1
Background ........................................................................................................................................................... 1
Methodology ......................................................................................................................................................... 2
Results ..................................................................................................................................................................... 6
Summary ................................................................................................................................................................ 10
References ............................................................................................................................................................. 12
Appendices
Appendix A: Pre‐assessment instrument ................................................................................................. 13
Appendix B: Post‐assessment instrument ............................................................................................... 22
Appendix C: Retention instrument ............................................................................................................. 32
Appendix D: Daily teacher’s log .................................................................................................................... 36
Appendix E: Project timeline and tasks .................................................................................................... 37
Appendix F: Examples of paper diagram projects ............................................................................... 38
Appendix G: Examples of podcast animation projects ....................................................................... 39
Authors’ Biographic Sketches ....................................................................................................................... 40

i
Executive Summary
Over the past decade, the amount of technology available to students has increased considerably. Internet resources and educational computer software have become more readily available to students within their classrooms. As a result of these changes, many educators have begun to ask how to implement aspects of these technologically‐advanced tools and resources into their curriculums. In addition, many districts are actively encouraging teachers to adopt and put into practice technology‐based resources and applications.
As the Maine Learning Technology Initiative (MLTI) enters its seventh year of
implementation, the need to expand upon the current research is essential. In an effort to gather information about implementing technology within various educational contexts, the Center for Education Policy, Applied Research, and Evaluation (CEPARE) at the University of Southern Maine collaborated with a science teacher from Bristol Consolidated School to conduct an action research study to determine how the use of technologically‐advanced tools and resources might affect academic achievement and student engagement in the science classroom.
Pre‐ and post‐assessments illustrated greater comprehension levels among the
students who were assigned to complete a technology‐rich project in comparison to students who were asked to complete a more traditional science project. In addition, a retention assessment revealed greater retention of information among those who had completed the technology‐rich project. Lastly, student engagement appeared to be higher among those who were working directly with their laptops to complete their science projects. The post‐assessment and the student interviews revealed that many of the students found the technology‐rich project to be more challenging and time‐consuming; however, many of the students also agreed that the project was more fun and engaging. These statements are illustrative of Seymour Papert’s concept of “hard fun”, by which Papert describes the idea that children enjoy being challenged and that they have greater learning outcomes when they are given the opportunity to actively construct new knowledge in an exciting way.

1
Using Laptops to Facilitate Middle School Science Learning:
The Results of Hard Fun
“It took more effort, but it was more fun”
Alexis M. Berry Sarah E. Wintle
Introduction
Since the fall of 2002, the Maine Learning Technology Initiative (MLTI) has provided
all 7th and 8th grade students in the state of Maine, as well as their teachers, with laptop
computers. MLTI started as a vision of former Maine Governor Angus King to transform the
way Maine had educated students in the past and to prepare students for a changing, more
technologically‐advanced world. As the MLTI laptop program has now entered its seventh
year of implementation, the legislature, educators, and researchers alike are curious to
know more about how this technology may be successfully facilitated within various
classroom settings. In particular, many individuals are curious about the impact that the
MLTI program may have on academic achievement and on student engagement within the
classroom.
In order to expand upon the current research and to gather information about
implementing technology within various educational contexts, the Center for Education
Policy, Applied Research, and Evaluation (CEPARE) at the University of Southern Maine
(USM) has collaborated with a science teacher from Bristol Consolidated School, Kevin
Crafts, and his two eighth grade science classrooms. This collaboration was organized to
conduct an action research study in an effort to measure the impact of MLTI integration on
student engagement and academic achievement. As a teacher who believes in the potential
benefits of implementing technology within the classroom, Crafts saw this project as an
opportunity to examine the impacts of his program. This report describes the collaborative
action research project undertaken by Kevin Crafts and CEPARE to help evaluate the
applications of the MLTI laptop program in a science classroom.
Background
Beginning in 2002, the MLTI program provided laptops to all 7th and 8th grade
students and teachers in the state of Maine. In addition, Airport wireless networking,
Internet access, and a variety of educational software has been provided. Furthermore,
2
technical assistance and professional development for effectively integrating the laptops
into the classroom curriculum have been provided to educators on an ongoing basis.
Throughout the development of the MLTI program, research has been conducted in
order to provide an ongoing evaluation of the program’s efficacy and value. For example, in
October 2007, CEPARE published a research brief that described the impact of MLTI on
students’ writing skills (Silvernail & Gritter, 2007). In March 2008, CEPARE published a
study that described Maine’s Impact Study of Technology and Mathematics (MISTM), which
examined how professional development might help to improve middle school mathematics
performance (Silvernail, 2008). Additionally, during the fall of 2007, CEPARE worked
collaboratively with Sanford (Maine) Junior High School in an effort to determine whether
or not an intervention to improve students’ website evaluation skills was effective
(Pinkham, Wintle, & Silvernail, 2008). All of these studies have shown that MLTI has been
successful in improving student learning.
In a continuing effort to expand the research on MLTI and student performance,
more information about how this technology may be used in various educational contexts
needs to be gathered. This research project, in particular, focuses on how the MLTI laptop
program may be implemented within a science classroom. More specifically, this report
describes an action research study designed to answer the following research question:
Is the use of the laptops to create narrated animations more effective than having students create traditional paper diagrams and reports in helping students learn the concepts related to Earth’s axis angle?
Methodology
Initial project planning meetings took place in June 2008. During these meetings,
CEPARE staff, Crafts, and Bristol Consolidated School principal Jennifer Ribeiro met to
discuss project goals and plans.
Goals of the Project
The primary goal of this research project was to examine how the MLTI program,
more specifically, laptop computers, might impact the academic achievement and general
classroom engagement of students within a science classroom. In particular, student
engagement, student comprehension of the material, and student retention of the material
would be observed. Crafts chose the science unit during which the observations and data
collection would occur. He planned to introduce the concept of Earth’s axis angle and the
3
cause for the seasons to both of his eighth grade science classes. One of his classes (Control
Group) would be taught in the traditional manner and would be asked to complete a
traditional paper diagram and report as a final project. The other class (Experimental
Group) would be taught the material in the traditional manner; however, they would have
access to interactive, educational websites for their final project and would be asked to
turn in a narrated animation podcast.
In order to examine how the technology would impact academic achievement and
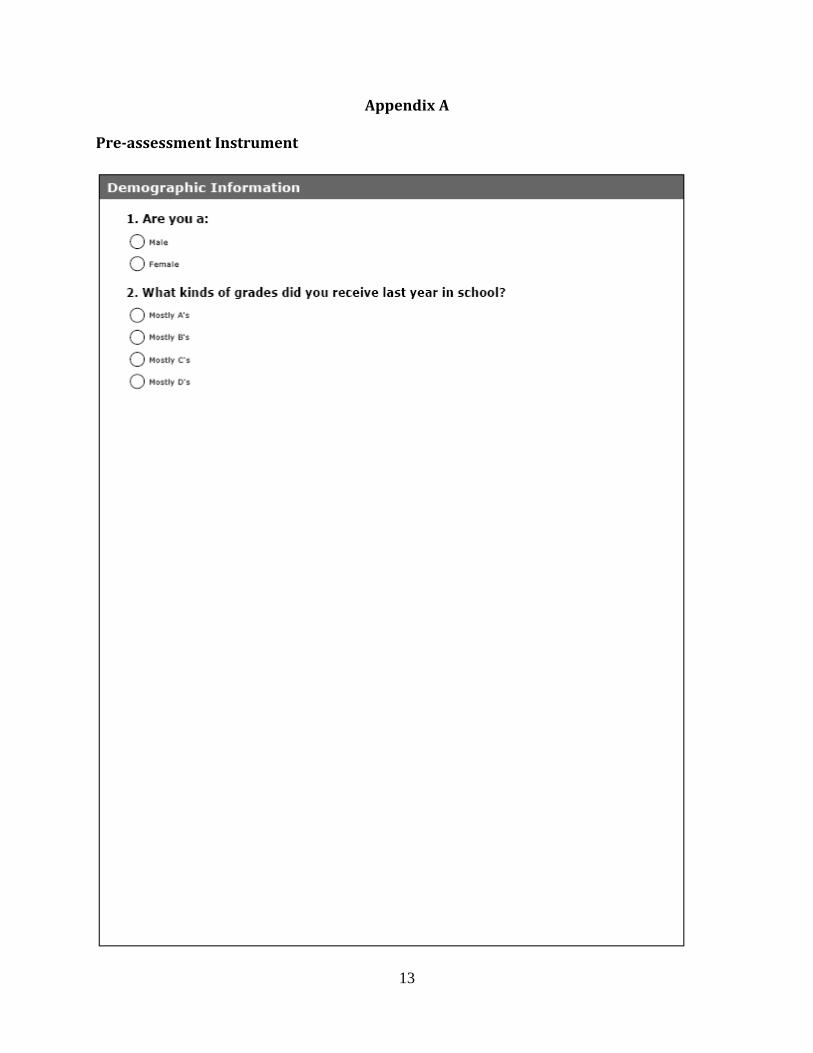
general classroom engagement, a number of measures were used in the study. First, a pre‐
assessment was administered to all of the students in order to establish a benchmark
comprehension level of axis angle concepts. This pre‐assessment measured
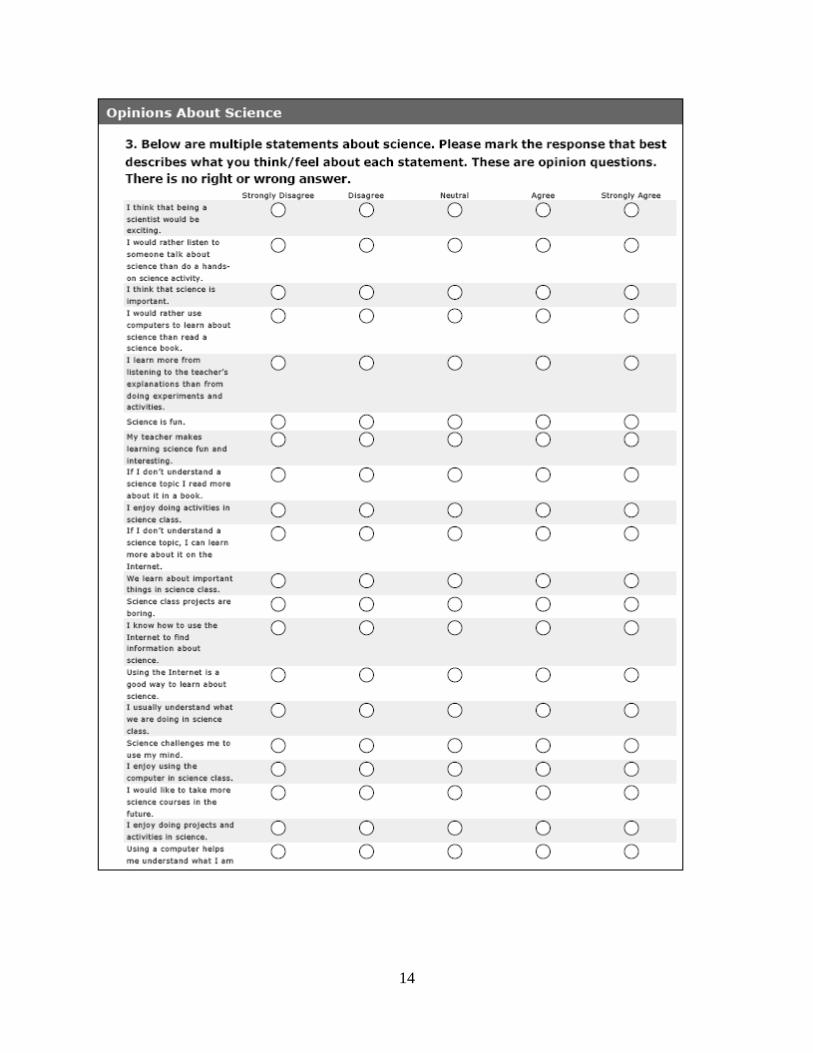
comprehension, as well as attitudes about science, comfort‐level and skill‐level with regard
to making animations, and 21st Century skills. In addition, Crafts was asked to complete
daily teacher logs of classroom activities throughout the study. A post‐assessment
measured student comprehension and contained several opinion questions, which asked
students to explain what they liked and disliked about completing their science projects. A
retention assessment was also administered roughly a month after Crafts had completed
the unit in order to measure the students’ retention of learning. This assessment contained
questions which were similar to those asked in the pre‐ and post‐assessments, but were
not identical.
In addition to the assessments and the teacher log, observations and interviews
were conducted with both Crafts and his students. These were conducted in an effort to
gather more information about how the technology was being introduced to the students,
to measure student engagement levels, and to gather a better understanding of the level of
student interest regarding the projects.
Project Staff
Kevin Crafts, the science teacher at Bristol Consolidated School worked
collaboratively with CEPARE staff to complete the research project goals. CEPARE staff
assisted with creating the assessments and daily teacher logs, as well as with conducting
interviews, observations, and data analysis.
4
Experimental and Control Groups
In this research project, Crafts’ two eighth grade science classes served as the
Experimental and Control Groups. After teaching both groups how to create animations on
their laptops during a previous science unit, Crafts began teaching the unit about Earth’s
axis angle. Both classes were similar in terms of prior achievement and both of the classes
received similar instruction with regard to the concepts related to the axis angle of the
Earth; however, the final project assignments differed.
Group A, which consisted of 13 students, was assigned as the Control Group. This
group received traditional classroom instruction during the axis angle unit and was
expected to develop a paper diagram and a report, summarizing their learning.
Group B, which consisted of 12 students, was assigned to be the Experimental
Group. This group was given the same classroom instruction during the axis angle unit;
however, during the time they were given to complete their final projects, they were
provided access to educational websites, such as ExploreLearning.com. In addition, they
were expected to develop a narrated animation podcast as a final project.
Both of Crafts’ classes met once per day for a 40 minute duration. Each class was
given the same amount of time to work on the project during class and the same amount of
time to work on the project at home. Each group was given 3 days to work on the project
during class time and roughly three weeks to work on the project at home. The final
projects for the axis angle unit for both groups had similar expectations of the students:
students were required to create an image of the earth as it revolves around the sun,
demonstrating how the axis tilt causes changes in seasons.
Intervention
Although both Group A and Group B were introduced to the concepts of axis angles
by completing the same lab, using Styrofoam balls and a light bulb, their hands‐on final
projects differed. Group A was expected to complete a paper diagram that demonstrated
the Earth’s position as it revolved around the sun. In particular, the students were asked to
use a compass and a protractor to draw the Earth’s axis at the correct angle. In addition,
Group A was asked to draw the Earth with another, different axis angle to demonstrate
their understanding of the concept by completing another application. Throughout the
duration of the project, the students in Group A had access to the Internet via their laptop
5
computers; however, they were not formally directed to use any specific Internet
resources. Instead they were given atlases and books to use in order to find temperatures
within specific cities during various seasons.
Group B, the Experimental Group, was directed to complete a narrated animation as
a final project for this science unit. Similarly, Group B was expected to demonstrate the
Earth’s position as it revolves around the sun. In particular, they were expected to explain
how the Earth’s axis angle influences the seasons. This group was also expected to make a
change in the Earth’s axis angle in order to demonstrate their understanding of the concept
and the effect it would have on the seasons. Group B received access to educational
Internet resources, such as explorelearning.com.
Measures
Assessments:
The pre‐ and post‐assessments were designed by CEPARE staff in conjunction with
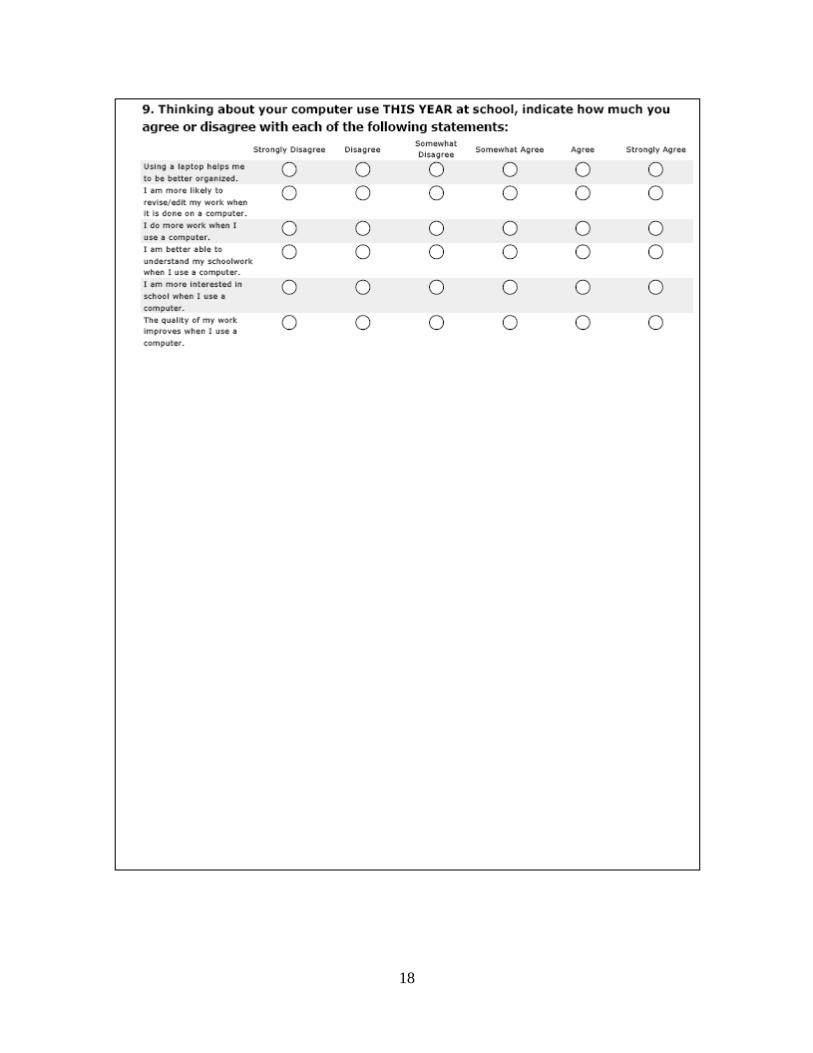
Crafts. Both the pre‐ and the post‐assessments were designed to measure the following:
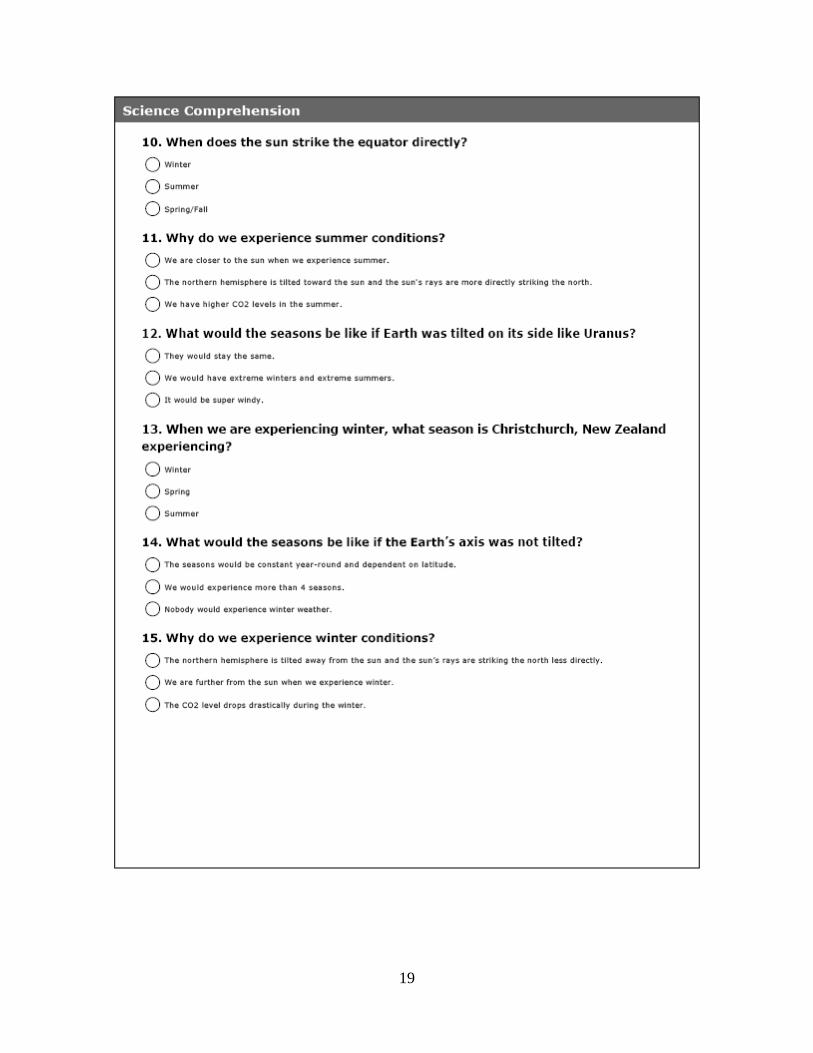
comprehension level of terminology and concepts related to the axis angle of the Earth,
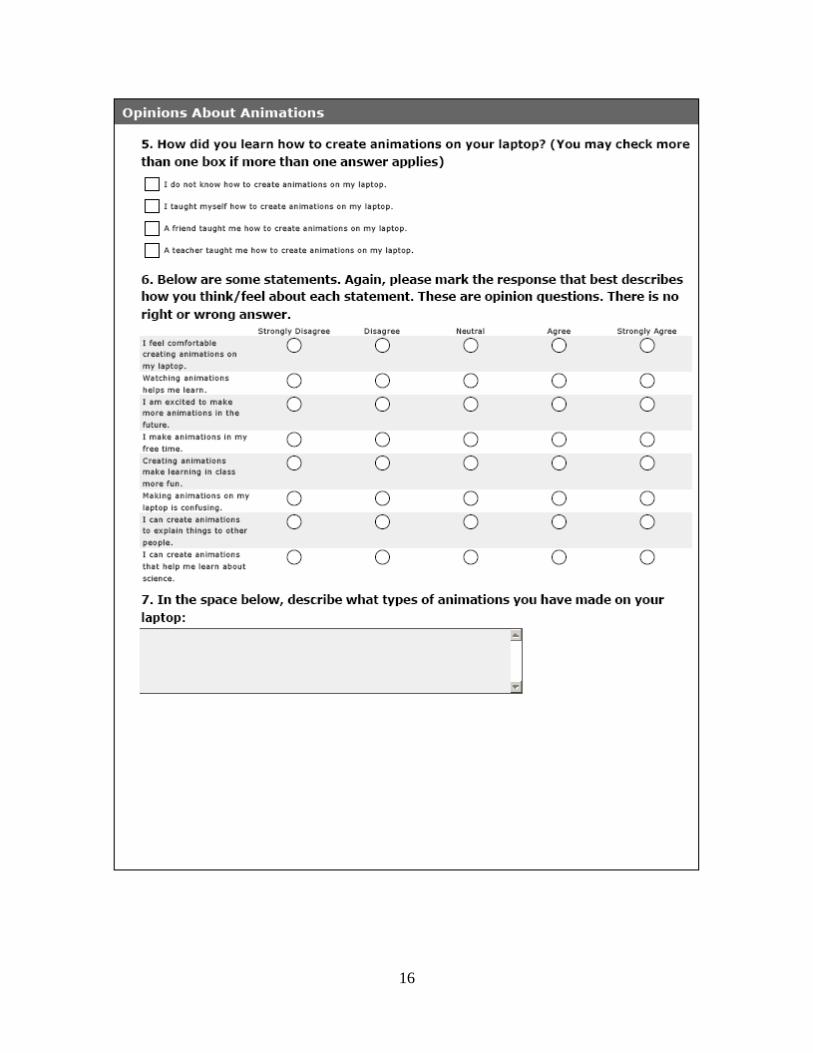
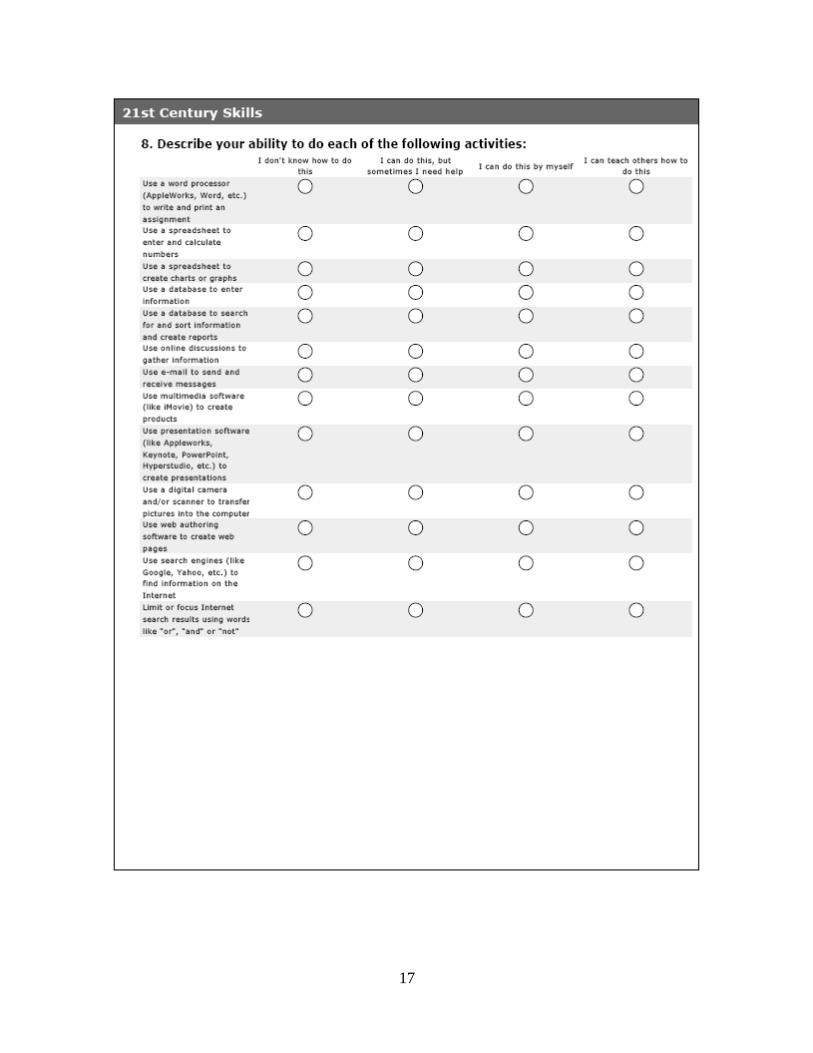
attitudes about science, comfort‐level and skill‐level in regard to making animations, and
21st century skills. The post‐assessment was designed to be nearly identical to the pre‐
assessment in order to compare possible changes within and between groups. In addition
to the information included in the pre‐assessment, the post‐assessment also included
questions to gather data about the students’ experiences and opinions about the axis angle
project. In particular, the students were asked to describe the most difficult part of their
project as well as the most fun part. All of the assessments were web‐based. As a result,
each child was able to complete the assessments on his/her own laptop during class time.
The pre‐assessment was administered before Crafts began introducing the axis angle unit.
The post‐assessment was administered after the axis angle unit had concluded and each
child had completed his/her project. A copy of these assessments can be found in
Appendices A and B.
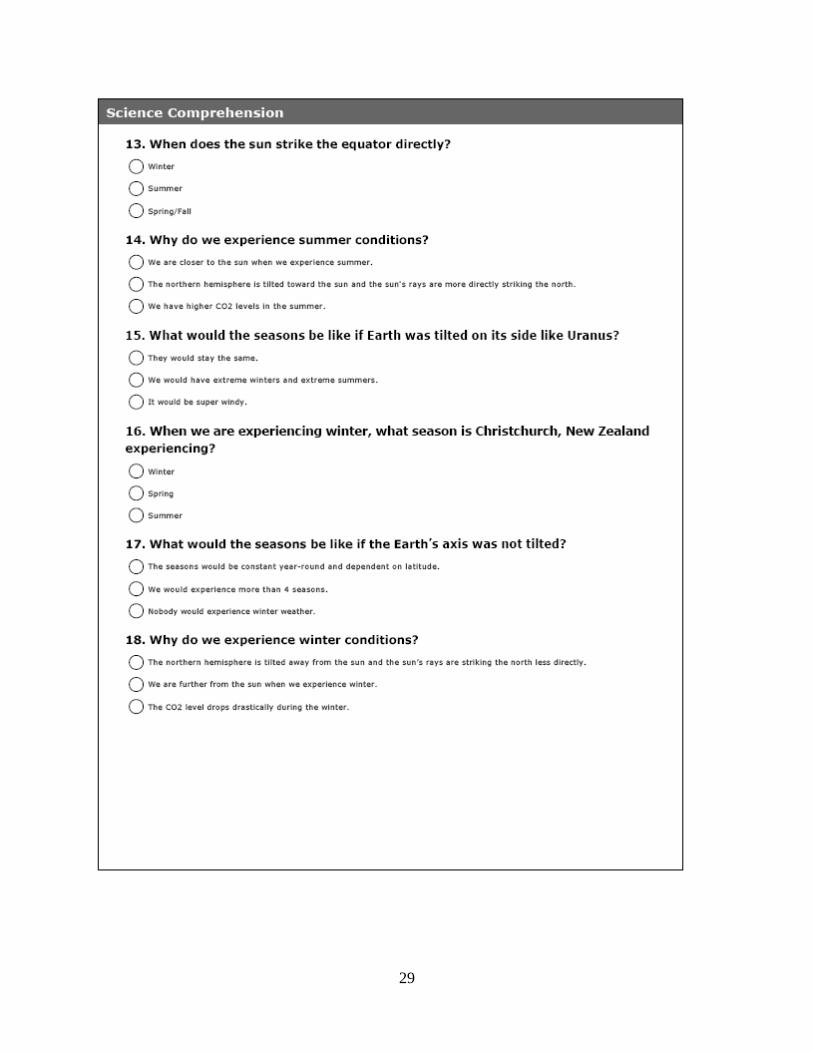
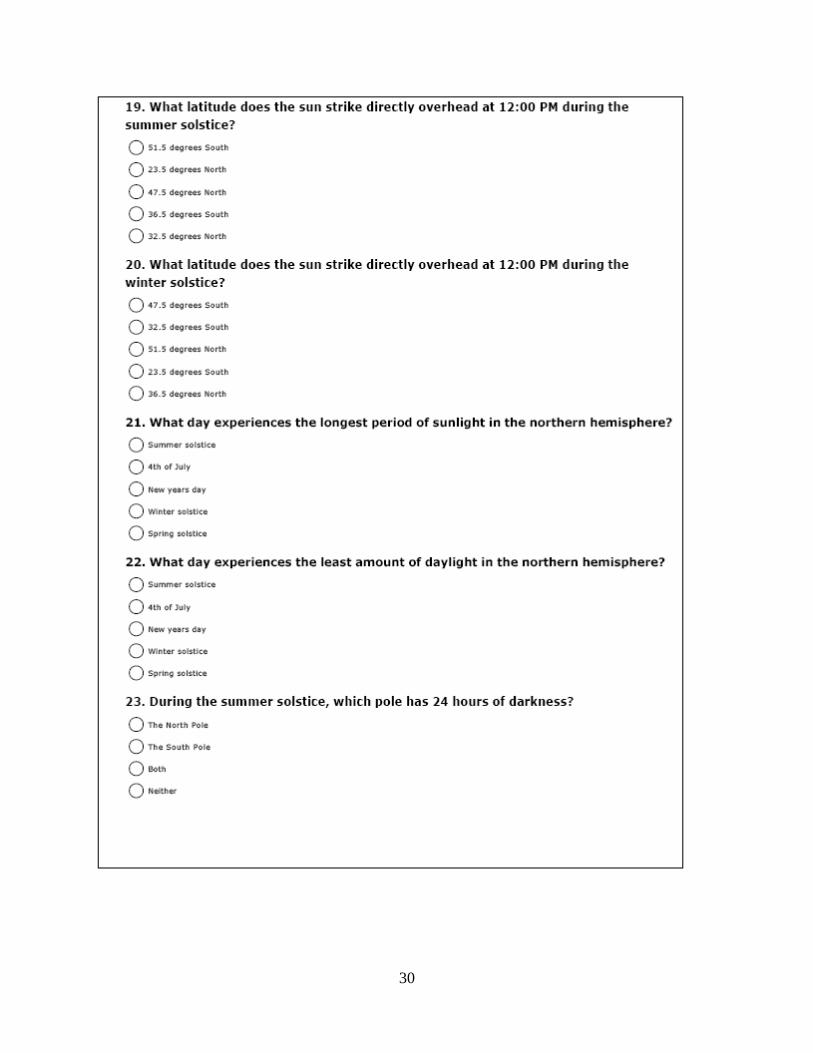
A third assessment was designed in order to measure the retention of learning over
a period of roughly one month, during which neither of the classes spent time covering the
axis angle concepts. This brief assessment consisted of 10 questions written by Crafts. The
questions were not identical to the questions asked in the pre‐ and post‐assessments;
6
however, they were designed to measure the comprehension of similar concepts. After
about one month had passed since the completion of the axis angle unit, Crafts asked his
students to complete the retention assessment. A copy of the retention assessment can be
found in Appendix C.
Daily Teacher’s Log:
In addition to the assessments used to gather data about the students, others
methods were also used. Crafts was asked to complete a Daily Teacher’s Log in order to
create a record of daily class activities, occurrences, difficulties, positive experiences, and
teaching outcomes. A copy of the Daily Teacher’s Log can be found in Appendix D.
Interviews:
A pre‐interview was conducted with Crafts before he began teaching the axis angle
unit, and a post‐interview was conducted with Crafts after the completion of the unit. These
interviews were intended to collect information about class demographics, student
engagement levels, challenges, and benefits of asking the students to complete the specific
projects. Finally, a web conference was conducted with two students from each group to
gather data about general attitudes, challenges, and benefits related to the projects.
Observations:
CEPARE staff conducted a classroom observation on the first day during which the
students in both classes were given class time to work on their final projects. This
observation was aimed at collecting information about student engagement. A partial‐
interval data recording form was used to collect information about on/off‐task behavior,
which included: manipulation of materials/websites unrelated to the assignment, talking to
peers or teacher about topic(s) unrelated to the assignment, putting head down on desk,
and being out of his/her seat for a reason unrelated to the assignment. Data on three
different students was collected in 15 second intervals for a period of 5 minutes each. Inter‐
observer agreement varied from 85% to 100% agreement.
Results
CEPARE Classroom Observations
Classroom observations were conducted on the first day that the students were
given an opportunity to work on their projects during class. A summary of the classroom
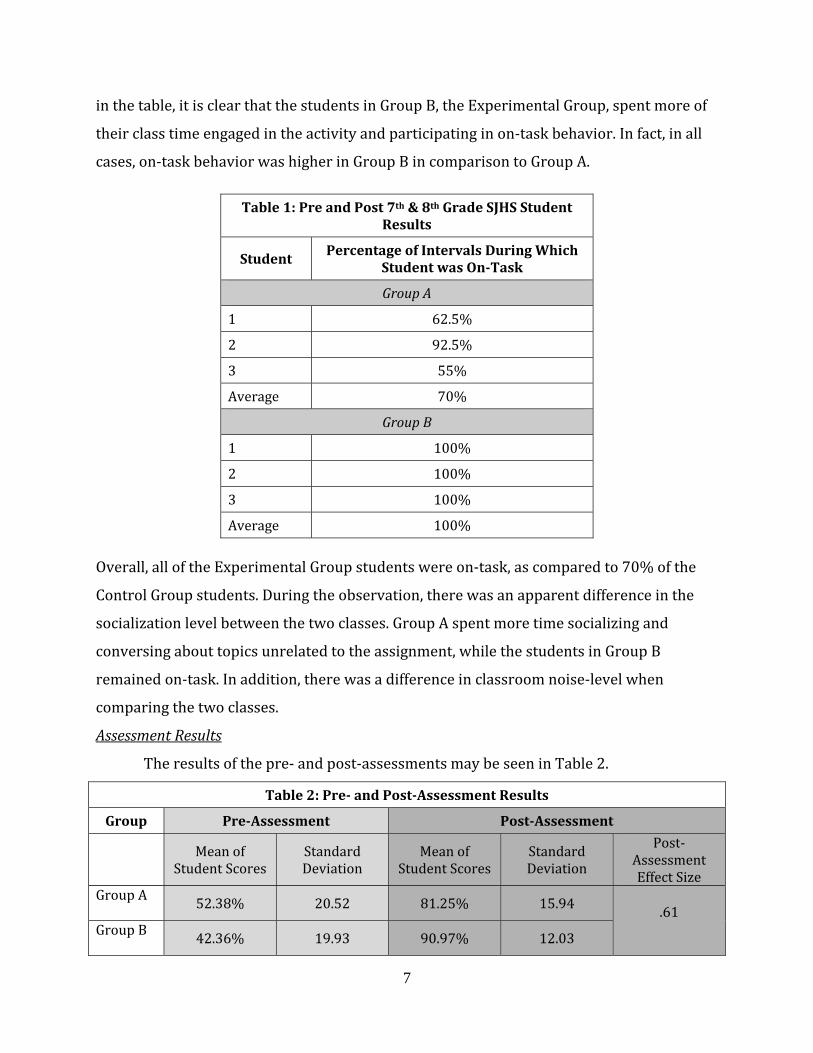
observations conducted by CEPARE staff may be found in the Table 1. As shown by the data
7
in the table, it is clear that the students in Group B, the Experimental Group, spent more of
their class time engaged in the activity and participating in on‐task behavior. In fact, in all
cases, on‐task behavior was higher in Group B in comparison to Group A.
Overall, all of the Experimental Group students were on‐task, as compared to 70% of the
Control Group students. During the observation, there was an apparent difference in the
socialization level between the two classes. Group A spent more time socializing and
conversing about topics unrelated to the assignment, while the students in Group B
remained on‐task. In addition, there was a difference in classroom noise‐level when
comparing the two classes.
Assessment Results
The results of the pre‐ and post‐assessments may be seen in Table 2.
Table 2: Pre and PostAssessment Results
Group PreAssessment PostAssessment
Mean of Student Scores
Standard Deviation
Mean of Student Scores
Standard Deviation
Post‐Assessment Effect Size
Group A 52.38% 20.52 81.25% 15.94
.61 Group B 42.36% 19.93 90.97% 12.03
Table 1: Pre and Post 7th & 8th Grade SJHS Student Results
Student Percentage of Intervals During Which
Student was OnTask
Group A
1 62.5%
2 92.5%
3 55%
Average 70%
Group B
1 100%
2 100%
3 100%
Average 100%
8
Table 2 provides a comparison between Group A and Group B in regard to the average of
students’ scores on both the pre‐ and post‐assessments. Based on the data displayed in
Table 2, the students in Group B answered more questions correctly than the students in
Group A on the post‐assessment. In fact, the average of the students’ scores in Group B
increased from 42.36% to 90.97%, while the student’s scores in Group A increased from
52.38% to only 81.25%. In addition, the Effect Size on the post‐assessment was .61,
indicating that the Experimental Group students scored approximately 2/3 of a standard
deviation above the Control Group students. Thus, academic achievement of the students in
the Experimental Group was greater in comparison to the students in the Control Group.
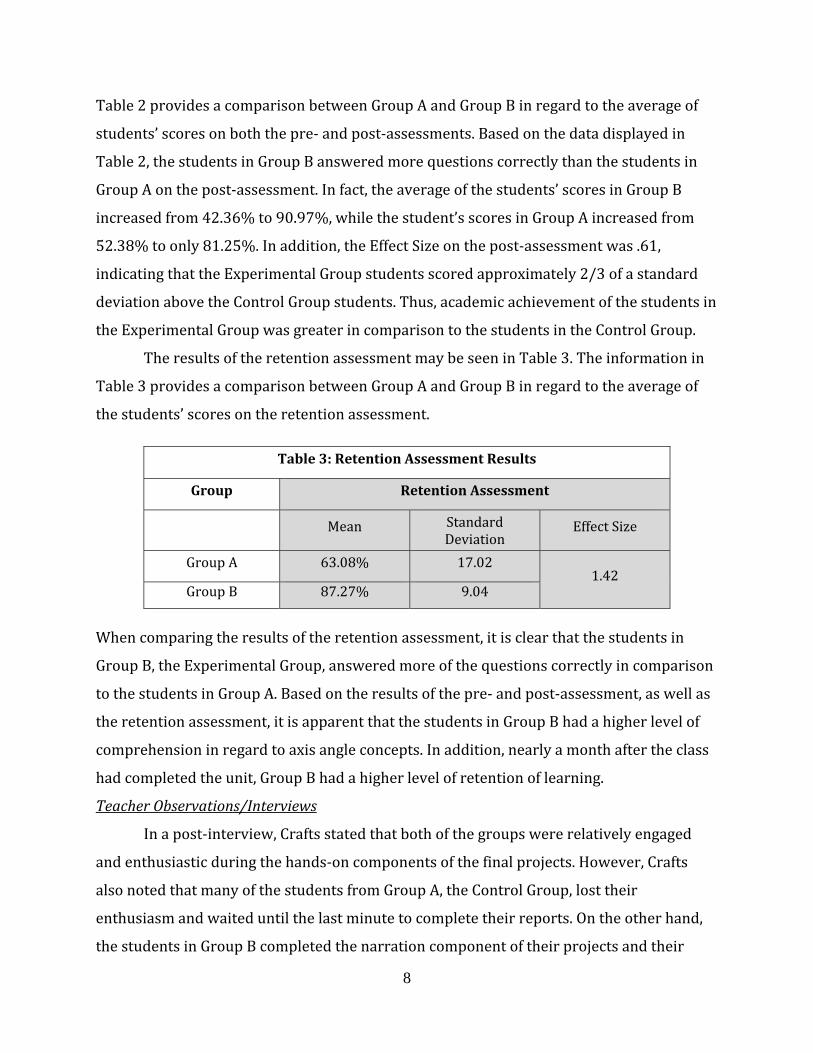
The results of the retention assessment may be seen in Table 3. The information in
Table 3 provides a comparison between Group A and Group B in regard to the average of
the students’ scores on the retention assessment.
Table 3: Retention Assessment Results
Group Retention Assessment
Mean Standard Deviation
Effect Size
Group A 63.08% 17.02 1.42
Group B 87.27% 9.04
When comparing the results of the retention assessment, it is clear that the students in
Group B, the Experimental Group, answered more of the questions correctly in comparison
to the students in Group A. Based on the results of the pre‐ and post‐assessment, as well as
the retention assessment, it is apparent that the students in Group B had a higher level of
comprehension in regard to axis angle concepts. In addition, nearly a month after the class
had completed the unit, Group B had a higher level of retention of learning.
Teacher Observations/Interviews
In a post‐interview, Crafts stated that both of the groups were relatively engaged
and enthusiastic during the hands‐on components of the final projects. However, Crafts
also noted that many of the students from Group A, the Control Group, lost their
enthusiasm and waited until the last minute to complete their reports. On the other hand,
the students in Group B completed the narration component of their projects and their
9
animations simultaneously, which appeared to keep the students engaged despite the
demand to gather and present detailed, scientific information. Crafts also stated that the
students in Group B benefited from the access to the educational websites. On
explorelearning.com, the students were able to view a variety of virtual labs. More
specifically, they were able to view interactive animations on the website that modeled
how the sun strikes the Earth at different times throughout the year.
There were, however, some challenges that Crafts faced while his students worked
on the animation podcast project. Crafts did not have a great deal of experience making
animations on the laptops. He stated in the pre‐interview that he was still in the process of
creating a practice animation and that he was hoping that in doing so he would run into
some of the same difficulties as his students would and as a result would be able to help
them. In addition, it was harder to check the progress of the students in Group B because
their work was saved on their laptops, rather than on large pieces of paper. As a result of
this difference, it was more challenging for Crafts to catch small errors as the students in
Group B progressed.
Despite the minor challenges that existed with the narrated animation podcast
project, Crafts affirmed that the students in Group B had a richer learning experience by
having to create the animations. He stated that the students in this group seemed to have a
more well‐rounded understanding of the concepts. During the post‐interview with Crafts
commented about the animation project: “Well it was a challenge, even for the top students. It was more work and it really forced them to understand the concept…In the future I’m definitely going to use the animation project in my class again.”
Student Interviews
Interviews with two students from both the Control and Experimental Groups were
conducted after the projects had been completed. From these interviews, it became clear
that both groups seemed to enjoy the hands‐on components of the projects. In particular,
the students in Group A seemed to have a definite preference for the drawing component of
their projects, rather than for the report component. During the web conference interview,
the two students responded as follows to the following question: “What was the most fun
part about the axis angle project?”
10
“Writing the report was a little more boring. The handson part of the diagram was better though.”
–Student 1 (student interview) “I liked doing the handson part because it was fun and I really like being creative.”
–Student 2 (student interview)
When discussing the project with the students from Group B, they too felt as if the
hands‐on aspects of their axis angle assignment made the project more interesting to
complete. In addition, both of the students that participated in the web conference agreed
that making the animation required a richer understanding of the subject matter. They
both described the animation podcast project as being more time‐consuming and tedious
than the paper diagram project; however, both of the students agreed that they would have
chosen the podcast project had they been given a choice between completing either of the
projects. “You can just copy a picture from the book if you make a diagram on paper. But, you really have to get it to make a whole animation. You have to memorize the script and then you keep replaying to make sure you got it right.”
–Student 3 (student interview) “It was fun to make the animations. It was fun because I'm pretty good at it, and it makes the viewers like it more.”
– Student 4 (postassessment) “I like doing podcasts, it's great to work with garage band and is much more fun than creating a diagram.”
– Student 5 (postassessment) “The most fun was creating the little animations for the podcast. It was fun because I got to use my imagination, and I was drawing.”
– Student 6 (postassessment) “I liked it. It was probably more work than doing a diagram but I felt challenged and I like to be challenged.”
– Student 7 (postassessment) “You really have to understand it. You can watch the animation on the explorelearning.com website, but then you really have to get it to make your own. It took more effort, but it was more fun.”
–Student 8 (student interview) Summary
The data gathered from this project suggest that Crafts provided a successful
example of how to integrate technology into a science classroom. In addition, the results of
this project imply that the students who completed the animation podcast project had a
higher level of comprehension, a higher level of retention, and higher levels of engagement
in comparison to the students who completed the paper diagrams and the reports. Thus, it
may be concluded that the intervention used in this project provides an example of the
11
successful use of the MLTI laptops within a science classroom in order to increase the
academic achievement and the general engagement of the students.
In addition to the increased engagement, comprehension, and retention of learning,
it appears as if the students in the Experimental Group enjoyed the project despite the fact
that it may have taken more time and effort than the paper diagram and the report. As one
student stated, “It took more effort, but it was more fun”. In his work, Seymour Papert, a
noted mathematician who was part of The Future of Learning Group, organized by a group
of individuals from MIT, found that people learn best when they are given the opportunity
to actively construct new knowledge, rather than having knowledge presented to them.
One day, while working with first‐grade students as they learned how to program
computers using the computer language called Logo, a young boy described the work as
both “hard” and “fun”. In a 2002 article, Papert writes, “Once I was alerted to the concept of "hard fun" I began listening for it and heard it over and over. It is expressed in many different ways, all of which all boil down to the conclusion that everyone likes hard challenging things to do. But they have to be the right things matched to the individual and to the culture of the times.”
This action research project demonstrates that the concept of “hard fun” may have
great implications for educators. With access to the MLTI laptops, teachers have the
capacity to offer their students activities that are both challenging and engaging. In
addition, curricula may be adapted so that it is reflective of the fast‐paced, technology‐rich
world that we currently live in. As a result, children may be more engaged in the classroom
and may experience higher levels of achievement.
12
References
Papert, S. (2002). Hard Fun. Bangor Daily News. Bangor, ME.
Papert, S. & Harel, I. (1991). Constructionism. New York: Ablex Publishing Corporation.
Pinkham, C., Wintle, S.E., & Silvernail, D.L. (2008). 21st century teaching and learning: An
assessment of student website evaluation skills. 1‐40.
Silvernail, D.L. (2008) Using sustained professional development as a catalyst for improving
middle school mathematics performance: Evidence from Maine’s impact study of
technology in mathematics (MISTM). 1‐34.
Silvernail, D.L, Gritter, A. (2007). Maine’s middle school laptop program: Creating better
writers. 1‐19.
13
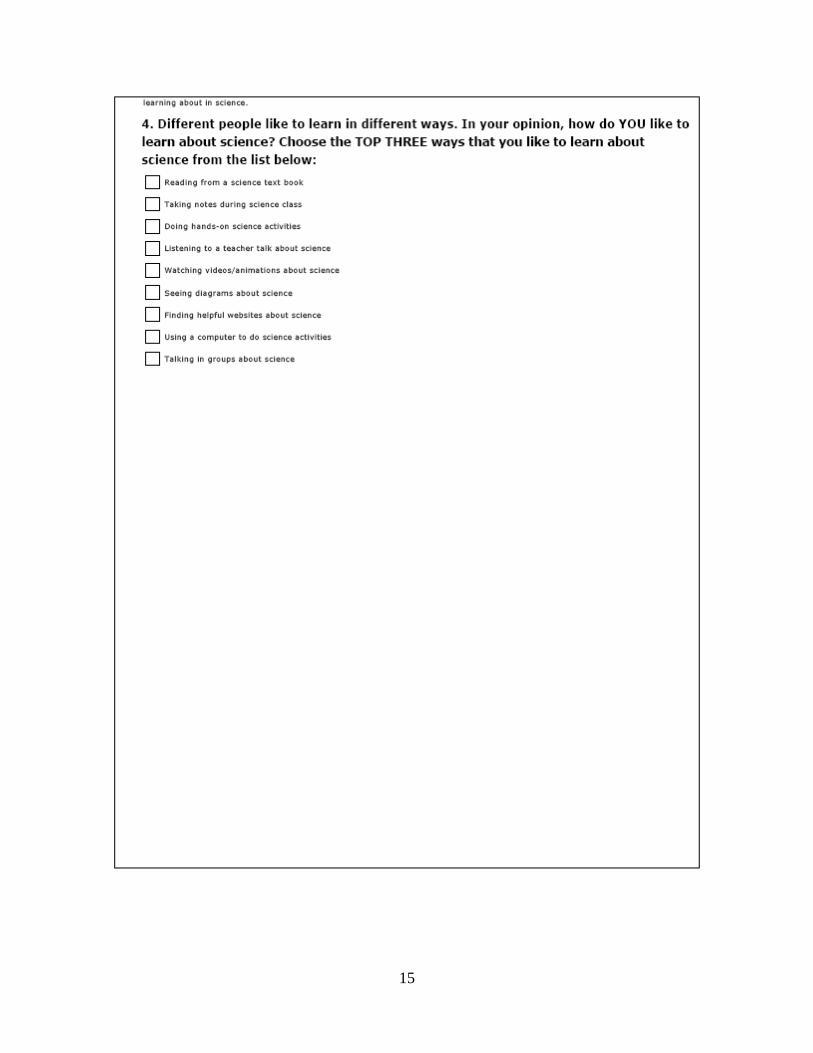
Appendix A Preassessment Instrument
14
15
16
17
18
19
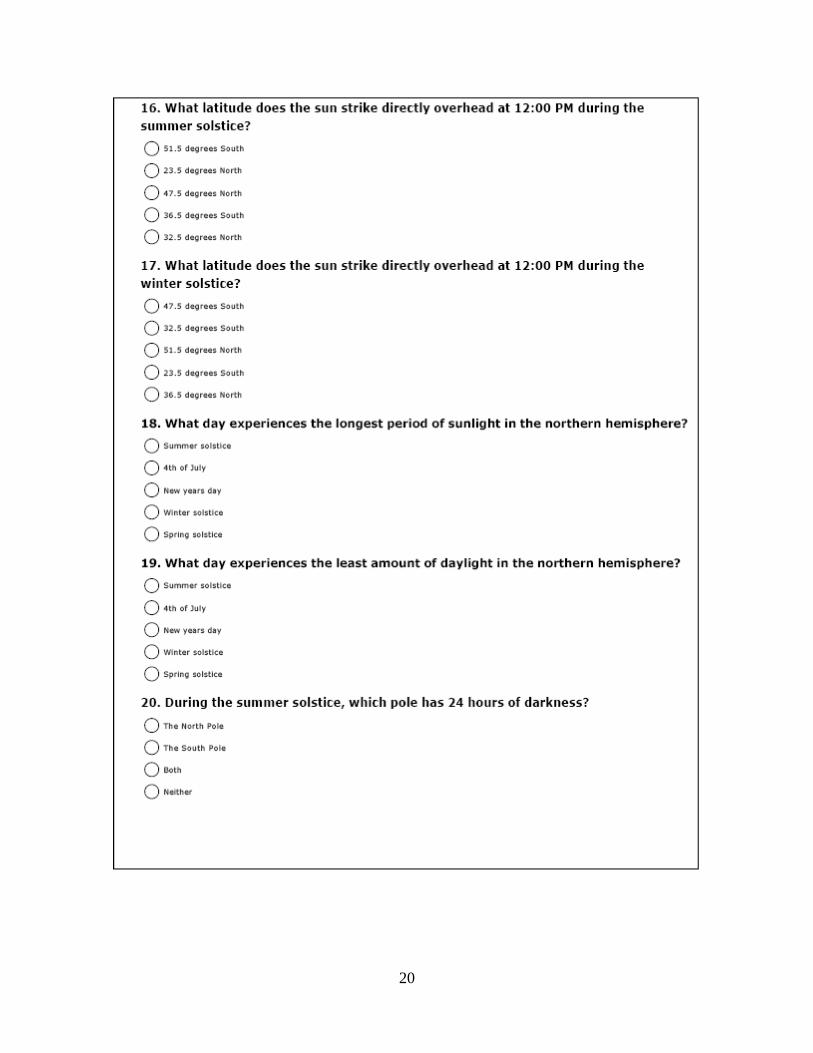
20
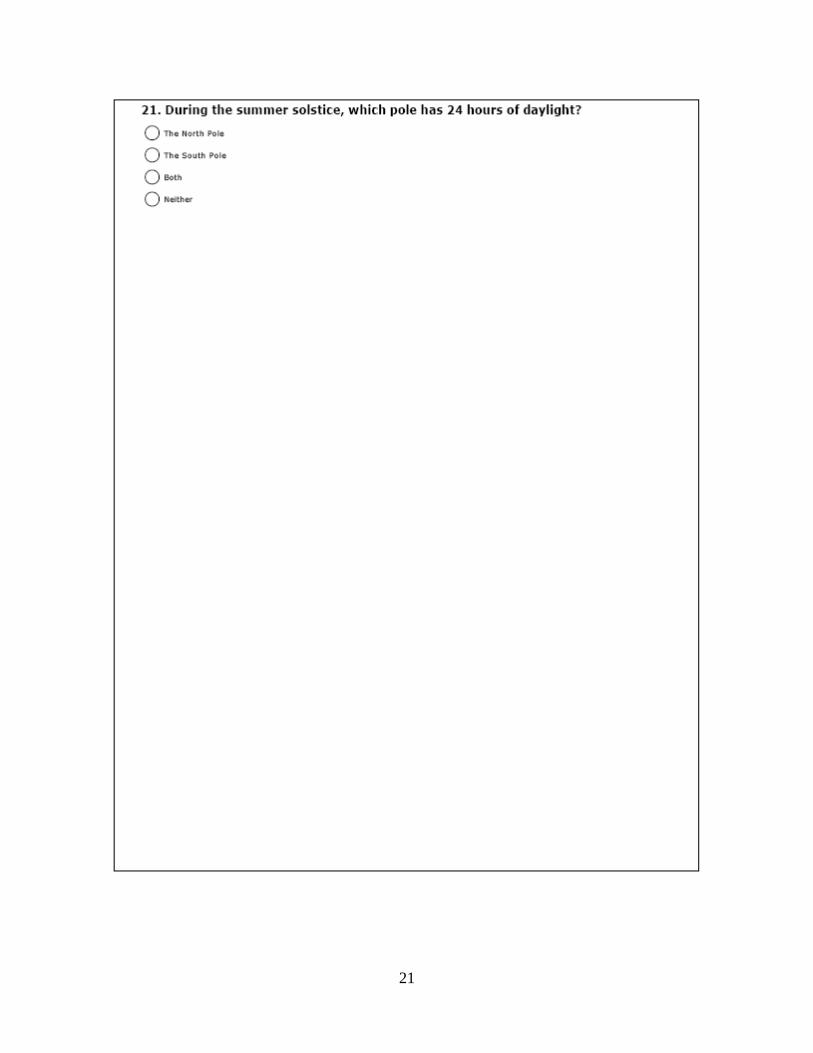
21
22
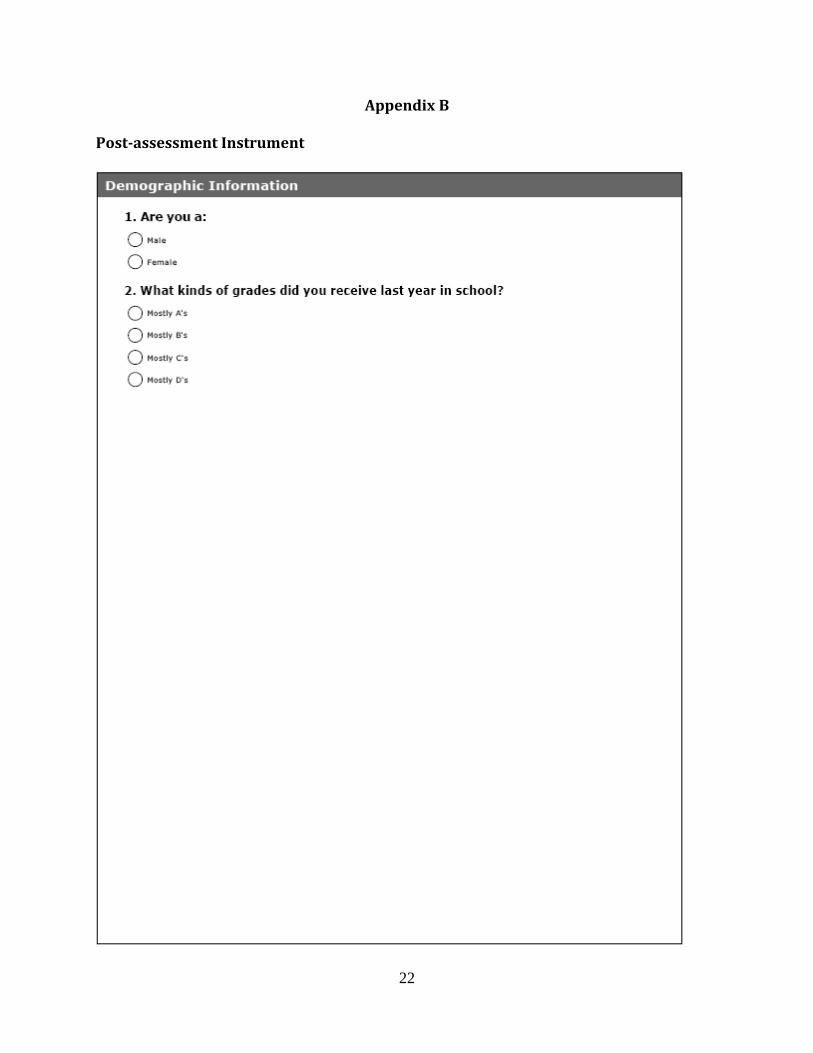
Appendix B Postassessment Instrument

23
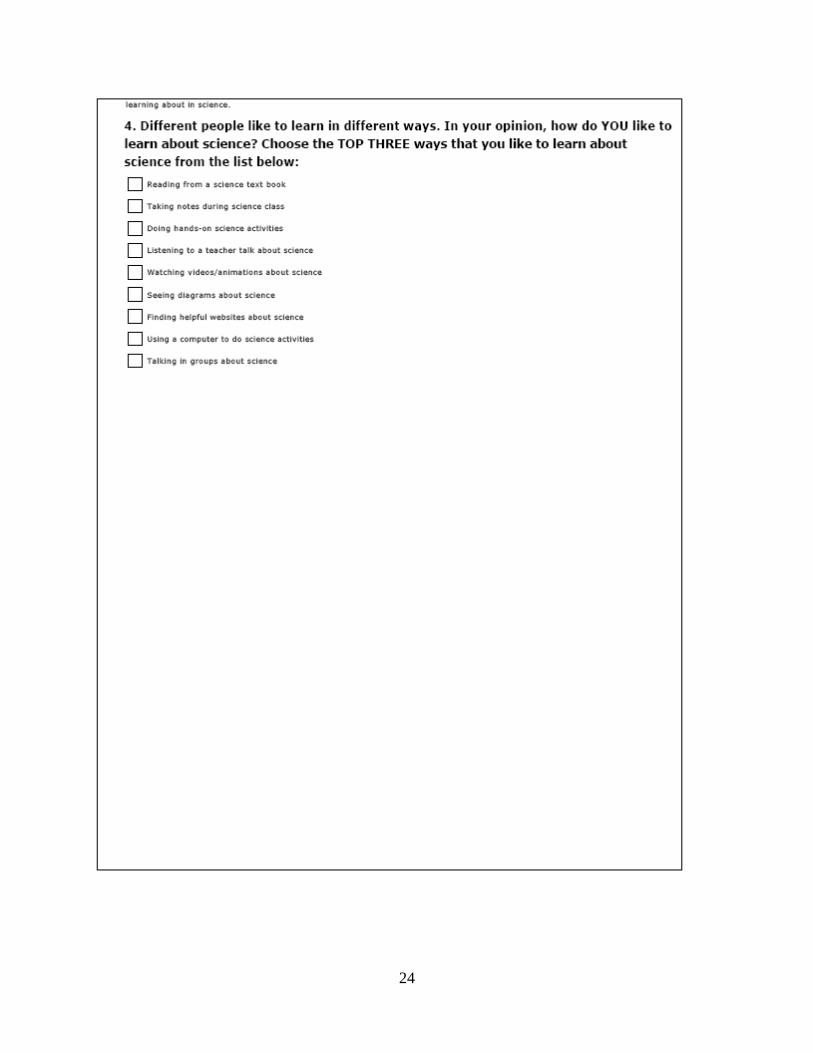
24
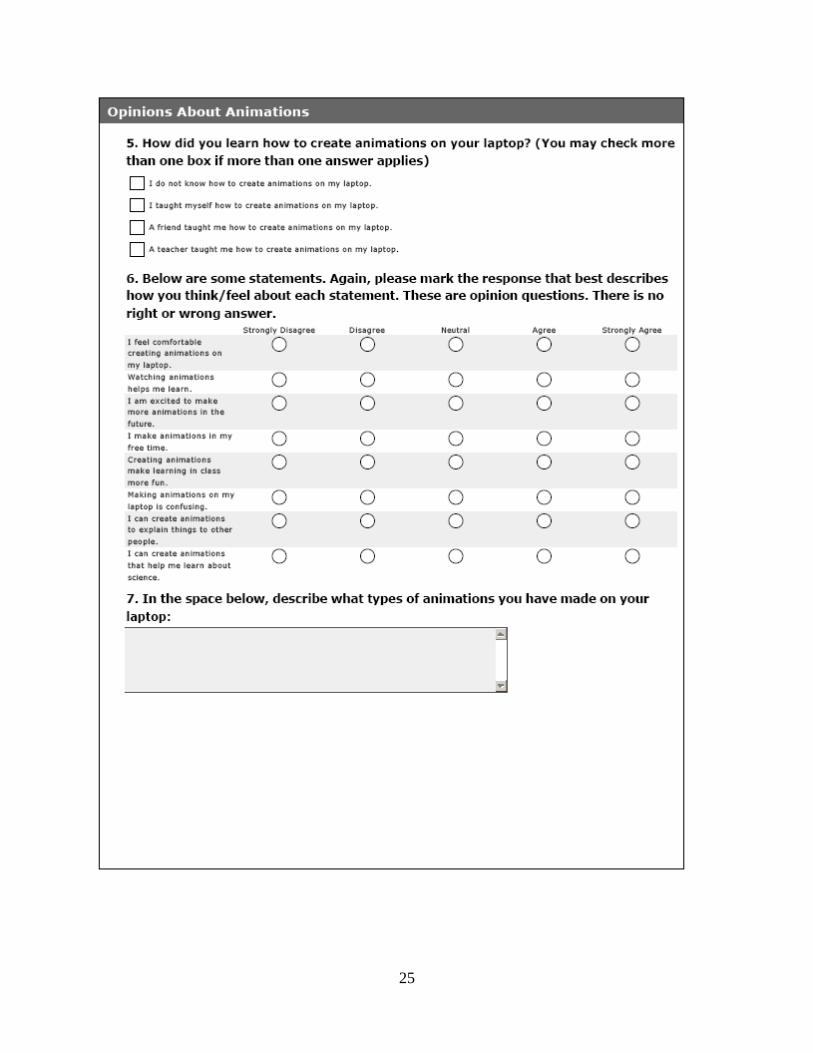
25
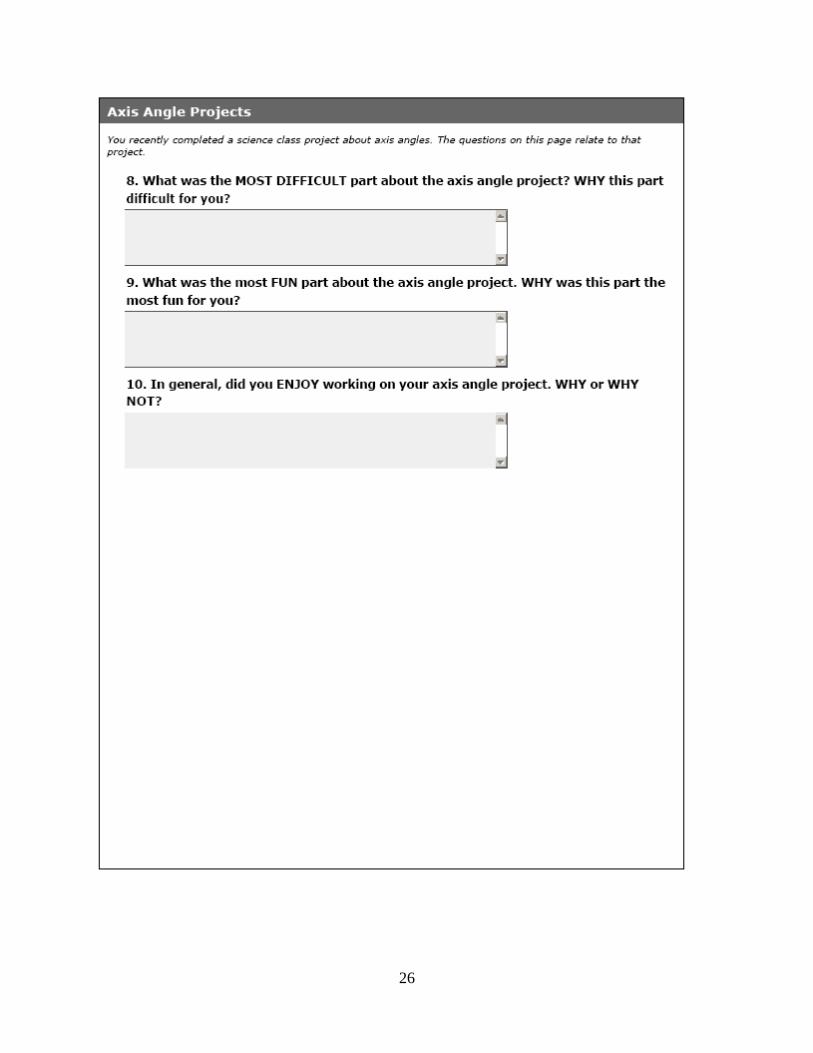
26
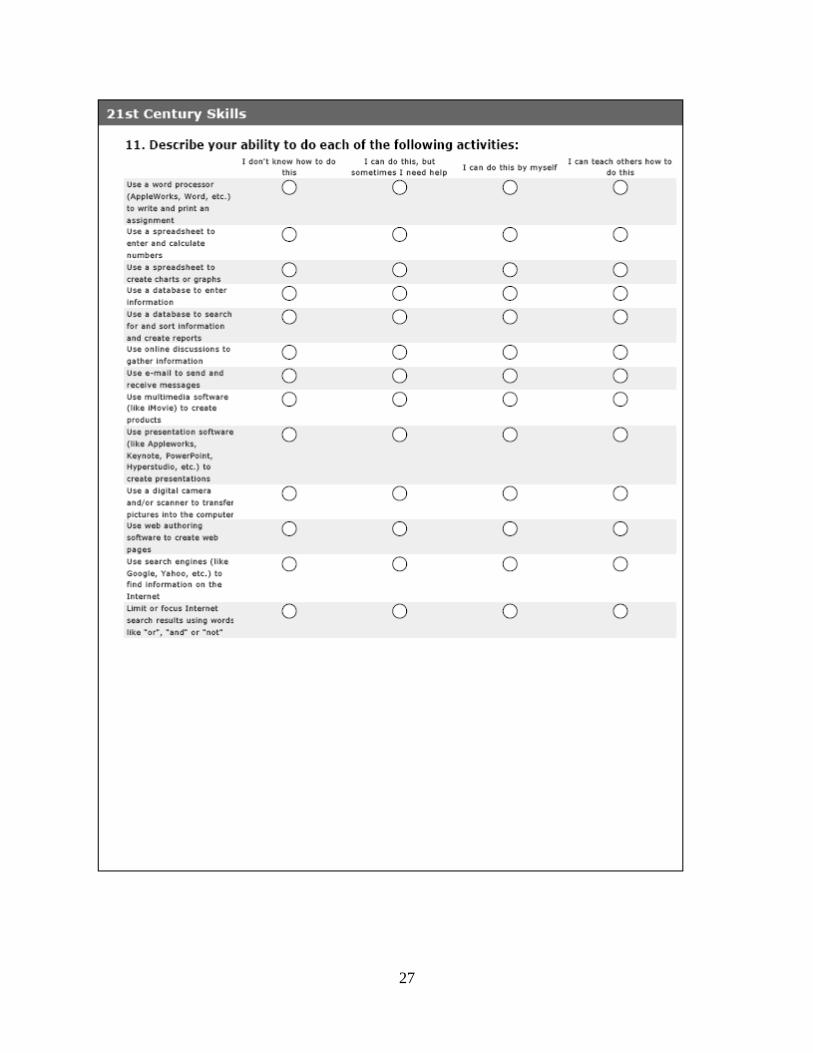
27
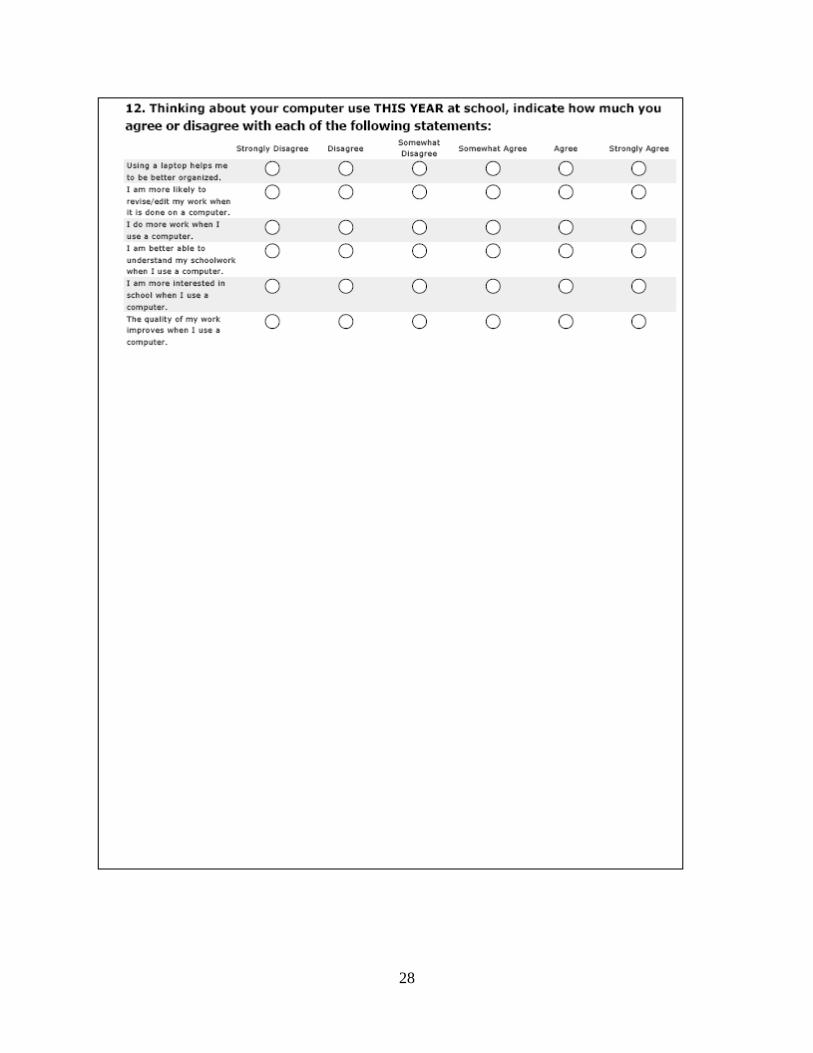
28
29
30
31
32
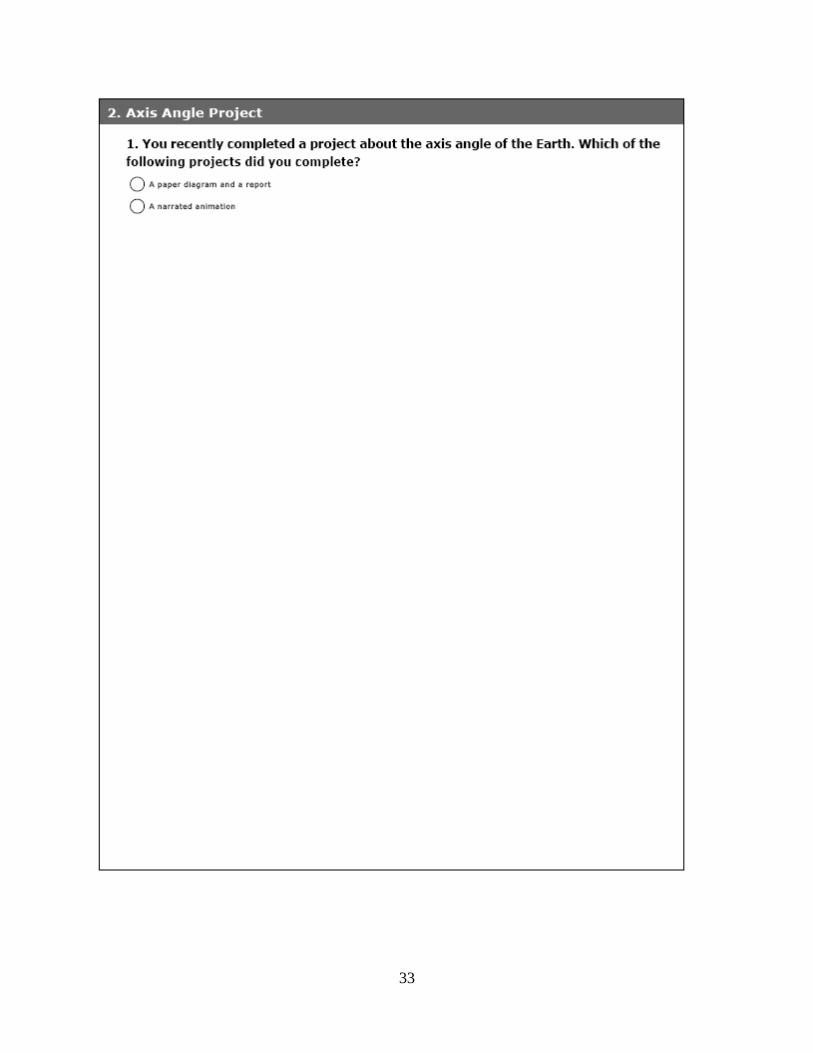
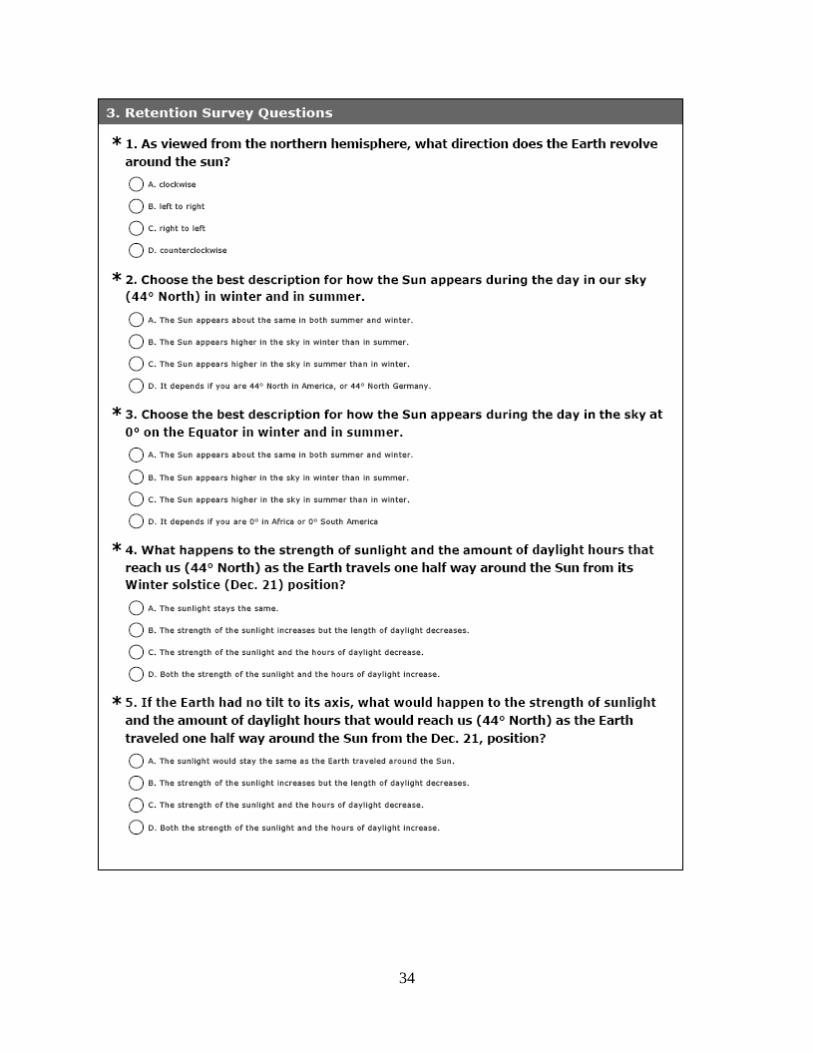
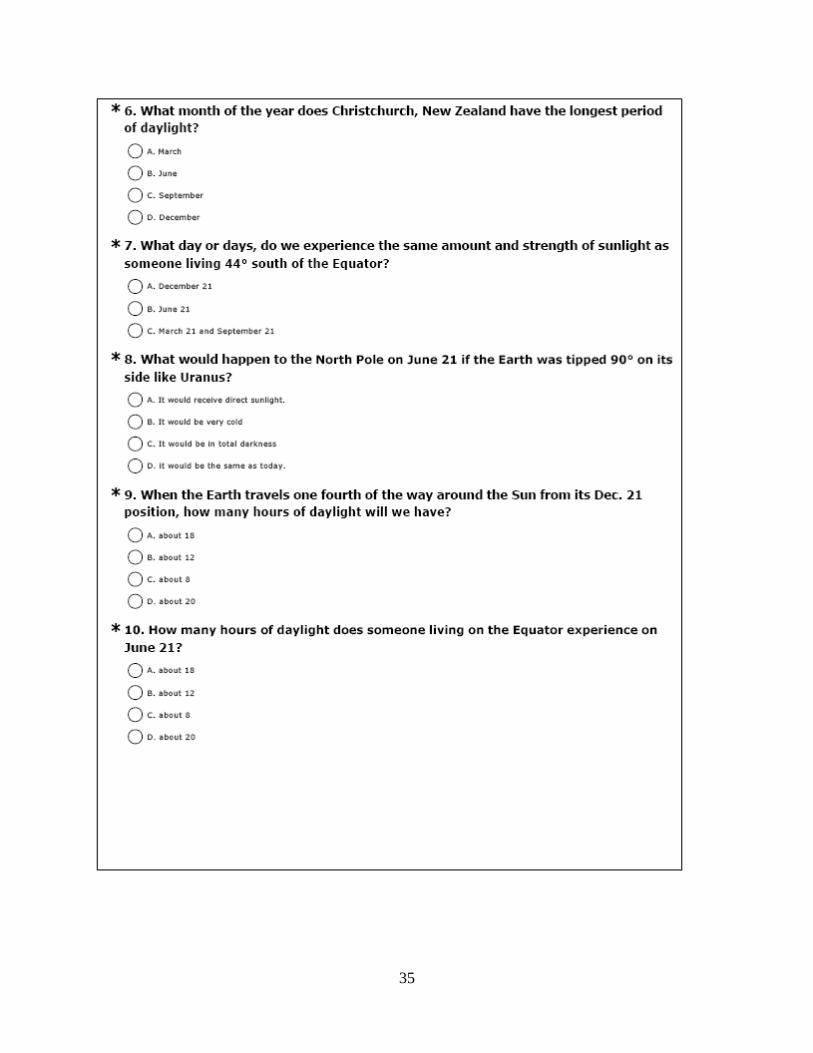
Appendix C
Retention Assessment
33
34
35
36
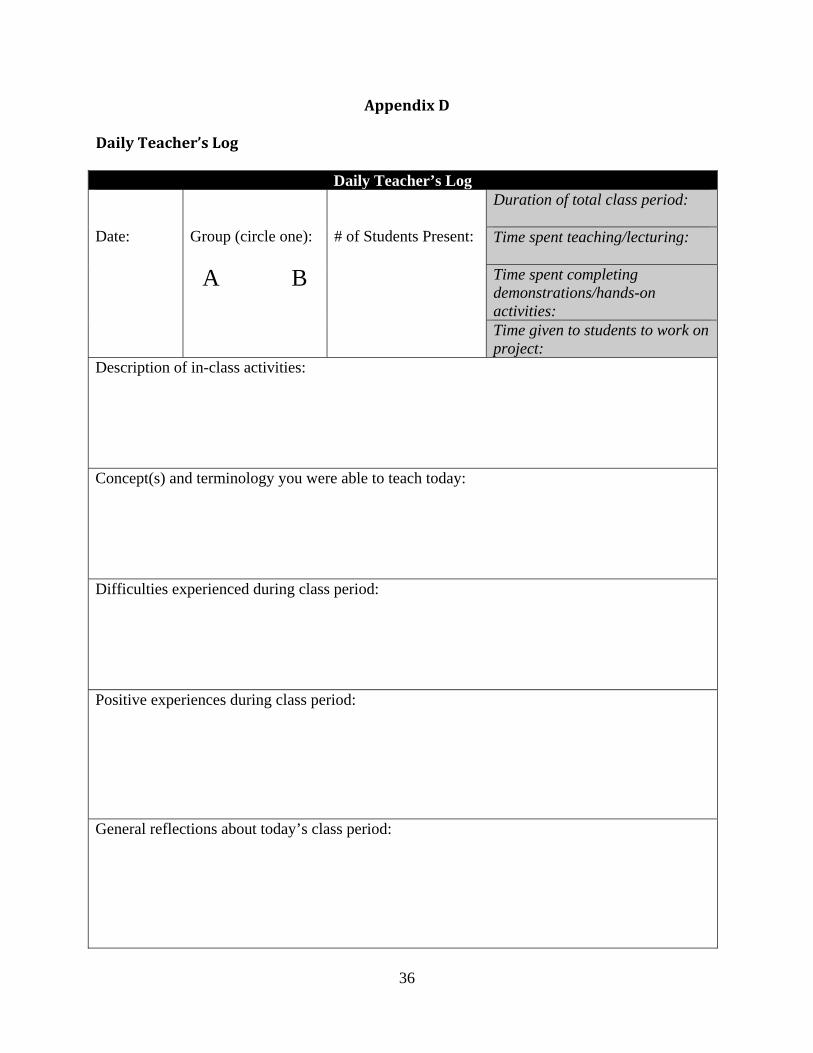
Appendix D Daily Teacher’s Log
Daily Teacher’s Log Date:
Group (circle one):
A B
# of Students Present:
Duration of total class period: Time spent teaching/lecturing: Time spent completing demonstrations/hands-on activities: Time given to students to work on project:
Description of in-class activities: Concept(s) and terminology you were able to teach today: Difficulties experienced during class period: Positive experiences during class period: General reflections about today’s class period:
37
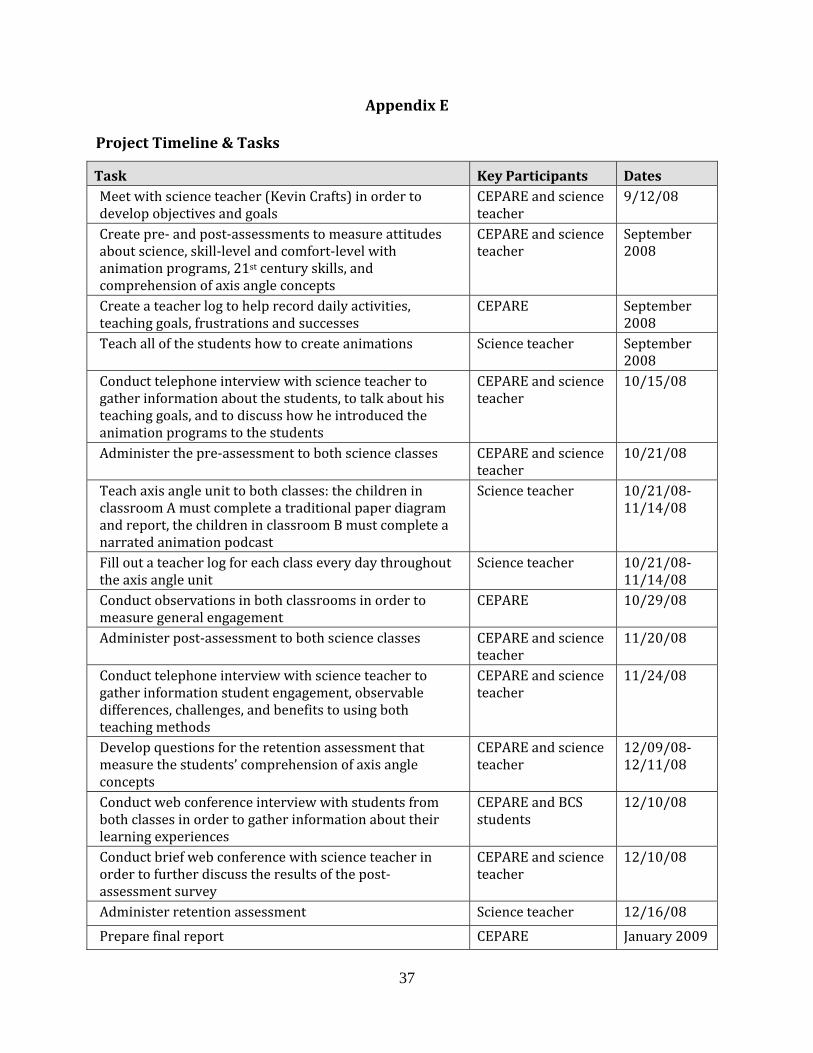
Appendix E
Project Timeline & Tasks
Task Key Participants Dates Meet with science teacher (Kevin Crafts) in order to develop objectives and goals
CEPARE and science teacher
9/12/08
Create pre‐ and post‐assessments to measure attitudes about science, skill‐level and comfort‐level with animation programs, 21st century skills, and comprehension of axis angle concepts
CEPARE and science teacher
September 2008
Create a teacher log to help record daily activities, teaching goals, frustrations and successes
CEPARE September 2008
Teach all of the students how to create animations Science teacher September 2008
Conduct telephone interview with science teacher to gather information about the students, to talk about his teaching goals, and to discuss how he introduced the animation programs to the students
CEPARE and science teacher
10/15/08
Administer the pre‐assessment to both science classes CEPARE and science teacher
10/21/08
Teach axis angle unit to both classes: the children in classroom A must complete a traditional paper diagram and report, the children in classroom B must complete a narrated animation podcast
Science teacher 10/21/08‐11/14/08
Fill out a teacher log for each class every day throughout the axis angle unit
Science teacher 10/21/08‐11/14/08
Conduct observations in both classrooms in order to measure general engagement
CEPARE 10/29/08
Administer post‐assessment to both science classes CEPARE and science teacher
11/20/08
Conduct telephone interview with science teacher to gather information student engagement, observable differences, challenges, and benefits to using both teaching methods
CEPARE and science teacher
11/24/08
Develop questions for the retention assessment that measure the students’ comprehension of axis angle concepts
CEPARE and science teacher
12/09/08‐ 12/11/08
Conduct web conference interview with students from both classes in order to gather information about their learning experiences
CEPARE and BCS students
12/10/08
Conduct brief web conference with science teacher in order to further discuss the results of the post‐assessment survey
CEPARE and science teacher
12/10/08
Administer retention assessment Science teacher 12/16/08 Prepare final report CEPARE January 2009
38
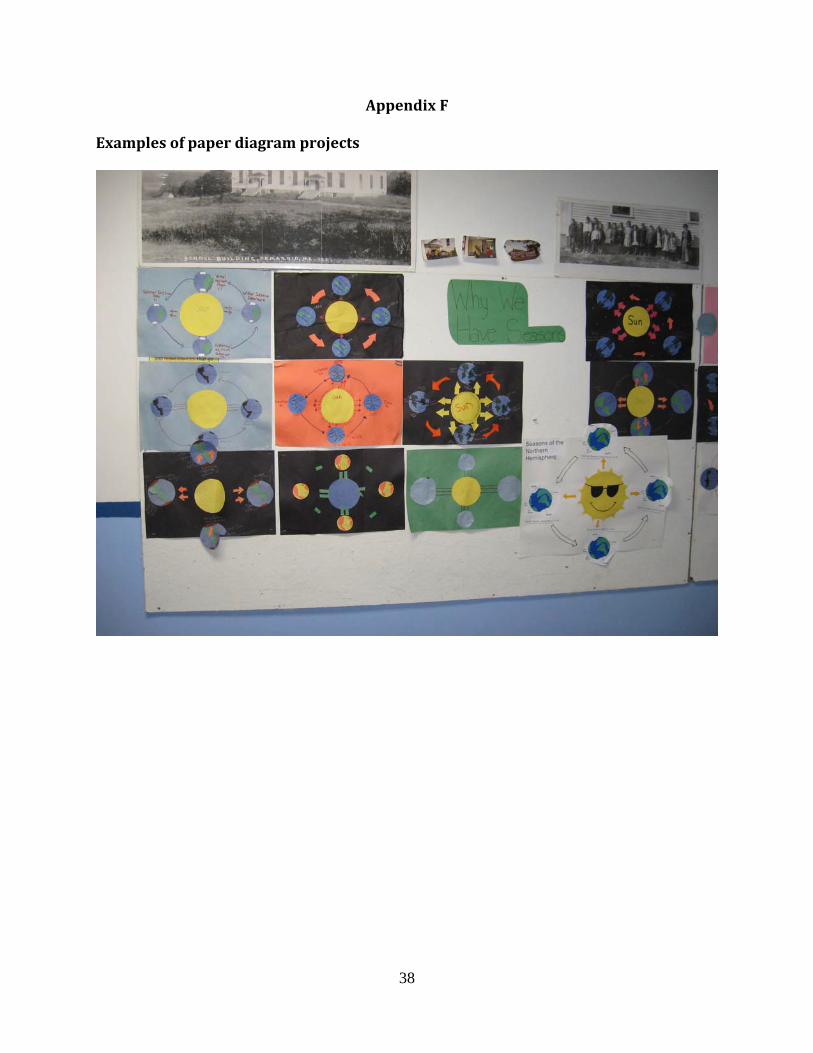
Appendix F
Examples of paper diagram projects
39
Appendix G
Examples of podcast animation projects
Examples of students’ podcast animation projects from Kevin Crafts’ science class
can be found by following the link below:
http://www.bristol‐cs.u74.k12.me.us/Science/Astronomy_and_Axis_Angle_ Podcasts/Astronomy_and_Axis_Angle_Podcasts.html
40
Authors’ Biographic Sketches Alexis Berry Research Assistant Center for Education Policy, Applied Research, and Evaluation (CEPARE) University of Southern Maine [email protected] (207) 228‐8137 Since she began working as a Research Assistant at CEPARE, Alexis has been involved with research projects related to the Maine Learning Technology Initiative (MLTI). Before working at CEPARE, Alexis worked as a clinical specialist at a day treatment center, which was designed to help keep high‐risk children within their own schools, homes, and communities. Alexis received her B.A. in Psychology from the University of New Hampshire in 2007. She is currently enrolled in her second year in the University of Southern Maine’s doctoral program in School Psychology. Sarah Wintle Policy Research Analyst Center for Education Policy, Applied Research, and Evaluation (CEPARE) University of Southern Maine [email protected] (207) 780‐5046 In her role as a Research Associate at CEPARE, Sarah is responsible primarily for the research associated with the Maine Learning Technology Initiative (MLTI) which provides laptop computers to all 7th and 8th grade students, as well as to all middle school and high school teachers in Maine’s public schools. Prior to her work at CEPARE, Sarah was a Recruiter for The New Teacher Project and worked to place traditional and alternate route teachers in high need classrooms across the state of Virginia. Sarah’s experience in the classroom included two years teaching high school history as part of the Teach for America program. Sarah holds a B.A. in American Studies and African American Studies from Smith College.