using hoosier riverwatch data for assessment and planning
DESCRIPTION
Using Hoosier Riverwatch Data for Assessment and Planning. Volunteers are Great. Hoosier Riverwatch. Emphasis: TRENDS Groups (not individuals) get kits if: Adopt a half-mile section of stream Monitor 200-foot section at least 2x/year for 2 or more years Complete 8-hour training course. - PowerPoint PPT PresentationTRANSCRIPT
Monitoring and Assessment for Watershed PlansNovember, 2007
Using Hoosier Using Hoosier Riverwatch Data for Riverwatch Data for
Assessment and Assessment and PlanningPlanning
Using Hoosier Using Hoosier Riverwatch Data for Riverwatch Data for
Assessment and Assessment and PlanningPlanning

Volunteers are GreatVolunteers are GreatVolunteers are GreatVolunteers are Great
Hoosier Riverwatch
Emphasis: TRENDS Groups (not individuals) get kits
if: Adopt a half-mile section of stream Monitor 200-foot section at least
2x/year for 2 or more years Complete 8-hour training course
Hoosier Riverwatch. 2005. Volunteer stream monitoring training manual, Indianapolis.
Hoosier Riverwatch
Equipment kits Chemical monitoring: DO, BOD,
temperature, orthophosphate, nitrate, nitrite, pH, transparency
Biological monitoring: sampling nets and identification keys for benthic macroinvertebrates
Methods
CHEMetrics DO Test Kit K-7512 Range: 1-12 mg/L DO
D.O. and B.O.D.
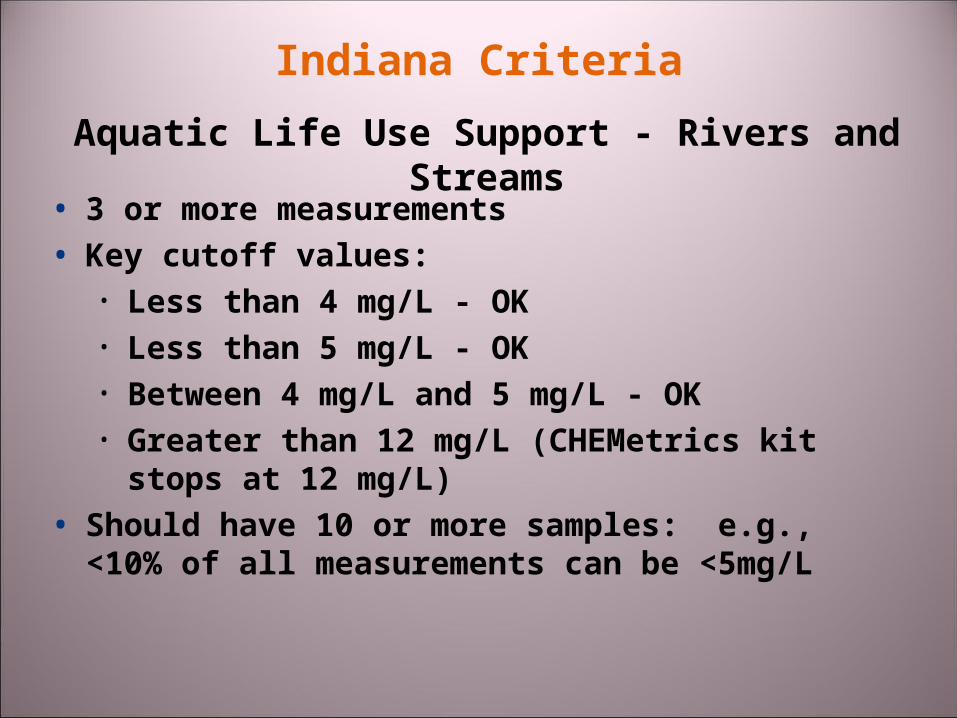
Indiana Criteria
• 3 or more measurements• Key cutoff values:
• Less than 4 mg/L - OK• Less than 5 mg/L - OK• Between 4 mg/L and 5 mg/L - OK• Greater than 12 mg/L (CHEMetrics kit
stops at 12 mg/L)• Should have 10 or more samples: e.g.,
<10% of all measurements can be <5mg/L
Aquatic Life Use Support - Rivers and Streams
Orthophosphate
CHEMetrics Phosphate Test Kit K-8510
Range: 0-1.0 mg/L in 0.1 & 0.2 mg/L
increments OR 1-10 mg/L in 1 & 2 mg/L increments
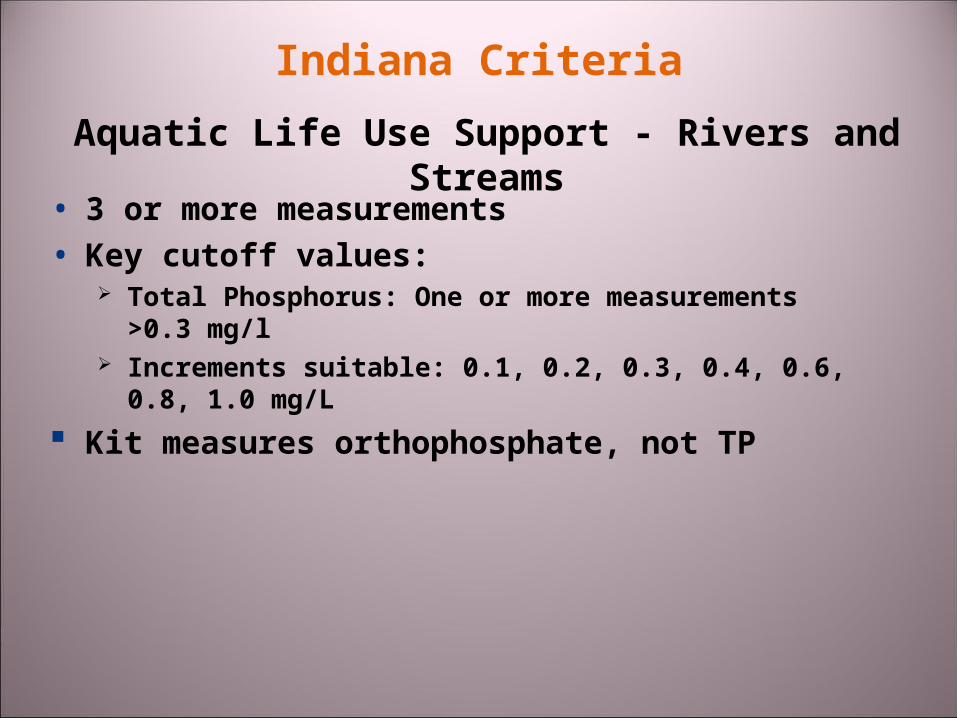
Indiana Criteria
• 3 or more measurements• Key cutoff values:
Total Phosphorus: One or more measurements >0.3 mg/l
Increments suitable: 0.1, 0.2, 0.3, 0.4, 0.6, 0.8, 1.0 mg/L
Kit measures orthophosphate, not TP
Aquatic Life Use Support - Rivers and Streams
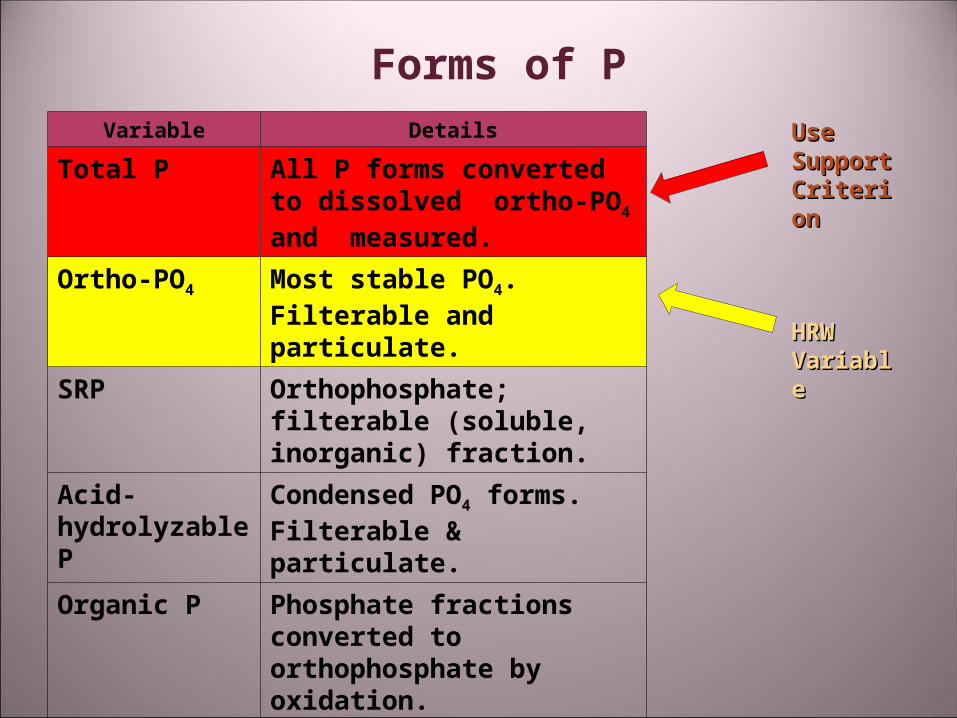
Variable Details
Total P All P forms converted to dissolved ortho-PO4 and measured.
Ortho-PO4 Most stable PO4. Filterable and particulate.
SRP Orthophosphate; filterable (soluble, inorganic) fraction.
Acid-hydrolyzable P
Condensed PO4 forms. Filterable & particulate.
Organic P Phosphate fractions converted to orthophosphate by oxidation.
Forms of P
Use Use SupporSupport t CriteriCriterionon
HRW HRW VariablVariablee
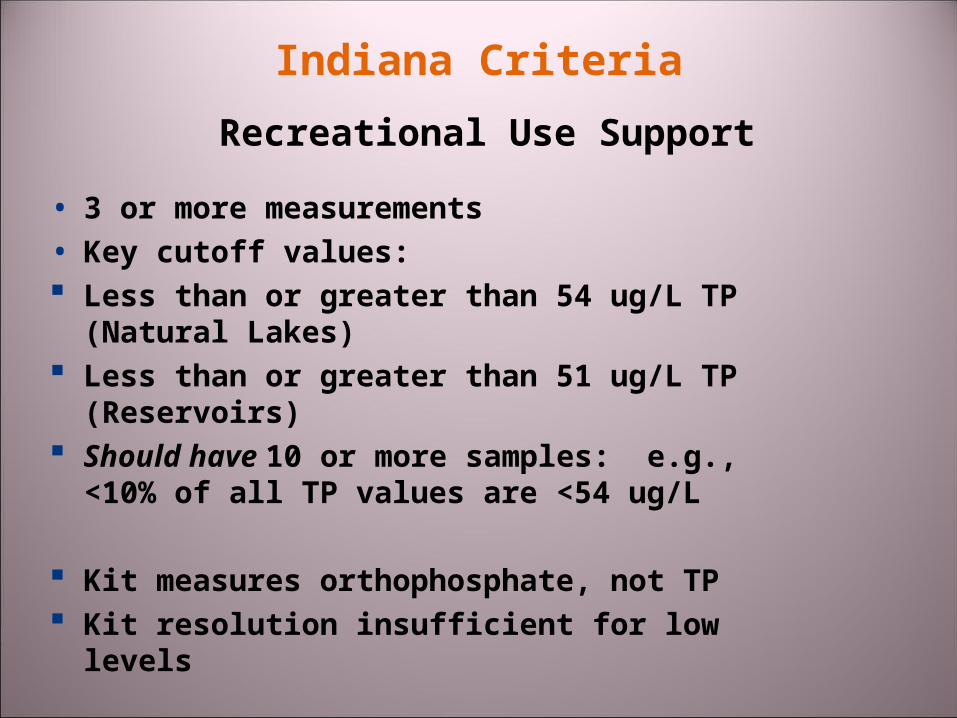
Indiana Criteria
• 3 or more measurements• Key cutoff values: Less than or greater than 54 ug/L TP
(Natural Lakes) Less than or greater than 51 ug/L TP
(Reservoirs) Should have 10 or more samples: e.g.,
<10% of all TP values are <54 ug/L
Kit measures orthophosphate, not TP Kit resolution insufficient for low levels
Recreational Use Support
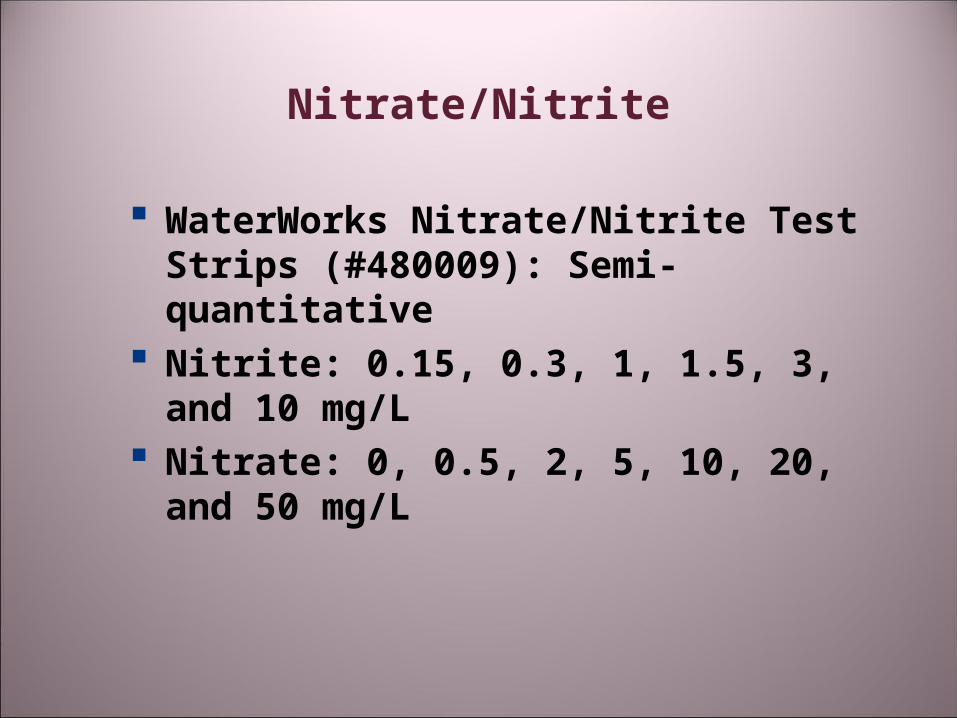
Nitrate/Nitrite
WaterWorks Nitrate/Nitrite Test Strips (#480009): Semi-quantitative
Nitrite: 0.15, 0.3, 1, 1.5, 3, and 10 mg/L
Nitrate: 0, 0.5, 2, 5, 10, 20, and 50 mg/L
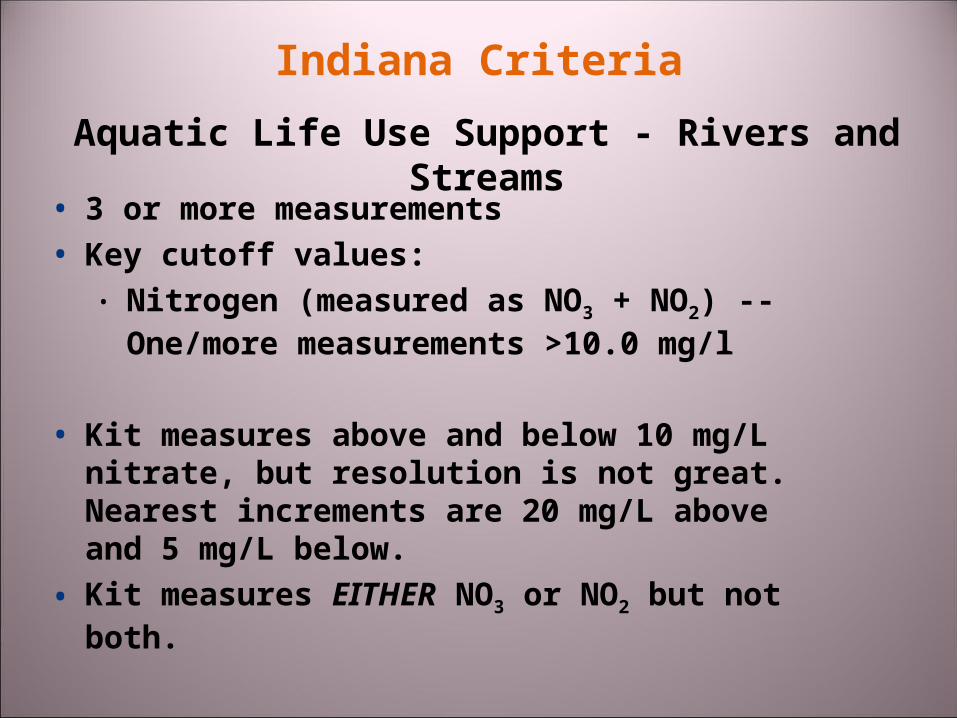
Indiana Criteria
• 3 or more measurements• Key cutoff values:
• Nitrogen (measured as NO3 + NO2) -- One/more measurements >10.0 mg/l
• Kit measures above and below 10 mg/L nitrate, but resolution is not great. Nearest increments are 20 mg/L above and 5 mg/L below.
• Kit measures EITHER NO3 or NO2 but not both.
Aquatic Life Use Support - Rivers and Streams
E. coli
Micrology Laboratories Coliscan Easygel
Lower limit: 20/100 mL One of two best in Univ. MN study
of bacteria field test kits (Liukkonen, et al., 2006)
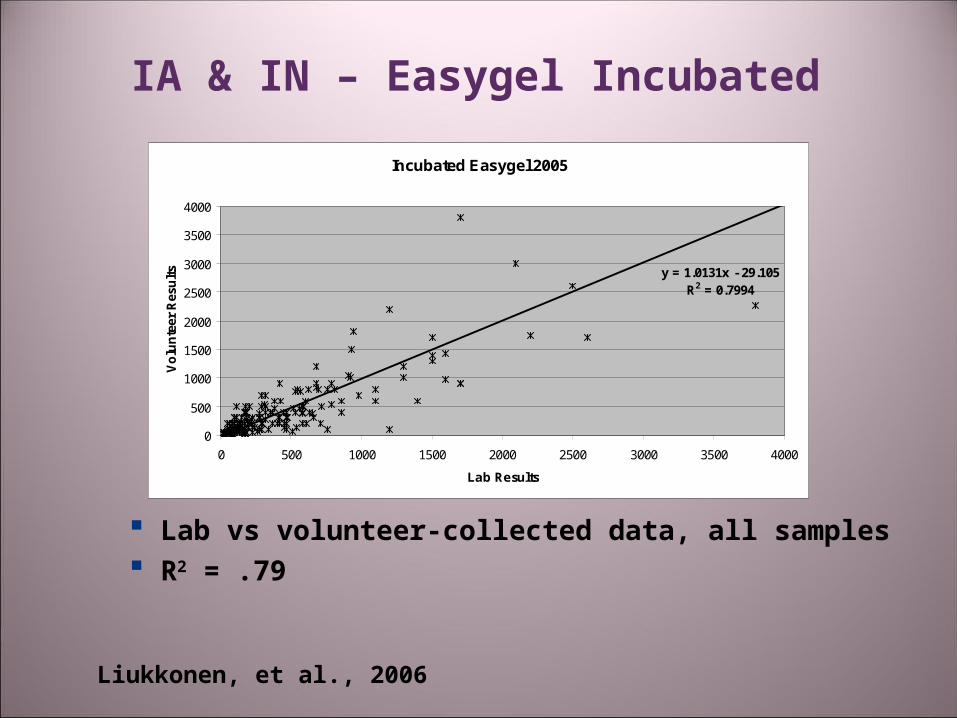
IA & IN – Easygel Incubated
Lab vs volunteer-collected data, all samples R2 = .79
Incubated Easygel 2005
y = 1.0131x - 29.105R2 = 0.7994
0
500
1000
1500
2000
2500
3000
3500
4000
0 500 1000 1500 2000 2500 3000 3500 4000
Lab Results
Vo
lun
teer
Res
ult
s
Liukkonen, et al., 2006
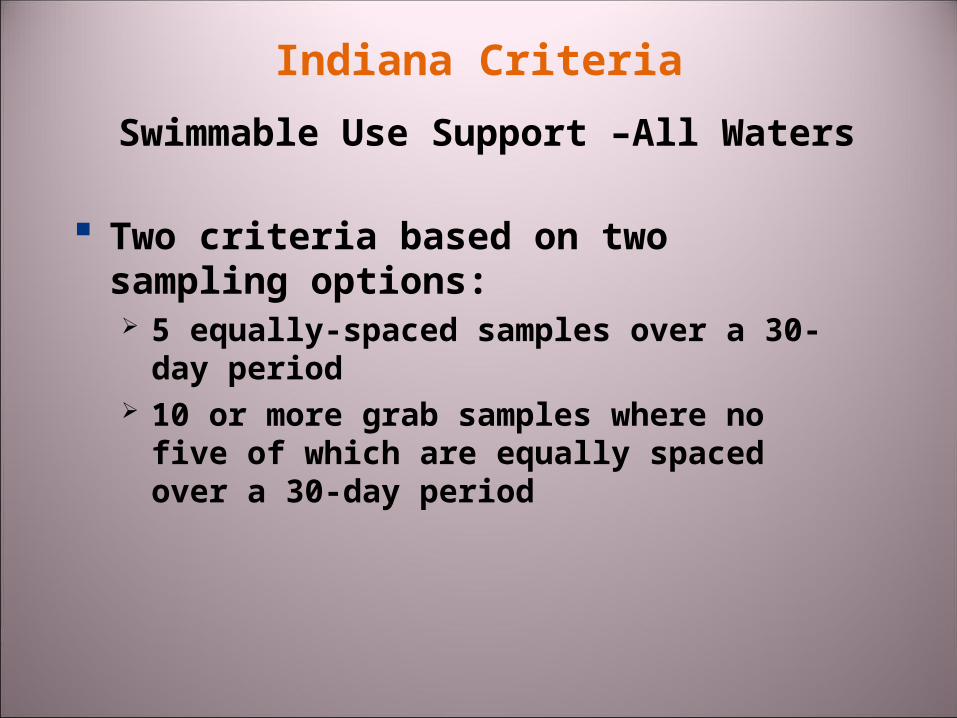
Indiana Criteria
Two criteria based on two sampling options: 5 equally-spaced samples over a 30-
day period 10 or more grab samples where no
five of which are equally spaced over a 30-day period
Swimmable Use Support –All Waters
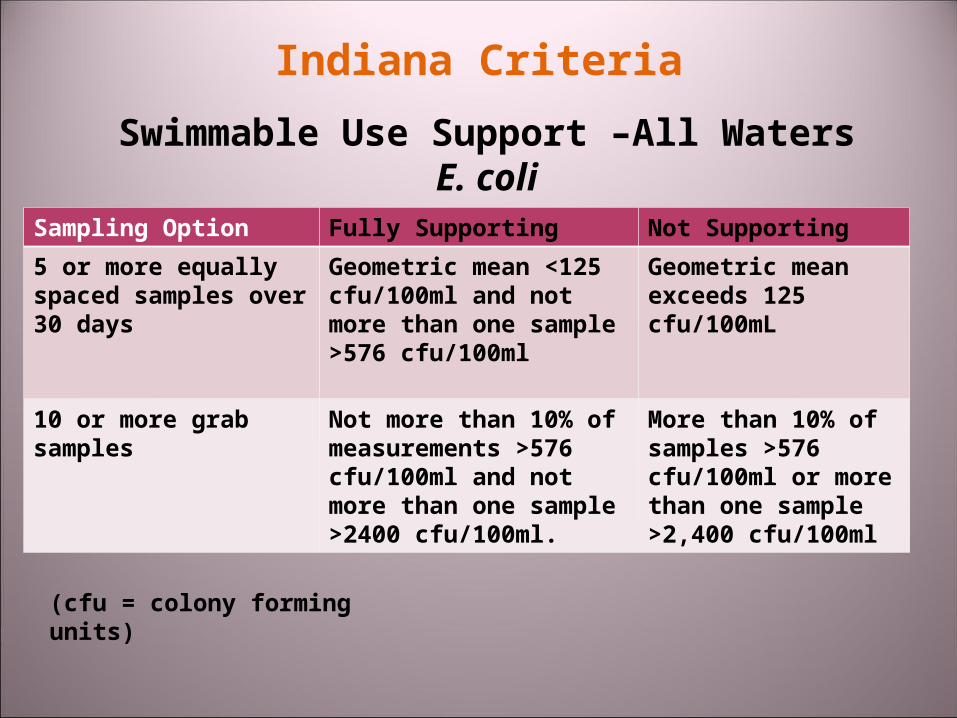
Indiana Criteria
Swimmable Use Support –All WatersE. coli
Sampling Option Fully Supporting Not Supporting
5 or more equally spaced samples over 30 days
Geometric mean <125 cfu/100ml and not more than one sample >576 cfu/100ml
Geometric mean exceeds 125 cfu/100mL
10 or more grab samples
Not more than 10% of measurements >576 cfu/100ml and not more than one sample >2400 cfu/100ml.
More than 10% of samples >576 cfu/100ml or more than one sample >2,400 cfu/100ml
(cfu = colony forming units)
Indiana Criteria
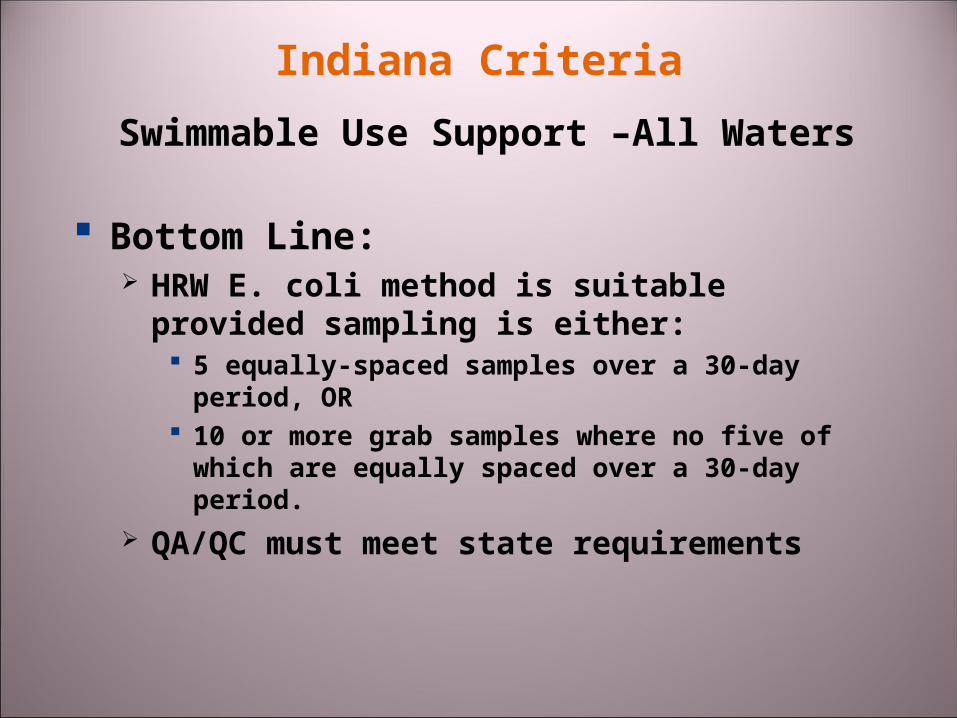
Bottom Line: HRW E. coli method is suitable
provided sampling is either: 5 equally-spaced samples over a 30-day
period, OR 10 or more grab samples where no five of
which are equally spaced over a 30-day period.
QA/QC must meet state requirements
Swimmable Use Support –All Waters
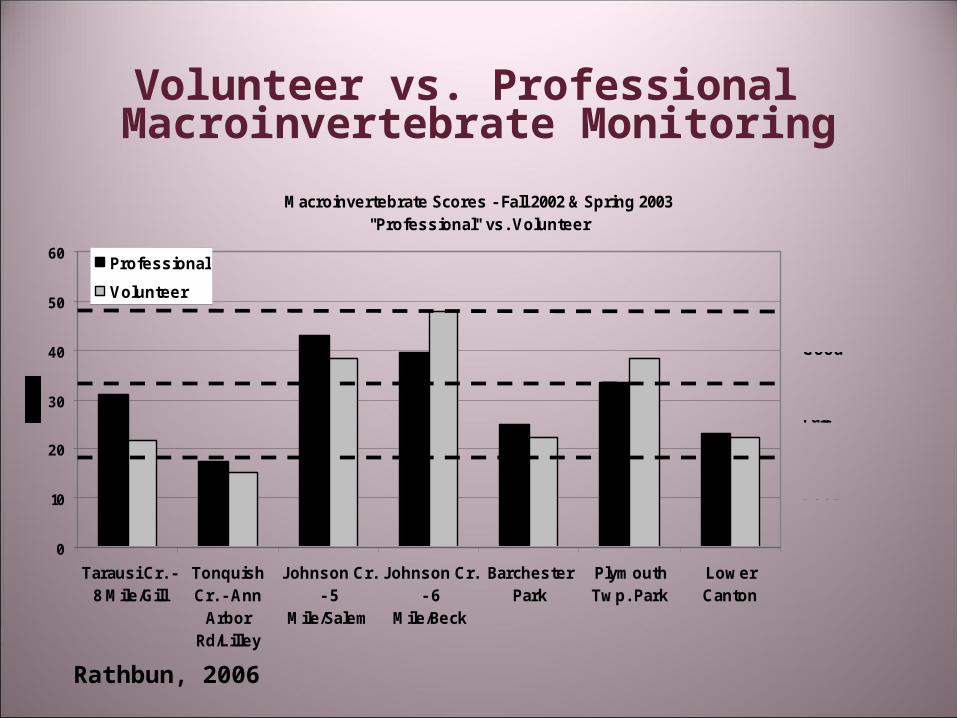
Macroinvertebrate Scores - Fall 2002 & Spring 2003"Professional" vs. Volunteer
0
10
20
30
40
50
60
Tarausi Cr. -8 Mile/Gill
TonquishCr. - Ann
ArborRd/Lilley
Johnson Cr.- 5
Mile/Salem
Johnson Cr.- 6
Mile/Beck
BarchesterPark
PlymouthTwp. Park
LowerCanton
Professional
Volunteer
Poor
Good
Fair
Excellent
Volunteer vs. Professional Macroinvertebrate Monitoring
Rathbun, 2006
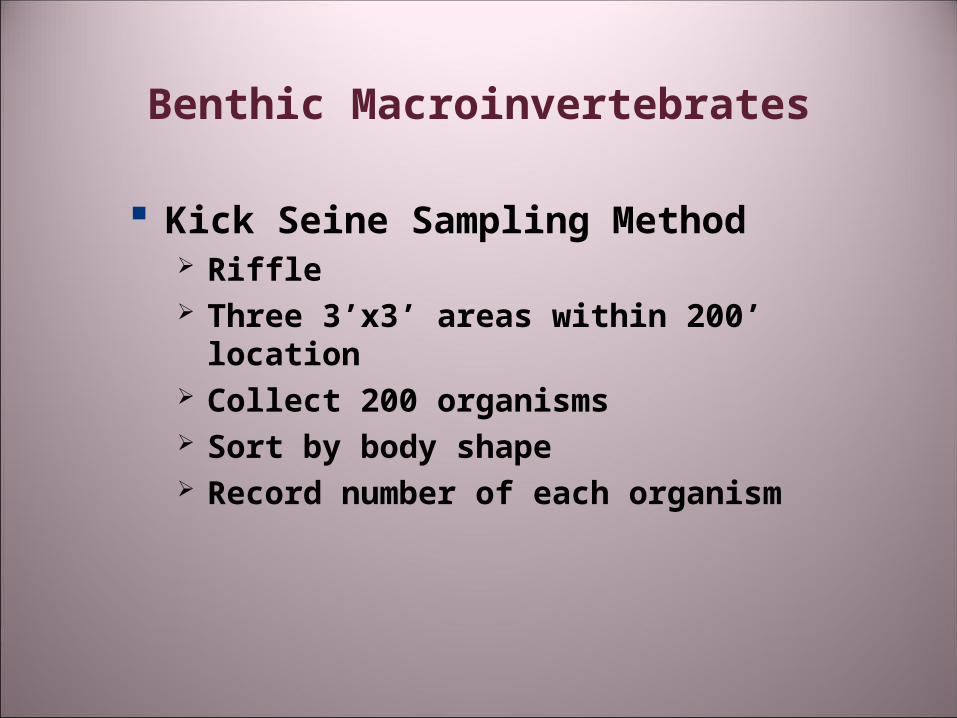
Benthic Macroinvertebrates
Kick Seine Sampling Method Riffle Three 3’x3’ areas within 200’ location Collect 200 organisms Sort by body shape Record number of each organism
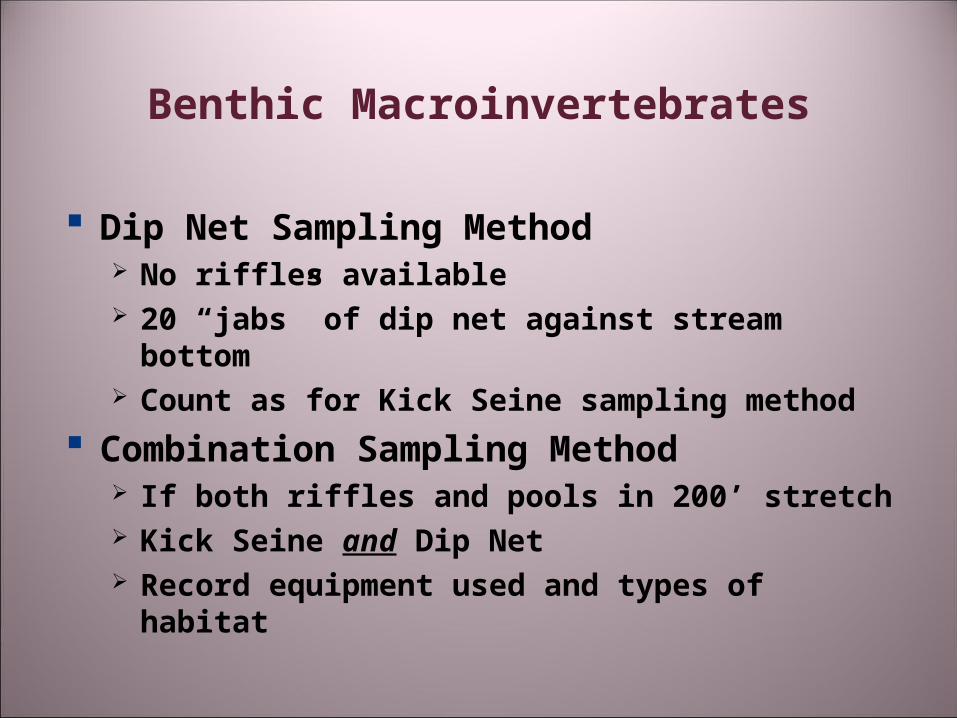
Dip Net Sampling Method No riffles available 20 “jabs” of dip net against stream
bottom Count as for Kick Seine sampling method
Combination Sampling Method If both riffles and pools in 200’ stretch Kick Seine and Dip Net Record equipment used and types of
habitat
Benthic Macroinvertebrates
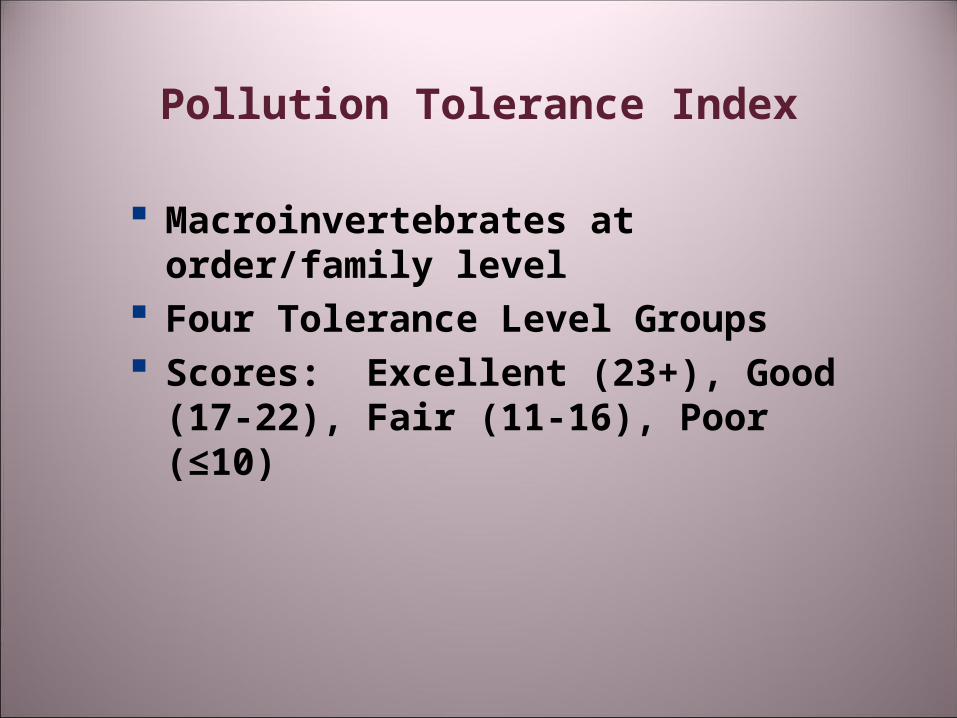
Pollution Tolerance Index
Macroinvertebrates at order/family level
Four Tolerance Level Groups Scores: Excellent (23+), Good (17-
22), Fair (11-16), Poor (≤10)
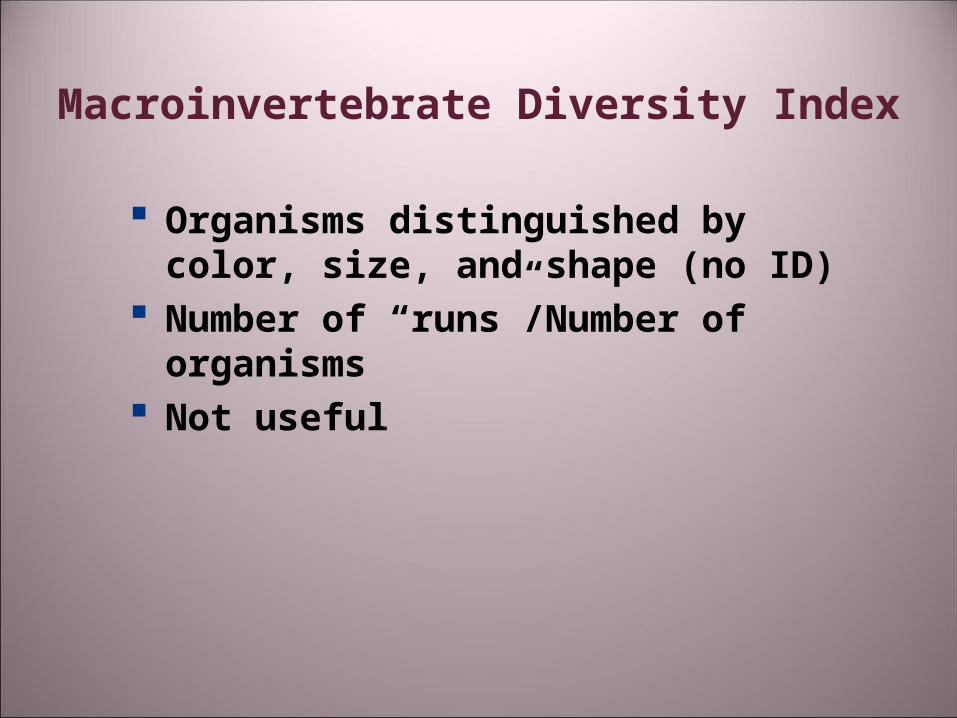
Macroinvertebrate Diversity Index
Organisms distinguished by color, size, and shape (no ID)
Number of “runs”/Number of organisms
Not useful
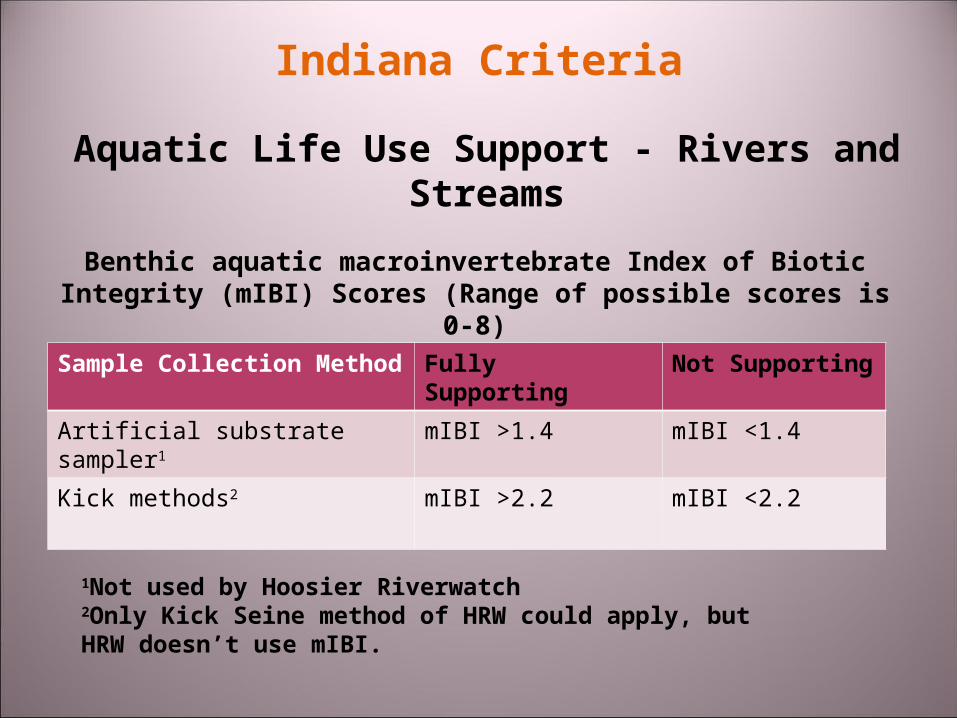
Indiana Criteria
Aquatic Life Use Support - Rivers and Streams
Sample Collection Method
Fully Supporting Not Supporting
Artificial substrate sampler1 mIBI >1.4 mIBI <1.4
Kick methods2 mIBI >2.2 mIBI <2.2
Benthic aquatic macroinvertebrate Index of Biotic Integrity (mIBI) Scores (Range of possible scores is 0-
8)
1Not used by Hoosier Riverwatch2Only Kick Seine method of HRW could apply, but HRW doesn’t use mIBI.
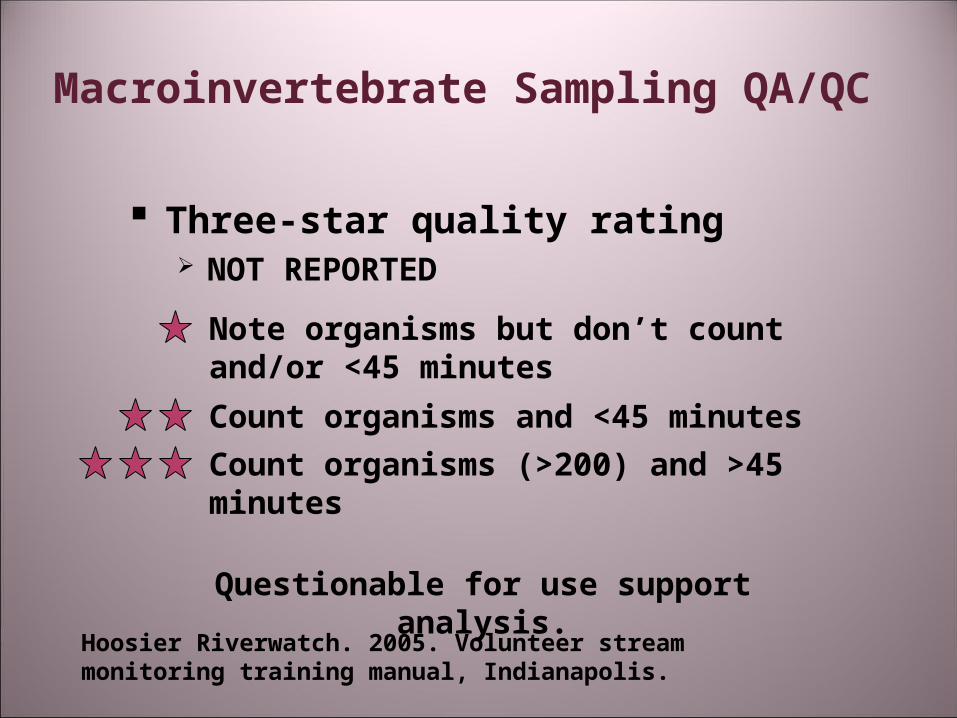
Macroinvertebrate Sampling QA/QC
Three-star quality rating NOT REPORTED
Note organisms but don’t count and/or <45 minutes
Count organisms and <45 minutes
Count organisms (>200) and >45 minutes
Hoosier Riverwatch. 2005. Volunteer stream monitoring training manual, Indianapolis.
Questionable for use support analysis.
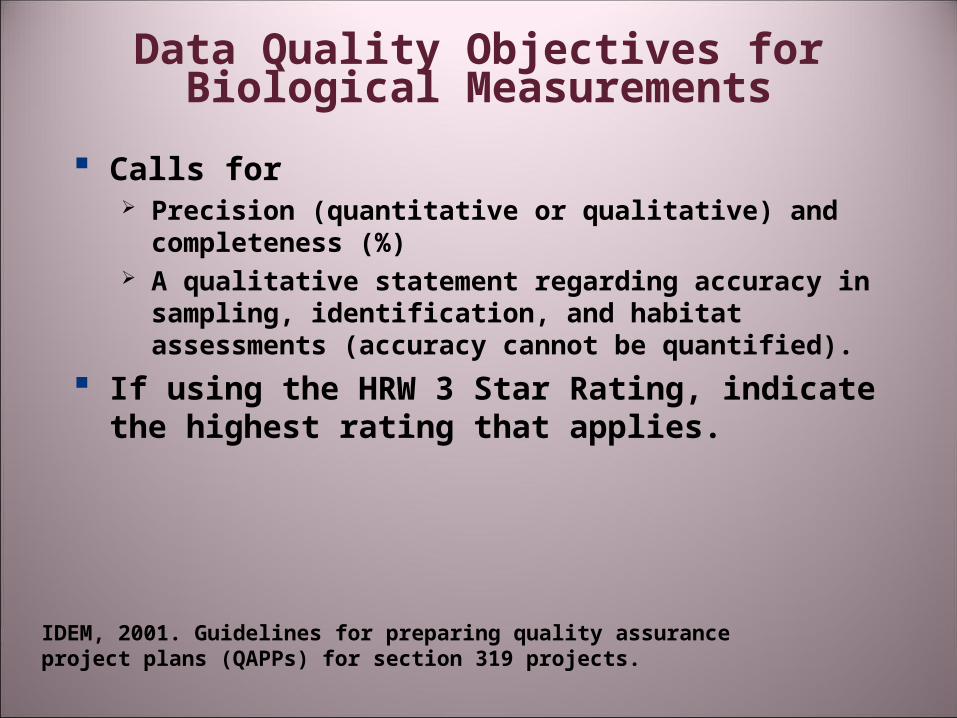
Data Quality Objectives for Biological Measurements
Calls for Precision (quantitative or qualitative) and
completeness (%) A qualitative statement regarding accuracy in
sampling, identification, and habitat assessments (accuracy cannot be quantified).
If using the HRW 3 Star Rating, indicate the highest rating that applies.
IDEM, 2001. Guidelines for preparing quality assurance project plans (QAPPs) for section 319 projects.
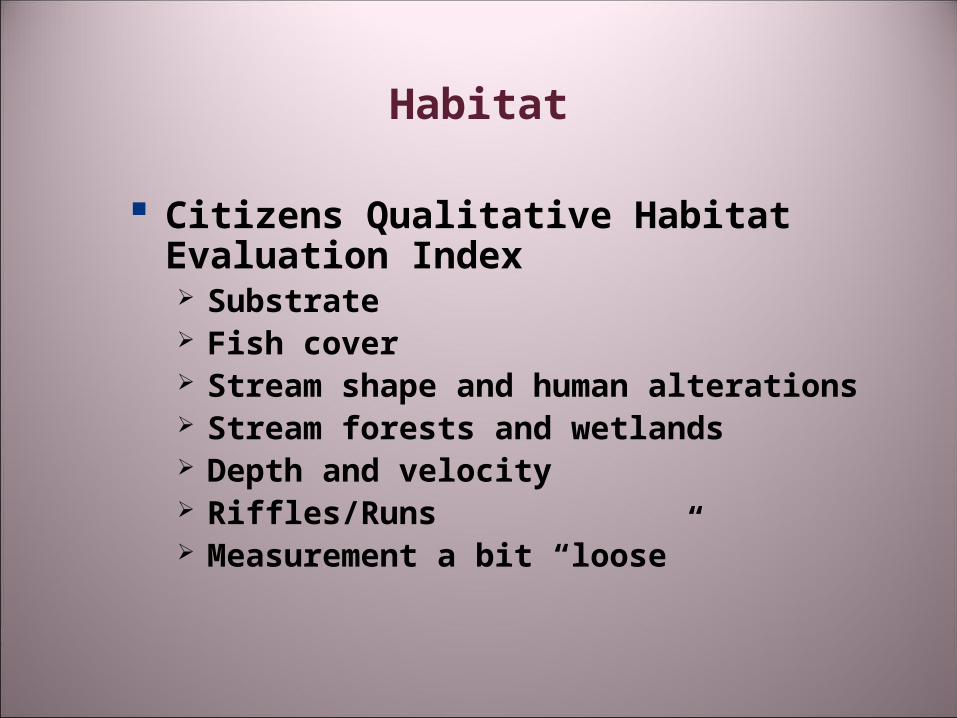
Habitat
Citizens Qualitative Habitat Evaluation Index Substrate Fish cover Stream shape and human alterations Stream forests and wetlands Depth and velocity Riffles/Runs Measurement a bit “loose”
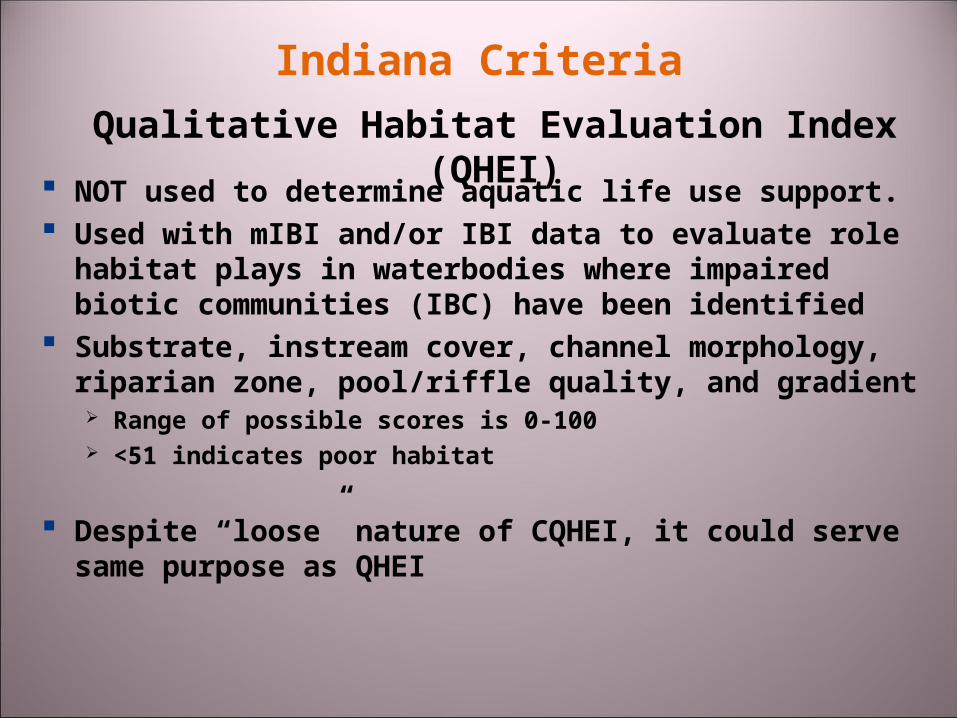
Indiana Criteria
Qualitative Habitat Evaluation Index (QHEI) NOT used to determine aquatic life use support.
Used with mIBI and/or IBI data to evaluate role habitat plays in waterbodies where impaired biotic communities (IBC) have been identified
Substrate, instream cover, channel morphology, riparian zone, pool/riffle quality, and gradient Range of possible scores is 0-100 <51 indicates poor habitat
Despite “loose” nature of CQHEI, it could serve same purpose as QHEI
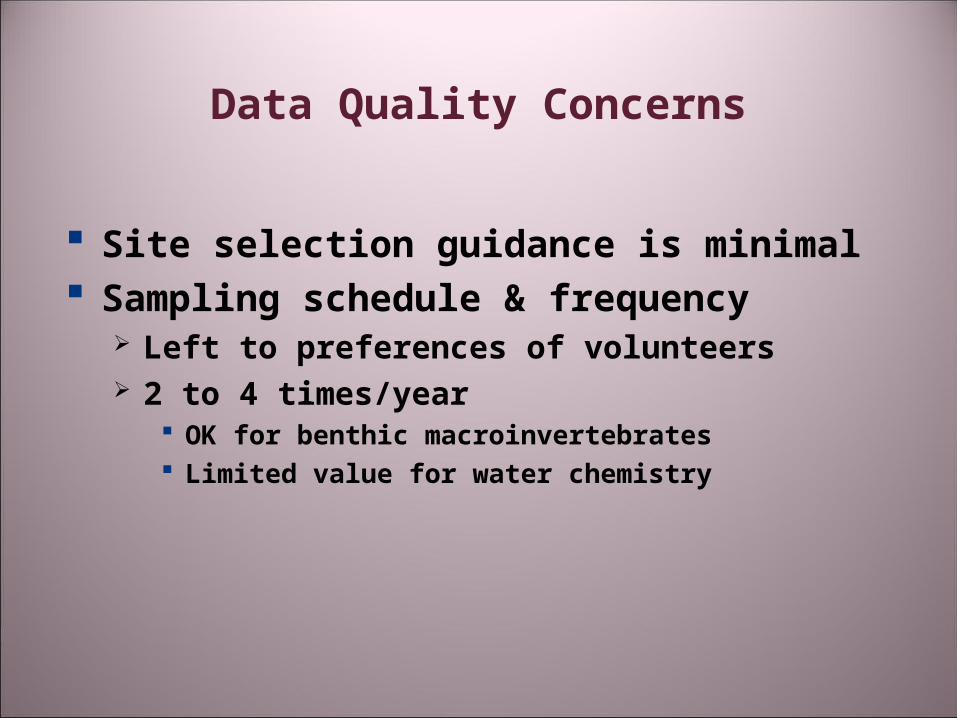
Site selection guidance is minimal Sampling schedule & frequency
Left to preferences of volunteers 2 to 4 times/year
OK for benthic macroinvertebrates Limited value for water chemistry
Data Quality Concerns
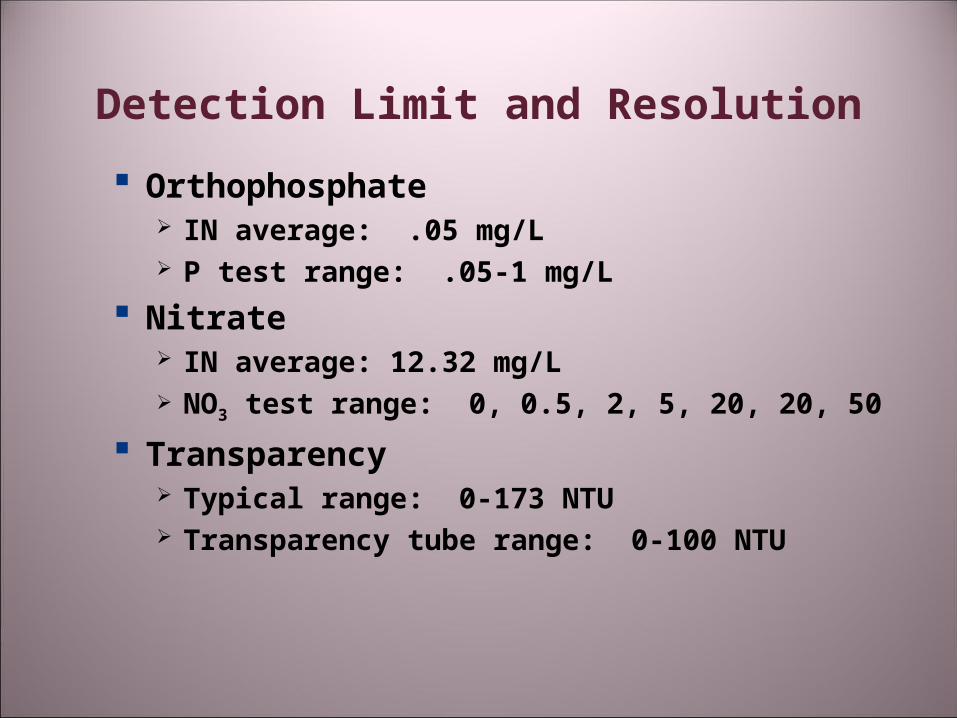
Detection Limit and Resolution
Orthophosphate IN average: .05 mg/L P test range: .05-1 mg/L
Nitrate IN average: 12.32 mg/L NO3 test range: 0, 0.5, 2, 5, 20, 20, 50
Transparency Typical range: 0-173 NTU Transparency tube range: 0-100 NTU
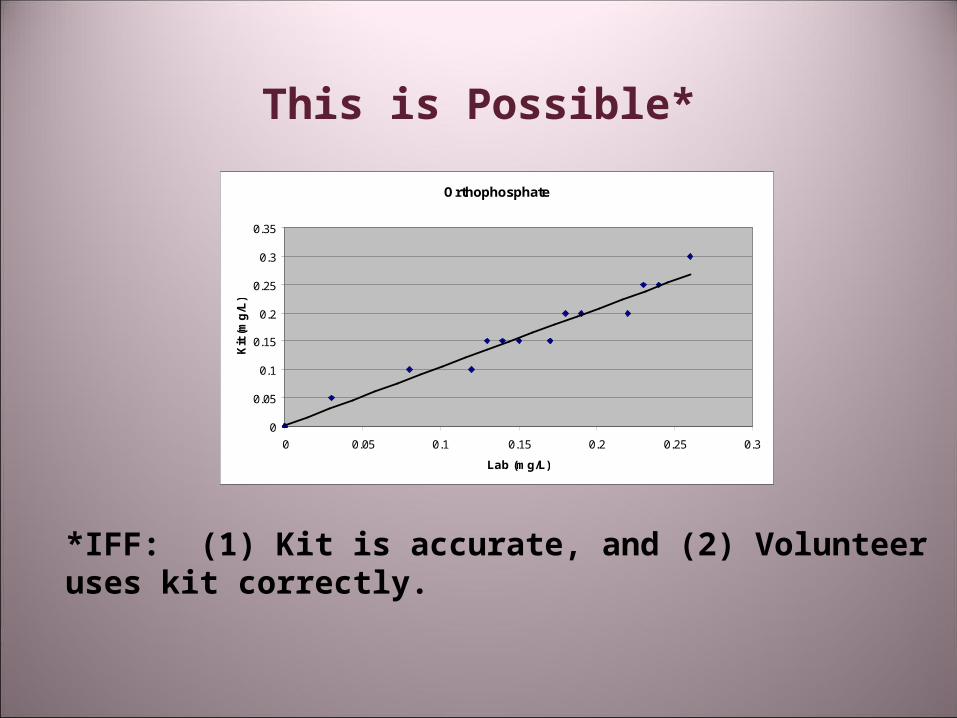
This is Possible*
Orthophosphate
0
0.05
0.1
0.15
0.2
0.25
0.3
0.35
0 0.05 0.1 0.15 0.2 0.25 0.3
Lab (mg/L)
Kit
(m
g/L
)
*IFF: (1) Kit is accurate, and (2) Volunteer uses kit correctly.
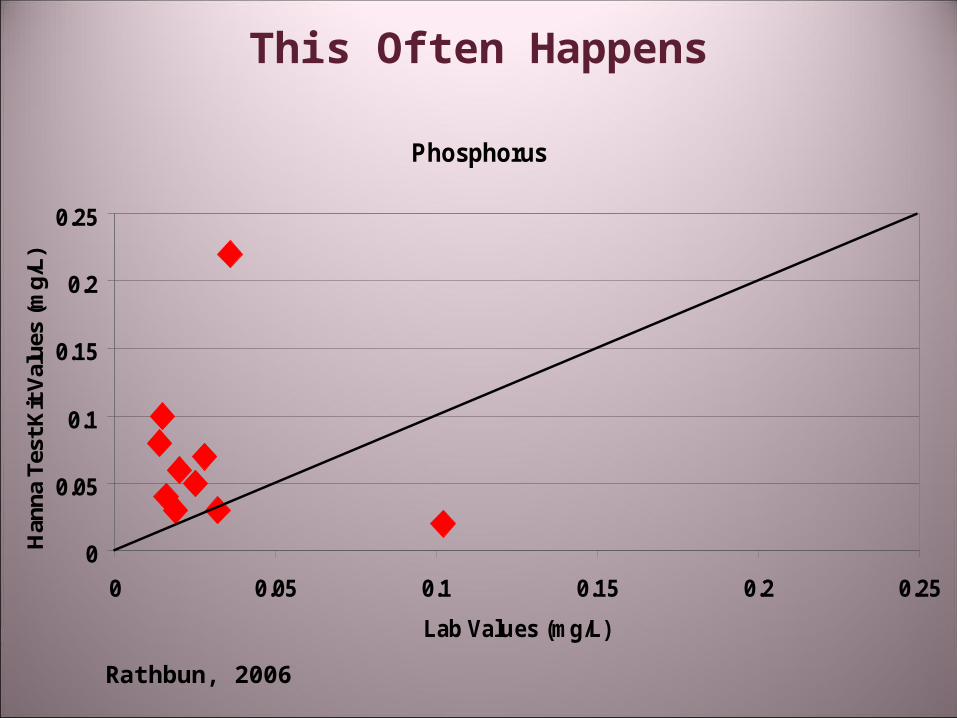
This Often Happens
Phosphorus
0
0.05
0.1
0.15
0.2
0.25
0 0.05 0.1 0.15 0.2 0.25
Lab Values (mg/L)
Han
na T
est K
it V
alue
s (m
g/L)
Rathbun, 2006
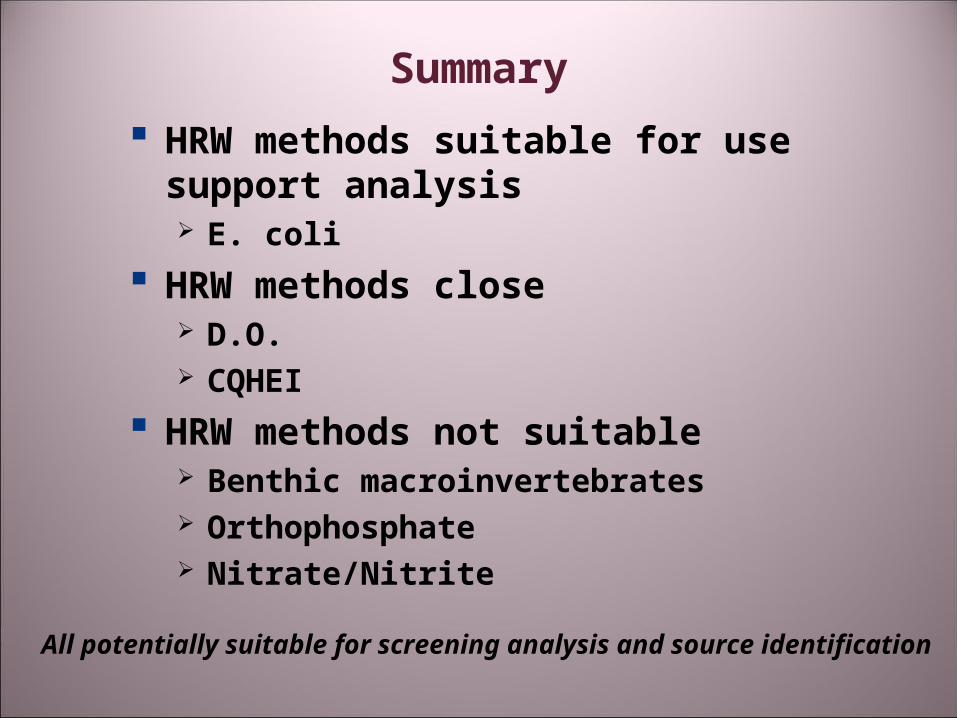
Summary
HRW methods suitable for use support analysis E. coli
HRW methods close D.O. CQHEI
HRW methods not suitable Benthic macroinvertebrates Orthophosphate Nitrate/Nitrite
All potentially suitable for screening analysis and source identification
References
Liukkonen, B. USEPA Region 5 SWIMS meeting, February 2006, University of Minnesota Water Resources Center, http://www.usawaterquality.org/volunteer/EColi/ResultsProducts.htm.
Rathbun, J. 2006. QA/QC Issues with Screening-Level Monitoring Methods, Michigan, DNR, Presentation at 14th National Nonpoint Source Monitoring Workshop, September 24-28, 2006, Minneapolis.