jukskei upper riverwatch report may 2016 · 1 jukskei river report edenvale riverwatch 14 may 2016...
TRANSCRIPT
1
Jukskei River Report Edenvale RiverWatch 14 May 2016
Jukskei Upper RiverWatch Report May 2016
Contents 1. Summary .................................................................................................................... 1
2. Profiles of the Jukskei River ....................................................................................... 2
3. Johannesburg CBD pollution ...................................................................................... 4
4. Alexandra pollution ..................................................................................................... 6
5. Sources ...................................................................................................................... 8
6. Contact ....................................................................................................................... 8
1. Summary
1. The Jukskei River has two major sources of pollution: sewage from Johannesburg CBD
and from Alexandra. In Quarter 2 2016 pollution and E coli counts decrease downstream
and river health improves, but in all cases the E coli count is unacceptably high and the
river health is always in the lowest ecological category which is “Very Poor”.
2. Johannesburg CBD and its effects on the downstream suburbs Bruma and Morninghill:
Over the ten year period from 2004 to 2014, downstream from the former Bruma Lake, E
coli counts have increased 100-fold, most of which happened between 2007 and 2009.
Over the last year, upstream from the former lake, E coli has been at around I million per
100 ml. Ekurhuleni monitors further downstream at Morninghill in Bedfordview, with
similar results. The Bruma Lake was emptied and removed late in 2014, but there is no
marked impact on sewage contamination downstream as shown by coliform tests. River
Health has improved at the Morninghill site from April 2015 to April 2016, which could be
a recovery from the effects of the lake removal.
3. Alexandra and downstream suburbs: E coli counts have increased steadily for the ten
years up to 2014 and have been around 1.5 million per 100 ml for the last year. The
impact of sewage from Alexandra on the Jukskei River must be at least as severe as that
from Johannesburg CBD. The volume of the river at Marlboro is about double that at
Bruma and the E coli counts are higher. From Marlboro the river flows through a stretch
of open veld before it meets suburbs at Buccleuch and has already improved by then,
yet the smell and litter problems are far greater than at Bruma and Morninghill. But the
greatest impact is on Alexandra itself.
About RiverWatch: “from anecdote to evidence”. RiverWatch promotes the use of
Citizen Science tools, together with formal information where available, to help people
understand their stream or river. This report brings some of that information together to give
a picture of the Jukskei River catchment, particularly the upper catchment.
2
Jukskei River Report Edenvale RiverWatch 14 May 2016
2. Profiles of the Jukskei River
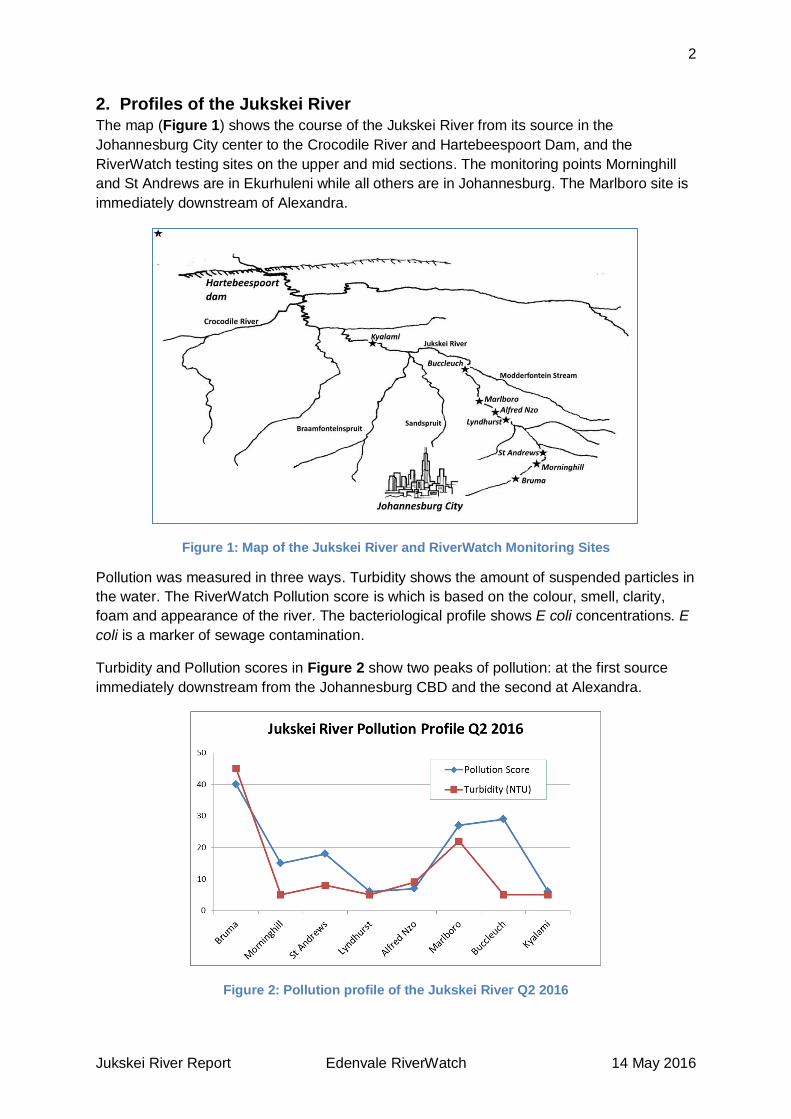
The map (Figure 1) shows the course of the Jukskei River from its source in the
Johannesburg City center to the Crocodile River and Hartebeespoort Dam, and the
RiverWatch testing sites on the upper and mid sections. The monitoring points Morninghill
and St Andrews are in Ekurhuleni while all others are in Johannesburg. The Marlboro site is
immediately downstream of Alexandra.
Figure 1: Map of the Jukskei River and RiverWatch Monitoring Sites
Pollution was measured in three ways. Turbidity shows the amount of suspended particles in
the water. The RiverWatch Pollution score is which is based on the colour, smell, clarity,
foam and appearance of the river. The bacteriological profile shows E coli concentrations. E
coli is a marker of sewage contamination.
Turbidity and Pollution scores in Figure 2 show two peaks of pollution: at the first source
immediately downstream from the Johannesburg CBD and the second at Alexandra.
Figure 2: Pollution profile of the Jukskei River Q2 2016
3
Jukskei River Report Edenvale RiverWatch 14 May 2016
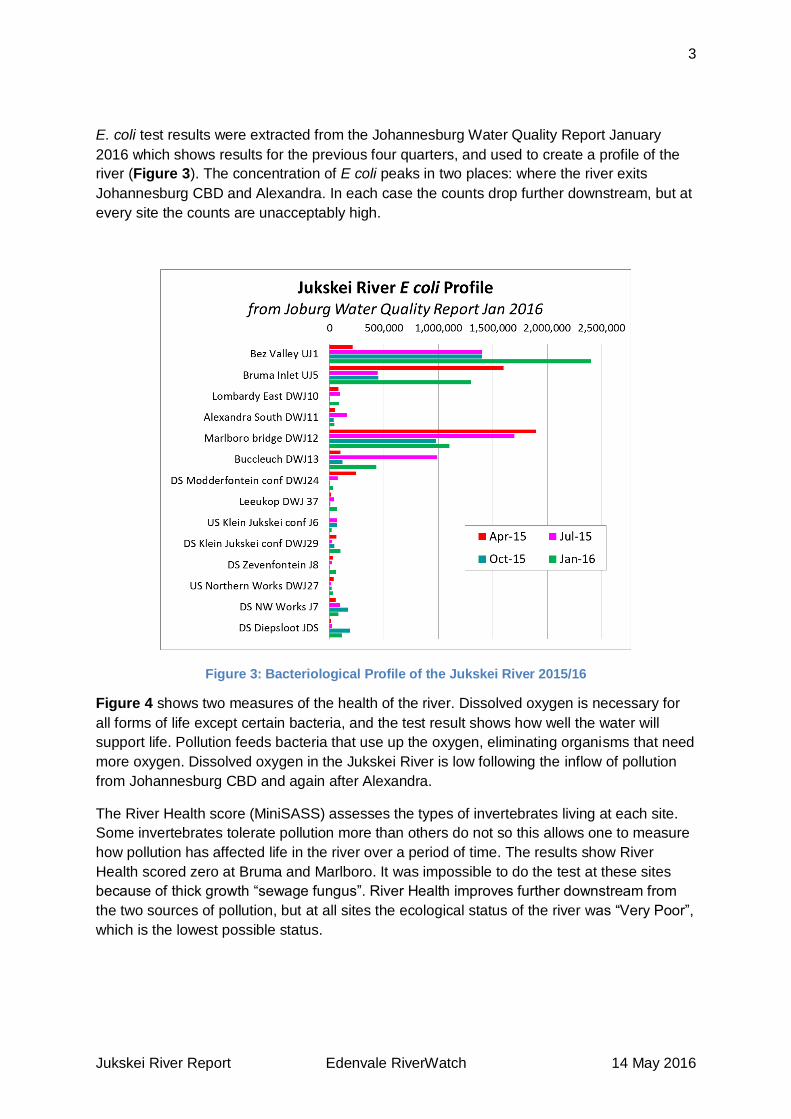
E. coli test results were extracted from the Johannesburg Water Quality Report January
2016 which shows results for the previous four quarters, and used to create a profile of the
river (Figure 3). The concentration of E coli peaks in two places: where the river exits
Johannesburg CBD and Alexandra. In each case the counts drop further downstream, but at
every site the counts are unacceptably high.
Figure 3: Bacteriological Profile of the Jukskei River 2015/16
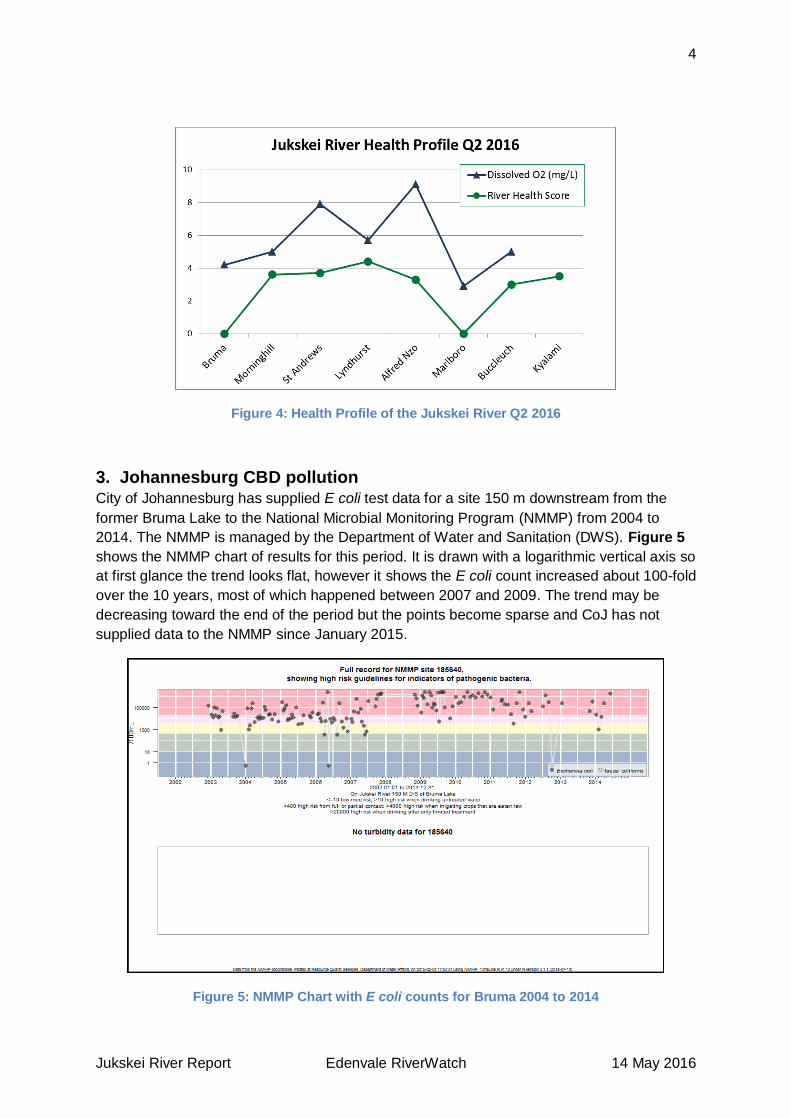
Figure 4 shows two measures of the health of the river. Dissolved oxygen is necessary for
all forms of life except certain bacteria, and the test result shows how well the water will
support life. Pollution feeds bacteria that use up the oxygen, eliminating organisms that need
more oxygen. Dissolved oxygen in the Jukskei River is low following the inflow of pollution
from Johannesburg CBD and again after Alexandra.
The River Health score (MiniSASS) assesses the types of invertebrates living at each site.
Some invertebrates tolerate pollution more than others do not so this allows one to measure
how pollution has affected life in the river over a period of time. The results show River
Health scored zero at Bruma and Marlboro. It was impossible to do the test at these sites
because of thick growth “sewage fungus”. River Health improves further downstream from
the two sources of pollution, but at all sites the ecological status of the river was “Very Poor”,
which is the lowest possible status.
4
Jukskei River Report Edenvale RiverWatch 14 May 2016
Figure 4: Health Profile of the Jukskei River Q2 2016
3. Johannesburg CBD pollution City of Johannesburg has supplied E coli test data for a site 150 m downstream from the
former Bruma Lake to the National Microbial Monitoring Program (NMMP) from 2004 to
2014. The NMMP is managed by the Department of Water and Sanitation (DWS). Figure 5
shows the NMMP chart of results for this period. It is drawn with a logarithmic vertical axis so
at first glance the trend looks flat, however it shows the E coli count increased about 100-fold
over the 10 years, most of which happened between 2007 and 2009. The trend may be
decreasing toward the end of the period but the points become sparse and CoJ has not
supplied data to the NMMP since January 2015.
Figure 5: NMMP Chart with E coli counts for Bruma 2004 to 2014
5
Jukskei River Report Edenvale RiverWatch 14 May 2016
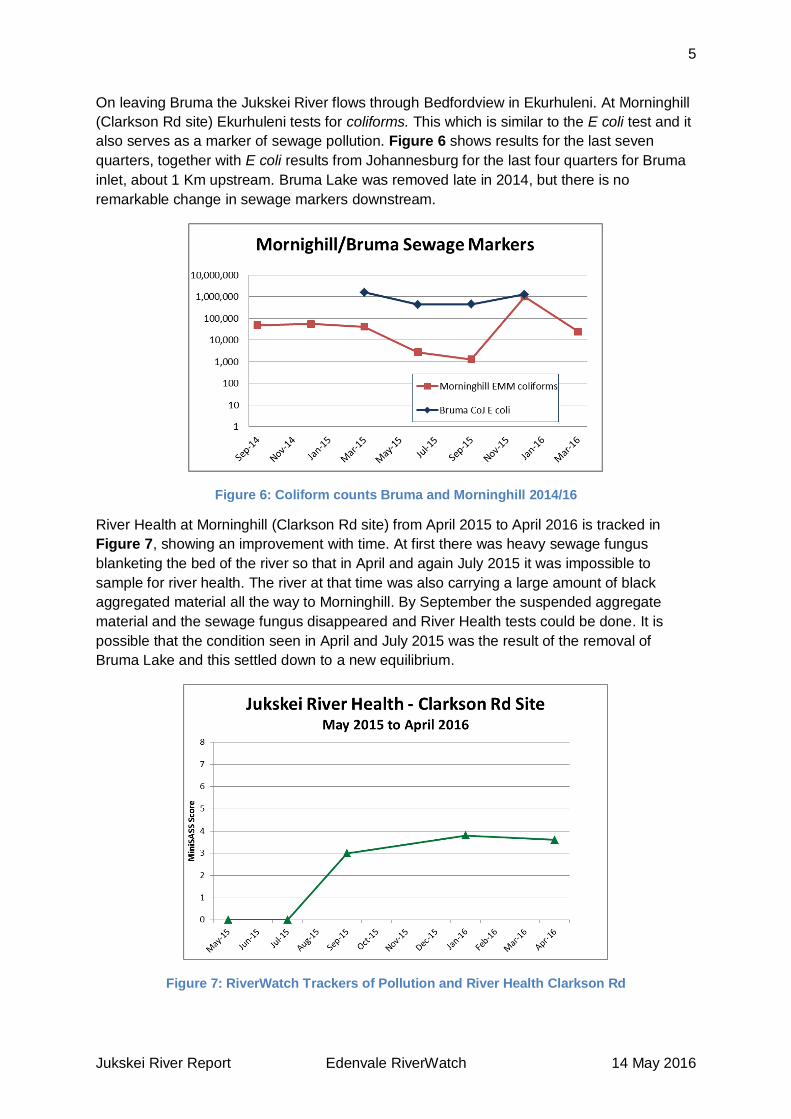
On leaving Bruma the Jukskei River flows through Bedfordview in Ekurhuleni. At Morninghill
(Clarkson Rd site) Ekurhuleni tests for coliforms. This which is similar to the E coli test and it
also serves as a marker of sewage pollution. Figure 6 shows results for the last seven
quarters, together with E coli results from Johannesburg for the last four quarters for Bruma
inlet, about 1 Km upstream. Bruma Lake was removed late in 2014, but there is no
remarkable change in sewage markers downstream.
Figure 6: Coliform counts Bruma and Morninghill 2014/16
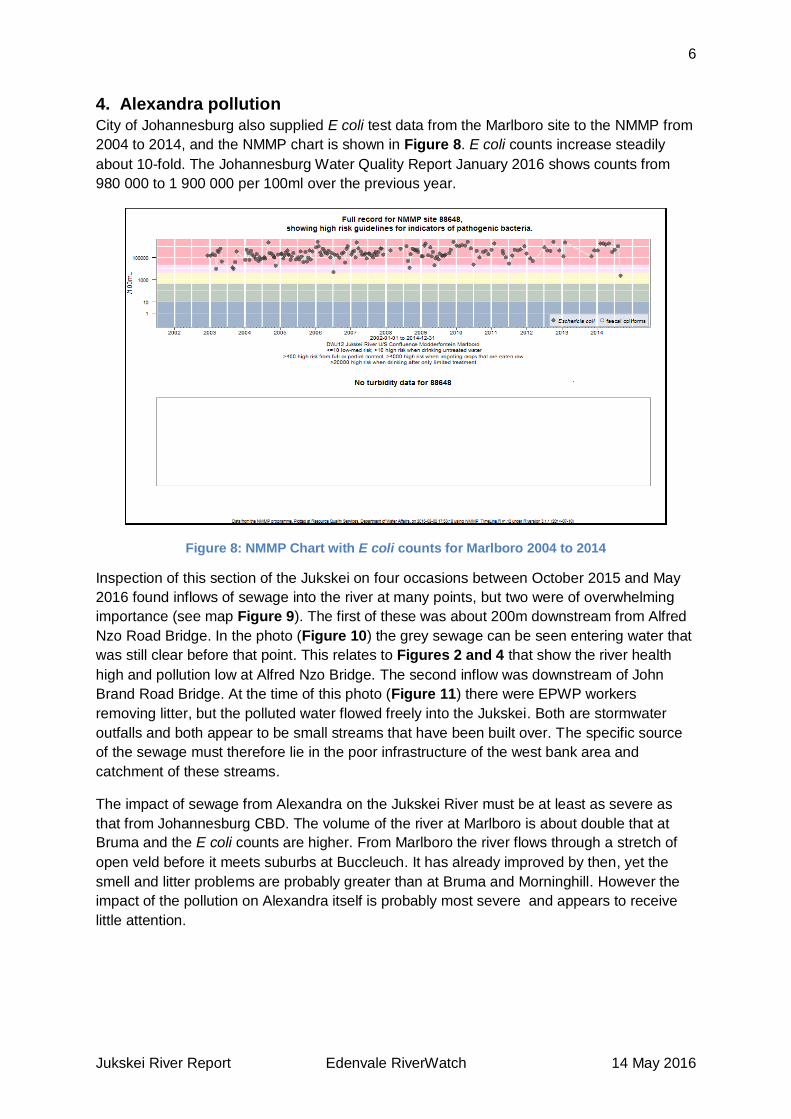
River Health at Morninghill (Clarkson Rd site) from April 2015 to April 2016 is tracked in
Figure 7, showing an improvement with time. At first there was heavy sewage fungus
blanketing the bed of the river so that in April and again July 2015 it was impossible to
sample for river health. The river at that time was also carrying a large amount of black
aggregated material all the way to Morninghill. By September the suspended aggregate
material and the sewage fungus disappeared and River Health tests could be done. It is
possible that the condition seen in April and July 2015 was the result of the removal of
Bruma Lake and this settled down to a new equilibrium.
Figure 7: RiverWatch Trackers of Pollution and River Health Clarkson Rd
6
Jukskei River Report Edenvale RiverWatch 14 May 2016
4. Alexandra pollution
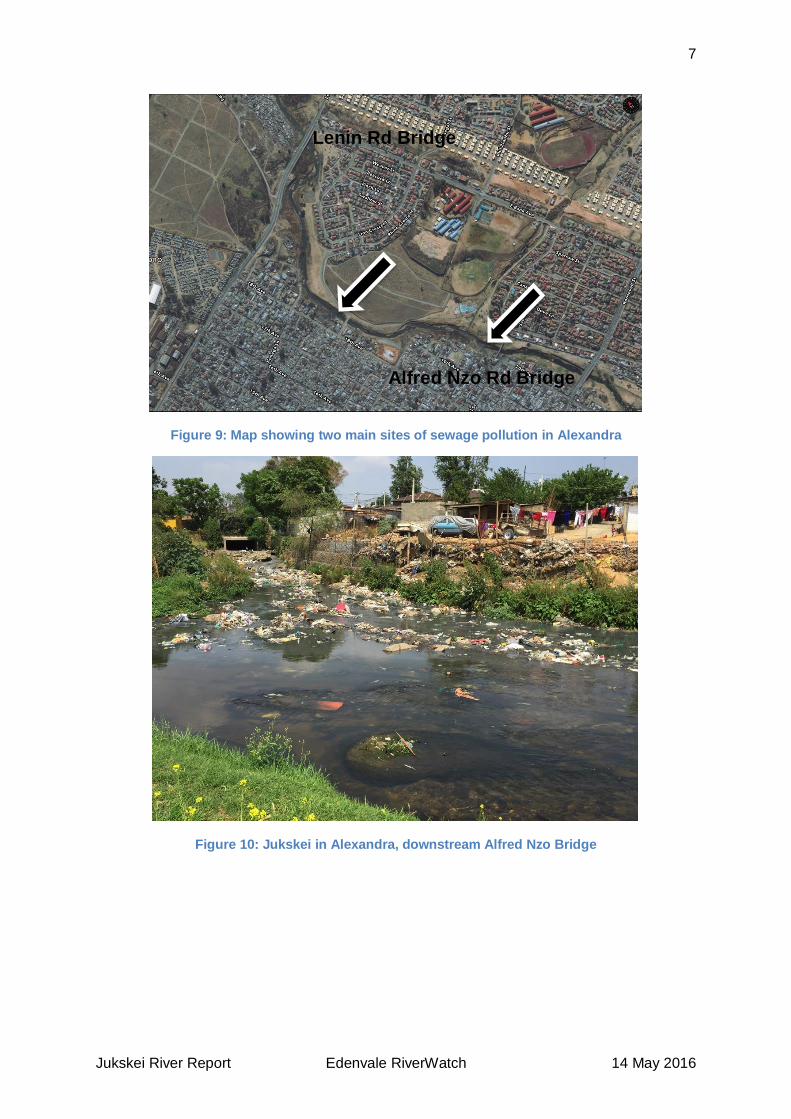
City of Johannesburg also supplied E coli test data from the Marlboro site to the NMMP from
2004 to 2014, and the NMMP chart is shown in Figure 8. E coli counts increase steadily
about 10-fold. The Johannesburg Water Quality Report January 2016 shows counts from
980 000 to 1 900 000 per 100ml over the previous year.
Figure 8: NMMP Chart with E coli counts for Marlboro 2004 to 2014
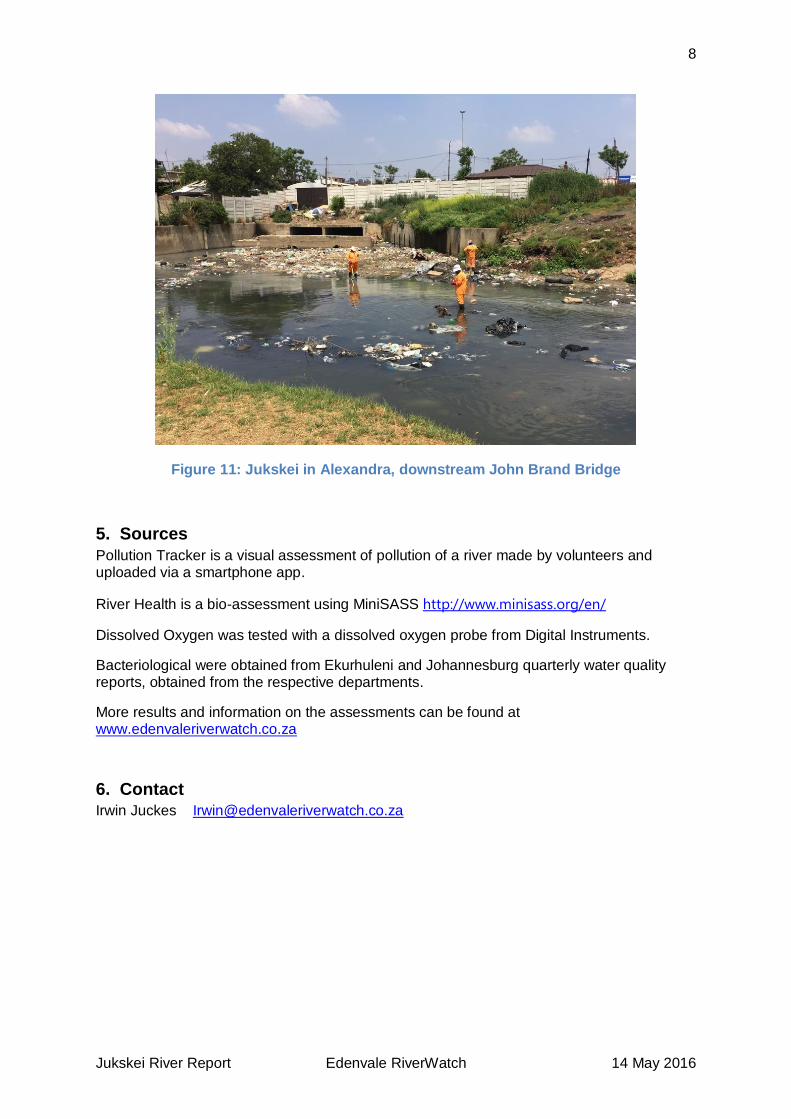
Inspection of this section of the Jukskei on four occasions between October 2015 and May
2016 found inflows of sewage into the river at many points, but two were of overwhelming
importance (see map Figure 9). The first of these was about 200m downstream from Alfred
Nzo Road Bridge. In the photo (Figure 10) the grey sewage can be seen entering water that
was still clear before that point. This relates to Figures 2 and 4 that show the river health
high and pollution low at Alfred Nzo Bridge. The second inflow was downstream of John
Brand Road Bridge. At the time of this photo (Figure 11) there were EPWP workers
removing litter, but the polluted water flowed freely into the Jukskei. Both are stormwater
outfalls and both appear to be small streams that have been built over. The specific source
of the sewage must therefore lie in the poor infrastructure of the west bank area and
catchment of these streams.
The impact of sewage from Alexandra on the Jukskei River must be at least as severe as
that from Johannesburg CBD. The volume of the river at Marlboro is about double that at
Bruma and the E coli counts are higher. From Marlboro the river flows through a stretch of
open veld before it meets suburbs at Buccleuch. It has already improved by then, yet the
smell and litter problems are probably greater than at Bruma and Morninghill. However the
impact of the pollution on Alexandra itself is probably most severe and appears to receive
little attention.
7
Jukskei River Report Edenvale RiverWatch 14 May 2016
Figure 9: Map showing two main sites of sewage pollution in Alexandra
Figure 10: Jukskei in Alexandra, downstream Alfred Nzo Bridge
Alfred Nzo Rd Bridge
Lenin Rd Bridge
8
Jukskei River Report Edenvale RiverWatch 14 May 2016
Figure 11: Jukskei in Alexandra, downstream John Brand Bridge
5. Sources
Pollution Tracker is a visual assessment of pollution of a river made by volunteers and uploaded via a smartphone app.
River Health is a bio-assessment using MiniSASS http://www.minisass.org/en/
Dissolved Oxygen was tested with a dissolved oxygen probe from Digital Instruments.
Bacteriological were obtained from Ekurhuleni and Johannesburg quarterly water quality reports, obtained from the respective departments.
More results and information on the assessments can be found at www.edenvaleriverwatch.co.za
6. Contact
Irwin Juckes [email protected]