using forensic methodology for …jebcl.com/symposium/wp-content/uploads/2011/07/pape… · web...
TRANSCRIPT

USING FORENSIC METHODOLOGY FOR CONTINUOUS AUDIT FILTERING BY DETECTING ABNORMAL WIRES IN AN
INSURANCE COMPANY: AN UNSUPERVISED RULE-BASED APPROACH
Preliminary Draft
Please Do Not Cite
1

SUMMARY
Fraud prevention and detection are important functions of internal control. Prior literature focused mainly on fraud committed by external parties such as customers. However, according to a 2009 survey by the Association of Certified Fraud Examiners (ACFE 2009), employees pose the greatest fraud threat. This study proposes profiling fraud using an unsupervised learning method. The fraud detection model is based on potential fraud/anomaly indicators in the wire transfer payment process of a major insurance company in the United States. Each indicator is assigned an arbitrary score based on its severity. Once an aggregate score is calculated, those wire transfer payments with total scores above a certain threshold will be recommended for investigation. This paper contributes to the literature on: 1) the usage fraud/anomaly indicators to detect potential fraud and/or errors on real data, 2) on its usage on a potential continuous audit framework, and 3) on a method to incorporate forensic type analysis into a modern error detection and prevention framework.
Key words: Continuous Auditing, Continuous Monitoring, Anomaly Detection, Fraud Detection, Unsupervised Learning
INTRODUCTION
2
The term fraud has been defined in many ways (SAS No. 99; ACFE 2004; Winn 2004; Lectric Law Library). However, one critical attribute found in common is that fraud is the intentional illegal theft from an organization for personal gains. Due to a series of financial scandals in the late 1990s and early 2000s, the AICPA issued SAS No. 99 which defined fraud and categorized it into two types: fraudulent financial reporting and misappropriation of assets. The former is misrepresentation of financial reports (e.g. earnings manipulation) by falsifying accounting records and/or omitting transactions. The latter occurs when assets are stolen or fraudulent expenditures are claimed. The ACFE’s definition of fraud is broader than SAS No. 99. It includes bribery and corruption in addition to the two types defined by SAS No. 99 (ACFE 1996).
External fraud is committed by an external party while internal fraud is committed by an employee. The framework of Jans et al. (2009) suggested three types for internal fraud: 1) statement or transaction fraud, 2) management or non-management fraud, and 3) fraud for or against a company. In this study, “fraud” or “internal fraud” will refer to internal transaction fraud against a company committed by either management or non-management.
Fraud occurs only when fraudsters have incentives/pressures, opportunities to commit fraud, and rationalization to justify their behavior (SAS No. 99). Anti-fraud activities are generally categorized into two groups: fraud prevention and detection. The former can be achieved by removing at least one of the conditions for fraud materialization. For example, fraud can be prevented by removing any incentives/pressures of a potential fraudster (also called fraud perpetrator). Also, if an enterprise’s internal control system is sufficiently effective, it will be difficult for fraudsters to find an opportunity to commit fraud. Lastly, fraud can be mitigated by educating employees to have business ethics so that fraudsters cannot justify their actions easily. Most of prevention methods are, however, difficult to implement and evaluate. For example, the incentives/pressures for fraud may be costly and difficult to control due to their qualitative characteristics. The effect of ethical education is difficult, if not impossible, to measure. As a result, a well-designed internal control system seems to be the only practical way to implement and evaluate fraud prevention and detection measures.
3

The Association of Certified Fraud Examiners (ACFE) in 2007 estimated that the cost of occupational fraud and abuse (hereinafter referred to as ‘internal fraud’) was approximately $994 billion in the US, which represents a loss in revenue of about 8 percent to businesses, up from $660 billion (6% loss of revenue) in 2004 (ACFE 2004). In 2009, the ACFE noted that the intense financial pressures of the current economic crisis have caused an increase in fraud and that employees posed the greatest fraud threat (48.3% increase in employee embezzlement from the previous year) (ACFE 2007). This increase in fraud may indicate ineffective internal controls and a lack of fraud detection/prevention systems. A company’s internal control system (ICS) is crucial for detecting and preventing fraud. A properly designed ICS facilitates reliable financial information by preventing, detecting, and correcting potentially material errors and irregularities on a timely basis. Fraud committed by employees has received little attention in the literature while fraud by outsiders, such as customers, has been greatly researched. This may be partly due to lack of data or fear of losing competitive advantage (Bolton and Hand 2002; Phua et al. 2005). However, recent financial scandals have clearly shown that fraud by employees affects a company’s revenue more adversely than that by outsiders does.
As fraud by employees (or internal fraud) is increasingly considered, it is timely to examine how an enterprise can prevent and detect fraud. This study proposes and tests an unsupervised rule-based model which utilizes the transactional data of a major insurance company to check for fraud committed by employees.
The rest of the paper proceeds as follows. In the following section, we provide a literature review on fraud detection and prevention methods used in prior research. Next, the methodology section will discuss the data and the model used in this study followed by the result and findings. The final section summarizes this study and discusses future research.
LITERATURE REVIEW
Fraud Detection and Prevention as a Way of Continuous Auditing
4

The Auditing Concepts Committee (AAA 1972) defined auditing as “a systematic process of objectively obtaining and evaluating evidence regarding assertions about economic actions and events to ascertain the degree of correspondence between those assertions and established criteria and communicating the results to interested users.” Consequently, the focus of auditing is verification of management assertions including the proposed financial reports (Alles et al. 2004). Continuous auditing broadens this concept by proposing timelier assurance, generally with less aggregated (e.g. transactional) data, than traditional auditing.
Vasarhelyi and Halper (1991) first introduced the concept of continuous auditing when they developed a monitoring tool in an online IT environment. Its rationale is to provide more timely assurance by continuously monitoring a company’s entire transactional data. This suggestion did not draw much attention from academia or practice for a decade due to skepticism about its feasibility and effectiveness. Recently, this concept has progressively received more attention in both academia and practice. After a series of recent financial scandals (e.g. WorldCom and Enron), researchers, practitioners and regulators have looked for possible solutions to prevent future financial disasters. Continuous auditing (CA) is believed to be a promising approach, drawing much attention from both researchers and practitioners.
Although the CA literature has grown (Brown et al, 2007), the majority of papers have focused on the technical perspectives of CA (Vasarhelyi and Halper 1991; Kogan et al. 1999; Woodroof and Searcy 2001; Rezaee et al. 2002; Murthy 2004; Murthy and Groomer 2004). A few papers discuss other aspects of CA such as its concepts and research directions (Alles et al. 2002 and 2004; Elliott 2002). Unfortunately, very few papers (Alles et al. 2004 and 2006) have focused on empirical studies on CA due to a lack of available data. Traditional auditing studies can use publicly available aggregated data, while research on CA is greatly benefited by disaggregated, transaction level data which is typically kept private by companies. However, empirical studies are an indispensable component of CA research in order to justify and verify its practical feasibility. The nature of fraud prevention/detection is similar to that of continuous auditing: the aim is to detect and correct anomalies in a timely manner. In other words, fraud prevention/detection is a part of continuous auditing.
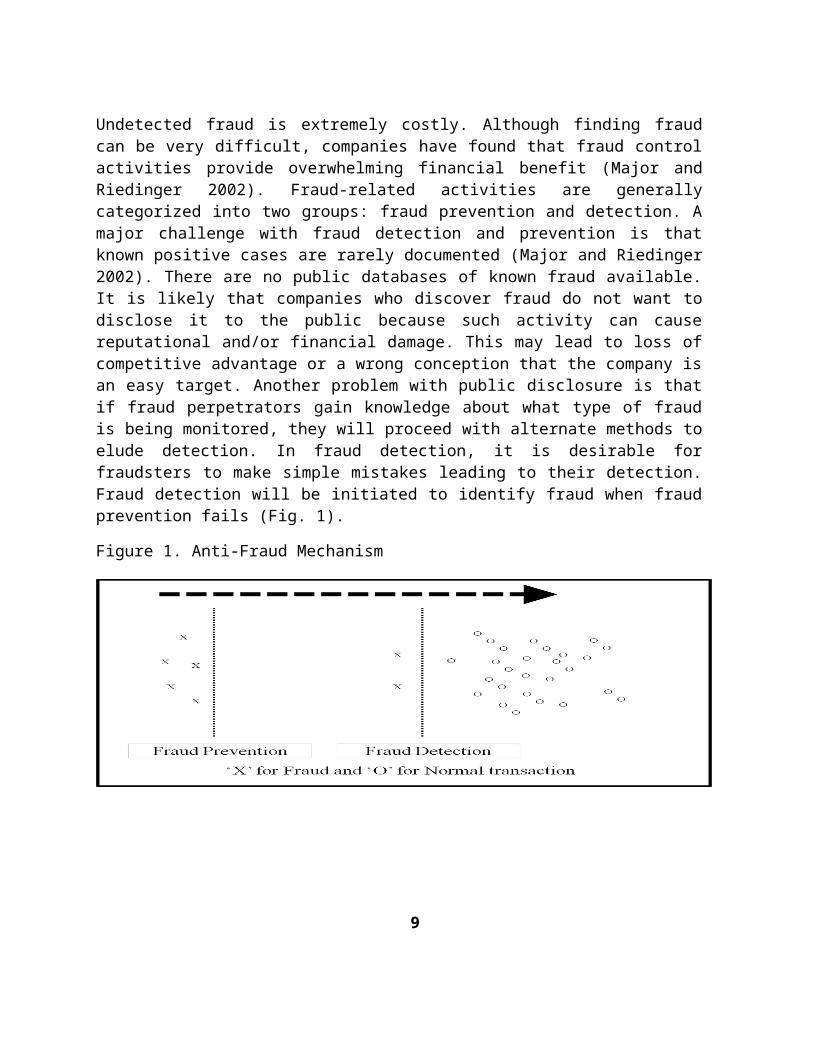
Undetected fraud is extremely costly. Although finding fraud can be very difficult, companies have found that fraud control activities provide overwhelming financial benefit (Major and Riedinger 2002). Fraud-related activities are generally categorized into two groups: fraud prevention and detection. A major challenge with fraud detection and prevention is that known positive cases are rarely documented (Major and Riedinger 2002). There are no public databases of known fraud available. It is likely that companies who discover fraud do not want to disclose it to the public because such activity can cause reputational and/or financial damage. This may lead to loss of competitive advantage or a wrong conception that the company is an easy target. Another problem with public disclosure is that if fraud perpetrators gain knowledge about what type of fraud is being monitored, they will proceed with alternate methods to elude detection. In fraud detection, it is desirable for fraudsters to make simple mistakes leading to their detection. Fraud detection will be initiated to identify fraud when fraud prevention fails (Fig. 1).
5

Figure 1. Anti-Fraud Mechanism
Fraud is elusive so that a company can never be sure of its absence. Nevertheless, it is prudent to reduce fraud risk by using prevention and detection to actively monitor business processes. However, it is not cost effective to check each and every business transaction for fraud given that companies have limited resources. As a result, applying mathematical algorithms to data might be an effective and efficient way to capture possible evidence of fraud (Phua et al. 2005). Data mining is a technique that is often discussed in research and used in practice to detect fraud with mathematical algorithms. Data mining methods typically provide outliers/anomalies which can be investigated further by internal auditors. However, algorithms producing too many outliers/alarms can adversely affect effectiveness and efficiency. On the other hand, a model producing too few alarms is not desirable either because it may suffer from false negatives, which are usually more costly than false positives (Phua et al. 2005). Taken together, a fraud detection model should generate a reasonable number of exceptions for investigation by balancing effectiveness and efficiency. In general, organizations remain unaware when the fraud prevention controls have failed. Consequently, fraud detection should be continuously applied regardless of existing fraud prevention methods (Bolton and Hand 2001 and 2002). Another notable attribute of fraud detection is that methods must be updated and applied continuously. The relationship between fraud and fraud detection is like that between a computer virus and an antivirus program. While known computer viruses can be effectively detected and corrected by antivirus software, new viruses are always being introduced. Unless the antivirus software is updated to adapt to new viruses, its detection power will be diminished. At the same time, the antivirus must keep the detection ability to capture the known viruses since a computer system can be attacked by the known viruses. A fraud detection method must be highly adaptive to detect the new types of fraud while keeping the existing detection ability to prevent the identifiable types (Bolton and Hand 2001; Winn 1996).
6

Supervised and Unsupervised method of Fraud Detection
Supervised Methods
7

There are two main methods used in the literature to detect fraud: supervised and unsupervised. The most frequently used research methodology is classification (or supervised) methods. Supervised methods utilize prior information (also called labeled information) that contains both legitimate and fraudulent transactions, while unsupervised methods do not require any labeled data. Under the supervised method, a database of known fraudulent or legitimate cases is used to construct models used to detect fraud (Bolton and Hand 2002). The models are trained by prior labeled data, and then fraudulent and legitimate transactions are discriminated in accordance with those models. These methods assume that the pattern of fraud in the future will be the same as that in the past. Neural network models which use the supervised method appear frequently in recent research (Bolton and Hand 2002; Kou et al. 2004; Phua et al. 2005).
Although often used in research, supervised methods pose several limitations resulting from their heavy dependence on reliable prior knowledge about both fraudulent and legitimate transactions. This may be impractical since prior information might be incorrect, since most companies do not have sufficient resources to examine every transaction. Consequently, some of those transactions labeled as legitimate are likely fraudulent, and therefore fraud detection models based on this information may be misleading (Bolton and Hand 2002). Another limitation of the supervised method is that the results are often not easily understood. This may be a substantial obstacle to implement fraud detection models since few enterprises can afford the requisite expertise (Sherman 2002). As a result, few enterprises would be interested in implementing the supervised method in practice. This is similar to analytical review procedures used by auditors where many sophisticated methods have been developed but simple methods dominate in practice. Another limitation is that a supervised model is not easily adjustable.
A major concern in fraud prevention/detection research is that models may work only for the data that is used in creating the models. The generalizability of fraud profiles is highly dependent on the context of the original model development and on the target environment. For example, if new data comes into the dataset, those models may not work due to either over-fitting to the training dataset or unknown fraud types. In addition, the robustness of models is a major concern during extension, re-utilization, and adaptation. Considering that fraud perpetrators adapt to find loopholes in an enterprise’s current fraud prevention/detection system, this can be a critical weakness. In order to adapt to unknown types of attacks, it is important that the systems should be dynamically extendable and adjustable. Last but not least, the supervised methods suffer from uneven class sizes of legitimate and fraudulent observations. Generally, the number of fraudulent observations is greatly outnumbered by that of legitimate ones. About 0.08% of annual observations are fraudulent (Hassibi 2000). In other words, even if a model classifies all fraudulent transactions as legitimate regardless of their true identities, the error rate (the number of correctly classified transactions/the total number of transactions) of the model is extremely small, which can be misleading.
Unsupervised Methods
8
Unsupervised methods have received far less attention in literature than supervised methods. Unsupervised methods focus on detection of changes in behavior or unusual transactions (i.e. outliers) by using data-mining methods. Anomaly/outlier detection is the recognition of patterns in data that do not conform to expected behavior (Chandola et al. 2009). The major advantage of unsupervised methods is that they do not require labeled information, which is generally unavailable due to censorship (Bolton and Hand 2002; Kou et al. 2004; Phua et al. 2005). The results are not disclosed in public either to maintain an enterprise’s competitive advantage or because of public benefits (Little et al. 2002).
Unsupervised methods usually employ suspicion scoring systems that estimate the degree of departure from the norm by utilizing if-then type of outlier rules. Rule-based systems are increasingly used to represent experiential knowledge. The criteria to determine whether a transaction is an outlier may change for various reasons such as cost and efficiency. Decision making by if-then rules is similar to a human’s cognitive decision processes, which enables internal auditors to understand and adjust the models if necessary. However, verification/ evaluation of the newly devised models is often difficult, if not impossible, due to lack of testable data. To tackle this weakness, methods such as peer group analysis, where groups with similar profiles are compared, and break point analysis, where recent transactions are compared with past patterns, can be used (Bolton and Hand 2001).
The results of unsupervised methods are not direct evidence that flagged transactions are fraudulent. Instead, the aim of unsupervised methods is to inform that flagged transactions are more anomalous, tending toward either error or fraud, based on the experience, analysis, and preconceptions of the analysts. In other words, a flagged transaction can be legitimate, error, or fraudulent. This outcome is clearly different from that of supervised methods, where outcomes are either legitimate or fraudulent. As Jans et al. (2009) described, an outlier can occur via mistakes (i.e. unintentional errors). It can be said that unsupervised methods consider broader causes than supervised methods. Furthermore, a transaction will be worthy of further investigation if it is flagged by multiple criteria, since normal transactions are unlikely to be flagged by many indicators. Analogous to other rule-based systems, the actual examination of selected transactions allows for re-parameterization and improvement of the method. However, the verification of resulting flagged transactions requires internal auditors’ direct examination (Fig. 2).
Figure 2. Anomaly Detection Process
9
Despite the drawbacks of unsupervised methods, they may be indispensable at the initial implementation stage where prior labeled information is rarely available. In addition, considering that it is ultimately internal auditors who will use and maintain fraud prevention/detection models and that only a few enterprises can afford the expertise necessary for them, a rule-based approach may be desirable for internal auditors (Sherman 2002). The pros and cons of supervised and unsupervised methods are summarized in Table. 1.
10

Table 1: Pros and Cons: Supervised vs. Unsupervised Methods
Supervised Methods Unsupervised Methods
Pros 1. Accurate for known fraud types
2. Results: fraudulent or not
1. Easy to apply and update
2. Unknown fraud can be found
3. Observations with both types are not necessary
4. Results: worthy of further investigation/attention
Cons 1. Highly unbalanced class sizes (1 out of 1,200)
2. False negatives
3. May work only for known fraud types
4. Highly dependent on historic data that may not be accurate
5. Lower understandability
1. Less accurate than complex methods in the short term
2. As accurate as complex methods in the long term
3. Requires auditor verification
The next section discusses the application of these concepts to the wire transfers of a major US insurance company.
METHODOLOGY
11

Overview
This pilot study involves a major US insurance company that is proceeding towards developing a continuous audit / fraud detection process. To that end, it was decided that a research team would cooperate with the internal audit organization to develop basic modeling and analysis methodologies in parallel with their internal audit process. The project plan entailed a set of progressive steps in the development of an automated discrepancy detection process.
Once the process and models are developed, the data extraction process will be made frequently and systematically, progressing towards more frequent data screening to monitor potential fraud. The model proposed is similar to an external stand-alone system which is used to extract and analyze data for exceptions in continuous auditing (Vasarhelyi & Halper, 1991; Searcy and Woodroof, 2001; Rezaee et al., 2002; Murthy and Groomer, 2004).
Wire payment data is extracted from the production legacy information systems and analyzed externally. This is beneficial since running an automatic fraud detection system can be intensive on the production system which might cause the system to operate sub-optimally. Pathak et al. (2005) found that auditing transactions in batches was more cost effective than initiating periodic audits after a certain period of time. Our model proposes that the fraud detection should occur in batches. Before an audit, the internal auditors can extract the desired data and run the fraud detection mechanism. Any resulting exceptions can be investigated during the regular audit. The wire transfer process was chosen as a desirable first target due to: 1) data availability, 2) volume and importance of the process, 3) availability of knowledgeable and competent internal audit staff for knowledge engineering, and 4) timing of the audit.
The wire transfer payment process did not seem as well-controlled as other processes in place. Furthermore, the company did not have documented historical information about past fraud occurrences. As a result, we must assume that there was no known fraud in the past. However, this lack of past experience does not necessarily mean that there was no fraud in the wire transfer process. Consequently, it was appropriate that the fraud detection and prevention model should be based on the unsupervised method. The objective was to create a statistical model to detect potential anomalies within wire payment transactions. Internal auditors would further investigate selected transactions for anomalies.
The indicators were divided into target and trend indicators. The target indicators are pass/fail type tests and the trend indicators are timing-related statistical tests. Our research objective was to focus solely on trend indicators by creating and running statistical algorithms to detect abnormal behavior or patterns in wire transfer payments (Table. 2).
12

Table 2. Potential Fraud Indicators: Trend Tests
Potential fraud indicators Possible screening rules to test
The payment amount to a payee is abnormally large or small.
Amount range for each payee (or all payees) & check outliers.
The payee transaction payment trend line over time has a positive slope.
Correlation between date (or sequence numbers) and payee amounts for each payee
The payee is an outlier to payee baseline activity. (Payment sent to a payee that normally does not receive payments)
Payee frequency by each initiator & check the payees that have the lowest frequencies.
The initiator / approver transaction payment amount is out of the range of baseline payment amounts.
First, check the transaction amts with their authorization amts. Second, calculate 90, 95, or 99PI. And then find the transactions that are beyond these bounds.
The transaction amount is out of range of normal activity from this bank account.
The 90, 95, and 99 PI amts for each sending/receiving bank account and check the exceptions.
The transaction initiator is not a normal sender from this bank account.
First, check the list of sender bank account, then create exception lists of initiators by originating bank account.
The transaction payee is not a normal receiver from this bank account.
A list of payees by sending banks who have least frequency.
Access to the bank account is commingled with many other types of transactions.
A list of bank accounts with wire types that have the least frequency.
13

Data
The dataset in this study consisted of wire transfer payments that were made by the company over a year, consisting of over 225,000 wire payments paid to over 10,000 payees. Approximately 90% of the wire transfer payments belonged to approximately 10% of the payees. More interestingly, 62.82% of the payees were involved in only one transaction while 93.84% of the payees were involved in less than 30 transactions. The insurance company provided the dataset in the form of seven tables (or files). The table primarily used in the study was the Wires table with 27 attributes whose records span from October 2007 to September 2008. The number of transactions was reduced to 229,531 after removing irrelevant records (for example, 12 rows of totals). The other six tables are master files that are referenced by the Wires table. The master files keep employee information such as start date, status of employment, rank status, and authorization limits. These attributes are mainly used to check employee authorization limits. The descriptive statistics for four numeric attributes: wire amounts, initialization limits, approval limits, and settlement limits are shown in Table. 3.
Table 3. Descriptive Statistics
Table All_wires trans_by_group trans_by_group trans_by_group
Variable AMOUNT Approval limit Initialization Limit
Settlement Limit
N 229,531 8,239 8,239 8,239
Nmiss 0 0 0 0
Avg 4,793,957 167,685,975 80,232,688 606,870
Median 70,242 10,000,000 0 0
Std 79,213,746 452,077,500 325,524,629 24,628,745
Min 0 0 0 0
Max 13,260,787,693 9,814,999,869 7,806,759,586 1,000,000,000
range 13,260,787,693 9,814,999,869 7,806,759,586 1,000,000,000
Wire Transfer Payment System
14

Figure 3: Wire Transfer Payment System
Wires processed within the wire transfer system can belong to one of four types: random, repetitive, concentration, and batch. These categories are based on the number of payments, and on operational effectiveness and efficiency. The wire transfer system also has controls to assign users to specific bank account groups, and users assigned to specific transaction groups can only process certain transaction types.
Model Development Process
The overall model development consists of five stages based on data mining methods. Once relevant information is collected, an initial brainstorming with internal auditors is performed. This process determines potentially relevant sources of indicators and rules. Once a model with a collection of rules is complete, transactional data are tested with the model. Each indicator is assigned an arbitrary score based on the severity of the related potential fraud. Once a payment is processed through different indicators and scored, an aggregate total is calculated and those wire transfer payments above a given threshold are suggested for investigation. The resulting observations are verified by internal auditors and the verification results are used to update the model. This process is reiterated until satisfactory results are found. Most importantly, the development process is iterative and interactive. The overall process is shown in Fig. 4.
15

Figure 4: Overall Model Development Process
Note. Activities surrounded by parentheses, “(“ and “)”, are performed after the first round
The initial phase of the study involved obtaining a general understanding of the company’s wire transfer payment system and the corresponding data. Understanding the system and its internal controls is important to facilitate the creation of indicators and algorithms to supplement and support the controls in place. To understand the data, basic characteristics and layouts were obtained, along with descriptive statistics including mean, average, range (min/max), distributions, etc. This gave a general quantitative understanding of the data and the types of wire transfer payments being made. Next the research team and the internal IT audit team brainstormed ideas for indicators that might potentially illuminate anomaly/outlier transactions, based on the notion that the anomalies/outliers produced might be meaningful as fraud indicators. These indicators were transformed into statistical algorithms which utilized data mining techniques.
16
Verificationby Internal Auditors
Modeling(Re-modeling)
Rule Creation (addition/deletion/rev
ision)
Discussion with Internal Auditors
Information collection

The indicators mainly consisted of three types of statistics; prediction, correlation, and frequency test. Using these types of statistics on the data allowed the determination of anomalies or patterns. Each indicator was scored based on fraud risk: a score of one for low risk, three for moderate, and five for high. Scores were based on the professional judgment of the internal audit department. After running the wire transfers through the different analyses, suspicion scores were aggregated to determine what total score should be used as the cutoff/threshold for further investigation by the internal audit team. Upon completion of the investigation, the internal audit department verifies whether the flagged transactions were fraudulent.
In addition, internal audit will suggest how to improve the model and the indicators. The model should constantly adapt to new findings. Since fraud is persistent in nature, the fraud detection/prevention process should be continuously run and updated. The target tests performed by the company are not discussed in this study in order to prevent harming the insurance company’s fraud detection efforts.
Trend Indicators
The three statistical algorithms used are 1) prediction interval, 2) correlation test, and 3) frequency test.
Prediction Interval Test
The prediction interval test involved stratifying payees into four categories: 1) payees with one wire payment, 2) payees with two wire payments, 3) payees with three to twenty-nine wire payments, and 4) payees with thirty or more wire payments. Wires were stratified by the number of observations by group for statistical interpretations. The stratification was made for payees, initiators, and approvers. In addition, alternative alpha prediction intervals of 90%, 95%, 99% were also considered. A higher alpha level will have fewer outliers and, conversely, a lower alpha level will have more outliers. For payees with only one wire payment, a prediction interval was estimated by grouping the payee’s wire payment together with other payees who have only one wire payment in order to determine which payments were abnormal compared to the group as a whole. The prediction interval was applied to payees with thirty or more wires. For payees who have only two wire payments and for payees with three to twenty nine payments, future research may use some type of statistical clustering method to detect outliers.
Correlation Test
17

The correlation test examined how each payee’s payment amounts increased or decreased in a manner inconsistent with other payees’ transaction patterns. Activity monitoring (Fawcett and Provost, 1999) is adopted for this type of test. It requires the maintenance of a usage profile for each payee or employee in order to determine any deviation in activity. In contrast to the prediction interval test, the minimum number of required observations to calculate correlation is three, so two groups were created: those with more than three wires, and those without. The degree of overall increase of wire amounts are determined by the correlation value and its p-value for its statistical significance. In the literature, various correlation values are suggested to decide whether observations are positively correlated. However, more than 0.3 is generally regarded positively correlated. The threshold 0.5 is used in this study.
Frequency Test
Depending on what are considered typical or normal activity patterns, we can determine which wire payments are anomalies or outliers. Frequency tests can help determine normal activity patterns. Infrequent activities may indicate potential errors or fraud. Frequency tests entail examining each payee and the employee initiating wire payments to determine which pairs had unusual activity.
For example, unusual activity can be a payee interacting with an uncommon employee or group of employees for the first time. Typically, a payee typically encounter many different initiators and approvers in the company. It follows that encounters with only the same initiator or approver would not be considered normal.
Scoring System
The scoring of the indicators was developed with the assistance of the internal IT audit department. The knowledge engineering of experienced professionals (Vasarhelyi and Halper, 1991) allows for the determination of types of indicators to be considered abnormal or potentially fraudulent. An effective internal audit team may have the ability to identify indicators that suggest fraud (AICPA 2002). Each indicator was assigned a score based on perceived risk. After each indicator is processed through the statistical algorithms, violation totals for each payment were tallied. Those wire transfers that violated a certain total aggregate score were subject to investigation by the internal auditors. However, in practice, it is difficult for internal auditors to allocate a large amount of time to investigate exceptions. In running the initial algorithms, an enormous number of exceptions were found. Kogan et al. (1999) discuss the cognitive effect of information overload. An overload of alarms will have a negative effect on the internal audit department to adopt our fraud detection system.
As a result, it is necessary to increase the threshold score in order to reduce the number of flagged wire transfers. The summary statistics of the aggregated scores is displayed in Fig. 5.
18

Figure 5: Suspicion Scores and their thresholds for further investigation
The number of exceptions was narrowed to 47 from 106, which is a more reasonable number of flagged transactions for internal auditors to investigate.
Results and Emerging Issues
Results
19

The internal audit team investigated the 47 wire transfer payments during their normal audit. No evidence was found to support that the suggested wires were either fraudulent or erroneous. Although the fraud detection/ prevention model did not find fraudulent wire payments, this does not mean that there were no anomalous payments. Instead, this may indicate the need for revision and fine-tuning of the model. The company intends to include the fraud detection process as a part of regular audit, retaining these indicators for future detection or preventive measures. In addition, the company is interested in refining the indicators and adding new ones to screen for anomalies. As a matter of fact, the company should consistently reevaluate and revise the model considering the highly adaptive nature of fraud perpetuators.
Internal Control Issues
During the study, the effectiveness of the company’s internal control cames into question. Three main issues emerged: 1) certain controls meant to segregate the duties of employees were violated, 2) terminated employees remained able to process payments, and 3) wire payment limits were circumvented because employees with even $0 limits were able to process wire payments. These major internal control issues were brought to the attention of the internal audit department and were investigated. The internal auditors found that there were inconsistencies between the wire transfer payment process records and human resource records. The discrepancy is caused by the company keeping only the most recent information. For example, a terminated employee might have been an active employee when he initiated/approved a wire transfer. Although these internal control violations appeared to be clearly potential fraud indicators, investigation of their nature and frequency suggested that these violations were due to poor database management. However, this does not exclude a chance of fraudulent activity.
Scoring System Issues
During the investigation, the internal audit department noted that some wires were flagged due to systematic causes that were mainly attributed to the target tests. Each of the target tests’ indicators was scored a risk level of high (the highest score) and as a result, a flag raised by a few of these indicators will most likely hit the threshold for investigation. This may suggest that an equally-weighted scoring system may be more useful as a starting point than an unequally-weighted one. However, some indicators are clearly more important than others. As long as the indicators are subjectively assigned weights, this issue may return. Further deliberation will be necessary to find less subjective weighing methods for the indicators. The finding further illustrates that any fraud system must be continuously developed and updated as new flaws with the current system surface.
CONCLUSIONS
20

This paper provides a pilot study for fraud detection at a major US insurance company. Although the literature has discussed numerous methods for fraud detection, there have been few that have used real company data. Data mining was used as the approach to detect fraud, with statistical algorithms created to detect data abnormalities. Since much of the prior research uses complex methods such as neural networks and clustering to detect fraud, the use of simple statistics such as prediction interval, frequency test, and correlation test may seem trivial. However, it is not uncommon that simple methods are as robust and powerful as and sometimes more accurate than more sophisticated methods. This study leaves out data analysis for payees with between 2 and 29 wire payments due to the lack of statistical significance. Future research can look into implementing other types of statistical methods such as clustering for detecting abnormal or patterned activity. The company plans to further pursue data mining in a continuous effort to detect fraud.
This study provides a learning experience for academics by showing how a fraud detection and prevention model is implemented. In addition, this study shows that internal auditors can run fraud detection and prevention activities on a frequent basis instead of during an annual audit. Two issues require further consideration: 1) high subjective weighting of most indicators yielded extreme numbers of violations, and 2) as the pilot study was progressing, some of the indicators needed to be adjusted due to an increasing understanding of data characteristics.
21

REFERENCES
22

Alles, M. G., A. Kogan, M. A. Vasarhelyi. 2002. Feasibility and economics of continuous assurance, Auditing: A Journal of Practice and Theory. Vol. 21, No. 1.
———. 2004. Restoring auditor credibility: tertiary monitoring and logging of continuous assurance systems. International Journal of Accounting Information Systems.
———, and J. Wu. 2006. Analytical procedures in continuous auditing: Continuity equations models for analytical monitoring of business processes . American Accounting Association Annual Conference.
———, and J. Wu. 2004. Continuity equations: Business process based audit benchmarks in continuous auditing. American Accounting Association Annual Conference.
American Accounting Association, Committee on Basic Auditing Concepts. 1972. 1969-71. The Accounting Review. Supplement. Vol. 47 Issue 4: 14-74.
American Institute of Certified Public Accountants, I. A. 2002. Management antifraud programs and controls: Guidance to help prevent, deter, and detect fraud.
Association of Certified Fraud Examiners. 2009. Occupational fraud: a study of the impact of an economic recession.
———. 1996. Report to the Nation on Occupational Fraud and Abuse.
———. 2004. Report to the Nation on Occupational Fraud and Abuse.
———. 2007. Report to the Nation on Occupational Fraud and Abuse.
Bolton, R. J., and D.J. Hand. 2001. Unsupervised profiling methods for fraud detection. Credit Scoring and Credit Control VII.
———. 2002. Statistical fraud detection: A Review. Statistical Science. 17(3): 235-249.
Brown, C.E., J.A. Wong, and A.A. Baldwin. 2007. A review and analysis of the existing research streams in Continuous Auditing. Journal of Emerging Technologies in Accounting, 4 (1): 1-28.
Chandola, V., A. Banerjee, and V. Kumar. 2009. Anomaly detection: a survey. ACM Computing Surveys. Vol. 41(3), Article 15.
Elliott, R. K. 2002. Twenty-first century assurance. Auditing: A Journal of Practice & Theory. 21 (1), 139.
Fawcett, T., and F. Provost. 1999. Activity monitoring: noticing interesting changes in behavior. The fifth ACM SIGKDD international conference on knowledge discovery and data mining. San Diego, California, United States.
23

Hassibi, K. 2000. Chap. 9. Detecting payment card fraud with neural networks. Business applications of neural networks: the state-of-the-art of real-world applications. World Scientific Publishing Co. Pte. Ltd. Edited by Lisboa, P. J., Edisbury, B., Vellido, A.
Jans, M., N. Lybaer, and K. Vanhoof. 2009. A framework for internal fraud risk reduction at it integrating business processes: the ifr framework. The International Journal of Digital Accounting Research. Vol. 9: 1-29.
Kogan, A., E. F. Sudit, and M. A., Vasarhelyi. 1999. Continuous online auditing: a program of research. Journal of Information Systems. 13(2): 87-103
Kou, Y., C. Lu, and S. Sirwongwattana. 2004. Survey of fraud detection techniques. Networking, Sensing and Control, 2004 IEEE International Conference on Knowledge Discovery and Data Mining.
Lectric Law Library, Fraud, to Defraud. http://www.lectlaw.com/def/f079.htm
Little, B. B., W. L. Jr. Johnston, A. C. Lovell, R. M. Rejesus, and S. A. Steed. 2002. Collusion in the U.S. crop insurance program: applied data mining. The eighth ACM SIGKDD international conference on knowledge discovery and data mining.
Major, J. A., and D. R. Riedinger. 2002. EFD: A hybrid knowledge/statistical-based system for the detection of fraud. The Journal of Risk and Insurance 69(3): 309-324.
Murthy, U. S. 2004. An analysis of the effects of continuous monitoring controls on e-commerce system performance. Journal of Information Systems. 18(2): 29-47.
———, and M. S. Groomer. 2004. A continuous auditing web services model for XML-based accounting systems. International Journal of Accounting Information Systems. 5(2): 139-163.
Pathak, J, B. Chaouch, and R. S. Sriram. 2005. Minimizing cost of continuous audit: Counting and time dependent strategies. Journal of Accounting and Public Policy. Vol. 24, Issue 1: 61-75.
Phua, C., V. Lee, K. Smith, and R. Gayler. 2005. A comprehensive survey of data mining based fraud detection research. Artificial Intelligence Review.
Rezaee, Z., A. Sharbatoghlie, R. Elam, and P. L. Mcmickle. 2002. Continuous auditing: building automated auditing capability. Auditing: A Journal of Practice & Theory. Vol. 21.
Sherman, E. 2002. Fighting web fraud, security: the internet has made it easier for crooks to ripe you company off. Here’s how businesses can protect themselves and their customers. Newsweek. June 2010.
Statement on Auditing Standards No. 99. 2002. Consideration of fraud in a financial statement audit. Auditing Standards Board of the American Institute of Certified Public Accountants.
24

Vasarhelyi, M.A., F. B. Halper. 1991. The continuous audit of online systems. Auditing: A Journal of Practice & Theory. 19 (1): 110-125.
Winn, T. J., Jr. 2004. Fraud detection - A primer for SAS programmers. SUGI 31.
———. 1996. Using data mining techniques for fraud detection: a best practice approach to government technology solutions. SAS Institute. Whitepapers.
Woodroof, J., and D. Searcy. 2001. Continuous audit implications of internet technology: triggering agents over the web in the domain of debt covenant compliance. The 34th Hawaii International Conference on System Sciences.
25