using flow cytometry to estimate pollen dna - annals of botany
TRANSCRIPT

TECHNICAL ARTICLE
Using flow cytometry to estimate pollen DNA content: improved methodologyand applications
Paul Kron* and Brian C. Husband
Department of Integrative Biology, 50 Stone Road E., University of Guelph, Guelph, Ontario, Canada* For correspondence. E-mail [email protected]
Received: 6 March 2012 Returned for revision: 26 April 2012 Accepted: 24 May 2012 Published electronically: 7 August 2012
† Background and Aims Flow cytometry has been used to measure nuclear DNA content in pollen, mostly tounderstand pollen development and detect unreduced gametes. Published data have not always met the high-quality standards required for some applications, in part due to difficulties inherent in the extraction of nuclei.Here we describe a simple and relatively novel method for extracting pollen nuclei, involving the bursting ofpollen through a nylon mesh, compare it with other methods and demonstrate its broad applicability and utility.† Methods The method was tested across 80 species, 64 genera and 33 families, and the data were evaluated usingestablished criteria for estimating genome size and analysing cell cycle. Filter bursting was directly comparedwith chopping in five species, yields were compared with published values for sonicated samples, and themethod was applied by comparing genome size estimates for leaf and pollen nuclei in six species.† Key Results Data quality met generally applied standards for estimating genome size in 81 % of species and thehigher best practice standards for cell cycle analysis in 51 %. In 41 % of species we met the most stringent cri-terion of screening 10 000 pollen grains per sample. In direct comparison with two chopping techniques, ourmethod produced better quality histograms with consistently higher nuclei yields, and yields were higher thanpreviously published results for sonication. In three binucleate and three trinucleate species we found thatpollen-based genome size estimates differed from leaf tissue estimates by 1.5 % or less when 1C pollen nucleiwere used, while estimates from 2C generative nuclei differed from leaf estimates by up to 2.5 %.† Conclusions The high success rate, ease of use and wide applicability of the filter bursting method show thatthis method can facilitate the use of pollen for estimating genome size and dramatically improve unreducedpollen production estimation with flow cytometry.
Key words: Pollen, flow cytometry, unreduced gametes, genome size, nuclei extraction, 2n pollen, cell cycle.
INTRODUCTION
Flow cytometry has become an important tool for measuringnuclear DNA content in plant biology, with applications incrop and horticultural science (Leus et al., 2009), genomesize research (Leitch and Bennett, 2007), and other areas ofpopulation and evolutionary biology (Kron et al., 2007).Publications featuring the DNA content of pollen nuclei repre-sent a small subset of that work, numbering fewer than one ayear since Van Tuyl et al.’s (1989) study of Lilium pollen(Table 1).
Despite their relative scarcity, these pollen studies haveincluded several different goals and applications, most ofwhich can be placed into three broad categories. Flow cyto-metric measurement of DNA content has been used to studythe development of pollen, ranging from observations aboutthe nuclear replication stages in mature pollen (Van Tuylet al., 1989; Bino et al., 1990; Sugiura et al., 1998) to multi-stage developmental studies (Pan et al., 2004) and examina-tions of nuclei development in pollen tubes (Pichot and ElMaataoui, 2000; Hirano and Hoshino, 2009). In a second ap-plication, measurements of pollen DNA have been used todetect individuals and experimental treatments that producerelatively high numbers of unreduced (2n) pollen grains, typic-ally in a horticultural context (e.g. Okazaki et al., 2005;
Akutsu et al., 2007; Van Laere et al., 2009). In a third and ar-guably distinct application, flow cytometry is used to quantifythe proportions of different nuclei types produced by indivi-duals with sufficient rigour to allow for statistical comparisonsbetween treatments or individuals. This includes two studiescomparing male- and female-determining pollen numbers inRumex species (Błocka-Wandas et al., 2007; Stehlik et al.,2007), but more often concerns the production of 2n pollen.These studies have included attempts to compare flow cyto-metric enumeration of 2n pollen with other ploidy indicators,such as pollen size (e.g. Van Tuyl et al., 1989; Dewitteet al., 2009), and to identify developmental stages when 2npollen production occurs (Pan et al., 2004). A fourth applica-tion, the use of pollen nuclei to determine genome size ofplants, remains to be developed.
Along with this array of applications comes a variety ofnuclei extraction methods (Table 1; for a broader review in-cluding non-flow cytometry papers, see Suda et al., 2007a).The most common is the standard method in plant flow cyto-metry, chopping with a razor blade, first introduced byGalbraith et al. (1983). Variations on this method includefirst germinating the pollen (Pichot and El Maataoui, 2000;Hirano and Hoshino, 2009) and chopping pollen in a frozenblock of buffer (Stehlik et al., 2007). Two-thirds of thepapers we have identified that measured the DNA content of
# The Author 2012. Published by Oxford University Press on behalf of the Annals of Botany Company. All rights reserved.
For Permissions, please email: [email protected]
Annals of Botany 110: 1067–1078, 2012
doi:10.1093/aob/mcs167, available online at www.aob.oxfordjournals.org
Dow
nloaded from https://academ
ic.oup.com/aob/article/110/5/1067/170760 by guest on 05 D
ecember 2021
pollen nuclei at least tested some form of chopping. Whenother methods were used, they were typically presented asoffering some improvement over chopping such as greaterefficiency, which implies higher nuclei numbers withoutsignificant increases in effort (sonication, Pan et al., 2004;bead-beating, Roberts, 2007). More often, experiments withother methods are presented as attempts to improve on histo-gram quality, emphasizing increases in nuclei numbers anddecreases in debris. Two such methods, for which improve-ments are claimed, are sonication (Pan et al., 2004) andosmotic bursting, sometimes in combination with overnightgermination or enzymatic treatments (Dewitte et al., 2006,2009; Hirano and Hoshino, 2009).
These attempts to improve nuclei extraction imply thatexisting methods may not always produce results of sufficientquality. However, the definition of ‘sufficient quality’ variesby application, and minimum standards are not always welldefined. For genome size studies in general, 1300 nuclei inthe G0/G1 fluorescence peak has been proposed (Greilhuberet al., 2007) and coefficients of variation (CVs) under 5 %are widely recommended for these peaks (Bennett andLeitch, 1995; Dolezel et al., 2007; Greilhuber et al., 2007).In comparison, qualitative screening to identify individualsproducing large numbers of 2n gametes may be accom-plished with relatively low-quality output (histograms), in-cluding high CVs and modest nuclei numbers. Similarly,establishing qualitative associations between large or abnor-mal pollen and polyploidy status may require little morethan the ability to identify the number of peaks present andtheir approximate fluorescence (e.g. Okazaki et al., 2005;Van Laere et al., 2009).
In contrast, higher standards are needed for precise quantifi-cation of proportions of 1C, 2C and 4C nuclei, as in
statistically rigorous studies of unreduced gamete frequenciesor comparisons of 2C nuclei counts with other ploidy indica-tors. No such set of standards has been described specificallyfor pollen nuclei, but the precise measurement of relative pro-portions of different nuclei types has equivalent statisticaldemands to cell cycle analysis and, in fact, may be consideredas cell cycle analysis in developmental studies (e.g. Pan et al.,2004). Consensus standards for clinical cell cycle analysis doexist, and these include a minimum of 10 000 nuclei in thecombined peaks of interest, CV , 8 % and aggregate anddebris levels under 20 % in the region of analytical interest(Shankey et al., 1993; Ormerod et al., 1998). While thedemands of individual studies may differ, these consensusstandards for genome size and cell cycle analyses provideuseful benchmarks when evaluating methods in pollen flowcytometry.
We have developed protocols for extracting nuclei byforcing pollen against a nylon or polyester mesh that requiresno special equipment, similar time and effort as chopping, andthat generates high-quality results across a wide range ofspecies. A similar method for bursting pollen with stainlesssteel mesh was briefly described by Okazaki et al. (2005)and used by Akutsu et al. (2007) and Nukui et al. (2011).None of these papers provided details concerning the relativequality of samples prepared in this way, and the method wasused only for qualitative identification of 2n pollen producers.Our objectives here are (1) to describe this method in detail,(2) to test the effectiveness of the method across an extensiveand taxonomically diverse set of species, (3) to compare thequality of output with chopping and the nuclei yield with son-ication, and (4) to compare genome size estimates from pollennuclei with those from leaf tissue and test the hypothesis thatthe two are not significantly different.
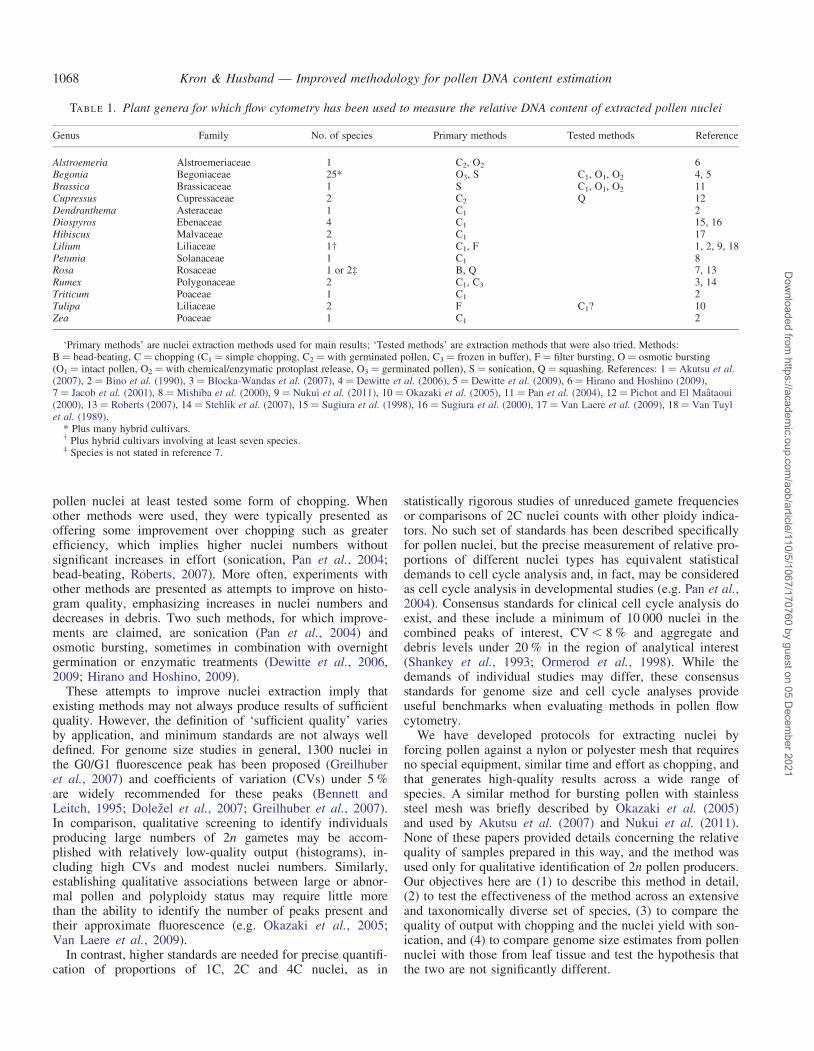
TABLE 1. Plant genera for which flow cytometry has been used to measure the relative DNA content of extracted pollen nuclei
Genus Family No. of species Primary methods Tested methods Reference
Alstroemeria Alstroemeriaceae 1 C2, O2 6Begonia Begoniaceae 25* O3, S C1, O1, O2 4, 5Brassica Brassicaceae 1 S C1, O1, O2 11Cupressus Cupressaceae 2 C2 Q 12Dendranthema Asteraceae 1 C1 2Diospyros Ebenaceae 4 C1 15, 16Hibiscus Malvaceae 2 C1 17Lilium Liliaceae 1† C1, F 1, 2, 9, 18Petunia Solanaceae 1 C1 8Rosa Rosaceae 1 or 2‡ B, Q 7, 13Rumex Polygonaceae 2 C1, C3 3, 14Triticum Poaceae 1 C1 2Tulipa Liliaceae 2 F C1? 10Zea Poaceae 1 C1 2
‘Primary methods’ are nuclei extraction methods used for main results; ‘Tested methods’ are extraction methods that were also tried. Methods:B ¼ bead-beating, C ¼ chopping (C1 ¼ simple chopping, C2 ¼ with germinated pollen, C3 ¼ frozen in buffer), F ¼ filter bursting, O ¼ osmotic bursting(O1 ¼ intact pollen, O2 ¼ with chemical/enzymatic protoplast release, O3 ¼ germinated pollen), S ¼ sonication, Q ¼ squashing. References: 1 ¼ Akutsu et al.(2007), 2 ¼ Bino et al. (1990), 3 ¼ Błocka-Wandas et al. (2007), 4 ¼ Dewitte et al. (2006), 5 ¼ Dewitte et al. (2009), 6 ¼ Hirano and Hoshino (2009),7 ¼ Jacob et al. (2001), 8 ¼Mishiba et al. (2000), 9 ¼ Nukui et al. (2011), 10 ¼ Okazaki et al. (2005), 11 ¼ Pan et al. (2004), 12 ¼ Pichot and El Maataoui(2000), 13 ¼ Roberts (2007), 14 ¼ Stehlik et al. (2007), 15 ¼ Sugiura et al. (1998), 16 ¼ Sugiura et al. (2000), 17 ¼ Van Laere et al. (2009), 18 ¼ Van Tuylet al. (1989).
* Plus many hybrid cultivars.† Plus hybrid cultivars involving at least seven species.‡ Species is not stated in reference 7.
Kron & Husband — Improved methodology for pollen DNA content estimation1068
Dow
nloaded from https://academ
ic.oup.com/aob/article/110/5/1067/170760 by guest on 05 D
ecember 2021

MATERIALS AND METHODS
General filter bursting method
The basic nuclei extraction method involves suspending pollenin a buffer and passing this through two filters: a pre-filter,which removes large contaminants while allowing pollengrains to pass, and a second (‘bursting’) filter that collectsthe pollen. The pollen grains are then rubbed against the burst-ing filter with a plastic or glass rod, and the nuclei are rinsedthrough the filter with a staining buffer.
We placed pollen, anthers or whole flowers in a buffer andvortexed them vigorously for a few seconds. The pollen sus-pension was then passed through the pre-filter and burstingfilter, and the flow-through was discarded. For simplicity, weused the same buffer for this step as for the bursting step, al-though solutions minimizing osmotic bursting may be usedif preferred. The bursting filter, with the collected pollen,was then placed on a clean tube and the pollen grains weregently rubbed against the filter for 10–15 s, using a rod witha rounded end. Nuclei were rinsed through the filter with thestaining buffer, the pollen was rubbed against the filter for afew seconds and buffer was added a second time. Thesample was then allowed to stain for 20–60 min and runaccording to standard plant flow cytometry protocols(Supplementary Data Video).
We used Partec Celltrics filters (Partec, Munster, Germany),available in 10-, 20-, 30-, 50-, 100- and 150-mm sizes. Filtersizes can be determined by trial and error, starting with a100- or 150-mm pre-filter and a 10-mm bursting filter, adjust-ing both if high-quality histograms are not obtained.Preferably, pollen grains and nuclei can be measured under afluorescence microscope after staining with propidium iodide(PI) or DAPI (4′,6-diamidino-2-phenylindole), and filtersizes selected accordingly. Filters should be large enough toallow passage of pollen through the pre-filter and nucleithrough the bursting filter, but not unnecessarily large, tomaximize the removal of debris at both stages. The type andamount of staining buffer depends on the requirements ofthe study, the instrument and the plant species. Our defaultbuffer was LB01 (Dolezel et al., 1989), but any nuclei extrac-tion buffer may be used, and changing buffers may improveresults in difficult species. PI or DAPI may be used as anuclear stain. PI should be used for genome size studiesbecause it is not base-pair-specific, but DAPI may producehigher quality histograms and can be used when the accuratemeasurement of absolute DNA content is not the objective(Dolezel et al., 2007). We added two rounds of 0.25 mLbuffer for a final sample of about 0.5 mL.
Survey of species
We tested the filter bursting method on 80 plant species(Supplementary Data Table S1). We selected from plantsthat were readily available to us and attempted to screen astaxonomically broad a sample as possible. We favouredplants from which pollen could be readily collected but wedid not entirely avoid those for which pollen collection wasrestricted due to flower size, morphology or number (e.g.Arabidopsis lyrata, Galium verum, Verbena officinalis).Pollen collection was improved in some species by growing
plants in the greenhouse or by field-collecting inflorescencesand keeping them overnight as bouquets. For Rumex nivalis,we used desiccated pollen stored in a refrigerator for .5years (extra pollen collected for Stehlik et al., 2007). Eachsample consisted of a single collection made from a singleplant. The number of samples tested per species ranged fromone to 22, with most species tested fewer than five times(Supplementary Data Table S1). Multiple attempts toimprove protocols focused on ways to improve pollen collec-tion (Elymus species and Verbena hastata) and the testing ofalternative buffers (Lilium cultivars, Aeschynanthus lobbianusand Chamerion angustifolium).
The basic filter bursting method was applied as describedabove, with the following specifics. When pollen was mea-sured, we typically used the smallest Partec filter that exceededthe largest observed pollen grain’s long axis, or one size larger.For five species with large proportions of pollen close to orexceeding 150 mm, we did not use a pre-filter, but obtainedthe cleanest pollen sample possible. We used 10 mm as ourdefault bursting filter, but we also used 20 and 30 mm(rarely 50 mm) when microscopy indicated that nucleiapproached or exceeded 10 mm (Supplementary Data TableS1). Pollen and nuclei were measured using a Leica DMRmicroscope (Leica Microsystems, Wetzlar, Germany) andOpen Lab software (Ver. 3.5.0, 2002, Improvision Ltd,Lexington, VA, USA). When measured, nuclei were visualizedwith PI (100 mg mL21) or DAPI (1 mg mL21; Vergne et al.,1987) stains and epifluorescence. Samples were run on a BDFACSCalibur flow cytometer (BD Biosciences, San Jose,CA, USA), at low (1–30 events s21) or medium (75–125events s21) speed. Run times varied greatly, from 3 to54 min (rarely exceeding 20 min). Long running timesreflected the goal of attaining high-quality histograms (lowCVs, high nuclei numbers), rather than maximizing samplenumbers. Data were acquired using CellQuest Pro software(Ver. 4.0.2, 2002, BD Biosciences) and the parameter of inter-est was fluorescence area measured with the FL2 (585/42 nm)detector.
For all parts of this study we measured ungated histogramsusing ModFit LT for Mac software (3.3.11, 2011, VeritySoftware House, Inc., Topsham, ME, USA). We used the auto-analysis function with histograms converted to a 256-channelscale to optimize event number per channel, the autodebrisand autoaggregate functions activated, and the assumptionthat no pollen nuclei were in S-phase. From these analyseswe obtained fluorescence means, nuclei numbers and CVsfor all major nuclei peaks, as well as the histogram’s back-ground aggregate and debris percentage (BAD). BAD isdefined as the proportion of events identified as either debrisor aggregates between the lowest fluorescence G0/G1 peakand the highest putative G2/doublet/2n peak, using ungatedhistograms (Shankey et al., 1993). Using these measures, weclassified histograms into the following classes. ‘Genomesize quality’ required at least one pollen peak with at least1300 nuclei and CV ≤ 5 % (Greilhuber et al., 2007). ‘CellCycle quality’ required a minimum of 10 000 nuclei in a setof peaks of interest and total BAD ≤ 20 % (Shankey et al.,1993; Ormerod et al., 1998). ‘Peaks of interest’ were defineddifferently depending on the pollen type. In species with tri-nucleate pollen, in which mature pollen grains contain one
Kron & Husband — Improved methodology for pollen DNA content estimation 1069
Dow
nloaded from https://academ
ic.oup.com/aob/article/110/5/1067/170760 by guest on 05 D
ecember 2021

vegetative and two sperm nuclei (all with 1n chromosomes),we defined peaks of interest as the major 1C nuclei peakplus any minor 2C peak potentially containing 2n pollennuclei. In species with binucleate pollen, mature pollengrains contain a vegetative (1n) nucleus and a generativenucleus that divides into two sperm nuclei after germination.Observations from microscopy (Brewbaker, 1967) suggestingthat typical mature generative nuclei are mitotically arrestedin a 2n state have been supported by flow cytometry, in thatbinucleate pollen generally show both 1C and 2C fluorescencepeaks (Bino et al., 1990; Suda et al., 2007a). In binucleatespecies, we defined the peaks of interest as the major genera-tive nuclei (2C) peak plus any corresponding 4C peak. All ofour species were angiosperms, but note that the nuclei typesand peaks of interest will be differently defined in gymnos-perms (e.g. Pichot and El Maataoui, 2000). Shankey et al.(1993) recommend CVs , 8 % for cell cycle analysis, butwe retained the criterion CV , 5 %, so that any sample thatwas of cell cycle quality also met genome size standards. Wefurther identified samples meeting cell cycle criteria whilesampling at least 10 000 pollen grains (30 000 nuclei intri-nucleate species, 10 000 in the generative peak for bi-nucleatespecies; ‘cell cycle + ’ quality). When samples did not meet theminimum criteria for genome size estimation or cell cycle ana-lysis, they were classified as ‘failed’, even if measurable peakswere detected.
Each taxonomic level (family, genus and species) wasassigned to a class based on the best sample obtained withinthat taxon. Because it was often possible to improve histo-grams by adjusting protocols, any species failing to meet theminimum genome size criteria but which was tested onlyonce was considered to be borderline with regard to testingof the method. We therefore calculated overall success rateswith and without these species.
Comparisons with other nuclei extraction methods
We directly compared sample quality for three nuclei ex-traction methods: chopping, freeze-chopping (Stehlik et al.,2007) and the method described here (filter bursting). We col-lected anthers or whole flowers from three individuals fromeach of five species (Buddleia davidii, Brassica napus,Eupatorium perfoliatum, Solanum lycopersicum and Viciafaba), using greenhouse-grown plants for all except Bu.davidii. A basic pollen amount was determined for eachspecies, based on requirements of our genome size tests (seebelow), and we used three times that amount for this test.We added 1.1 mL of LB01 buffer to the collected samples,vortexed them for 15 s on moderate to high speed and filteredwith the appropriate pre-filter for a final volume of about 1 mLof filtered buffer with pollen. Three sub-samples of 0.3 mLwere drawn from the tube, vortexing 2 s before each sub-sample. One sub-sample was added to 0.9 mL of buffer,passed through a bursting filter, and treated according to thefilter bursting method described above. A second 0.3-mL sub-sample was placed in a Petri dish on a frozen block, andchopped for 2 min (1 min for Bu. davidii). An additional0.9 mL of buffer was then added to the dish and the samplewas pipetted through the same size filter as used for filterbursting. A final sub-sample was added to 0.9 mL of the
buffer and frozen at –20 8C for 2–3.25 h. The frozen samplewas extracted from the tube, chopped with a razor bladeuntil completely thawed (2–2.5 min) and filtered through thesame filter as the other methods. For all three methods,small adjustments were made to bring the final filteredvolume to 1 mL by passing drops of buffer through thesecond filter. PI and RNase were added to the filteredsamples to obtain 100 mg mL21 PI and 50 mg mL21 RNase.Each treatment was replicated three times within a species,once per individual. The samples were stained for30–36 min (20–36 min in Bu. davidii) and run on mediumspeed for 3–10 min, with running times kept constant forall samples and treatments within a species. Details of thefilter sizes, tissue amounts, staining and running times foreach species are presented in Supplementary Data Table S2.
We compared three measures of sample/histogram qualityfor the three treatments: CV of the 1C peak, total number ofnuclei and BAD. We used a restricted maximum-likelihood(REML) ANOVA for each of these response variables withthe following factors: Species (fixed), Plant[nested inspecies] (random), Extraction Method (fixed) and Species ×Method interaction. We ln-transformed nuclei number andCV data to correct non-normality of residuals and heterogen-eity of variances in the raw data. For this and subsequentANOVAs, residuals were tested for normality using theShapiro–Wilk W test and variances were tested for homogen-eity using Bartlett’s (when residuals were normal) or Brown–Forsythe tests. All analyses were performed with JMP software(Ver. 8.0, 2009, SAS Institute, Inc., Cary, NC, USA).
We calculated filter bursting nuclei yields (number extractedper pollen grain) in Br. napus ‘Hyola 401′ for comparison withpublished yields for the same species using sonication (Panet al., 2004). We collected 48 anthers from each of fivegreenhouse-grown plants. Anthers were placed in LB01buffer, vortexed and filtered through a 50-mm filter toproduce a final volume of 2 mL. This was vortexed for a fewseconds before 1 mL was passed through a 10-mm filter andprepared using the usual filter bursting method. The samplewas run on medium on a FACSCalibur flow cytometer untilno further nuclei could be acquired because the sample wasdepleted (11–12 min). A second 1 mL was transferred to69 mL IsotonII diluent (Beckman Coulter, Inc., Indianapolis,IN, USA) for pollen counting. Pollen grains were countedwith a Multisizer 3 particle counter (Beckman Coulter, Inc.)and the number of pollen grains in the original 1 mL was cal-culated as (average of seven 1-mL subsamples) × 70. Thesesamples were tested within 2 min of dilution and stirred con-tinuously during counting. The yield for each filter burstsample was calculated as nuclei (from the 1mL flow cytometrysubsample) per total pollen grains (from the 1 mL particlecounter subsample). Because each pollen grain containsthree nuclei, yield was also expressed as a percentage oftotal possible nuclei: [(number of nuclei acquired)/(numberof pollen grains × 3)] × 100 %.
Genome size estimation with filter burst pollen
We compared genome size estimates obtained with leafnuclei with those made with pollen nuclei for six species,including three species with binucleate pollen (Bu. davidii,
Kron & Husband — Improved methodology for pollen DNA content estimation1070
Dow
nloaded from https://academ
ic.oup.com/aob/article/110/5/1067/170760 by guest on 05 D
ecember 2021

S. lycopersicum and V. faba) and three with trinucleate pollen(Br. napus, E. perfoliatum and Zea mays). These were selectedon the basis of availability, sufficient flowering to enablerepeated pollen collections and taxonomic breadth (i.e. sixfamilies). We measured between 55 and 67 pollen grains andbetween nine and 24 nuclei per species under the microscopeand selected filters accordingly. We experimentally deter-mined basic tissue amounts for each species such that all rele-vant nuclei peaks (leaf from standard, leaf from test plant, 1Cpollen nuclei and 2C pollen in binucleate species) would haveapproximately equal numbers when standards and test plantswere run together. We used LB01 buffer for all species;filters were selected as described above and DNA content stan-dards were selected from the list given by Dolezel et al.(2007). For details of these and the following methods seeSupplementary Data Table S2.
To allow for replication, plants had to provide three timesthe number of flowers as needed for a single test, plus addition-al flowers for the inhibition tests described below. Flowernumber was limited on at least one individual in some of thespecies, so to maintain replication across all individuals andto keep pollen amount constant we used less than the idealpollen amount in some cases and adopted a goal of 1000nuclei per peak rather than 1300. To estimate genome sizefrom leaf tissue, a piece of young leaf from the test plantwas co-chopped with leaf from the standard species. Leaveswere chopped with a razor blade in 0.75 mL ice-cold buffer(with 100 mg mL21 PI, 50 mg mL21 RNase), filtered
through a filter of the same size as selected for pollen bursting,stained for 30–45 min at room temperature and run at lowspeed. Pollen samples were prepared using the filter burstmethod described above, except that leaf tissue from the stand-ard was first chopped in staining buffer as described above, andthis buffer was then used to wash the pollen nuclei through thebursting filter (2 × 0.25 mL; Supplementary Data Video).Because the standard was chopped in 0.75 mL buffer butonly 0.5 mL was then used, 1.5 times as much of the standardtissue amount was used as in the leaf test, in order to keep thenumber of standard nuclei approximately equal in the twotreatments. For each species, these two treatments wereapplied on five or six plants on a single day, and this was repli-cated on 3 d. For Z. mays, plants did not flower synchronously,so the tests were spread out over 5 d.
DNA contents of nuclei were calculated relative to the stan-dards, and expressed as pg/1C. Genome size was calculatedusing leaf and 1C pollen nuclei for trinucleate species, andusing leaf, 1C (vegetative) pollen nuclei and 2C (generative)pollen nuclei in binucleate species. For each species separate-ly, an REML ANOVA was performed using 1C DNA contentas the response variable and Tissue Type (fixed), Plant(random), and Tissue Type × Plant interaction (random) assources of variation. There were two Tissue Type levels for tri-nucleate species (pollen, leaf ) and three for binucleate species(vegetative, generative and leaf).
On one test day for each species, an additional three treat-ments were applied to each plant: leaf tissue chopped
2000C
F
3000
2400
1800
1200
600
0
700
560
420
280
140
0
1500
1000
500
0
1150
Cou
nts
Cou
nts
920
690
460
230
0
800
640
480
320
160
0
50
40
30
20
10
00 200 400 600 800 1000 0 200 400
Relative fluorescence (FL2 area) Relative fluorescence (FL2 area)Relative fluorescence (FL2 area)600 800 1000 0 200 400 600 800 1000
A B
D E
FI G. 1. Representative ungated histograms showing the range of quality obtained with filter bursting. These six genera were selected because all were testedpreviously by other authors with other nuclei extraction methods (Table 1). (A) Brassica napus, Cell cycle + quality, 47 306 nuclei (15 769 pollen), CV ¼ 4.5 %,BAD ¼ 11.7 %; (B) Rumex nivalis, Cell cycle + quality, 49 705 nuclei (16 569 pollen), CVs ¼ 2.2 and 2.2 %, BAD ¼6.1 % – this species has two pollen types(male- and female-determining) that account for the two peaks; (C) Rosa rugosa, Cell cycle + quality, 22 824 nuclei (11 081 pollen), CVs ¼ 4.4 and 3.2 %,BAD ¼ 19.9 %; (D) Zea mays, Cell cycle quality, 16 038 nuclei (5346 pollen), CV ¼ 2.6 %, BAD ¼ 12.2%; (E) Lilium longiforum, Cell cycle + quality, 21 764nuclei (11 200 pollen), CVs ¼ 3.1 and 2.0 %, BAD ¼16.6 %; (F) Alstroemeria cultivar, Failed, 1970 nuclei, (849 pollen), CVs ¼ 10.4 and 8.0%, BAD ¼27.6 %.
Pollen numbers in binucleate species are based on the number of generative nuclei.
Kron & Husband — Improved methodology for pollen DNA content estimation 1071
Dow
nloaded from https://academ
ic.oup.com/aob/article/110/5/1067/170760 by guest on 05 D
ecember 2021

without the standard, standard tissue chopped without the testplant and pollen prepared without the standard. These testswere used to determine whether any tissue type appeared tobe affecting the staining of other tissues (i.e. inhibition sensuPrice et al., 2000). For these treatments, twice the basictissue amounts were used, in order to keep the total nucleiamounts relatively constant across treatments. We comparedthe standard and test plant peaks across treatments for evidenceof two patterns that might result in differences between DNAcontent estimates for leaf and pollen: differential impacts ofleaf and pollen on the fluorescence of the standard’s nuclei,and differential impacts of the standard on pollen and leafnuclei fluorescence.
RESULTS
General effectiveness of filter bursting across species
We tested 80 species, distributed across 64 genera and 33 fam-ilies (Supplementary Data Table S1). Representative histo-grams are shown in Fig. 1. Eighty-one per cent of all speciestested included at least one individual meeting the minimumcriteria for genome size testing, and 51 % met the requirementsfor cell cycle analysis. In addition, 41 % of species met cellcycle criteria with generative nuclei numbers correspondingto at least 10 000 pollen grains. Success rates at the genuslevel reflect these results closely, and rates at the familylevel are somewhat higher for cell cycle quality (Table 2).When we excluded eight species that failed but were testedonly once, the success rate at the species level increased to90 % for genome size quality and 57 % for cell cycle quality(Table 2). Two species required buffers other than LB01 toachieve their best results: Lilium Asiatic cultivars neededMgSO4 buffer (Arumuganathan and Earle, 1991) with 2.5 %Triton X-100 to achieve near-genome size quality and Maluscoronaria required a variant of the de Laat buffer (de Laatand Blaas, 1984; Bino et al., 1992, with 0.25 mmol L21
PVP-40) for cell cycle quality. Three trinucleate species(Raphanus sativus, Lychnis noctiflora and Symphyotrichumnovae-angliae) had differentially staining vegetative andsperm nuclei that generated a doubled 1C peak with a com-bined CV . 5 %; those of R. sativus could be well enough dis-tinguished on the basis of fluorescence and forward scatterproperties that they could be measured separately usingCellQuest Pro software.
Comparisons with other extraction methods
Measures of nuclei number, CV and BAD all showed highlysignificant effects of the extraction method when comparingfilter bursting with chopping and freeze-chopping. The effectof method varied among species, however, as we foundweak to significant Species × Extraction Method interactionsfor all measures (Table 3). Nuclei numbers were alwayshighest for filter burst samples, ranging from 5.7 (Br. napus)to 27.6 (Bu. davidii) times higher than chopped samples, and2.9 (E. perfoliatum) to 12.0 times higher than freeze-chopped(back-transformed least-square means from ANOVA, Table 3,Fig. 2A). Across all species, filter bursting produced 10 timesmore nuclei than chopping and 7.6 times more than freeze-chopping. Counts from chopped and freeze-chopped samplesdid not differ significantly overall or for any single species,but filter bursting counts were significantly higher than bothof these chopping methods in every species exceptE. perfoliatum (Tukey HSD test, Fig. 2A).
For 1C nuclei peaks, CVs for chopping and filter burstingdid not differ overall or for any individual species, while
TABLE 2. Summary of quality classifications for species tested using filter bursting
Number tested% at Genome Size
quality % at Cell Cycle quality % at Cell Cycle + quality
Taxa All Adjusted All Adjusted All Adjusted All Adjusted
Species 80 72 81 % 90 % 51 % 57 % 41 % 46 %Genus 64 59 83 % 90 % 55 % 59 % 44 % 47 %Family 33 31 82 % 87 % 67 % 71 % 58 % 61 %
‘Genome size quality’ ¼ 1300 nuclei in one peak, CV ≤ 5%; ‘Cell cycle quality’ ¼ 10 000 nuclei, BAD ≤ 20 %; ‘Cell Cycle + quality’ ¼ ‘Cell cyclequality’ with nuclei from 10 000 pollen grains; ‘All’ includes all species tested; ‘Adjusted’ excludes species that failed to meet genome size quality but weretested only once.
TABLE 3. Fixed effect results from four ANOVAs comparingnuclei number, CV and BAD for three extraction methods
(chopping, freeze-chopping and filter bursting)
Response variable and sources ofvariation d.f
d.f.den. F P
Nuclei numberSpecies 4 10 15.132 0.0003Extraction Method 2 20 175.627 < 0.0001Species × Extraction Method 8 20 4.589 0.0027
CV (1C peak)Species 4 10 3.603 0.0456Extraction Method 2 20 89.426 < 0.0001Species × Extraction Method 8 20 10.716 < 0.0001
CV (generative peak)Species 2 6 3.232 0.1116Extraction Method 2 12 28.155 < 0.0001Species × Extraction Method 4 12 13.570 0.0002
BADSpecies 4 10 9.893 0.0017Extraction Method 2 20 26.469 < 0.0001Species × Extraction Method 8 20 2.398 0.0539
Numbers in bold are significant values (P , 0.05).
Kron & Husband — Improved methodology for pollen DNA content estimation1072
Dow
nloaded from https://academ
ic.oup.com/aob/article/110/5/1067/170760 by guest on 05 D
ecember 2021

freeze-chopping produced significantly higher CVs overall(P , 0.0001; Table 3) and in three of five species (Fig. 2B).For 2C peaks (generative nuclei in binucleate species), allthree treatments were significantly different from one anotherin the overall analysis, with filter bursting producing thelowest and freeze-chopping the highest CVs (P , 0.0001,Table 3, Fig. 2C). The effect differed at the species level,with filter bursting producing significantly lower CVs thanfreeze-chopping in S. lycopersicum and lower than both chop-ping and freeze-chopping in Bu. davidii (Fig. 2C).
Across all five species, filter bursting produced significantlylower background aggregates and debris (22 %) than chopping(33 %), which in turn produced significantly less than freeze-chopping (49 %; P , 0.0001, Table 3, Fig. 2D). At the levelof individual species, mean values for BAD were lowest forfilter bursting in four out of five species, but the differencesbetween chopped and filter burst were never statistically sig-nificant, while filter bursting had significantly lower BADthan freeze-chopping in two species (Fig. 2D).
For the five Br. napus plants tested for nuclei yield, themean extraction rate averaged 1067 (+56) nuclei/1000pollen grains (+s.e., n ¼ 5, range ¼ 914–1264). This isequivalent to extracting all three nuclei from 35.6 % ofpollen grains on average (range 30.5–42.1%). CVs averaged5.06 (+0.345)%, although only one exceeded 5 %; BAD aver-aged 13.61 (+1.58)% with a range of 8.91–18.34 %.
Genome size estimates: comparison of pollen and leaf results
Pollen samples were more likely than leaf samples to fallshort of our quality control criteria for the genome size tests,even with the relaxed requirement for only 1000 nuclei perpeak. For all six species, all leaf tissue histograms met ourgenome size criteria, while 91 % of pollen samples did. Fivepollen samples had peaks with fewer than 1000 nuclei (oneeach for Bu. davidii and Br. napus, three in V. faba), althoughall exceeded 860 nuclei. One Br. napus plant had all threepollen replicates with CVs exceeding 5 % (5.05–5.52 %).
Small but statistically significant differences were foundbetween pollen and leaf genome size estimates in mostspecies (Table 4, Fig. 3). Two of three trinucleate speciesshowed significant differences in genome size estimatesbetween pollen and leaf tissue, but all differences were small(≤1.5 %; Fig. 3). In binucleate plants only one species (Bu.davidii) had a significant difference between 1C pollennuclei (vegetative) and leaf estimates (1.1 %). In comparison,all three binucleate species showed a significant differencebetween leaf and generative nuclei estimates, although all dif-ferences were still modest (between 1 and 2.5 %; Fig. 3).
The leaf genome size estimates averaged higher than thepollen in all species except Z. mays (pollen 0.6 % higher,P ¼ 0.18, Fig. 3). In comparisons between fluorescencepeaks from single species samples and mixed samples (inhib-
60
40
20
0
a ab b
a ab b
a a a
a a a
Species
a a aa b c
Bac
kgro
und
aggr
egat
es a
nd d
ebris
(%
)
B. n. B. d. E. p. S. l. V. f. All
6
4
2
0
2C c
oeffi
cien
t of v
aria
tion
(%) a a b
a a aa b c
a b b
9
6
3
0
1C c
oeffi
cien
t of v
aria
tion
(%)
a a a
a b ba b b
a a a a b b
a b b
10 000
A
B
C
D
8000
6000
Nuc
lei n
umbe
r
4000
2000
0
ab a b
a a b
a a ba a b
a a b
a a b
Freeze-chopping
Chopping
Filter-bursting
FI G. 2. Comparison of sample quality measures for three nuclei extractiontreatments: freeze-chopping (dark grey), chopping (light grey) and filter-bursting(white). (A) Total pollen nuclei number across all peaks; (B) CV of 1C pollenpeak; (C) CV of 2C (generative) nuclei peak (binucleate species only); (D)
BAD. All values shown are least-square means with s.e. from the ANOVAs inTable 3. Bars marked by the same lower-case letter indicate values not signifi-cantly different within a species (Tukey’s HSD, a ¼ 0.05), but do not havemeaning across species. ‘All’ ¼ main treatment effect across all species;B. n. ¼ Brassica napus; Z. m. ¼ Zea mays; E. p ¼ Eupatorium perfoliatum;
B. d. ¼ Buddleia davidii; S. l. ¼ Solanum lycopersicum; V. f. ¼ Vicia faba.
Kron & Husband — Improved methodology for pollen DNA content estimation 1073
Dow
nloaded from https://academ
ic.oup.com/aob/article/110/5/1067/170760 by guest on 05 D
ecember 2021

ition tests), no clear overall pattern was detected, with bothupwards and downwards shifts in fluorescence when specieswere mixed. However, we observed two trends that would con-tribute to higher leaf DNA content estimates. In three species(Br. napus, E. perfoliatum and S. lycopersicum) the standardpeak showed reduced fluorescence in the presence of leaf,more so than any similar reduction in the presence of pollen.In three species (Br. napus, E. perfoliatum and V. faba) thepollen peak shifted downward in the presence of the standard,more so than any similar shift in leaf tissue. These shifts influorescence averaged 1.6–4.5 %, depending on the speciesand tissue.
DISCUSSION
Effectiveness of filter bursting across species
The range of species we tested (80 species, 64 genera and 33families) exceeds the combined total for all previous studiesusing flow cytometry to measure relative DNA content ofpollen nuclei (46 species, 14 genera and 12 families, with mul-tiple hybrids and varieties of Petunia and Lilium; Table 1).Filter bursting success rates were high when measuredagainst commonly applied genome size and cell cycle analysis
quality standards: 81–90 % for genome size quality and51–71 % for cell cycle quality (Table 2). Furthermore, cellcycle quality in combination with data from 10 000 pollengrains was achieved in 33 species, within 28 genera and19 families.
Fifteen species failed to meet the minimum genome size cri-teria (Supplementary Data Table S1). This failure rate is prob-ably conservative because eight of these species were testedonly once and, hence, adjustments to protocols (e.g. bufferchoice, pollen amount, selecting healthier individuals) wouldpotentially improve results. For four of the 16 failed species(Arabidopsis thaliana, Artemisia biennis, Galium mullugoand Vicia villosa) pollen collection was difficult and lownuclei counts were the main cause of failure. Note, however,that we restricted ourselves to single day collections ofsingle plants, a requirement that may not apply in all studies.In two trinucleate species (Lychnis noctiflora andSymphyotrichum novae-angliae), CVs exceeded 5 % (butwere ,6 %) due to differential staining of vegetative andsperm nuclei that resulted in a near-double peak. For each ofthe remaining nine species (Aeschynanthus lobbianus,Alstroemeria cultivar, Crocus sativus, Cucurbita pepo,Hemerocallis fulva, Iris reticulata, Lilium Asiatic cultivars,Strelitzia reginae and Taraxacum officinale), some combin-ation of high debris, high CV and/or low nuclei number wasat fault. The reasons for poor quality in these species remainto be determined. Problems are often associated with largepollen size, with most species with maximum pollen diametersover 100 mm failing to meet genome size quality, although thismay be confounded with family effects (e.g. Iridaceae,Liliaceae). In addition, some commonly cultivated genera(e.g. Aeschynanthus, Alstroemeria, Crocus, Lilium) mayinclude hybrids or odd-numbered polyploids, and theirpollen may have high rates of infertility or aneuploidy. Thequality of results may therefore be species- or even cultivar-specific. For example, we had considerable difficulty obtaininggood quality histograms with Lilium Asiatic cultivars, testingmultiple buffers and pollen amounts before getting onesample with near-genome size quality (.1290 nuclei). In con-trast, obtaining genome size quality was not difficult in Liliumlongiflorum, and we achieved cell cycle quality or better insome samples for this species (Fig. 1).
3·0
1·5
Vegetative/sperm – leafGenerative – leaf
% d
iffer
ence
Species
0·0
–1·5
*
**
* *
*
–3·0B. n. Z. m. E. p. B. d. S. l. V. f.
FI G. 3. Percentage difference between genome size estimates obtained frompollen nuclei and estimates from leaf nuclei [(pollen – leaf estimate)/average]. Negative values indicate lower estimates from pollen. Asterisks indi-cate significant differences between leaf and pollen estimates (a ¼ 0.05).B.n. ¼ Brassica napus; Z. m. ¼ Zea mays; E. p ¼ Eupatorium perfoliatum;B. d. ¼ Buddleia davidii; S. l. ¼ Solanum lycopersicum; V. f. ¼ Vicia faba.
TABLE 4. Genome size estimates for leaf and pollen nuclei and ANOVA results for effect of nucleus type
Genome size (pg/1C) ANOVA
Species Pollen type Standard Leaf 1C pollen 2C pollen s.e. d.f. F P
Brassica napus1 Trinucleate Tomato2 1.183a 1.177b 0.007417 1 13.470 0.0214Eupatorium perfoliatum Trinucleate Tomato 2.47a 2.44b 0.01125 1 70.687 0.0011Zea mays3 Trinucleate Tomato 2.65a 2.67a 0.01123 1 2.596 0.1824Buddleia davidii Binucleate Soybean4 1.55a 1.54b 1.52c 0.002464 2 48.482 < 0.0001Solanum lycopersicum2 Binucleate Soybean 1.06a 1.05a 1.03b 0.007100 2 97.766 < 0.0001Vicia faba5 Binucleate Rye6 13.62a 13.60a 13.48b 0.05665 2 34.034 < 0.0001
Genome size estimates are least-square means from the ANOVA for that species. Standard error (s.e.) is the same for all genome size estimates within aspecies. Estimates with the same letter within a species are not significantly different, Tukey’s HSD, a ¼ 0.05. Numbers in bold are significant values (P ,
0.05).1B. napus ‘Hyola 401’; 2S. lycopersicum ‘Stupicke polnı rane’, 1.96 pg/2C, Dolezel et al. (1992); 3Z. mays ‘CE-777’; 4Glycine max ‘Polanka’, 2.50 pg/2C,
Dolezel et al. (1994); 5V. faba ‘Inovec’; 6Secale cereale ‘Dankovske’, 16.19 pg/2C, Dolezel et al. (1998).
Kron & Husband — Improved methodology for pollen DNA content estimation1074
Dow
nloaded from https://academ
ic.oup.com/aob/article/110/5/1067/170760 by guest on 05 D
ecember 2021

Comparisons with other methods
It is difficult to evaluate previously published data againstthe specific genome size and cell cycle criteria describedhere, because the required detail is lacking in most cases. Itis likely, however, that several studies include examples thatmeet or approach the minimum requirements for genomesize testing, including examples of chopping (e.g. Van Tuylet al., 1989; Bino et al., 1990; Mishiba et al., 2000, Sugiuraet al., 1998, 2000; Pichot and El Maataoui, 2000;Błocka-Wandas et al., 2007; Stehlik et al., 2007), sonication(Pan et al., 2004) and osmotic shock combined with germin-ation (Dewitte et al., 2009). However, none of the studies inTable 1 presents data or histograms obviously meeting thestandards of cell cycle analysis, with the possible exceptionof Pan et al. (2004), which does not provide specifics forCV or BAD. This apparent absence of examples of cellcycle quality may simply reflect the fact that such qualitywas not always demanded by the studies in question.However, it may also reflect the difficulties inherent in obtain-ing a combination of high nuclei numbers, low CVs and lowdebris.
In our direct comparisons with chopping, filter bursting pro-duced significantly higher nuclei counts, slightly improvedBAD and essentially identical CVs (Fig. 2). Choppingfrozen samples produced significantly poorer quality thanfilter bursting, and our filter-burst samples of R. nivalis pro-duced much higher quality histograms (Fig. 1) than our previ-ous use of freeze-chopping did in this same species (Stehliket al., 2007). Our nuclei yields for filter-burst B. napuspollen (1067 nuclei/1000 pollen grains) exceeded by 2.5times the maximum yield reported for sonication (400nuclei/1000 pollen with 10 min of treatment; Pan et al.,2004). Pan et al. (2004) did not report debris measures andso we cannot directly compare our results with theirs, but wenote that they recommended a shorter sonication time (4–5 min, yields of 300 nuclei/1000 pollen) and multiple centrifu-gation and resuspension steps to reduce debris to acceptablelevels. Debris levels following sonication have also beenreported as a problem in Begonia pollen flow cytometry(Dewitte et al., 2009). We did not compare filter burstingwith osmotic bursting of germinated or enzymatically treatedpollen, methods with much longer sample preparation times,nor did we did make direct comparisons with bead-beating, afast and simple extraction method (Roberts, 2007). Althoughbead beating is the one nuclei extraction method with ashorter preparation time than filter bursting, extensive experi-ence with this method in our lab indicates that extractingnuclei of high enough quality for flow cytometry is veryspecies-dependent, and debris levels higher than chopping(and by extension, filter bursting) are the norm. Our outputfor filter burst pollen of Rosa rugosa (Fig. 1) can be comparedquite favourably with that for the same species in Roberts(2007).
It is likely that the high nuclei yield and relatively cleansamples produced by filter bursting result from the efficient ap-plication of pressure on most pollen grains in the confinedspace provided by the filters, and the subsequent filtering outof the relatively intact pollen walls following bursting.Chopping is probably less efficient with respect to contact
with the pollen, and both chopping and sonication producemore fragments of pollen wall that will pass through thefilter and contribute to debris. Filter bursting may also resultin less damage to nuclei than more energetic methods. Forexample, Roberts (2007) and Dewitte et al. (2009) reportedsubstantial reductions in expected numbers of vegetativenuclei (relative to generative) using bead beating and sonic-ation. Similar but less pronounced patterns have been reportedfor chopped samples (e.g. Van Tuyl et al., 1989) and are some-times seen with filter bursting as well. This effect might arisefrom deterioration of vegetative nuclei at maturity (Brewbaker,1967), failure of vegetative nuclei to escape from the openedpollen walls (Van Laere et al., 2009) or counting inaccuracieswhen debris is high (Van Tuyl et al., 1989), but an alternativehypothesis is that more energetic extraction methods maydamage fragile vegetative nuclei.
Use in genome size studies
The exact quality criteria for genome size data may bedebated, and not everyone will wish to restrict themselves toCV , 5 % and nuclei numbers .1300. These guidelines doprovide a useful test for evaluating the method, however, andthe 81–90 % success rates indicate that genome size measure-ment with pollen is a viable option when filter bursting is used.This option is further strengthened by the observation that leafand pollen estimates did not differ by more than 2.5 % in thesix species we tested (1.5 % if tests are restricted to the 1Cvegetative nuclei in binucleate species; Fig. 3). A number ofauthors have suggested that fluorescence of leaf and pollennuclei appear to be similar but may not be identical (VanTuyl et al., 1989; Bino et al., 1990; Dewitte et al., 2006),but only two previous studies have compared such estimatesusing internal standardization and replication. Roberts (2007)reported pollen DNA content estimates 0.7 % lower thanthose for leaves in bead-beaten Rosa rugosa samples, whileBłocka-Wandas et al. (2007) found that pollen estimateswere 4–6 % lower than theoretical expectations based onsomatic tissue in Rumex acetosa.
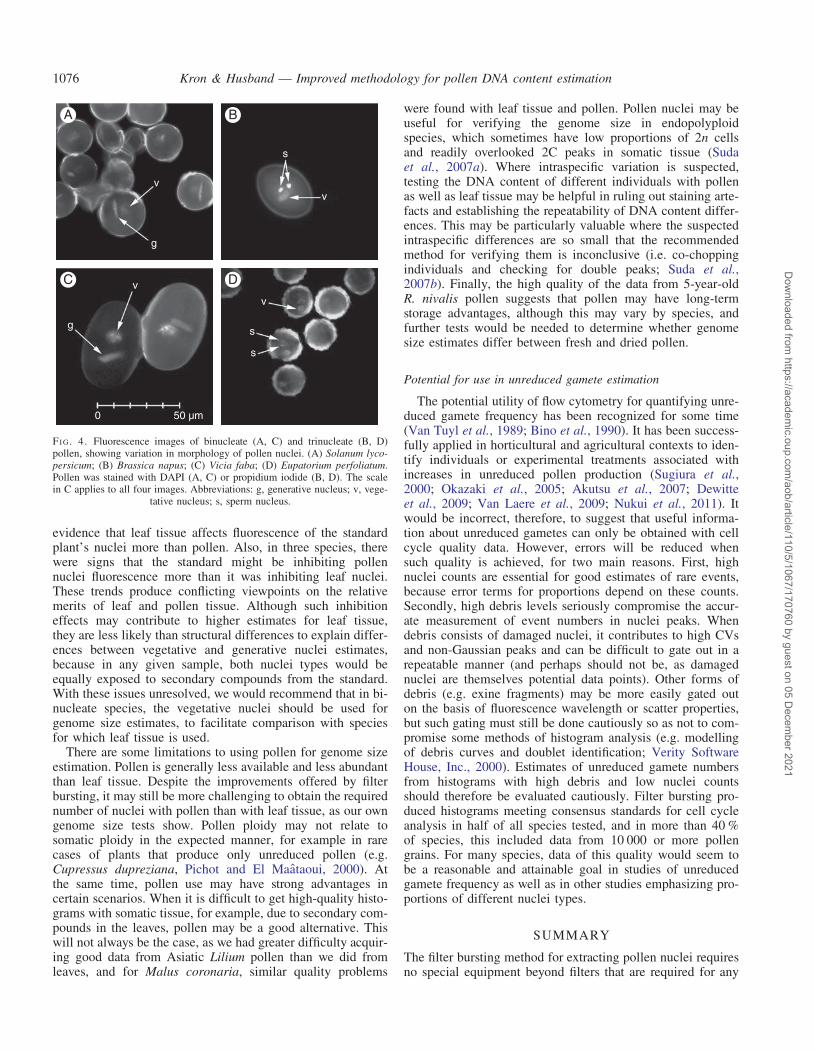
The general trend towards slightly higher DNA content esti-mates with leaf nuclei raises the question of why these differ-ences occur, especially as there is no a priori reason to assumethat leaf estimates are the more accurate of the two. The samequestion applies in the case of vegetative and generative nucleiin binucleate species, where the two types provide slightly dif-ferent genome size estimates, with those from vegetativenuclei tending to be most similar to leaf nuclei estimates(Fig. 3). A likely explanation lies in the pronounced structuraldifferences often observed between vegetative and generativenuclei, and presumably leaf and pollen nuclei (Fig. 4).Associated differences, such as levels of chromatin condensa-tion, may lead to differences in stain uptake by the nuclei, aproblem recognized in the use of feulgen microdensitometry(Verma and Rees, 1974; Bennett and Leitch, 2005) and previ-ously suggested for staining differences in pollen flow cytome-try (Suda et al., 2007a; Błocka-Wandas et al., 2007). We alsonoted two weak trends in our data consistent with fluorescenceinhibition effects (sensu Price et al., 2000) operating different-ly in pollen and leaf samples. In three species, there was some
Kron & Husband — Improved methodology for pollen DNA content estimation 1075
Dow
nloaded from https://academ
ic.oup.com/aob/article/110/5/1067/170760 by guest on 05 D
ecember 2021
evidence that leaf tissue affects fluorescence of the standardplant’s nuclei more than pollen. Also, in three species, therewere signs that the standard might be inhibiting pollennuclei fluorescence more than it was inhibiting leaf nuclei.These trends produce conflicting viewpoints on the relativemerits of leaf and pollen tissue. Although such inhibitioneffects may contribute to higher estimates for leaf tissue,they are less likely than structural differences to explain differ-ences between vegetative and generative nuclei estimates,because in any given sample, both nuclei types would beequally exposed to secondary compounds from the standard.With these issues unresolved, we would recommend that in bi-nucleate species, the vegetative nuclei should be used forgenome size estimates, to facilitate comparison with speciesfor which leaf tissue is used.
There are some limitations to using pollen for genome sizeestimation. Pollen is generally less available and less abundantthan leaf tissue. Despite the improvements offered by filterbursting, it may still be more challenging to obtain the requirednumber of nuclei with pollen than with leaf tissue, as our owngenome size tests show. Pollen ploidy may not relate tosomatic ploidy in the expected manner, for example in rarecases of plants that produce only unreduced pollen (e.g.Cupressus dupreziana, Pichot and El Maataoui, 2000). Atthe same time, pollen use may have strong advantages incertain scenarios. When it is difficult to get high-quality histo-grams with somatic tissue, for example, due to secondary com-pounds in the leaves, pollen may be a good alternative. Thiswill not always be the case, as we had greater difficulty acquir-ing good data from Asiatic Lilium pollen than we did fromleaves, and for Malus coronaria, similar quality problems
were found with leaf tissue and pollen. Pollen nuclei may beuseful for verifying the genome size in endopolyploidspecies, which sometimes have low proportions of 2n cellsand readily overlooked 2C peaks in somatic tissue (Sudaet al., 2007a). Where intraspecific variation is suspected,testing the DNA content of different individuals with pollenas well as leaf tissue may be helpful in ruling out staining arte-facts and establishing the repeatability of DNA content differ-ences. This may be particularly valuable where the suspectedintraspecific differences are so small that the recommendedmethod for verifying them is inconclusive (i.e. co-choppingindividuals and checking for double peaks; Suda et al.,2007b). Finally, the high quality of the data from 5-year-oldR. nivalis pollen suggests that pollen may have long-termstorage advantages, although this may vary by species, andfurther tests would be needed to determine whether genomesize estimates differ between fresh and dried pollen.
Potential for use in unreduced gamete estimation
The potential utility of flow cytometry for quantifying unre-duced gamete frequency has been recognized for some time(Van Tuyl et al., 1989; Bino et al., 1990). It has been success-fully applied in horticultural and agricultural contexts to iden-tify individuals or experimental treatments associated withincreases in unreduced pollen production (Sugiura et al.,2000; Okazaki et al., 2005; Akutsu et al., 2007; Dewitteet al., 2009; Van Laere et al., 2009; Nukui et al., 2011). Itwould be incorrect, therefore, to suggest that useful informa-tion about unreduced gametes can only be obtained with cellcycle quality data. However, errors will be reduced whensuch quality is achieved, for two main reasons. First, highnuclei counts are essential for good estimates of rare events,because error terms for proportions depend on these counts.Secondly, high debris levels seriously compromise the accur-ate measurement of event numbers in nuclei peaks. Whendebris consists of damaged nuclei, it contributes to high CVsand non-Gaussian peaks and can be difficult to gate out in arepeatable manner (and perhaps should not be, as damagednuclei are themselves potential data points). Other forms ofdebris (e.g. exine fragments) may be more easily gated outon the basis of fluorescence wavelength or scatter properties,but such gating must still be done cautiously so as not to com-promise some methods of histogram analysis (e.g. modellingof debris curves and doublet identification; Verity SoftwareHouse, Inc., 2000). Estimates of unreduced gamete numbersfrom histograms with high debris and low nuclei countsshould therefore be evaluated cautiously. Filter bursting pro-duced histograms meeting consensus standards for cell cycleanalysis in half of all species tested, and in more than 40 %of species, this included data from 10 000 or more pollengrains. For many species, data of this quality would seem tobe a reasonable and attainable goal in studies of unreducedgamete frequency as well as in other studies emphasizing pro-portions of different nuclei types.
SUMMARY
The filter bursting method for extracting pollen nuclei requiresno special equipment beyond filters that are required for any
v
g
s
v
v
v
s
s
g
0 50 µm
A B
C D
FI G. 4. Fluorescence images of binucleate (A, C) and trinucleate (B, D)pollen, showing variation in morphology of pollen nuclei. (A) Solanum lyco-persicum; (B) Brassica napus; (C) Vicia faba; (D) Eupatorium perfoliatum.Pollen was stained with DAPI (A, C) or propidium iodide (B, D). The scalein C applies to all four images. Abbreviations: g, generative nucleus; v, vege-
tative nucleus; s, sperm nucleus.
Kron & Husband — Improved methodology for pollen DNA content estimation1076
Dow
nloaded from https://academ
ic.oup.com/aob/article/110/5/1067/170760 by guest on 05 D
ecember 2021

extraction method. It is comparable to chopping in terms of thetime and effort required. CV and debris measures are as goodas or better than other commonly used methods, and nucleiyields are higher than reported for other methods. Qualitylevels reached or exceeded commonly accepted standards forgenome size studies in the great majority of species, and esti-mates of genome size did not differ from leaf estimates bymore than 2.5 % in the six species tested. These results showthat using pollen for genome size estimation is a viableoption when other considerations (e.g. availability) are takeninto account. Furthermore, the high consensus standards forcell cycle analysis were met in roughly half of all speciestested. Use of this method will therefore allow for high-qualitydata in studies emphasizing the measurement of proportionsof rare events, particularly studies of unreduced pollenproduction.
SUPPLEMENTARY DATA
Supplementary data are available online at www.aob.oxford-journals.org and consists of the following. Table S1: detailsof the species surveyed. Table S2: details of the methodsused in the comparison of the three nuclei extractionmethods and in the genome size estimations. Video: thefilter bursting method as used for genome size testing.
ACKNOWLEDGEMENTS
We thank Jillian Bainard for comments on the manuscript andPetr Smarda for providing seeds. This research was supportedby Natural Sciences and Engineering Research Council ofCanada (NSERC) and Canada Research Chair (CRC) grantsto B.C.H., and by equipment purchased through the CanadaFoundation for Innovation (CFI).
LITERATURE CITED
Akutsu M, Kitamura S, Toda R, Miyajima I, Okazaki K. 2007. Productionof 2n pollen of Asiatic hybrid lilies by nitrous oxide treatment. Euphytica155: 143–152.
Arumuganathan K, Earle ED. 1991. Estimation of nuclear DNA content ofplants by flow cytometry. Plant Molecular Biology Reporter 9: 229–233.
Bennett MD, Leitch IJ. 1995. Nuclear DNA amounts in angiosperms. Annalsof Botany 76: 113–176.
Bennett MD, Leitch IJ. 2005. Genome size evolution in plants. In: GregoryTR. ed. The evolution of the genome. Amsterdam: Elsevier AcademicPress, 89–162.
Bino RJ, Van Tuyl JM, De Vries JN. 1990. Flow cytometric determinationof relative nuclear DNA contents in bicellulate and tricellulate pollen.Annals of Botany 65: 3–8.
Bino RJ, De Vries JN, Kraak HL, Van Pijlen JG. 1992. Flow cytometricdetermination of nuclear replication stages in tomato seeds duringpriming and germination. Annals of Botany 69: 231–236.
Błocka-Wandas M, Sliwinska E, Grabowska-Joachimiak A, Musial K,Joachimiak AJ. 2007. Male gametophyte development and two differentDNA classes of pollen grains in Rumex acetosa L., a plant with an XX/XY1Y2 sex chromosome system and a female-biased sex ratio. SexualPlant Reproduction 20: 171–180.
Brewbaker JL. 1967. The distribution and phylogenetic significance of bi-nucleate and trinucleate pollen grains in the angiosperms. AmericanJournal of Botany 54: 1069–1083.
De Laat AMM, Blaas J. 1984. Flow-cytometric characterization and sortingof plant chromosomes. Theoretical and Applied Genetics 67: 463–467.
Dewitte A, Eeckhaut T, Van Huylenbroeck J, Van Bockstaele E. 2006.Flow cytometric detection of unreduced pollen in Begonia. ActaHorticulturae 714: 107–112.
Dewitte A, Eeckhaut T, Van Huylenbroeck J, Van Bockstaele E. 2009.Occurrence of viable unreduced pollen in a Begonia collection.Euphytica 168: 81–94.
Dolezel J, Binarova P, Lucretti S. 1989. Analysis of nuclear DNA content inplant cells by flow cytometry. Biologia plantarum (Praha) 31: 113–120.
Dolezel J, Sgorbati S, Lucretti S. 1992. Comparison of three DNA fluoro-chromes for flow-cytometric estimation of nuclear DNA content inplants. Physiologia Plantarum 85: 625–631.
Dolezel J, Dolezelova M, Novak FJ. 1994. Flow cytometric estimation ofnuclear DNA amount in diploid bananas (Musa acuminata andM. balbisiana). Biologia Plantarum 36: 351–357.
Dolezel J, Greilhuber J, Lucretti S, et al. 1998. Plant genome size estimation byflow cytometry: inter-laboratory comparison. Annals of Botany 82A: 17–26.
Dolezel J, Greilhuber J, Suda J. 2007. Estimation of nuclear DNA content inplants using flow cytometry. Nature Protocols 2: 2233–2244.
Galbraith DW, Harkins KR, Maddox JM, Ayres NM, Sharma DP,Firoozabady E. 1983. Rapid flow cytometric analysis of the cell cyclein intact plant tissues. Science 220: 1049–1051.
Greilhuber J, Temsch EM, Loureiro JCM. 2007. Nuclear DNA contentmeasurement. In: Dolezel J, Greilhuber J, Suda J. eds. Flow cytometrywith plant cells: analysis of genes, chromosomes and genomes.Weinheim: Wiley-VCH Verlag, 67–101.
Hirano T, Hoshino Y. 2009. Detection of changes in the nuclear phase and evalu-ation of male germ units by flow cytometry during in vitro pollen tubegrowth in Alstroemeria aurea. Journal of Plant Research 122: 225–234.
Jacob Y, Priol V, Ferrero F, Coudret C, Sallanon H. 2001. Fluorescentstaining of roses pollen tubes and nuclei by microscopy and flow cytome-try analysis. Acta Horticulturae 547: 383–385.
Kron P, Suda J, Husband BC. 2007. Applications of flow cytometry to evo-lutionary and population biology. Annual Review of Ecology, Evolutionand Systematics 38: 847–876.
Leitch IJ, Bennett MD. 2007. Genome size and its uses: the impact of flowcytometry. In: Dolezel J, Greilhuber J, Suda J. eds. Flow cytometrywith plant cells: analysis of genes, chromosomes and genomes.Weinheim: Wiley-VCH Verlag, 153–176.
Leus L, Van Laere K, Dewitte A, Van Huylenbroeck J. 2009. Flow cytome-try for plant breeding. Acta Horticulturae 836: 221–226.
Mishiba KI, Ando T, Mii M, et al. 2000. Nuclear DNA content as an indexcharacter discriminating taxa in the genus Petunia sensu Jussieu(Solanaceae). Annals of Botany 85: 665–673.
Nukui S, Kitamura S, Hioki T, et al. 2011. N2O induces mitotic polyploidi-zation in anther somatic cells and restores fertility in sterile interspecifichybrid lilies. Breeding Science 61: 327–337.
Okazaki K, Kurimoto K, Miyajima I, et al. 2005. Induction of 2n pollen intulips by arresting meiotic process with nitrous oxide gas. Euphytica 143:101–114.
Ormerod MG, Tribukait B, Giaretti W. 1998. Consensus report of the taskforce on standardisation of DNA flow cytometry in clinical pathology.Analytical Cellular Pathology 17: 103–110.
Pan G, Zhou Y, Fowke LC, Wang H. 2004. An efficient method for flowcytometric analysis of pollen and detection of 2n nuclei in Brassicanapus pollen. Plant Cell Reports 23: 196–202.
Pichot C, El Maataoui M. 2000. Unreduced diploid nuclei in Cupressusdupreziana A. Camus pollen. Theoretical and Applied Genetics 101:574–579.
Price HJ, Hodnett G, Johnston JS. 2000. Sunflower (Helianthus annuus)leaves contain compounds that reduce nuclear propidium iodide fluores-cence. Annals of Botany 86: 929–934.
Roberts AV. 2007. The use of bead beating to prepare suspensions of nucleifor flow cytometry from fresh leaves, herbarium leaves, petals andpollen. Cytometry Part A 71A: 1039–1044.
Shankey TV, Rabinovitch PS, Bagwell B, et al. 1993. Guidelines for imple-mentation of clinical DNA cytometry. Cytometry 14: 472–477.
Stehlik I, Kron P, Barrett SCH, Husband BC. 2007. Sexing pollen revealsfemale bias in a dioecious plant. New Phytologist 175: 185–194.
Suda J, Kron P, Husband BC, Travnıcek P. 2007a. Flow cytometry andploidy: applications in plant systematics, ecology and evolutionarybiology. In: Dolezel J, Greilhuber J, Suda J. eds. Flow cytometry withplant cells: analysis of genes, chromosomes and genomes. Weinheim:Wiley-VCH Verlag, 103–130.
Kron & Husband — Improved methodology for pollen DNA content estimation 1077
Dow
nloaded from https://academ
ic.oup.com/aob/article/110/5/1067/170760 by guest on 05 D
ecember 2021

Suda J, Weiss-Schneeweiss H, Tribsch A, Schneeweiss GM, Travnıcek P,Schonswetter P. 2007b. Complex distribution patterns of di-, tetra-,and hexaploid cytotypes in the European high mountain plant Seneciocarniolicus (Asteraceae). American Journal of Botany 94: 1391–1401.
Sugiura A, Tao R, Ohkuma T, Tamura M. 1998. Pollen nuclear number infour Diospyros species. HortScience 33: 149–150.
Sugiura A, Ohkuma T, Choi YA, Tao R, Tamura M. 2000. Production ofnonaploid (2n¼9x) Japanese persimmons (Diospyros kaki) by pollinationwith unreduced (2n¼6x) pollen and embryo rescue culture. Journal of theAmerican Society for Horticultural Science 125: 609–614.
Van Laere K, DeWitte A, Van Huylenbroeck J, Van Bockstaele E. 2009.Evidence for the occurrence of unreduced gametes in interspecific
hybrids of Hibiscus. Journal of Horticultural Science & Biotechnology84: 240–247.
Van Tuyl JM, De Vries JN, Bino RJ, Kwakkenbos TAM. 1989.Identification of 2n-pollen producing interspecific hybrids of Liliumusing flow cytometry. Cytologia 54: 737–745.
Vergne P, Delvallee I, Dumas C. 1987. Rapid assessment of microspore andpollen development stage in wheat and maize using DAPI and membranepermeabilization. Stain Technology 62: 299–304.
Verity Software House, Inc. 2000. ModFit LT User Guide. Topsham, ME:Verity Software House, Inc.
Verma SC, Rees H. 1974. Nuclear DNA and the evolution of allotetraploidBrassicae. Heredity 33: 61–68.
Kron & Husband — Improved methodology for pollen DNA content estimation1078
Dow
nloaded from https://academ
ic.oup.com/aob/article/110/5/1067/170760 by guest on 05 D
ecember 2021