using cluster analysis to identify patterns in students
TRANSCRIPT
Using cluster analysis to identify patterns in students’ responses tocontextually different conceptual problems
John Stewart,* Mayo Miller, Christine Audo, and Gay Stewart
Physics Department, University of Arkansas, Fayetteville, Arkansas 72701, USA(Received 23 February 2012; published 4 October 2012)
This study examined the evolution of student responses to seven contextually different versions of two
Force Concept Inventory questions in an introductory physics course at the University of Arkansas. The
consistency in answering the closely related questions evolved little over the seven-question exam. A
model for the state of student knowledge involving the probability of selecting one of the multiple-choice
answers was developed. Criteria for using clustering algorithms to extract model parameters were
explored and it was found that the overlap between the probability distributions of the model vectors
was an important parameter in characterizing the cluster models. The course data were then clustered and
the extracted model showed that students largely fit into two groups both pre- and postinstruction: one that
answered all questions correctly with high probability and one that selected the distracter representing the
same misconception with high probability. For the course studied, 14% of the students were left with
persistent misconceptions post instruction on a static force problem and 30% on a dynamic Newton’s third
law problem. These students selected the answer representing the predominant misconception slightly
more consistently postinstruction, indicating that the course studied had been ineffective at moving this
subgroup of students nearer a Newtonian force concept and had instead moved them slightly farther away
from a correct conceptual understanding of these two problems. The consistency in answering pairs of
problems with varied physical contexts is shown to be an important supplementary statistic to the score on
the problems and suggests that the inclusion of such problem pairs in future conceptual inventories would
be efficacious. Multiple, contextually varied questions further probe the structure of students’ knowledge.
To allow working instructors to make use of the additional insight gained from cluster analysis, it is our
hope that the physics education research community will make these methods available though their
Web sites.
DOI: 10.1103/PhysRevSTPER.8.020112 PACS numbers: 01.40.Di, 01.40.Fk
I. INTRODUCTION
Pre- and posttesting using research-validated instru-ments has become standard practice for evaluating theconceptual learning in introductory physics courses [1].This practice gives valuable but incomplete informationabout the state of students’ knowledge entering and leavinga physics course. For example, at the University ofArkansas the Spring 2006 Force Concept Inventory (FCI)[2] pretest yielded the following averages for the selectionof the five responses to FCI problem 29: (a) 8%, (b) 45%,(c) 3%, (d) 41%, and (e) 3%. The correct answer is (b).While informative, these average values lack importantinformation which could be used to shape instructionaldecisions. Consider an experiment that asks a number ofquestions similar to FCI problem 29 (a problem involvingthe forces on a chair sitting on the floor, reproduced in theAppendix), where each question uses a different physical
system. The averages above could be generated by a popu-lation of students where most students were waveringbetween the correct answer and the misconception repre-sented by response (d). This population is applying both aNewtonian model and a novice model that produces themisconception represented by answer (d). The averagecould also be produced by a course where about half thestudents always select the correct answer (b) and whereabout half the students always select answer (d); the secondset of students presumably is consistently applying themisconception represented by answer (d). These two pop-ulations of students, the always consistent population andthe inconsistent population, have very different incomingknowledge states.The consistency of student answers to problems where
the underlying physical system is similar has been exten-sively investigated. There is substantial evidence thatstudents do not leave most introductory physics courseswith an integrated, expertlike understanding of the material[1–3]. This lack of expertlike understanding can take manyforms, from persistent, consistently applied misconcep-tions to a sensitivity to the surface features of a problemsuch as the physical system or the presentation of theproblem. In this work, the physical system used in a
Published by the American Physical Society under the terms ofthe Creative Commons Attribution 3.0 License. Further distri-bution of this work must maintain attribution to the author(s) andthe published article’s title, journal citation, and DOI.
PHYSICAL REVIEW SPECIAL TOPICS - PHYSICS EDUCATION RESEARCH 8, 020112 (2012)
1554-9178=12=8(2)=020112(19) 020112-1 Published by the American Physical Society
problem will be called its context. Students who answerdifferently to problems with different contexts have asensitivity to the context. Related to the context, the formin which the problem is presented, whether the statementof the problem is mathematical, textual, diagrammatic, orpictorial, will be called the problem’s representation.
This paper will investigate the evolution of consistencyof students’ answers over seven contextually related ques-tions embedded in the FCI. Using multiple, contextuallydifferent questions with the same underlying physicalinterpretation is an important experimental techniqueused to investigate expert-novice differences, the structureof novice models, contextual and representational sensiti-vity, and the consistency of application of novice models.The survey of research that follows is a small sample of theapplications of the technique.
The role of context has been important in the under-standing of the structure of novice physics knowledge andthe application of that knowledge to physical situations[4,5]. The difference in the methods of solution of prob-lems by experts and novices has been investigated usingcontextually related questions. Students group mathemat-ics and physics problems differently than experts, withexpert problem solvers grouping problems based on theirunderlying physical or mathematical structure and noviceproblem solvers often grouping problems based on theirsurface features such as context or question format [6–8].The representation-use pattern of novice and expert prob-lem solvers also shows identifiable differences in thepatterns of use of multiple representations [9].
Multiple, physically similar problems have been used toinvestigate how consistently alternate models are applied.Substantial variation in the consistency of the applicationof alternate frameworks and scientifically correct frame-works was found with students often using both the correctmodel and an alternate model in different situations[10–12]. The consistency of student reasoning (either cor-rect or incorrect) was found to increase with additionalinstruction [12–14] and to depend on the familiarity of thecontext of the problems [15].
Since context sensitivity probes the degree to which astudent population has developed an integrated under-standing of a topic, it has been studied in a number ofenvironments. Testing student understanding using mul-tiple, contextually related questions has been used withphysics problem pairs involving an inanimate and a livingcontext [16], an abstract and a concrete context [17], andan abstract and a familiar context [18]. Students performedslightly better on problems where the context was familiar[18]. Multiple-question instruments are also used; Palmerinvestigated Newton’s third law using a nine-question testinvolving a range of contexts from the ‘‘hard’’ contextscommonly found in physics problems such as tables or theground to ‘‘soft’’ contexts less commonly found in physicsproblems such as water or a mattress [19].
Differences in performance based on problem represen-tation have also been investigated. Novices react to surfacefeatures of problems involving their representation thatwould be unimportant to experts just as they respond tocontextual surface features. McDermott et al. foundstudents had difficulty in interpreting many features ofkinematics graphs and designed interventions to addressthese problems and to foster the use of multiple represen-tations [20]. These interventions use multiple contexts toaugment graphical skill. Differences in the representationof physics problems were found to produce strong differ-ences in performance [21–23]. Differences in performancebased on representation were also influenced by the contextof the problems [22,23]. Savinainen and co-workers con-structed a conceptual instrument derived from the ForceConcept Inventory to investigate representational coher-ence and found a substantial improvement in coherencebetween the pretest and posttest in high school students[24,25]. In mathematics education, work comparing per-formance on story, word, and symbolic problems seems toshow superior performance on contextually richer storyproblems [26] (this work contains an extensive discussionof the issue of story problems).The use of multiple representations [27,28] and enriched
contexts [29,30] has also been used as part of instructionalprograms designed to produce more expertlike thinking orto improve the attitudes of students toward science.Application of contextually paired problems has alsobeen investigated as an instructional method. The efficacyof this technique was found to depend strongly on how thepaired problems were presented [31–33].All of these studies use multiple, similar problems to
investigate or improve student understanding, usuallyusing pairs of problems but sometimes using many similarproblems. This opens the possibility that the state of stu-dent knowledge evolves over the course of the experiment.The work of Rennie and Parker shows some slight im-provement in results in the second of a pair of problems[18], but their sample size is so small (N ¼ 8) that it isunlikely the observed effect is statistically significant.The works described above use a variety of method-
ologies. Many use paired problems, but some use up tonine similar problems. The degree of the similarity of theproblems also varies widely with some problems differingonly by the textual description of the physical system,some problems differing by a rewriting of the problemusing a graphical or mathematical representation to replacethe problem text, and some problems differing widelyrelated only by the underlying physical principles neededto solve the problem.Overall, a few themes emerge. The state of student
knowledge after a science course is complex, with studentsoften holding multiple, conflicting models after instruc-tion. The consistency of application of these models in-creases with additional education. The consistency is also
STEWART et al. PHYS. REV. ST PHYS. EDUC. RES. 8, 020112 (2012)
020112-2

influenced by the familiarity of the students with the con-text of the problem.
The studies above examined the consistency of students’answers in a variety of situations, but do little to developmore detailed models of the consistency of the studentpopulations tested. Bao and Redish [34] introduced aframework, model analysis, for further exploring the struc-ture of the consistency of the application of student knowl-edge by separating a group of students into intellectuallysimilar subgroups. Approximate methods for extracting thesize and structure of the subgroups was also developed.Bao and Redish [34] make a compelling argument for theneed for further investigation into the structure of theknowledge state of the student population: ‘‘Analyses usingscores alone often fail to provide useful details on thestudents’ real understanding of the physics concept (exceptin the case when most students consistently give correctanswers). For example, a low score can be caused by aconsistent incorrect model, calculation errors generatedwhile using a correct model, random guessing, or a persis-tently triggered incorrect model for a student in a mixedmodel state. These different situations reflect importantinformation on student understanding of physics, but theycannot be distinguished using an analysis based solely onscores.’’
Model analysis has been used to investigate the struc-ture of the consistency of student answers to conceptualproblems in mechanics [34]. It was found that 74%–82%of the students were associated with a single subgroup forboth the pretest and the posttest in both a course usingtraditional instruction and a course using modified instruc-tion; however, the students in the nontraditional coursemuch more consistently applied the correct model thanthe students in the traditional course. The method wasalso used to explore the structure of students’ understand-ing of Newton’s third law, and it was found that detailedfeatures of Newton’s third law problems involvingwhether the objects were stationary, moving, or accelerat-ing generated student subgroups with very different prop-erties [35].
The problem of taking a set of data and separating it intosubgroups where the members of each subgroup are moresimilar to each other than they are to members not in thesubgroup is a problem that has been extensively studied.One well-understood statistical method for performingsuch a separation is cluster analysis. Cluster analysis willconverge to a set of subgroups that are within a presettolerance of the mathematically best set of subgroups.
This study seeks to investigate the following questions:(1) Does the consistency of students’ answers evolve
over the course of an exam?(2) How can a data set containing the responses to
multiple, contextually related questions be used tosubdivide a class into intellectually similarsubgroups?
(3) Once a model subdividing a class into groups isconstructed, how does one evaluate the quality ofthe model?
(4) What are the subgroup models of the Spring 2006and Fall 2006 University Physics courses at theUniversity of Arkansas?.
II. MEASUREMENT
In 2006–2007, an experiment was performed at theUniversity of Arkansas that investigated how context in-fluenced the consistency of students’ responses to concep-tual physics questions. This study was conducted withstudents enrolled in the introductory calculus-based me-chanics course during the Spring 2006 (147 students) andFall 2006 (200 students) semesters. During the first day ofphysics laboratory, students were given a 36 questionpretest using 30 Force Concept Inventory (FCI) questionsmixed with six variations of one FCI question. The sixvariations modified the physical context of the FCIquestion.Students who took the pretest received extra credit for
participation, but additional extra credit was also possiblebased on superior performance. Later in the semester, thesame examwas administered as a posttest; this posttest waspart of the third exam (four exams total). Data from thepretests and posttests were excluded for students that didnot complete the course.The course used for the measurement, University
Physics I, is the first-semester, calculus-based mechanicscourse in the introductory physics sequence for scientistsand engineers. The course is presented with two50-minute traditional lectures and two 110-minute labo-ratories per week. The laboratories are a mix of teachingassistant led problem solving, small group work, hands-oninteractive laboratories, and traditional experiments. Thecourse was developed as part of the University ofArkansas’ Physics Teacher Education Coalition site andproduced an average normalized gain on the FCI of 0.51for the semesters studied.Two versions of the modified FCI test were used, one
for the Spring 2006 semester and one for the Fall 2006semester. The Spring semester test contained the 30 FCIquestions and six additional questions regarding theforces acting on a stationary object that were producedby modifying the context of FCI problem 29. The originalFCI problem and an example of a transformed problemare included in the Appendix. A different physical con-text was used for each problem. The new contexts variedfrom traditional physics ‘‘hard’’ contexts (marble restingon a table) to less traditional ‘‘soft’’ contexts (balloonfloating in the air). Table I shows the contexts used. Asmuch as possible, the context-modified problems werecreated by word substitution, replacing the original con-text with the modified context. The order of the multiple-choice responses was unchanged. This work uses the
USING CLUSTER ANALYSIS TO IDENTIFY . . . PHYS. REV. ST PHYS. EDUC. RES. 8, 020112 (2012)
020112-3
revised version of the FCI included with Mazur’s PeerInstruction [36].
To reduce the risk of students recognizing similarity inthe seven questions, they were spread throughout the test.For the Spring semester, the context-related questions werequestions 3, 9, 15, 20, 24, 30, and 35 in the 36-questionexam. Three versions of the test were created; the context-related questions were asked in the same locations, but theseven questions were ordered differently. The order of theproblems in the three tests using the index, i, in Table I wastest 1: 1, 2, 3, 4, 5, 6, 7; test 2: 7, 6, 3, 4, 5, 2, 1; test 3: 2, 7,3, 6, 5, 1, 4. Note that problems 3 and 5 were in the samelocation in all three tests. This was done because previousresearch suggested that the students’ response to the un-usual (for a physics course) contexts in the problems wouldgenerate a different response pattern [19]. By placing theproblems in the same location, these effects could beeliminated if necessary. Each of the three versions ofeach test were given to approximately one-third of thestudents in each course.
The same procedure was followed with a different FCIquestion in Fall 2006. Six context-modified questions werewritten for FCI question 4, a question that involves theapplication of Newton’s third law in a situation where atleast one object is moving. The questions were placed inthe same locations as in Spring 2006. Again, three versionsof the test were formed using the same sequences as inSpring 2006.
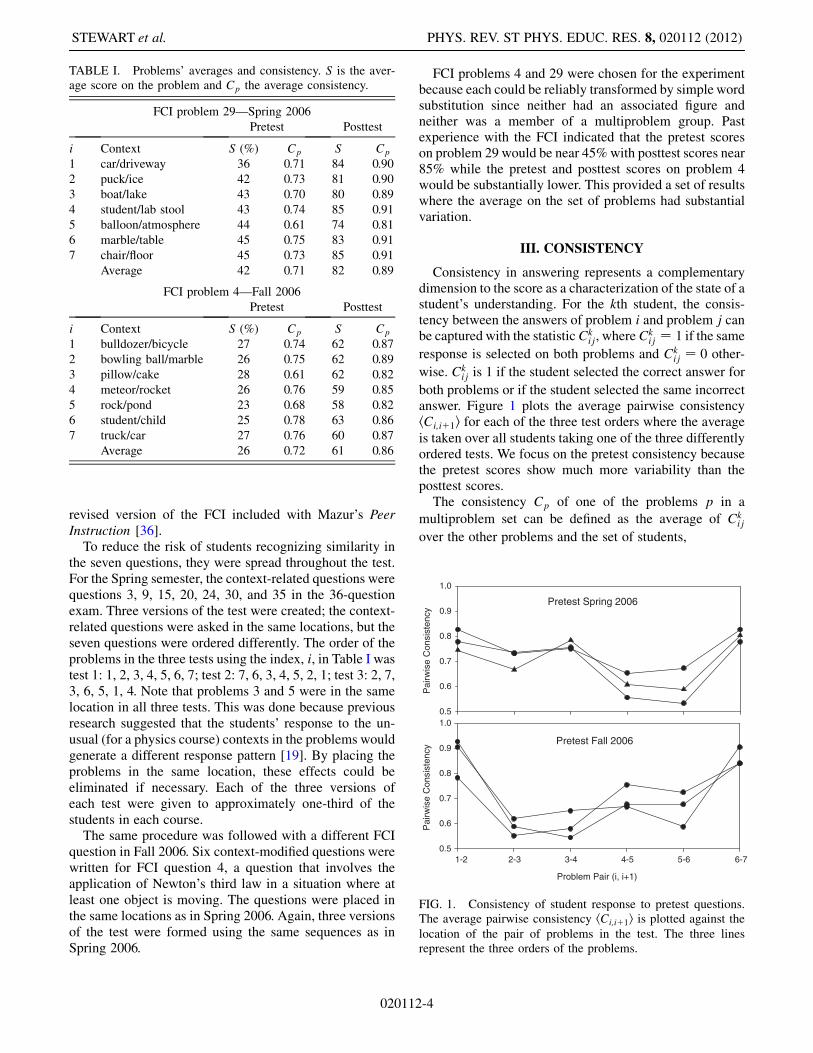
FCI problems 4 and 29 were chosen for the experimentbecause each could be reliably transformed by simple wordsubstitution since neither had an associated figure andneither was a member of a multiproblem group. Pastexperience with the FCI indicated that the pretest scoreson problem 29 would be near 45%with posttest scores near85% while the pretest and posttest scores on problem 4would be substantially lower. This provided a set of resultswhere the average on the set of problems had substantialvariation.
III. CONSISTENCY
Consistency in answering represents a complementarydimension to the score as a characterization of the state of astudent’s understanding. For the kth student, the consis-tency between the answers of problem i and problem j canbe captured with the statisticCk
ij, whereCkij ¼ 1 if the same
response is selected on both problems and Ckij ¼ 0 other-
wise. Ckij is 1 if the student selected the correct answer for
both problems or if the student selected the same incorrectanswer. Figure 1 plots the average pairwise consistencyhCi;iþ1i for each of the three test orders where the average
is taken over all students taking one of the three differentlyordered tests. We focus on the pretest consistency becausethe pretest scores show much more variability than theposttest scores.The consistency Cp of one of the problems p in a
multiproblem set can be defined as the average of Ckij
over the other problems and the set of students,
Pretest Spring 2006
Pai
rwis
e C
onsi
sten
cy
0.5
0.6
0.7
0.8
0.9
1.0
Pretest Fall 2006
Problem Pair (i, i+1)
1-2 2-3 3-4 4-5 5-6 6-7
Pai
rwis
e C
onsi
sten
cy
0.5
0.6
0.7
0.8
0.9
1.0
FIG. 1. Consistency of student response to pretest questions.The average pairwise consistency hCi;iþ1i is plotted against the
location of the pair of problems in the test. The three linesrepresent the three orders of the problems.
TABLE I. Problems’ averages and consistency. S is the aver-age score on the problem and Cp the average consistency.
FCI problem 29—Spring 2006
Pretest Posttest
i Context S (%) Cp S Cp
1 car/driveway 36 0.71 84 0.90
2 puck/ice 42 0.73 81 0.90
3 boat/lake 43 0.70 80 0.89
4 student/lab stool 43 0.74 85 0.91
5 balloon/atmosphere 44 0.61 74 0.81
6 marble/table 45 0.75 83 0.91
7 chair/floor 45 0.73 85 0.91
Average 42 0.71 82 0.89
FCI problem 4—Fall 2006
Pretest Posttest
i Context S (%) Cp S Cp
1 bulldozer/bicycle 27 0.74 62 0.87
2 bowling ball/marble 26 0.75 62 0.89
3 pillow/cake 28 0.61 62 0.82
4 meteor/rocket 26 0.76 59 0.85
5 rock/pond 23 0.68 58 0.82
6 student/child 25 0.78 63 0.86
7 truck/car 27 0.76 60 0.87
Average 26 0.72 61 0.86
STEWART et al. PHYS. REV. ST PHYS. EDUC. RES. 8, 020112 (2012)
020112-4
Cp ¼ 1
N
1
Nq � 1
XNk¼1
XNq
i�p
Ckip; (1)
where N is the number of students and Nq ¼ 7 the number
of contextually related questions. The average consistencyC over a set of problems can then be defined as the averageof Cp. Table I shows the score S and the consistency Cp of
each problem and the average score and consistency of allproblems.
The consistency is not free to independently vary from 0to 1. As the score S on a question increases, the consistencyshould also tend to increase. If S ¼ 100%, then C ¼ 1.
Figure 1 plots the average consistency per problem pairhCi;iþ1i versus the relative location of the pair i within the
test. These figures show little evidence of increasing con-sistency as students answer more, related questions.
There is little variation in pretest averages S, with onlyquestion 1 in Spring 2006 scoring substantially lower thanthe other questions. There is some evidence in the pretestdata that the students answered less consistently for con-texts that were ‘‘soft,’’ question 5 in Spring 2006 andquestions 3 and 5 in Fall 2006. This difference in consis-tency largely vanishes postinstruction with only question 5in Spring 2006 answered substantially less consistentlythan the other questions. The varying response of studentsto the soft contexts lends support to Palmer’s observationof substantial variation on an instrument using multiple,soft contexts [19].
The shape of the curves in Fig. 1 largely results from thevariation in consistency of the problems discussed aboveand not from the location of the problem in the test, asproblems 3 and 5 remained in the same location.
A linear fit to the Spring 2006 pretest data yieldedhCi;iþ1i ¼ �0:011iþ 0:75. A similar fit to the Fall 2006
pretest data gives hCi;iþ1i ¼ �0:001iþ 0:68. The consis-
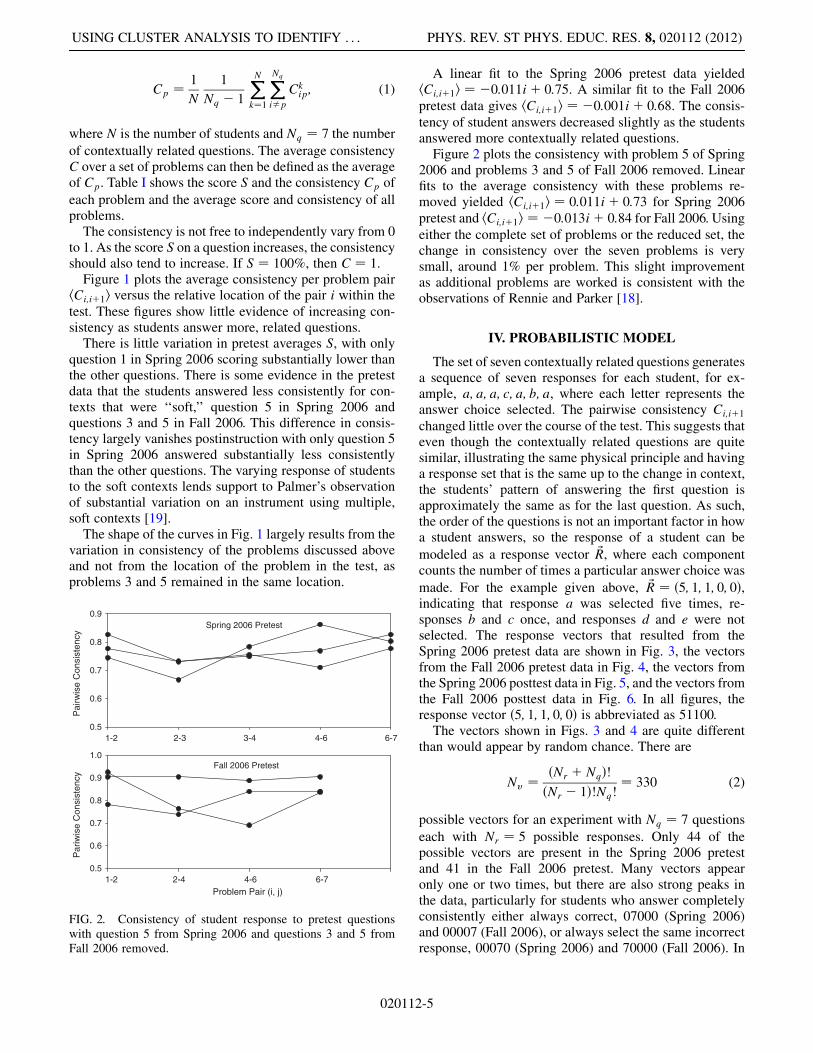
tency of student answers decreased slightly as the studentsanswered more contextually related questions.Figure 2 plots the consistency with problem 5 of Spring
2006 and problems 3 and 5 of Fall 2006 removed. Linearfits to the average consistency with these problems re-moved yielded hCi;iþ1i ¼ 0:011iþ 0:73 for Spring 2006
pretest and hCi;iþ1i ¼ �0:013iþ 0:84 for Fall 2006. Usingeither the complete set of problems or the reduced set, thechange in consistency over the seven problems is verysmall, around 1% per problem. This slight improvementas additional problems are worked is consistent with theobservations of Rennie and Parker [18].
IV. PROBABILISTIC MODEL
The set of seven contextually related questions generatesa sequence of seven responses for each student, for ex-ample, a; a; a; c; a; b; a, where each letter represents theanswer choice selected. The pairwise consistency Ci;iþ1
changed little over the course of the test. This suggests thateven though the contextually related questions are quitesimilar, illustrating the same physical principle and havinga response set that is the same up to the change in context,the students’ pattern of answering the first question isapproximately the same as for the last question. As such,the order of the questions is not an important factor in howa student answers, so the response of a student can be
modeled as a response vector ~R, where each componentcounts the number of times a particular answer choice was
made. For the example given above, ~R ¼ ð5; 1; 1; 0; 0Þ,indicating that response a was selected five times, re-sponses b and c once, and responses d and e were notselected. The response vectors that resulted from theSpring 2006 pretest data are shown in Fig. 3, the vectorsfrom the Fall 2006 pretest data in Fig. 4, the vectors fromthe Spring 2006 posttest data in Fig. 5, and the vectors fromthe Fall 2006 posttest data in Fig. 6. In all figures, theresponse vector ð5; 1; 1; 0; 0Þ is abbreviated as 51100.The vectors shown in Figs. 3 and 4 are quite different
than would appear by random chance. There are
Nv ¼ ðNr þ NqÞ!ðNr � 1Þ!Nq!
¼ 330 (2)
possible vectors for an experiment with Nq ¼ 7 questions
each with Nr ¼ 5 possible responses. Only 44 of thepossible vectors are present in the Spring 2006 pretestand 41 in the Fall 2006 pretest. Many vectors appearonly one or two times, but there are also strong peaks inthe data, particularly for students who answer completelyconsistently either always correct, 07000 (Spring 2006)and 00007 (Fall 2006), or always select the same incorrectresponse, 00070 (Spring 2006) and 70000 (Fall 2006). In
1-2 2-3 3-4 4-6 6-7
Pai
rwis
e C
onsi
sten
cy
0.5
0.6
0.7
0.8
0.9
Problem Pair (i, j)1-2 2-4 4-6 6-7
Par
iwis
e C
onsi
sten
cy
0.5
0.6
0.7
0.8
0.9
1.0
Spring 2006 Pretest
Fall 2006 Pretest
FIG. 2. Consistency of student response to pretest questionswith question 5 from Spring 2006 and questions 3 and 5 fromFall 2006 removed.
USING CLUSTER ANALYSIS TO IDENTIFY . . . PHYS. REV. ST PHYS. EDUC. RES. 8, 020112 (2012)
020112-5

FIG. 3. Distribution of response vectors for Spring 2006 pretest data.
FIG. 4. Distribution of response vectors for Fall 2006 pretest data.
FIG. 5. Distribution of response vectors for Spring 2006 postt-est data.
FIG. 6. Distribution of response vectors for Fall 2006 posttestdata.
STEWART et al. PHYS. REV. ST PHYS. EDUC. RES. 8, 020112 (2012)
020112-6

the Spring 2006 vectors, there is some evidence of a smallgroup who are uncertain about which answer to selectbetween answer (b) and answer (d) as shown by the peaksat 02050 and 03040.
Since the students’ response pattern does not vary sig-nificantly as additional contextually related problems areasked, one potential model of the students’ knowledgemeasured by the question set would be a model givingthe students’ probability of selecting each answer.This probability can be represented as a vector ~p ¼ðp1; p2; p3; p4; p5Þ, where p1 is the probability the studentselects the first response, response a. The probabilityvector ~p for a student can be estimated from the response
vector for that student as ~p ¼ ~R=Nq ¼ ðR1=Nq;
R2=Nq; R3=Nq; R4=Nq; R5=NqÞ.The distribution of response vectors shown in Figs. 3 and
4 seems to indicate that there are subgroups of studentswith similar answering patterns. Focusing on the Spring2006 data set, the peaks near the correct answer 07000including vectors 07000, 06010, and 16000 give evidencefor a subgroup of students with probability vector ~p ¼ð�;�; 0; �; 0Þ, where � � �> �. Note that this exampleillustrates a danger in the response vector plots. The re-sponse vectors are five dimensional; a plot like Fig. 3,which presents the five-dimensional object on a one-dimensional graph, often does not represent the distancebetween two vectors correctly. The peaks at 00070, 01060,and 00061 suggest a second group with ~p nearð0; �; 0; �; �Þ, where � � �> �. The vectors 02050 and03040 give some evidence for smaller third group with ~pnear ð0; �; 0; �; 0Þ with �>�. The cluster analysis per-formed in Sec. VII will further support the existence of thissubgroup.
As a result of the above discussion, it seems reasonableto try to extract a model of the state of student knowledgefor the pretest and posttest data in terms of a set ofsubgroups of students where each student in a subgrouphas the same probability vector ~pi. The size of the sub-groups will be characterized by �i ¼ Ni=N, which will becalled the group population fraction, where Ni is the num-ber of students in the group andN is the number of studentsin the course, N ¼ P
iNi.
A. Overlap
Later in the paper we will examine the problem ofextracting �i and ~pi from a data set and characterizingthe reliability of the extraction. A key property that deter-mines whether two subgroups can be resolved is the geo-metric overlap of the average radius of the sphere thatcontains the subgroups. The subgroups in this paper aremodeled with vectors representing the probability ofchoosing a certain response to a physics question. Theoverlap of two subgroups is then related to the probabilitythat two students from different subgroups generate thesame response vector. This probability will be called the
overlap, Vij, between the two subgroups and can be calcu-
lated directly from ~pi.The probability that a student with probability vector
~p ¼ ðp1; p2; p3; p4; p5Þ will generate the response vector~R ¼ ðR1; R2; R3; R4; R5Þ is defined as P ð ~R; ~pÞ. For an Nq
question experiment where each question has Nr re-
sponses, P ð ~R; ~pÞ is given by
P ð ~R; ~pÞ ¼�
Nq!
R1!R2!R3!R4!R5!
�pR1
1 pR2
2 pR3
3 pR4
4 pR5
5 : (3)
The overlap between the probability distributions of vector~pi and ~pj can then be defined as
Vij ¼X~R
minðP ð ~R; ~piÞ;P ð ~R; ~pjÞÞ; (4)
where the sum is taken over all response vectors. If theprobability distributions were continuous, the overlapwould be the area under both probability curves. The over-lap V of a model will be defined as the maximum pairwiseoverlap of the vectors in the model.
B. Consistency
With the probability of each vector given in Eq. (3) onecan calculate the consistency Ck of a student with proba-bility vector ~pk. As before, define the consistency ofstudent k on two related problems, i and j, as Ck
ij where
Ckij is 1 if the problems are answered consistently and 0
otherwise. The consistency of a student is then the averageof Ck
ij, Ck ¼ hCk
iji, over the set of problem pairs. Likewise,
the consistency of a course can be defined as the average ofthe consistency of its students. The consistency Ck is theprobability of student k selecting the same answer in a two-
question experiment. Using Nq ¼ 2 and ~Rk ¼ ð2; 0; 0; 0; 0Þin Eq. (3) yields the probability that the first multiple-choice answer is selected for both questions in atwo-question experiment as ðpk
1Þ2. The consistency of astudent with probability vector ~pk; Ck, is then
Ck ¼ ~pk � ~pk: (5)
The consistency of a course C with group populationfractions �i is
C ¼ Xi
�i ~pi � ~pi: (6)
C. Symmetric two-component vectors
To investigate the properties of a set of probabilityvectors that would generate a data set that can be reliablydivided into subgroups, consider the probability vectorsand group population fractions for the two-group model:
�1 ¼ 0:5; ~p1 ¼ ða; 1� a; 0; 0; 0Þ;�2 ¼ 0:5; ~p2 ¼ ð1� a; a; 0; 0; 0Þ: (7)
USING CLUSTER ANALYSIS TO IDENTIFY . . . PHYS. REV. ST PHYS. EDUC. RES. 8, 020112 (2012)
020112-7

This model depends on one parameter, a, and produces asymmetric response vector probability distribution. ForNq ¼ 7, there are only eight response vectors produced
by this model. The probability distributions for a ¼ 0:95,a ¼ 0:8, a ¼ 0:75, and a ¼ 0:7 are shown in Fig. 7, wherethe probability is plotted in terms of N1, the number oftimes a student selects the first response choice. The over-lap V is calculated for each figure.
Figure 7 shows that for models with small overlap(V � 0) two easily identifiable subgroups exist. As theoverlap increases, the peaks move together and eventuallyat V ¼ 0:25 it becomes difficult to visually resolve twodistinct subgroups. At sufficiently high overlap, the divi-sion of the data into subgroups is not warranted.
V. COMPARISON OF SUBGROUPIDENTIFICATION METHODS
Following the statistical analysis of Sec. IV, we wouldlike to further our understanding of the 2006 course data bydeveloping a model of the knowledge state of the studentsin the course in terms of a set of group population fractions�i and probability vectors ~pi. The visual investigation ofFigs. 3 and 4 provided a qualitative summary of the prop-erties of both semesters’ pretest data. This qualitative in-vestigation does not, however, allow the estimation of thesizes of the subgroups of students or allow the exactcharacterization of the vectors of the subgroups. As withany visual investigation of a statistical data set, it is alsopossible that identifiable subgroups were missed or statis-tical fluctuations were spuriously identified as subgroups.The additional detail offered by a model of the subgroup
structure of a course will allow the investigation of impor-tant questions that cannot be answered by the average scoreor the average consistency. The course studied increasedboth the consistency and the score on the two problemsconsidered, but what was the character of the groups ofstudents that answered mostly correctly? Were they verysure of the correct answer, selecting correctly with highprobability, or only mostly sure, periodically selecting anincorrect answer? How did the character of the mostly suregroup (which was also present before instruction) changewith instruction? Did the students who already had aNewtonian model apply it with higher probability afterinstruction? What was the character of the subgroup thatstill retained the alternate model? After instruction, did thisgroup now apply the correct model and the alternate modelwith substantial probability? Did the noise seen in theresponse vector plots represent a group of students whowere uncertain, oscillating between many answers? Thesubgroup models constructed below will answer all thesequestions and provide a remarkably detailed picture of thecourse studied.Two very different methods will be considered for the
extraction of an accurate set of group population fractionsand probability vectors, model analysis [34] and clusteranalysis. The purpose of this section is to compare the twomethods and to select the best method to use to model the2006 data.Model analysis provides a computationally efficient
method for extracting �i and ~pi based on an analogywith the quantum mechanical density matrix.Unfortunately, it is only exact in certain limits and doesnot allow the control of the number of subgroups extracted.Since model analysis is only used within the physicseducation research community, it is not as extensivelystudied as clustering algorithms and as such is not sup-ported in statistical software packages.Cluster analysis is broadly studied and is a common
technique in many disciplines. Some clustering algorithmsallow for the control of the number of clusters, subgroups,
Pro
b
a=0.95 V=0.0004
Pro
b
a=0.8 V=0.067
Pro
b
a=0.75 V=0.14
0 1 2 3 4 5 6 7
Pro
b
a=0.7 V=0.25 M=0.126
M=0.000
M=0.032
M=0.071
N1
FIG. 7. Probability distribution of the response vectors ofsymmetric probability vectors. V is the overlap between thetwo vectors in the model. M is the misassignment rate in asimulated clustering experiment.
STEWART et al. PHYS. REV. ST PHYS. EDUC. RES. 8, 020112 (2012)
020112-8

in the model and provide models that can be made arbi-trarily close to the maximal R2 model (defined below).Since clustering algorithms are common, most statisticalsoftware packages contain a variety of algorithms. Thealgorithm investigated in Sec. VB, k-means, was chosenfor its simplicity, its long history, its control of the numberof clusters, its broad acceptance, and its ease of implemen-tation and modification. Many other algorithms are avail-able and would yield similar results.
A. Model analysis
Model analysis was introduced by Bao in [37] anddescribed by Bao and Redish [34] as a method for usingmultiple, matched problems measuring the same physicalconcept to develop a model of the state of student knowl-edge in terms of course model vectors, representing theknowledge state of subsets of the students in the course.The size of these subsets can be estimated using theeigenvalues of the course density matrix. This estimate isexpected to be most accurate either when there is onedominant subgroup, one group with �i � 1, or when theprobability vectors of the subgroups are orthogonal. Sincethe �i and ~pi calculated using model analysis are approxi-mate away from these two limiting cases, it is productive toinvestigate how rapidly the estimated values diverge fromthe exact values for classes not meeting either of theseconditions. The formalism introduced in Sec. IV offers arich platform for investigating model analysis. The follow-ing uses the notation introduced by Bao in [37] and sum-marized in Bao et al. [35].
The student response vectors introduced in Sec. IV,~Rk ¼ ðNk
1 ; Nk2 ; N
k3 ; N
k4 ; N
k5Þ, where k indexes the student,
can be converted into the single-student model state as
juki ¼ 1ffiffiffiffiffiffiNq
p
ffiffiffiffiffiffiNk
1
qffiffiffiffiffiffiNk
2
qffiffiffiffiffiffiNk
3
qffiffiffiffiffiffiNk
4
qffiffiffiffiffiffiNk
5
q
0BBBBBBBBBBBBBBB@
1CCCCCCCCCCCCCCCA; (8)
where Nq ¼P
Ni is the number of questions. The course
density matrix is then formed as
D ¼ 1
N
Xk
jukihukj; (9)
where N is the number of students.We will restrict our investigation to systems where each
question has only two responses. With this simplification,the single-student model state vector becomes
juki ¼ 1ffiffiffiffiffiffiNq
p0B@
ffiffiffiffiffiffiNk
1
qffiffiffiffiffiffiffiffiffiffiffiffiffiffiffiffiffiffiffiNq � Nk
1
q1CA: (10)
Suppose the underlying state of knowledge of the studentsis represented by the probability vector ~p ¼ ða; 1� aÞ. Inthe large Nq limit, where the students answer many similar
questions, the single-student model state vector shouldconverge to
juki ¼ ffiffiffi
apffiffiffiffiffiffiffiffiffiffiffiffi1� a
p!: (11)
If all students have the same knowledge state, ~p ¼ða; 1� aÞ, the course density matrix becomes
DðaÞ ¼ affiffiffiffiffiffiffiffiffiffiffiffiffiffiffia� a2
pffiffiffiffiffiffiffiffiffiffiffiffiffiffiffia� a2
p1� a
!: (12)
Model analysis predicts that the eigenvalues of the densitymatrix will be related to the group population fractions �i.If one computes the eigenvalues, �1 and �2, of DðaÞ inEq. (12), one finds correctly that �1 ¼ 1 and �2 ¼ 0. So inthe first case discussed above where one group dominates,model analysis recovers it [34].Now consider a two-group model, Eq. (13), using sym-
metric probability vectors. This is a generalization of thesystem investigated in Sec. IVC:
�1 ¼ �; ~p1 ¼ ða; 1� aÞ;�2 ¼ 1� �; ~p2 ¼ ð1� a; aÞ; (13)
This system produces the density matrix
Dða; �Þ ¼ �a
ffiffiffiffiffiffiffiffiffiffiffiffiffiffiffia� a2
pffiffiffiffiffiffiffiffiffiffiffiffiffiffiffia� a2
p1� a
!
þ ð1� �Þ 1� affiffiffiffiffiffiffiffiffiffiffiffiffiffiffia� a2
pffiffiffiffiffiffiffiffiffiffiffiffiffiffiffia� a2
pa
!; (14)
which can be written as
Dða; �Þ ¼ 1� bffiffiffiffiffiffiffiffiffiffiffiffiffiffiffia� a2
pffiffiffiffiffiffiffiffiffiffiffiffiffiffiffia� a2
pb
!;
where b ¼ aþ �� 2�a.The general form of the eigenvalues of Eq. (14) is
�� ¼ 1
2ð1�
ffiffiffiffiffiffiffiffiffiffiffiffiffiffiffiffiffiffiffiffiffiffiffiffiffiffiffiffiffiffiffiffiffiffiffiffiffiffiffiffiffiffiffiffiffiffiffiffiffiffiffiffiffiffiffiffi4ða� a2Þ � 4ðb� b2Þ þ 1
qÞ: (15)
To recover the model in Eq. (13), this expression shouldyield �� ¼ � and 1� �, which it does only when a ¼ 1 ora ¼ 0. If a ¼ 0 or a ¼ 1, the ~pi vectors are orthogonal, sofor the second limiting case presented above model, analy-sis correctly extracts �i for this model.Away from the two limiting cases, the � estimated
using model analysis diverges from the � of the model,
USING CLUSTER ANALYSIS TO IDENTIFY . . . PHYS. REV. ST PHYS. EDUC. RES. 8, 020112 (2012)
020112-9
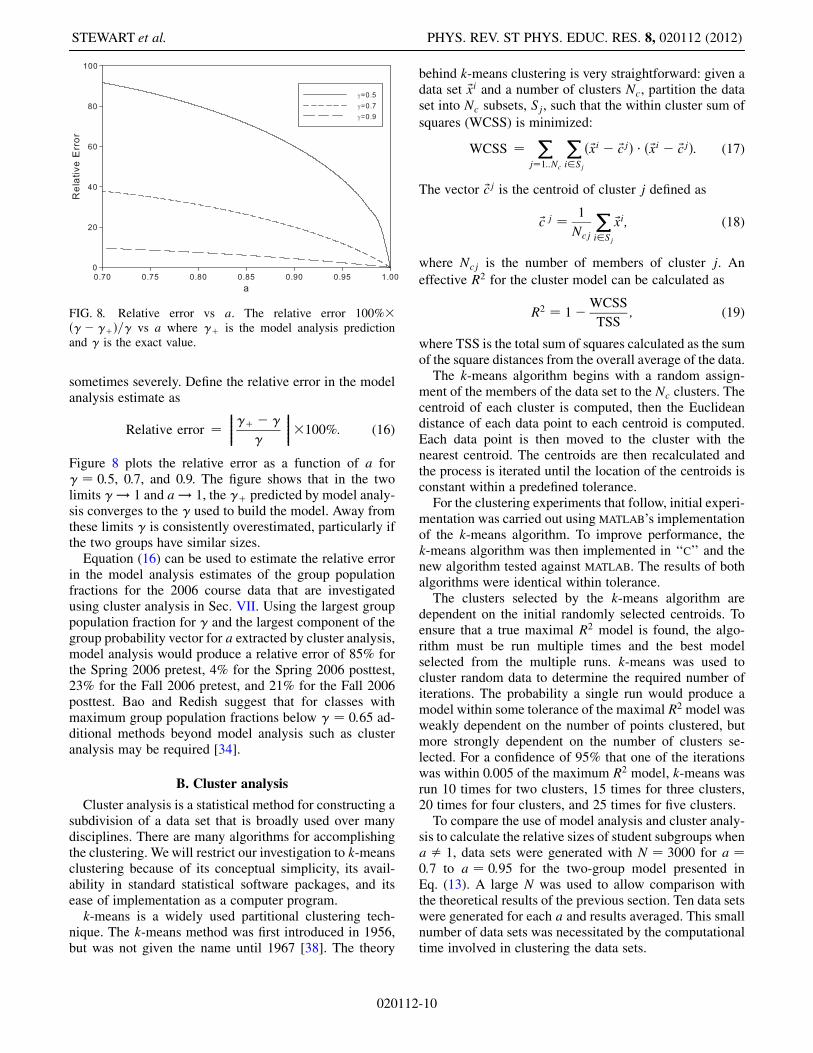
sometimes severely. Define the relative error in the modelanalysis estimate as
Relative error ¼���������þ � �
�
���������100%: (16)
Figure 8 plots the relative error as a function of a for� ¼ 0:5, 0.7, and 0.9. The figure shows that in the twolimits � ! 1 and a ! 1, the �þ predicted by model analy-sis converges to the � used to build the model. Away fromthese limits � is consistently overestimated, particularly ifthe two groups have similar sizes.
Equation (16) can be used to estimate the relative errorin the model analysis estimates of the group populationfractions for the 2006 course data that are investigatedusing cluster analysis in Sec. VII. Using the largest grouppopulation fraction for � and the largest component of thegroup probability vector for a extracted by cluster analysis,model analysis would produce a relative error of 85% forthe Spring 2006 pretest, 4% for the Spring 2006 posttest,23% for the Fall 2006 pretest, and 21% for the Fall 2006posttest. Bao and Redish suggest that for classes withmaximum group population fractions below � ¼ 0:65 ad-ditional methods beyond model analysis such as clusteranalysis may be required [34].
B. Cluster analysis
Cluster analysis is a statistical method for constructing asubdivision of a data set that is broadly used over manydisciplines. There are many algorithms for accomplishingthe clustering. We will restrict our investigation to k-meansclustering because of its conceptual simplicity, its avail-ability in standard statistical software packages, and itsease of implementation as a computer program.
k-means is a widely used partitional clustering tech-nique. The k-means method was first introduced in 1956,but was not given the name until 1967 [38]. The theory
behind k-means clustering is very straightforward: given adata set ~xi and a number of clusters Nc, partition the dataset into Nc subsets, Sj, such that the within cluster sum of
squares (WCSS) is minimized:
WCSS ¼ Xj¼1::Nc
Xi2Sj
ð ~xi � ~cjÞ � ð ~xi � ~cjÞ: (17)
The vector ~cj is the centroid of cluster j defined as
~c j ¼ 1
Ncj
Xi2Sj
~xi; (18)
where Ncj is the number of members of cluster j. An
effective R2 for the cluster model can be calculated as
R2 ¼ 1�WCSS
TSS; (19)
where TSS is the total sum of squares calculated as the sumof the square distances from the overall average of the data.The k-means algorithm begins with a random assign-
ment of the members of the data set to the Nc clusters. Thecentroid of each cluster is computed, then the Euclideandistance of each data point to each centroid is computed.Each data point is then moved to the cluster with thenearest centroid. The centroids are then recalculated andthe process is iterated until the location of the centroids isconstant within a predefined tolerance.For the clustering experiments that follow, initial experi-
mentation was carried out using MATLAB’s implementationof the k-means algorithm. To improve performance, thek-means algorithm was then implemented in ‘‘C’’ and thenew algorithm tested against MATLAB. The results of bothalgorithms were identical within tolerance.The clusters selected by the k-means algorithm are
dependent on the initial randomly selected centroids. Toensure that a true maximal R2 model is found, the algo-rithm must be run multiple times and the best modelselected from the multiple runs. k-means was used tocluster random data to determine the required number ofiterations. The probability a single run would produce amodel within some tolerance of the maximal R2 model wasweakly dependent on the number of points clustered, butmore strongly dependent on the number of clusters se-lected. For a confidence of 95% that one of the iterationswas within 0.005 of the maximum R2 model, k-means wasrun 10 times for two clusters, 15 times for three clusters,20 times for four clusters, and 25 times for five clusters.To compare the use of model analysis and cluster analy-
sis to calculate the relative sizes of student subgroups whena � 1, data sets were generated with N ¼ 3000 for a ¼0:7 to a ¼ 0:95 for the two-group model presented inEq. (13). A large N was used to allow comparison withthe theoretical results of the previous section. Ten data setswere generated for each a and results averaged. This smallnumber of data sets was necessitated by the computationaltime involved in clustering the data sets.
FIG. 8. Relative error vs a. The relative error 100%�ð�� �þÞ=� vs a where �þ is the model analysis predictionand � is the exact value.
STEWART et al. PHYS. REV. ST PHYS. EDUC. RES. 8, 020112 (2012)
020112-10

Figure 9 plots the � computed by k-means and by modelanalysis against a for � ¼ 0:5 and � ¼ 0:7. The theoretical� calculated frommodel analysis in theN ! 1 limit givenin Eq. (15) is also plotted. To perfectly recover the modelused to generate the data, each curve should be a horizontalline passing through �. The k-means algorithm does excep-tionally well except for � ¼ 0:7 and a � 0:75. The diver-gence from � ¼ 0:7 for these cases may result from thesmall number of data sets averaged and the growth in errorwith increasing overlap. Model analysis correctly extracts� only for a ¼ 1 and then progressively diverges from thecorrect � as predicted in the previous section.
While model analysis is somewhat less computationallyexpensive than k-means or other traditional clusteringalgorithms, the group population fractions predicted byk-means more accurately reproduce the group populationfractions of the underlying models except in the case wherea ¼ 1. As such, to use model analysis one must be able toargue either that the data set is near the � ¼ 1 limit or thatthe underlying model vectors are orthogonal. Since theseconditions were not met for all course data under consid-eration, only cluster analysis will be used to analyze the2006 course data.
VI. CHARACTERIZING COURSE MODELS
k-means will generate a cluster model for any Nc up tothe number of data points. It is therefore important to beable to evaluate the fitness of a given model. The mostimportant feature of a cluster model is that it explains asubstantial amount of the variation in the data; good mod-els have a large R2. R2 increases as the number of clustersincreases and therefore a maximal R2 value cannot be usedto select an optimal model.
A second criterion is that the model correctly representsthe underlying population. Error in representation occursthrough a number of mechanisms; there can be error in thegroup population fraction � or in the probability vectors ~pextracted by the clustering algorithm. The clustering algo-rithm also partitions the data and may assign students toincorrect clusters.The third criterion for a good cluster model is that the
number of clusters is correct. Selecting the number ofclusters in a set of data is an extremely active area ofresearch. We experimented with a number of cluster se-lection criteria such as the ‘‘knee’’ method or the averagesilhouette. For the very discrete data produced by theseven-question experiment considered above, where thereare only 330 possible data points, all these methods wereextremely ambiguous.Unlike in general cluster analysis, the centroids of the
clusters that will be extracted below will be probabilityvectors. As was qualitatively explored in Sec. IVC, theoverlap V between two probability vectors will be a usefuladditional statistic for characterizing the degree to which adata set can be accurately separated into a set of clusters.
A. Simulation experiments
To understand the error in the clustering of student data,group population fractions �i and probability vectors ~pi
were randomly generated for Ng ¼ 2–5, where Ng is the
number of groups. The generated �i and ~pi were then usedto create a data set containing N ¼ 300 response vectors.This number of response vectors was selected as a reason-able size for an introductory science course at many uni-versities. The effect of N on the clustering error will beinvestigated in Sec. VI C.Four strategies were used to generate the random mod-
els; for each strategy, 100 000 data sets were created,clustered, and analyzed. Each strategy first randomly se-lected Ng ¼ 2–5 groups. With this selection, group popu-
lation fractions �i were randomly generated such thatPi�i ¼ 1. If the �i selected would on average produce a
group with less than 10 students, then �i were regenerated.The first strategy then randomly generated the probabilityvectors ~pi. It was found that this generated models wherethe vectors were on average fairly close together. To pro-duce models with vectors that were farther apart, threeadditional strategies were used. The second strategy calcu-lated the total probability already allocated to previouslygenerated probability vectors pt and weighted the proba-bility of that component of the next vector by 1� pt. Thethird strategy randomly generated vectors as before, butrequired that ~p have only two nonzero components. Thelast strategy modified strategy three and produced onlyvectors with three nonzero components. Once a modelwas generated, it was used to produce a data set withN ¼ 300 members. The data set was then clustered usingk-means.
k-meansmodel analysismodel analysis predicted
γ=0.5
γ=0.7
a
γγ
FIG. 9. Computed group population fraction � versus a. Thedata used in the top figure are generated with � ¼ 0:5 and thebottom figure � ¼ 0:7. The model analysis predicted line plotsthe theoretical prediction of the group population fraction calcu-lated from Eq. (15).
USING CLUSTER ANALYSIS TO IDENTIFY . . . PHYS. REV. ST PHYS. EDUC. RES. 8, 020112 (2012)
020112-11

B. Misassignment and overlap
The centroids that resulted from clustering do not per-fectly correspond to the probability vectors used to gen-erate the data set. Each centroid was associated with thegroup in the probability model with the nearest probabilityvector. Since the data set was artificially generated, eachmember of the data set was unambiguously generated aspart of some subgroup. The resulting clustered partition ofthe data set might not place members in the cluster asso-ciated with the group from which the member was gener-ated. The fraction of students placed in the incorrect clusterwill be called the misassignment rate M.
The closer two groups are together, the higher theprobability a member generated from one group will beplaced in a cluster associated with a different group.
The symmetric vectors explored in Sec. IVC and pre-sented in Fig. 7 were used to investigate the relationship ofoverlap and misassignment. For each system in Fig. 7, 100data sets were produced and clustered using the k-meansalgorithm. For each figure, the parameter a, the overlap V,and the average misassignment rate M for the clusteredmodels are reported. The misassignment rate increaseswith the overlap. An overlap of V ¼ 0:25 (a ¼ 0:7) showslittle visual evidence of two distinct peaks.
The misassignment rate M for models with differentnumbers of clusters is difficult to compare because theupper bound on M changes with the number of clustersNc. If data are randomly assigned to two clusters of equalsize, half on average would be assigned to the wrongcluster, M ¼ 1
2 . If data are randomly assigned to five
clusters, the expected misassignment rate is 80%. To com-pensate for this difference, consider a normalized misas-signment rate MN ,
MN ¼ M
1� 1=Nc
: (20)
The results of clustering the 400 000 generated data sets areshown in Fig. 10. To generate this figure, the data wereseparated into segments of width �V ¼ 0:02. The averagenormalized misassignment and the standard deviation ofthe normalized misassignment were calculated for eachsegment. The normalized misassignment grows fairly lin-early with overlap for overlaps from V ¼ 0:0 to 0.25. Thislinear trend does not continue beyond V ¼ 0:25 becausethe misassignment begins to saturate as the overlap grows.Examination of Fig. 7 shows that at V ¼ 0:25 the symmet-ric vector’s probability distribution exhibits little visualevidence of the existence of two clusters. The data arewell fitted by Eq. (21) relating the normalized misassign-ment to the overlap and by Eq. (22), which relates thestandard deviation in the normalized misassignment rateSDMN
to the overlap:
MN ¼ 1:91V þ 0:0085 ðR2 ¼ 0:996Þ; (21)
SDMN¼ 0:701V þ 0:0293 ðR2 ¼ 0:977Þ: (22)
C. Effect of N
All previous analysis was performed for data sets con-taining N ¼ 300 members. The 2006 course data from theUniversity of Arkansas contains from 149 to 200 students;therefore, the effect of N on the misassignment rate mustbe understood.To allow prediction of the effect of N on the misassign-
ment rate, a variety of linear models were fit to randomlygenerated data sets that varied N from 30 to 300. 400 000random models were generated using the same set ofstrategies detailed in Sec. VI B. To extract the dependenceof the normalized misassignment rate and its standarddeviation on N and V, the data were divided into regionsof width �N ¼ 30 in N and �V ¼ 0:02 in V. The averageand standard deviation for MN was calculated for eachregion and a linear fit yielded
MN ¼1:90V�0:103
�N
300
�þ0:072 ðR2¼0:95Þ (23)
and
SDMN¼ 0:440V � 0:025
�N
300
�þ 0:083 ðR2 ¼ 0:76Þ:
(24)
Since both V and N=300 have approximately the samerange for the experiment, the size of their coefficientscan be compared to evaluate the relative importance ofoverlap and N. The overlap has a much stronger influenceon the normalized misassignment rate than the numberof students in the sample. A nonlinear model adding an
MN
0.0
0.2
0.4
0.6
0.8
V
0.00 0.05 0.10 0.15 0.20 0.25
SD
MN
0.00
0.04
0.08
0.12
0.16
0.20
FIG. 10. Normalized misassignment rateMN versus overlap V,and the standard deviation in normalized misassignment rateSDMN
versus overlap.
STEWART et al. PHYS. REV. ST PHYS. EDUC. RES. 8, 020112 (2012)
020112-12
NV term was also fit, but this addition had very little effecton R2. For a 10% overlap, the normalized misassignmentrate changes from MN ¼ 0:25 at N ¼ 30 to MN ¼ 0:16 atN ¼ 300.
D. Centroid and vector error
Cluster models do not perfectly locate the centroids orgroup population fractions of the underlying model. Theaverage distance between the centroid found by k-meansand the probability vector used to generate the randommodel can be calculated and will be called the ‘‘centroiderror’’ Ec. A linear regression of centroid error against theoverlap yielded
Ec ¼ 0:495V þ 0:036 ðR2 ¼ 0:38Þ: (25)
The centroid error also grows with overlap, as does itsstandard deviation.
The average error in the group population fractions Eg
can be calculated as the distance between the computedgroup population fractions and the model population frac-tions treated as vectors. This also increases with overlapand a linear regression of Eg on V yields Eq. (26). The
standard deviation of Eg also increases with overlap,
Eg ¼ 0:295V þ 0:020 ðR2 ¼ 0:21Þ: (26)
Note that the R2 for the above equations is much smallerthan other R2 values reported. More investigation is re-quired to understand why these quantities are so muchharder to predict.
VII. CLUSTERING OF COURSE DATA
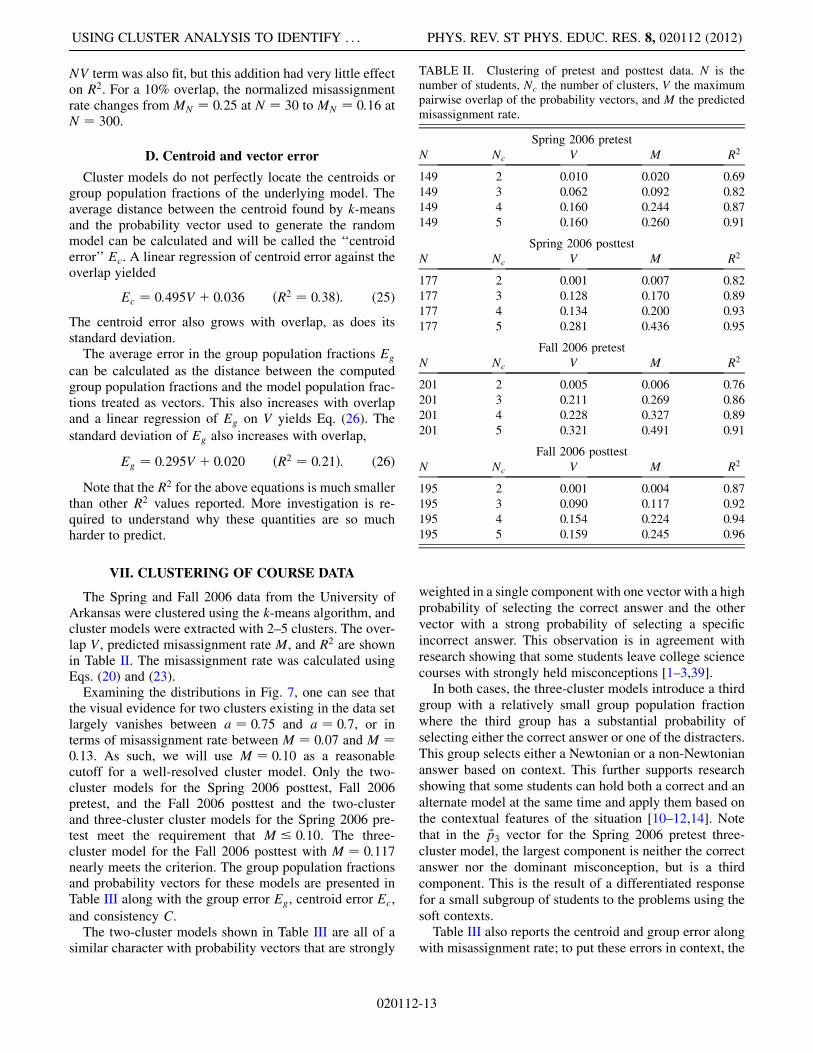
The Spring and Fall 2006 data from the University ofArkansas were clustered using the k-means algorithm, andcluster models were extracted with 2–5 clusters. The over-lap V, predicted misassignment rate M, and R2 are shownin Table II. The misassignment rate was calculated usingEqs. (20) and (23).
Examining the distributions in Fig. 7, one can see thatthe visual evidence for two clusters existing in the data setlargely vanishes between a ¼ 0:75 and a ¼ 0:7, or interms of misassignment rate between M ¼ 0:07 and M ¼0:13. As such, we will use M ¼ 0:10 as a reasonablecutoff for a well-resolved cluster model. Only the two-cluster models for the Spring 2006 posttest, Fall 2006pretest, and the Fall 2006 posttest and the two-clusterand three-cluster cluster models for the Spring 2006 pre-test meet the requirement that M � 0:10. The three-cluster model for the Fall 2006 posttest with M ¼ 0:117nearly meets the criterion. The group population fractionsand probability vectors for these models are presented inTable III along with the group error Eg, centroid error Ec,
and consistency C.The two-cluster models shown in Table III are all of a
similar character with probability vectors that are strongly
weighted in a single component with one vector with a highprobability of selecting the correct answer and the othervector with a strong probability of selecting a specificincorrect answer. This observation is in agreement withresearch showing that some students leave college sciencecourses with strongly held misconceptions [1–3,39].In both cases, the three-cluster models introduce a third
group with a relatively small group population fractionwhere the third group has a substantial probability ofselecting either the correct answer or one of the distracters.This group selects either a Newtonian or a non-Newtoniananswer based on context. This further supports researchshowing that some students can hold both a correct and analternate model at the same time and apply them based onthe contextual features of the situation [10–12,14]. Notethat in the ~p3 vector for the Spring 2006 pretest three-cluster model, the largest component is neither the correctanswer nor the dominant misconception, but is a thirdcomponent. This is the result of a differentiated responsefor a small subgroup of students to the problems using thesoft contexts.Table III also reports the centroid and group error along
with misassignment rate; to put these errors in context, the
TABLE II. Clustering of pretest and posttest data. N is thenumber of students, Nc the number of clusters, V the maximumpairwise overlap of the probability vectors, and M the predictedmisassignment rate.
Spring 2006 pretest
N Nc V M R2
149 2 0.010 0.020 0.69
149 3 0.062 0.092 0.82
149 4 0.160 0.244 0.87
149 5 0.160 0.260 0.91
Spring 2006 posttest
N Nc V M R2
177 2 0.001 0.007 0.82
177 3 0.128 0.170 0.89
177 4 0.134 0.200 0.93
177 5 0.281 0.436 0.95
Fall 2006 pretest
N Nc V M R2
201 2 0.005 0.006 0.76
201 3 0.211 0.269 0.86
201 4 0.228 0.327 0.89
201 5 0.321 0.491 0.91
Fall 2006 posttest
N Nc V M R2
195 2 0.001 0.004 0.87
195 3 0.090 0.117 0.92
195 4 0.154 0.224 0.94
195 5 0.159 0.245 0.96
USING CLUSTER ANALYSIS TO IDENTIFY . . . PHYS. REV. ST PHYS. EDUC. RES. 8, 020112 (2012)
020112-13

maximum distance between two ~p isffiffiffi2
p. For three vectors,
where one of the vectors is at the center of the other two asis approximately the case in the three-cluster models, the
distance between the nearest clusters is 1=ffiffiffi2
p. The two-
cluster model with the maximum overlap was the Spring2006 pretest model with V ¼ 0:01. At this overlap,Eq. (25) predicts a centroid error of Ec ¼ 0:04. The dis-tance between the two centroids in this model is 0.99, sothe centroid error is 4% of the intercentroid distance. Forthe three-cluster models, the minimum intercentroid dis-tance is 0.54 at an overlap of V ¼ 0:09 in Fall 2006, whichyields a predicted error of Ec ¼ 0:08, 15% of the inter-centroid distance. Therefore, the error in locating the cen-troid can become important as overlap increases or as theintercentroid distance decreases. Comparison of the grouperrors with the group population fractions shows that grouperror is also particularly important in the smaller groups inthe three-cluster models.
Using the results of the previous section, the subgroupmodels extracted by k-means have predicted misassign-ment rates less the 10% (excluding the three-cluster Fall2006 posttest model) and acceptable centroid and grouperrors. The predicted overlap indicates that the extractedsubgroups should be well separated from one another.
VIII. DISCUSSION
Four research questions were proposed in the introduc-tion. Each will be discussed in turn.Does the consistency of students’ answers evolve over
the course of an exam?The pairwise consistency plotted in Fig. 2 shows very
little change over the course of the exam. Since the con-sistency evolves little, the experiments presented in theIntroduction that used paired problems should produceresults that are not biased by changes in the student causedby the exam. This result also lends support for the validityof experiments using many contextually related questions[11,13,19]. The experiment presented in this paper spreadsseven questions through a 36 question test while otherwork used a much higher density of contextually relatedquestions, using exams with either nine consecutive con-textually related questions [19] or eight questions in a ten-question test [11,13]. More research is needed varying thelength of the test before it could be concluded thatmultiple-question experiments with a much higher densityof context-related questions also do not suffer from anevolution of consistency.Table I presents the overall consistency C for each data
set. The students are quite consistent on both problems atthe beginning of the course with C ¼ 0:71 and 0.72. Thisconsistency is commensurate with the consistency ob-served by Palmer [13] for college students postinstruction.The consistency on these problems for the course studiedincreases to C ¼ 0:89 and 0.86 postinstruction. The higherconsistency produced by the course studied than that ob-served by Palmer could be a result of the problem selection(Palmer used Newton’s first law), the population of stu-dents, the time between instruction and testing, or theinquiry-based nature of the course, among other factors.This observation of increased consistency postinstructionlends further support to studies finding that students’ con-sistent application of both the correct and alternate modelsincreases with instruction [13,14].While not directly related to the issue of the evolution of
consistency, the experiment used a range of contexts fromthe traditional ‘‘hard’’ contexts used in most physics prob-lems to ‘‘softer’’ contexts using balloons and pillows. Asseen in Table I, these soft contexts did produce effects onconsistency and problem average, but only at about the10% level. This is a smaller effect than observed in pre-vious studies [19], but the previous studies were done withhigh school students and this study is performed withcollege students. Students emerging from the 2006 courses
TABLE III. Group population fractions and vectors. Correctanswer shown in bold face. Note that some vectors do not add to1 because of accumulated rounding error. C is the course con-sistency as defined in Eq. (6), Ec is the centroid error, and Eg the
group error.
Spring 2006 pretest—two-cluster
Ec ¼ 0:04, Eg ¼ 0:02, C ¼ 0:64
�1 ¼ 0:49 ~p1 ¼ ð0:01; 0:10; 0:02; 0:84; 0:03Þ�2 ¼ 0:51 ~p2 ¼ ð0:13; 0:73; 0:02; 0:08; 0:04Þ
Spring 2006 pretest—three-cluster
Ec ¼ 0:07, Eg ¼ 0:04, C ¼ 0:68
�1 ¼ 0:39 ~p1 ¼ ð0:04; 0:86; 0:02; 0:07; 0:01Þ�2 ¼ 0:48 ~p2 ¼ ð0:01; 0:10; 0:02; 0:85; 0:01Þ�3 ¼ 0:13 ~p3 ¼ ð0:40; 0:29; 0:05; 0:11; 0:16Þ
Spring 2006 posttest
Ec ¼ 0:04, Eg ¼ 0:02, C ¼ 0:87
�1 ¼ 0:86 ~p1 ¼ ð0:02; 0:94; 0:01; 0:03; 0:01Þ�2 ¼ 0:14 ~p2 ¼ ð0:05; 0:08; 0:00; 0:86; 0:01Þ
Fall 2006 pretest
Ec ¼ 0:04, Eg ¼ 0:02, C ¼ 0:69
�1 ¼ 0:25 ~p1 ¼ ð0:08; 0:01; 0:01; 0:02; 0:87Þ�2 ¼ 0:75 ~p2 ¼ ð0:81; 0:04; 0:01; 0:08; 0:06Þ
Fall 2006 posttest—two-cluster
Ec ¼ 0:04, Eg ¼ 0:02, C ¼ 0:83
�1 ¼ 0:61 ~p1 ¼ ð0:04; 0:01; 0:00; 0:00; 0:95Þ�2 ¼ 0:39 ~p2 ¼ ð0:84; 0:03; 0:02; 0:04; 0:07Þ
Fall 2006 posttest—three-cluster
Ec ¼ 0:08, Eg ¼ 0:05, C ¼ 0:85
�1 ¼ 0:30 ~p1 ¼ ð0:93; 0:03; 0:00; 0:02; 0:01Þ�2 ¼ 0:11 ~p2 ¼ ð0:50; 0:05; 0:05; 0:07; 0:33Þ�3 ¼ 0:59 ~p3 ¼ ð0:03; 0:00; 0:00; 0:00; 0:96Þ
STEWART et al. PHYS. REV. ST PHYS. EDUC. RES. 8, 020112 (2012)
020112-14
were not substantially constrained to traditional physicscontexts for their application of Newtonian principles. Theeffects of soft contexts showed most strongly in problemconsistency; only the balloon context in the Spring 2006posttest showed a substantially different score than that ofthe other problems. Three of the four softer contexts hadnoticeably lower consistency in the pretest. These differ-ences mostly disappeared with instruction except onceagain for the balloon context. These observations supportwork showing that contextual sensitivity decreases withinstruction [6–8,13,14]. The difference in the responsesbetween the soft and hard physical contexts supports theobservations of Liu and MacIsaac [15] that familiarity is animportant variable in the consistent application of alternatemodels.
How can a data set containing the responses to multiple,context-related questions be used to subdivide a class intointellectually similar subgroups?
Model analysis and cluster analysis were compared us-ing models with two subgroups. Model analysis producedgood results in the limit when one subgroup contained themajority of students (�1 � 1) or when the probabilityvectors of the two subgroups were orthogonal. Awayfrom these limits, the population fractions calculated bymodel analysis diverged from the fractions input into themodels. The divergence was most severe when the twosubgroups were similar in size, �1 ¼ 1
2 and �2 ¼ 12 .
The cluster analysis algorithm investigated, k-means,correctly extracted the group population fractions overthe range where visual inspection suggested subdivisioninto clusters was reasonable. Using the vectors extracted byk-means in Table III to estimate the relative error producedby model analysis generated small errors (< 5%) for onlyone of the four data sets. Since the errors predicted formodel analysis were substantial for the studied course,cluster analysis was used to extract the subgroup structureof the course data. Methods were developed to characterizethe quality of the models produced by cluster analysisusing the overlap V. Application of these methods showedthat the clustering algorithm produced subgroup popula-tion fractions and probability vectors with acceptable er-rors. As such, k-means clustering is an efficacious methodof examining the subgroup structure of student understand-ing. Since model analysis overestimates the differences in�i in many cases, it is possible that the large populationfractions reported in previous research are artificially high.
Once a model subdividing a class into groups is con-structed, how does one evaluate the quality of the model?
The identification of the centroids of the clusters asprobability vectors allowed the introduction of a newmethod for characterizing the quality of a cluster modelusing the overlap V between the probability distributionsof pairs of probability vectors. The overlap V, which can bedirectly calculated from the probability vectors, allowedthe prediction of the amount of misassignment, centroid,
and group error in the cluster models. Balancing misas-signment rate M with R2 allowed the selection of well-resolved cluster models.It is possible that the correct underlying model does not
allow clustering into well-resolved models. This wouldappear as a largeR2 for a set of centroids with high overlap.This situation undoubtedly occurs in some classrooms, butwas not present in the course data clustered above.What are the subgroup models of the Spring 2006 and
Fall 2006 University Physics courses at the University ofArkansas?Two semesters of pretest and posttest data were clus-
tered using data taken at the University of Arkansas asshown in Table III. While the Spring 2006 pretest and theFall 2006 posttest showed evidence for a three-clustermodel where the third cluster contained students who hadsubstantial probability of selecting one of two choices, thegroup population fractions for these clusters were small,0.11 and 0.13. Therefore, in the course studied there is littleevidence for a substantial population of students applyingboth the correct model and an alternate model in differentcontextual situations. Though small, the existence of thesethree-cluster models shows that some students can bemoved to a mixed state by a physics course (almost allstudents entering the course have had some physics in-struction, so the pretest data can be viewed as the result ofsome previous physics course). This lends further supportfor the observations of Rosenblatt and Heckler showingthat for some concepts students learn by passing through anintermediate, partially correct state [40]. Their work alsostrongly suggests that on some questions, but not all ques-tions, three subgroups should be expected.In all cases, most students’ state of knowledge on the
two questions was described by the two-cluster probabilityvectors. The two-cluster models featured one group thatwith high probability (p > 0:7) answered correctly, andone group that with high probability (p > 0:8) answeredwith the same incorrect answer. For the group that consis-tently selected the incorrect model, the consistency ofselecting that model increased slightly with instructionfor both semesters. This supports research showing thatthe consistency of application of both the correct modeland incorrect models increases with instruction [13,14].The students entering the Spring 2006 course were
approximately evenly divided between the groups on thestatic force question tested. These students left instructionpredominately in the group that selected the correct answer� ¼ 0:86 with a small number retaining persistent mis-conceptions. In Fall 2006, using a Newton’s third lawquestion involving systems in motion, 75% of the incom-ing students consistently selected an incorrect answer. Thisnumber dropped to 30% after instruction; even withinquiry-based instruction a substantial subpopulation wasstill consistently applying an incorrect model for this typeof problem.
USING CLUSTER ANALYSIS TO IDENTIFY . . . PHYS. REV. ST PHYS. EDUC. RES. 8, 020112 (2012)
020112-15
The measurement of consistency C presented in Table Isubstantially improves the characterization of the courseover that provided by the average scores alone. The sub-group models presented in Table III further refine thischaracterization. Focusing on the Fall 2006 data, with nomeasure of consistency, the average score of S ¼ 26%observed for the Fall 2006 pretest might be taken as agroup of students that simply had no understanding ofthe problem. With a measured consistency of C ¼ 0:72,the course is shown to be formed of students who answerincorrectly because of strongly held alternate models. Thesubgroup model presented in Table III further refines thispicture, showing a class divided into two groups, oneforming one-quarter of the class that answers correctly87% of the time and one forming three-quarters of theclass that answers incorrectly—in the same way—81% ofthe time. There is no substantial group of students whoanswer uncertainly entering the course in Fall 2006.
The effect of instruction is multifaceted. Using thethree-cluster model for Fall 2006, the group answeringconsistently correctly expanded from 25% of the class to59% of the class, and the consistency of answering cor-rectly on each question also increased from p5 ¼ 0:87 top5 ¼ 0:96 (the fifth response is correct). The group ofstudents that answer consistently incorrectly shrank from75% to 30% of the class. The consistency of these stu-dents in selecting one of the incorrect responses (the firstresponse) also increased from p1 ¼ 0:81 to p1 ¼ 0:93.These students seem even more entrenched in the incor-rect model postinstruction. The course also generated asmall subpopulation (11% of the students) who movedfrom consistently applying a misconception to applyingthat misconception and the correct model based on thecontext of the question. The subgroup model gives a muchmore detailed picture of the class over the score or theoverall consistency alone in terms of the numbers ofstudents left in each of these three states, correct, incor-rect, and uncertain, and the details of the evolution ofthese states. This additional detail opens up the possibilityof studies to determine how different modes of instructionaffect the production of the third subgroup or canmodify the rate of consistent application of the alternatemodels.
IX. IMPLICATIONS FOR INSTRUCTION
The measurement above gives substantial additionalinformation about a course, but the results were restrictedto two problem sets for a single course. The specificimplications for the instruction for the course studied willbe discussed, as well as what different measurementswould indicate for other courses.
The course studied produced significant progress instudents’ application of Newton’s laws using a designthat mixed traditional lecture with interactive laboratories.Most students leaving the courses could be divided into
two groups: one group that consistently applied theNewtonian force concept correctly and one group thatfairly consistently applied a single misconception. Thesize of the group of students with persistent misconcep-tions is 14% for the static force problem examined in theSpring 2006 semester and 30% for the dynamic Newton’sthird law problem in Fall 2006 (again using the three-cluster model). The students in these groups have notbeen moved significantly toward a Newtonian force con-cept on these concepts by the course; in fact, students inthese groups answer incorrectly somewhat more consis-tently on the posttest than on the pretest. For thesestudents, the instruction in the course, particularly theactivities in the laboratory, have been completely ineffec-tive in moving the students toward the correct model.Within the limits of instructional time, the concepts rep-resented by these questions need to be revisited and newactivities constructed to allow these students to confronttheir misconceptions. The laboratory already containshands-on activities about the dynamical application ofNewton’s third law; these activities will have to be revis-ited and enhanced.While most students in the courses studied were con-
tained in two subgroups, different outcomes could havebeen observed for different courses and different problemchoices. Two alternate outcomes are of particular interest:in some courses, it should be possible to observe a soften-ing of the consistency of the group holding alternate con-ceptions or the production of a substantial third subgroupthat holds both the correct model and the alternate model.Both of these outcomes would produce subpopulations ofstudents who apply both the correct model and an incorrectmodel depending on the situation. Work on characterizingthe subgroup structure of classes [34] and understandingthe features of the misconceptions that influence that struc-ture [35] are evolving, so specific implications for instruc-tion for the above cases do not yet exist. It would be veryinteresting to determine the features of a course that pro-duces this shift in consistency. Furthermore, while it seemslikely that intensive, laboratory-based interventions will berequired to move students in the course studied away fromthe Newton’s third law misconception, perhaps alternatemethods would be useful in a course that produces studentsholding both models simultaneously. It would also be veryinteresting to study how the knowledge states of thesestudents evolve over time. Would the students fall backto applying the misconception consistently or move towardcorrectly applying Newton’s third law? It is only throughthe production of reliable methods to extract the subgroupstructure of a class that these important instructional issuescan be investigated.Consistency C provides an important additional statistic
beyond the average score on the problem S to aid inunderstanding an incoming student population and theresults of instruction. Since C evolves little over a
STEWART et al. PHYS. REV. ST PHYS. EDUC. RES. 8, 020112 (2012)
020112-16

multiple-question exam, a set of paired questions can beused to estimate C on a given concept. These questionsmay be drawn from standard instruments such as the FCI orForce and Motion Conceptual Evaluation [41] in manycases [34] and C should be easily calculable by workinginstructors. The additional information provided by thecluster models requires substantially more effort andprobably requires more time than is available to a workinginstructor, and therefore will remain primarily a researchtool. It is our hope that versions of standard conceptualevaluations containing multiple contextually related prob-lems can be created and made available along with resour-ces to do the clustering at Web sites maintained by thephysics community.
X. FUTURE
The k-means algorithm is only one of many clusteringalgorithms. The modeling of a cluster by a single parame-ter, its center, contains the assumption of spherical clusters.The probability vectors found when clustering the coursedata do not produce spherical clusters; the clusters areheavily weighted in two components and produce clustersthat tend to spread along a line. In the future, clusteringalgorithms that can account for nonspherical cluster shapeswill be investigated.
The experiment performed could be repeated with anyFCI question to determine if the observation that thestudents were either left in a state where they consis-tently selected the correct answer most of the time orconsistently selected the wrong answer was a generalfeature of the course or only a feature of the twoquestions studied. It would also be interesting to extendthis research to other institutions to see if probabilityvectors with the same general qualitative features wereproduced.
It would be very interesting to repeat this analysis fordifferent forms of instruction and determine how the classsubgroup structure is impacted by instructional methods.
XI. CONCLUSION
The consistency in answering conceptual Newtonianmechanics questions evolved very little over sevenmatched questions; therefore, the consistency measuredby a set of paired questions should be a good estimate ofthe overall consistency. The k-means algorithm is an ef-fective mechanism for extracting the underlying subgroupsin student data. The statistical overlap of the probabilitydistributions of the student responses in the class sub-groups is a highly useful statistic for characterizing thesemodels. The cluster models extracted from data taken atthe University of Arkansas suggested that consistency in-creased during instruction in an inquiry-based course, but asubset of students were left consistently applying a non-Newtonian model.
ACKNOWLEDGMENTS
This work is supported in part by the National ScienceFoundation as part of the evaluation of improved learningfor the Physics Teacher Education Coalition, PHY-0108787.
APPENDIX
Original FCI problem 29—Spring 2006 An emptyoffice chair is at rest on a floor. Consider the followingforces:A. a downward force of gravity.B. an upward force exerted by the floor.C. a net downward force exerted by the air.Which of the forces is (are) acting on the office chair?
(a) A only(b) A and B(c) B and C(d) A, B, and C(e) None of the forces. (Since the chair is at rest, there
are no forces acting upon it.)
Example of transformed FCI problem 29—Spring2006 A car is at rest in your driveway. Consider thefollowing forces:A. a downward force of gravity.B. an upward force exerted by the driveway.C. a net downward force exerted by the air.Which of the forces is (are) acting on the car?
(1) A only(2) A and B(3) B and C(4) A, B, and C(5) None of the forces. (Since the car is at rest, there are
no forces acting upon it.)
Example of original FCI Problem 4—Fall 2006 Alarge truck collides head-on with a small compact car.During the collision(1) the truck exerts a greater amount of force on the car
than the car exerts on the truck.(2) the car exerts a greater amount of force on the truck
than the truck exerts on the car.(3) neither exerts a force on the other, the car gets
smashed simply because it gets in the way of the truck.(4) the truck exerts a force on the car but the car does not
exert a force on the truck.(5) the truck exerts the same amount of force on the car
as the car exerts on the truck.
Example of transformed FCI problem 4—Fall2006 A bulldozer collides head-on with a bicycle.During the collision
USING CLUSTER ANALYSIS TO IDENTIFY . . . PHYS. REV. ST PHYS. EDUC. RES. 8, 020112 (2012)
020112-17

(1) the bulldozer exerts a greater amount of force on thebicycle than the bicycle exerts on the bulldozer.
(2) the bicycle exerts a greater amount of force on thebulldozer than the bulldozer exerts on the bicycle.
(3) neither exerts a force on the other, the bicycle getssmashed simply because it gets in the way of the bulldozer.
(4) the bulldozer exerts a force on the bicyclebut the bicycle does not exert a force on thebulldozer.(5) the bulldozer exerts the same amount of force on the
bicycle as the bicycle exerts on the bulldozer.
[1] Richard R. Hake, Interactive-engagement versus tradi-
tional methods: A six-thousand-student survey of mechan-
ics test data for introductory physics courses, Am. J. Phys.
66, 64 (1998).[2] David Hestenes, Malcolm Wells, and Gregg Swackhamer,
Force concept inventory, Phys. Teach. 30, 141 (1992).[3] Ibrahim Abou Halloun and David Hestenes, The initial
knowledge state of college physics students, Am. J. Phys.
53, 1043 (1985).[4] Andrea A. diSessa, Knowledge in pieces, in
Constructivism in the Computer Age, edited by George
Forman and Peter B. Pufall (Erlbaum, Hillsdale, NJ,
1988).[5] Michelene T. H. Chi and James D. Slotta, The ontological
coherence of intuitive physics, Cogn. Instr. 10, 249
(1993).[6] Gail S. Gliner, College students’ organization of mathe-
matics word problems in relation to success in problem
solving, School Sci. Math. 89, 392 (1989).[7] Gail S. Gliner, College students’ organization of mathe-
matics word problems in terms of mathematical structure
vs. surface structure. School Sci. Math. 91, 105
(1991).[8] Michelene T. H. Chi, Paul J. Feltovich, and Robert Glaser,
Categorization and representation of physics problems by
experts and novices, Cogn. Sci. 5, 121 (1981).[9] Patrick B. Kohl and Noah D. Finkelstein, Patterns of
multiple representation use by experts and novices during
physics problem solving, Phys. Rev. ST Phys. Educ. Res.
4, 010111 (2008).[10] Elizabeth Engel Clough and Rosalind Driver, A study of
consistency in the use of students’ conceptual frameworks
across different task contexts, Sci. Educ. 70, 473 (1986).[11] David H. Palmer, Measuring contextual error in the
diagnosis of alternative conceptions in science, Issues
Educ. Res. 8, 65 (1998) [http://www.iier.org.au/iier8/
palmer.html].[12] Salomon F. Itza-Ortiz, Sanjay Rebello, and Dean Zollman,
Students’ models of Newton’s second law in mechanics
and electromagnetism, Eur. J. Phys. 25, 81 (2004).[13] David Palmer, The effect of context on students’ reasoning
about forces, Int. J. Sci. Educ. 19, 681 (1997).[14] M. Finegold and P. Gorsky, Students’ concepts of force as
applied to related physical systems: A search for consis-
tency, Int. J. Sci. Educ. 13, 97 (1991).[15] Xiufeng Liu and Dan MacIsaac, An investigation of
factors affecting the degree of naive impetus theory ap-
plication, J. Sci. Educ. Technol. 14, 101 (2005).
[16] Nanjundiah Sadanand and Joseph Kess, Concepts in force
and motion, Phys. Teach. 28, 530 (1990).[17] John Stewart, Heather Griffin, and Gay Stewart, Context
sensitivity in the Force Concept Inventory, Phys. Rev. ST
Phys. Educ. Res. 3, 010102 (2007).[18] Lonnie J. Rennie and Lesley H. Parker, Placing physics
problems in real-life context: Students’ reactions and
performance, Aust. Sci. Teachers J. 42, 55 (1996)
[http://www.eric.ed.gov/ERICWebPortal/detail?accno=
EJ530089].[19] David H. Palmer, Investigating the relationship between
students’ multiple conceptions of action and reaction in
cases of static equilibrium, Res. Sci. Technol. Educ. 19,193 (2001).
[20] Lillian C. McDermott, Mark L. Rosenquist, and Emily H.
van Zee, Student difficulties in connecting graphs and
physics: Examples from kinematics, Am. J. Phys. 55,503 (1987).
[21] David E. Meltzer, Relation between students’ problem-
solving performance and representational format, Am. J.
Phys. 73, 463 (2005).[22] Patrick B. Kohl and Noah D. Finkelstein, Student repre-
sentational competence and self-assessment when solving
physics problems, Phys. Rev. ST Phys. Educ. Res. 1,010104 (2005).
[23] Patrick B. Kohl and Noah D. Finkelstein, Effects of
representation on students solving physics problems: A
fine-grained characterization, Phys. Rev. ST Phys. Educ.
Res. 2, 010106 (2006).[24] Antti Savinainen, Pasi Nieminen, Jouni Viiri, Jukka
Korkea-aho, and Aku Talikka, FCI-based multiple choice
test for investigating students’ representational coherence,
AIP Conf. Proc. 951, 176 (2007).[25] Pasi Nieminen, Antti Savinainen, and Jouni Viiri, Force
Concept Inventory-based multiple-choice test for investi-
gating students representational consistency. Phys. Rev.
ST Phys. Educ. Res. 6, 020109 (2010).[26] Kenneth R. Koedinger and Mitchell J. Nathan, The
real story behind story problems: Effects of representa-
tions on quantitative reasoning, J. Learn. Sci. 13, 129
(2004).[27] Robert J. Dufresne, William J. Gerace, and William J.
Leonard, Solving physics problems with multiple repre-
sentations, Phys. Teach. 35, 270 (1997).[28] Patrick B. Kohl and Noah D. Finkelstein, Effect of instruc-
tional environment on physics students representational
skills, Phys. Rev. ST Phys. Educ. Res. 2, 010102
(2006).
STEWART et al. PHYS. REV. ST PHYS. EDUC. RES. 8, 020112 (2012)
020112-18
[29] Gita Taasoobshirazi and Martha Carr, A review and cri-tique of context-based physics instruction and assessment,Educ. Res. Rev. 3, 155 (2008).
[30] Patricia Heller and Mark Hollabaugh, Teaching problemsolving through cooperative grouping. Part 2: Designingproblems and structuring groups, Am. J. Phys. 60, 637(1992).
[31] Shih-Yin Lin and Chandralekha Singh, Using isomorphicproblems to learn introductory physics, Phys. Rev. STPhys. Educ. Res. 7, 020104 (2011).
[32] Chandralekha Singh, Assessing student expertise in intro-ductory physics with isomorphic problems. I. Performanceon nonintuitive problem pair from introductory physics,Phys. Rev. ST Phys. Educ. Res. 4, 010104 (2008).
[33] Chandralekha Singh, Assessing student expertise in intro-ductory physics with isomorphic problems. II. Effect ofsome potential factors on problem solving and transfer,Phys. Rev. ST Phys. Educ. Res. 4, 010105 (2008).
[34] Lei Bao and Edward F. Redish, Model analysis:Representing and assessing the dynamics of student learn-ing, Phys. Rev. ST Phys. Educ. Res. 2, 010103 (2006).
[35] Lei Bao, Kirsten Hogg, and Dean Zollman, Model analy-sis of fine structures of student models: An example withNewton’s third law, Am. J. Phys. 70, 766 (2002).
[36] E. Mazur, Peer Instruction (Prentice-Hall, EnglewoodCliffs, NJ, 1997).
[37] Lei Bao, Dynamics of Student Modeling: A Theory,Algorithms, and Applications to Quantum Mechanics,Ph.D. thesis, University of Maryland, 1999.
[38] J. B. MacQueen, Some methods for classification andanalysis of multivariate observations, in Proceedings ofthe Fifth Berkeley Symposium on Mathematical Statisticsand Probability, edited by L.M. Le Cam and J. Neyman(University of California Press, Berkeley, CA, 1967),pp. 281–297.
[39] Ibrahim Abou Halloun and David Hestenes, Commonsense concepts about motion, Am. J. Phys. 53, 1056(1985).
[40] Rebecca Rosenblatt and Andrew F. Heckler, Systematicstudy of student understanding of the relationships be-tween the directions of force, velocity, and acceleration inone dimension, Phys. Rev. ST Phys. Educ. Res. 7, 020112(2011).
[41] Ronald K. Thornton and David R. Sokoloff, Accessingstudent learning of Newton’s laws: The Force and MotionConceptual Evaluation and the evaluation of active learn-ing laboratory and curricula, Am. J. Phys. 66, 338(1998).
USING CLUSTER ANALYSIS TO IDENTIFY . . . PHYS. REV. ST PHYS. EDUC. RES. 8, 020112 (2012)
020112-19