input-output based cluster method to identify traded … based cluster method to identify traded...
TRANSCRIPT

A-0
Input-Output Based Cluster Method to Identify
Traded Industry Clusters in the Cali-Baja Binational
Mega-Region
Sanchita Mukherjee, Ph.D.
San Diego Association of Governments (SANDAG)
Daniel E. Flyte
San Diego Association of Governments (SANDAG)
Alejandro Brugués, Ph.D.
El Colegio de la Frontera Norte (COLEF), Mexico
Acknowledgements
The authors would like to personally express their appreciation and gratitude for the
contributions and support from the UC San Diego Center for US-Mexican Studies; the University
of San Diego; the San Diego Regional EDC; the Cali-Baja Bi-National Mega-Region; the Office
of the Mexican Consul General in San Diego; the Office of the U.S. Consul General in Tijuana;
the Cali-Baja Advisory Committee; and the entire COLEF and SANDAG Technical Committee.
Abstract
In this paper, we describe the methodology and results of a traded industry cluster study of the
Cali-Baja Binational Mega-Region, using a multi-regional economic input-output (I-O) model.
Using I-O interactions among 189 industry sectors in the Mega-Region that encompasses San
Diego County, Imperial County and Baja California (Mexico), we examine cross-border
buyer-supplier linkages. We use industry-specific location quotients to identify those industries
with the strongest comparative advantage over other regions. These industries locally account
for more employment than the U.S.-Mexico national average, and are selected as cluster seeds.
Using a hierarchical distance-based crisp clustering technique, we identify “member industries”
with strong buyer and/or supplier linkages (via intermediate transactions) with a seed industry.
Collectively, these industries form a traded industry cluster. Identifying the most competitive and
productive cross-border industry clusters serves many important purposes for both
policymakers and planners. This study will help improve planning and decision-making efforts in
workforce development, economic development, and border-related infrastructure investments
as they pertain to traded industry clusters. We also discuss efforts underway to extend this
study by developing cross-border value added trade matrices, so as to establish a deeper
understanding of the drivers of wealth in the Mega-Region.

INPUT-OUTPUT BASED CLUSTER METHOD TO IDENTIFY TRADED INDUSTRY CLUSTERS IN THE CALI-BAJA BINATIONAL MEGA-REGION
1
1. Introduction
In the two-plus decades following the establishment of the North American Free Trade
Agreement (NAFTA), the US, Canada, and Mexico have benefited from tremendous economic
expansion and a proliferation of trade between member countries. NAFTA’s impact on border
regions and their regional economies has been particularly striking—transforming entire regions
and industries, contributing to the massive growth and evolution of the Mexican maquiladora
and U.S.-Canadian automobile industries, and highlighting the strategic role of cross-border
innovation and value chains. NAFTA’s impact on trade has also underscored the significance of
North American trade gateways and corridors, and the need for safe, efficient, and modern
border crossing infrastructure.
As a testament to this growth, between 1995 and 2010 US-Mexican trade through land ports of
entry grew from $71 billion to $255 billion (Wilson Center, 2013, p.30). Moreover, duty-free
passage of goods through North American borders has facilitated sophisticated supply and
value chains, allowing semi-finished (intermediate) goods to cross back and forth across
borders often many times before final consumption. According to Koopman, et al (2010), 40% of
the content of U.S. imports from Mexico is actually produced in the U.S. Barajas, et al (2014)
and Wilson Center (2011) provide more complete analyses, and quantify the magnitude of
NAFTA’s economic impact on border regions at a state and sub-state scale. In addition, they
identify those industries which contribute most to cross-border trade and economic interaction at
major trade gateways.
In this study we identify traded industry clusters of the Cali-Baja Binational Mega-Region —
home to over 6.5 million people and 2.5 million jobs in 2008. Encompassing San Diego County
(California), Imperial County (California), and the State of Baja California (Mexico), the Cali-Baja
Mega-Region is served by three international airports, two commercial seaports, and three
commercial land ports of entry. It is also home to the San Ysidro port of entry—the busiest land
border crossing in the Western Hemisphere1.
The Cali-Baja Mega-Region initiative was developed as part of a broad economic development
coalition between the San Diego Regional Economic Development Corporation (EDC), the
Imperial Valley EDC, and a consortium of Baja California partners, including the Tijuana EDC.
Cali-Baja aims to promote the region as a globally competitive center for research and
1 See GSA, http://www.gsa.gov/portal/category/105703

INPUT-OUTPUT BASED CLUSTER METHOD TO IDENTIFY TRADED INDUSTRY CLUSTERS IN THE CALI-BAJA BINATIONAL MEGA-REGION
2
development, advanced manufacturing, and a rich diversity of services, with strong accessibility
to global markets.
The cluster analysis was performed along with a binational research team that includes
SANDAG—the San Diego region’s Metropolitan Planning Organization; Mexico’s El Colegio de
la Frontera Norte (COLEF); the UC San Diego Center for U.S. Mexican Studies; the San Diego
Regional EDC; the University of San Diego; and Cali-Baja Mega-Region.
For this study, we define traded industry clusters as groups of interrelated, export-oriented
industries that bring wealth to a region. Building on previous cluster studies performed by
SANDAG (2012 and 2008), and following a similar approach to Porter’s Diamond of National
Advantage (1990 and 2000), we focus on identifying basic sectors that serve as regional drivers
of economic activity. These industries have strong location quotients (LQs), and their exports
generally represent a substantial share of their total production. Using an economic input-output
(I-O) model, we then analyze the intermediate transactions matrix for these industries, which
serve as seeds for the cluster process. We perform a hierarchical distance based crisp cluster
analysis on these industries, with intermediate purchases and sales coefficient magnitudes
serving as the basis for cluster membership.
The Cali-Baja clusters technical team advocates intermediate transactions analysis as a strong
method for cluster development in the Mega-Region context due to its focus on value chains
and its insight into the strategic drivers of cross-border interaction under NAFTA. Furthermore, it
provides a better understanding of the industries most affected by the friction and costs
associated with border crossing delays. Understanding cross-border economic interactions and
the cooperative relationships between industries on either side of the border is important for
carrying out a multitude of planning activities and policy making. The intent is to help identify
common needs for improved border crossing infrastructure and investments in workforce
development and other fixed capital.
The remainder of this paper describes the data sources and types of data used in this study, as
well as challenges in developing a consistent and reliable binational data set at sub-national
geographic scale. It presents the methodology and work completed as the first of two phases in
studying Cali-Baja Mega-Region clusters. A discussion of future work underway is provided,
describing the disaggregation of commodity trade flows through ports of entry, which aims to
improve the study’s findings.

INPUT-OUTPUT BASED CLUSTER METHOD TO IDENTIFY TRADED INDUSTRY CLUSTERS IN THE CALI-BAJA BINATIONAL MEGA-REGION
3
Based on 2008 data, our findings suggest that there are 15 traded industry clusters in San
Diego County and 12 in Baja California. Imperial County has one industry cluster, Agriculture
and animal production. We see a mix of manufacturing and non-manufacturing industry clusters
in San Diego. These 15 clusters in San Diego County accounted for 1.5 million jobs and $238bn
of output in 2008. It is also interesting that ten out of the 12 industry clusters identified in Baja
California are manufacturing related and the non-manufacturing clusters are the least
productive. These 12 industry clusters together accounted for close to a million jobs and $53bn
of output in Baja California.
Results from this first phase of the analysis provide indisputable evidence of the Cali-Baja
Mega-Region’s importance as a global hub for manufacturing, with particular strengths in
sectors like audio and video equipment manufacturing and medical device and supplies
manufacturing. This study helps to illustrate the strengths and diversity of the binational region’s
three sub economies: the combination of high-tech research and development capability in the
San Diego region, agricultural production in Imperial Valley, and diverse manufacturing in Baja
California.
The paper is organized as follows. Section 2 describes data sources; Section 3 explains the
methodology used for Phase I; Section 4 explains the results; and Section 5 describes the
conclusions drawn in Phase I and the future research agenda for Phase II.
2. Data Sources
To perform the analysis, we required a spatially and temporally consistent, disaggregate multi-
regional (binational), economic I-O model. In the U.S., a commercially available I-O model at the
county and sub-county level is produced on an annual basis from IMPLAN, Inc. However, for
Mexico, no commercial data source for economic I-O models exists. Therefore, one had to be
estimated using the most recently available (2009 vintage reflecting 2008 data) Censos
Económicos (Economic Census) from the Instituto Nacional de Estadística y Geografía (INEGI).
The Mexican Economic Census—like the U.S. Economic Census—is produced every five years,
and serves as the official measure of business and the economy. A 2008 Baja California I-O
model was developed by the research team at COLEF from the Mexican national I-O model,
and from previous surveys and estimates of state-level Regional Purchase Coefficient (RPC)

INPUT-OUTPUT BASED CLUSTER METHOD TO IDENTIFY TRADED INDUSTRY CLUSTERS IN THE CALI-BAJA BINATIONAL MEGA-REGION
4
shares. It was standardized to reflect 2008 PPP2 U.S. dollars in intermediate transactions
activity.
In addition to the I-O models, employment at a common North American Industrial Classification
System (NAICS) industry detail level was required, both locally and at a national level for each
country. Employment data is also only available from INEGI, and from the Economic Census. It
is reported at a state level at four-digit NAICS industry detail at the finest resolution. Therefore,
for this analysis, a common 2008 economic data set was developed.
For San Diego and Imperial Counties, the 2008 California Employment Development
Department’s (EDD) Quarterly Census of Employment and Wages (QCEW) was used as the
basis for employment at a four-digit NAICS level. For U.S. national employment, the Bureau of
Labor Statistics 2008 QCEW was used.
To reconcile the sector composition differences between San Diego and Imperial County’s
IMPLAN models and COLEF’s Baja California I-O model, a 189 sector scheme was devised that
maps each of the 2008 IMPLAN 509 sectors and each of the four-digit Baja California sectors to
a Cali-Baja industry sector. A similar approach was done to map employment in each four-digit
employment sector to a Cali-Baja sector.
In performing the data synthesis, we discovered small, yet nonetheless significant, differences
in reporting for certain employment sectors. Most importantly, we discovered INEGI’s detailed
reporting classification of employment in wholesale trade activities (NAICS 42XX) compared to
the QCEW’s aggregate reporting detail for wholesale. In addition, we discovered inconsistency
in reporting of agriculture employment (NAICS 11XX) at a four-digit detail level. To resolve
these differences, we resorted to choosing an aggregated wholesale trade activity and opting for
three-digit NAICS specificity for the agriculture sector—thereby aggregating the four-digit based
economic sectors each for agriculture and wholesale trade.
The resulting data set contains a 2008 representation of employment and LQ at each of 189
Cali-Baja sectors for San Diego County, Imperial County, and Baja California. Furthermore, a
structurally consistent 189 sector I-O model was produced for each economy, and served as the
driver for the cluster analysis.
2 PPP: Purchasing power parity

INPUT-OUTPUT BASED CLUSTER METHOD TO IDENTIFY TRADED INDUSTRY CLUSTERS IN THE CALI-BAJA BINATIONAL MEGA-REGION
5
3. Methodology for Phase I
In Phase I, we identify industry clusters for each of the three geographies – San Diego County,
Imperial County and Baja California. Clusters are different from traditional sector employment
because they focus on specialized industries as well as buyer and supplier linkages that are
unique to a region’s economy.
3.1. Location Quotient (LQ) tool to select “Seed” industry
We use employment concentrations to approximate an industry’s export strength and
consequently to identify the industry clusters. High employment concentration in an industry
would imply high production volume, suggesting these industries will be exporting most of its
products after satiating regional demand. Employment concentrations are determined by
calculating location quotients (LQ) for each 4-digit industry. A location quotient identifies the
industries in each region with a comparative advantage over other industries and serves as a
proxy calculation for identifying which industries export their goods and services out of the
region, bringing wealth back into it. By employing more workers than the national average the
industry is likely producing more goods and services than the region alone can consume; thus,
the industries export the surplus product out of the region. The LQs are calculated as follows:
a) LQ for San Diego (SD) County:
𝐿𝑄𝑆𝐷 = 𝑆𝑎𝑛 𝐷𝑖𝑒𝑔𝑜 𝑆𝑒𝑐𝑡𝑜𝑟 𝐸𝑚𝑝𝑙𝑜𝑦𝑚𝑒𝑛𝑡 𝑇𝑜𝑡𝑎𝑙 𝑆𝑎𝑛 𝐷𝑖𝑒𝑔𝑜 𝐸𝑚𝑝𝑙𝑜𝑦𝑚𝑒𝑛𝑡⁄
𝑈. 𝑆. 𝑆𝑒𝑐𝑡𝑜𝑟 𝐸𝑚𝑝𝑙𝑜𝑦𝑚𝑒𝑛𝑡 𝑇𝑜𝑡𝑎𝑙 𝑈. 𝑆. 𝐸𝑚𝑝𝑙𝑜𝑦𝑚𝑒𝑛𝑡⁄
b) LQ for Imperial (Imp) County:
𝐿𝑄𝐼𝑚𝑝 = 𝐼𝑚𝑝𝑒𝑟𝑖𝑎𝑙 𝐶𝑜𝑢𝑛𝑡𝑦 𝑆𝑒𝑐𝑡𝑜𝑟 𝐸𝑚𝑝𝑙𝑜𝑦𝑚𝑒𝑛𝑡 𝑇𝑜𝑡𝑎𝑙 𝐼𝑚𝑝𝑒𝑟𝑖𝑎𝑙 𝐶𝑜𝑢𝑛𝑡𝑦 𝐸𝑚𝑝𝑙𝑜𝑦𝑚𝑒𝑛𝑡⁄
𝑈. 𝑆. 𝑆𝑒𝑐𝑡𝑜𝑟 𝐸𝑚𝑝𝑙𝑜𝑦𝑚𝑒𝑛𝑡 𝑇𝑜𝑡𝑎𝑙 𝑈. 𝑆. 𝐸𝑚𝑝𝑙𝑜𝑦𝑚𝑒𝑛𝑡⁄
c) LQ for Baja California (BC):
𝐿𝑄𝐼𝑚𝑝 = 𝐵𝑎𝑗𝑎 𝐶𝑎𝑙𝑖𝑓𝑜𝑟𝑛𝑖𝑎 𝑆𝑒𝑐𝑡𝑜𝑟 𝐸𝑚𝑝𝑙𝑜𝑦𝑚𝑒𝑛𝑡 𝑇𝑜𝑡𝑎𝑙 𝐵𝑎𝑗𝑎 𝐶𝑎𝑙𝑖𝑓𝑜𝑟𝑛𝑖𝑎 𝐸𝑚𝑝𝑙𝑜𝑦𝑚𝑒𝑛𝑡⁄
𝑀𝑒𝑥𝑖𝑐𝑜 𝑆𝑒𝑐𝑡𝑜𝑟 𝐸𝑚𝑝𝑙𝑜𝑦𝑚𝑒𝑛𝑡 𝑇𝑜𝑡𝑎𝑙 𝑀𝑒𝑥𝑖𝑐𝑜 𝐸𝑚𝑝𝑙𝑜𝑦𝑚𝑒𝑛𝑡⁄
Industries exhibiting an LQ at least half standard deviation above the average log (LQ) across
all sectors are considered to be the “seed” industries. It should be noted that this threshold was
developed empirically, and appeared to present a good balance between high LQ and

INPUT-OUTPUT BASED CLUSTER METHOD TO IDENTIFY TRADED INDUSTRY CLUSTERS IN THE CALI-BAJA BINATIONAL MEGA-REGION
6
reasonable set size of seed industries. The log of LQ is used because of the strongly skewed
distribution of LQs in the region.
Using location quotients, we identify the seeds for each region (San Diego County, Imperial
County and Baja California) separately. These seed industries are considered to be the engines
of growth of the local economy. The idea is that as the seed industries develop, they demand for
new types of products and services. Existing firms can supply some of this new demand and
some of it can be imported. However, this often results in creation of new local firms. These
sectors create both competition and collaboration, spurring innovation, which eventually leads to
new companies producing new products and services. The end result is a higher influx of
capital, a rising economic profit, higher employment and growing wages.
Next, the seed industries are grouped by similar 3-digit NAICS where possible and reasonable
in order to consolidate and group related seeds. For example, in the case of San Diego seed
industries, 3341: Computer and peripheral equipment manufacturing, 3342: Communications
equipment manufacturing, 3343: Audio and video equipment manufacturing and 3345:
Electronic instrument manufacturing, are grouped by first three digits of their NAICS code (334)
into one seed industry, 334 Aggregate: “Electronic equipment manufacturing”. The Seed
industries for San Diego County, Imperial County, and Baja California are shown in Tables 1, 2,
and 3, respectively.
Column 1 in Table 1, 2 and 3 report the Cali-Baja code, which is essentially 4-digit NAICS code.
Column 2 reports the name of the seed. Column 3 reports employment in the country. For San
Diego County and Imperial County column 3 reports employment in the U.S. and for Baja
California, column 3 reports employment in Mexico. Column 4 reports employment in San Diego
County, Imperial County and Baja California. And column 5 reports industry specific location
quotient in San Diego County, Imperial County and Baja California.
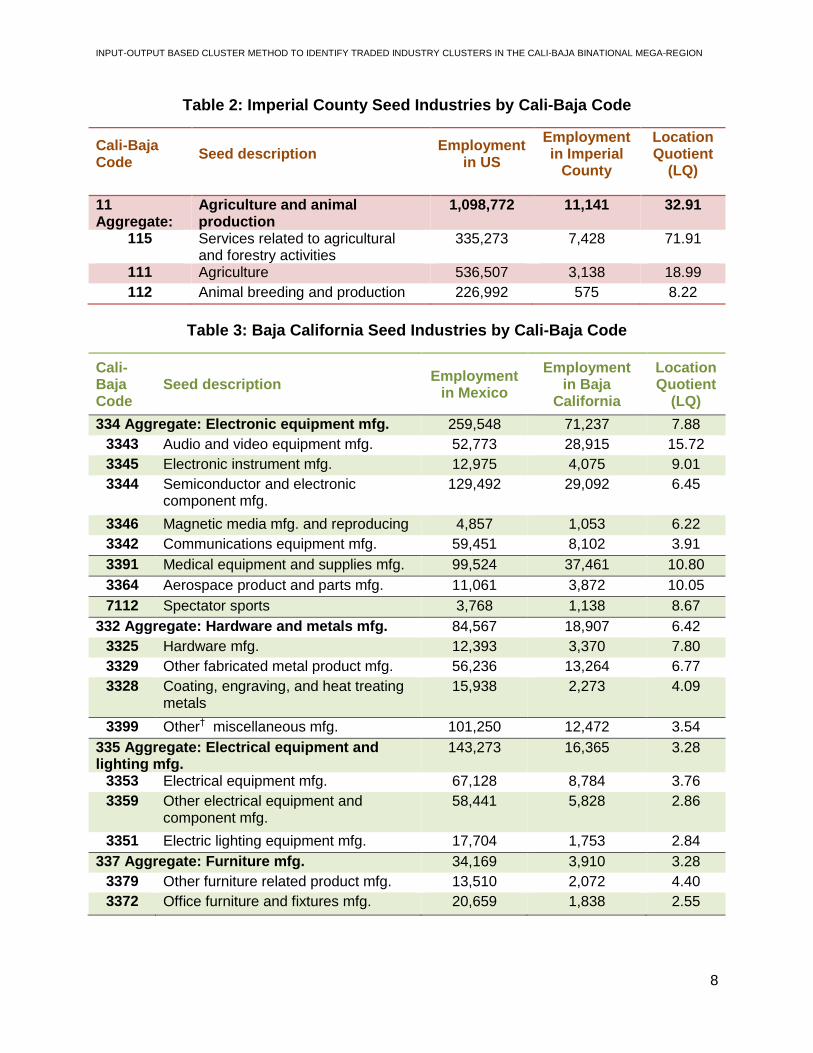
Both in San Diego and Baja California, 3343: Audio and video equipment manufacturing has the
highest location quotient indicating it has the highest employment concentration among the
seed industries. In Imperial County, 115: Services related to agricultural and forestry activities
have the largest location quotient. In San Diego, 3366: Ship and Boat Building is the second
largest industry in terms of LQ whereas in Baja California, 3391: Medical equipment and
supplies mfg. is the second largest.

INPUT-OUTPUT BASED CLUSTER METHOD TO IDENTIFY TRADED INDUSTRY CLUSTERS IN THE CALI-BAJA BINATIONAL MEGA-REGION
7
Table 1: San Diego County Seed Industries by Cali-Baja Code
Cali-Baja Code
Seed description Employment
in US
Employment in San Diego
County
Location Quotient
(LQ)
334 Aggregate: Electronic equipment mfg. 779,304 19,311 2.71
3343 Audio and video equipment mfg. 26637 2694 11.06
3342 Communications equipment mfg. 127056 4751 4.09
3345 Electronic instrument mfg. 442711 8711 2.15
3341 Computer and peripheral equipment mfg.
182900 3155 1.89
3366 Ship and boat building 155,942 7,790 5.46
5417 Scientific research and development services
619,111 24,972 4.41
7121 Museums, historical sites, zoos, and parks
130,703 3,509 2.94
7115 Independent artists, writers, and performers
49,223 1,108 2.46
517A Wired Telecommunications Carriers; Wireless Telecommunications Carriers (except Satellite); Satellite Telecommunications; All Other Telecommunications
1,019,148 18,982 2.04
3391 Medical equipment and supplies mfg.
308,372 5,554 1.97
3399 Other* miscellaneous mfg. 319,064 5,688 1.95
721A Hotels (except Casino Hotels) and Motels; Bed-and-Breakfast Inns; Recreational and Vacation Camps (except Campgrounds); Rooming and Boarding Houses
1,858,911 31,326 1.84
541A Architectural, Engineering, and Related Services; Management, Scientific, and Technical Consulting Services; Employment Services
2,449,306 40,368 1.80
3254 Pharmaceutical and medicine mfg. 289,586 4,656 1.76
5611 Office administrative services 404,079 6,464 1.75
531A Lessors of Real Estate; Offices of Real Estate Agents and Brokers; Activities Related to Real Estate
1,470,846 22,961 1.71
5112 Software publishers 261,652 4,055 1.69
3169 Other** leather product mfg. 11,784 181 1.68
*(Jewelry, silverware, hollowware, lapidary work, costume, sporting and athletic goods, game, toy, children’s vehicle, office supplies
(except paper), gasket, packing, sealing device, musical instrument, button, pin, mop, broom, brush, burial casket manufacturing).
**Other refers to Luggage, women's handbag, purse and personal leather good manufacturing.
INPUT-OUTPUT BASED CLUSTER METHOD TO IDENTIFY TRADED INDUSTRY CLUSTERS IN THE CALI-BAJA BINATIONAL MEGA-REGION
8
Table 2: Imperial County Seed Industries by Cali-Baja Code
Cali-Baja Code
Seed description Employment
in US
Employment in Imperial
County
Location Quotient
(LQ)
11 Aggregate:
Agriculture and animal production
1,098,772 11,141 32.91
115 Services related to agricultural and forestry activities
335,273 7,428 71.91
111 Agriculture 536,507 3,138 18.99
112 Animal breeding and production 226,992 575 8.22
Table 3: Baja California Seed Industries by Cali-Baja Code
Cali-Baja Code
Seed description Employment
in Mexico
Employment in Baja
California
Location Quotient
(LQ)
334 Aggregate: Electronic equipment mfg. 259,548 71,237 7.88
3343 Audio and video equipment mfg. 52,773 28,915 15.72
3345 Electronic instrument mfg. 12,975 4,075 9.01
3344 Semiconductor and electronic component mfg.
129,492 29,092 6.45
3346 Magnetic media mfg. and reproducing 4,857 1,053 6.22
3342 Communications equipment mfg. 59,451 8,102 3.91
3391 Medical equipment and supplies mfg. 99,524 37,461 10.80
3364 Aerospace product and parts mfg. 11,061 3,872 10.05
7112 Spectator sports 3,768 1,138 8.67
332 Aggregate: Hardware and metals mfg. 84,567 18,907 6.42
3325 Hardware mfg. 12,393 3,370 7.80
3329 Other fabricated metal product mfg. 56,236 13,264 6.77
3328 Coating, engraving, and heat treating metals
15,938 2,273 4.09
3399 Other† miscellaneous mfg. 101,250 12,472 3.54
335 Aggregate: Electrical equipment and lighting mfg.
143,273 16,365 3.28
3353 Electrical equipment mfg. 67,128 8,784 3.76
3359 Other electrical equipment and component mfg.
58,441 5,828 2.86
3351 Electric lighting equipment mfg. 17,704 1,753 2.84
337 Aggregate: Furniture mfg. 34,169 3,910 3.28
3379 Other furniture related product mfg. 13,510 2,072 4.40
3372 Office furniture and fixtures mfg. 20,659 1,838 2.55

INPUT-OUTPUT BASED CLUSTER METHOD TO IDENTIFY TRADED INDUSTRY CLUSTERS IN THE CALI-BAJA BINATIONAL MEGA-REGION
9
Table 3: Baja California Seed Industries by Cali-Baja Code (continued…)
Cali-Baja Code
Seed description Employment
in Mexico
Employment in Baja
California
Location Quotient
(LQ)
333 Aggregate: Machinery and equipment mfg.
15,697 1,651 3.02
3333 Commercial and service industry machinery
5,490 765 4.00
3336 Turbine and power transmission equipment mfg.
10,207 886 2.49
3261 Plastics product mfg. 195,697 19,180 2.81
3362 Motor vehicle body and trailer mfg. 20,853 1,751 2.41
5619 Other†† support services 32,215 2,575 2.29 †Jewelry, silverware, hollowware, lapidary work, costume, sporting and athletic goods, game, toy, children’s vehicle, office supplies
(except paper), gasket, packing, sealing device, musical instrument, button, pin, mop, broom, brush, burial casket manufacturing. †† Packaging and Labeling Services, Convention and Trade Show Organizers.
3.2 Identify strong buyer and supplier relationships – Industry Cluster
Once seed industries have been identified using LQ tool, next step is to identify the supporting
industries with strong buyer supplier relationship with the seed – together they (seed and the
supporting industries with strong buyer supplier relationship with the seed) are known as an
“industry cluster”. In order to quantify the relationships between businesses within a cluster, we
have used Input-Output (I-O) models for each region. These I-O models have transaction tables
showing the U.S. dollar value and direction of the buyer-supplier relationships. The monetary
values in the transactions table are used to determine the relative strengths of the relationships
between businesses in a cluster; strong relationships (high transaction values) representing a
possible cluster group.
To detect buyer supplier relationship, we use purchase magnitude and sales magnitude.
Purchase magnitude is the ratio of each of the buyer’s purchase transactions to that buyer’s
average purchases across all of its sectors. It is calculated for each cluster seed as follows:
𝑃𝑢𝑟𝑐ℎ𝑎𝑠𝑒 𝑀𝑎𝑔𝑛𝑖𝑡𝑢𝑑𝑒 = 𝐸𝑎𝑐ℎ 𝑜𝑓 𝑡ℎ𝑒 𝑏𝑢𝑦𝑒𝑟′𝑠 𝑝𝑢𝑟𝑐ℎ𝑎𝑠𝑒 𝑡𝑟𝑎𝑛𝑠𝑎𝑐𝑡𝑖𝑜𝑛𝑠
𝐵𝑢𝑦𝑒𝑟′𝑠 𝑎𝑣𝑒𝑟𝑎𝑔𝑒
Similarly, a sales magnitude is the ratio of each of the seller’s sales transactions to seller’s
average sales across all of its sectors. It is calculated for each cluster seed as follows:

INPUT-OUTPUT BASED CLUSTER METHOD TO IDENTIFY TRADED INDUSTRY CLUSTERS IN THE CALI-BAJA BINATIONAL MEGA-REGION
10
𝑆𝑎𝑙𝑒𝑠 𝑀𝑎𝑔𝑛𝑖𝑡𝑢𝑑𝑒 = 𝐸𝑎𝑐ℎ 𝑜𝑓 𝑡ℎ𝑒 𝑠𝑒𝑙𝑙𝑒𝑟′𝑠 𝑠𝑎𝑙𝑒𝑠 𝑡𝑟𝑎𝑛𝑠𝑎𝑐𝑡𝑖𝑜𝑛𝑠
𝑠𝑒𝑙𝑙𝑒𝑟′𝑠 𝑎𝑣𝑒𝑟𝑎𝑔𝑒
Strong buyer supplier relationship is established when the supporting industry’s purchase
magnitude and sales magnitude is at least one standard deviation above the average purchase
magnitude and sales magnitude across all sectors. This step is intended to find the biggest
partners of a seed industry. It is to be noted that the same supporting industry may appear
under different seed industries – the clusters we get following this technique can be referred to
as fuzzy clusters (where same supporting industry can be found under different clusters).
Next we refine the fuzzy clusters using distance based crisp clustering technique so that there is
no duplication. This means duplication of those supporting industries that are found in more
than one Seed is removed and the supporting industries are exclusively assigned to a single
Seed using distance clustering technique known as crisp clustering (where a supporting industry
can only be found under a particular cluster).
Distance clustering involves calculating the distance of location of a supporting industry in terms
of its purchase magnitude and sales share from the point of maximum purchase magnitude and
maximum sales share of a cluster. Sales share denotes percent of sales that a supporting
industry makes to the seed. In the sample, Sector 3161, Leather and hide tanning and finishing,
sells 20.4% of all of its sales to Seed 3169, Other3 leather product manufacturing. Purchase
magnitude and sales share are being considered as key variables here to take into account both
buyer’s and seller’s perspective. The supporting industry with the shortest distance is assigned
to the seed cluster. The seed industry along with its supporting members found through crisp
clustering appears at the core of the cluster. The rest of the supporting industries (of the same
cluster) that meet the purchase magnitude cut-off, but appear under other clusters are
mentioned in the outer circle. An example of Electronic equipment manufacturing cluster in San
Diego region is shown in Figure 1. The inner circle shows the sectors that comprise the cluster
core while the outer circle includes other sectors that support the core. For example, we have
12 industries at the core of Electronic equipment manufacturing clusters. These industries
belong exclusively to Electronic equipment manufacturing and don’t appear under any other
cluster. The other 11 industries appearing in the outer circle support Electronic equipment
manufacturing, however, they appear under other clusters as well. Apart from these 23
3 Other refers to Luggage, women's handbag, purse and personal leather good manufacturing.

INPUT-OUTPUT BASED CLUSTER METHOD TO IDENTIFY TRADED INDUSTRY CLUSTERS IN THE CALI-BAJA BINATIONAL MEGA-REGION
11
industries, there are hundreds of other industries that provide support to Electronic equipment
manufacturing, but on a smaller scale and thus have not been reported.
The industry clusters with cluster seed and the supporting industries are reported in Table 7
(San Diego County), Table 8 (Imperial County) and Table 9 (Baja California). Column 1 of Table
7, 8 and 9 reports seed industry’s Cali-Baja code, Column 2 reports seed name, Column 3 seed
LQ; Column 4 reports supporting industry’s Cali-Baja code, Column 5 supporting industry’s
name. We have separated industries between purchase side and sales side. Supporting
industries from whom seed industries purchase products are listed under Purchase side and
supporting industries to whom seed industries sell their (seed industries’) products are listed
under Sales side. If a supporting industry appears under purchase side, then Columns 6, 7 and
8 reports Purchase Magnitude, Sales Share and Transaction Amount between the seed industry
and the supporting industry. If a supporting industry appears under sales side, then Columns 6,
7 and 8 reports Sales Magnitude, Purchase Share and Transaction Amount between the seed
industry and the supporting industry. The seed industry and its supporting industries together
create an industry cluster.

INPUT-OUTPUT BASED CLUSTER METHOD TO IDENTIFY TRADED INDUSTRY CLUSTERS IN THE CALI-BAJA BINATIONAL MEGA-REGION
12
Core of Electronic equipment
manufacturing
Computer systems design and related services
Semiconductor and electronic component mfg.
Alumina and aluminum production
Boiler, tank, and shipping container mfg.
Other fabricated metal product manufacturing
Motor vehicle body and trailer manufacturing
Aerospace product and parts manufacturing
Motor vehicle manufacturing
Architectural and structural
metals mfg.
Beverage manufacturing
Coating, engraving, and heat treating
metals
Electric lighting equipment
manufacturing
Office furniture and fixtures
manufacturing Other furniture related product manufacturing
Investigation and security
services
Automotive repair and
maintenance
Electronic equipment repair and
maintenance
Management of Companies and
Enterprises
Wholesale Trade
Communications equipment manufacturing
Computer and peripheral equipment mfg.
Audio and video equipment manufacturing
Electronic instrument manufacturing
Figure 1: Electronic equipment manufacturing cluster in San Diego County

INPUT-OUTPUT BASED CLUSTER METHOD TO IDENTIFY TRADED INDUSTRY CLUSTERS IN THE CALI-BAJA BINATIONAL MEGA-REGION
13
4. Results
Applying the methodology discussed in Section 2, we find 15 core industry clusters in San
Diego County, one industry cluster in Imperial County and 12 in Baja California.
4.1 San Diego County Core Industry Clusters
The 15 industry clusters in San Diego County are listed in Table 4 along with cluster (comprising
of seed and the supporting industries) employment, cluster output (total production in USD
terms) and cluster productivity. Here, productivity is defined as output per worker. The industry
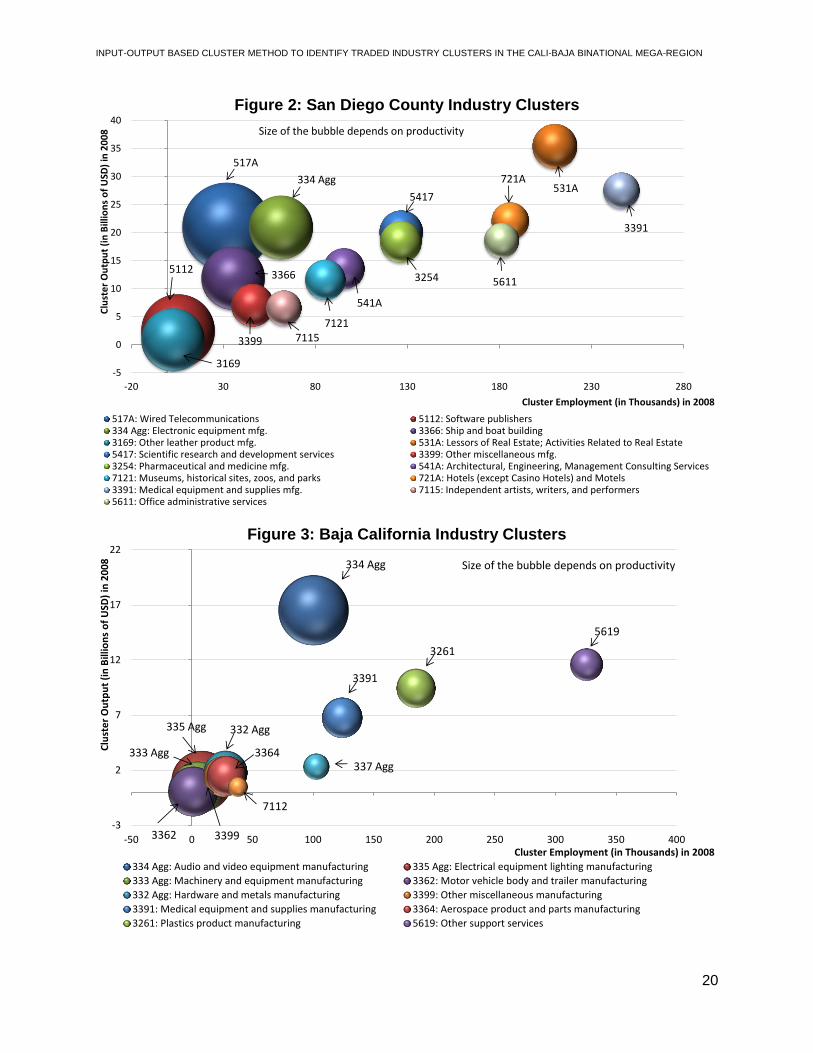
clusters are portrayed in Figure 2 as well. On the x-axis of Figure 2, we measure employment in
terms of numbers of people employed in thousands and on the y-axis we measure output
produced in billions of U.S. dollars. And the size of the bubbles depicts productivity. In San
Diego, 3391: Medical equipment and supplies manufacturing (mfg.) cluster employs the highest
number of people, 246,179 workers, but is not the most productive cluster. ‘Cluster 517A: Wired
Telecommunications Carriers; Wireless Telecommunications Carriers (except Satellite); Satellite
Telecommunications; All Other Telecommunications’ – named ‘Wired Telecommunications’ in
Figure 2 is the most productive cluster, indicating each person employed in the Wired
Telecommunications cluster is producing more than any other cluster in San Diego County.
517A is closely followed by 5112: Software publishers and 334Agg: Electronic equipment
manufacturing.
531A: Lessors of Real Estate; Activities Related to Real Estate produces the maximum output in
value terms ($35,424,100,541), with a moderate productivity level. Here, it is to be noted that
some of these sectors, for example, 7115: Independent artists, writers, and performers and
5611: Office administrative services, are more labor intensive by nature and since we are not
accounting for total factor productivity that is productivity of both labor and capital (machinery
etc), the labor intensive sectors will reflect lower productivity level. However, given the data
limitations, labor productivity is still the finest way to depict productivity level across clusters and
would help us identify the clusters with high and low productivity.
4.2 Imperial County Core Industry Clusters
Imperial County has one industry cluster, Agriculture and animal production with an employment
of 25,038 and output $3,910,127,242 with productivity $156,170 per worker (Table 5).

INPUT-OUTPUT BASED CLUSTER METHOD TO IDENTIFY TRADED INDUSTRY CLUSTERS IN THE CALI-BAJA BINATIONAL MEGA-REGION
14
4.3 Baja California Core Industry Clusters
Baja California has 12 industry clusters and they are reported in Table 6 along with their
respective cluster employment, cluster output and cluster productivity. These clusters are
portrayed in Figure 3 as well. Similar to Figure 2, on the x-axis of Figure 3, we measure
employment in thousands and on the y-axis we measure output produced in billions of U.S.
dollars. And the size of the bubbles depicts productivity – output per worker.
334 Agg: Audio and video equipment manufacturing is the most productive sector in Baja
California, followed by 335 Agg: Electrical equipment lighting manufacturing and 333 Agg:
Machinery and equipment manufacturing. However, the largest employer is 5619: Other support
services. Here ‘Others’ denote ‘Packaging and Labeling Services, Convention and Trade Show
Organizers’. 334 Agg: Audio and video equipment manufacturing produces maximum amount
of output in value terms (USD bn).
4.4 Comparing Industry Clusters in San Diego County and Baja California
It is very interesting that all of the industry clusters in Baja California are manufacturing sectors
other than the least productive ones, ‘Other support services’ and ‘Spectator sports’. Whereas in
San Diego County we see a mix of manufacturing and non-manufacturing industries – Wired
Telecommunications, Software publishers, Electronic equipment manufacturing, Ship and boat
building, Leather product manufacturing, Real estate activities, Scientific research and
development services, Museums, historical sites, zoos, and parks, Hotels (except Casino
Hotels) and Motels, Medical equipment and supplies manufacturing, Independent artists,
writers, and performers etc.
The productivity level is relatively low in Baja California compared to San Diego County. For
example, the most productive sector in San Diego County produces output $659,203 per
person, whereas the most productive cluster in Baja California produces only $164,543 per
person. If we compare the same industry cluster, ‘334 Agg: Electronic equipment
manufacturing’ across San Diego County and Baja California, we find that it’s productivity level
in San Diego is $340,882 per worker, which is a little more than double of its productivity in
Baja California ($164,543 per worker). One reason behind that could be low labor cost in Baja
California. Due to relatively low wage rate in Baja California compared to San Diego County,
employers in Baja California employ more laborers than machinery. This could result in low
productivity in Baja California compared to San Diego. However, if we compare these two

INPUT-OUTPUT BASED CLUSTER METHOD TO IDENTIFY TRADED INDUSTRY CLUSTERS IN THE CALI-BAJA BINATIONAL MEGA-REGION
15
regions in terms of total production, San Diego produces $20bn worth of goods in ‘334 Agg’
while Baja California produces $16bn worth of goods. The difference in production is
significantly lower compared to productivity level. And by creating a cross-border industry
cluster, San Diego County would be able to leverage Baja California’s low labor cost reducing
the cost of production and Baja California would gain in terms of infrastructure, skill and better
production technique. This would also improve access to market as San Diego will then have
access to Baja California’s market demand and will not have to wait for import demand from
China and other countries that involve large transportation costs.
5. Conclusions and Future Research
This study is important as the effort to identify industry clusters in our Cali-Baja binational region
has not been accomplished before. Given the uniqueness and magnitude of the project, this
effort has evolved into different phases. This paper describes the initial phase (Phase 1) built
upon the methodology that SANDAG has used for several decades to identify industry clusters
in the San Diego region. This methodology begins with location quotient analysis to identify
economic drivers in the economy and then uses an input-output model to identify buyer and
supplier relationships to define the industry clusters.
In this paper, using three separate I-O models based on 4-digit NAICS code (year 2008), we
have established 15 industry clusters for San Diego County, one industry cluster for Imperial
County and 12 industry clusters for Baja California. Industry clusters are groups of interrelated,
export-oriented industries that bring new money into the region. Clusters are different from
traditional sector employment because they focus on specialized industries as well as buyer and
supplier linkages that are unique to a region’s economy. Viewing the regional economy through
the perspective of clusters is important when describing the fast-paced, international economy
of today.
We see a mix of manufacturing and non-manufacturing industry clusters in San Diego, whereas
in Baja California, ten out of 12 industry clusters are manufacturing units, and they are the most
productive clusters in terms of output per worker.
In San Diego, industry cluster ‘531A: Lessors of Real Estate; Activities Related to Real Estate’
produces the maximum amount of output ($35,424,100,541), industry cluster ‘3391: Medical
equipment and supplies mfg.’ generates the largest employment (246,179 persons). However,
the most productive sector in terms of output per person is ‘517A: Wired Telecommunications

INPUT-OUTPUT BASED CLUSTER METHOD TO IDENTIFY TRADED INDUSTRY CLUSTERS IN THE CALI-BAJA BINATIONAL MEGA-REGION
16
Carriers; Wireless Telecommunications Carriers (except Satellite); Satellite
Telecommunications; All Other Telecommunications’ generating $659,203 per person.
Imperial County has only one industry cluster: ‘11 Aggregate: Agriculture and animal production’
with an employment of 25,038, total production of $3,910,127,242, producing $156,170 per
worker.
In Baja California, industry cluster ‘334 Agg: Audio and video equipment manufacturing’
produces the maximum amount of output ($35,424,100,541), industry cluster ‘5619: Other4
support services.’ generates the largest employment (246,179 persons) in the state. However,
the most productive sector in terms of output per person is ‘334 Agg: Audio and video
equipment manufacturing’ producing $164,543 per person.
Although this study captures the regional industry clusters well, we still lack the understanding
of key industry clusters in our Cali-Baja bi-national region. It is a difficult task as we have only
three regional I-O models available, capturing regional buyer supplier linkages. To identify
binational industry clusters, we need to understand cross-border buyer supplier linkages and for
that we would have to incorporate cross-border trade data to our model. Unfortunately, the trade
data between San Diego County, Imperial County and Baja California are not easily available.
However, we have started an effort to create a cross-border trade matrix that will help us identify
the industry clusters in our Cali-Baja binational region using international trade data. This
technique has not been accomplished before – this will be the Phase II of our study.
In Phase II of our study, to identify the industry clusters in Cali-Baja Mega-Region, we are using
cross-border value added trade data. Why value added trade flow? In the production process,
each producer purchases inputs and then adds values to create the final product. However, all
official trade statistics are measured in gross terms, gross exports and gross imports, which
include values of both intermediate goods and final products. Official trade flows are therefore,
overstated because they “double-count” value of intermediate goods that cross international
borders more than once. To avoid this “double counting” and pin down each industry’s actual
contribution to cross-border trade, we want to focus on value added trade flow between San
Diego County, Imperial County and Baja California. We are closely following the paper by
Koopman, Powers, Wang and Wei (NBER 2010) to accomplish this goal.
4 Packaging and Labeling Services, Convention and Trade Show Organizers

INPUT-OUTPUT BASED CLUSTER METHOD TO IDENTIFY TRADED INDUSTRY CLUSTERS IN THE CALI-BAJA BINATIONAL MEGA-REGION
17
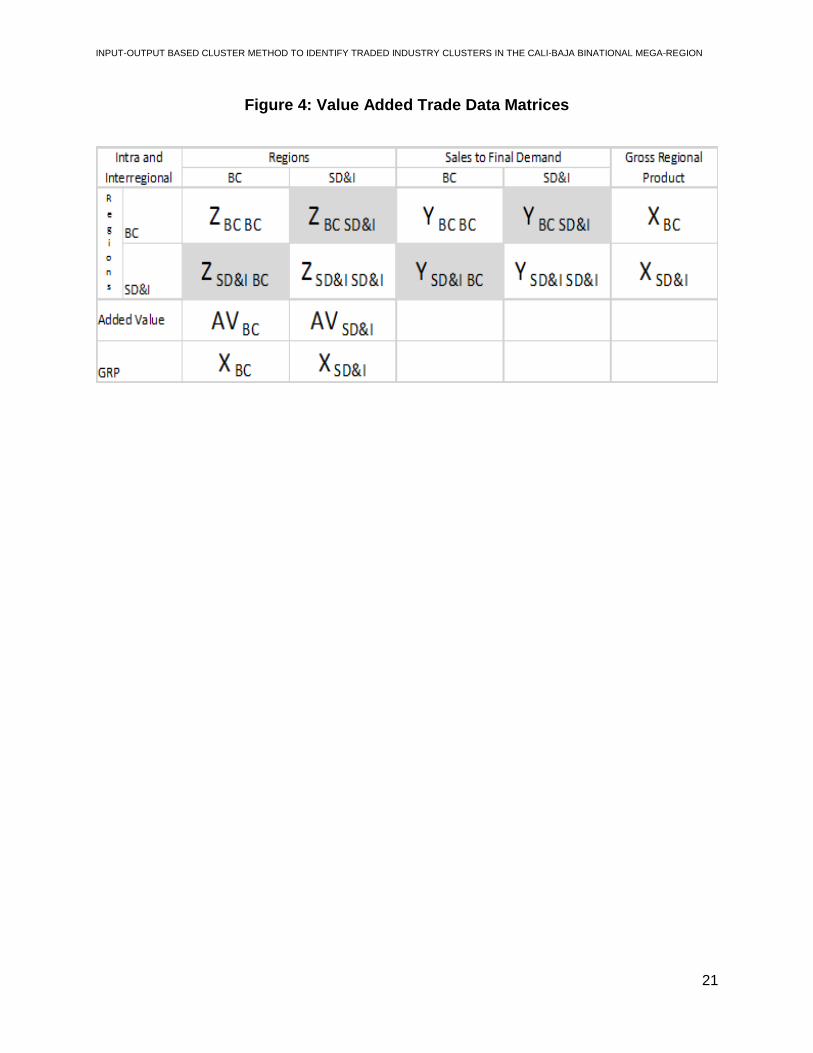
To identify the cross-border industry clusters we are creating value added trade matrices as
described in Figure 4. We combine San Diego and Imperial County in one single region (SD&I)
and calculate value added trade between SD&I and Baja California (BC). These four value
added trade matrices will give us BC’s value added exports to SD&I (which is equivalent of
SD&I’s imports from BC) and SD&I’s value added exports to BC (BC’s imports from SD&I). We
could not add the regional I-O models together to reflect Cali-Baja Mega-Region trade as it was
regional data. However, we can add the value added trade data as the exports from one region
are the imports of the other region. Once we establish this I-O model for cross-border value
added trade, we will repeat Phase I’s methodology (Section 3) to identify cross-border cluster
seeds and supporting industries to create traded industry clusters in Cali-Baja Mega-Region.
The identification of these industry clusters will detect the most competitive sectors in Cali-Baja
Mega-Region, improve cross-border economic linkages, and help policymakers assess the type
of infrastructure and other investments that could help the key industries.

INPUT-OUTPUT BASED CLUSTER METHOD TO IDENTIFY TRADED INDUSTRY CLUSTERS IN THE CALI-BAJA BINATIONAL MEGA-REGION
18
Table 4: San Diego County Industry Clusters: Employment, Output and
Productivity
Cali-Baja Code
Cluster Name Cluster
Employment
Cluster Output (in 2008 USD)
Cluster Productivity (Output/Employment)
517A Wired Telecommunications Carriers; Wireless Telecommunications Carriers (except Satellite); Satellite Telecommunications; All Other telecommunications
31,883 21,017,232,468 659,203
5112 Software publishers 5,437 2,463,060,443 453,032
334 Agg Electronic equipment manufacturing
61,378 20,922,667,512 340,882
3366 Ship and boat building 35,344 11,873,463,994 335,939
3169 Other** leather product manufacturing
2,680 892,685,049 333,135
531A Lessors of Real Estate; Offices of Real Estate Agents and Brokers; Activities Related to Real Estate
210,015 35,424,100,541 168,674
5417 Scientific research and development services
126,531 20,126,387,806 159,063
3399 Other* miscellaneous manufacturing
45,865 7,070,698,505 154,165
3254 Pharmaceutical and medicine manufacturing
126,387 18,391,186,584 145,515
541A Architectural, Engineering, and Related Services; Management, Scientific, and Technical Consulting Services
95,493 13,594,055,805 142,357
7121 Museums, historical sites, zoos, and parks
85,305 11,606,463,498 136,058
721A Hotels (except Casino Hotels) and Motels; Bed-and-Breakfast Inns; Recreational and Vacation Camps (except Campgrounds); Rooming and Boarding Houses
185,763 22,094,236,938 118,937
3391 Medical equipment and supplies manufacturing
246,179 27,535,102,229 111,850
7115 Independent artists, writers, and performers
62,814 6,594,307,328 104,982
5611 Office administrative services 181,082 18,626,914,070 102,864
*Jewelry, silverware, hollowware, lapidary work, costume, sporting and athletic goods, game, toy, children’s vehicle, office supplies
(except paper), gasket, packing, sealing device, musical instrument, button, pin, mop, broom, brush, burial casket manufacturing.
**Other refers to Luggage, women's handbag, purse and personal leather good manufacturing.

INPUT-OUTPUT BASED CLUSTER METHOD TO IDENTIFY TRADED INDUSTRY CLUSTERS IN THE CALI-BAJA BINATIONAL MEGA-REGION
19
Table 5: Imperial County Clusters: Employment, Output and Productivity
Cali-Baja Code
Cluster Cluster
Employment
Cluster Output (in 2008 USD)
Cluster Productivity (Output/Employment)
11 Aggregate
Agriculture and animal production
25,038 3,910,127,242 156,170
Table 6: Baja California Industry Clusters: Employment, Output and Productivity
Cali-Baja Code
Cluster Cluster Employment
Cluster Output (in 2008 USD)
Cluster Productivity (Output/Employment)
334 Agg
Audio and video equipment manufacturing
100,426 16,524,419,134 164,543
335 Agg
Electrical equipment lighting manufacturing
8,175 1,002,246,378 122,601
333 Agg
Machinery and equipment manufacturing
4,649 427,481,954 91,948
3362 Motor vehicle body and trailer manufacturing
891 73,908,432 82,966
332 Agg
Hardware and metals manufacturing
27,605 1,782,950,588 64,587
3399 Other† miscellaneous manufacturing
26,339 1,455,326,388 55,253
3391 Medical equipment and supplies manufacturing
123,895 6,775,508,308 54,687
3364 Aerospace product and parts manufacturing
28,535 1,505,666,114 52,766
3261 Plastics product manufacturing
184,838 9,448,281,572 51,117
5619 Other†† support services 325,574 11,603,049,809 35,639
337 Agg
Furniture manufacturing 102,548 2,335,075,570 22,770
7112 Spectator sports 37,807 497,624,657 13,162 †Jewelry, silverware, hollowware, lapidary work, costume, sporting and athletic goods, game, toy, children’s vehicle, office supplies
(except paper), gasket, packing, sealing device, musical instrument, button, pin, mop, broom, brush, burial casket manufacturing. †† Packaging and Labeling Services, Convention and Trade Show Organizers.
INPUT-OUTPUT BASED CLUSTER METHOD TO IDENTIFY TRADED INDUSTRY CLUSTERS IN THE CALI-BAJA BINATIONAL MEGA-REGION
20
Figure 2: San Diego County Industry Clusters
Figure 3: Baja California Industry Clusters
-5
0
5
10
15
20
25
30
35
40
-20 30 80 130 180 230 280
Clu
ste
r O
utp
ut
(in
Bill
ion
s o
f U
SD)
in 2
00
8
Cluster Employment (in Thousands) in 2008
517A: Wired Telecommunications 5112: Software publishers334 Agg: Electronic equipment mfg. 3366: Ship and boat building3169: Other leather product mfg. 531A: Lessors of Real Estate; Activities Related to Real Estate5417: Scientific research and development services 3399: Other miscellaneous mfg.3254: Pharmaceutical and medicine mfg. 541A: Architectural, Engineering, Management Consulting Services7121: Museums, historical sites, zoos, and parks 721A: Hotels (except Casino Hotels) and Motels3391: Medical equipment and supplies mfg. 7115: Independent artists, writers, and performers5611: Office administrative services
517A
5417
3254
334 Agg
3391
7115
3366
721A
7121
5611
3169
541A
531A
3399
5112
Size of the bubble depends on productivity
-3
2
7
12
17
22
-50 0 50 100 150 200 250 300 350 400
Clu
ste
r O
utp
ut
(in
Bill
ion
s o
f U
SD)
in 2
00
8
Cluster Employment (in Thousands) in 2008
334 Agg: Audio and video equipment manufacturing 335 Agg: Electrical equipment lighting manufacturing
333 Agg: Machinery and equipment manufacturing 3362: Motor vehicle body and trailer manufacturing
332 Agg: Hardware and metals manufacturing 3399: Other miscellaneous manufacturing
3391: Medical equipment and supplies manufacturing 3364: Aerospace product and parts manufacturing
3261: Plastics product manufacturing 5619: Other support services
334 Agg
5619
3261
3391
337 Agg
7112
332 Agg
3364
3399
335 Agg
333 Agg
3362
Size of the bubble depends on productivity
INPUT-OUTPUT BASED CLUSTER METHOD TO IDENTIFY TRADED INDUSTRY CLUSTERS IN THE CALI-BAJA BINATIONAL MEGA-REGION
21
Figure 4: Value Added Trade Data Matrices

INPUT-OUTPUT BASED CLUSTER METHOD TO IDENTIFY TRADED INDUSTRY CLUSTERS IN THE CALI-BAJA BINATIONAL MEGA-REGION
22
References
Barajas, I.A., Sisto, N.P., Gaytán E.A., Cantú, J.C, and López, B.H. (2014). Trade Flows Between the United States and Mexico: NAFTA and the Border Region, Journal of Urban Research, 10 | 2014 Koopman, R., Powers, W., Wang, Z., and Wei, S. (2010). Give Credit Where Credit is Due:
Tracing Value Added In Global Production Chains. National Bureau of Economic Research.
Working Paper No. 16426, Cambridge, MA.
Porter, M. E. (1990). The Competitive Advantage of Nations. Macmillan, London
Porter, M. E. (2000), Location, competition, and economic development: Local clusters in a
global economy. Economic Development Quarterly 14(1), 15-34.
SANDAG. (2008). Traded Industry Clusters in the San Diego Region. San Diego, CA.
SANDAG. (2012). Traded Industry Clusters in the San Diego Region. San Diego, CA.
UCSD Center for US-Mexican Studies. (2014). Jobs Without Borders: Employment, Industry
Concentrations, and Comparative Advantage in the Cali-Baja Region. San Diego, CA.
U.S. Department of Transportation, TransBorder Freight Data, Research and Innovative
Technology Administration, Bureau of Transportation Statistics, 2012.
Wilson Center. (2011). Working Together: Economic Ties between the United States and
Mexico. Washington, D.C.: Wilson, C.
Wilson Center. (2013). The State of the Border: A Comprehensive Analysis of the US-Mexico
Border. Washington, D.C.: Wilson, C., Lee, E.

A-0
Table 7: San Diego County Core Industry Clusters (Seed and Supporting Industries)
Seed CaliBaja
Code
Seed Name Seed
L.Q.
Supporting Industry
CaliBaja Code
Supporting Industry Name
3169 Other leather product manufacturing 1.68
Purchase Magnitude Sales Share Transaction
Amount in USD
3256 Soap, cleaning compound, and toiletry mfg. 8.55 0.50% 788,427
3133 Textile and fabric finishing mills 5.95 1.43% 548,285
3325 Hardware manufacturing 4.53 0.69% 417,580
3161 Leather and hide tanning and finishing 4.23 20.40% 390,399
Sales Magnitude Purchase share Transaction
Amount in USD
3149 Other textile product mills 5.38 2.00% 564,448
3162 Footwear manufacturing 0.29 1.00% 30,018
112A Other animal production 0.15 0.00% 15,844
3254 Pharmaceutical and medicine manufacturing 1.76
Purchase Magnitude Sales Share Transaction
Amount in USD
5511 Management of Companies and Enterprises 19.55 9.16% 239,376,129
Sales Magnitude Purchase share Transaction
Amount in USD
621A Offices of Physicians, Dentists, and all Other Miscellaneous Health
Practitioners
32.20 14.00% 191,347,707
622A General Medical, Surgical, Psychiatric and Substance Abuse, and
Specialty Hospitals
18.12 11.00% 107,695,174
621B Outpatient Care Centers; Medical and Diagnostic Laboratories;
Other Ambulatory Health Care Services
5.81 8.00% 34,498,541
6216 Home health care services 1.51 14.00% 8,959,402
623A Nursing Care Facilities; Residential Mental Retardation, Mental
Health and Substance Abuse Facilities; Community Care Facilities
for the Elderly; Other Residential Care Facilities
1.17 4.00% 6,943,879
3111 Animal food manufacturing 0.17 7.00% 984,783
1123 Poultry and Egg Production 0.07 2.00% 387,133
115A Support Activities for Animal Production 0.07 7.00% 402,778
334 Aggregate Electronic equipment manufacturing 2.71
3341 Computer and peripheral equipment mfg. 1.89 Purchase Magnitude Sales Share Transaction
Amount in USD
3342 Communications equipment manufacturing 4.09 3344 Semiconductor and electronic component mfg. 24.03 55.45% 982,768,693
3343 Audio and video equipment manufacturing 11.06 5415 Computer systems design and related services 4.49 25.90% 183,532,051
3345 Electronic instrument manufacturing 2.15 Sales Magnitude Purchase share Transaction
Amount in USD
3364 Aerospace product and parts manufacturing 9.65 6.71% 92,784,435
3329 Other fabricated metal product manufacturing 0.21 2.95% 2,012,394
3324 Boiler, tank, and shipping container mfg. 0.13 6.16% 1,286,894
3313 Alumina and aluminum production 0.10 11.05% 955,797
3362 Motor vehicle body and trailer manufacturing 0.03 4.81% 267,507
3361 Motor vehicle manufacturing 0.02 16.19% 219,795
Purchase (Seed as a buyer)
Sales (Seed as a supplier)
San Diego Seed Industries (Crisp Clusters)
(Luggage, women's handbag, purse and personal
leather good (except women's handbag and
purse) manufacturing)
Purchase (Seed as a buyer)
Sales (Seed as a supplier)
Purchase (Seed as a buyer)
Sales (Seed as a supplier)

INPUT-OUTPUT BASED CLUSTER METHOD TO IDENTIFY TRADED INDUSTRY CLUSTERS IN THE CALI-BAJA BINATIONAL MEGA-REGION
1
Table 7: San Diego County Core Industry Clusters (Seed and Supporting Industries) (continued…)
Seed CaliBaja
Code
Seed Name Seed
L.Q.
Supporting Industry
CaliBaja Code
Supporting Industry Name
3366 Ship and boat building 5.46
Purchase Magnitude Sales Share Transaction
Amount in USD
3336 Turbine and power transmission equipment mfg. 7.04 55.40% 39,302,127
5331 Lessors of nonfinancial intangible assets 5.16 3.78% 28,807,785
3261 Plastics product manufacturing 4.55 4.09% 25,384,475
3312 Steel product mfg. from purchased steel 4.19 5.54% 23,377,220
Sales Magnitude Purchase share Transaction
Amount in USD
1141 Fishing 8.78 45.31% 1,265,274
483A Deep Sea, Coastal, and Great Lakes Water Transportation; Inland
Water Transportation
7.23 21.85% 1,043,048
3353 Electrical equipment manufacturing 4.43 0.65% 638,727
3335 Metalworking machinery manufacturing 3.42 0.56% 493,592
3359 Other electrical equipment and component mfg. 2.75 0.19% 396,322
333A Other General Purpose Machinery Manufacturing 2.57 0.14% 371,067
48XA Scenic and Sightseeing Transportation, Support Activities for
Transportation
1.77 0.53% 255,101
3121 Beverage manufacturing 1.69 0.05% 244,053
3333 Commercial and service industry machinery 1.41 0.10% 203,694
8113 Commercial machinery repair and maintenance 0.78 0.14% 112,386
3352 Household appliance manufacturing 0.71 0.36% 102,876
3334 HVAC and commercial refrigeration equipment 0.33 0.13% 48,003
3314 Other nonferrous metal production 0.29 0.03% 41,629
3331 Ag., construction, and mining machinery mfg. 0.25 0.08% 35,650
3151 Apparel knitting mills 0.18 0.17% 26,439
3115 Dairy product manufacturing 0.16 0.03% 23,438
3332 Industrial machinery manufacturing 0.16 0.36% 23,193
3351 Electric lighting equipment manufacturing 0.14 0.04% 20,212
3322 Cutlery and handtool manufacturing 0.06 0.07% 8,132
3113 Sugar and confectionery product manufacturing 0.03 0.03% 4,590
3311 Iron and steel mills and ferroalloy mfg. 0.03 0.04% 4,254
3112 Grain and oilseed milling 0.01 0.02% 909
3391 Medical equipment and supplies manufacturing 1.97
Purchase Magnitude Sales Share Transaction
Amount in USD
4300 Wholesale Trade 20.50 2.01% 112,503,275
Sales Magnitude Purchase share Transaction
Amount in USD
3279 Other nonmetallic mineral products 0.50 2.62% 1,221,706
Sales (Seed as a supplier)
San Diego Seed Industries (Crisp Clusters)
Purchase (Seed as a buyer)
Sales (Seed as a supplier)
Purchase (Seed as a buyer)

INPUT-OUTPUT BASED CLUSTER METHOD TO IDENTIFY TRADED INDUSTRY CLUSTERS IN THE CALI-BAJA BINATIONAL MEGA-REGION
2
Table 7: San Diego County Core Industry Clusters (Seed and Supporting Industries) (continued…)
Seed CaliBaja
Code
Seed Name Seed
L.Q.
Supporting Industry
CaliBaja Code
Supporting Industry Name
3399 Other miscellaneous manufacturing 1.95
Purchase Magnitude Sales Share Transaction
Amount in USD
3251 Basic chemical manufacturing 13.67 3.72% 51,389,314
3327 Machine shops and threaded product mfg. 5.65 4.81% 21,225,183
Sales Magnitude Purchase share Transaction
Amount in USD
8114 Household goods repair and maintenance 5.91 5.27% 6,041,423
8122 Death care services 4.71 20.13% 4,808,797
3152 Cut and sew apparel manufacturing 2.78 2.03% 2,837,961
6111 Elementary and secondary schools 2.07 2.26% 2,117,857
3363 Motor vehicle parts manufacturing 1.05 0.66% 1,076,960
8121 Personal care services 0.99 0.58% 1,010,709
3141 Textile furnishings mills 0.60 5.19% 610,335
8123 Drycleaning and laundry services 0.44 0.94% 446,285
3272 Glass and glass product manufacturing 0.34 1.26% 350,630
2131 Support activities for mining 0.04 0.40% 40,395
1142 Hunting and Trapping 0.00 0.42% 404
5112 Software publishers 1.69
Purchase Magnitude Sales Share Transaction
Amount in USD
Sales Magnitude Purchase share Transaction
Amount in USD
3346 Magnetic media manufacturing and reproducing 2.29 27.31% 10,491,203
3369 Other transportation equipment manufacturing 0.63 4.52% 2,878,702
4821 Rail transportation 0.01 0.34% 59,877
517A 2.04
Purchase Magnitude Sales Share Transaction
Amount in USD
5419 Other professional and technical services 6.94 17.14% 293,657,335
Sales Magnitude Purchase share Transaction
Amount in USD
481A Scheduled Air Transportation; Nonscheduled Air Transportation 0.20 5.21% 5,846,019
Sales (Seed as a supplier)
Wired Telecommunications Carriers; Wireless
Telecommunications Carriers (except Satellite);
Satellite Telecommunications; All Other
Telecommunications
Purchase (Seed as a buyer)
Sales (Seed as a supplier)
San Diego Seed Industries (Crisp Clusters)
(Jewelry, silverware, hollowware, lapidary work,
costume, sporting and athletic goods, game, toy,
children’s vehicle, office supplies (except paper),
gasket, packing, sealing device, musical
instrument, button, pin, mop, broom, brush,
burial casket manufacturing)
Purchase (Seed as a buyer)
Sales (Seed as a supplier)
Purchase (Seed as a buyer)

INPUT-OUTPUT BASED CLUSTER METHOD TO IDENTIFY TRADED INDUSTRY CLUSTERS IN THE CALI-BAJA BINATIONAL MEGA-REGION
3
Table 7: San Diego County Core Industry Clusters (Seed and Supporting Industries) (continued…)
Seed CaliBaja
Code
Seed Name Seed
L.Q.
Supporting Industry
CaliBaja Code
Supporting Industry Name
531A 1.71
Purchase Magnitude Sales Share Transaction
Amount in USD
5617 Services to buildings and dwellings 8.95 17.03% 228,569,486
522A Nondepository Credit Intermediation; Activities Related to Credit
Intermediation
7.28 10.99% 186,110,948
2211 Power generation and supply 6.57 20.54% 167,941,567
562A Waste Collection; Waste Treatment and Disposal; Remediation and
Other Waste Management Services
6.57 44.19% 167,783,275
52XA Monetary Authorities-Central Bank; Depository Credit
Intermediation
6.38 7.32% 163,093,516
5411 Legal services 5.59 7.80% 142,817,002
Sales Magnitude Purchase share Transaction
Amount in USD
8131 Religious organizations 2.20 18.52% 89,355,883
1114 Greenhouse, Nursery, and Floriculture Production 0.28 7.88% 11,516,589
1119 Other Crop Farming 0.22 22.72% 8,958,286
1112 Vegetable and Melon Farming 0.17 20.78% 7,095,451
1113 Fruit and Tree Nut Farming 0.15 7.67% 6,122,856
1121 Cattle Ranching and Farming 0.02 8.77% 842,065
1111 Oilseed and Grain Farming 0.00 35.33% 91,749
541A Architectural, Engineering, and Related Services;
Management, Scientific, and Technical Consulting
Services
1.8
Purchase Magnitude Sales Share Transaction
Amount in USD
Sales Magnitude Purchase share Transaction
Amount in USD
2361 Residential Building Construction 6.68 8.29% 146,498,668
2221 Water, Sewage and Other Systems 0.03 17.53% 555,307
2122 Metal ore mining 0.00 3.76% 5,107
5417 Scientific research and development services 4.41
Purchase Magnitude Sales Share Transaction
Amount in USD
2362 Nonresidential Building Construction 9.09 10.89% 99,864,829
Sales Magnitude Purchase share Transaction
Amount in USD
611A Junior Colleges; Colleges, Universities, and Professional Schools 2.72 4.71% 13,789,460
3259 Other chemical product and preparation mfg. 1.61 8.64% 8,164,005
3255 Paint, coating, and adhesive manufacturing 1.59 5.80% 8,072,764
3253 Agricultural chemical manufacturing 0.34 5.38% 1,716,668
3252 Resin, rubber, and artificial fibers mfg. 0.23 3.63% 1,140,422
3114 Fruit and vegetable preserving and specialty 0.15 0.52% 779,467
2111 Oil and gas extraction 0.09 1.03% 436,824
3241 Petroleum and coal products manufacturing 0.07 2.02% 363,753
2123 Nonmetallic mineral mining and quarrying 0.06 1.76% 288,197
3159 Accessories and other apparel manufacturing 0.04 2.38% 219,364
3122 Tobacco manufacturing 0.01 1.97% 75,205
3274 Lime and gypsum product manufacturing 0.00 0.69% 13,734
Sales (Seed as a supplier)
Purchase (Seed as a buyer)
Sales (Seed as a supplier)
Purchase (Seed as a buyer)
Sales (Seed as a supplier)
San Diego Seed Industries (Crisp Clusters)
Lessors of Real Estate; Offices of Real Estate
Agents and Brokers; Activities Related to Real
Estate
Purchase (Seed as a buyer)

INPUT-OUTPUT BASED CLUSTER METHOD TO IDENTIFY TRADED INDUSTRY CLUSTERS IN THE CALI-BAJA BINATIONAL MEGA-REGION
4
Table 7: San Diego County Core Industry Clusters (Seed and Supporting Industries) (continued…)
Seed CaliBaja
Code
Seed Name Seed
L.Q.
Supporting Industry
CaliBaja Code
Supporting Industry Name
5611 Office administrative services 1.75
Purchase Magnitude Sales Share Transaction
Amount in USD
5613 Employment services 10.09 0.89% 16,364,942
5412 Accounting and bookkeeping services 8.72 1.76% 14,141,465
5619 Other support services 7.45 2.31% 12,082,751
5191 Other information services 6.88 0.59% 11,164,933
523A Investment Banking and Securities Dealing; Securities and
Commodity Exchanges; Trust, Fiduciary, and Custody Activities
4.05 0.29% 6,577,049
Sales Magnitude Purchase share Transaction
Amount in USD
5242 Insurance agencies and brokerages 5.96 3.17% 20,677,231
484A General Freight Trucking; Specialized Freight Trucking 1.76 2.99% 6,107,104
611B Business and Secretarial Schools; Other Technical and Trade
Schools; Exam Preparation and Tutoring; Educational Support
Services
1.36 1.55% 4,703,574
8112 Electronic equipment repair and maintenance 1.00 2.53% 3,458,121
6241 Individual and family services 0.91 1.96% 3,151,389
8111 Automotive repair and maintenance 0.90 0.76% 3,126,673
624A Community Food and Housing, and Emergency and Other Relief
Services; Vocational Rehabilitation Services
0.53 2.13% 1,827,168
5612 Facilities support services 0.42 5.52% 1,446,764
492A Couriers and Express Delivery Services; Local Messengers and Local
Delivery
0.42 2.45% 1,446,749
485A Urban Transit Systems; Interurban and Rural Bus Transportation;
Taxi and Limousine Service; School and Employee Bus
Transportation; Charter Bus Industry; Other Transit and Ground
Passenger Transportation
0.22 1.95% 752,077
486A Pipeline Transportation of Crude Oil; Pipeline Transportation of
Natural Gas; Other Pipeline Transportation
0.02 1.83% 80,036
7115 Independent artists, writers, and performers 2.46
Purchase Magnitude Sales Share Transaction
Amount in USD
711A Promoters of Performing Arts, Sports, and Similar Events; Agents
and Managers for Artists, Athletes, Entertainers, and Other Public
Figures
32.35 15.94% 8,476,672
7112 Spectator sports 13.50 2.56% 3,537,947
Sales Magnitude Purchase share Transaction
Amount in USD
8129 Other personal services 17.48 2.16% 13,148,984
713A Amusement Parks and Arcades; Gambling Industries; Other
Amusement and Recreation Industries
16.38 0.98% 12,322,571
7111 Performing arts companies 8.17 11.63% 6,145,615
5121 Motion picture and video industries 6.69 3.53% 5,030,193
5152 Cable and other subscription programming 1.85 5.09% 1,392,922
6244 Child day care services 1.25 0.95% 937,636
113A Timber Tract Operations, Forest Nurseries and Gathering of Forest
Products
0.01 0.85% 8,566
Purchase (Seed as a buyer)
Sales (Seed as a supplier)
Purchase (Seed as a buyer)
Sales (Seed as a supplier)
San Diego Seed Industries (Crisp Clusters)

INPUT-OUTPUT BASED CLUSTER METHOD TO IDENTIFY TRADED INDUSTRY CLUSTERS IN THE CALI-BAJA BINATIONAL MEGA-REGION
5
Table 7: San Diego County Core Industry Clusters (Seed and Supporting Industries)
Seed CaliBaja
Code
Seed Name Seed
L.Q.
Supporting Industry
CaliBaja Code
Supporting Industry Name
7121 Museums, historical sites, zoos, and parks 2.94
Purchase Magnitude Sales Share Transaction
Amount in USD
3231 Printing and related support activities 6.07 0.39% 2,948,148
Sales Magnitude Purchase share Transaction
Amount in USD
5324 Machinery and equipment rental and leasing 2.79 2.04% 9,098,739
813A Grantmaking Foundations; Other Social Advocacy Organizations 1.51 2.71% 4,939,178
5321 Automotive equipment rental and leasing 1.43 1.79% 4,664,849
5614 Business support services 1.32 2.32% 4,318,262
5182 Data processing, hosting and related services 1.06 2.81% 3,471,426
5616 Investigation and security services 0.97 2.66% 3,148,946
813B Civic and Social Organizations; Business, Professional, Labor,
Political, and Similar Organizations
0.89 0.86% 2,890,706
5414 Specialized design services 0.77 1.80% 2,517,911
5615 Travel arrangement and reservation services 0.77 2.14% 2,499,488
3118 Bakeries and tortilla manufacturing 0.69 1.21% 2,248,956
525A Insurance and Employee Benefit Funds; Other Investment Pools
and Funds
0.59 0.22% 1,934,487
3323 Architectural and structural metals mfg. 0.57 0.67% 1,850,832
3273 Cement and concrete product manufacturing 0.44 0.85% 1,423,364
532A Consumer Goods Rental, General Rental Centers 0.43 1.32% 1,414,327
5122 Sound recording industries 0.42 2.39% 1,356,864
3222 Converted paper product manufacturing 0.20 0.94% 662,973
3372 Office furniture and fixtures manufacturing 0.19 0.66% 621,527
3321 Forging and stamping 0.16 1.06% 508,779
3328 Coating, engraving, and heat treating metals 0.16 1.00% 535,346
3219 Other wood product manufacturing 0.13 1.04% 410,391
3119 Other food manufacturing 0.12 0.24% 383,521
3212 Plywood and engineered wood product mfg. 0.10 1.40% 309,729
3379 Other furniture related product manufacturing 0.10 0.94% 322,454
3262 Rubber product manufacturing 0.06 0.52% 198,945
3315 Foundries 0.03 0.48% 90,946
3271 Clay product and refractory manufacturing 0.02 0.46% 69,195
3132 Fabric mills 0.01 0.33% 32,682
3211 Sawmills and wood preservation 0.01 0.37% 16,792
3326 Spring and wire product manufacturing 0.01 0.71% 34,944
3116 Animal slaughtering and processing 0.00 0.45% 4,837
3117 Seafood product preparation and packaging 0.00 0.43% 1,141
3131 Fiber, yarn, and thread mills 0.00 0.16% 4,130
721A 1.84
Purchase Magnitude Sales Share Transaction
Amount in USD
722A Full-Service Restaurants; Limited-Service Eating Places; Special
Food Services; Drinking Places (Alcoholic Beverages)
12.68 3.81% 51,693,127
5418 Advertising, PR, and related services 5.72 3.18% 23,343,933
5151 Radio and television broadcasting 5.57 2.88% 22,725,826
4911 Postal service 4.96 4.06% 20,223,250
5111 Newspaper, book, and directory publishers 4.87 2.29% 19,872,258
2222 Natural Gas Distribution 4.81 2.81% 19,630,932
5241 Insurance carriers 3.97 1.47% 16,192,141
Sales Magnitude Purchase share Transaction
Amount in USD
Sales (Seed as a supplier)
Hotels (except Casino Hotels) and Motels; Bed-
and-Breakfast Inns; Recreational and Vacation
Camps (except Campgrounds); Rooming and
Boarding Houses
Purchase (Seed as a buyer)
Sales (Seed as a supplier)
San Diego Seed Industries (Crisp Clusters)
Purchase (Seed as a buyer)

INPUT-OUTPUT BASED CLUSTER METHOD TO IDENTIFY TRADED INDUSTRY CLUSTERS IN THE CALI-BAJA BINATIONAL MEGA-REGION
6
Table 8: Imperial County Core Industry Clusters (Seed and Supporting Industries)
Seed CaliBaja
Code
Seed Name Seed L.Q. Candidate
Member CaliBaja
Code
Candidate Member Name
11 Aggregate Agriculture and animal production 32.91
111 Agriculture 18.99
Purchase Magnitude Sales Share Transaction
Amount in USD
112 Animal breeding and production 8.22 4300 Wholesale Trade 8.08 34.44% 59,628,156
115 Services related to agricultural and
forestry activities
71.91 531A Lessors of Real Estate; Offices of Real Estate
Agents and Brokers; Activities Related to
Real Estate
5.45 53.75% 40,206,557
484A General Freight Trucking; Specialized Freight
Trucking
4.46 31.59% 32,905,281
2111 Oil and gas extraction 0.01 7.18% 64,516
Sales Magnitude Purchase share Transaction
Amount in USD
3149 Other textile product mills 5.38 2.00% 564,448
3162 Footwear manufacturing 0.29 1.00% 30,018
112A Other animal production 0.15 0.00% 15,844
Purchase (Seed as a buyer)
Sales (Seed as a supplier)
Imperial County Seed Industries (Crisp Clusters)

INPUT-OUTPUT BASED CLUSTER METHOD TO IDENTIFY TRADED INDUSTRY CLUSTERS IN THE CALI-BAJA BINATIONAL MEGA-REGION
7
Table 9: Baja California Core Industry Clusters (Seed and Supporting Industries)
Seed CaliBaja
Code
Seed Name Seed
L.Q.
Supporting Industry
CaliBaja Code
Supporting Industry Name
3261 Plastics product manufacturing 2.81
Purchase Magnitude Sales Share Transaction Amount
in USD
Sales Magnitude Purchase share Transaction Amount
in USD
3361 Motor vehicle manufacturing 24.43 14.00% 62,193,690
3121 Beverage manufacturing 11.66 13.00% 29,675,714
2361 Residential Building Construction 11.00 5.00% 27,999,424
3118 Bakeries and tortilla manufacturing 5.03 5.00% 12,806,376
3341 Computer and peripheral equipment mfg. 4.18 9.00% 10,642,021
332 Aggregate: Hardware and metals manufacturing 6.42
3325 Hardware manufacturing 7.80
Purchase Magnitude Sales Share Transaction Amount
in USD
3328 Coating, engraving, and heat treating metals 4.09 3312 Steel product mfg. from purchased steel 38.92 16.31% 38,106,155
3329 6.77 Sales Magnitude Purchase share Transaction Amount
in USD
3323 Architectural and structural metals mfg. 8.91 8.62% 2,588,922
333A Other General Purpose Machinery
Manufacturing
6.13 2.34% 1,779,255
333 Aggregate: Machinery and equipment manufacturing 3.02
3333 Commercial and service industry machinery 4.00
Purchase Magnitude Sales Share Transaction Amount
in USD
3336 Turbine and power transmission equipment
mfg.
2.49
Sales Magnitude Purchase share Transaction Amount
in USD
48XA Scenic and Sightseeing Transportation,
Support Activities for Transportation
6.71 1.53% 509,993
334 Aggregate: Audio and video equipment manufacturing 7.88
3342 Communications equipment manufacturing 3.91
Purchase Magnitude Sales Share Transaction Amount
in USD
3343 Audio and video equipment manufacturing 15.72 3222 Converted paper product manufacturing 10.73 26.18% 48,611,976
3344 Semiconductor and electronic component mfg. 6.45 3322 Cutlery and handtool manufacturing 4.14 63.13% 18,750,365
3345 Electronic instrument manufacturing 9.01 5411 Legal services 6.97 34.22% 31,578,064
3346 Magnetic media manufacturing and reproducing 6.22 5616 Investigation and security services 4.01 21.03% 18,159,938
Sales Magnitude Purchase share Transaction Amount
in USD
517A Wired Telecommunications Carriers;
Wireless Telecommunications Carriers
(except Satellite); Satellite
Telecommunications; All Other
Telecommunications
9.47 4.06% 6,430,942
Purchase (Seed as a buyer)
Sales (Seed as a supplier)
Purchase (Seed as a buyer)
Sales (Seed as a supplier)
Baja California Seed Industries (Crisp Clusters)
Purchase (Seed as a buyer)
Sales (Seed as a supplier)
Purchase (Seed as a buyer)
Other fabricated metal product manufacturing Sales (Seed as a supplier)

INPUT-OUTPUT BASED CLUSTER METHOD TO IDENTIFY TRADED INDUSTRY CLUSTERS IN THE CALI-BAJA BINATIONAL MEGA-REGION
8
Table 9: Baja California Core Industry Clusters (Seed and Supporting Industries) (continued…)
Seed CaliBaja
Code
Seed Name Seed
L.Q.
Supporting Industry
CaliBaja Code
Supporting Industry Name
335 Aggregate: Electrical equipment lighting manufacturing 3.28
3351 Electric lighting equipment manufacturing 2.84
Purchase Magnitude Sales Share Transaction Amount
in USD
3353 Electrical equipment manufacturing 3.76
3359 Other electrical equipment and component
mfg.
2.86 Sales Magnitude Purchase share Transaction Amount
in USD
3362 Motor vehicle body and trailer manufacturing 2.41
Purchase Magnitude Sales Share Transaction Amount
in USD
Sales Magnitude Purchase share Transaction Amount
in USD
3364 Aerospace product and parts manufacturing 10.05
Purchase Magnitude Sales Share Transaction Amount
in USD
484A General Freight Trucking; Specialized Freight
Trucking
8.65 1.92% 4,030,277
Sales Magnitude Purchase share Transaction Amount
in USD
337 Aggregate: Furniture manufacturing 3.28
3372 Office furniture and fixtures manufacturing 2.55
Purchase Magnitude Sales Share Transaction Amount
in USD
3379 Other furniture related product manufacturing 4.4
Sales Magnitude Purchase share Transaction Amount
in USD
2362 Nonresidential Building Construction 17.70 0.30% 1,586,677
3391 Medical equipment and supplies manufacturing 10.8
Purchase Magnitude Sales Share Transaction Amount
in USD
541A Architectural, Engineering, and Related
Services; Management, Scientific, and
Technical Consulting Services
12.81 11.04% 13,167,208
2211 Power generation and supply 7.07 1.09% 7,270,579
3272 Glass and glass product manufacturing 4.52 4.04% 4,651,152
5412 Accounting and bookkeeping services 4.41 1.11% 4,533,207
Sales Magnitude Purchase share Transaction Amount
in USD
621A Offices of Physicians, Dentists, and all Other
Miscellaneous Health Practitioners
26.24 3.50% 2,895,478
622A General Medical, Surgical, Psychiatric and
Substance Abuse, and Specialty Hospitals
17.90 2.40% 1,975,157
6111 Elementary and secondary schools 6.43 1.19% 709,646
Baja California Seed Industries (Crisp Clusters)
Sales (Seed as a supplier)
Purchase (Seed as a buyer)
Sales (Seed as a supplier)
Sales (Seed as a supplier)
Purchase (Seed as a buyer)
Sales (Seed as a supplier)
Purchase (Seed as a buyer)
Sales (Seed as a supplier)
Purchase (Seed as a buyer)
Purchase (Seed as a buyer)

INPUT-OUTPUT BASED CLUSTER METHOD TO IDENTIFY TRADED INDUSTRY CLUSTERS IN THE CALI-BAJA BINATIONAL MEGA-REGION
9
Table 9: Baja California Core Industry Clusters (Seed and Supporting Industries)
Seed CaliBaja
Code
Seed Name Seed
L.Q.
Supporting Industry
CaliBaja Code
Supporting Industry Name
3399 Other miscellaneous manufacturing 3.54
Purchase Magnitude Sales Share Transaction Amount
in USD
Sales Magnitude Purchase share Transaction Amount
in USD
721A Hotels (except Casino Hotels) and Motels;
Bed-and-Breakfast Inns; Recreational and
Vacation Camps (except Campgrounds);
Rooming and Boarding Houses
19.06 4.92% 3,247,486
8123 Drycleaning and laundry services 10.09 23.93% 1,719,511
5619 Other support services 2.29
Purchase Magnitude Sales Share Transaction Amount
in USD
4300 Wholesale Trade 8.79 0.13% 2,212,607
531A Lessors of Real Estate; Offices of Real Estate
Agents and Brokers; Activities Related to
Real Estate
6.68 0.34% 1,682,415
Sales Magnitude Purchase share Transaction Amount
in USD
7112 Spectator sports 8.67
Purchase Magnitude Sales Share Transaction Amount
in USD
5613 Employment services 9.54 0.99% 3,350,972
3231 Printing and related support activities 4.84 3.74% 1,699,670
Sales Magnitude Purchase share Transaction Amount
in USD
(Packaging and Labeling Services, Convention
and Trade Show Organizers, All Other Support
Services)
Purchase (Seed as a buyer)
Sales (Seed as a supplier)
Purchase (Seed as a buyer)
Sales (Seed as a supplier)
Baja California Seed Industries (Crisp Clusters)
(Jewelry, silverware, hollowware, lapidary
work, costume, sporting and athletic goods,
game, toy, children’s vehicle, office supplies
(except paper), gasket, packing, sealing device,
musical instrument, button, pin, mop, broom,
brush, burial casket manufacturing)
Purchase (Seed as a buyer)
Sales (Seed as a supplier)