using change management to improve crm user acceptance
TRANSCRIPT

jurjen nienhuis
U S I N G C H A N G E M A N A G E M E N T T O I M P R O V E C R MU S E R A C C E P TA N C E

U S I N G C H A N G E M A N A G E M E N T T O I M P R O V E C R M U S E RA C C E P TA N C E
jurjen nienhuis
In a Microsoft Dynamics CRM context at Avanade
School of Management and Governance & Electrical Engineering, Mathematics andComputer Science
University of Twente
February 2014 - July 2014

Jurjen Nienhuis: Using change management to improve CRM user accep-tance, In a Microsoft Dynamics CRM context at Avanade © February2014 - July 2014
supervisors:M.E. IacobM.J. van SinderenG. van WaardenburgG. Ramaker
locations:Enschede and Almere
time frame:February 2014 - July 2014

A B S T R A C T
A considerable amount of research has been conducted on user ac-ceptance of Information Systems (IS). In addition, new IS are bought Information Systems
or developed by organizations to improve efficiency, effectiveness,and employees’ job performance [26, 44]. However, to attain theseadvancements, it is critical for the IS to be accepted and used by em-ployees within the organization [81].
Within the user acceptance field, research has mainly focused onIS usage and its predictors. To improve usage, organizations providetrainings, support, and an e-learning environment, under the headingof Change Management (CM). Nevertheless, it is to be determined to Change
Managementwhat extent usage and its predictors can be improved by CM.This research identifies to what extent CM influences usage and its
predictors. Herefore, CM is operationalized as "the extent to whichan employee has the awareness, desire, knowledge, ability and re-inforcement to change and uphold behavior, attitude & skills". Thecontext of this research is Customer Relationship Management (CRM) Customer
RelationshipManagement
systems. CRM systems may require changes in the organization whenintroduced, such as the way of working.
The developed model is mainly based on the Unified Theory ofAcceptance and Use of Technology (UTAUT) model of Venkatesh et Unified Theory of
Acceptance and Useof Technology
al. (2003) [81], who researched IS usage and its predictors. Moreover,Habit (HT) and Task-Technology Fit (TTF) are added based on the
HabitTask-Technology Fit
work of Limayem et al. (2007) and Pai & Tu (2011) [57, 69]. The devel-oped model is empirically tested through a survey at two customersof Avanade and LinkedIn users. Habit was found to be the centralconstruct, predictable for 56% and, influenced by Effort Expectancy,Performance Expectancy, Task-Technology Fit and CM. No significantrelationship was determined between Behavioral Intention and UseBehavior, which contradicts previous studies. CM influenced Effort Ex-pectancy, Performance Expectancy, Social Influence, Facilitating Con-ditions, and Task-Technology Fit, as hypothesized. This entails thatCM does influence the predictors of Use Behavior (UB), via HT. Use Behavior
v

S A M E N VAT T I N G
Veel onderzoek is gedaan naar gebruikersacceptatie van informatiesys-temen. Daarnaast worden nieuwe informatiesystemen ontwikkeld ofgekocht door organisaties om de efficientie, effectiviteit en prestatiesvan de medewerkers te verhogen [26, 44]. Om deze voordelen te be-nutten moeten de medewerkers het nieuwe informatiesysteem echterwel accepteren en gebruiken [81].
Binnen het gebied van gebruikersacceptatie, heeft onderzoek zichtot nu toe voornamelijk gericht op de acceptatie, het gebruik van in-formatiesystemen en de voorspellende factoren van gebruik. Organ-isaties proberen de acceptatie, gebruik en voorspellende factoren teverhogen door het geven van bijvoorbeeld trainingen, het aanbiedenvan hulp en een online leersysteem. Deze activiteiten vallen onder denoemer van Change Management (CM). Het is echter niet duidelijk inChange
Management hoeverre gebruik en haar voorspellende factoren beïnvloed kunnenworden door CM.
Dit onderzoek bepaalt in hoeverre CM in staat is gebruik en haarvoorspellende factoren te beïnvloeden. Hiervoor is CM eerst geop-erationaliseerd als de mate waarin een medewerker het bewustzijnheeft, de wil heeft, de kennis heeft, de mogelijkheden heeft en ver-sterkt wordt om te veranderen en te blijven bij gedrag, houdingenen vaardigheden. De context van dit onderzoek is gebaseerd op Cus-tomer Relationship Management (CRM) systemen.Customer
RelationshipManagement
Het ontwikkelde model is voornamelijk gebaseerd op het UTAUT
model van Venkatesh et al. (2003) [81], welke onderzoek deden naargebruik van informatiesystemen en haar voorspellende factoren. Hetontwikkelde model is empirisch getest met een enquête bij twee klantenvan Avanade en via LinkedIn gebruikers. Gewoonte is een centralecategorie in het resulterende model gebleken, waarvan 56% van devariantie voorspeld kan worden door gebruiksgemak, prestatieverbe-teringen, de mate waarin de taak bij de technologie past en door CM.Geen significante relatie is gevonden tussen intentie om te gebruikenen gebruik zelf, wat noemenswaardig is. CM beïnvloedt het gebruiks-gemak, de prestatieverbetering, de sociale invloeden, de faciliterendeomstandigheden en de mate waarin de taak bij de technologie past,zoals gehypothetiseerd. Uit de resultaten valt op te maken dat CM devoorspellende factoren van gebruik beinvloedt.
vi

A C K N O W L E D G M E N T S
I would like to thank all my supervisors for guiding me throughthe graduation process. Especially the support of M.E. Iacob and M.J.van Sinderen helped me to write a good scientific thesis. I wouldlike to thank G. van Waardenburg for making companies and peopleenthusiastic about my research and convincing them to participate inthe survey. I would like to thank G. Ramaker for his quick and helpfulresponses.
Furthermore, I would like to thank the interns at Avanade for mak-ing my stay in Almere acceptable. We had quite some fun and enjoyedsome drinks the past six months.
Lastly, I would like to especially thank N. Tax for the effective andthorough feedback, mainly at the beginning of the project.
vii


C O N T E N T S
i introduction 1
1 relevance of change management for user ac-ceptance 2
2 research methodology 5
2.1 Approach 6
3 thesis overview 7
ii state of the art 9
4 change management 10
4.1 Literature study results 10
4.2 Approaches to change management 10
4.2.1 Planned change 10
4.2.2 Emergent change 11
4.3 Individual perspective on change 12
4.4 Resistance to change 13
4.4.1 Coping with resistance 14
4.5 Change management for CRM 15
4.5.1 Multi-layered CRM implementation approach 15
4.5.2 Avanade’s change management 16
4.5.3 Most suitable change management approach 17
5 user acceptance 19
5.1 Literature study results 19
5.2 User acceptance 19
5.3 UTAUT 20
5.3.1 Elaborating on UTAUT 22
5.4 User acceptance of CRM systems 22
5.4.1 Individual, organizational, and social character-istics 22
5.4.2 UTAUT and Task-Technology Fit 23
5.5 Conceptualizations of Use Behavior 24
iii development of the model 26
6 operationalization of change management from
end user’s perspective 27
6.1 Avanade’s end user related change management goals 27
6.2 Comparison of three change management methods 31
6.2.1 Awareness 31
6.2.2 Desire 32
6.2.3 Knowledge 32
6.2.4 Ability 32
6.2.5 Reinforcement 33
6.3 Change management approaches mapping 33
ix

x contents
7 determining user acceptance for crm 34
7.1 Not included constructs 34
7.2 Additional constructs 34
7.3 Conceptualizations of Use Behavior 35
7.4 Additional determinants of CRM acceptance 35
8 integrating change management and user accep-tance for crm 37
8.1 Additional determinants of CRM acceptance 37
8.2 Change management in the model 37
8.2.1 Change management’s influence on PerformanceExpectancy 37
8.2.2 Change management’s influence on Effort Ex-pectancy 38
8.2.3 Change management’s influence on Social In-fluence 38
8.2.4 Change management’s influence on FacilitatingConditions 38
8.2.5 Change management’s influence on Task-TechnologyFit 38
8.3 Habit taking over 39
9 empirical validation 41
9.1 Indicators 42
9.1.1 Task-Technology Fit 42
9.1.2 Habit 42
9.1.3 Measurement of Use Behavior 42
9.2 Assessment of reliability & validity 42
9.3 Survey 44
9.4 Cases 44
9.4.1 Company X 44
9.4.2 Company Y 45
9.4.3 LinkedIn 45
iv data analysis 47
10 results of the crm survey 48
10.1 Reliability and validity 48
10.1.1 Indicator reliability 48
10.1.2 Internal consistency reliability 49
10.1.3 Convergent validity 49
10.1.4 Discriminant validity 50
10.1.5 Multicollinearity 52
10.1.6 Common Method Variance 52
10.2 Responses 52
10.3 Resulting model 53
10.4 Hypothesis 56
11 discussion 57
11.1 Hypothesized, not significant 57

contents xi
11.1.1 Behavioral intention -> Use behavior 58
11.1.2 Performance expectancy -> Behavioral intention 58
11.1.3 Effort expectancy -> Behavioral intention 58
11.1.4 Task technology fit -> Behavioral intention 58
11.1.5 Habit -> Behavioral intention 59
11.1.6 Facilitating condition -> Use behavior 59
11.2 Not hypothesized, but significant 59
11.2.1 Task technology fit -> Performance expectancy 60
11.2.2 Performance expectancy -> Habit 60
11.2.3 Effort expectancy -> Habit 60
11.2.4 Experience -> Habit 60
11.2.5 Age -> Effort 60
11.2.6 Gender -> Facilitating conditions 60
11.2.7 Facilitating conditions -> Behavioral intention 60
11.3 Results discussion company X and company Y 61
11.4 Theoretical Contributions 61
11.5 Limitations and future research 61
11.6 Managerial Implications 62
12 conclusion 64
v appendix 66
a validated survey questions and answers 67
b resulting model only significant 71
bibliography 73

L I S T O F F I G U R E S
Figure 1 The structure of the thesis 7
Figure 2 Multi-layered CRM implementation approach,obtained from [34] 15
Figure 3 Avanade Change Engagement approach 17
Figure 4 Framework for change, developed by Burnes(2004) [17] 18
Figure 5 Theory of Reasoned Action, obtained from Kara-hanna et al. (1999) [48] 20
Figure 6 UTAUT, obtained from Venkatesh et al. (2003)[81] 21
Figure 7 CRM acceptance model by Avlonitis & Panagopou-los (2005) [4] 23
Figure 8 Resulting CRM acceptance model by Avlonitis& Panagopoulos (2005) [4] 23
Figure 9 Integrated model of UTAUT and TTF, obtainedfrom Pai & Tu (2011) [69] 24
Figure 10 Change management mapped from user’s per-spective 33
Figure 11 Part of Task-Technology Fit included in the modelof Pai & Tu (2011) [69] 35
Figure 12 The constructed model 40
Figure 13 The resulting model 55
Figure 14 Stripped research model, applicable for prac-tice 63
Figure 15 The resulting model, only significant relation-ships 71
L I S T O F TA B L E S
Table 1 Benefits of Customer Relationship Managementsystems, obtained from Chen & Chen (2004)[22] 3
Table 1 Benefits of Customer Relationship Managementsystems, obtained from Chen & Chen (2004)[22] 4
Table 2 Change management aligned with business re-sults, obtained from Hiatt (2006) [45] 13
xii

List of Tables xiii
Table 3 Avanade’s change method’s applicability to enduser 27
Table 4 Sources of questionnaire items 41
Table 5 Cronbach’s Alpha results of pilot 44
Table 6 Indicator reliability 48
Table 6 Indicator reliability 49
Table 7 Composite reliability and AVE 50
Table 8 Fornell-Larcker test for discriminant validity[35] 50
Table 9 Outer weights of Use Behavior 51
Table 10 PLS loadings and cross-loading 51
Table 10 PLS loadings and cross-loading 52
Table 11 Results per group and total 53
Table 12 Legend for Figure 13 53
Table 12 Legend for Figure 13 54
Table 13 Five-number summary of intention 57
Table 14 Five-number summary frequency of use 57
Table 15 Survey questions 67
Table 15 Survey questions 68
Table 15 Survey questions 69
Table 16 Survey answers 69
Table 16 Survey answers 70

A C R O N Y M S
AVE Average Variance Extracted
BI Behavioral Intention
CM Change Management
CMV Common Method Variance
CRM Customer Relationship Management
EE Effort Expectancy
FC Facilitating Conditions
FIS Foundations of Information Systems
HM Hedonic Motivation
HT Habit
IS Information Systems
ITIL Information Technology Infrastructure Library
PE Performance Expectancy
PLS Partial Least Squares
PV Price Value
ROI Return on Investment
SI Social Influence
TAM Technology Acceptance Model
TRA Theory of Reasoned Action
TTF Task-Technology Fit
UB Use Behavior
UTAUT Unified Theory of Acceptance and Use of Technology
VIF Variance Inflation Factor
xiv

Part I
I N T R O D U C T I O N

1R E L E VA N C E O F C H A N G E M A N A G E M E N T F O RU S E R A C C E P TA N C E
The lack of user acceptance has long been and still is a major barrierfor the success of new Information Systems (IS) [26, 41, 62, 68]. TheInformation Systems
goal of most organizationally focused IS is to improve efficiency, ef-fectiveness, and employees’ job performance [26, 44]. However, whenusers reject the IS, this goal will not be accomplish or the results willbecome insignificant [26]. Rejection of the IS may have several causes.One of these is senior management which is unwilling to be involvedin the process of change to the new IS, because they fear a hostileresponse [66].
Taking into account the importance of user acceptance, it is essen-tial to not only perceive IS implementation as an IS development pro-cess. IS implementation is also an organizational change process [55](as cited by [49]) and user acceptance can be addressed and improvedduring this process.
Many consulting companies offer services to support the organi-zational change process, under the heading of Change Management(CM). In an IS context, CM will help changing organizations to copeChange
Management with changing attitude, behavior and skills of users towards the newIS. Through CM, employees become aware of the need for change. Thisdecreases resistance to the IS and increases user acceptance.
An example of organizationally oriented IS are Customer Relation-ship Management (CRM) systems. CRM systems can be used in forCustomer
RelationshipManagement
example sales, service, and marketing [70]. As it is cheaper to keepan existing customer than to acquire a new one, organizations changefrom a product-focused strategy to a customer-focused strategy [34].Since CRM systems help the organization to manage relationshipswith changing customers’ needs [34], an increase of demand for CRM
systems is observed [22, 21, 87]. By analyzing and gathering up-to-date, rich information on all aspects of the customer, a more personalinteraction with the customer can be created [77, 11, 70, 34].
Understanding customers’ needs and offering value-added servicesare recognized as determining factors for success of companies [51].CRM helps with maintaining positive relationships, resulting in highercustomer loyalty and expanded customer lifetime value [51]. Table 1
lists some of the identified CRM system benefits [22].Exploiting the advantages of a CRM system requires user accep-
tance. As CRM systems are used organization-wide, CRM implementa-tion decisions are typically made on a strategic, management, level.This may drive resistance on operational, end users level, as it is
2

relevance of change management for user acceptance 3
obliged to use a new system without users having their say in thedecision process for a new IS. Organizations can try to increase useracceptance through CM. An example of a CM practice is to give train-ings to help employees in applying the new CRM system in their dailywork.
Unfortunately, the failure rates of CRM projects obtaining their busi-ness results are high [78, 63, 34]. This might indicate that the imple-mentation processes focuses too much on the development of the soft-ware without "an in-depth understanding of the issues of integratingculture, process, people, and technology within and across organiza-tional context" [34].
In the integration process of the IS with the organization, factorssuch as senior management support and sponsorship, providing enduser training, internally convincing people of the change, reconfig-uring business process and establishing rewarding systems are key[72]. This whole process of managing the change can be problematicand very time and resource consuming, but should lead to higher ac-ceptance [34]. The question is however to what extent CM contributesto user acceptance. To the best of the author’s knowledge, no datais available to quantify the relationship between CM and user accep-tance.
CM is often part of the CRM implementation process, but the failurerates of CRM systems are still too high. To improve this situation, thefocus of this thesis is on CM and resulting user acceptance in the con-text of CRM systems. Moreover, as the author is doing an internshipat the CRM department of Avanade Netherlands, the author is able todo a field study at the customers of Avanade.
The Avanade CRM department develops CRM products, based onMicrosoft Dynamics CRM. Depending on the customer’s wishes, timeand effort is put into CM. Some customers may also decide to managethe change themselves.
Table 1: Benefits of Customer Relationship Management systems, obtainedfrom Chen & Chen (2004) [22]
Tangible benefits Intangible benefits
Increased revenues and profitability Increased customer satisfaction
Quicker turnaround time Positive word-of-mouth
Reduced internal costs Improved customer service
Higher employee productivity Streamlined business process
Reduced marketing (e.g. direct mail-ing) costs
Closer contact management
Higher customer retention rates Increased depth and effectiveness ofcustomer

4 relevance of change management for user acceptance
Table 1: Benefits of Customer Relationship Management systems, obtainedfrom Chen & Chen (2004) [22]
Tangible benefits Intangible benefits
Protected marketing investment withmaximized
Acute targeting and profiling of cus-tomers
Better understanding/addressing ofcustomer

2R E S E A R C H M E T H O D O L O G Y
As mentioned in the previous chapter, this research focuses on CM
and user acceptance of CRM systems. The research should help tofurther increase the number of successful new IS, by increasing CRM
user acceptance.User acceptance can be increased by managing the change to the
new IS. However, managing the change can be hard, because many ofthe changes in organizations fail and do not give the financial benefitsas forecasted [6, 64, 52]. To address problems in the change process,the effects should be evaluated at the end users’ side, because the endusers are the ones who should accept the system and are one of thetargets in the organizational change process. The focus on end userswill help to determine what drives user acceptance and identify prob-lems. Monitoring the change process at the input side is less useful,as this does not say anything about the resulting users’ involvement.
The question remains, however, to what extent CM can influenceCRM user acceptance. Therefore, the main research question is:
To what extent does change management contribute to CRM useracceptance?
The main research question can be split in three sub-questions. Thefirst two research questions can be discussed in parallel while thethird integrates the first two.
First, a general overview of the CM field has to be obtained in termsof perspectives on CM. Based on these outcomes, CM will be definedfrom an end user’s perspective.
1. How can change management be operationalized from an end user’sperspective, in a CRM context?
Secondly, an overview of the user acceptance knowledge for CRM
is needed. This should give insight in user acceptance and its de-terminants. CM might influence these determinants to improve useracceptance.
2. What are the predictors of user acceptance of a CRM system?
Based on the outcomes of the two previous sub-questions, a modelwill be developed which combines the relationship of CM and useracceptance.
3. How can change management and user acceptance be integrated intoa single model?
5
6 research methodology
The developed model will be validated to answer the main researchquestion. This will be done with a survey, conducted at the end usersof CRM systems. The survey will give quantitative results, which isbest suited for studies which focus on individuals [8].
2.1 approach
To structure this research, the design science methodology of Hevneret al. (2004) will be used [44]. A model will be composed using litera-ture in the field of CM and user acceptance. In order to operationalizeCM from an end user’s perspective, a general overview of the CM
approaches is needed first. This overview is obtained by looking forCM theories and approaches in Scopus and Google Scholar, using thequery ("change management" theories approaches). In Google Scholarand Scopus, the first 20 results will be reviewed. Scopus will be sortedon number of citations. The results will be reviewed further if theydescribe fundamental approaches in CM. Using one-step forward andbackward citation, research will be widened to gain a basic under-standing of the academic works concerning CM.
To get an overview of CM for IS in general and CRM in particular,Scopus and Google Scholar will be consulted with the query ("changemanagement’ crm approach). The results will be reviewed if they con-tain a method for handling the change in an organization. A reviewof the methods used by practitioners will be done, by using the bookof Erskine (2013) [33]. The book has been provided by Avanade andis specialized in change for Information Technology Infrastructure Li-brary (ITIL), which is expected to have similarities with CM for IS. TheInformation
TechnologyInfrastructure
Library
Avanade approach to CM will be reviewed as well, to make the thesisapplicable to Avanade.
For user acceptance, the starting point is the literature provided atUniversity of Twente, during the course Foundations of InformationSystems (FIS). The selection of the literature for this course has beenFoundations of
Information Systems published by Moody, Iacob & Amrit (2010) [65], to find the core the-ories concerning IS. Many of these core theories have a considerableamount of overlap and are competing in the IS success and IS usagefield. Forward search will be done to find the latest developments inthe IS success/usage field. The studies should aim to further describeand understand user acceptance.
User acceptance for CRM will be researched using Scopus and GoogleScholar with the query (user acceptance crm). The papers will be se-lected when they are building on the non CRM specfic user accep-tance theories.
A survey will be conducted among the end users of Avanade’s CRM
systems, to evaluate the proposed model. A requirement of the par-ticipating companies is that the survey could take up to five minutes.

3T H E S I S O V E RV I E W
Part ii, state of the art, introduces change management and user ac-ceptance, based on the relevant theories and related work in the field.Part iii, development of the model, operationalizes Change Manage-ment and determines relevant user acceptance concepts for CRM, inorder to develop and test the model.Part iv, describes the results, discussion and conclusion of the result-ing model.
Figure 1: The structure of the thesis
7


Part II
S TAT E O F T H E A RT

4C H A N G E M A N A G E M E N T
In this chapter, the concept of CM will be introduced in general aswell as in a CRM context. This chapter aims to:
• Briefly explain the results of the literature study;
• Explain the processes of, resistance to, and the individual per-spective on CM.
4.1 literature study results
In his book, Burnes (2004) gives an overview of the CM field [17].He describes the development of the field, as well as its main ap-proaches. Bamford & Forrester (2003) and By (2005) critically reviewthese main approaches [7, 19]. Avanade’s perspective on CM, Kotter &Schlesinger (2008) perspectives on resistance to change [53], and theADKAR model for the individual perspective on change [45] are alsoincorporated in this research.
4.2 approaches to change management
CM is not a clear-cut discipline with well-defined boundaries [17]. Themost well-known approaches to the change are the planned changeapproach and the emergent change approach.
4.2.1 Planned change
The planned change approach originated in the work of Lewin [7, 20].According to Burnes (2004) [16], Lewin used the term planned changeto distinguish change which is consciously scheduled from changewhich derives from accidental actions. Lewin believes that "peoplein organizations work in groups" and "individual behavior must beseen, modified or changed in the light of groups prevailing practicesand norms" [16]. To bring about change, the focus should not be onindividuals but on the groups’ norms, roles and values [24].
Lewin developed a three-stage model for his envisioned change.These stages are unfreezing, moving, and refreezing. Lewin statesthe current set of behavior needs to be destabilized, unfrozen, be-fore new behavior can replace old behavior [17]. Three processes areneeded for this unfreezing [75]. First, people should disconfirm theircurrent set of behavior. Secondly, people should feel ’attached’ to this
10
4.2 approaches to change management 11
disconfirmation and have a strong desire to change. At last, peopleshould feel save from loss and humiliation [17].
Following the process of implementation, the organization imple-ments the actual change. The outcome of this change cannot alwaysbe predicted, but the forces influencing the change - such as reinforce-ment of old behavior - can be evaluated in an iterative way to steerto a more acceptable set of behavior [75]. Trying to change behaviorwithout reinforcement, could make change short-lived [56] (as men-tioned by [16]).
After the change has been implemented, the organization tries toregain stability as soon as possible, and refreezes. The new behaviorneeds to be congruent with the set of other behavior, personalities andthe environment of the employees, to keep stability [17]. Otherwise,the change could become unsuccessful.
Based on the three-step approach by Lewin, new models have beendeveloped. Bullock and Batten (1985) tried to make a more practicalmodel, by reviewing more than 30 models of planned change [7]. Themodel consists of four phases and contains the exploration, planning,action and integration phase [14].
In the exploration phase, members of the organization determineand decide whether or not a change is needed. If so, resources arecommitted to the change. In the second phase, the problem is diag-nosed and change goals and actions are defined. In the action phasethe changes are implemented as planned, including the feedbackneeded to control the change [3]. Once the changes are implemented,the integration phase has been reached. In this phase the organiza-tion tries to stabilize and new behavior is reinforced. This four phasemodel has broad applicability to most change situations according to[24] (as cited by [3]).
4.2.2 Emergent change
Considerable disagreement exists about the most appropriate way tochange organizations. The planned change method is seen as tooheavily relying on the role of the managers and assumes the man-agers have a full understanding of the change process as a whole [85].Because of the criticism on planned change, the emergent changeapproach has gained ground [19]. Within this approach, change isseen as a continuous, dynamic and contested process that emergesin an unpredictable and unplanned fashion [17]. Emergent change isbottom-up driven [7] and the ’increasingly dynamic and uncertain na-ture’ of organizations makes the emergent change more appropriatethan planned change [85] (as cited by [17]). Furthermore, change isseen as sudden, messy and unpredictable and not as a linear, planned,process [29, 13].

12 change management
According to Burnes (2003), in the emergent approach five aspectsof organizations make or break change [15]. These aspects are or-ganizational structures, cultures, organizational learning, managerialbehavior and power and politics. Some types of formal and informalorganizational structures are easier to achieve change than others [36].More dynamic and chaotic environments require organizations to bemore flexible and less hierarchical. For change to be successful, thenew situation has to be anchored in the organization’s culture.
Organizational learning concerns ’the capacity of members of an or-ganization to detect and correct errors and to seek new insights thatwould enable them to make choices that better produce outcomesthat they seek’ [61]. Making employees dissatisfied with the currentsituation can help building momentum for change [85]. According toPettigrew and Whipp (1993), ’collective learning’ is a main precondi-tion for sustainable change [71].
The emergent change approach sees managers as facilitators andcoaches, in contrast to directing and controlling function in the plannedapproach. This difference requires various capabilities from managers.Power and politics are recognized as important factors in the emer-gent approach. It is important to ’gain support of senior management,local management, supervisors, trade unions and workplace employ-ees’ [28] and to build coalitions [47].
4.3 individual perspective on change
Erskine, a practitioner in the field of IT and organizational changeinitiatives, outlines the individual perspective on change, causes ofresistance to change, and how to cope with this resistance [33]. Shedescribes the ADKAR model - which is developed by Hiatt (2006) [45]- as a method which covers the aspects needed for an individual toadapt to the change.
The ADKAR model concerns managing the people side of change.This model highlights more than just the task of communication,sponsorship or training [45]. The goal of this model is to realizechange faster, with greater participation levels, and higher perfor-mance by all individuals affected by the change. This should result inrealizing the goals of the change and maximize the financial benefits.
In Table 2, the CM elements of the ADKAR model are aligned withthe business results. The CM activities are connected to the businessresults through the ADKAR model. To achieve the business results,all the element of the ADKAR model have to be covered. In order tofulfill the ADKAR criteria, different CM activities have to be under-taken. For these activities to be completed, a strategy is needed.
Because various activities and ways of doing these activities exists,the focus will be on the ADKAR element, to make it fit with all kind

4.4 resistance to change 13
of activities. For example, some organizations may give trainings in avirtual way, some may do it once, and some only give on-site support.
Table 2: Change management aligned with business results, obtained fromHiatt (2006) [45]
CM strategy development CM activities CM elements -ADKAR
Business results
Assess the change
Assess the organization
Assess sponsorship
Assess risks and challenges
Design special tactics
Form team and sponsormodel
Assess team readiness
Communications
Sponsorship
Training
Coaching
Resistance man-agement
Awareness
Desire
Knowledge
Ability
Reinforcement
On time
On budget
Archieve businessobjectives
- lower costs
- increased revenue
- improved quality
- maximize ROI
As mentioned in Table 2, five elements of CM need to be coveredfrom the individual perspective [45]. First of all, an individual needsto be aware why the change is needed. This is done by communi-cating the need for change. Then, it is important that the person hasthe desire to support and participate in the change. There should besome motivation to change, in terms of advantages for the individual.Third, the employee should have the knowledge on what is expectedfrom him or her and how or she should change.
After these three above-stated criteria have been fulfilled, the per-son should have the ability to change his or her skills and behavior.The skills and behavior should be reinforced to sustain the change.
The ADKAR can be used in tandem with the six steps method todecrease the resistance to change, as discussed in the next section[33].
4.4 resistance to change
Kotter & Schlesinger (2008) researched reasons for an individual toresist change. Four main reasons were found, which are parochial self-interest, misunderstanding and lack of trust, different assessments ofthe situation, and low tolerance to change [53].
Kotter & Schlesinger (2008) found that people predominantly actout of self-interest in a change process. If employees think that bychanging their behavior, they lose something of value for themselves- for example their position or job -, they are not willing to change.

14 change management
Furthermore, when people do not understand why the change isneeded and interpret the results of the change as non-beneficial, an-other barrier for change is created. Often this barrier is caused by alack of trust in the person initiating the change [2].
Thirdly, an employee might have a different assessment of the sit-uation than the person initiating the change. The employee may seemore disadvantages than advantages to change and will feel less com-mitted to the change.
Finally, people can feel unable to develop the required skills, atti-tude, and behavior. A lack of knowledge and a lack of time may beexamples why people feel uncomfortable to change.
4.4.1 Coping with resistance
Kotter & Schlesinger (2008) came up with six solutions to deal withthe resistance to change [53]. Successfully managed changes may con-tain a combination of the six approaches.
Kotter & Schlesinger (2008) found that when communicating andeducating about the change beforehand, people will become less re-sistant to the change. This helps them to find out why the changeis needed and overcomes problems with incorrect information or ru-mors within the organization.
Secondly, by involving and letting people participate in the changeprocess, knowledge gaps can be identified and solved. Knowledgegaps can exist because the change manager is unable to know every-thing about the employee’s working process. Involvement will alsolead to participants feeling more committed to change.
Moreover, it is important that people are facilitated and supportedto adopt to the changes, by providing trainings. Additionally, givingemployees time off when a substantial amount of work is deliveredcan help the employees feel supported.
By negotiating with potential and active resisters in the organiza-tion, an incentive can be created to change. For example, a highersalary can be negotiated. Negotiated agreements are a relatively easyway to avoid major resistance.
Fifth, someone will become less resistant to change by giving himor her an important role in the change process or by providing se-lective information to this person. This is called manipulation andco-option. A major risk is that if the person finds out and feels ma-nipulated, their resistance will be even larger than at the initial stage.
At last, employees may also be forced to change through explicitor implicit coercion. For instance, employees can be fired when theydo not change to the desired situation. This is a risky approach aspeople strongly resent forced change. However, sometimes coercionis not be unavoidable.

4.5 change management for crm 15
4.5 change management for crm
In the context of an organization’s customer-focus, a CRM systemmay be implemented, as described in Chapter 1. The decision to im-plement a CRM system is made at a strategic level, as CRM systemsare used organization-wide. The integration of the different businessunits with their processes in one IS, is a significant issue for today’sorganizations [38].
4.5.1 Multi-layered CRM implementation approach
Finnegan & Currie (2010) introduced a multi-layered approach toCRM implementation [34]. The approach consists of four layers, whichcan be found in Figure 2. The layers are are culture, people, pro-cess and technology. A "collaborative approach which promotes in-tegration of culture, people, processes and technology" is seen asparamount. Each of the layers depends on, enables and constrainsone another.
Figure 2: Multi-layered CRM implementation approach, obtained from [34]
Affordance is a central construct in this model, which representsthe "perceived aspects of the setting that enable and/or constrain hu-man actions and interactions" [39].

16 change management
The cultural aspect is relevant as the shift to a customer focusedorganization with a CRM requires a change in "the culture to sharinginformation and knowledge more freely". This cultural change can besupported by "effective communication throughout the entire project"and should reach all levels of employees.
A diversity of people, such as sales, marketing and managers, areworking with the CRM system. Because of the diversity, it is hard toembrace the demanded and planned change to make people account-able for change success. With senior executives support, employeescan be motivated to change and overcome accountability problems.
The move to a customer focused organization requires a changein the product-driven processes. A customer-focused organizationshould be able to adapt to changes in the customer’s demand as fastas possible.
The technology layer concerns the CRM and its technical implemen-tation to "collect and analyze data on customer patterns, interpretcustomer behavior, develop predictive models, respond with timelyand effective customized communications, and deliver product andservice value to individual customers".
4.5.2 Avanade’s change management
Avanade developed its own approach to CM, called ’change enable-ment’. The focus of this approach is on user acceptance and achievingthe business case1. Achieving the business case is important, as suc-cess is measured based on whether the solution is turned-on, on-timeand on-budget. Only few customers show concern for achieving busi-ness results, in terms of efficiency and effectiveness2. User acceptanceis needed for the business results to be obtained.
The Avanade Change Enablement methods integrates the changeprocess with the software development process. Six phases in the de-velopment process match five aspects of the change process, as shownin Figure 3.
During the ’Plan Change’ stage, the stakeholders are identified andit is determined how the stakeholders will be affected by the change.Moreover, the change process is planned, as well as the target stateis defined. This stage contains all preparation needed for the changeprocess.
The ’Manage Change’ stage ensures the identified stakeholders areengaged in the change and are ready to adopt to the new situation.The progress of the change is monitored and it is made sure that thebusiness is ready to perform in the target state.
Enabling the organization ensures individuals adopt to the plannedsituation, by aligning the jobs, business processes, and the IS. It is
1 As mentioned at Avanade’s Change Enablement internal webpage.2 Based on the experience of Avanade’s employees.

4.5 change management for crm 17
Figure 3: Avanade Change Engagement approach
important that these are aligned, otherwise the organization may notbe as efficient and effective as possible.
Designing and implementing training and end user support aimsat adapting the set behavior, skills, capabilities, and knowledge, to fitthe new way of working. This is important because if someone doesnot have the ability to adapt himself or herself to the new situation,adoption may fail.
When building leadership and commitment, the leaders of the changeare trained to have the required behavior to effectively lead the orga-nization through the change. When the new behavior is identifiedfor all stakeholders, these should be aligned by integrating them inthe performance objectives and incentives, and by incorporating theminto training and end user support.
As can be seen in Figure 3, the last four phases run in parallel andonly the first is done beforehand. The tasks and activities of eachstage are clearly defined and scheduled. This matches Lewin’s defini-tion of planned change, as discussed 4.2.1.
4.5.3 Most suitable change management approach
A matrix has been developed by Burnes (2004), to select which way ofCM is most suitable [17]. On the horizontal axis, the need for change ismapped. In the case of near bankruptcy, drastic and fast changes maybe needed to the organization. If an organization wants to improve itsservice, but no fundamental changes are needed, slow transformationand change are preferred.
On the vertical axis, the degree of impact, in terms of size and theamount of change, is mapped. If the impact is high, the focus is on the

18 change management
organization as a whole. If the impact is low, individuals and groupsbehavior and attitudes should be changed. The matrix can be foundin Figure 4.
Figure 4: Framework for change, developed by Burnes (2004) [17]
The implementation of a CRM system does not involve structuralor drastic changes to the organization. A CRM system is part of acustomer-focused strategy in an organization [22, 21]. The customersof Avanade implement a CRM system to further improve their effi-ciency and effectiveness. Although many of the departments in anorganization will directly or indirectly be influenced by the CRM sys-tem, this implementation does not have influence on culture of anorganization. The change should mainly focus on the attitude andbehavior of the end users, as the users should change their attitudeand behavior to accept the new CRM system. Based on Burnes’ (2004)matrix [17], the planned change approach is most appropriate for theintroduction of a CRM system, which is in the lower left quadrant.This matches the current approach of Avanade, as the organizationuses a planned change approach to implement the CRM system intothe organization.
5U S E R A C C E P TA N C E
In this chapter, the concept of user acceptance will be introduced.Afterwards, the concept will be applied to the CRM context. Thischapter aims to:
• Briefly discuss the results of the literature study;
• Explain the context of user acceptance;
• Justify the current understanding of user acceptance and its de-terminants.
According to Venkatesh et al. (2003), IS research has for a long timestudied why and how people accept new information technologies[81]. The goal of this research is to understand what user acceptancedepends on. However, current theoretical models and perspectivesare weak in prescriptive guidance to practitioners on how to improveuser acceptance [81].
5.1 literature study results
As mentioned in the approach 2.1, the starting point for the litera-ture study is the literature given at the University of Twente, at thecourse FIS. Special attention is given to the publication of Moody, Ia-cob & Amrit (2010) [65]. Unified Theory of Acceptance and Use ofTechnology (UTAUT) is found as a central point in literature. By using Unified Theory of
Acceptance and Useof Technology
forward citations, several additions are found. One of these additionsis the Habit (HT) [57, 50]. To clarify user acceptance, the theory of
HabitKarahanna et al. (1999) is found [48].For CRM specifically, UTAUT is expanded with Task-Technology Fit
(TTF) by Pai & Tu (2011) [69]. Moreover, Avlonitis & Panagopoulos Task-Technology Fit
(2005) researched the determinants of CRM acceptance for individual,organizational and social factors specifically [4]. It is important tonote that in several articles the use of IS is voluntary. In the contextof this thesis, however use is not voluntary, since end users have touse the CRM system. Also, the CRM system is the only sufficient IS forperforming certain tasks.
5.2 user acceptance
As was briefly discussed above, Karahanna et al. (2009) developeda model, called Theory of Reasoned Action (TRA). Additionally, they Theory of Reasoned
Action
19

20 user acceptance
found differences in the determinants of user acceptance for the pre-adoption and post-adoption phase [48]. Pre-adoption has been referredto as "the stages leading to the adoption decision". In the pre-adoptionstages, the target behavior is adoption. The stages following the adop-tion decision" are referred to as post-adoption stages and the goal hereis to continued usage. Continued usage is often used as a synonymfor post-adoption.
In the pre-adoption phase, the normative determinants dominatethe prediction of Behavioral Intention (BI). On the contrary, in theBehavioral Intention
post-adoption phase the attitudinal determinants predominate the be-havioral intention to continue using the IT. The model, developed byKarahanna et al. (1999) [48], can be found in Figure 5.
When reflecting the two phases on the work of Venkatesh et al.(2003), the pre-adoption phase is not studied [81]. However, a distinc-tion is made for low levels of experience and higher level of experi-ence.
Figure 5: Theory of Reasoned Action, obtained from Karahanna et al. (1999)[48]
5.3 utaut
As was introduced earlier, Venkatesh et al. (2003) unified eight modelsof user acceptance, including TRA, into one model called UTAUT [81].The model outperforms the eight individual models by predicting

5.3 utaut 21
69% of the variance in BI and 47% of the variance in Use Behavior (UB). Use Behavior
The model can be found in Figure 6.UTAUT describes nine constructs, (in)directly influencing UB. UB was
measured as actual use of the system, by analyzing the system logs.A central, mediating, construct in the model is BI. This is the extentto which a person aims to act in a certain way, in this case to use theIS. One of the predictors for BI is Performance Expectancy (PE). Performance
ExpectancyPE is ’the degree to which an individual believes that using thesystem will help him or her to attain gains in job performance’. PE isa strong predictor for BI, moderated by gender and age. This effect isstronger for men and younger workers.
Another predictor for BI is Effort Expectancy (EE), which is defined Effort Expectancy
as ’the degree of ease associated with the use of the system’. EE ismoderated by gender, age, and experience for predicting BI. Thiseffect is stronger for women, particularly younger women, at earlystages of experience.
Figure 6: UTAUT, obtained from Venkatesh et al. (2003) [81]
Social Influence (SI) is defined as ’the degree to which an individ- Social Influence
ual perceives that important others believe he or she should use thenew system’. SI is moderated by gender, age, voluntariness, and ex-perience. This effect is stronger for women and older persons. Whenuse is mandatory, social influence has found to be relevant only inthe early stages of individual experience with the technology. Its in-fluence decreases over time and becomes non-significant.
Facilitating Conditions (FC) directly influences UB and is defined FacilitatingConditionsas ’the degree to which an individual believes that an organizational
and technical infrastructure exists to support use of the system’. FC isfound to be stronger for older workers, particularly with increasingexperience.

22 user acceptance
5.3.1 Elaborating on UTAUT
One of the critiques of Limayem et al. (2007) on user acceptance re-search, including UTAUT, is that "it does not reveal what is really driv-ing continued usage" [57]. When the degree of HT increases, the BI
prediction of UB is worse. The authors suggest that HT has a moder-ating effect on the relationship between BI and UB and may fill thegap in understanding continued UB [57]. HT is defined as "the extentto which people tend to perform behavior (use IS) automatically be-cause of learning". This definition is supported by Kim et al. (2005)[50], who tested other perspectives on HT.
In reaction to this, Venkatesh et al. (2012) researched UTAUT in aconsumer’s context and developed UTAUT 2 [82]. Specifically for thiscontext, three constructs were added to the model, which are HedonicMotivation (HM), Price Value (PV), and HT.Hedonic Motivation
Price Value HM is defined as "the fun or pleasure derived from using a technol-ogy" and is modeled as determinant of BI, moderated by gender, ageand experience. The addition of HM is based on the work of Brown& Venkatesh (2005) and is confirmed once more in the research ofVenkatesh et al. (2012) [82, 12].
The second added construct, PV, is only relevant in a consumer usecontext because users have to pay money for usage, whereas employ-ees do not [82]. The last construct which was added is HT, which hasan effect on BI as well as UB. HT is moderated by age, gender, andexperience and the effects of HT are stronger for older men with highlevels of experience.
5.4 user acceptance of crm systems
Although a considerable amount of research is done on user accep-tance of IS in general, research clearly falls short on the user accep-tance of CRM. Two of the articles related to user acceptance in a CRMcontext are discussed below.
5.4.1 Individual, organizational, and social characteristics
Avlonitis & Panagopoulos (2005) researched additional determinantsof CRM acceptance and the resulting performance of salespersons [4].In their article, they combine Technology Acceptance Model (TAM)Technology
Acceptance Model and the IS Success model of DeLone and McLean (1992) into a newand extended model, which can be found in Figure 7 [30, 25].
The authors added individual, organizational, and social character-istics to the model, influencing CRM ease-of-use and CRM usefulness[4]. The individual characteristics are Computer Experience, Com-puter Self-Efficacy, and Innovativeness. The organizational factors areTraining, User Participation, and Accurate Expectations. The social
5.4 user acceptance of crm systems 23
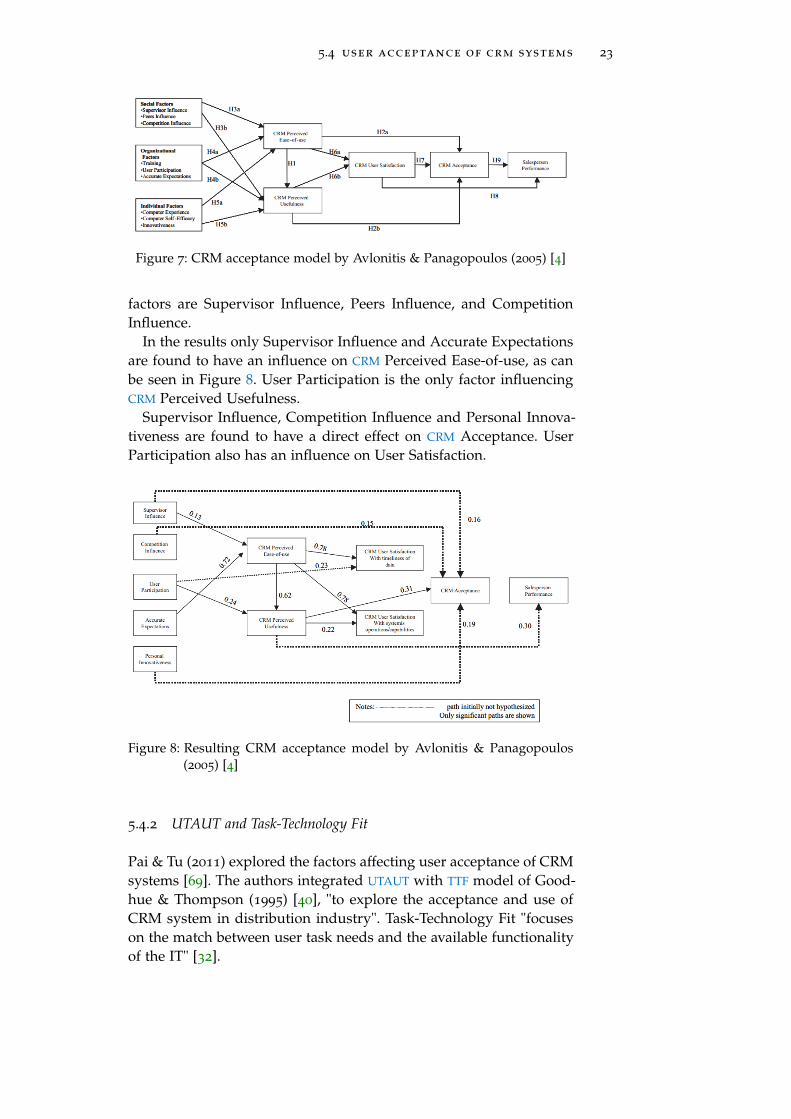
Figure 7: CRM acceptance model by Avlonitis & Panagopoulos (2005) [4]
factors are Supervisor Influence, Peers Influence, and CompetitionInfluence.
In the results only Supervisor Influence and Accurate Expectationsare found to have an influence on CRM Perceived Ease-of-use, as canbe seen in Figure 8. User Participation is the only factor influencingCRM Perceived Usefulness.
Supervisor Influence, Competition Influence and Personal Innova-tiveness are found to have a direct effect on CRM Acceptance. UserParticipation also has an influence on User Satisfaction.
Figure 8: Resulting CRM acceptance model by Avlonitis & Panagopoulos(2005) [4]
5.4.2 UTAUT and Task-Technology Fit
Pai & Tu (2011) explored the factors affecting user acceptance of CRMsystems [69]. The authors integrated UTAUT with TTF model of Good-hue & Thompson (1995) [40], "to explore the acceptance and use ofCRM system in distribution industry". Task-Technology Fit "focuseson the match between user task needs and the available functionalityof the IT" [32].

24 user acceptance
They used the definition of Goodhue & Thompson (1995) for theirconstructs [69, 40]. Therefore, task characteristics are defined in termsof interdependence and non-routine. The first dimension, which isinterdependence, determines the degree to which tasks are related tomore than one business function. The second dimension, non-routine,determines to what extent business problems are ill-defined and ad-hoc.
Goodhue & Thompson (1995) measured technology characteristicsalong two dimensions, the number of IS used by each respondent,and the department of the respondents [40]. The authors assumeddifferent departments would pay different levels of attention on forexample trainings. Moreover, they assumed that the characteristicsof system is the same for all who use that system. TTF describes thedegree "to which a technology assists an individual in performing hisor her portfolio of tasks". The tested and resulting model by Pai & Tu(2011) can be found in Figure 9. The influence of Task-Technology fiton Behavioral Intention was found to be high.
Figure 9: Integrated model of UTAUT and TTF, obtained from Pai & Tu (2011)[69]
5.5 conceptualizations of use behavior
Venkatesh et al. (2008) used three different conceptualizations of sys-tem use, which are perceived frequency, duration and intensity [80].These are subjective conceptualizations of UB, instead of the objectiveway of measuring system use with system logs. These conceptualiza-

5.5 conceptualizations of use behavior 25
tions can be used in combination with the objective way of measuringsystem usage, such as analyzing system logs [81].
The authors retrieved the conceptualizations from David et al. (1989)[27] and Straub et al. (1995) [76]. Both papers note that the correlationbetween perceived system use and actual system use is not perfect.Davis et al. (1989) handled this problem by not handling the concep-tualization as an exact measure, but as a relative measure [9, 43]".

Part III
D E V E L O P M E N T O F T H E M O D E L

6O P E R AT I O N A L I Z AT I O N O F C H A N G EM A N A G E M E N T F R O M E N D U S E R ’ S P E R S P E C T I V E
As mentioned in Chapter 4, the goal of CM for CRM is to changeusers’ attitudes and behavior to match with the new IS. In this chap-ter, the different approaches to CM will be compared in order to op-erationalize CM from an end user’s perspective. First, the end userrelated goals in the Avanade’s Change Enablement method will bedetermined. Then Avanade’s method will be compared with the AD-KAR model and the six actions to deal with resistance to change. The’Multi-layered CRM implementation approach’ will not be included inthe operationalization as it does not focus on individuals and is notdetailed enough for operationalization.
6.1 avanade’s end user related change management goals
Avanade’s change enablement approach contains five processes withdifferent goals, as shown in Figure 3. In Avanade’s method, a changemanager is appointed and his or her corresponding goals are defined.This change manager is responsible with regards to the change pro-cess. In order to operationalize CM from an individual’s perspectivein the Avanade method, the end user related goals are included inthe operationalization. The goals which apply to the end user of thesystem can be found in Table 3
1. The inclusion or exclusion of thesegoals is subjective. Therefore, a motivation is added to each goal, whyit is included or not.
Table 3: Avanade’s change method’s applicability to end user
Process / objective Motivation
Plan Change
Identify all change stakeholders, and deter-mine their needs, expectations, constraints, andinterfaces for all stages of the project.
Not included: Task of changemanager, end user not involved.
Clearly articulate the target state to guide theproject’s path forward.
Not included: This goal is specif-ically aimed at higher-level man-agement 2.
Define how to organize and govern the changestructure.
Not included: Task of changemanager, end user not involved.
1 The goals can be found on Avanade’s internal website2 As stated in their internal methodology
27

28 operationalization of change management from end user’s perspective
Develop a Change Brand to provide a meaning-ful identity to the project.
Not included: Task of changemanager, end user not involved.
Develop a Value Plan expressing how each partof the organization contributes to achievingproject benefits.
Not included: Task of changemanager, end user not involved.
Define a Change Plan to address the impactsand enable people and the organization to op-erate the new capability.
Not included: Task of changemanager, end user not involved.
Assess the effort and resources associated withthe change activities required to achieve thebusiness case and objectives
Not included: Task of changemanager, end user not involved.
Managing change
Ensure ownership of the change within thebusiness.
Not included: Task of changemanager, end user not involved.
Ensure any external stakeholders are identifiedand appropriately involved.
Not included: Task of changemanager, end user not involved.
Educate employees about the change initiativeand the new ways of working - both at the exec-utive level and at the operational level - to sup-port understanding of issues during change.
Included: End user directly in-volved.
Establish and monitor a network of changeagents to act as liaisons between project lead-ership and target stakeholders.
Not included: Task of changemanager, end user not involved.
Develop joint understanding among senior ex-ecutives, sponsors, and key stakeholders as towhat they expect to achieve from the changeeffort and their role in making it happen.
Included: Some end users arekey stakeholders and shouldknow and understand what isexpected from them.
Measure and report the progress of the changeadoption.
Not included: Task of changemanager, end user not involved.

6.1 avanade’s end user related change management goals 29
Assess the readiness of the organization to un-dertake and enable the change and to conductinterventions to ensure change success, if inscope.
Not included: Task of changemanager, end user not involved.
Enable the Organization
Enable the change by aligning the organizationand Human Resources (HR) processes to sup-port the new processes and motivate individu-als.
Included: End users may bemotivated by the Human Re-sources department to adopt tothe change.
Develop the required behavior, skills, capabili-ties, and knowledge to be successful in the tar-get state.
Included: Users should developtheir abilities to adopt and reachtargeted state.
Design and Implement Training and EndUser Support
Support employees to develop the behavior,skills, capabilities and knowledge required toeffectively perform new or improved ways ofworking.
Included: End users receive sup-port to develop themselves.
Define the training and end user support strat-egy and plan to effectively enable the change.
Not included: Task of changemanager, end user not involved.
Design and develop training materials neededto achieve the new or improved way of work-ing.
Not included: Task of changemanager, end user not involved.
Design and develop end user support to sus-tain performance in the short and long term.
Not included: Task of changemanager, end user not involved.
Deploy training and end user support to en-sure adoption of new or improved ways ofworking.
Included: End users receivetraining and support to improveadoption.
Evaluate the effectiveness of training and enduser support provided to optimize adoption ofnew or improved ways of working.
Included: End users’ feedbackmay be used to optimize adop-tion and identify knowledgegaps.
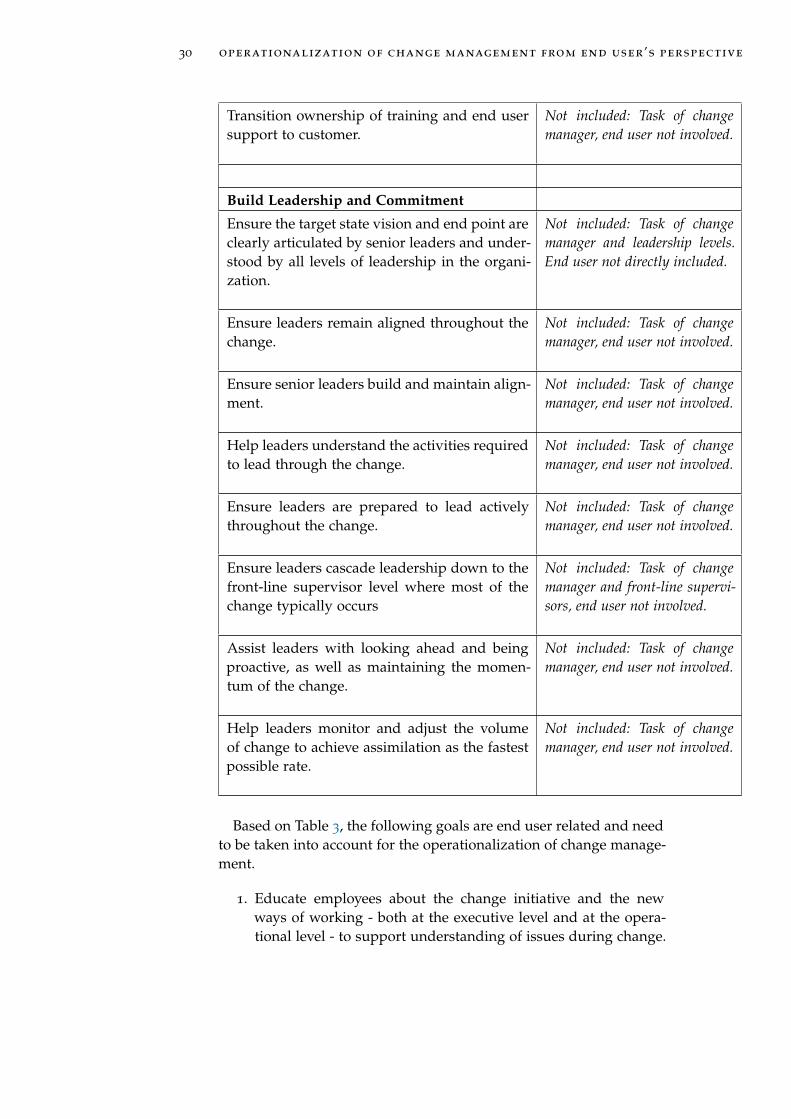
30 operationalization of change management from end user’s perspective
Transition ownership of training and end usersupport to customer.
Not included: Task of changemanager, end user not involved.
Build Leadership and Commitment
Ensure the target state vision and end point areclearly articulated by senior leaders and under-stood by all levels of leadership in the organi-zation.
Not included: Task of changemanager and leadership levels.End user not directly included.
Ensure leaders remain aligned throughout thechange.
Not included: Task of changemanager, end user not involved.
Ensure senior leaders build and maintain align-ment.
Not included: Task of changemanager, end user not involved.
Help leaders understand the activities requiredto lead through the change.
Not included: Task of changemanager, end user not involved.
Ensure leaders are prepared to lead activelythroughout the change.
Not included: Task of changemanager, end user not involved.
Ensure leaders cascade leadership down to thefront-line supervisor level where most of thechange typically occurs
Not included: Task of changemanager and front-line supervi-sors, end user not involved.
Assist leaders with looking ahead and beingproactive, as well as maintaining the momen-tum of the change.
Not included: Task of changemanager, end user not involved.
Help leaders monitor and adjust the volumeof change to achieve assimilation as the fastestpossible rate.
Not included: Task of changemanager, end user not involved.
Based on Table 3, the following goals are end user related and needto be taken into account for the operationalization of change manage-ment.
1. Educate employees about the change initiative and the newways of working - both at the executive level and at the opera-tional level - to support understanding of issues during change.

6.2 comparison of three change management methods 31
2. Develop joint understanding among senior executives, spon-sors, and key stakeholders as to what they expect to achievefrom the change effort and their role in making it happen.
3. Enable the change by aligning the organization and Human Re-sources (HR) processes to support the new processes and moti-vate individuals.
4. Develop the required behavior, skills, capabilities, and knowl-edge to be successful in the target state
5. Support employees to develop the behavior, skills, capabilitiesand knowledge required to effectively perform new or improvedways of working.
6. Deploy training and end user support to ensure adoption ofnew or improved ways of working.
7. Evaluate the effectiveness of training and end user support pro-vided to optimize adoption of new or improved ways of work-ing.
6.2 comparison of three change management methods
The goal of comparing the different CM methods is to operationalizeCM from a user’s perspective, covering all aspects. In Figure 10 theAvanade’s change enablement method, the ADKAR model, and thesix change resistance reduction ways are mapped. The item numbersof the Avanade method correspond to the goals mentioned in theprevious section.
The factors of the ADKAR model are proposed as factors of CM,because the model suggests to cover all CM aspects from user’s per-spective. For each of the factors in the ADKAR model, the link to theother two models is explained. First the connection with the methodof Kotter and Schlesinger (2008) is be discussed, which is explainedis 4.4.1 [53]. Then the connection with the Avanade approach is bereviewed, which can be found in 4.5.2.
6.2.1 Awareness
The ’Education and communication’ resistance reduction way of Kot-ter and Schlesinger (2008) ’helps people see the need for and the logicof a change’ [53]. This shows similarities with the awareness factor ofthe ADKAR model. To raise awareness, employees should know whythe change is needed. Based on this similarity, ’Education and com-munication’ and Awareness can be linked.
The second item of the Avanade Change Enablement method is’develop joint understanding among senior executives, sponsors, and

32 operationalization of change management from end user’s perspective
key stakeholders as to what they expect to achieve from the changeeffort and their role in making it happen’. This indicates an intro-duction to the change, as it discusses what is expected from the newIS and what their role is in the change. By having this introduction,awareness to change is created. Based on this relationship, the seconditem of the Avanade Change Enablement method and Awareness canbe linked.
6.2.2 Desire
Participation & involvement can be mapped with Desire because Par-ticipation & involvement aims to leads commitment, which is beneeded for change success [53]. Desire is willingness to support andparticipate in the change [45]. Based on this mutual overlap, Desirecan be linked to Participation & involvement.
The third item of the Avanade method, ’aligning the organizationand Human Resources (HR) processes to support the new processesand motivate individuals’, tries to create an incentive to change. Thisincentive should create a desire to change. Therefore, ’Enable Change(3)’ and Desire can be linked.
6.2.3 Knowledge
’Education & communication’ aims to create knowledge, since em-ployees who are educated about the change, overcome problems suchas ’inadequate or inaccurate information and analyses’. Moreover, thepeople get the knowledge on what the change is expected to look like.Based on this relationship, ’Education & communication’ can be con-nected to Knowledge.
’Educating employees (1)’ for a change makes sure that the em-ployees get the right level of knowledge, which is needed for thechange. Because the education of employees aims at creating knowl-edge about the change, ’Educating employees (1)’ can be linked toKnowledge of the ADKAR model.
6.2.4 Ability
When the previous three aspects of the ADKAR model are fulfilled,an employee should have the ability to change. ’Facilitation & sup-port’ may support an employee to increase his or her ability to change.When an employee does not want to change ’Explicit & implicit co-ercion’ can be used to force an employee to change. Therefore, both’Facilitation & support’ and ’Explicit & implicit coercion’ items can belinked to ability.
’Behavior, skills, capability, and knowledge (4)’ need to be devel-oped to address the ability to change. ’Trainings and End user sup-

6.3 change management approaches mapping 33
port (6)’ and ’Support employees to develop (5)’ should make theemployee able to change. Therefore, these three items are linked toAbility.
6.2.5 Reinforcement
Reinforcement makes sure the employee will stick to the changes sit-uation. According to Lewin, without reinforcement, change could beshort-lived [56] (as cited by [17]). ’Negotiating & Agreement’ mayhelp to make sure employees stick to the change, even if the employeehas certain requirements or problems. ’Evaluate (7)’ might also helpto keep the new behavior reinforced, as identified problems may besolved to stick to the new situation.
6.3 change management approaches mapping
In Figure 10 the mutual overlap of the three different methods ismapped. As mentioned earlier, the factors of the ADKAR model areused for the operationalization of CM. CM can now be defined as "theextent to which an employee has the awareness, desire, knowledge,ability and reinforcement to change and uphold behavior, attitude &skills".
Figure 10: Change management mapped from user’s perspective

7D E T E R M I N I N G U S E R A C C E P TA N C E F O R C R M
In this chapter, the current understanding of user acceptance is ex-ploited to prepare a model which is applicable to the user acceptanceof CRM systems. The core of the user acceptance model is the UTAUT
model of Venkatesh et al. (2003), as it unified eight models with ahigh explanatory power [81]. As use of the CRM is mandatory in thisorganizational setting, voluntariness of use is dropped. Some con-structs are added to the core model, based on their applicability toCRM. In the coming sections, possible additional constructs are dis-cussed, based on the results of Chapter 5.
7.1 not included constructs
Venkatesh et al. (2012) updated UTAUT model to UTAUT 2, by addingseveral new constructs for consumer use context [82]. One of theseconstructs is HM, which is the pleasure of using an IS. Resulting fromthe upcoming trend of gamification, this construct may be useful [31].However, currently Avanade does not work with gamification andtherefore, no variance is expected in HM. Therefore, HM will not beincluded in the model.
Another construct which is not included in the model is PV [82].Because the users of the system do not pay for the IS themselves, theconstruct is not relevant in a CRM context [82].
7.2 additional constructs
As discussed in Chapter 5, several constructs were added to UTAUT,or one of the covered models in UTAUT. Two of these constructs areHT and TTF.
HT is found to be a critical factor in post-adoption use [57, 50, 82].The explanatory power of BI on UB is found to decrease, when be-havior becomes more habitual [57, 82]. In UTAUT 2, HT is modeled asfactor influencing BI as well as UB, moderated by gender, experienceand age [82]. Because HT seems to play such an important role in theuse of IS, HT is added to the core model.
For the prediction of CRM usage, Pai & Tu (2011) [69] integratedthe TTF model of Goodhue & Thompson [40] with UTAUT, as can befound in Figure 11. TTF has positive influence and a high explanatorypower on BI. Therefore, TTF suggests to be a useful addition to thecore model.
34

7.3 conceptualizations of use behavior 35
Because the task and technology characteristics may vary amongthe different implementations of a CRM system1, only Task-technologyis added to the core model. Moreover, adding extra constructs to TTF
does not give extra insight in BI or UB.
Figure 11: Part of Task-Technology Fit included in the model of Pai & Tu(2011) [69]
7.3 conceptualizations of use behavior
As mentioned in 5.5, Venkatesh et al. (2008) used three different, sub-jective, conceptualizations of UB. Namely frequency, duration and in-tensity [80]. The advantage of these conceptualizations is that no sys-tem changes are needed to measure UB. Since Avanade does not mea-sure UB currently, these three conceptualizations are used. It has tobe noted however, that using these conceptualizations implicates thatthe outcomes of the measured UB cannot be taken as exact measure,but as a relative measure [9, 43].
7.4 additional determinants of crm acceptance
Avlonitis & Panagopoulos (2005) researched additional determinantsof CRM acceptance [4], as discussed in 5.4.1. Supervisor influenceand accurate expectations are determined to have a significant influ-ence on CRM Perceived Ease-of-use, which is incorporated in UTAUT asEE [81]. User participation is found as a factor influencing perceivedCRM usefulness, merged in UTAUT as PE [81]. Supervisor influence,competition influence and personal innovativeness had a direct effecton CRM Acceptance, which matches BI in UTAUT [4]. User Participa-tion resulted to have an influence on User Satisfaction.
All these influences are a useful addition to the core model. How-ever, SI of UTAUT covers supervisor influence as well as competitioninfluence, because this is part of the definition of SI which is the ’de-gree to which an individual perceives that important others believehe or she should use the new system’ [81].
1 At some customers of Avanade, 80% of the code may be custom made, and at somecustomers almost nothing may be custom made.

36 determining user acceptance for crm
Both accurate expectations and user participation are not incorpo-rated in UTAUT, therefore these two concepts are a useful addition tothe core model.

8I N T E G R AT I N G C H A N G E M A N A G E M E N T A N DU S E R A C C E P TA N C E F O R C R M
In this Chapter, CM and user acceptance are merged into one modelbased on Chapter 6 & 7. As mentioned in Chapter 7, the core for themodel is UTAUT. HT and TTF are added to the core model, as well asthe conceptualizations of UB. Furthermore, the determinants for CRM
success should be integrated.CM, which is operationalized in 6.3 as "the awareness, desire, knowl-
edge, ability and reinforcement to change and uphold behavior, atti-tude & skills", is expected to have on the user acceptance part ofthe model. Hypothesis are proposed to predict the effect of CM onthe user acceptance part of the model. The developed model can befound in Figure 12.
8.1 additional determinants of crm acceptance
As discussed in 7.4, accurate expectations of the system and user par-ticipation are additional determinants of CRM acceptance and shouldtherefore be included in the model. However, user participation is al-ready covered by the Desire factor of CM, since Desire is the willing-ness ’to support and participate in the change’ [45]. Accurate expec-tations is covered by the Awareness and Knowledge factors of CM, asthe end users gain awareness and knowledge about what needs to bechanges, which should lead to accurate expectations. Consequently,no additional determinants of CRM acceptance are included in themodel.
8.2 change management in the model
Based on Chapter 6, the aspects awareness, desire, knowledge, ability,and reinforcement of CM are integrated into the model. It is expectedthat CM influences PE, EE, SI, and FC.
8.2.1 Change management’s influence on Performance Expectancy
New IS, and consequently CRM systems also, are introduced to furtherincrease job performance, organization’s efficiency and effectiveness[26, 44]. PE has been defined as ’the degree to which an individualbelieves that using the system will help him or her to attain gains injob performance’ [81]. CM is expected to influence PE, because if theend user is increasing its awareness of the change, to further increase
37

38 integrating change management and user acceptance for crm
job performance, organization’s efficiency and effectiveness [26, 44],he or she should also be aware of the performance benefits. Based onthis relationship it is expected that CM will increase PE.
Hypothesis 1: CM will increase PE.
8.2.2 Change management’s influence on Effort Expectancy
EE has been defined as ’the degree of ease associated with the useof the system’ [81]. CM programs contain activities such as trainingsand support to make the employees able to work with the IS. Train-ings and support should also make working with the system easier.Therefore, CM is expected to increase perceived EE.
Hypothesis 2: CM will increase EE.
8.2.3 Change management’s influence on Social Influence
SI has been defined as ’the degree to which an individual perceivesthat important others believe he or she should use the new system’[81]. When management stimulates the change to the new IS, this willput a certain pressure on the employees and motivate them to change.As a result, CM is expected to increase the perceived SI.
Hypothesis 3: CM will increase SI.
8.2.4 Change management’s influence on Facilitating Conditions
FC has been defined as ’the degree to which an individual believesthat an organizational and technical infrastructure exists to supportuse of the system’ [81]. In the CM process, trainings, end user supportand discussions may take place to facilitate employees in adoption tothe new IS. Therefore, it is expected that CM will increase perceivedFC.
Hypothesis 4: CM will increase FC.
8.2.5 Change management’s influence on Task-Technology Fit
When end users are participating in a change, knowledge gaps maybe solved, as mentioned in 4.4.1, and problems may be identifiedin the early stages. This feedback can be used to improve the way ofworking with the system and make the technology fit the tasks. Basedon this relationship, it is expected that CM has influence on the TTF.
Hypothesis 5: CM will increase TTF.

8.3 habit taking over 39
8.3 habit taking over
When HT increases, the predictability of BI on UB is found to decrease[57, 1] and HT becomes more important for predicting UB. Indirectly,it is expected that the effect of change management will fade out overtime. However, change management may be relevant in the beginningto facilitate people to adopt and develop the HT.
Venkatesh et al. (2012) modeled HT as construct influencing BI aswell as UB, moderated by Age, Gender and Experience [82]. The ef-fect is stronger for older men with high levels of experience with thetechnology. When the end user just started using the system, no HT
has been developed. Therefore, it is expected that HT does not influ-ence BI and UB when the user just adopted.
Hypothesis 6(a): Habit will not influence BI and UB for people with lessexperience.
On the other hand, in higher experience levels HT was found to bea critical factor for predicting UB [57, 50, 82]. Therefore, it is theo-rized that HT will increase and have a significant influence on BI andUB. This indirectly decreases the impact of change management overtime.
Hypothesis 6(b): Habit will have a positive influence on BI and UB forpeople with higher levels of experience.

40
in
te
gr
at
in
gc
ha
ng
em
an
ag
em
en
ta
nd
us
er
ac
ce
pt
an
ce
fo
rc
rm
Figure 12: The constructed model

9E M P I R I C A L VA L I D AT I O N
A field survey will be conducted among the end users of different im-plementations of the CRM systems, based on Microsoft Dynamics CRM.According to Bhattacherjee (2012), field surveys capture "a snapshotof practices, beliefs, or situations from a random sample of subjects"[8]. The strength of field surveys is external validity, as data is col-lected in field settings. However, cause-effect relationships are hardto determine, called internal validity. Moreover, the internal validitymay be threatened by ’socially desirable’ responses. This is mediatedby anonymizing the results of the survey, but "there is practically noway of overcoming the social desirability bias in a questionnaire sur-vey" [8].
Venkatesh et al. (2003) did a longitudinal study at four organiza-tions from low to higher levels of experience [81]. Because of thetime-span of the thesis, it is not possible to do a longitudinal study.However, this survey will be conducted at different companies withdifferences in average levels of experience.
As mentioned in the Approach (2.1), the field survey is allowed totake up to five minutes. The survey can be found in Appendix A. Thesurvey is developed in Dutch, as the "end users would not under-stand" an English version. If possible, the items of previous studiesare reused and translated to Dutch. The sources of the English itemscan be found in Table 4. Moreover, extra items are created to makesure the language barrier would not create a gap in the definition ofthe constructs. For each of the constructs which needs more explana-tion, in terms of developing questions, will be described in Section9.1.
Table 4: Sources of questionnaire items
General information Venkatesh et al. (2003) [81]
Habit Limayem, Hirt & Cheung(2007) [57]
Task-Technology Fit Lin & Huang (2008) [59]
Performance Expectancy Venkatesh et al. (2003) [81]
Effort Expectancy Venkatesh et al. (2003) [81]
Social Influence Venkatesh et al. (2003) [81]
Facilitating Conditions Venkatesh et al. (2003) [81]
Behavioral Intention Venkatesh et al. (2003) [81]
Use Behavior Venkatesh et al. (2008) [80]
41

42 empirical validation
Change management Not applicable
9.1 indicators
In this section, the constructs which needs extra attention for creatingitems for the survey are described below.
9.1.1 Task-Technology Fit
The survey that Pai & Tu used for determining TTF was not men-tioned in the paper, as it was developed in Chinese1 [69]. To keepthe explanatory power of the TTF model on BI, similar research is re-trieved.
Zhou, Lu & Wang also integrated TTF of Goodhue & Thompsonwith UTAUT for mobile banking user adoption [88, 40]. Their itemsregarding the TTF construct are based on the work of Lin and Huang[59]. These questions are reused as basis for the Dutch translation.
9.1.2 Habit
The items used by Venkatesh et al. (2012) for determining HT arebased on the work Limayem & Hirt (2003) [58, 82]. Limayem, Hirt& Cheung (2007) also used the items generated by Limayem & Hirt(2003) [58]. As Limayem & Hirt (2003)’s work is unavailable, Limayem,Hirt & Cheung’s (2007) items are used and converted to a CRM context[57]. A well-designed self-reported measure of HT is found to be agood indicator for the degree to which a behavior is habitual [83] (ascited by [57]).
9.1.3 Measurement of Use Behavior
As mentioned in 7.3, UB can be conceptualized as frequency, dura-tion and intensity [80]. For frequency and intensity, the authors usedLikert scale items. Duration was measured in hours. For comparisonpurposes, it is important to determine the duration of usage relativeto the number of hours the employee works per week. Therefore, par-ticipants are asked to fill in the duration for a 40 hours working week.
9.2 assessment of reliability & validity
For the constructs of which the indicators are reused, seven items aretranslated and created. For perceived CM, thirty items are developed.Then, validity and reliability is assessed. The participants in the vali-
1 Mr. Pai was called to ask for the survey.

9.2 assessment of reliability & validity 43
dation process are interns at Avanade Netherlands, mainly studyingComputer Science and Business Information Technology at Univer-sity of Applied Sciences.
The first step of the validation process is done by a group of fiveto ten persons in three rounds, assessing clarity, readability & seman-tic meaning, and selecting the right construct, as suggested by Bhat-tacherjee (2012) [8]. Three rounds were needed to have an acceptableamount of items with an inter rater reliability of 70%, which is con-sidered an adequate rate [67].
In total, six people assessed face validity & content validity forthe remaining items. Respondents assessed whether they thought theitem matches the construct and is necessary for the measurement ofthe construct. If 70% of the persons agreed on face validity and con-tent validity the question was accepted. When people said they wereuncertain, this would count for half 2.
All of the constructs remained with at least three items. Only forUB, two out of the three previously validated questions were accepted.The indicator measuring the number of hours was not validated. Theauthor expects this was caused by the scale which was not mentionedclearly and a small mistake in the translation to Dutch. This questionwas retranslated and inserted into the questionnaire. A minimum ofthree items per construct is acceptable as the survey can only takefive minutes and most constructs were already validated by otherauthors (see Table 4). Fourteen questions remained for the changemanagement construct.
Six persons took part in the pilot. A fake case was used for the pilot,since no companies were able to take part during the pilot period. Thecase was introduced and people were motivated to start using theMicrosoft Dynamics CRM system. A small introduction to the systemwas given and the people could practice themselves for about five toten minutes. Then the survey was conducted.
An exploratory factor analysis was done to assess convergent anddiscriminant validity. Factors were extracted with an eigenvalue higherthan 1.0. Items with same-factor factor loading > 0.60, and cross fac-tor loading of 6 0.30 were accepted as stated by Bhattacherjee (2012)[8]. For the resulting items, Cronbach’s Alpha was determined. Theresults per construct can be found in Table 5.
Different authors write about acceptable values of Cronbach’s Al-pha, starting from 0.70 [10, 79]. One of the constructs, UB, reporteda Cronbach’s Alpha lower than 0.70. The scale item about the use inhours greatly reduced the Cronbach’s Alpha value, as the indicatedthe value would be .848 without this item. This was probably causedby the pilot setting, as the participators did not know how long they
2 For example, if four out of six agree on face validity and content valid-ity, one disagrees and one is uncertain the acceptance percentage would be4/6*100+0.5*1/6*100=75%.

44 empirical validation
would normally use the system, as they used it for just five to tenminutes. This item was also not dropped because it represents one ofthe three conceptualizations of UB (see 5.5).
Table 5: Cronbach’s Alpha results of pilot
Construct Cronbach’sAlpha
TTF 0.750
PE 0.872
HT 0.762
EE 0.968
SI 0.753
FC 0.971
BI 0.966
UB 0.638
CM 0.903
9.3 survey
Because all the potential companies participating in the survey areDutch, the survey was developed in Dutch. However, after asking po-tential participating companies, not much progress was made. Afterthat, it was decided to translate the survey to English, to broaden thescope of research. All questions can be found in Appendix A.
9.4 cases
The surveys is conducted among the end users of CRM at customers ofAvanade. Moreover, different groups at LinkedIn are asked to fill inthe survey. All of the participating companies have a different imple-mentation of Microsoft Dynamics CRM. Both companies are describedbelow. Afterwards, the approach to reach people on LinkedIn is bedescribed.
9.4.1 Company X
Company X manages the contact with the hotel and catering industry,to sell its products. The department started using Microsoft DynamicsCRM in December 2013. In total, 120 employees are working with theCRM system, out of which 80 users are in the Sales division and 40
users are in the Sales Support division.The Sales people are visiting customers every day, afterwards Sales
Support submits the information to the CRM system. Sales uses the

9.4 cases 45
CRM system to retrieve customer information. It is essential that bothgroups work together to keep information up to date.
Before the employees started using the system, they got differentkinds of exercises and two days of training. Someone is available forextra help or training new users. However, at management level, thefeeling was that both parts have different perceptions of the CRM sys-tem and some users still have difficulties with using the system.
The survey is used to determine the differences in use for the twodivisions and to determine problems with user acceptance. If anyproblems are detected, measures may have to be taken.
Before the survey was accepted at Company X, some changes hadto be made to the questions. Otherwise, the employees ’would notunderstand’. The ’new’ version of the survey was also conducted atthe other company and on LinkedIn.
9.4.2 Company Y
Company Y employs about 350 to 400 persons, depending on theseason, out of whom 120 use Microsoft Dynamics CRM.
Company Y runs two implementations of CRM, one for retail andone for the hotel and catering industry. In retail, the system is mainlyused for marketing purposes in for example promotions in a super-market, while in the hotel and catering industry, the system is usedfor contracting.
Company Y started the CRM project in the summer of 2012, the firstimplementation went live in the beginning of 2013, and the secondin October 2013. The management team was highly committed to theCRM project, as they wanted to gain insight in the potential benefitsof a new customer.
The way of working did not change with the new system, as theprocesses have stayed the same for five years already. Many of theusers already work with a CRM for about three to seven years. Nospecific trainings have been provided to the users, as it was ’just’ adifferent system and nothing else changed. The CRM system is theonly system the users work with.
Before a new functionality of a CRM system is implemented, theemployees work with a paper prototype for some time. When thisfits their needs, it is implemented in the system.
9.4.3 LinkedIn
As mentioned 9.3, the survey is translated to English. This way, thesurvey could be posted on LinkedIn. In different Microsoft DynamicsCRM groups, the author asked twice to fill in the English version of thesurvey. The following groups we asked to take part in the research.
46 empirical validation
• Dynamics CRM User Group (CRMUG) 3
• Microsoft Dynamics CRM. 4
• MS Dynamics CRM 5
3 https://www.linkedin.com/groups?gid=1224317
4 https://www.linkedin.com/groups?gid=21231
5 https://www.linkedin.com/groups?gid=114154

Part IV
D ATA A N A LY S I S

10R E S U LT S O F T H E C R M S U RV E Y
In this chapter, the results of the survey is discussed, as well as va-lidity, reliability and significance. Since Partial Least Squares (PLS)Partial Least
Squares allows to test a model with several interaction terms, PLS is used totest the proposed model [23]. SmartPLS is used in combination withthe method of Wong (2013) to assess validity and reliability as well asthe significance of various models [86, 74]. SmartPLS is also used byVenkatesh et al. (2012) [82].
In Chapter 9, Cronbach’s alpha was calculated for assessing inter-nal consistency reliability. However in this variant of PLS (PLS-SEM),composite reliability is found to be a better measure for internal con-sistency reliability [5], as it "prioritizes indicators according to theirindividual reliability" [42].
10.1 reliability and validity
In this section, the reliability and validity of the survey are assessed.The method of Wong (2013) is primarily used for this purpose, aswell as the paper of Venkatesh et al. (2012), to cover all aspects ofreliability and validity [86, 82].
10.1.1 Indicator reliability
According to Hulland (1999), indicator reliability should be higherthan 0.4, but preferably higher than 0.7 [46]. In Table 6, indicator reli-ability can be found. The results of indicator reliability suggest thereare no major problems. However, indicator reliability is relatively lowfor CM and UB. In UB, this is mainly the case for hours of use andfrequency.
Table 6: Indicator reliability
CM EE FC HT BI PE SI TTF UB
C1_10 0,61 0,00 0,00 0,00 0,00 0,00 0,00 0,00 0,00
C1_12 0,70 0,00 0,00 0,00 0,00 0,00 0,00 0,00 0,00
C1_13 0,63 0,00 0,00 0,00 0,00 0,00 0,00 0,00 0,00
C1_4 0,52 0,00 0,00 0,00 0,00 0,00 0,00 0,00 0,00
C1_8 0,69 0,00 0,00 0,00 0,00 0,00 0,00 0,00 0,00
E1_1 0,00 0,86 0,00 0,00 0,00 0,00 0,00 0,00 0,00
48

10.1 reliability and validity 49
Table 6: Indicator reliability
CM EE FC HT BI PE SI TTF UB
E1_3 0,00 0,86 0,00 0,00 0,00 0,00 0,00 0,00 0,00
E1_4 0,00 0,83 0,00 0,00 0,00 0,00 0,00 0,00 0,00
E1_5 0,00 0,85 0,00 0,00 0,00 0,00 0,00 0,00 0,00
E1_7 0,00 0,88 0,00 0,00 0,00 0,00 0,00 0,00 0,00
F1_2 0,00 0,00 0,87 0,00 0,00 0,00 0,00 0,00 0,00
F1_3 0,00 0,00 0,90 0,00 0,00 0,00 0,00 0,00 0,00
F1_4 0,00 0,00 0,86 0,00 0,00 0,00 0,00 0,00 0,00
H1_1 0,00 0,00 0,00 0,89 0,00 0,00 0,00 0,00 0,00
H1_2 0,00 0,00 0,00 0,90 0,00 0,00 0,00 0,00 0,00
I1_2 0,00 0,00 0,00 0,00 0,73 0,00 0,00 0,00 0,00
I1_4 0,00 0,00 0,00 0,00 0,93 0,00 0,00 0,00 0,00
P1_1 0,00 0,00 0,00 0,00 0,00 0,92 0,00 0,00 0,00
P1_2 0,00 0,00 0,00 0,00 0,00 0,92 0,00 0,00 0,00
P1_5 0,00 0,00 0,00 0,00 0,00 0,93 0,00 0,00 0,00
P1_7 0,00 0,00 0,00 0,00 0,00 0,95 0,00 0,00 0,00
S1_2 0,00 0,00 0,00 0,00 0,00 0,00 0,84 0,00 0,00
S1_4 0,00 0,00 0,00 0,00 0,00 0,00 0,88 0,00 0,00
T1_1 0,00 0,00 0,00 0,00 0,00 0,00 0,00 0,94 0,00
T1_2 0,00 0,00 0,00 0,00 0,00 0,00 0,00 0,92 0,00
U1 0,00 0,00 0,00 0,00 0,00 0,00 0,00 0,00 0,40
U2_1 0,00 0,00 0,00 0,00 0,00 0,00 0,00 0,00 0,53
U3_1 0,00 0,00 0,00 0,00 0,00 0,00 0,00 0,00 0,82
10.1.2 Internal consistency reliability
According to Bagozzi & Yi (1988), composite reliability should behigher than 0.6, and preferably higher than 0.7 [5]. The results canbe found in Table 7 in the column "Composite Reliability". The out-comes suggest the internal consistency reliability to be good, as allvalues are 0.8 or higher.
10.1.3 Convergent validity
According to Bagozzi & Yi (1988), convergent validity says the Aver-age Variance Extracted (AVE) should be higher than 0.5 [5]. As can Average Variance
Extractedbe seen in Table 7, all AVE values are above 0.5. No problem is thus

50 results of the crm survey
expected in convergent validity. Again, the values are relatively lowfor CM and UB.
Table 7: Composite reliability and AVE
CompositeReliability
AVE√AVE
CM 0,89 0,63 0,95
EE 0,97 0,86 0,98
FC 0,95 0,87 0,98
HT 0,95 0,90 0,97
BI 0,91 0,83 0,95
PE 0,98 0,93 0,99
SI 0,93 0,86 0,96
TTF 0,96 0,93 0,98
UB 0,80 0,58 0,90
10.1.4 Discriminant validity
To confirm discriminant validity, Fornell and Larcker (1981) suggestthe square root of AVE of each latent variable should be greater thanthe correlations with the other latent variables [35]. All values canbe found in Table 8. The square root of AVE can be found on theintersection of the same constructs. Discriminant validity is suggestedto be good, as all square roots of AVE are higher than the correlationswith other constructs.
Table 8: Fornell-Larcker test for discriminant validity [35]
CM EE FC HT BI PE SI TTF UB
CM 0,79
EE 0,57 0,93
FC 0,40 0,50 0,93
HT 0,49 0,66 0,40 0,95
BI 0,28 0,27 0,42 0,33 0,91
PE 0,63 0,52 0,16 0,49 0,12 0,96
SI 0,40 0,31 0,30 0,32 0,34 0,20 0,93
TTF 0,47 0,44 0,31 0,23 0,13 0,51 0,06 0,96
UB 0,21 0,29 0,04 0,33 0,15 0,20 -0,04 0,15 0,76
Discriminant validity is also assessed by determining factors’ load-ings and cross-factor loadings, which can be found in Table 10. This

10.1 reliability and validity 51
way of assessing discriminant validity is also performed by Venkateshet al. (2012) [82]. For all loadings, the construct the loading belongsto should be at least 0,1 higher than the loadings to other constructs[60, 37]. The results suggest discriminant validity is suggested to befine.
UB is operationalized using three formative indicators1, namelyhours of use per week, frequency and intensity. The outer weightscan be found in Table 9 and show especially low outer weighting forU1. Nevertheless, as suggested by Wong (2013), U1 is not droppedbecause its outer loading is significant [86].
Table 9: Outer weights of Use Behavior
Indicator Weight
U1 (Hours) -0.03
U2_1 (Frequency) 0.23
U3_1 (Intensity) 0.89
Table 10: PLS loadings and cross-loading
CM EE FC HT BI PE SI TTF UB
C1_10 0,78 0,50 0,31 0,33 0,24 0,45 0,29 0,42 0,18
C1_12 0,84 0,46 0,30 0,33 0,17 0,46 0,30 0,37 0,27
C1_13 0,79 0,43 0,40 0,48 0,36 0,51 0,44 0,36 0,26
C1_4 0,72 0,36 0,27 0,35 0,18 0,50 0,30 0,33 -0,03
C1_8 0,83 0,50 0,29 0,44 0,15 0,59 0,25 0,37 0,11
E1_1 0,54 0,93 0,41 0,58 0,20 0,55 0,28 0,41 0,34
E1_3 0,51 0,93 0,46 0,63 0,23 0,46 0,33 0,35 0,25
E1_4 0,52 0,91 0,53 0,60 0,32 0,41 0,29 0,45 0,24
E1_5 0,48 0,92 0,46 0,63 0,23 0,47 0,25 0,38 0,25
E1_7 0,59 0,94 0,47 0,60 0,26 0,54 0,28 0,45 0,24
F1_2 0,34 0,43 0,93 0,42 0,44 0,11 0,29 0,23 0,07
F1_3 0,41 0,48 0,95 0,35 0,38 0,17 0,27 0,33 -0,01
F1_4 0,36 0,51 0,93 0,36 0,36 0,16 0,27 0,32 0,06
H1_1 0,42 0,57 0,33 0,95 0,34 0,42 0,31 0,13 0,36
H1_2 0,50 0,68 0,43 0,95 0,29 0,50 0,30 0,30 0,26
I1_2 0,18 0,12 0,24 0,14 0,86 0,07 0,28 0,16 0,17
1 Formative indicators are used when the indicators of a construct are not interchange-able among each other. Reflective indicators are highly correlated and interchange-able, and try to measure the same. For more information, please check Wong (2013)[86]. In this research, only UB was modeled with formative indicators.

52 results of the crm survey
Table 10: PLS loadings and cross-loading
CM EE FC HT BI PE SI TTF UB
I1_4 0,30 0,32 0,47 0,40 0,96 0,13 0,33 0,10 0,12
P1_1 0,62 0,51 0,12 0,46 0,10 0,96 0,17 0,50 0,19
P1_2 0,58 0,47 0,11 0,43 0,08 0,96 0,15 0,47 0,21
P1_5 0,62 0,53 0,20 0,52 0,12 0,97 0,23 0,49 0,20
P1_7 0,62 0,52 0,18 0,47 0,15 0,98 0,21 0,50 0,20
S1_2 0,33 0,31 0,30 0,34 0,30 0,18 0,92 0,07 -0,03
S1_4 0,40 0,27 0,26 0,26 0,32 0,19 0,94 0,04 -0,05
T1_1 0,47 0,45 0,30 0,22 0,14 0,52 0,08 0,97 0,11
T1_2 0,43 0,40 0,30 0,22 0,11 0,47 0,04 0,96 0,18
U1 0,16 0,15 0,03 0,15 -0,03 0,15 -0,12 0,05 0,63
U2_1 0,07 0,11 0,02 0,23 0,15 0,08 -0,03 0,03 0,73
U3_1 0,23 0,34 0,05 0,33 0,16 0,23 0,00 0,20 0,90
10.1.5 Multicollinearity
Multicollinearity is the result of two formative indicators highly cor-related to each other. Small changes in one indicator may have largeimpact on the other indicator. To verify no multicollinearity exists inthis model, the formative indicators of UB have been calculated. Theresults suggest that multicollinearity is not a problem, since all Vari-ance Inflation Factor (VIF)’s are lower than 5 [42, 86].Variance Inflation
Factor
10.1.6 Common Method Variance
Common Method Variance (CMV) is assessed to make sure the modelCommon MethodVariance cannot be explained by a single factor. CMV is the ’variance that is
attributable to the measurement method rather than to the constructsthe measures represent’ [73, 54].
To test for CMV, Harman’s single factor test is conducted. The testfails if a single factor emerges from the factor analysis or one generalfactor accounts for the majority of the covariance among the variables[54]. The data passed the Harman’s single factor test, which meansno major single factor is found.
10.2 responses
In total, 127 persons participated in the survey. In Table 11, the overallresults and the results per group are provided in terms of the Mean(µ) and Standard Deviation (σ).

10.3 resulting model 53
Table 11: Results per group and total
X - Sales (30) X - S. S. (23) Y (56) Linkedin (18) All (127)
µ σ µ σ µ σ µ σ µ σ
CM 5,23 1,39 5,00 1,38 5,85 0,83 6,10 1,19 5,59 1,21
EE 4,46 1,59 4,84 1,51 5,53 1,02 5,40 1,30 5,14 1,38
FC 5,73 0,96 6,00 1,10 6,15 0,70 5,72 1,16 5,96 0,93
HT 5,03 1,50 5,11 1,37 6,19 0,66 5,36 1,74 5,60 1,32
BI 6,47 0,75 6,24 0,87 6,46 1,07 6,33 0,86 6,41 0,94
PE 2,88 1,43 2,65 1,21 4,79 1,35 5,86 1,35 4,10 1,78
SI 5,80 1,02 4,78 1,66 5,79 1,15 5,78 0,81 5,61 1,24
TTF 4,45 1,43 4,98 1,06 5,34 1,27 5,72 0,97 5,12 1,30
U-H 9,93 4,71 29,17 9,94 15,63 8,86 25,94 14,44 18,20 11,60
U-F 6,63 1,03 6,91 0,42 6,91 0,35 6,78 0,65 6,83 0,63
U-I 5,30 1,32 6,00 1,45 6,00 1,08 5,83 1,25 5,81 1,25
Exp 6,53 2,16 7,13 2,53 13,46 7,97 72,00 52,87 18,98 29,74
Age 39,47 7,41 36,43 9,47 36,43 8,22 43,00 11,70 38,08 9,22
Gndr 0,90 0,57 0,71 0,72 0,73
10.3 resulting model
The resulting model can be found in Figure 13. Significance has been testedby bootstrapping to 5000 samples. Experience has been measured as thenumber of months the user is using a CRM system, which is similar toVenkatesh et al. (2012) [82]. Gender is coded as a dummy variable, a 0 forwomen and 1 for men. The moderating effect of Experience has been nor-malized among the four participating groups to be able to compare relativeexperience.R2 can be found above each construct. Above the significant arrows, the
regression coefficient (B) is mentioned. Cohen’s f-square was calculated tocheck the effect size of the main-effect variables and the interaction terms.All found moderation effects are between low (0.02) and medium (0.15) ef-fect size. In case a moderating variable is found, the coefficient for thesemoderating variables is mentioned as well.
Three constructs which are normally moderating factors, have a directeffect. This is the case for Age on EE, Gender on FC, and Experience on HT.
The model ran twice, once without moderating effect, once with moderat-ing effects. An additional legend for Figure 13 can be found in Table 12. Theresulting model with all significant relationships can be found in Figure 13,Appendix B.
Table 12: Legend for Figure 13
Item Meaning
* p < 0.05
** p < 0.01
*** p < 0.001

54 results of the crm survey
Table 12: Legend for Figure 13
Item Meaning
X/X With/without moderation
G Gender
A Age
E Experience

10.
3r
es
ul
tin
gm
od
el
55
Figure 13: The resulting model

56 results of the crm survey
10.4 hypothesis
Each of the hypothesis developed in Chapter 8 will be confirmed or discon-firmed, based on the results.
Hypothesis 1: Change management will increase PE. As can be seen in Fig-ure 13, this hypothesis is confirmed. Moreover, gender was found to be amoderator meaning that the effect is stronger for women.
Hypothesis 2: Change management will increase EE. CM is found to have apositive relationship on EE, meaning that it is easier to work with the IS inthe case of a higher perceived CM. This relationship is moderated by Genderand Age, which implicates that for men, and older persons this effect isstronger. This hypothesis is therefore approved.
Hypothesis 3: Change management will increase SI. CM has a positive rela-tionship on SI. The effect is stronger for women and younger people. Thishypothesis is confirmed.
Hypothesis 4: Change management will increase FC. CM is determined to havea positive relation on FC. For men, this relationship is even stronger than forwomen. This hypothesis is confirmed.
Hypothesis 5: Change management will increase TTF. CM is found to have anincreasing effect on TTF. The older the person, the stronger this relationship.This hypothesis is approved.
Hypothesis 6(a): Habit will not influence BI and UB for people with less experi-ence. This hypothesis cannot be confirmed or dis-confirmed. In the develop-ment of UTAUT, Venkatesh et al. (2003) studied only the first six months [81].As only 31 (out of 127) of the respondents are using the CRM six months orless and four of participants use the system three months or less, the limitedexperience group is too small.
Hypothesis 6(b): Habit will have a positive influence on BI and UB for people withhigher levels of experience. A significant relationship has been found betweenHabit en UB. For older people this relationship is stronger and for personswith more experience, this relationship is less strong. Therefore, this hypoth-esis is partially confirmed.

11D I S C U S S I O N
In this chapter both the ’Hypothesized, not significant’ as well as the ’Nothypothesized, but significant’ relationships are be discussed. Furthermore,the theoretical implications, managerial implications and limitation are bedescribed.
11.1 hypothesized, not significant
All of the six expected, but insignificant relationships are connected to BI
or UB. Not much variance is found in BI, as can be seen in Table 13. Themajority of participants (totally) agreed on having the BI to use. This is un-derstandable as the users have no choice to work with a system other thanthe CRM system. Working with the IS is one of their tasks, and no other IS
suffices the requirements of the tasks. This low variance may have resultedin difficulties finding relationships with BI and UB.
Table 13: Five-number summary of intention
Minimum 1
Quartile 1 6
Median 7
Quartile 3 7
Maximum 7
For predicting UB, another problem arose. The participants in the surveyhave different tasks, and consequently use other functionalities of the CRM
system. Some may even be contracted to work with the system all day andfor others, working with the system is a secondary task. Therefore, not allconceptualizations of UB, such as the number of hours, may be the bestindicator of UB for CRM.
Furthermore, this study was not longitudinal as many other researches inthe field [81, 82, 57]. This may have caused problems in finding relationships,as BI also focuses on future UB.
Thirdly, a low variance was found in the frequency of usage, as can beseen in Table 14. A frequency of 7 corresponds to use ’Several times a day’.This low variance may have resulted in difficulties finding relationships,similar as for BI.
Table 14: Five-number summary frequency of use
Minimum 2
Quartile 1 7
Median 7
Quartile 3 7
Maximum 7
57

58 discussion
As can be seen in Figure 8, less moderating effects have been found thanin UTAUT and UTAUT 2. This may be due to the reasons mentioned earlierin this section. All the expected, but non-significant relationships will bediscussed in the next subsection.
11.1.1 Behavioral intention -> Use behavior
BI may not have had a significant effect on UB because in this research, par-ticipants in the survey have different tasks. Someone may have the full in-tention to work with the system, but only needs the system one hour a weekto fulfill the tasks. On the other hand, the intention may be irrelevant if theperson has to work with the system 40 hours a week anyway.
In previous studies, on which the proposed model is based, mostly alongitudinal survey was done [81, 82, 57]. In this research, a survey wasfilled in at one moment in time, to take a so called ’snapshot’. As BI focuseson future UB and use is only measured at one point in time, this might haveresulted in insignificance.
Furthermore, Limayem et al. (2007) admit circumstances might exist inwhich BI cannot be regarded as reliable predictor of UB, which is confirmedby Warsaw & David (1984) [57, 84]. This context of fully obliged usage inCRM context might create the circumstances in which BI is insignificant forpredicting UB.
11.1.2 Performance expectancy -> Behavioral intention
Pai & Tu (2011) also showed no significant relationship between PE and BI
[69]. This insignificance is explained by the fact that the "system dawns noapparent effect regarding performance merit bonus or promotion matters".For the cases handled in this thesis, the same applies. In none of the cases,the KPIs and bonuses of the users are directly related to the use of the CRM
system.Moreover, Venkatesh et al. (2003) expected the effect of PE on BI would
be stronger for men and younger workers [81]. However, in their paper noaverage age is mentioned. In Venkatesh et al. (2012), the average age was 30
[82]. In this research, the average age is 38, which may be a reasons why PE
did not have a significant effect on BI.
11.1.3 Effort expectancy -> Behavioral intention
As can be seen in Table 11, the average experience is at least 6,5 months andthe overall average experience is 19 months. Venkatesh et al. (2003) expectedthis relationship would only exist for users with limited experience [81]. Asonly a small group used a CRM system for six months or less, which is thescope of Venkatesh et al. (2003), this might be the reason why no relationshipwas found between EE and BI.
11.1.4 Task technology fit -> Behavioral intention
Pai & Tu (2011) established a significant influence of TTF on BI in a CRM
context. According to them, the user is more willing to use the CRM system

11.2 not hypothesized, but significant 59
if it ’can handle business issues for user’ [69]. This relationship was notfound in this research.
The relationship between TTF and BI can be questioned. In case a certaintasks requires the CRM system, it does not matter how well the technologyfits to the tasks, as the task has to be done anyway. Therefore, no relationshipbetween BI and TTF is required.
Moreover, BI also has a focus on future UB, as discussed earlier, and TTF isabout present use. This may cause in insignificant relationship between TTF
and BI as well.
11.1.5 Habit -> Behavioral intention
No significant effect of HT on BI is found. This indicates that there is noevidence the variance in HT can predict variance in BI. As discussed earlier,this may be due to the low variance in BI.
Furthermore, just as the relationship between BI and UB, BI is also aboutfuture use and HT is about the current situation. As the measurements havetaken place at only one point in time, this might have weakened the rela-tionship as well.
In a fully mandatory setting, the relationship between HT and BI is nottested. In the previous studies of HT, on which this research is based on,usage was voluntary [82, 57]. The relationship suggests that in a mandatorysettings, it is not BI which is relevant for performing a tasks, but it is HT.
11.1.6 Facilitating condition -> Use behavior
No significant relationship has been found between FC and UB. This may bedue to a shift in the content of the indicators in the survey.
Venkatesh et al. (2003) used the following questions for FC:
1. I have the resources necessary to use the system.
2. I have the knowledge necessary to use the system.
3. The system is not compatible with other systems I use.
4. A specific person (or group) is available for assistance with systemdifficulties.
In this research the following questions were used for FC:
1. There is a person or group available to help with difficulties regardingin the CRM system.
2. If I need help with the CRM system, I can get it.
3. I get support with using the CRM system.
This shift towards support is caused by the introduction of CM in UTAUT.As knowledge is operationalized as an important factor of change manage-ment, these questions could not be used for FC.
11.2 not hypothesized, but significant
In this section, the unexpected, but found significant effects will be listedand explained.
60 discussion
11.2.1 Task technology fit -> Performance expectancy
The effect of TTF on PE, which was found in this study, was not found by Pai& Tu (2011) [69]. However, it can be argued that when a certain task fits tothe technology, the performance of a user increases. When, for example, theuser needs less clicks to do a certain tasks, or the system fills in a large partof the form automatically, job performance can increase.
11.2.2 Performance expectancy -> Habit
PE was found to facilitate an increasing HT. Moreover, this relation is strongerfor women and less experienced users. This may be the case if someone feelsthe CRM system increases his or her performance, the person might be morewilling to use the system and build a HT in using the system.
11.2.3 Effort expectancy -> Habit
EE was found to have a strong positive effect on HT. The easier it is to workwith the system, the less effort and thinking a user has to put in workingwith the system and to perform a certain tasks. The effect is even strongerfor men. Empirical evidence suggests if not much of effort is needed, theeasier performing certain tasks becomes a HT.
11.2.4 Experience -> Habit
Experience was found to have a direct effect on HT. As mentioned in 5.3.1,HT is defined as ’the extent to which people tend to perform behavior (useIS) automatically because of learning’. When people gain more experiencein using the CRM system, they learn to work with the CRM and build a HT.
11.2.5 Age -> Effort
Age was found to have a direct effect on EE. The older a person gets, themore time this person needs to work with the system. In the model ofVenkatesh et al. (2003), age was a moderating variable in the relationshipof EE on BI [81]. Resultingly, it might not be unexpected that age was foundto have a direct effect on EE.
11.2.6 Gender -> Facilitating conditions
Venkatesh et al. (2012) found the effect of FC on BI to be stronger for womenthan for men [82]. In this investigation, gender was found to have a directsignificant influence on FC. In this research the relationship is stronger forwomen as well. Again, it may not be surprising Gender was found to havea direct effect on FC.
11.2.7 Facilitating conditions -> Behavioral intention
The relationship from FC to BI was also found in the research of Venkateshet al. (2012) [82]. Nonetheless, age, gender, and experience were moderating
11.3 results discussion company x and company y 61
the effect of FC on BI. In this research, the moderating effects were not found,but gender was found to directly influence FC.
11.3 results discussion company x and company y
The results of the survey have been discussed with company X and companyY. At both companies it was suggested to further improve EE and PE, basedon the results at Company X and the comments of Company Y. CompanyX was informed about a new mobility project at Company Y. Furthermore,both companies should invest in a user friendly Knowledge Base. The mea-sures to implement all of this are still to be discussed with both companies.
11.4 theoretical contributions
A major contribution of this research is the addition and operationalizationof CM to UTAUT. CM is defined as "the extent to which an employee hasthe awareness, desire, knowledge, ability and reinforcement to change anduphold behavior, attitude & skills". Empirical evidence suggests CM has asignificant influence on EE, PE, TTF, SI, FC. Future work might focus on whatmethods work best to increase perceived CM and how to best manage thechange to a new IS.
Moreover, the resulting model gives insight in how HT can be explained.HT is found as a central construct in the model, with a predictability of 56%.HT can directly be facilitated by increasing PE, EE, and indirectly via TTF andCM. Future work can focus on expanding the knowledge about creating aHT en whether it also applies to other parts of the IS field.
Furthermore, user acceptance research might discuss whether studyingand predicting UB is the ultimate goal. In an organizational context, the ulti-mate goal of a system is increase job performance and make the organizationas efficient and effective as possible [26, 44]. UB does not fully cover this goal,as a higher level of UB might not mean higher efficiency and effectiveness.HT might be a better subject of study, as it shows whether or not the useris able to work with the IS, and working with the IS feels natural. Having aHT might implicate that a user is using the system when the organizationis better off. Studying HT over UB also helps in making the research moreapplicable to the business. HT is more general and can be compared withusers of another IS. For UB, the measurements such as hours of use, intensityand frequency depend on users’ tasks.
This research has shown that not under all circumstances BI is able topredict UB. The may be due to the fully mandatory setting, or because themeasurements were not taken in a longitudinal way. Furthermore, partici-pants have different tasks which require others amounts of UB. As BI hasfound to be an important predictor in many other researches [81, 82, 57],future research might look into this non-significant relationship.
11.5 limitations and future research
Generalizability is one of the limitations of this research, since the focus ison the field of CRM only and the surveys have taken place at two differentcompanies in the same sector as well as CRM users on LinkedIn. However, asthe study was quite broad in the sense that participants have different kindof tasks, the research may be relevant to other field than just CRM.

62 discussion
Secondly, the average age in this research is 38. The finding may not applyfor people and groups significantly older than 38. This issue is also reportedby Venkatesh et al. (2012) [82]. The difference in age may be an interestingtopic for future research.
In addition, all measurements are sell-reported. For all constructs thismight mean that the ’actual’ truth is not reflected. For the operationaliza-tion of UB in particular, UB can only be used as a more relative measurethan an exact measure, as mentioned in section 5.5. To further improve theaccuracy of the UB measurements, future research may look into the opera-tionalization of UB related to users’ tasks. This addition is also suggested byBurton-Jones & Straub (2006) [18].
Also, quite a large difference in number of participants exists in this studyand for example the study of Venkatesh et al. (2012) [82]. This research wasbuilt upon 127 participants, versus 1512 in Venkatesh et al. (2012). This isa large difference and might not uncover small differences in moderatingeffects. However, Venkastesh et al. (2003) also had a similar number of par-ticipants (119) [81].
Fifth, this is research contributes to further uncovering HT. In this researchthe variance of HT was found to be predictable with 56%, by EE and PE,through TTF and CM. The limitation is however the CRM context as well asthe number of participants. Future research should show the generalizabilityof the further uncovered HT.
Finally, future research should also focus on how individual contribu-tion to organization’s efficiency and effectiveness can best be measured. Anincreased UB might not lead to higher efficiency or effectiveness of the orga-nization. Increased use might also mean that someone has more trouble inusing the IS.
11.6 managerial implications
This research shows that CM does matter for User Acceptance of CRM sys-tems. Through effective CM more IT projects can be successful. CM shows tohave a significant positive effect on TTF, PE, EE, SI, and FC. This means CM
is a useful method to help users adopt to a CRM system. It is essential forcompanies to be aware of the fact that CM is relevant for IS success.
Creating a HT for using the IS may be the ultimate goal of the CM process,as the goal of an IS is to increase job performance, organization’s efficiencyand effectiveness [26, 44]. HT seems to better fit the goal of IS than UB, as themeasures for UB are difficult to define since employees use different featuresof a CRM system and have different task. HT might implicate that the systemis used when it can increase job performance, organizations’ efficiency andeffectiveness.
Based on the results of the survey, the focus of CM should be on EE and PE,as main predictors of HT. Also, TTF should be taken into account, in orderto ensure PE. A simplified model is proposed in Figure 14. The model andcorresponding survey can be used to measure the progress of an IT project,in terms of HT and its predictors. The survey can take place at one momentin time, in contrast to a longitudinal study which is done in research field[81, 82, 57]. The results can be used to steer projects towards a success.

11.6 managerial implications 63
Figure 14: Stripped research model, applicable for practice

12C O N C L U S I O N
The lack of user acceptance has long been and still is a major barrier forthe success of new Information Systems (IS) [26, 41, 62, 68]. The goal ofInformation Systemsmost organizationally focused IS is to improve efficiency, effectiveness, andemployees’ job performance [26, 44]. However, when users reject the IS thisgoal will not be accomplished or the results will become insignificant [26].Change Management (CM) will help changing organizations to cope withChange
Management changing attitudes, skills and behavior, needed for new IS. Through CM,people become aware of the need for change. This leads to a decreasedresistance to the new IS and an increase of user acceptance. The goal of thisresearch is to find out to what extent CM contributes to Customer Relation-ship Management (CRM) user acceptance.Customer
RelationshipManagement CM is defined as "the extent to which an employee has the awareness, de-
sire, knowledge, ability and reinforcement to change and uphold behav-ior, attitude & skills". The relationships of CM with the other constructs ismoderated by Age and/or Gender. The current study shows that CM has asignificant influence on the concept of user acceptance, in terms of the Task-Technology Fit (TTF), Effort Expectancy (EE), Performance Expectancy (PE),Task-Technology Fit
Effort Expectancy
PerformanceExpectancy
Social Influence (SI), and Facilitating Conditions (FC), as discussed in 11.4.
Social Influence
FacilitatingConditions
CM influences the predictors of Use Behavior (UB) and Habit (HT).
Use BehaviorHabit
UB is indirectly influenced by CM, via HT, EE, PE and TTF. A central con-struct in this study is HT, which can be predicted for 56% by PE, EE, andExperience. HT is suggested as ultimate goal in organizations’ system imple-mentation, as it is unrelated to the tasks of the user. Moreover, a higher levelof UB, which is a central construct in earlier research, does not necessarilylead to a more efficient en effective organization.
To find the previously mentioned relationships, a field survey is con-ducted among the end users of different implementations of the CRM sys-tems, based on Microsoft Dynamics CRM. These end users are reached throughtwo companies and through LinkedIn. In total, 127 CRM users participatedin the research.
Since only the CRM end users at two companies and CRM end users atLinkedIn participated in the study, generalizability is one of the main limita-tions of this research. This is also described in 11.5. Future research shoulddetermine whether the same results apply to other implementations of CRM
and other IS.Secondly, all measurements are sell-reported. For all constructs this might
mean that the ’actual’ truth is not reflected. To further improve the accuracyof the UB measurements in particular, future research may look into theoperationalization of UB related to users’ tasks.
Thirdly, this research contributes to further explain HT. The variance inHT is found to be predictable for 56%. The limitation is however the CRM
context as well as the number of participants. Future research should showthe generalization of the further explained HT.
64

conclusion 65
Finally, future research should focus on how individual contribution toorganizations efficiency and effectiveness can best be measured. As an in-creased UB might not lead automatically to higher efficiency or effectivenessof the organization.
It is important for businesses to recognize CM as a crucial part of IS imple-mentation, as discussed in 11.6. To support this goal, a simplified model isproposed for the businesses, to gain insight in their CM process and corre-sponding PE, EE, TTF and HT.
As the goal of an IS is to increase job performance, organization’s effi-ciency and effectiveness [26, 44], creating a HT seems to be essential. HT
better fits the goal of IS than UB, as the measures for UB are difficult to definesince employees use different features of a CRM system and have differenttasks.
The focus of CM should be on EE and PE. Also, TTF should be taken intoaccount, in order to ensure PE. A simplified model is proposed in Figure 14.The model and corresponding survey can be used to measure the progressof an IT project, in terms of HT and its predictors. The results of the surveycan be used to steer IT projects towards success.

Part V
A P P E N D I X

AVA L I D AT E D S U RV E Y Q U E S T I O N S A N D A N S W E R S
Table 15: Survey questions
Dutch English
Gen.
Geslacht Gender
Leeftijd Age
Ervaring Experience
CM
C1_4 Ik weet waarom de organisatiebeter wordt van het nieuweCRM-systeem.
I know why the organization isbe better off with the new CRMsystem.
C1_8 De (voorgestelde) verandering,met daarin het nieuwe CRM-systeem, bevalt me.
The (proposed) change, includ-ing the new CRM system,pleases me.
C1_10
1
Ik kan mijn houding, gedrag envaardigheden ontwikkelen naarwat het CRM-systeem vereist.
I can develop my attitude, be-havior and skills to what theCRM system requires.
C1_12 Ik kan mijn gedrag envaardigheden zo ontwikke-len dat ik het CRM-systeem kangebruiken.
I can develop my behavior andskills so that I can use the CRMsystem.
C1_13 Ik word gemotiveerd om mijnvaardigheden en gedrag verderte ontwikkelen zodat ik hetCRM-systeem blijf gebruiken.
I am motivated to develop myskills and behavior such that Icontinue to use the CRM sys-tem.
EE
E1_1 Ik vind het CRM-systeemmakkelijk om te gebruiken.
I find it easy to use the CRM sys-tem.
E1_3 Ik hoef niet veel moeite te doenom het CRM-systeem te ge-bruiken.
I don’t need to put much effortinto using the CRM system.
E1_4 Het werken met het CRM-systeem is duidelijk en begri-jpelijk.
Working with the CRM systemis clear and understandable.
E1_5 Het is makkelijk voor mijom met het CRM-systeem tewerken.
It’s easy for me to work with theCRM system.
1 Based on the feedback of Company X, ’benodigdheden’ was changed to ’vereist’.
67
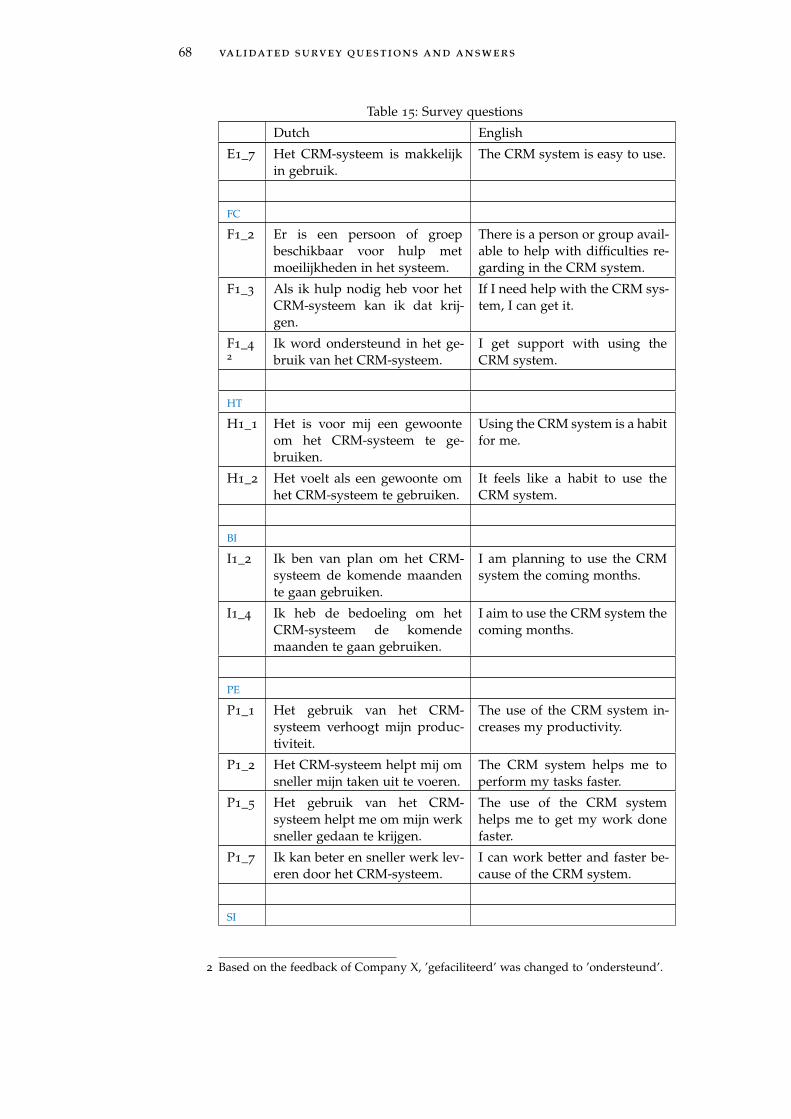
68 validated survey questions and answers
Table 15: Survey questions
Dutch English
E1_7 Het CRM-systeem is makkelijkin gebruik.
The CRM system is easy to use.
FC
F1_2 Er is een persoon of groepbeschikbaar voor hulp metmoeilijkheden in het systeem.
There is a person or group avail-able to help with difficulties re-garding in the CRM system.
F1_3 Als ik hulp nodig heb voor hetCRM-systeem kan ik dat krij-gen.
If I need help with the CRM sys-tem, I can get it.
F1_4
2
Ik word ondersteund in het ge-bruik van het CRM-systeem.
I get support with using theCRM system.
HT
H1_1 Het is voor mij een gewoonteom het CRM-systeem te ge-bruiken.
Using the CRM system is a habitfor me.
H1_2 Het voelt als een gewoonte omhet CRM-systeem te gebruiken.
It feels like a habit to use theCRM system.
BI
I1_2 Ik ben van plan om het CRM-systeem de komende maandente gaan gebruiken.
I am planning to use the CRMsystem the coming months.
I1_4 Ik heb de bedoeling om hetCRM-systeem de komendemaanden te gaan gebruiken.
I aim to use the CRM system thecoming months.
PE
P1_1 Het gebruik van het CRM-systeem verhoogt mijn produc-tiviteit.
The use of the CRM system in-creases my productivity.
P1_2 Het CRM-systeem helpt mij omsneller mijn taken uit te voeren.
The CRM system helps me toperform my tasks faster.
P1_5 Het gebruik van het CRM-systeem helpt me om mijn werksneller gedaan te krijgen.
The use of the CRM systemhelps me to get my work donefaster.
P1_7 Ik kan beter en sneller werk lev-eren door het CRM-systeem.
I can work better and faster be-cause of the CRM system.
SI
2 Based on the feedback of Company X, ’gefaciliteerd’ was changed to ’ondersteund’.

validated survey questions and answers 69
Table 15: Survey questions
Dutch English
S1_2 Mensen die ik belangrijk vind,vinden dat ik het CRM-systeemmoet gebruiken.
People who I find important,think I should use the CRM sys-tem.
S1_4 Als ik het CRM-systeem ge-bruik, vinden de mensen die ikbelangrijk vind dat fijn.
When I use the CRM system,the people who I find importantappreciate that.
TTF
T1_1
3
De functionaliteiten van hetCRM-systeem zijn passend.
The functionalities of the CRMsystem are suitable.
T1_2 De functionaliteiten van hetCRM-systeem zijn geschikt.
The functionalities of the CRMsystem are appropriate.
UB
U1 Hoeveel uren per week gebruiktu het systeem gemiddeld (Uit-gaande van een 40-urige werk-week)?
On average, how many hoursper week do you use the sys-tem average (assuming a 40-hour week)?
U2_1 Hoe vaak gebruikt u het sys-teem?
How often do you use the sys-tem?
U3_1 Hoe intensief gebruikt u hetCRM-systeem?
How do you consider the extentof your current system use?
Table 16: Survey answers
Question Value Dutch English
Gender
0 Vrouw Female
1 Man Male
Mostly
1 Helemaal mee oneens Strongly disagree
2 Mee oneens Disagree
3 Een beetje mee oneens Somewhat disagree
4 Niet mee oneens/nietmee eens
Neither agree or disagree
5 Een beetje mee eens Somewhat agree
6 Mee eens Agree
7 Helemaal mee eens Strongly agree
3 Based on the feedback of Company X, ’adequaat’ was changed to ’passend’.
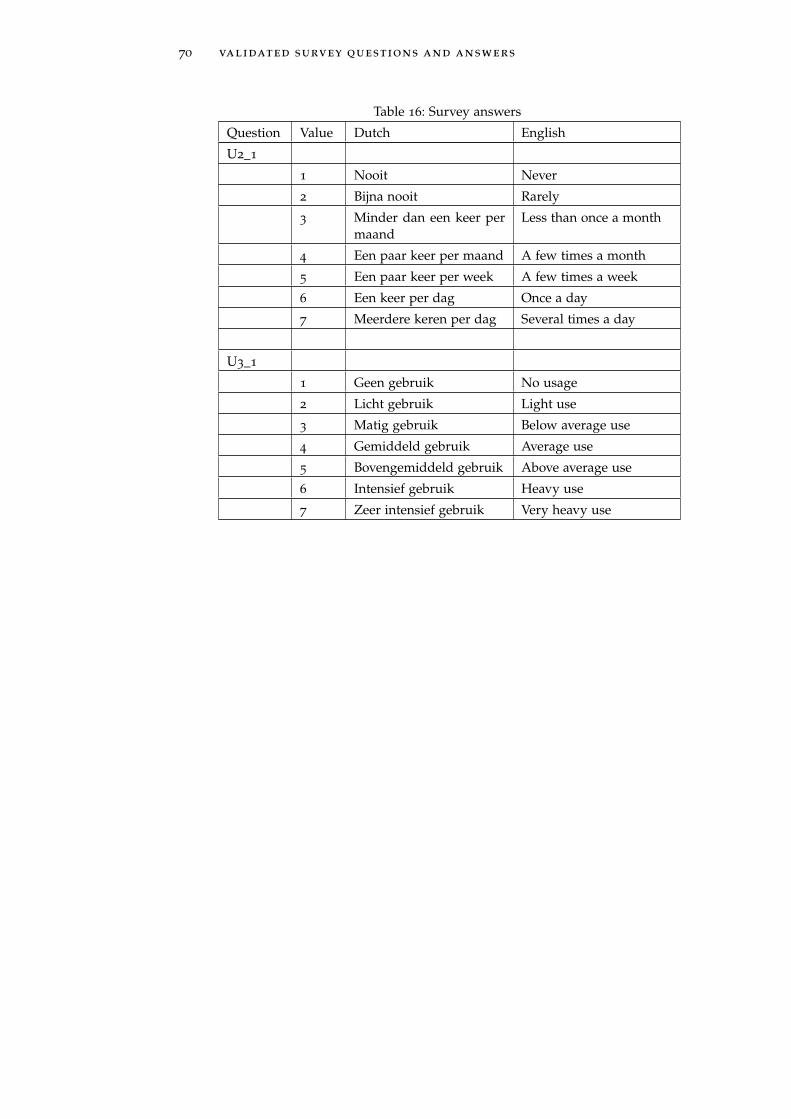
70 validated survey questions and answers
Table 16: Survey answers
Question Value Dutch English
U2_1
1 Nooit Never
2 Bijna nooit Rarely
3 Minder dan een keer permaand
Less than once a month
4 Een paar keer per maand A few times a month
5 Een paar keer per week A few times a week
6 Een keer per dag Once a day
7 Meerdere keren per dag Several times a day
U3_1
1 Geen gebruik No usage
2 Licht gebruik Light use
3 Matig gebruik Below average use
4 Gemiddeld gebruik Average use
5 Bovengemiddeld gebruik Above average use
6 Intensief gebruik Heavy use
7 Zeer intensief gebruik Very heavy use

BR E S U LT I N G M O D E L O N LY S I G N I F I C A N T
Figure 15: The resulting model, only significant relationships
71


B I B L I O G R A P H Y
[1] Ajzen, I. Residual Effects of Past on Later Behavior: Habituation andReasoned Action Perspectives. Personality and Social Psychology Review6, 2 (May 2002), 107–122.
[2] Argyris, C. Intervention Theory and Method: A Behavioural Science View.Addison-Wesley, 1970.
[3] Arnold, J., Silvester, J., Patterson, F., Robertson, I., Cooper, C.,and Burnes, B. Work Psychology: Understanding Human Behaviour in theWorkplace. Financial times management. Prentice Hall/Financial Times,2005.
[4] Avlonitis, G. J., and Panagopoulos, N. G. Antecedents and conse-quences of CRM technology acceptance in the sales force. IndustrialMarketing Management 34, 4 (May 2005), 355–368.
[5] Bagozzi, R. P., and Yi, Y. On the evaluation of structural equationmodels. Journal of the Academy of Marketing Science 16, 1 (Mar. 1988),74–94.
[6] Balogun, J., and Hope Hailey, V. Exploring strategic change. PearsonEducation, 2008.
[7] Bamford, D. R., and Forrester, P. L. Managing planned and emergentchange within an operations management environment. InternationalJournal of Operations & Production Management 23, 5 (2003), 546–564.
[8] Bhattacherjee, A. Social Science Research: principles, methods, andpractices, 2012.
[9] Blair, E., and Burton, S. Cognitive Processes Used by Survey Respon-dents to Answer Behavioral Frequency Questions. Journal of ConsumerResearch 14, 2 (Sept. 1987), 280.
[10] Bland, J. M., and Altman, D. G. Statistics notes: Cronbach’s alpha.BMJ 314, 7080 (Feb. 1997), 572–572.
[11] Brohman, M. K., Watson, R. T., Piccoli, G., and Parasurama, A.Data completeness. Communications of the ACM 46, 6 (June 2003), 47.
[12] Brown, S., and Venkatesh, V. Model of adoption of technology inhouseholds: A baseline model test and extension incorporating house-hold life cycle. MIS quarterly 29, 3 (2005), 399–426.
[13] Buchanan, D., and Storey, J. Role-taking and role-switching in orga-nizational change: the four pluralities. Innovation, organizational changeand technology (1997), 127–145.
[14] Bullock, R. J., and Batten, D. It’s just a phase we’re going through:a review and synthesis of OD phase analysis. Group & OrganizationManagement 10, 4 (1985), 383–412.
[15] Burnes, B. Managing change and changing managers from ABC toXYZ. Journal of Management Development 22, 7 (2003), 627–642.
73

74 bibliography
[16] Burnes, B. Kurt Lewin and the Planned Approach to Change: A Re-appraisal. Journal of Management Studies 41, 6 (Sept. 2004), 977–1002.
[17] Burnes, B. Managing Change: A Strategic Approach to Organisational Dy-namics. Prentice Hall/Financial Times, 2004.
[18] Burton-Jones, A., and Straub, D. W. Reconceptualizing System Us-age: An Approach and Empirical Test. Information Systems Research 17,3 (Sept. 2006), 228–246.
[19] By, R. T. Organisational change management: A critical review. Journalof Change Management 5, 4 (Dec. 2005), 369–380.
[20] By, R. T., Burnes, B., and Oswick, C. Change Management: The RoadAhead. Journal of Change Management 11, 1 (Mar. 2011), 1–6.
[21] Chalmeta, R. Methodology for customer relationship management.Journal of Systems and Software 79, 7 (July 2006), 1015–1024.
[22] Chen, Q., and Chen, H.-M. Exploring the success factors of eCRMstrategies in practice. Journal of Database Marketing & Customer StrategyManagement 11, 4 (July 2004), 333–343.
[23] Chin, W. W., Marcolin, B. L., and Newsted, P. R. A Partial LeastSquares Latent Variable Modeling Approach for Measuring InteractionEffects: Results from a Monte Carlo Simulation Study and an Electronic-Mail Emotion/Adoption Study. Information Systems Research 14, 2 (June2003), 189–217.
[24] Cummings, T. G., and Huse, E. F. Organization Development and Change.West series in management. West Publishing Company, 1985.
[25] Davis, F. D. Perceived Usefulness, Perceived Ease of Use, and UserAcceptance of Information Technology. MIS Quarterly 13, 3 (Sept. 1989),319.
[26] Davis, F. D. User acceptance of information technology: system charac-teristics, user perceptions and behavioral impacts. International Journalof Man-Machine Studies 38, 3 (Mar. 1993), 475–487.
[27] Davis, F. D., Bagozzi, R. P., and Warshaw, P. R. User Acceptanceof Computer Technology: A Comparison of Two Theoretical Models.Management Science 35, 8 (Aug. 1989), 982–1003.
[28] Dawson, P. Organizational Change. Human Resource Management se-ries. SAGE Publications, 1994.
[29] Dawson, P. Reshaping Change: A Processual Perspective. Understandingorganizational change. Routledge, 2003.
[30] DeLone, W. H., and McLean, E. R. Information Systems Success: TheQuest for the Dependent Variable. Information Systems Research 3, 1
(Mar. 1992), 60–95.
[31] Desisto, R. P. Hype Cycle for CRM Sales, 2013. Tech. Rep. August,Gartner, Inc., 2013.
[32] Dishaw, M. T., and Strong, D. M. Extending the technology accep-tance model with task technology fit constructs. Information & Manage-ment 36, 1 (July 1999), 9–21.

bibliography 75
[33] Erskine, P. ITIL and Organizational Change. It Governance Limited,2013.
[34] Finnegan, D. J., and Currie, W. L. A multi-layered approach to CRMimplementation: An integration perspective. European Management Jour-nal 28, 2 (Apr. 2010), 153–167.
[35] Fornell, C., and Larcker, D. F. Evaluating structural equation mod-els with unobservable variables and measurement error. Journal of mar-keting research (1981), 39–50.
[36] Galbraith, J. R. The role of formal structures and processes. Breakingthe code of change (2000), 139–160.
[37] Gefen, D., and Straub, D. A practical guide to factorial validity us-ing PLS-Graph: Tutorial and annotated example. Communications of theAssociation for Information systems 16 (2005), 91–109.
[38] Giachetti, R. E. A framework to review the information integrationof the enterprise. International Journal of Production Research 42, 6 (Mar.2004), 1147–1166.
[39] Gibson, J. J. The theory of affordances In RE Shaw & J. Bransford (eds.)Perceiving, Acting, and Knowing, 1977.
[40] Goodhue, D. L., and Thompson, R. L. Task-Technology Fit and Indi-vidual Performance. MIS Quarterly 19, 2 (June 1995), 213.
[41] Gould, J. D., Boies, S. J., and Lewis, C. Making usable, useful,productivity-enhancing computer applications. Communications of theACM 34, 1 (1991), 74–85.
[42] Hair, J. F., Sarstedt, M., Ringle, C. M., and Mena, J. a. An assess-ment of the use of partial least squares structural equation modelingin marketing research. Journal of the Academy of Marketing Science 40, 3
(June 2011), 414–433.
[43] Hartley, C., Brecht, M., Pagerey, P., Weeks, G., Chapanis, A., and
Hoecker, D. Subjective time estimates of work tasks by office workers.Journal of Occupational Psychology 50, 1 (Mar. 1977), 23–36.
[44] Hevner, A. R., March, S., Park, J., and Ram, S. Design science ininformation systems research. MIS quarterly 28, 1 (2004), 75–105.
[45] Hiatt, J. ADKAR: A Model for Change in Business, Government, and OurCommunity. Prosci Learning Center Publications, 2006.
[46] Hulland, J. Use of partial least squares (PLS) in strategic managementresearch: a review of four recent studies. Strategic Management Journal20, 2 (Feb. 1999), 195–204.
[47] Kanter, R., Stein, B., and Jick, T. The Challenge of organizationalchange : how companies experience it and leaders guide it. Free PressMaxwell Macmillan Canada Maxwell Macmillan International, NewYork Toronto New York, 1992.
[48] Karahanna, E., Straub, D., and Chervany, N. Information tech-nology adoption across time: A cross-sectional comparison of pre-adoption and post-adoption beliefs. MIS quarterly 23, 2 (1999), 183–213.
[49] Katsma, C. An organizational change approach for enterprise system imple-mentations. University of Twente, 2008.

76 bibliography
[50] Kim, S. S., Malhotra, N. K., and Narasimhan, S. Research Note TwoCompeting Perspectives on Automatic Use: A Theoretical and Empiri-cal Comparison. Information Systems Research 16, 4 (Dec. 2005), 418–432.
[51] King, S. F., and Burgess, T. F. Understanding success and failure incustomer relationship management. Industrial Marketing Management37, 4 (June 2008), 421–431.
[52] Kotter, J. Leading change: Why transformation efforts fail. Harvardbusiness review (1995).
[53] Kotter, J. P., and Schlesinger, L. A. Choosing strategies for change.Harvard business review 86, 7/8 (2008), 130.
[54] Krishnaveni, R., and Deepa, R. Controlling Common Method Vari-ance while Measuring the Impact of Emotional Intelligence on Well-being. VIKALPA 38, 1 (2013), 41–47.
[55] Kruithof, E. J. D., and Poll, H. K. Systeem Implementatie Methode.Academic Service, 1991.
[56] Lewin, K. Frontiers in Group Dynamics: Concept, Method and Realityin Social Science; Social Equilibria and Social Change. Human Relations1, 1 (June 1947), 5–41.
[57] Limayem, M., Hirt, S., and Cheung, C. How habit limits the predictivepower of intention: the case of information systems continuance. MisQuarterly 31, 4 (2007), 705–737.
[58] Limayem, M., and Hirt, S. G. Force of Habit and Information Sys-tems Usage: Theory and Initial Validation. Journal of the Association forInformation Systems 4 (2003).
[59] Lin, T.-C., and Huang, C.-C. Understanding knowledge managementsystem usage antecedents: An integration of social cognitive theory andtask technology fit. Information & Management 45, 6 (Sept. 2008), 410–417.
[60] Lowry, P. B., and Gaskin, J. Partial Least Squares (PLS) StructuralEquation Modeling (SEM) for Building and Testing Behavioral CausalTheory: When to Choose It and How to Use It. IEEE Transactions onProfessional Communication 57, 2 (June 2014), 123–146.
[61] Martin, R. Breaking the code of change. Observations and critique.Breaking the code of change 453 (2000), 449–473.
[62] McCarroll, T. What new age. Time 138, 12 (1991), 44–46.
[63] Mendoza, L. E., Pérez, M., and Grimán, A. Critical Success Factorsfor Managing Systems Integration. Information Systems Management 23,2 (Mar. 2006), 56–75.
[64] Miller, D. Successful change leaders: What makes them? What dothey do that is different? Journal of Change Management 2, 4 (Dec. 2001),359–368.
[65] Moody, D. L., Iacob, M.-E., and Amrit, C. In Search of Paradigms :identifying the theoretical foundations of the information system field.In 18th European Conference on Information Systems, ECIS 2010 (2010).
[66] Moran, J. W., and Brightman, B. K. Leading organizational change.Journal of Workplace Learning 12, 2 (2000), 66–74.

bibliography 77
[67] Multon, K. D. Encyclopedia of Research Design. In Encyclopedia of re-search design, N. Salkind, Ed. SAGE Publications, Inc., 2455 Teller Road,Thousand Oaks California 91320 United States, 2010, pp. 627–629.
[68] Nickerson, R. S. Why interactive computer systems are sometimes notused by people who might benefit from them. International Journal ofMan-Machine Studies 15, 4 (Nov. 1981), 469–483.
[69] Pai, J.-C., and Tu, F.-M. The acceptance and use of customer relation-ship management (CRM) systems: An empirical study of distributionservice industry in Taiwan. Expert Systems with Applications 38, 1 (Jan.2011), 579–584.
[70] Pan, S. L., and Lee, J.-N. Using e-CRM for a unified view of the cus-tomer. Communications of the ACM 46, 4 (Apr. 2003), 95–99.
[71] Pettigrew, A., and Whipp, R. Understanding the environment. Man-aging change 2 (1993), 5–20.
[72] Pettigrew, A. M. The awakening giant: Continuity and change in ImperialChemical Industries. Blackwell Oxford, 1985.
[73] Podsakoff, P. M., MacKenzie, S. B., Lee, J.-Y., and Podsakoff, N. P.Common method biases in behavioral research: a critical review of theliterature and recommended remedies. The Journal of applied psychology88, 5 (Oct. 2003), 879–903.
[74] Ringle, C., Wende, S., and Will, S. SmartPLS 2.0 (M3) Beta, 2005.
[75] Schein, E. H. Kurt Lewin’s change theory in the field and in the class-room: Notes toward a model of managed learning. Systems Practice 9,1 (Feb. 1996), 27–47.
[76] Straub, D., Limayem, M., and Karahanna-Evaristo, E. MeasuringSystem Usage: Implications for IS Theory Testing. Management Science41, 8 (Aug. 1995), 1328–1342.
[77] Swift, R. S. Accelerating Customer Relationships: Using CRM and Relation-ship Technologies. Prentice Hall PTR, 2001.
[78] Tafti, M. Analysis of factors affecting implementation of customer rela-tionship management systems. In Issues & Trends of Information Technol-ogy Management in Contemporary Organizations, M. Khosrow-Pour, Ed.Idea Group Inc (IGI), 2002.
[79] Tavakol, M., and Dennick, R. Making sense of Cronbach’s alpha.International Journal of Medical Education 2 (June 2011), 53–55.
[80] Venkatesh, V., Brown, S., Maruping, L. M., and Bala, H. PredictingDifferent Conceptualizations of System Use: The Competing Roles ofBehavioral Intention, Facilitating Conditions, and Behavioral Expecta-tion. Mis Quarterly 32, 3 (2008), 483–502.
[81] Venkatesh, V., Morris, M., Davis, G., and Davis, F. User acceptanceof information technology: Toward a unified view. MIS quarterly 27, 3
(2003), 425–478.
[82] Venkatesh, V., Thong, J., and Xu, X. Consumer acceptance and useof information technology: extending the unified theory of acceptanceand use of technology. MIS quarterly 36, 1 (2012), 157–178.

78 bibliography
[83] Verplanken, B., and Orbell, S. Reflections on Past Behavior: A Self-Report Index of Habit Strength. Journal of Applied Social Psychology 33,6 (2003), 1313–1330.
[84] Warshaw, P. R., and Davis, F. D. Self-understanding and the accuracyof behavioral expectations. Personality and Social Psychology Bulletin 10,1 (1984), 111–118.
[85] Wilson, D. C. A Strategy of Change: Concepts and Controversies in theManagement of Change. ITBP Textbooks Series. International ThomsonBusiness Press, 1992.
[86] Wong, K. Partial Least Squares Structural Equation Modeling (PLS-SEM) Techniques Using SmartPLS. Marketing Bulletin (2013).
[87] Yu, L. Successful customer-relationship management. MIT Sloan Man-agement Review (2001), 1–4.
[88] Zhou, T., Lu, Y., and Wang, B. Integrating TTF and UTAUT to explainmobile banking user adoption. Computers in Human Behavior 26, 4 (July2010), 760–767.