using cbct as a diagnostic tool for evaluation of ... · using cbct as a diagnostic tool for...
TRANSCRIPT

Virginia Commonwealth UniversityVCU Scholars Compass
Theses and Dissertations Graduate School
2014
Using CBCT as a diagnostic tool for evaluation ofinfrabony defects in vivoAnya RostVirginia Commonwealth University
Follow this and additional works at: http://scholarscompass.vcu.edu/etd
Part of the Dentistry Commons
© The Author
This Thesis is brought to you for free and open access by the Graduate School at VCU Scholars Compass. It has been accepted for inclusion in Thesesand Dissertations by an authorized administrator of VCU Scholars Compass. For more information, please contact [email protected].
Downloaded fromhttp://scholarscompass.vcu.edu/etd/3333

Using CBCT as a diagnostic tool for evaluation of infrabony defects in vivo
A thesis submitted in partial fulfillment of the requirements for the degree of Master of Science
in Dentistry at Virginia Commonwealth University.
by
Anya Rost
BS MCPHS, Boston 2006, DMD University of Connecticut 2011
Director: Thomas C. Waldrop, Professor, Director Graduate Periodontics, Department of
Periodontics
Virginia Commonwealth University
Richmond, Virginia
April 14, 2014
ii
Acknowledgment
The primary author would like to thank her husband for all the support he provided. She would
also like to thank her co-author Dr. Jessica Allen and her Research Committee of Dr. Waldrop,
Dr. Gunsolley, Dr. Rathore and Dr. Sabatini for providing both insight and oversight with this
project.

iii
Table of Contents
List of Tables………………………………….…………………………………………….……iv
List of Figures……………………………………………………………………………….…....v
Abstract……………………………………………………………….…………….………........vi
Chapter
1. Introduction………………………………………………………………………..…..…..1
2. Materials and Methods……………………………………………………..…………..….6
3. Results…………………………………………………………………………...…..…...10
4. Discussion……………………………………………………………………...……...…13
5. References………………………………………………………………………...……...18

iv
List of Tables
Table 1: ……………………………………………….…………………………………....……22
Table 2: ………………………………………………………………………………………….22
Table 3: ………………………………………………………………………………………….23
v
List of Figures
Figure 1: Schematic of the measurement locations……………………………………………...24
Figure 2: Example of a CBCT - Axial view showing architecture of the defect………………..25
Figure 3: Example of a CBCT - Measurement of the deepest point of the defect………………25
Figure 4: Example of a CBCT - Measuring distal line angle of the defect……………………...26
Figure 5: Example of a CBCT - Measuring buccal line angle of the defect…………………….26
Figure 6: Example of a CBCT - Lingual line angle of a defect………………………………….27

Abstract
USING CBCT AS A DIAGNOSTIC TOOL FOR EVALUATION OF INFRABONY DEFECT
IN VIVO
By Anya Rost, DMD
A thesis submitted in partial fulfillment of the requirements for the degree of Master of Science in
Dentistry at Virginia Commonwealth University.
Virginia Commonwealth University 2014
Major Director: Thomas C. Waldrop, Professor, Director Graduate Periodontics, Department of
Periodontics
BACKGROUND: Clinicians rely on radiographs and clinical exam to assess infrabony defects.
However, two-dimensional radiographs have many limitations. Three-dimensional imaging has
shown promise and has provided more precise measurements of defects created in skulls. The
aim of this study is to compare the diagnostic efficacy of cone beam computed tomography to
clinical measurements in patients presenting with infrabony defects.
METHODS: The study population included 20 patients with 25 infrabony defects. Clinical
measurements of pocket depth (PD), gingival margin (GM), bone sounding (BS) were obtained
and PD and BS were compared to CBCT measurements.
RESULTS: The average difference between the means of measurements obtained by BS and by
CBCT was 1.08mm with BS always being the greater value. BS measurement was statistically
significantly different with p<0.05 from CAL and CBCT values.

CONCLUSION: The CBCT provided measurements that are on average 1.08mm smaller than
bone sounding measurements.

1
INTRODUCTION
Early diagnosis of periodontal pockets and underlying infrabony defects is important in
treating and preventing periodontal disease. In diagnosing infrabony pockets, clinicians have to
rely on clinical measurements and two-dimensional radiographs. Clinical measurements usually
involve measuring pocket depths and clinical attachment loss. Both of these measurements rely
on the use of a periodontal probe. Probing measurements can often be inaccurate due to a variety
of operator, armamentarium and patient dependent factors. These factors include probe
angulation, force, diameter of the tine, amount of inflammation, anxiety and discomfort during
clinical evaluation. Van der Zee has found that probe tine diameter and calibration may have an
effect on the measurements.1
Theil found that probe readings were not a precise measurement of
attachment loss, especially in areas of increasing destruction and on multi-rooted teeth2. Van der
Valden described that with a probing force of 0.75N and a probe with a 0.63mm tip, the tip
penetrated into the most coronal intact fibers of the connective tissue.3
Fowler found that probe
tip penetrated 0.45mm into CT in the untreated sites and stopped 0.73 mm coronally to the apical
extent of junctional epithelium in the treated sites4. In a clinical setting, it is hard to standardize
all the variables to arrive at the most correct values for probing and attachment levels, and
clinicians are forced to rely on these values to make important treatment decisions.
The most accurate way of measuring bony defects is by direct evaluation during surgery,
where the clinician can see both the CEJ and the bone. However, direct evaluation can be an

2
inaccurate method of determining a treatment methodology. The technique of transgingival
probing, or bone sounding, has been identified as an accurate way to establish the location of the
alveolar margin and extent of osseous destruction pre-surgically.5, 6
By using this technique, an
operator can eliminate some of the inaccuracies, such as effect of the depth of probe penetration
and tine and tip diameter on the measurements acquired. Zybuts found that bone sounding is an
accurate measure to assess interproximal bone level compared to direct measurement during
surgery, with a mean difference being 0.1mm7. The drawback of bone sounding is that it has to
be done under local anesthesia and cannot be used during routine examinations.
Radiographic evaluation has always been used as an adjunct to clinical exam to diagnose
dental and periodontal problems. Most commonly used radiographs are periapical films,
bitewings, and panoramic radiographs. These radiographs allow the clinician to assess many
variables, such as caries, bone level, crown to root ratio, root proximity, as well as presence and
location of infrabony defects. Two-dimensional radiographs were found to routinely
underestimate bone loss up to 32% for panoramic, 11-23% for bitewings, and 9-20% for
periapicals.8 Eickholz compared linear measurements of interproximal bone loss on radiographs
to surgical measurements and found that bone loss was underestimated on radiographs by an
average of 1.43mm.9 Pepelassi compared using periapical and panoramic radiographs to measure
osseous destruction compared to transgingival probing. The author found that periapical
radiographs were more accurate in detecting osseous destruction than panoramic radiographs.
The extent of inaccuracy of radiographic measurements depended on jaw location, tooth group,
and extent of bone destruction. The degree of destruction was underestimated in slight
periodontitis, overestimated in severe periodontitis and was relatively accurate in moderate
periodontitis.10

3
Another drawback of the standard radiographs is that it is difficult, and frequently
impossible, to evaluate the geography of infrabony defects with certainty. In addition, dehisences
and fenestrations are undetectable on two-dimensional radiographs.11
The most prevalent of the
defects is a crater. Craters comprise 35.2% of all maxillary and 62% of all mandibular infrabony
defects, but it is impossible to distinguish them radiographically.12
Vertical defects can present in
various configurations. Goldman described one-wall, two-wall, three-wall, and combination
defects.13
While the presence of vertical defects can easily be identified on radiographs, it is
impossible to distinguish between two-wall, three-wall and combination defects. However,
many of the treatment decisions rely on knowing the architecture of the infrabony defect before
treatment is attempted.
Three-dimensional imaging in dentistry has become popular and is commonly utilized for
treatment planning of dental implants. This imaging technique can allow the clinician to evaluate
the condition of the patient’s osseous structures in three dimensions without interferences of
overlying structures. Three-dimensional imaging gives the clinician an ability to visualize and
measure bone level without structures being superimposed on each other, and has the potential to
significantly enhance periodontal diagnosis compared to regular radiographs. It was found to be
superior to the periapical radiographs in evaluating artificially created periodontal defects in both
large and small periodontal bone lesions, and therefore may have increased use in detecting early
periodontal lesions.14
Another study found that only 60% of infrabony defects could be
identified on two-dimensional radiographs and the vertical depth was underestimated by 2.2mm,
while in computed tomography scans 100% of the defects were identified and vertical depth was
underestimated by 0.2mm.15

4
Previously, medical grade conventional computed tomography (CT) scans were the only
ones available; however, cone beam computed tomography (CBCT) scans have become more
prevalent. Unlike the medical grade CT machines, the CBCT has a conical radiation source and a
digital detector. CBCT offers many advantages over a multislice CT scan, such as reduced
patient radiation dose (29-477µSv for CBCT versus 2000µSv for CT), decreased exposure time,
and decreased cost, and the linear measurements are as accurate on the CBCT as they are on the
CT scan.16
Ludlow found that on the Kodak 9500 unit the effective dose for a large field of view
ranged from 93-260 µSv, and a medium field of view ranged from 76-166 µSv.17
To limit
radiation exposure even further, a small field of view (FOV) scan can be taken of the area of
interest. The Kodak 9300 Cone Beam CT scanner’s small field of view provides doses that range
9.8 to 38.3 µSv, which are considerably lower than those produced by medium and large FOV
CBCT units.18
The range in dosage is due to different intraoral locations requiring a different
dose for obtaining the measurement, with anterior maxilla requiring the smallest dose and
posterior mandible requiring the highest dose.19
These doses are within the range used in two-
dimensional dental radiography.17
Small field of view CBCT imaging allows relatively low
radiation exposure, but the protocols for CBCT must be optimized to follow the ALARA (As
Low as Reasonably Achievable) principle.20
Due to limited radiation exposure, ability to take a small focused field, and ability to
avoid having distortion independent of the location of the tooth, CBCT has great potential for
evaluation of depth and architecture of infrabony defects. This can aid the clinician in diagnosis
and treatment planning.21
Most of the articles published on this topic were done in vitro on skull
models with artificial defects. 14, 15, 22-24
Misch evaluated artificially created infrabony defects on
two skulls, and found that all infrabony defects were identified with CBCT and with the probe.
5
Compared to caliper measurements (which are assumed to be the true value), CBCT error was
0.41mm and probe measurement error was 0.34mm. The author found that measurement from
CBCT is as accurate as using periodontal probe and superior to PAs in diagnosing buccal and
lingual defects.22
Vanderberghe’s skull study found that infrabony craters were detected with
100% certainty and classified with 91% certainty using CBCT while only 71% of cases were
identified when looking at two-dimensional radiographs. 24
Mol compared measurements taken
on dry skulls with a caliper to measurements made on an FMX and CBCT. It was found that the
difference between the direct measurements and the CBCT was 0.23mm and for FMX the
difference was 1.23mm, with both underestimating the bone level. It was concluded that CBCT
measurements were more accurate than the FMX measurements.23
While the studies done in
skulls may provide an accurate direct measurement of the bone and remove the concern about
radiation exposure to the patient, their results cannot always be generalized to live patients.
In difficult treatment planning cases, CBCTs have tremendous potential for making the
initial exam more informative and the process of diagnosis and treatment planning more precise.
The aim of this study is to evaluate how accurate CBCT is as a tool for evaluation of depth of
infrabony defects in vivo by comparing measurements taken on CBCT to clinical measurements
in a patient who has not yet undergone initial therapy. The specific goal of this study is to
compare clinical measurements, and measurements taken on a small field of view CBCT, in
order to establish how CBCT agrees with clinical measurements of infrabony defects.
6
MATERIALS AND METHODS
I. Patient Selection
Twenty patients (11 female and 9 male) were selected from the patient population of the
Virginia Commonwealth University Graduate Periodontics Department. The study was approved
by Virginia Commonwealth University Institutional Review Board. The patients were given a
detailed description of the study and signed an informed consent to participate. To be eligible to
participate in the study, patients had to have: at least one infrabony defect with interproximal
probing ≥6mm, attachment loss ≥4mm, and suspicion of one of more infrabony defects based on
the radiographs that were available. The exclusion criteria were: history of excessive radiation
exposure, inability to have a CBCT scan, uncontrolled systemic disease, pregnancy, children
under eighteen years of age, and presence of large full coverage restorations and restorations
located close to the cemento-enamel junction.
II. Examiner Calibration
For the clinical measurements, two examiners were calibrated by taking measurements on
one patient. If there were discrepancies in the measurements that were ≥2mm, the technique was
discussed and adjusted and measurements were repeated. The examiners used the same
technique for obtaining bone sounding measurements, probing depth, and gingival margin
location of all of the study patients. For the CBCT measurements, the examiners discussed the

7
measurement technique (discussed under the section of Radiographic Interpretation) and
measured infrabony defects on a patient. If the measurements were ≥2mm apart, the
measurements were repeated and the technique was modified. The same technique was utilized
for measuring all of the defects on a CBCT.
II. Clinical Examination
Either at the initial examination appointment or at the scaling and root planning
appointment, measurements were obtained on the teeth of interest by two calibrated examiners
using the same UNC periodontal probe. The measurements were: periodontal probing (gingival
margin to the base of the pocket), and gingival margin (gingival margin to CEJ). After the
patient was anesthetized, bone sounding measurements (gingival margin to bone) were obtained
using the same UNC probe. All measurements were obtained by keeping the probe parallel to
the long axis of the tooth and “walking it” to determine the deepest measurement. Then the bone
sounding from GM to the most apical stop, PD, and GM location would be recorded in that spot.
The measurements were obtained in five sites per tooth: direct buccal, buccal line angle,
interproximal, lingual line angle, direct lingual for the two teeth between which the infrabony
defect was located. The deepest probing in each location was recorded (Figure 1). The two
examiners were blinded to each other’s values. If there was an adjacent tooth present, the same
sites on the adjacent tooth were measured.
III. Radiographic Examination
At the same appointment, the patient received a small focused field of view (5x5) CBCT
of the quadrant of interest with Kodak 9000 machine (70kV, 10mA and 10.68 seconds). The

8
CBCTs were not reviewed on the same day to avoid bias. All CBCTs were saved under pre-
assigned patient number and reviewed at a later date by the same two calibrated examiners using
Carestream Software and the measuring tool provided within the software. The examiners did
not have access to clinical measurements while evaluating the CBCTs. Both examiners used the
same computer during evaluation. In order to obtain the most accurate measurements possible,
the teeth adjacent to the defect of interest were evaluated in an oblique view by lining up the
cross section of the plains in the center of the tooth and aligning the sagittal and coronal views
with the long axis of the tooth. Location of the CEJ could be identified in the coronal and sagittal
plains. Scrolling back and forth in sagittal and coronal planes, the most apical extent of the bone
could be identified. Measurements from most apical extent of the bone to CEJ were obtained in
the locations that correspond to clinical measurements (direct buccal, buccal line angle,
interproximal, lingual line angle, and direct lingual) for both teeth adjacent to the defect.
(Figure 1) After the measurements were made and recorded by the first examiner, they were
erased as to not influence the second examiner. The anatomy of the defect, such as width and
number of walls was visualized in the axial view by starting below the level of the defect and
scrolling in a coronal direction.
III. Statistical Analysis
Spearman’s correlation was used to evaluate the relationship between the CBCT values
for the five different sites per tooth. Five separate analysis of variance models were used to
determine the effect of a number of factors on the five different locations of measurements. The
models used the subject as a random effect and used fixed effects for type of measurement (BS,
CBCT, CAL). Tukey’s test for multiple testing ( p < 0.05) was used to determine if there were

9
statistically significant differences between the three types of measurements. In addition,
repeatability among examiners was assessed for probing, bone sounding, and pocket depth.

10
RESULTS
Twenty five infrabony defects were evaluated in twenty patients. The study population
was comprised of eleven females and nine males. Eight of the defects were next to an edentulous
space and seventeen of the defects were located between two adjacent teeth. CBCT
measurements and clinical values were evaluated. Gingival margin (GM) was recorded as a
distance from gingival margin to the CEJ. It was recorded as a negative number if there was
recession and as a positive number if the gingiva was above CEJ. Bone sounding (BS)
measurement was found by taking the clinical depth obtained from measuring the distance
between the free gingival margin to the bone and subtracting the GM. Probing depth (PD) was
measured from the free gingival margin position to the most coronal aspect of the attachment
apparatus. Clinical attachment level was calculated by subtracting gingival margin from the
probing depth measurement. While the main analysis was done between BS and CBCT
measurements, PD and CAL were included in the analysis as well.
For the purposes of descriptive statistics and hypothesis testing, direct buccal and direct
lingual measurements were averaged to obtain one value for each measurement type and
location. Likewise, buccal and lingual line angle measurements were also averaged. Table 1
summarizes mean values obtained from all of the measurements. N represents the total number
of measurements. Each was measured on the lingual and the buccal, thus the number of sites
(subjects) was half of the above. In all hypothesis testing the subject was the unit of analysis.

11
The mean defect depth established on CBCT was 6.93 ±2.34 mm and by BS it was 8.40±
2.32mm. The average difference between the means of measurements obtained by BS and by
CBCT was 1.08mm with BS always being the greater value. The mean difference between the
BS and CBCT measurements for the buccal and lingual surfaces of the teeth was the smallest:
0.83mm and 0.16mm for the tooth with the defect and the adjacent tooth, respectively. The mean
difference between the BS and CBCT measurements for the buccal and lingual line angles was
1.48mm and 0.99mm for the tooth with the defect and the adjacent tooth, respectively. The mean
difference for the interproximal measurement was 1.47 for the infrabony defect and 1.54 for the
proximal surface of the tooth adjacent to the defect. Incidentally, the value of PD was closer to
the CBCT value obtained than was the BS value.
Correlation between examiners:
Table 2 summarizes the correlation between examiners. The results show that the two
examiners’ measurements were within 1mm of each other 92-97% of the time for BS, 80-94% of
the time for GM, and 76-94% of time for PD measurements. Bone sounding values has the best
agreement of the clinical measurements.
Table 3 summarizes the reproducibility of CBCT measurements between examiners.
CBCT values were well-reproducible between the two examiners. There was a Spearman’s
correlation coefficient of 0.98 for the measurement of the infrabony defect. The lowest
reproducibility was for the direct (buccal and lingual) measurement of the tooth adjacent to the
tooth with the defect. For those sites the Spearman’s correlation was 0.84. For all the other
locations, the correlation was: 0.91 for line angles of the adjacent tooth, 0.94 for the direct

12
surface and line angles of the tooth with the defect. For all the measurement locations except
buccal and lingual of the adjacent tooth, the Least Squares Mean calculation showed the BS
measurements to be statistically significantly different from CAL or CBCT. For the direct
measurement of the adjacent tooth, CBCT and BS were statistically different from the PD
measurement with a p<0.05.

13
DISCUSSION
Diagnosis, prognosis and treatment planning rely on evaluation of bone loss and defect
morphology. Clinical examination and two-dimensional radiographs are routinely used for the
evaluation. CBCT has many benefits compared to two-dimensional radiographs as it allows three
dimensional visualization of bone and tooth morphology, eliminates foreshortening, enlargement
or superimposition of structures, and provides visualization of structures on the buccal and
lingual aspects of the teeth.
The aim of this study was to assess CBCT as as a tool for evaluating depth of infrabony
defects by comparing measurements taken on CBCT to clinical measurements. In our study we
decided to take the measurements in the patients who have not yet undergone initial therapy,
since this is the point at which clinicians are usually planning treatment. The challenge with
taking the measurements in patients with inflamed periodontium stems from a multitude of
factors that can render the measurements inaccurate, such as patient’s discomfort upon probing,
presence of subgingival calculus, inflamed periodontium, or inaccuracies in probing angulation.1,
3, 4 It was hypothesized that CBCT measurements will provide a better assessment of the depth
of infrabony defects. In this study we used bone sounding as the gold standard, as previous
studies have shown that bone sounding measurements are very close to those obtained
intrasurgically.5-7
The specific goal of this study was to compare clinical measurements and
measurements taken on a small field of view CBCT in order to establish how accurate CBCT is

14
as a tool for evaluation of depth of infrabony defects. Multiple in vitro studies have been
conducted comparing the infrabony defects in skulls to periapical or panoramic, and CBCT
images, all showing CBCT to be the closest to the true depth of the defect.14, 22, 23, 25
In the skull
model studies, the benchmark measurement used is either a direct measurement with a
periodontal probe or a caliper. In this study we used bone sounding as the gold standard due to
inability to visualize the defect, as most of the patients did not proceed to surgical phase of
treatment.
In comparing our results to those done on skull models, there are some discrepancies. The
in vitro studies showed measurements taken on CBCTs to be very close to their gold standard.
Misch et al. found that CBCTs overestimated the depth of the defect by an average on 0.41mm.22
Mol et al. compared measurements taken with a digital caliper and CBCTs and saw an
underestimation of 0.23mm on average.23
The results of our study were not consistent with those
done on skull models. The CBCT measurements were statistically significantly smaller (average
of 1.08mm) than BS measurements, and were very similar to PD measurements. The means of
PD and CAL measurements were similar to each other due to having some teeth with recession
and some with gingival margin above CEJ, which resulted in GM having a small value.
Naito et al. evaluated 186 sites in 9 patients using CT, bone sounding, and intrasurgical
measurements. They found the difference between CT and true bone level to be 0.41±2.53 and
the difference between bone sounding and true bone level to be 0.22±1.49.26
It is important to
note that this was study was done with a CT, not CBCT, and bone sounding and all the clinical
measurements were obtained after initial therapy when inflammation was controlled.
After analyzing results of this study, we cannot rule out that using bone sounding as a
benchmark in a patient with inflamed periodontium may not lead to accurate basis for

15
comparison, as this measurement itself may be flawed. One possible source of inaccuracy is that
the BS measurement was not a true measurement, but instead was a calculation. The first
measurement was made from the margin of the gingiva to the bone, the second measurement was
made from the margin of the gingiva to the CEJ, and then the second measurement was
subtracted from the first. Therefore, this final BS value could have measurement error that stems
from two sources. We know that measuring gingival margin from CEJ is inaccurate as it is
frequently hard to locate the CEJ, especially in the interproximal areas and those with
subgingival calculus deposits and inflamed gingiva. We believe that the gold standard used in
skull model studies is more accurate due to ability to directly visualize the defect. In our study,
we could not visualize the defect or take impressions of the defect and make measurements using
a caliper. In this study all measurements were done with a UNC probe using only tactile sense to
locate the CEJ when it was subgingival. In addition, frequently visualization was impaired due to
bleeding on probing of the inflamed gingival tissues.
As discussed in the introduction, there are many sources of error involved in the clinical
periodontal measurements. Another possible reason for the differences in measurements between
BS and CBCT could stem from the angulation of the probe when obtaining the BS value. When
making intraoral measurements, especially interproximally, one frequently needs to angle the
probe. Depending on the angulation, the measurement obtained could be exaggerated. In
contrast, when a measurement is done on a CBCT, a straight line is drawn from the CEJ to the
deepest point in the bone, and since the defect is frequently directly below the contact, the line
drawn from measurement cannot be reproduced clinically.
When bone sounding is performed the probe is pushed until it stops at the most apical
extent. We are not ruling out the possibility that the tip of the probe could end up being more

16
apical to the area from which the CBCT measurement is obtained. The tip of a UNC probe is
0.4mm and could theoretically penetrate into a marrow space or into an enlarged PDL space.
Another reason for the discrepancy between BS and CBCT measurements could stem
from clinical measurements always being rounded up when rounding was necessary, i.e. if the
line that marks 5mm was even slightly submerged, the measurement recorded was 6mm. In
contrast, the CBCT measurements were recorded to one decimal place.
Although measurements obtained on the CBCT did not exactly replicate BS values, the
value of CBCT in visualizing the architecture of the defect cannot be understated. The
architecture of the defect could be clearly visualized on a CBCT and easily described in regards
to the number of walls present and the width of the defect. In contrast, when asked to assess it
with clinical measurements only, the examiners did not have the same degree of certainty.
Due to some of the shortcomings of this study that were described above, there is more to
be learned about using CBCTs for evaluation of infrabony defects. This was a pilot study with a
small number of defects, and there would be a benefit in repeating this study with several
modifications, including the use of stents to assure that the same exact location is being
measured clinically and on CBCT, enrolling only patients that proceed to the surgical phase so
that a measurement could be taken by directly visualizing CEJ and bone level to obtain a better
gold standard, including measurements obtained from periapicals and bitewings, and quantifying
and recording the architecture of the defect during clinical exam and later comparing it to what is
visualized on CBCT.
If the results of the in vitro studies are assumed to be correct and we know that CBCT
measurements are within 0.5mm of the true depth of the defect, then it is possible that the BS is
overestimating the depth of the defect in a patient with uncontrolled inflammation. If this is true,

17
then CBCT and not bone sounding should be the basis for comparison, and it may be beneficial
to use CBCT as a diagnostic tool for an initial evaluation.
In this study, it was found that when evaluating the infrabony defect and adjacent sites,
the measurements obtained on a CBCT were on average 1.08mm lower than BS and were the
closest to PD measurement. CBCT appears to have great potential for use in periodontal
evaluation and for determining the architecture and depth of infrabony defects. When
recommending CBCT for this purpose, clinicians need to remember United States Food and
Drug Administration’s recommendation for reducing unnecessary radiation exposure from
medical and dental imaging, which includes avoiding duplicate exams and adjusting exposure
settings to provide the lowest radiation dose for obtaining an image of acceptable quality.27
At
this time, there is inconclusive evidence to recommend routine use of CBCT solely for the
purpose of evaluating the depth of infrabony defects. However, if there are other needs for
obtaining a CBCT, such as implant treatment planning, CBCT can be used as an adjunct to
clinical exam to evaluate the architecture and depth of infrabony defects.

18
List of References

19
List of References
1. Van der Zee E, Davies EH, Newman HN. Marking width, calibration from tip and tine
diameter of periodontal probes. J Clin Periodontol 1991;18(7):516-520.
2. Theil EM, Heaney TG. The validity of periodontal probing as a method of measuring loss of
attachment. J Clin Periodontol 1991;18(9):648-653.
3. van der Velden U, de Vries JH. The influence of probing force on the reproducibility of pocket
depth measurements. J Clin Periodontol 1980;7(5):414-420.
4. Fowler C, Garrett S, Crigger M, Egelberg J. Histologic probe position in treated and untreated
human periodontal tissues. J Clin Periodontol 1982;9(5):373-385.
5. Renvert S. Healing after treatment of periodontal intraosseous defects. III. Effect of osseous
grafting and citric acid conditioning. J Clin Periodontol
6. Greenberg J. Transgingival probing as a potential estimator of alveolar bone level. The
Journal of periodontology.
7. Zybutz M, Rapoport D, Laurell L, Persson GR. Comparisons of clinical and radiographic
measurements of inter-proximal vertical defects before and 1 year after surgical treatments. J
Clin Periodontol 2000;27(3):179-186.
8. Akesson L, Hakansson J, Rohlin M. Comparison of panoramic and intraoral radiography and
pocket probing for the measurement of the marginal bone level. J Clin Periodontol
1992;19(5):326-332.
9. Eickholz P, Hausmann E. Accuracy of radiographic assessment of interproximal bone loss in
intrabony defects using linear measurements. Eur J Oral Sci 2000;108(1):70-73.
10. Pepelassi EA, Diamanti-Kipioti A. Selection of the most accurate method of conventional
radiography for the assessment of periodontal osseous destruction. J Clin Periodontol
1997;24(8):557-567.
11. Rees TD, Biggs NL, Collings CK. Radiographic interpretation of periodontal osseous
lesions. Oral Surg Oral Med Oral Pathol 1971;32(1):141-153.

20
12. Manson JD, Nicholson K. The distribution of bone defects in chronic periodontitis. J
Periodontol 1974;45(2):88-92.
13. Goldman HM CD. The infrabony pocket: classification and treatment. J Periodontol
1958;29(272)
14. Noujeim M, Prihoda T, Langlais R, Nummikoski P. Evaluation of high-resolution cone beam
computed tomography in the detection of simulated interradicular bone lesions. Dento-maxillo-
facial radiology 2009;38(3):156-162.
15. Fuhrmann RA, Bcker A, Diedrich PR. Assessment of alveolar bone loss with high resolution
computed tomography. J Periodont Res 1995;30(4):258-263.
16. Loubele M, Van Assche N, Carpentier K, et al. Comparative localized linear accuracy of
small-field cone-beam CT and multislice CT for alveolar bone measurements. Oral Surg Oral
Med Oral Pathol Oral Radiol Endod 2008;105(4):512-518.
17. Ludlow JB. A manufacturer's role in reducing the dose of cone beam computed tomography
examinations: effect of beam filtration. Dentomaxillofac Radiol 2011;40(2):115-122.
18. Lagravere MO, Carey J, Toogood RW, Major PW. Three-dimensional accuracy of
measurements made with software on cone-beam computed tomography images. Am J Orthod
Dentofacial Orthop 2008;134(1):112-116.
19. Ludlow J. Dosimetry of 9000 3D Small FOV CBCT and Panoramic Unit, <br />Univ of N
Carolina School of Dentistry, Chapel Hill, NC, 2008. AAOMR Annual session 2009;
20. Ludlow JB, Davies-Ludlow LE, White SC. Patient risk related to common dental
radiographic examinations: the impact of 2007 International Commission on Radiological
Protection recommendations regarding dose calculation. J Am Dent Assoc 2008;139(9):1237-
1243.
21. Mohan R, Singh A, Gundappa M. Three-dimensional imaging in periodontal diagnosis -
Utilization of cone beam computed tomography. Journal of Indian Society of Periodontology
2011;15(1):11-17.
22. Misch K, Yi E, Sarment D. Accuracy of cone beam computed tomography for periodontal
defect measurements. J Periodontol 2006;77(7):1261-1266.
23. Mol A, Balasundaram A. In vitro cone beam computed tomography imaging of periodontal
bone. Dento-maxillo-facial radiology 2008;37(6):319-324.
24. Vandenberghe B, Jacobs R, Yang J. Diagnostic validity (or acuity) of 2D CCD versus 3D
CBCT-images for assessing periodontal breakdown. Oral surgery, oral medicine, oral
pathology, oral radiology and endodontics 2007;104(3):395-401.

21
25. Vandenberghe B, Jacobs R, Yang J. Detection of periodontal bone loss using digital intraoral
and cone beam computed tomography images: an in vitro assessment of bony and/or infrabony
defects. Dento-maxillo-facial radiology 2008;37(5):252-260.
26. Naito T, Hosokawa R, Yokota M. Three-dimensional alveolar bone morphology analysis
using computed tomography. J Periodontol 1998;69(5):584-589.
27. Dental Cone-beam Computed Tomography Available at: : http://www.fda.gov/Radiation-
EmittingProducts /RadiationEmittingProductsandProcedures/ MedicalImaging/ MedicalX-
Rays/ucm315011.htm. 2014.

22
Appendix A
Table 1: Summary Statistics: N represents number of measurements. Each was measured on the
lingual and the buccal, thus the number of sites (subjects) was half of the above. In all
hypothesis testing the subject was the unit of analysis.
B or L of tooth with
defect mean
Line Angle of
tooth with
defect mean
Proximal
(defect) mean
Proximal
adjacent tooth
mean
B or L of
adjacent tooth
mean
Line angle of
the adjacent
tooth mean
Type N Mean Std
Dev
Mean Std Dev Mean Std
Dev
N Mean Std
Dev
Mean Std
Dev
Mean Std
Dev
BS 50.00 4.80 2.25 6.59 2.57 8.40 2.32 34 5.44 1.93 4.06 1.73 4.50 1.96
CBCT 50.00 3.97 2.28 5.11 2.12 6.93 2.34 34 3.90 1.89 3.49 1.44 3.51 1.50
GM 50.00 0.23 1.35 0.29 1.61 0.66 1.81 34 0.94 1.63 0.28 1.38 0.65 1.33
PD 50.00 3.66 1.55 5.16 2.46 7.50 2.33 34 5.04 2.07 3.07 0.85 3.59 1.36
CAL 50.00 3.43 1.98 4.87 2.50 6.84 2.05 34 4.10 2.08 2.94 1.66 2.79 1.48
Table 2: Percent of time measurements between examiners were within 1mm of each other (T1 –
tooth with the infrabony defect, T2 – adjacent tooth)
Direct T1 Line Angle
T1
Proximal
(defect)
Proximal
T2
Line Angle
T2
Direct T2
BS 96% 90% 94% 97% 94% 92%
GM 80% 84% 88% 94% 82% 91%
PD 94% 90% 76% 86% 91% 91%

23
Table 3: Nonparametric: Spearman's ρ for CBCT measurements (T1=tooth with the infrabony
defect, T2= adjacent tooth)
Variable Spearman ρ Prob>|ρ|
Direct T1 0.94 <.0001*
Line Angle T1 0.94 <.0001*
Proximal T1 (defect location) 0.98 <.0001*
Line Angle T2 0.91 <.0001*
Direct T2 0.84 <.0001*

24
Appendix B
Figure 1: Schematic of the measurement locations
25
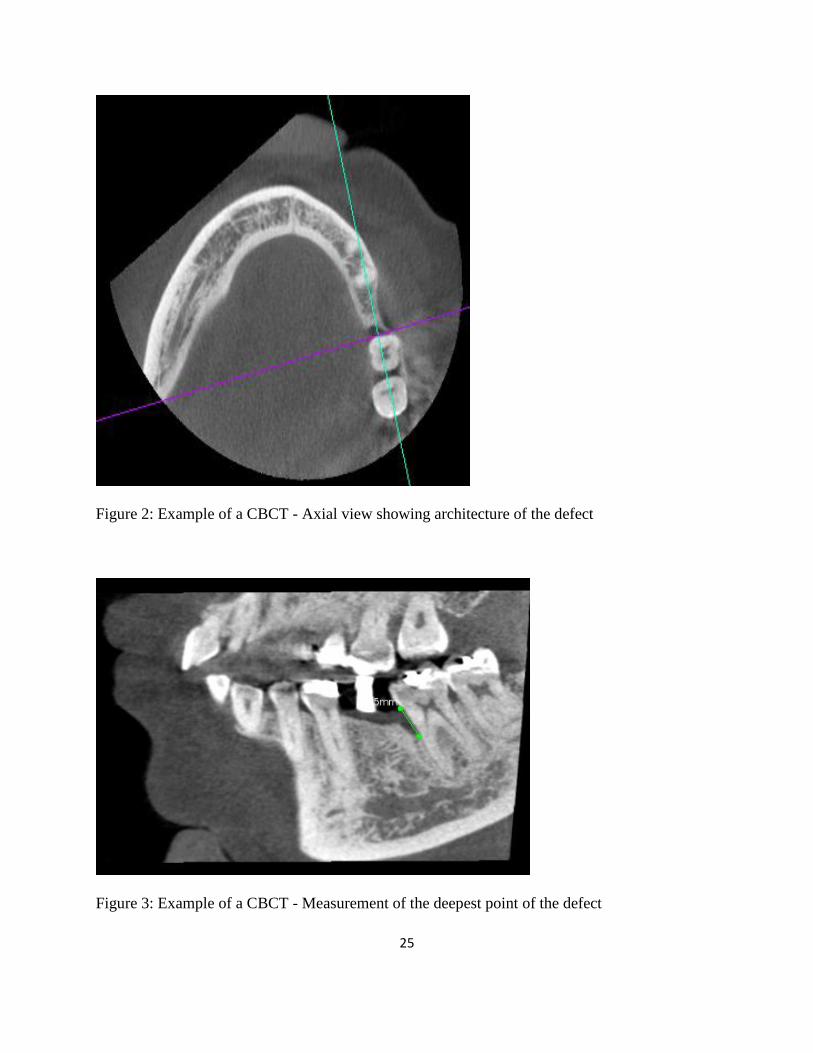
Figure 2: Example of a CBCT - Axial view showing architecture of the defect
Figure 3: Example of a CBCT - Measurement of the deepest point of the defect

26
Figure 4: Example of a CBCT - Measuring distal line angle of the defect
Figure 5: Example of a CBCT - Measuring buccal line angle of the defect

27
Figure 6: Example of a CBCT - Lingual line angle of a defect