using advanced statistical tools to assess the impact of a
TRANSCRIPT

Using advanced statistical tools to assess the impactof a small landfill site on the aquatic environment
Grzegorz Przydatek
Received: 2 October 2020 /Accepted: 5 January 2021 /Published online: 19 January 2021
Abstract The aim of the study was to assess the impactof a small municipal landfill on the aquatic environmentover 9 years, using advanced statistical tools. The resultsof the study of surface, ground- and leachate watersfrom 2008 to 2016 were subjected to detailed statisticalanalysis based on 15 physicochemical indicators. Factoranalysis accounted for the requirements of the WHO,the European Union and the nation of Poland using 8statistical analytical methods. The analysis of leachatecontamination from the landfill site with the use ofadvanced statistical tools revealed its interaction withgroundwater. The assessment was based on increasedand statistically significant values and correlations oftemperature, Zn and N–NO3 between leachate andgroundwater, factors demonstrating the negative impactof the landfill. In the case of Zn, there was also acorrelation between the tested waters below the landfill.The increased PAH values in the examined surface andground waters were not a consequence of waste dispos-al. However, the deterioration of the chemical state ofgroundwater in the vicinity of the landfill could resultfrom a certain dysfunction of the facility’s infrastructureafter operating for more than 20 years.
Keywords Municipal waste . Impact . Landfill . Water .
Leachate . Advanced statistical analysis
Introduction
In general, growing material consumption has led to amassive increase in waste generation, especially munic-ipal solid waste (MSW), and waste management hasbecome a major problem for governments (Rajaeifaraet al. 2017). One of the elements of waste management isstorage. Despite the actions taken to minimize the massof generated waste and its rational recovery, waste stor-age remains the most widely used waste managementsolution in the world (Laner et al. 2012). In 2018, a totalof 52 million Mg of waste was deposited in theEuropean Union and 12 million Mg in Poland(Eurostat 2018; Statistics Poland 2018). Waste disposalusually occurs in landfills with different forms of envi-ronmental protection organization. The functioning oflandfills as engineering facilities should help to mini-mize their negative impact, especially on the aquaticenvironment. Such a process should be fulfilled bylocating, constructing and operating landfills in a man-ner that accounts for hydrological and geotechnical con-ditions (Przydatek 2019a).
One of the side effects of waste disposal is the leach-ate produced as a result of rainwater migration throughthe deposited waste, which rinses out dissolved organicand mineral substances. During migration, organic, in-organic, colloidal, pathogenic and other contaminatedsubstances are transferred in the waste (Zin et al. 2012),which is characterised by diverse chemical composition,depending primarily on the waste composition (Singhet al. 2012). The age of the landfill, the amount ofprecipitation, seasonal weather variability and storage
Environ Monit Assess (2021) 193: 71https://doi.org/10.1007/s10661-021-08850-4
G. Przydatek (*)Engineering Institute, State University of Applied Sciences inNowy Sącz, Zamenhofa 1a street, 33-300 Nowy Sacz, Polande-mail: [email protected]
# The Author(s) 2021

technology also influence the quality of the leachate(Kjeldsen et al. 2002; Singh et al. 2016).
The leachate from municipal landfills can be a po-tential source of surface water, groundwater and soilpollution (Barbieri et al. 2014; Aziz et al. 2015), as itis the longest emitting pollutant generated in landfills. Ifit is not adequately protected (Patil et al. 2013), themigration of leachate from landfills, in particular, posesa high risk to groundwater resources (Chen et al. 2019).Effluents can enter groundwater aquifers as a result ofprecipitation and be transferred into the adjacent riversystem through groundwater flow, possibly pollutingthe surrounding environment (Naveen et al. 2018).They may contain multiple mineral and organic com-pounds, the amount of which should be systematicallycontrolled (Przydatek 2019b). In this context, the guide-lines of Council Directive 1999/31/EC of 26 April 1999oblige EU member states to comply with environmentallaws and regulations on the monitoring of landfills,including water and leachate.
The assessment of the impact of landfills on thequality of surface water and groundwater needs to ac-count for the selection of indicators, which should be thesame for the types of water tested and the leachate.Therefore, it is beneficial to analyse the impact of land-fills on the environment by using statistical tools, whichmake it possible to significantly increase the probabilityof detecting the degree and causes of the negative im-pact of landfilled waste on the water environment (Attaet al. 2015; Aziz et al. 2018; Koda et al. 2017; Przydatekand Kanownik 2019; Przydatek 2019a; Srivastava andRamanathan 2008; Tałałaj 2014). The use of a widerange of statistical tools assists in classifying, modellingand interpreting large data sets, which allows for areduction in the form of data extraction, helping toassess water quality (Gibrilla et al. 2011; Singhet al. 2016).
The aim of the study was to assess the impact of asmall municipal landfill site located in the vicinity of ariver in an organised form, on the water environmentusing advanced statistical tools.
Materials and methods
Study objective
The studied 1.45-ha landfill for non-hazardous and inertwaste is located in XY (49° 51′ 31.74″N, 20° 65′ 68.55″
E) in southern Poland, several meters from the Popradriverbed (Fig. 1). At the beginning of the 1990s, thesuperstructure of the existing municipal landfill wasthoroughly modernized with the accompanying techni-cal infrastructure. After the modernisation, operationsbegan in 1999.
The area of the landfill is located within the MaguraNappe, composed of Cretaceous and Paleogene perioddeposits, i.e. sandstone and shale (typical flysch forma-tions). There are Tertiary formations of deeper subsoilcovered with Holocene river formations, developed inthe form of pebbles, gravels, sand and gravel mix, andsands with thin interlayer loams.
In the vicinity of the landfill, groundwater is foundin flysh and Quaternary formations. In flysch forma-tions, water is contained in sandstone layers of bed-rock, the amount of which depends on the size of thesandstone crevices that contact each other and thesandstone porosity. In Quaternary formations, themain aquifer occurs in Holocene stone and gravelformations of the Poprad River terraces. These watersare hydraulically connected with the waters of theriver, the valley of which is a system that drainsunderground water flowing down the mountainslopes (Przydatek 2019a). Generally, the groundwa-ter flow is directed towards the Poprad from thesouthwest to the northeast (Figs. 1 and 2).The landfillarea consists of two sectors, the first of which re-mains in the rehabilitation phase, while the second(134,932 m3) is in operation. Within the landfill,there is a stable embankment that is 2.0–5.0 m high.The bottom of these two sectors of the landfill hasbeen sealed with synthetic insulation in the form of abentonite mat, 2.5-mm-thick HDPE geomembraneand geotextile to protect the soil and water environ-ment. The landfill leachate is captured by a Ø 100-mm drain and a collective drainage system with a Ø200-mm diameter and is collected in an 18.3-m3 tankprior to transport to a sewage treatment plant. Thislandfill has a passive degassing system consisting offive wells. In the first sector, there are two wells, andin the second sector, three wells. The degassing wellsare made of corrugated perforated pipes placed intowaste.
Residual waste after segregation is sent to a landfillsite due to the required minimisation of the amount ofdeposited waste, which should be beneficial for thereduction of potential environmental hazards. The wastedeposited at the landfill site is separated and thickened
71 Page 2 of 21 Environ Monit Assess (2021) 193: 71

with a bulldozer in thin layers, 0.3–0.5-m-thick to 1.2-mhigh, and then systematically transferred with an insu-lation layer with a maximum thickness of 0.3 m(Przydatek 2019a).
Scope of research
The results of physicochemical elements of surface wa-ter and groundwater, leachate, precipitation andamounts of leachate and waste collected from 2008 to2016 were used to conduct statistical analyses and draw
conclusions aimed at recognising the impact of a smalllandfill with an organised form on the quality of water inits immediate vicinity.
Samples for surface water testing were collected inthe Poprad riverbed (springs in Slovakia) at two points:W1 above and W2 below the landfill. There are sixpiezometers within the landfill from which water sam-ples for qualitative and quantitative studies were taken.Two piezometers P2 and P3 (reference points) are lo-cated above the landfill on the groundwater inflow. Theother four are located below the landfill (P1a, P4, P5 and
Fig. 1 Location of reached points in the around of the municipalsolid waste landfill site in XY (Southern Małopolska, Poland):points of groundwater sampling (P1a, P2, P3, P4, P5, P6) and
surface water sampling (W1, W2), and direction of surface waterflow is shown with bright blue arrows and groundwater of flow isshown with blue arrows
Environ Monit Assess (2021) 193: 71 Page 3 of 21 71

P6) and on the groundwater outflow (Fig. 1). It shouldbe noted that the location of the P1a piezometric pointindicates that it is out of the reach of the landfill. Thesampling of groundwater from piezometers P2 and P4 inthe analysed years was characterised by a certain irreg-ularity as a result of the periodic lack of water at thesepoints.
At piezometric points, groundwater samples werecollected, and their depth measured followingpumping. The leachate water was collected from thetank before it was cleaned. After samples of water andleachate were collected in the field, pH and electricalconductivity were measured using a portable multi-functional meter with glass electrodes. The meter wascalibrated before each time before the research wasconducted. Each result was based on the average ofthree measurements. The samples were collected insterilised polyethene containers and delivered imme-diately to an accredited testing laboratory for analysisaccording to standard methods. The minimum amountof the sample taken was 500 mg/L. The samples takenwere transported to the laboratory at 4 °C in the dark(APHA 2007).The concentrations of the followingpollutants were determined: copper (Cu), cadmium(Cd), chromium (Cr+6), mercury (Hg), N–NO3, totalorganic carbon (TOC) and polycyclic aromatic hydro-carbons (PAHs). Heavy metals Cu, Cd, Cr+6 and Hgwere determined by atomic absorption spectroscopy(AAS), which uses the phenomenon of atomic
absorption of electromagnetic radiation. TOC andN–NO3were determined by spectrophotometry, whileHPLC with fluorescent detection after liquid-liquidextraction was used to determine PAHs. The biochem-ical oxygen demand (BOD5) was determined by thedilution method, with the addition of inoculum mate-rial and allylthiourea, and COD by test kits pre-madeby the manufacturer HACH. Laboratory analyseswere performed twice (repeated) when acceptablevalues were exceeded, or results outside the calibra-tion coefficient or atypical results for a given matrixwere obtained. The content of the leachate chemicalcontamination index shown was determined to thenearest μg/L.
The quality of surface waters was determined perthe Regulation of the Minister of Environment of 21July 2016 on the method of classification of thestatus of surface water bodies and the MERegulation (2016) environmental quality standardsfor priority substances. Groundwater in piezometerswas determined per the Regulation of the Ministerof Maritime Economy and Inland Navigation of 11October 2019 on criteria and method of assessmentof the status of groundwater bodies (MMEINRegulation 2019a). The results of the tests of leach-ate water from the landfill were compared with thosein the Regulation of the Minister of MaritimeEconomy and Inland Navigation of 12 July 2019on substances particularly harmful to the aquatic
Fig. 2 Level of groundwater inpiezometers
71 Page 4 of 21 Environ Monit Assess (2021) 193: 71

environment and the conditions to be met whendischarging sewage into waters or soil and whendischarging rainwater or snowmelt into waters orwater facilities (MMEIN Regulation 2019b).
The verification of exceeding the maximum permis-sible pollutant value for leachate from the landfill andthe quality class of surface and groundwater inpiezometers was determined based on the arithmeticmean value for each of the tested physicochemicalelements. In addition, the results of the tested waterswere compared with the limit values set by the WHO(2017) for drinking water.
The quarterly sum of precipitation and the averagequarterly flow of the Poprad were determined.Meteorological data were obtained from meteorologicalstations of the Institute of Meteorology and WaterManagement (49° 37′ 38″ N, 20° 41′ 21″ E) located inthe vicinity of the landfill, i.e. close to the riverbed of thestudied river (49° 34′ 05.65″N, 20° 39′ 35.83″ E) and inthe neighbouring village (49° 37′ 38″ N, 20° 41′ 21″ E)(Przydatek 2019b).
Statistical analyses
For the collected results of the tested leachate and waterincluding physical and chemical variables (reaction tem-perature, specific electrolytic conductivity, 5-dayBOD5, COD, TOC, total nitrogen (N), N–NO3, PAH,Cu, Cd, Cr+6, Hg) and surface water flow, groundwatertable depth, amount of precipitation and amount ofleachate and waste, we determined the following: min-imum, maximum, arithmetic mean and standard devia-tion (groundwater depth only). Many of the demonstrat-ed physicochemical indicators in the study of surfacewater and groundwater quality in the landfill area wereused by Tałałaj (2013).
For the calculation of some values of statistical pa-rameters, the measurement result at half of a given limitof quantification was assumed when the value of waterindicators in a given sample was below the limit ofquantification defined by a multiple of detectability,i.e. the output signal or concentration value above whichit can be stated with relative certainty that the samplediffers from a blank value (Przydatek 2019a; Przydatekand Kanownik 2019).
The ANOVA test was used to estimate the signif-icance of the differences in the concentrations of the
tested surface and groundwater indices above andbelow the municipal landfill. As most of the variabledecomposition conditions (excluding pH, electrolyticconductivity and temperature) were not met, theKruskal-Wallis test (the non-parametric equivalentof the ANOVA test) and the median test as well asmultiple (bilateral) comparisons of mean ranks,which do not require normal decomposition or ho-mogeneous variations, were used. The Mann-Whitney U test was used to investigate the signifi-cance of the differences in the concentrations of thetested waters due to failure to meet the Student’s t testassumptions (except for pH, electrical conductivityand temperature). If the null hypothesis was rejectedin the analysis of variance, the significance of thedifferences between the individual averages was ex-amined using multiple post hoc comparison tests (thiselement exists only if the differences in the ANOVAtest are statistically significant). Correlations weredetermined between the composition of leachate withwater taken from the watercourse and piezometerslocated below the landfill to determine the impactof a municipal landfill on the physicochemical stateof surface water and groundwater. Pearson’s correla-tion coefficient method was used to determine thecorrelation relationship for normally distributed data.When the condition of normal distribution was notmet, the Spearman rank method was used, whereinthe Spearman R correlation coefficient is the non-parametric equivalent of Pearson’s coefficient. Rankcorrelation shows any monotonic (or non-linear) de-pendence. As in the case of parametric correlation,the Spearman R correlation coefficient measures thestrength of the relationship between the variables, butin this case, a quantitative scale with normal distri-bution is not applicable.
The non-parametric tests were applied due to thelack of normal distribution of most of the analysedphysicochemical indicators according to the Shapiro-Wilk test results and the lack of equality of variancedetermined by the Mann-Kendall test. For the phys-icochemical elements of the examined waters, signif-icantly different from each other, the extreme values,median and quartile range are presented in the boxplots. The Mann-Kendall non-parametric statisticaltest was chosen for testing multiple figures to identifyan upward or downward trend, which was not
Environ Monit Assess (2021) 193: 71 Page 5 of 21 71

necessarily linear. A test diagram was also used,which is one of the simplest types of graphs, i.e. alinear graph for cases. Cluster analysis was also usedto explain the detection of the structure in the data,taking into account the hierarchical clustering,which allows for the determination of the so-called tree structure of elements of the analysedset of objects. For all statistical analysis, theStatistica 13 programme was used (StatSoftPolska, StatSoft, Inc., USA).
Results
The qualitative-quantitative analysis of surface water,groundwater, leachate and deposited waste
The average quarterly amount of leachate from thelandfill in the years 2008–2016 was 658.29 m3, andthe average quarterly precipitation was 194.15 mm.According to Enekwechi and Longe (2007), theamount of leachate produced is highly dependent onthe surface of the landfill, meteorological andhydrogeological factors and the tightness of the cov-er. In turn, the average amount of waste depositedwas 658.29 Mg, at total mass of 5266.32 Mg, whichshowed in the analysed period was deposited lessthan 10 Mg waste per day (Table 1).
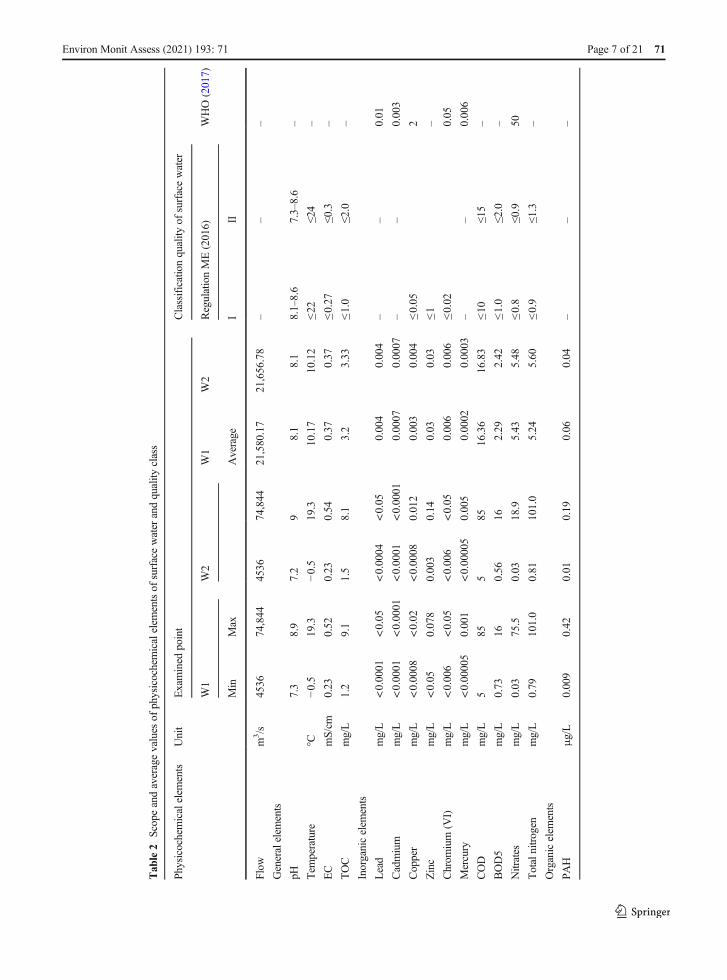
Per ME Regulation (2016) and based on the anal-ysis of quarterly results of physicochemical waterquality of the river flowing in the vicinity of a landfillsite, samples from two test points (W1 and W2) metmost class I water quality standards. The exceptionswere electrical conductivity, BOD5, COD, N and N–NO3 (Table 2). Based on the average value of elec-trical conductivity, the level of geochemical back-ground and the level of purity, class II for electricalconductivity was exceeded by 0.07 mg/L. Similarly,measurements of other variables showed that the
limit values of the second class were exceeded.Furthermore, the maximum concentration of 75.5mg/L of N–NO3 at the surface water inflow exceededthe WHO limit value (2017).
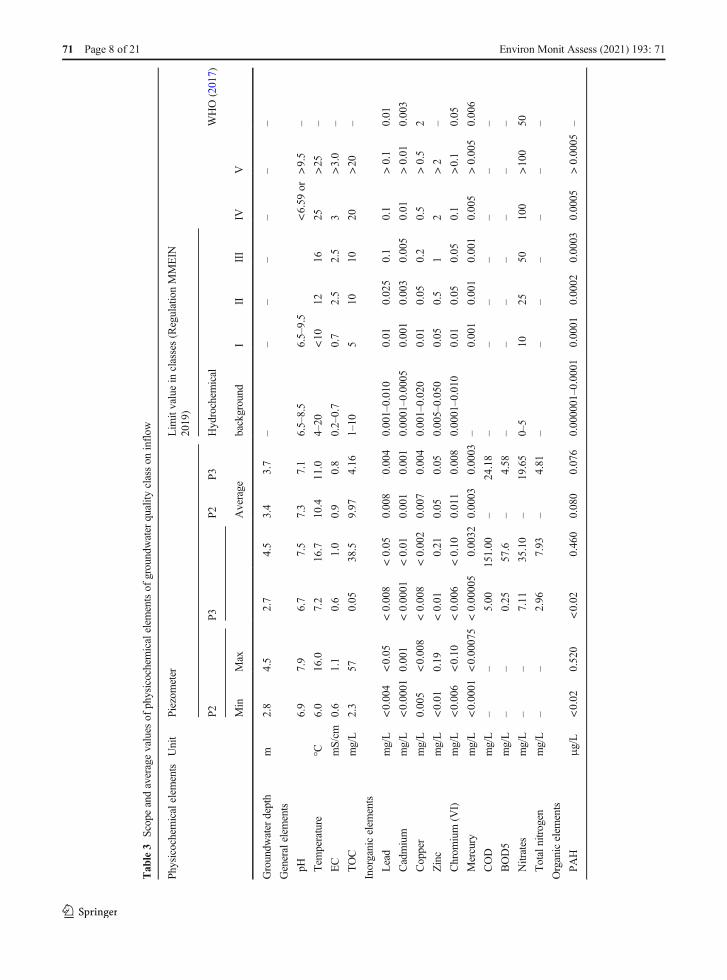
The analysis of the quarterly results of groundwa-ter quality in six piezometers located in the area ofthe landfill site over 9 years, taking into account thelimit values set out in the MMEIN Regulation (2019),showed that most of the examined physicochemicalelements meet the class I standards of very goodwater quality. Average pH values between 7.1 and7.3 were measured at both the inflow and outflow ofwater. Above the landfill, groundwater quality dete-riorated significantly. It was classified as the worst(class V) due to the high average PAH concentra-tions, significantly exceeding the 0.0005 mg/L limitvalue in two piezometers (P2 and P3). All the re-maining variables indicated class II (good quality).They did not meet class I quality due to exceeding theaverage TOC concentration by almost 5 mg/L, theaverage electrical conductivity by 0.2 mS/cm, andCr+6 by 0.01 mg/L. Class II water quality was alsofound to result from more than two times the averageN–NO3 concentration, at P3 (Table 3). Below thelandfill, underground water, due to average PAHconcentrations significantly exceeding the level ac-ceptable in four piezometers at the same time, wasclassified as class V, the same as at the inflow. Incontrast, the waters below the landfill were classifiedas class III, not meeting the average concentration ofN–NO3 in P1a required for class II by 3.85 mg/L.The water level in this piezometer was stable, whichwas confirmed by the lowest standard deviation (SD= 0.000). The waters below the landfill site wereclass II, slightly exceeding the requirements of classI for temperature at P1a, P5 and P6 by 1.21, 0.65 and0.34 °C, respectively. The average Zn concentrationexceeded by 0.03 mg/L in P5. The piezometers P1aand P5 had the highest Zn values of 0.390 and 0.198mg/L, respectively (Table 4). In comparison, the av-erage Cd concentration below the landfill was 0.001mg/L, and the average value of electrical conductiv-ity at the outflow was the same as the inflow water.
In leachate from the municipal landfill, most of theaverage concentrations of the examined indicatorswere lower than the maximum normative values(MMEIN Regulation, 2019). One such indicator isthe pH, the average value of which was near neutral.However, leachate from the landfill site did not meet
Table 1 Scope and average of meteorological, waste and leachatevolumes
Indicator Unit Min Max Average
Amount of waste Mg 0.00 1273.92 658.29
Amount of leachate m3 0.00 2511 699.304
Precipitation mm 51.1 524 194.15
71 Page 6 of 21 Environ Monit Assess (2021) 193: 71
Tab
le2
Scopeandaveragevalues
ofphysicochemicalelem
entsof
surfacewater
andquality
class
Physicochemicalelem
ents
Unit
Examined
point
Classificationquality
ofsurfacewater
W1
W2
W1
W2
RegulationME(2016)
WHO(2017)
Min
Max
Average
III
Flow
m3/s
4536
74,844
4536
74,844
21,580.17
21,656.78
––
–
Generalelem
ents
pH7.3
8.9
7.2
98.1
8.1
8.1–8.6
7.3–8.6
–
Tem
perature
°C−0
.519.3
−0.5
19.3
10.17
10.12
≤22
≤24
–
EC
mS/cm
0.23
0.52
0.23
0.54
0.37
0.37
≤0.27
≤0.3
–
TOC
mg/L
1.2
9.1
1.5
8.1
3.2
3.33
≤1.0
≤2.0
–
Inorganicelem
ents
Lead
mg/L
<0.0001
<0.05
<0.0004
<0.05
0.004
0.004
––
0.01
Cadmium
mg/L
<0.0001
<0.0001
<0.0001
<0.0001
0.0007
0.0007
––
0.003
Copper
mg/L
<0.0008
<0.02
<0.0008
0.012
0.003
0.004
≤0.05
2
Zinc
mg/L
<0.05
0.078
0.003
0.14
0.03
0.03
≤1–
Chrom
ium
(VI)
mg/L
<0.006
<0.05
<0.006
<0.05
0.006
0.006
≤0.02
0.05
Mercury
mg/L
<0.00005
0.001
<0.00005
0.005
0.0002
0.0003
––
0.006
COD
mg/L
585
585
16.36
16.83
≤10
≤15
–
BOD5
mg/L
0.73
160.56
162.29
2.42
≤1.0
≤2.0
–
Nitrates
mg/L
0.03
75.5
0.03
18.9
5.43
5.48
≤0.8
≤0.9
50
Totalnitrogen
mg/L
0.79
101.0
0.81
101.0
5.24
5.60
≤0.9
≤1.3
–
Organicelem
ents
PAH
μg/L
0.009
0.42
0.01
0.19
0.06
0.04
––
–
Environ Monit Assess (2021) 193: 71 Page 7 of 21 71
Tab
le3
Scopeandaveragevalues
ofphysicochemicalelem
entsof
groundwater
quality
classon
inflow
Physicochemicalelem
ents
Unit
Piezom
eter
Lim
itvaluein
classes(RegulationMMEIN
2019)
P2P3
P2P3
Hydrochem
ical
WHO(2017)
Min
Max
Average
background
III
III
IVV
Groundw
ater
depth
m2.8
4.5
2.7
4.5
3.4
3.7
––
––
––
–
Generalelem
ents
pH6.9
7.9
6.7
7.5
7.3
7.1
6.5–8.5
6.5–9.5
<6.59
or>9.5
–
Tem
perature
°C6.0
16.0
7.2
16.7
10.4
11.0
4–20
<10
1216
25>25
–
EC
mS/cm
0.6
1.1
0.6
1.0
0.9
0.8
0.2–0.7
0.7
2.5
2.5
3>3.0
–
TOC
mg/L
2.3
570.05
38.5
9.97
4.16
1–10
510
1020
>20
–
Inorganicelem
ents
Lead
mg/L
<0.004
<0.05
<0.008
<0.05
0.008
0.004
0.001–0.010
0.01
0.025
0.1
0.1
>0.1
0.01
Cadmium
mg/L
<0.0001
0.001
<0.0001
<0.01
0.001
0.001
0.0001–0.0005
0.001
0.003
0.005
0.01
>0.01
0.003
Copper
mg/L
0.005
<0.008
<0.008
<0.002
0.007
0.004
0.001–0.020
0.01
0.05
0.2
0.5
>0.5
2
Zinc
mg/L
<0.01
0.19
<0.01
0.21
0.05
0.05
0.005–0.050
0.05
0.5
12
>2
–
Chrom
ium
(VI)
mg/L
<0.006
<0.10
<0.006
<0.10
0.011
0.008
0.0001–0.010
0.01
0.05
0.05
0.1
>0.1
0.05
Mercury
mg/L
<0.0001
<0.00075
<0.00005
0.0032
0.0003
0.0003
–0.001
0.001
0.001
0.005
>0.005
0.006
COD
mg/L
––
5.00
151.00
–24.18
––
––
––
–
BOD5
mg/L
––
0.25
57.6
–4.58
––
––
––
–
Nitrates
mg/L
––
7.11
35.10
–19.65
0–5
1025
50100
>100
50
Totalnitrogen
mg/L
––
2.96
7.93
–4.81
––
––
––
–
Organicelem
ents
PAH
μg/L
<0.02
0.520
<0.02
0.460
0.080
0.076
0.000001–0.0001
0.0001
0.0002
0.0003
0.0005
>0.0005
–
71 Page 8 of 21 Environ Monit Assess (2021) 193: 71

Tab
le4
Scopeandaveragevalues
ofphysicochemicalelem
entsof
groundwater
quality
classon
outflow
Physicochemicalelem
ents
Unit
Piezometer
P1a
P4
P5
P6P1
P4
Min
Max
Average
Groundw
ater
depth
m2.50
4.90
2.50
4.20
2.10
5.10
1.80
4.50
3.76
3.46
Generalelem
ents
pH6.7
7.7
6.6
8.1
6.6
7.9
6.7
8.4
7.1
7.1
Tem
perature
°C6.3
174.90
15.6
615.4
3.90
16.20
11.21
9.94
EC
mS/cm
0.5
1.3
0.5
1.2
0.4
1.1
0.3
1.6
0.8
0.9
TOC
mg/L
<0.036
14.60
<0.5
120.50
16<1
122.74
3.83
Inorganicelem
ents
Lead
mg/L
0.0002
<0.050
0.0002
<0.050
0.0002
<0.05
0.0002
<0.050
0.0043
0.0046
Cadmium
mg/L
<0.0001
<0.010
<0.0001
<0.010
<0.0001
<0.010
<0.0001
<0.010
0.001
0.001
Copper
mg/L
<0.002
0.019
<0.002
<0.02
<0.002
0.013
<0.002
<0.02
0.004
0.004
Zinc
mg/L
<0.010
0.390
<0.020
0.270
<0.020
0.198
0.002
0.034
0.050
0.048
Chrom
ium
(VI)
mg/L
<0.006
<0.10
<0.006
<0.10
<0.006
<0.10
<0.006
<0.10
0.009
0.011
Mercury
mg/L
<0.00005
<0.0001
<0.00005
0.00110
<0.00005
0.0011
<0.00005
<0.0015
0.00018
0.00023
COD
mg/L
<10
<10
<10
132
<10
263
<10
165
22.58
BOD5
mg/L
<0.50
1.6
<0.5
7.1
<0.5
8.2
<0.5
0.9
0.43
1.79
Nitrates
mg/L
15.20
39.70
0.01
45.40
0.01
21.40
<4.5
16.3
25.85
17.64
Totalnitrogen
mg/L
4.07
9.17
1.72
31.80
<0.50
11.60
<0.5
4.26
6.10
6.05
Organicelem
ents
PAH
μg/L
<0.02
0.520
<0.02
1.77
0.008
0.749
<0.02
<1.00
0.035
0.114
Physicochemicalelem
ents
Piezometer
Lim
itvaluein
classes(RegulationMMEIN
2019)
P5P6
Hydrochem
ical
WHO(2017)
Average
background
III
III
IVV
Groundw
ater
depth
3.24
2.81
––
––
––
–
Generalelem
ents
pH7.2
7.3
6.5–8.5
6.5–9.5
<6.59
or>9.5
–
Tem
perature
10.65
10.34
4–20
<10
1216
25>25
–
EC
0.7
0.8
0.2–0.7
0.7
2.5
2.5
3>3.0
–
TOC
3.91
3.85
1–10
510
1020
>20
–
Inorganicelem
ents
Lead
0.0039
0.0045
0.001–0.010
0.01
0.025
0.1
0.1
>0.1
0.01
Cadmium
0.001
0.001
0.0001–0.0005
0.001
0.003
0.005
0.01
>0.01
0.003
Environ Monit Assess (2021) 193: 71 Page 9 of 21 71

the requirements for the introduction of wastewaterinto the water or the ground due to the high concen-tration of TOC, which ranged from 16 to 560 mg/Lwith an average of 61.40 mg/L, twice as high as thelimit value. Landfill leachate was also characterisedby a high COD of 4.50 to 300 mg/L with an averageof 135.92 mg/L, which exceeded the permitted levelby 10.92 mg/L. The average BOD5 concentrationwas lower than permissible by 13.85 mg/L. TheCOD/BOD ratio provided a biodegradability indexof 0.08. Average concentrations of nutrients, includ-ing total N (87.19 mg/L) and N–NO3 (134.50 mg/L),showed that the limit values were exceeded by 3 and4 times, respectively. The PAH concentration inleachate was low (average of 0.109 μg/L). Thehighest concentrations of heavy metals were low,between 0.003 and 0.68 mg/L, the lowest of whichwas for Hg and the highest for Zn (Table 5).
Analysis of research results using advanced statisticaltools
Statistical comparative analysis of 12 physicochemicalvariables of surface waters including TOC, Pb, Cd, Cu,Zn, Cr+6, Hg, BOD5, COD, N, N–NO3 and PAHs withthe Whitney-Mann U test showed no significant differ-ences (p > 0.05).
In contrast, a comparative analysis of groundwaterphysicochemical elements by the Kruskal-Wallisnon-parametric test and the median and multiple posthoc repetition tests showed that only seven indica-tors, i.e. groundwater depth, electrical conductivity,BOD5, TOC, N, N–NO3 and PAHs, differed signif-icantly between piezometers at a significance level ofα = 0.05 (Table 6). Differences in the values ofphysicochemical elements in groundwater werefound between piezometer P3 located at the inflowand piezometers P4, P5 and P6 at the outflow ofgroundwater. In piezometers P5 and P6, a statisticallysignificant lower depth of groundwater was found atthe outflow of water than in piezometer P3 at theinflow. Moreover, the nitrate value in the P4 piezom-eter was significantly higher than in P3. The concen-tration of total nitrogen below the landfill in piezom-eter P3 was significantly lower than in groundwaterat the inflow in piezometers P4 and P5 (Fig. 3). Thesephysicochemical variables, in addition to the depth ofwater, cause deterioration of groundwater qualitywith significantly higher values at point P4. To assessT
able4
(contin
ued)
Physicochemicalelem
ents
Piezometer
Lim
itvaluein
classes(RegulationMMEIN
2019)
P5P6
Hydrochem
ical
WHO(2017)
Average
background
III
III
IVV
Copper
0.004
0.004
0.001–0.020
0.01
0.05
0.2
0.5
>0.5
2
Zinc
0.053
0.047
0.005–0.050
0.05
0.5
12
>2
Chrom
ium
(VI)
0.009
0.010
0.0001–0.010
0.01
0.05
0.05
0.1
>0.1
0.05
Mercury
0.00019
0.00019
–0.001
0.001
0.001
0.005
>0.005
0.006
COD
21.52
9.50
––
––
––
–
BOD5
1.49
0.56
––
––
––
–
Nitrates
5.39
4.58
0–5
1025
50100
>100
50
Totalnitrogen
2.30
1.11
––
––
––
–
Organicelem
ents
––
––
––
PAH
0.090
0.081
0.000001–0.0001
0.0001
0.0002
0.0003
0.0005
>0.0005
–
71 Page 10 of 21 Environ Monit Assess (2021) 193: 71

the impact of the landfill on the physicochemicalstate of surface and groundwater, Spearman’s R testwas used to analyse the correlation between water inthe mountain river (W2) and piezometers below thelandfill (P4, P5, P6) and leachate from the landfill,taking into account the variables mentioned above (p< 0.05).
Statistical analysis of the correlation of physico-chemical indicators of surface water and leachateshowed that four of the examined indicators, i.e.pH, temperature, Cr+6 and Hg, were statistically sig-nificantly correlated below the landfill. The correla-tion analysis shows that the average relationship fol-lowing with the highest coefficient (r = 0.57) oc-curred between point W2 and leachate in case oftemperature. In the case of Cr+6 and Hg, the correla-tion coefficient did not exceed 0.50 (Stanisz 2006)(Table 7).
Based on the assessment of the impact of thelandfill on the physicochemical state of groundwater,a statistically negative correlation between water inthe P6 piezometer and leachate was observed forBOD5. In the same piezometer, three compoundsconsidered to be high (temperature, Cd and Zn) weresignificantly positively correlated between ground-water and leachate (Fig. 4). Furthermore, water inthe P4 piezometer was significantly positively
correlated with the leachate only in the case of twoPAH and Zn designations. In contrast, undergroundwater examined in P5 was statistically significantlycorrelated with leachates based on two Cd and Znindicators at the average level. The most correlativecompounds were found in point P6 below the land-fill, at the most remote and at the lowest water level(Tables 2 and 8).
The assessment of the relationship between the pointsof study of the physicochemical state of the watersbelow the landfill showed significant positive correla-tions for eight indicators. The most statistically signifi-cant variables included temperature, Pb, Cd, Cu and Hg.A strong correlation occurred between W2 and threepiezometric points (P4–P6; r = 0.99–1.00) in Pbconcentrations. There was a strong correlation be-tween the examined points of Cd and Hg and high(P6), average (P4) and high (P5) Cu concentra-tions. There were also single correlation compoundstaking into account N–NO3 as well as heavy metals Znand Cr+6 (Fig. 5). The latter designations werecharacterised by a very high and high correlation, re-spectively (Table 9).
The statistical analysis of surface water, groundwaterand leachate quality testing showedmostly a statisticallysignificant decreasing trend (p = 0.00–0.04) (Table 10).In surface water (W1, W2), the detected upward trend
Table 5 Statistical parameters describing values of pollution indicators in the leachate from municipal solid waste landfill site andadmissible values
Pollution indicators Unit Min Max Average The highest admissible values in accordancewith Regulation MMEIN (2019)
pH 7 9 7 6.5–12.5
Temperature °C 5.80 19.90 12 35
EC mS/cm 1.34 8.20 3.91 –
TOC mg/L 16 560 61.40 30
Lead mg/L 0.0003 < 0.05 0.02 0.5
Cadmium mg/L < 0.0005 0.005 0.002 0.4
Copper mg/L < 0.005 0.03 0.01 0.5
Zinc mg/L < 0.025 0.68 0.06 2
Chromium (VI) mg/L < 0.006 0.05 0.01 0.1
Mercury mg/L 0.0001 0.003 0.0004 0.06
COD mg/L 4.50 300 135.92 125
BOD5 mg/L 1.60 34 11.15 25
Nitrates mg/L 0.92 629 134.50 30
Total nitrogen mg/L 3.20 222 87.19 30
PAH μg/L 0.004 2.420 0.109 –
Environ Monit Assess (2021) 193: 71 Page 11 of 21 71

Table 6 Comparison of physicochemical elements values between piezometers using non-parametric Kruskal-Wallis test
Physicochemical elements Piezometres P1a P2 P3 P4 P5 P6
Groundwater depth (m) P1a 0.3881 1.0000 0.9866 0.0007 0.0000a
P2 0.3881 0.9471 1.0000 1.0000 0.0926
P3 1.0000 0.9471 1.0000 0.0052 0.0000
P4 0.9866 1.0000 1.0000 0.7584 0.0007
P5 0.0007 1.0000 0.0052 0.7584 0.2443
P6 0.0000 0.0926 0.0000 0.0007 0.2443
EC (mS/cm) P1a 0.610480 1.000000 0.224188 0.010076 1.000000
P2 0.610480 0.242471 1.000000 0.000045 0.341130
P3 1.000000 0.242471 0.061949 0.056110 1.000000
P4 0.224188 1.000000 0.061949 0.000000 0.116202
P5 0.010076 0.000045 0.056110 0.000000 0.088865
P6 1.000000 0.341130 1.000000 0.116202 0.088865
BOD5 (mg/L) P1a 1.000 0.004 0.003 1.000
P3 1.000 0.442 0.442 1.000
P4 0.004 0.442 1.000 0.383
P5 0.003 0.442 1.000 0.397
P6 1.000 1.000 0.383 0.397
COD (mg/L) P1a 0.0560 0.0002 0.0027 1.0000
P3 0.0560 1.0000 1.0000 1.0000
P4 0.0002 1.0000 1.0000 0.8212
P5 0.0027 1.0000 1.0000 1.0000
P6 1.0000 1.0000 0.8212 1.0000
TOC (mg/L) P1a 0.001 1.000 0.158 0.179 0.043
P2 0.001 0.134 1.000 0.631 1.000
P3 1.000 0.134 1.000 1.000 1.000
P4 0.158 1.000 1.000 1.000 1.000
P5 0.179 0.631 1.000 1.000 1.000
P6 0.043 1.000 1.000 1.000 1.000
Total nitrogen (mg/L1) P1a 1.000 0.551 0.0000 0.0000
P3 1.00000 1.000 0.0018 0.0038
P4 0.55071 1.000 0.0017 0.0053
P5 0.00000 0.002 0.002 1.0000
P6 0.00003 0.004 0.005 1.0000
Nitrates (mg/L) P1a 1.0000 0.1496 0.0000 0.0003
P3 1.0000 1.0000 0.0001 0.0203
P4 0.1496 1.0000 0.0009 0.1018
P5 0.0000 0.0001 0.0009 1.0000
P6 0.0003 0.0203 0.1018 1.0000
PAH (μg/L) P1a 1.000 0.085 1.000 1.000 0.054
P2 1.000 1.000 1.000 1.000 0.912
P3 0.085 1.000 1.000 1.000 1.000
P4 1.000 1.000 1.000 1.000 1.000
P5 1.000 1.000 1.000 1.000 1.000
P6 0.054 0.912 1.000 1.000 1.000
a Italic value of statistics means. that the relationship is statistically significant at p < 0.05
71 Page 12 of 21 Environ Monit Assess (2021) 193: 71

included pH significantly (p = 0.03–0.04). In addition,Cd (W1), COD (W2), Cu, Hg, PAH and N (W1, W2)were characterised by a significant decreasing trend (p =0.000–0.012).
The analysis of the results of the groundwaterquality survey showed a significant upward trendof variables including depth of groundwater (P6),electrical conductivity (P4), COD (P3) and N–NO3 (P5)at p = 0.001–0.022. The pH (P4, P6), N (P4), COD (P5),PAH (P1a), TOC (P1a, P5, P6), Cu and Cd (P1a–P6),Pb (P2) and Hg (P1a–P5) followed a significant decreas-ing trend (p = 0.001–0.022).
Analysis of leachate contamination confirmed only asignificant decreasing trend in N, N–NO3, COD, PAHand Cd (p = 0.000–0.04).
Figure 6 shows a dendrogram containing a groupingof leachate physicochemical indicators, based on the
assumption that the optimal number of clusters is two,divided into five subgroups: (1) TOC and PAHs, (2)heavy metals (Cd, Cu), (3) electrical conductivity, (4)heavy metals (Pb, Hg, Zn, Cr+6) and (5) pH.
Discussion
One of the important factors affecting the composi-tion of leachate is both the volume and compositionof the deposited waste. The average amountdeposited at the examined small landfill over9 years was 658.29 Mg. At a small landfill site,Przydatek and Kanownik (2019) showed almost halfthe amount of waste deposited.
The deterioration of surface water quality in thevicinity of the landfill site, both above and below, was
Fig. 3 Differences between piezometers
Environ Monit Assess (2021) 193: 71 Page 13 of 21 71

caused by values of electrical conductivity, Cr+6,BOD5, COD, N and N–NO3. In particular, the increasedelectrical conductivity at two points confirmed the pol-
lution of these waters at the non-class level.Grygorczuk-Petersons and Wiater (2016) also showeda deterioration in the quality of surface water due toincreased electrical conductivity. However, no statisti-cally significant differences were found between the testpoints located in the riverbed below and above thelandfill. Furthermore, the only upward trend detectedin these waters was pH. According to Maqbool et al.(2011), the contamination of surface water is moreserious than that of groundwater, because untreatedleachate from the landfill can come into direct contactwith streams, causing serious pollution.
The deterioration of groundwater quality in thearea of the landfill site was mainly caused by in-creased PAH concentration significantly exceedingthe acceptable level of water quality, causing it tobe classified as the worst out-of-class quality, as wellas by water inflow. The concentration of this organiccompound class in the leachate was low, below 0.12μg/L. Malakahmad et al. (2016) showed that PAHsoriginate mainly from anthropogenic processes, inparticular from the incomplete combustion of organicfuels, and are widely distributed in the environment.Generally, this indicates that pollutants transported ingroundwater, with a much slower flow than thesurface water, can enter the latter through theinflow. Förstner and Wittmann (1979) showed thatin general, groundwater advection to surface water islow; however, the concentration of pollution in-creases when the surface water percolates via sedi-
Table 7 Correlation dependence of physicochemical elementsbetween water in point W2 and leachate from the landfill site
Parameter Points Correlation coefficient R
Leachate
General elements
pH W2 0.41a
Temperature (°C) W2 0.57
EC (mS/cm) W2 0.34
TOC (mg/L) W2 0.07
Inorganic elements
Lead (mg/L) W2 −0.25Cadmium (mg/L) W2 0.21
Copper (mg/L) W2 −0.25Zinc (mg/L) W2 0.29
Chromium (VI) (mg/L) W2 0.49
Mercury (mg/L) W2 0.45
COD (mg/L) W2 −0.16BOD5 (mg/L) W2 0.07
Nitrates (mg/L) W2 0.09
Total nitrogen (mg/L) W2 0.02
Organic elements
PAH (μg/L) W2 0.001
a Italic value of statistics means that the relationship is statisticallysignificant at p < 0.05
Fig. 4 Significantly positivelycorrelation (Zn) between ground-water and surface water belowlandfill site
71 Page 14 of 21 Environ Monit Assess (2021) 193: 71

mentation. The occurrence of one of these processesis indicated by increased concentration of PAHs(Przydatek and Kanownik 2019), which at high con-centrations both at inflow and outflow confirms theexistence of an anthropogenic source. The presenceof N–NO3 in groundwater is also considered to be aconsequence of the anthropogenic inputs (Cossuet al. 2018). Regarding the examined landfill, thisconfirms the deterioration of the groundwater qualityat outflow due to significantly higher PAH concen-trations (the lowest average exceeding 3 mg/L) andan upward trend. Ahmed and Sulaiman (2001) andPrzydatek (2019a) showed a low concentration ofPAHs with a significant increase in the outflow fromthe landfill area. Notably, the deterioration ofgroundwater quality was similarly affected by anincrease in temperature, the highest average of whichwas 11.21 °C. Galarpe and Parilla (2012) showed amuch higher groundwater temperature in the area ofthe landfill, which exceeded 25 °C. The deteriorationof water quality in the area of the landfill was causedby Zn concentration in addition to the increasedtemperature. The most statistically significant rela-tionships were between the temperature of ground-water and Zn, as the average concentration of Znexceeded acceptable limits by 0.03 mg/L with thehighest 0.390 mg/L, as well as the occurrence ofsignificant correlations with leachate and surface wa-ters below the landfill.
Among the heavy metals studied, the concentra-tion of Zn was the highest in groundwater. Similarly,Foufou et al. (2017) observed excess Zn in the ex-amined groundwater. Concentrations of Cr+6, Cd,Cu, Pb and Hg remained at a low level, similar tothe neutral reaction. Kapelewska et al. (2016)
Table 8 Correlation dependence of physicochemical elementsbetween water in piezometers P4, P5 and P6 and leachate fromthe landfill site
Parameter Points Correlation coefficient R
Leachate
General elements
pH P4 0.19
P5 0.20
P6 0.40
Temperature (°C) P4 0.44
P5 0.61
P6 0.55
EC (mS/cm) P4 −0.14P5 0.04
P6 − 0.13
TOC (mg/L) P4 − 0.11
P5 0.02
P6 − 0.24
Inorganic elements
Lead (mg/L) P4 − 0.21
P5 − 0.14
P6 − 0.19
Cadmium (mg/L) P4 0.37
P5 0.37
P6 0.56
Copper (mg/L) P4 − 0.34
P5 − 0.29
P6 0.16
Zinc (mg/L) P4 0.52
P5 0.51
P6 0.62
Chromium (VI) (mg/L) P4 0.29
P5 0.12
P6 0.08
Mercury (mg/L) P4 0.13
P5 0.14
P6 0.19
COD (mg/L) P4 0.38
P5 0.01
P6 − 0.32
BOD5 (mg/L) P4 − 0.10
P5 0.21
P6 − 0.99
Nitrates (mg/L) P4 − 0.21
P5 − 0.32
P6 –
Table 8 (continued)
Parameter Points Correlation coefficient R
Total nitrogen (mg/L) P4 − 0.01
P5 −0.06P6 − 0.22
Organic elements
PAH (μg/L) P4 0.58
P5 −0.01P6 0.07
Environ Monit Assess (2021) 193: 71 Page 15 of 21 71

observed a neutral water reaction in the area of thelandfill. However, it should be noted that in the caseof Cd at an average concentration of 0.001 mg/Lbelow the landfill, there was a high correlation inthe relationship between groundwater and leachateand two types of water below the landfill. HigherCd concentrations (0.07 mg/L) in groundwater inthe area of the landfill were also observed by Idreeset al. (2018). Iwuoha and Akinseye (2019) attributedsignificant toxicity to this element. The strongestcorrelations were found in the study of groundwaterquality at the lowest piezometric point of the outflow,with a noticeable downward trend in the water table,which may be related to the direction of groundwaterflow (Boateng et al. 2019). Other researchers foundthat the degree of contamination of aquifers dependson the speed of transport of the pollutants and theflow conditions at the point where they penetrate thesoil structure (Vasanthi et al. 2008; Szymkiewiczet al. 2018). Han et al. (2016) showed that the nega-tive impact of landfills could reach up to 1000 m.
The tested composition of leachate from the oldlandfill did not meet the requirements for the intro-duction of wastewater into the water or soil due tothe high average concentration of TOC of 61.40 mg/L. TOC and PAH were considered to be similarrelationships because they remained in the samefocus. Liu et al. (2013) showed a strong correlationbetween these designations in surface water. The
average COD concentration of 135.92 mg/L washigh in the leachate.
Accordingly, Cheibub et al. (2014) considered meet-ing an acceptable COD to be generally possible with thecombined processes of coagulation/flocculation and theFenton process of leachate treatment from landfills. Theconcentration of total N was 87.19 mg/L and N–NO3
was 134.50 mg/L, also high values. The main compo-nent of nitrogen in leachate is usually the decompositionof complex nitrogen compounds in solid waste (Al-Yaqout and Hamoda 2020). The leachate’s biodegrad-ability changes over time, which can be observed fromthe BOD5/COD ratio, for which a result below 0.1confirms that the sample originated from an old andmature landfill (Amor et al. 2015; Kamaruddinet al. 2015). Its location near the riverbed indicates thatthe landfill is mature (Noerfitriyani et al. 2018). Incomparison, a higher value of the biodegradability indexwas shown by Atta et al. (2015) in a landfill in a tropicalclimate. According to Kapelewska et al. (2019) and Deet al. (2016), the landfills’ age significantly affects theleachate composition; hence, the heavy metals in theleachate were at a low level with the highest zinc con-centration at 0.68 mg/L. In general, the concentration ofmetals in the analysed leachates was characterised by adownward trend.
Some researchers (e.g. De Schamphelaereet al. 2005; Heijerick et al. 2009) have noted that TOCinfluences the toxicity of Zn in the aquatic environment.
Fig. 5 Significantly positivelycorrelation (Zn) between ground-water and leachate below landfillsite
71 Page 16 of 21 Environ Monit Assess (2021) 193: 71

The average Zn concentration was at a very low level,not exceeding mg/L. Boateng et al. (2019) indicated thatthe mean Zn concentration in the leachate at landfill inGhana was above the acceptable level (6.092mg/L).Similarly, Abiriga et al. (2020) showed an increasedconcentration of this microelement (max 5.739 mg/L)in groundwater near a landfill in Norway. The study ofleachate from a landfill site used since the 1990s usingstatistical tools confirmed the interaction between leach-ate and underground and surface waters, as demonstrat-ed in several studies (Przydatek 2019a; Przydatek andKanownik 2019; Vahabian et al. 2019). According toRana et al. (2018), an applied multidimensional statisti-cal analysis is used in environmental monitoring ordataset modelling to reduce dimensionality and devia-tion, which is helpful in data evaluation.
The negative impact of the landfill on groundwater,according to Han et al. (2016), is considered to be mostintense in the area of landfills when they are less than 20years old. In turn, Tenodi et al. (2020) showed a nega-tive impact on groundwater, even in a new landfill. Thereason for the demonstrated negative impact after morethan 20 years of landfill use could be the poor efficiencyof the existing leachate treatment system, as suggestedby Rowe (2005), or the leachate collection system,according to Liu et al. (2018). Another reason could beleakage of leachate through the geomembrane as a resultof manufacturing and construction defects, as well asvapour diffusion through the padding (Pantiniet al. 2014). Another reason for water pollution belowof the landfill given by Thomsen et al. (2012) wassurface runoff. However, the latter factor is unlikely tobe the case because the analysed landfill has a stableembankment as indicated by the lack of leachate inter-action with surface waters.
Table 9 Correlation dependence of physicochemical elementsbetween water in point W2 and groundwater in piezometers P4,P5 and P6 below landfill site
Parameter Points Correlation coefficient R
W2
General elements
pH P4 0.06
P5 − 0.02
P6 0.12
Temperature (°C) P4 0.60
P5 0.70
P6 0.87
EC (mS/cm) P4 −0.04P5 0.14
P6 0.06
TOC (mg/L) P4 0.13
P5 0.26
P6 0.31
Inorganic elements
Lead (mg/L) P4 0.99
P5 1.00
P6 1.00
Cadmium (mg/L) P4 0.74
P5 0.76
P6 0.73
Copper (mg/L) P4 0.44
P5 0.51
P6 0.91
Zinc (mg/L) P4 0.27
P5 0.67
P6 0.32
Chromium (VI) (mg/L) P4 0.34
P5 0.36
P6 0.35
Mercury (mg/L) P4 0.54
P5 0.63
P6 0.62
COD (mg/L) P4 0.10
P5 0.01
P6 0.06
BOD5 (mg/L) P4 − 0.07
P5 0.09
P6 −0.65Nitrates (mg/L) P4 0.71
P5 − 0.10
P6 − 0.47
Table 9 (continued)
Parameter Points Correlation coefficient R
Total nitrogen (mg/L) P4 0.10
P5 − 0.08
P6 − 0.27
Organic elements
PAH (μg/L) P4 0.38
P5 0.30
P6 − 0.17
Environ Monit Assess (2021) 193: 71 Page 17 of 21 71

Conclusions
Based on the 9-year analysis of the quality of the waterenvironment in the area of a small landfill, the followingconclusions may be drawn:
& The quality of water in the area of the landfill belowits location resulted in changes in the classificationof its quality, confirming the negative impact of asmall and organized municipal landfill on ground-water quality.
& The deterioration of water quality, both above andbelow the landfill, was influenced by the excessiveconcentration of PAH, causing it to be classified asthe worst non-class quality.
& The use of 8 advanced statistical methods has thor-oughly analysed the occurrence of interactions be-tween leachate and groundwater and betweengroundwater and surface water in the closest vicinityof the landfill.
& A significant factor in the deterioration of ground-water quality was an increase in the temperature ofthe tested groundwater and a positive correlationbetween the leachate and the groundwater and be-tween the surface and underground waters below thelandfill for toxic Zn.
& The identification of the negative impact of thelandfill was also influenced by the highest numberof correlations in groundwater below the landfillwith regard to temperature, Cd and a significantN–NO3 difference.
& Most correlations were found at the lowest and out-ermost piezometric point at the groundwater outflow.
Table 10 Time trends of examined parameters quality of waterand leachate
Variable Point Trend Probability (p)
Surface water
Cadmium W1 ↓ 0.001
COD W2 ↓ 0.012
Copper W1 ↓ 0.001
Copper W2 ↓ 0.009
Mercury W1 ↓ 0.000
Mercury W2 ↓ 0.000
PAH W1 ↓ 0.010
pH W1 ↑ 0.04
pH W2 ↑ 0.03
Total nitrogen W1 ↓ 0.005
Total nitrogen W2 ↓ 0.005
Groundwater
Groundwater depth P6 ↑ 0.022
pH P4 ↓ 0.017
pH P6 ↓ 0.008
EC P4 ↑ 0.015
Total nitrogen P4 ↓ 0.021
COD P3 ↑ 0.014
COD P5 ↓ 0.002
PAH P1A ↓ 0.035
TOC P1A ↓ 0.001
TOC P5 ↓ 0.015
TOC P6 ↓ 0.001
Copper P1A ↓ 0.000
Copper P3 ↓ 0.000
Copper P4 ↓ 0.000
Copper P5 ↓ 0.000
Copper P6 ↓ 0.002
Cadmium P1A ↓ 0.001
Cadmium P3 ↓ 0.005
Cadmium P4 ↓ 0.034
Cadmium P5 ↓ 0.016
Cadmium P6 ↓ 0.009
Lead P2 ↓ 0.031
Mercury P1A ↓ 0.0000
Mercury P3 ↓ 0.00001
Mercury P4 ↓ 0.00005
Mercury P5 ↓ 0.00001
Mercury P6 ↓ 0.00004
Nitrate P5 ↑ 0.001
Table 10 (continued)
Variable Point Trend Probability (p)
Leachate
Total nitrogen – ↓ 0.02
Nitrates – ↓ 0.001
COD – ↓ 0.04
PAH – ↓ 0.01
Cadmium – ↓ 0.000
Italic value of statistics means that the relationship is statisticallysignificant at p = 0.05
71 Page 18 of 21 Environ Monit Assess (2021) 193: 71

& The demonstrated adverse impact of the landfilledwaste, despite its organized form, may have been aconsequence of physical defects of the sealingscreen on the ground of the landfill or limited effi-ciency of the leachate collection system.
Acknowledgements The study was sponsored by a scholarshipno. DNR.350-8/20 obtained from State University of AppliedSciences in Nowy Sącz.
Open Access This article is licensed under a Creative CommonsAttribution 4.0 International License, which permits use, sharing,adaptation, distribution and reproduction in anymedium or format,as long as you give appropriate credit to the original author(s) andthe source, provide a link to the Creative Commons licence, andindicate if changes were made. The images or other third partymaterial in this article are included in the article's CreativeCommons licence, unless indicated otherwise in a credit line tothe material. If material is not included in the article's CreativeCommons licence and your intended use is not permitted bystatutory regulation or exceeds the permitted use, you will needto obtain permission directly from the copyright holder. To view acopy of this l icence, vis i t ht tp: / /creat ivecommons.org/licenses/by/4.0/.
References
Abiriga, D., Vestgarden, L. S., & Klempe, H. (2020).Groundwater contamination from a municipal landfill: effectof age, landfill closure, and season on groundwater chemis-try. Science of the Total Environment, 737, 140307.
Ahmed, A. M., & Sulaiman, W. N. (2001). Evaluation groundwa-ter and soil pollution in a landfill area using electrical resis-tivity imaging survey. Environmental Management, 28(5),655–663.
Al-Yaqout, A., & Hamoda, M. F. (2020). Long-term temporalvariations in characteristics of leachates from a closed landfillin an arid region. Water, Air, & Soil Pollution, 231, 319.
Amor, C., De Torres-Socías, E., Peres, J. A., Maldonado, M. I.,Oller, I., Malato, S., & Lucas, M. S. (2015). Mature landfillleachate treatment by coagulation/flocculation combinedwith Fenton and solar photo-Fenton processes. Journal ofHazardous Materials, 286, 261–268. https://doi.org/10.1016/j.jhazmat.2014.12.036.
APHA. (2007). Standard method for the examination of water andwastewater. USA: In American public health association.Washington.
Atta, M., Yaacob, W. Z. W., & Jaafar, O. B. (2015). The potentialimpact of leachate-contaminated groundwater of an ex-landfill site at Taman Beringin Kuala Lumpur, Malaysia.Environmental Earth Sciences, 73, 3913–3923.
Aziz, S., Bashir, M., Aziz, H., Mojiri, A., Abu, A. S., & Maulood,Y. (2018). Statistical analysis of municipal solid waste land-fill leachate characteristics in different countries. ZancoJournal of Pure and Applied Sciences, 30(6), 85–96.
Aziz, S. Q., Aziz, H. A., Bashir, M. J. K., & Mojiri, A. (2015).Assessment of various tropical municipal landfill leachatecharacteristics and treatment opportunities. Global NESTJournal, 17, 1–3.
Barbieri, M., Sappa, G., Vitale, S., Parisse, B., & Battistel, M.(2014). Soil control of trace metals concentrations in landfill:a case study of the largest landfill in Europe, Malagrotta,Rome. Journal of Geochemical Exploration, 143, 146–154.
Boateng, T. K., Opoku, F., & Akoto, O. (2019). Heavy metalcontamination assessment of groundwater quality: a casestudy of Oti landfill site, Kumasi. Applied Water Science, 9,33.
Fig. 6 Dendrogram containing agrouping of leachatephysicochemical indicators
Environ Monit Assess (2021) 193: 71 Page 19 of 21 71

Cheibub, A. F., Campos, J. C., & Da Fonseca, F. V. (2014).Removal of COD from a stabilized landfill leachate by phys-icochemical and advanced oxidative process. Journal ofEnvironmental Science and Health. Part A, Toxic/Hazardous Substances & Environmental Engineering,49(14), 1718–1726.
Chen, R., Teng, Y., Chen, H., Hu, B., & Yue, W. (2019).Groundwater pollution and risk assessment based on sourceapportionment in a typical cold agricultural region inNortheastern China. Science of the Total Environment, 696,133972.
Cossu, R., Zuffianò, L. E., Limoni, P. P., De Giorgio, G.,Pizzardini, P., Miano, T., Mondelli, D., Garavaglia, R.,Carella, C., & Polemio, M. (2018). How can the role ofleachate on nitrate concentration and groundwater qualitybe clarified? An approach for landfills in operation(Southern Italy). Waste Management, 77, 156–165.
De Schamphelaere, K. A. C., Lofts, S., & Janssen, C. R. (2005).Bioavailability models for predicting acute and chronic tox-icity of zinc to algae, daphnids, and fish in natural surfacewaters. Environmental Toxicology and Chemistry, 24(5),1190–1197.
De, S., Maiti, S., Hazra, T., Debsarkar, A., & Dutta, A. (2016).Leachate characterization and identification of dominant pol-lutants using leachate pollution index for an uncontrolledlandfill site. Global Journal of Environmental SciencesManagement, 2(2), 177–186.
Enekwechi, L. O., & Longe, E. O. (2007). Investigation on poten-tial groundwater impacts and influence on local hydrology onnatural attenuation of leachate at a municipal landfill.International journal of Environmental Science andTechnology, 4(1), 133–140.
Eurostat. (2018). https://ec.europa.eu/eurostat/statisticsexplained.Accessed 31 Aug 2020
Förstner, U., &Wittmann, G. T. W. (1979).Metal pollution in theaquatic environment. Berlin Heidelberg New York:Springer-Verlag ISBN 978–3–642-69385-4.
Foufou, A., Djorfi, S., Haied, N., Kechiched, R., Azlaoui, M., &Hani, A. (2017). Water pollution diagnosis and risk assess-ment of Wadi Zied plain aquifer caused by the leachates ofAnnaba landfill (N-E Algeria). Energy Procedia, 119, 393–406.
Galarpe, V. R. K., & Parilla, R. B. (2012). Influence of seasonalvariation on the bio-physicochemical properties of leachateand groundwater in Cebu City sanitary landfill, Philippines.International Journal of Chemical and EnvironmentalEngineering, 3(3), 24.
Gibrilla, A., Bam, E. K. P., Adomako, D., Ganyaglo, S., Osae, S.,Akiti, T. T., Kebede, S., Achoribo, E., Ahialey, E., Ayanu,G., & Agyeman, E. K. (2011). Application of water qualityindex (WQI) and multivariate analysis for groundwater qual-ity assessment of the Birimian and cape coast Granitoidcomplex: Densu River basin of Ghana. Water QualityExposure and Health, 3(2), 63–78.
Grygorczuk-Petersons, E., & Wiater, J. (2016). Effect of sealedmunicipal waste landfill on the quality of underground water.J. Ecol. Eng., 17(1), 123–130.
Han, Z., Ma, H., Shi, G., He, L., Wei, L., & Shi, Q. (2016). Areview of groundwater contamination near municipal solidwaste landfill sites in China. The Science of the TotalEnvironment, 569, 1255–1264.
Heijerick, D. G., De Schamphelaere, K. A. C., & Janssen, C. R.(2009). Predicting acute zinc toxicity for daphnia magna as afunction of key water chemistry characteristics: developmentand validation of a biotic ligand model. EnvironmentalToxicology and Chemistry, 21(6), 1309–1315. https://doi.org/10.1002/etc.5620210628.
Idrees, N., Tabassum, B., Allah, E. F. A., Hashem, A., Sarah, R.,& Hashim, M. (2018). Groundwater contamination withcadmium concentrations in some West U.P. Regions, India.Saudi Journal of Biological Sciences, 25(7), 1365–1368.
Iwuoha, G. N., & Akinseye, A. (2019). Toxicological symptomsand leachates quality in Elelenwo, Rivers State, Nigeria.Chemistry International, 5(3), 198–205.
Kamaruddin, M. A., Yusoff, M. S., Aziz, H. A., & Hung, Y. T.(2015). Sustainable treatment of landfill leachate. AppliedWater Science, 5, 113–126.
Kapelewska, J., Kotowska, U., & Wiśniewska, K. (2016).Determination of personal care products and hormones inleachate and groundwater from Polish MSW landfills byultrasound-assisted emulsification microextraction and GC-MS. Environmental Science and Pollution Research, 23,1642–1652. https://doi.org/10.1007/s11356-015-5359-9.
Kapelewska, J., Kotowska, U., Karpińska, J., Astel, A., Zieliński,P., Suchta, J., & Algrzym, K. (2019). Water pollution indi-cators and chemometric expertise for the assessment of theimpact of municipal solid waste landfills on groundwaterlocated in their area. Chemical Engineering Journal, 359,790–800.
Kjeldsen, P., Barlaz, M. A., Rooker, A. P., Baun, A., Ledin, A., &Christensen, T. H. (2002). Present and long-term composi-tion of MSW landfill leachate: a review. Critical Reviews inEnvironmental Science and Technology, 32(4), 297–336.
Koda, E., Miszkowska, A., & Sieczka, A. (2017). Levels oforganic pollution indicators in groundwater at the old landfilland waste management site. Applied Sciences, 7(6), 638.
Laner, D., Crest, M., Scharff, H., Morris, J. W. F., & Barlaz, M. A.(2012). A review of approaches for the long-term manage-ment of municipal solid waste landfills.Waste Management,32(3), 498–512.
Liu, Y., Beckingham, B., Ruegner, H., Li, Z., Ma, L., Schwientek,M., Xie, H., Zhao, J., &Grathwohl, P. (2013). Comparison ofsedimentary PAHs in the Rivers of Ammer (Germany) andLiangtan (China): differences between early- and newly-industrialized countries. Environmental Science &Technology, 47(2), 701–709.
Liu, Y., Sun, W., Du, B., & Liu, J. (2018). The physical cloggingof the landfill leachate collection system in China: based onfiltration test and numerical modelling. International Journalof Environmental Research and Public Health, 15(2), 318.https://doi.org/10.3390/ijerph15020318.
Malakahmad, A., Law, M. X., Ng, K.-W., & Manan, T. S. A.(2016). The fate and toxicity assessment of polycyclic aro-matic hydrocarbons (PAHs) in water streams of Malaysia.Procedia Engineering, 148, 806–811.
Maqbool, F., Bhatti, Z., Malik, A., Pervez, A., & Mahmood, Q.(2011). Effect of landfill leachate on the streamwater quality.International Journal of Environmental Research, 5(2), 491–500.
Naveen, B. P., Sumalatha, J., & Malik, R. K. (2018). A study oncontamination of ground and surface water bodies by
71 Page 20 of 21 Environ Monit Assess (2021) 193: 71

leachate leakage from a landfill in Bangalore, India.International Journal of Geotechnical Engineering, 9, 27.
Noerfitriyani, E., Hartono, D. M., Moersidik, S. S., & Gusniani, I.(2018). Impact of leachate discharge from Cipayung Landfillon water quality of Pesanggrahan River, Indonesia. IOPConference Series Earth and Environmental Science,120(1), 012002. https://doi.org/10.1088/1755-1315/120/1/012002.
Pantini, S., Verginelli, I., & Lombardi, F. (2014). A new screeningmodel for leachate production assessment at landfill sites.International journal of Environmental Science andTechnology, 11, 1503–1516.
Patil, C., Narayanakar, S., &Virupakshi, A. (2013). Assessment ofgroundwater quality around solid waste landfill area - a casestudy. International Journal of Innovative Research inScience, Engineering and Technology, 42(7).
Przydatek, G. (2019a). Multi-indicator analysis of the influence ofold municipal landfill sites on the aquatic environment: casestudy. Environmental Monitoring and Assessment, 191, 773.
Przydatek, G. (2019b). The analysis of the possibility of usingbiological tests for assessment of toxicity of leachate from anactive municipal landfill. Environmental Toxicology andPharmacology, 67, 94–101.
Przydatek, G., &Kanownik,W. (2019). Impact of small municipalsolid waste landfill on groundwater quality. EnvironmentalMonitoring and Assessment, 191(3), 169.
Rajaeifara, M. A., Ghanavati, H., Dashti, B. B., Heijungs, R.,Aghbashlo, M., & Tabatabaei, M. (2017). Electricity gener-ation and GHG emission reduction potentials through differ-ent municipal solid waste management technologies: a com-parative review. Renewable and Sustainable EnergyReviews, 79, 414–439.
Rana, R., Ganguly, R., & Gupta, A. K. (2018). Indexing methodfor assessment of pollution potential of leachate from non-engineered landfill sites and its effect on ground water qual-ity. Environmental Monitoring and Assessment, 190, 46.
Regulation of the Minister of Maritime Economy and InlandNavigation of 11 October 2019a on criteria and method ofassessment of the status of groundwater bodies (Journal ofLaws 2019, item 2148).
Regulation of the Minister of Maritime Economy and InlandNavigation of 12 July 2019b on substances particularlyharmful to the aquatic environment and the conditions to bemet when discharging sewage into waters or ground, as wellas discharging rainwater or meltwater into waters or intowater facilities (Journal of Laws 2019, item 1311).
Regulation of the Minister of the Environment of July 21, 2016 onthe classification of the state of surface water bodies andenvironmental quality standards for priority substances(Journal of Laws of 2016, item 1187).
Rowe, R. K. (2005). Long-term performance of contaminantbarrier systems. Geotechnique, 55(9), 631–678.
Singh, A. L., Tripathi, A. K., Kumar, A., & Singh, V. K. (2012).Nitrate and phosphate contamination in ground water ofVaranasi. Journal of Industrial Research & Technology,2(1), 26–32.
Singh, S., Raju, N. J., Gossel, W., & Wycisk, P. (2016).Assessment of pollution potential of leachate from the mu-nicipal solid waste disposal site and its impact on groundwa-ter quality. Varanasi Environs, India. Arabian Journal ofGeosciences, 9(2), 131.
Srivastava, S. K., & Ramanathan, A. L. (2008). Geochemicalassessment of groundwater quality in vicinity of Bhalswalandfill, Delhi, India, using graphical and multivariate statis-tical methods. Environmental Geology, 53, 1509–1528.
Stanisz, A. (2006). Przystępny kurs statystyki z zastosowaniemSTATISTICA-PL na przykładach z medycyny Tom 1.Statystyki podstawowe. Wydawnictwo StatSoftPolska. s.1-343 (in Polish).
S t a t i s t i c s P o l a n d . ( 2 0 1 8 ) . h t t p s : / / b d l . s t a t . g o v .pl/BDL/dane/podgrup/tablica. Accessed 31 Aug 2020
Szymkiewicz, A., Gumuła-Kawęcka, A., Potrykus, D., Jaworska-Szulc, B., Pruszkowska-Caceres, M., & Gorczewska-Langner, W. (2018). Estimation of conservative contaminanttravel time through Vadose zone based on transient andsteady flow approaches. Water, 10(10), 1417. https://doi.org/10.3390/w10101417.
Tałałaj, I. A. (2013). Groundwater and surface water qualityassessment near the closed municipal landfill. Journal ofEcological Engineering, 14(3), 89–98.
Tałałaj, I. A. (2014). Assessment of groundwater quality near thelandfill site using the modified water quality index.Environmental Monitoring and Assessment, 186, 3673–3683.
Tenodi, S., Krčmar, D., Agbaba, J., Zrnić, K., Radenović, M.,Ubavin, D., & Dalmacija, B. (2020). Assessment of theenvironmental impact of sanitary and unsanitary parts of amunicipal solid waste landfill. Journal of EnvironmentalManagement, 258, 110019.
Thomsen, N. I., Milosevic, N., & Bjerg, P. L. (2012). Applicationof a contaminant mass balance method at an old landfill toassess the impact on water resources. Waste Management,32, 2406–2417.
Vahabian, M., Hassanzadeh, Y., & Marofi, S. (2019). Assessmentof landfill leachate in semi-arid climate and its impact on thegroundwater quality case study: Hamedan, Iran.Environmental Monitoring and Assessment, 191(2), 109.https://doi.org/10.1007/s10661-019-7215-8.
Vasanthi, P., Kaliappan, S., & Srinivasaraghavan, R. (2008).Impact of poor solid waste management on ground water.Environmental Monitoring and Assessment, 143, 227–238.
WHO (2017). Drinking Water Parameter Cooperation Project.Support to the revision of Annex I Council Directive 98/83/EC on the Quality of Water Intended for HumanConsumption (Drinking Water Directive).
Zin, M. S. N., Aziz, H. A., Adlan, M. N., & Ariffin, A. (2012). Acharacterization of leachate at Matang landfill site, Perak,Malaysia. Acad Journal of Sciences, 1(2), 317–322.
Publisher’s note Springer Nature remains neutral with regard tojurisdictional claims in published maps and institutionalaffiliations.
Environ Monit Assess (2021) 193: 71 Page 21 of 21 71