user's guide for oracle business intelligence enterprise
TRANSCRIPT
Oracle Business Intelligence Enterprise Edition (OBIEE)
12.2.1.1.0
Author User's Guide

Oracle Fusion Middleware User's Guide for Oracle Business Intelligence Enterprise Edition, 12.2.1.1.0
E72865-04
Copyright © 2015, 2016, Oracle and/or its affiliates. All rights reserved.
Primary Author: Jenny Smalling
Contributors: Oracle Business Intelligence development, product management, and quality assurance teams
This software and related documentation are provided under a license agreement containing restrictions onuse and disclosure and are protected by intellectual property laws. Except as expressly permitted in yourlicense agreement or allowed by law, you may not use, copy, reproduce, translate, broadcast, modify, license,transmit, distribute, exhibit, perform, publish, or display any part, in any form, or by any means. Reverseengineering, disassembly, or decompilation of this software, unless required by law for interoperability, isprohibited.
The information contained herein is subject to change without notice and is not warranted to be error-free. Ifyou find any errors, please report them to us in writing.
If this is software or related documentation that is delivered to the U.S. Government or anyone licensing it onbehalf of the U.S. Government, then the following notice is applicable:
U.S. GOVERNMENT END USERS: Oracle programs, including any operating system, integrated software,any programs installed on the hardware, and/or documentation, delivered to U.S. Government end users are"commercial computer software" pursuant to the applicable Federal Acquisition Regulation and agency-specific supplemental regulations. As such, use, duplication, disclosure, modification, and adaptation of theprograms, including any operating system, integrated software, any programs installed on the hardware,and/or documentation, shall be subject to license terms and license restrictions applicable to the programs.No other rights are granted to the U.S. Government.
This software or hardware is developed for general use in a variety of information management applications.It is not developed or intended for use in any inherently dangerous applications, including applications thatmay create a risk of personal injury. If you use this software or hardware in dangerous applications, then youshall be responsible to take all appropriate fail-safe, backup, redundancy, and other measures to ensure itssafe use. Oracle Corporation and its affiliates disclaim any liability for any damages caused by use of thissoftware or hardware in dangerous applications.
Oracle and Java are registered trademarks of Oracle and/or its affiliates. Other names may be trademarks oftheir respective owners.
Intel and Intel Xeon are trademarks or registered trademarks of Intel Corporation. All SPARC trademarks areused under license and are trademarks or registered trademarks of SPARC International, Inc. AMD, Opteron,the AMD logo, and the AMD Opteron logo are trademarks or registered trademarks of Advanced MicroDevices. UNIX is a registered trademark of The Open Group.
This software or hardware and documentation may provide access to or information about content, products,and services from third parties. Oracle Corporation and its affiliates are not responsible for and expresslydisclaim all warranties of any kind with respect to third-party content, products, and services unlessotherwise set forth in an applicable agreement between you and Oracle. Oracle Corporation and its affiliateswill not be responsible for any loss, costs, or damages incurred due to your access to or use of third-partycontent, products, or services, except as set forth in an applicable agreement between you and Oracle.
Contents
Preface ............................................................................................................................................................. xvii
Audience .................................................................................................................................................... xvii
Documentation Accessibility .................................................................................................................. xvii
Related Documentation and Other Resources ..................................................................................... xvii
Conventions.............................................................................................................................................. xviii
New Features for Oracle Business Intelligence Users .............................................................. xix
New Features for Oracle BI EE 12c (12.2.1) ............................................................................................ xix
1 Introducing Oracle Business Intelligence Enterprise Edition
Introduction to Oracle BI Enterprise Edition........................................................................................ 1-1
Where Do I Store and Manage Oracle BI EE Objects?......................................................................... 1-3
Signing In to Oracle BI Enterprise Edition............................................................................................ 1-4
Signing Out of Oracle BI Enterprise Edition......................................................................................... 1-5
Navigating Oracle BI Enterprise Edition............................................................................................... 1-5
What Is the Oracle BI EE Home Page?................................................................................................... 1-6
What Is the Oracle BI EE Global Header? ............................................................................................. 1-7
Where Can I Get Help or More Information?....................................................................................... 1-9
About Privileges and Permissions ......................................................................................................... 1-9
About Acting for Other Users............................................................................................................... 1-10
Acting for Other Users ........................................................................................................................... 1-10
Setting Preferences.................................................................................................................................. 1-10
Downloading BI Desktop Tools............................................................................................................ 1-11
Topics of Interest in Other Guides ....................................................................................................... 1-12
System Requirements and Certification .............................................................................................. 1-12
How Does Oracle BI EE Interact with Other Products?.................................................................... 1-13
Integration of Oracle BI EE with Oracle BI Publisher ............................................................... 1-13
Integration of Oracle BI EE with Oracle BI Mobile App Designer ......................................... 1-14
Integration of Oracle BI EEwith Oracle Business Intelligence Mobile ................................... 1-14
Integration of Oracle BI EE with Oracle Enterprise Performance Management System..... 1-14
Interaction of Oracle BI EE with Oracle BI Applications.......................................................... 1-15
Integration of Oracle BI EE with Microsoft Office..................................................................... 1-15
iii

2 Creating Analyses
What Is an Analysis? ................................................................................................................................ 2-2
How Do I Work with an Analysis?................................................................................................ 2-2
How Is an Analysis Processed?...................................................................................................... 2-2
How Can I Always See the Most Current Results of an Analysis?........................................... 2-2
What Are Subject Areas and Columns? ................................................................................................ 2-3
What Are the Types of Columns? .................................................................................................. 2-4
How Are Columns Indicated Visually? ........................................................................................ 2-6
Understanding the Double Column Feature ........................................................................................ 2-7
What Is the Analysis Editor?................................................................................................................... 2-8
Managing Panes in the Analysis Editor Tabs............................................................................... 2-9
What Is the Process for Constructing Analyses?.................................................................................. 2-9
Creating New Analyses ......................................................................................................................... 2-10
Specifying the Criteria for Analyses .................................................................................................... 2-10
Understanding Null Suppression ................................................................................................ 2-13
Example 1: Adding a Filter to a Row Edge on a Measure When Null Values Are Included
..................................................................................................................................................... 2-14
Example 2: Adding a Filter to a Row Edge on a Measure When Null Values Are Included
..................................................................................................................................................... 2-15
Example 3: Adding a "Not Null" Filter to a Row Edge on a Measure When Null Values
Are Included.............................................................................................................................. 2-16
Editing the Formula for a Column............................................................................................... 2-17
Combining Columns Using Set Operations ............................................................................... 2-18
Viewing Metadata Information from the Subject Areas Pane ................................................. 2-21
Saving Columns to the Catalog ............................................................................................................ 2-22
Changing the Sort Order of Subject Areas and Subject Area Folders............................................. 2-22
Where Else is the Subject Areas Sort Order Reflected?............................................................. 2-23
Displaying the Results of Analyses...................................................................................................... 2-25
Creating Additional Compound Layouts................................................................................... 2-25
Alerting Users to No Data in the Results of Analyses .............................................................. 2-25
Adding Prompts to Analyses................................................................................................................ 2-26
Examining the Logical SQL Statements for Analyses ....................................................................... 2-26
Saving Analyses ...................................................................................................................................... 2-28
Creating Agents from Analyses............................................................................................................ 2-29
Editing Analyses ..................................................................................................................................... 2-30
About Embedding an Analysis in a Dashboard................................................................................. 2-30
Working with Direct Database Requests............................................................................................. 2-30
Setting Privileges for Direct Requests ......................................................................................... 2-30
Executing a Direct Database Request .......................................................................................... 2-31
Seeing the Results of Direct Database Requests ........................................................................ 2-31
Using Variables ....................................................................................................................................... 2-31
What Are Session Variables? ........................................................................................................ 2-32
iv
What Are Repository Variables? .................................................................................................. 2-32
What Are Presentation Variables? ............................................................................................... 2-33
What Are Request Variables? ....................................................................................................... 2-33
What Are Global Variables? ......................................................................................................... 2-34
Where Can I Reference Variables? ....................................................................................................... 2-35
What Is the Syntax for Referencing Variables? .................................................................................. 2-36
What Predefined Presentation Variables Are Available? ................................................................. 2-39
Example of Referencing a Variable in a Title View ........................................................................... 2-42
4 Adding Views for Display in Dashboards
What Are Views? ...................................................................................................................................... 4-2
What Types of Views Are Available? .................................................................................................... 4-2
What Types of Graphs Are Available?.......................................................................................... 4-6
What Types of Funnel Graphs Are Available? ............................................................................ 4-8
What Types of Graphs Are Available to Trellis Views? ............................................................. 4-8
What Types of Gauges Are Available? ......................................................................................... 4-9
What Types of Logical SQL Views Are Available? ..................................................................... 4-9
What Types of Waterfall Graph Formats Are Available? ........................................................ 4-10
Adding Views to the Results of Analyses ........................................................................................... 4-11
What Is the Recommended Visualizations Feature? ......................................................................... 4-12
Editing Views .......................................................................................................................................... 4-13
Editing Table and Pivot Table Views .......................................................................................... 4-15
Editing Graph Views ..................................................................................................................... 4-18
Editing Trellis Views...................................................................................................................... 4-23
Editing Gauge Views ..................................................................................................................... 4-29
Editing Map Views......................................................................................................................... 4-30
Editing Narrative Views................................................................................................................ 4-39
Editing Column Selector Views ................................................................................................... 4-40
Editing View Selector Views......................................................................................................... 4-41
Editing Legend Views.................................................................................................................... 4-42
Editing Performance Tile Views................................................................................................... 4-42
Editing Treemap Views ................................................................................................................. 4-44
Editing Heat Matrix Views ........................................................................................................... 4-48
v

Modifying the Layout of Data in Views...................................................................................... 4-50
Modifying Values and Performing Write Back.................................................................................. 4-66
About Modifying Values and Various Types of Users............................................................. 4-66
Process for Write Back ................................................................................................................... 4-67
Adding the Write-Back Capability to a Column ....................................................................... 4-67
Adding the Write-Back Capability to a Table View.................................................................. 4-68
About the Modes for Write Back in Views ................................................................................. 4-68
Interactions in Views.............................................................................................................................. 4-69
Click Interactions in Views ........................................................................................................... 4-69
Right-Click Interactions in Views ................................................................................................ 4-70
Drilling in Views..................................................................................................................................... 4-70
In Which Columns Can I Drill? .................................................................................................... 4-70
How Do I Allow Drilling in Columns? ....................................................................................... 4-71
What are the Effects of Drilling on Filters and Selection Steps?.............................................. 4-71
Sorting Data in Views............................................................................................................................. 4-71
Common Sort Functionality.......................................................................................................... 4-72
Sorting Data..................................................................................................................................... 4-73
Clearing Sorts.................................................................................................................................. 4-74
Sorting in Tables and Pivot Tables............................................................................................... 4-74
Example 1: Sorting with a Single Column on Each Edge......................................................... 4-75
Example 2: Sorting with Two Columns on the Row Edge....................................................... 4-76
Example 3: Sorting with Two Measures on the Column Edge................................................ 4-76
Sorting in Graphs by Using the Right-Click Menu ................................................................... 4-77
Resizing Rows and Columns in Table Views, Pivot Table Views, and Advanced Trellis Views 4-79
Saving Views ........................................................................................................................................... 4-79
Renaming Views or Compound Layouts............................................................................................ 4-80
Rearranging Views ................................................................................................................................. 4-80
Printing Views......................................................................................................................................... 4-81
Changing Print and Export Options for Views .................................................................................. 4-81
Previewing How Views Are Displayed on a Dashboard ................................................................. 4-82
Removing Views ..................................................................................................................................... 4-82
Refreshing the Results in Views ........................................................................................................... 4-83
Customizing Views for Delivery to Agent Users............................................................................... 4-83
What Is Master-Detail Linking of Views? ........................................................................................... 4-83
What Are Master Views?............................................................................................................... 4-84
What Are Detail Views? ................................................................................................................ 4-87
How Does Master-Detail Linking of Views Work?................................................................... 4-88
Linking Views in Master-Detail Relationships................................................................................... 4-89
Defining the Master View ............................................................................................................. 4-89
Defining the Detail View............................................................................................................... 4-89
Example of a Table and Graph Linked in a Master-Detail Relationship ............................... 4-91
vi
6 Filtering and Selecting Data for Analyses
Saving Objects as Inline or Named ........................................................................................................ 6-1
What are Inline or Named Objects?............................................................................................... 6-2
What is the Folder Structure for Named Objects?....................................................................... 6-2
Saving Filters as Inline or Named.................................................................................................. 6-2
Saving Groups and Calculated Items as Inline or Named......................................................... 6-2
What are Filters and Selection Steps? .................................................................................................... 6-3
How Do Filters and Selection Steps Differ? ................................................................................. 6-3
Applying Filters to Attribute Columns to Affect Hierarchical Columns................................. 6-4
Working with Selections of Data ............................................................................................................ 6-4
Creating Selection Steps .................................................................................................................. 6-5
Editing Selection Steps..................................................................................................................... 6-6
Saving Selection Steps as a Group Object ..................................................................................... 6-6
Working with Selection Steps and Double Columns.................................................................. 6-6
Creating Column Filters ......................................................................................................................... 6-7
Editing Column Filters ............................................................................................................................ 6-8
Working with the EVALUATE_PREDICATE Function ..................................................................... 6-9
How Can I Use the EVALUATE_PREDICATE Function with a Filter? .................................. 6-9
Adding the EVALUATE_PREDICATE Function to an Inline Filter....................................... 6-10
Applying a Named Filter to an Analysis............................................................................................. 6-10
Combining and Grouping Column Filters.......................................................................................... 6-10
Using a Saved Analysis as a Filter........................................................................................................ 6-11
Creating and Editing the SQL Statements for a Column Filter in an Analysis ............................. 6-12
Working with Calculated Measures .................................................................................................... 6-12
Working with Groups and Calculated Items...................................................................................... 6-13
What are Groups?........................................................................................................................... 6-14
What are Calculated Items? .......................................................................................................... 6-14
Creating Groups and Calculated Items....................................................................................... 6-14
Editing Groups and Calculated Items......................................................................................... 6-16
Adding a Group to Another Analysis ......................................................................................... 6-17
Nesting Groups and Calculated Items ........................................................................................ 6-17
viii
Examples of Calculated Items ...................................................................................................... 6-18
7 Prompting in Dashboards and Analyses
What Are Inline and Dashboard Prompts?........................................................................................... 7-1
What are Column Prompts?.................................................................................................................... 7-2
Other Prompt Types................................................................................................................................. 7-3
What Types of User Input Options Can I Use With a Column or Variable Prompt?..................... 7-3
How Do Prompts Work in Oracle BI Mobile? ...................................................................................... 7-7
Can Dashboard Prompts and Analysis Prompts Interact?................................................................. 7-7
In What Order Does Oracle BI EE Apply Prompts with Default Values?........................................ 7-8
What Is Auto-Complete? ......................................................................................................................... 7-9
Creating a Column Prompt ................................................................................................................... 7-10
Overriding a Selection Step With a Column Prompt ........................................................................ 7-12
Creating an Image Prompt ................................................................................................................... 7-13
Creating a Currency Prompt................................................................................................................. 7-15
Creating a Variable Prompt................................................................................................................... 7-17
Editing Prompts ...................................................................................................................................... 7-18
Adding a Dashboard Prompt to a Dashboard or Dashboard Page................................................. 7-19
Adding a Hidden Dashboard Prompt to a Dashboard or Dashboard Page .................................. 7-19
8 Formatting Analyses, Views, and Dashboard Pages
What Can be Formatted? ......................................................................................................................... 8-1
Applying Formatting to Columns in Analyses............................................................................ 8-1
Applying Formatting to Views....................................................................................................... 8-2
Applying Formatting to Dashboard Pages................................................................................... 8-2
Formatting Columns in Analyses........................................................................................................... 8-2
What Kinds of Formatting Can I Apply?...................................................................................... 8-3
Applying Formatting to a Column ................................................................................................ 8-3
Saving Formatting Defaults ............................................................................................................ 8-4
What is Cosmetic Formatting?................................................................................................................ 8-4
Using a Saved Analysis to Modify the Cosmetic Appearance of Other Analyses ................. 8-4
Applying Conditional Formatting to Tables, Pivot Tables, Performance Tiles, Graphs, Heat
Matrices, and Trellises ........................................................................................................................ 8-6
How is Conditional Formatting Applied?.................................................................................... 8-7
Can Conditional Formats Be Based on Another Column?......................................................... 8-7
What Factors Affect Conditional Formats? .................................................................................. 8-8
Applying Conditional Formatting............................................................................................... 8-11
Example of Conditional Formatting for Ranking...................................................................... 8-12
Storing Custom Files Locally and Using the fmap Function to Reference Them ......................... 8-12
Custom Format Masks ........................................................................................................................... 8-13
Custom Format Strings .......................................................................................................................... 8-16
Custom Format Strings for Date and Time Fields..................................................................... 8-17
Custom Format Strings for Numeric Fields ............................................................................... 8-19
ix
Preface
The Oracle Business Intelligence Foundation Suite is a complete, open, and integratedsolution for all enterprise business intelligence needs, including reporting, ad hocqueries, OLAP (Online Analytical Processing), dashboards, scorecards, and what-ifanalysis.
The Oracle Business Intelligence Foundation Suite includes Oracle BusinessIntelligence Enterprise Edition.
Oracle Business Intelligence Enterprise Edition (Oracle BI EE) is a comprehensive setof enterprise business intelligence tools and infrastructure, including a scalable andefficient query and analysis server, an ad-hoc query and analysis tool, interactivedashboards, proactive intelligence and alerts, and an enterprise reporting engine.
This guide contains information about using Oracle BI EE to organize and present datafor making critical and timely business decisions.
AudienceThis document is intended for anyone who plans to organize and present data formaking critical and timely business decisions using Oracle Business Intelligence, suchas a middle tier administrator, report specialist, departmental reporter, or informationconsumer.
(This guide refers to report specialists and departmental reporters collectively ascontent designers, and to information consumers as end users.) It also includes userswho view analyses on a mobile device.
Documentation AccessibilityFor information about Oracle's commitment to accessibility, visit the OracleAccessibility Program website at http://www.oracle.com/pls/topic/lookup?ctx=acc&id=docacc.
Access to Oracle Support
Oracle customers that have purchased support have access to electronic supportthrough My Oracle Support. For information, visit http://www.oracle.com/pls/topic/lookup?ctx=acc&id=info or visit http://www.oracle.com/pls/topic/lookup?ctx=acc&id=trs if you are hearing impaired.
Related Documentation and Other ResourcesThere are many places where you can find information about this product.
xvii
See the Oracle Business Intelligence documentation library for a list of related OracleBusiness Intelligence documents.
In addition:
• Go to the Oracle Learning Library for Oracle Business Intelligence-related onlinetraining resources.
• Go to the Product Information Center support note (Article ID 1267009.1) on MyOracle Support at https://support.oracle.com.
ConventionsSpecific text conventions are used in this document.
Convention Meaning
boldface Boldface type indicates graphical user interface elements associatedwith an action, or terms defined in text or the glossary.
italic Italic type indicates book titles, emphasis, or placeholder variables forwhich you supply particular values.
monospace Monospace type indicates commands within a paragraph, URLs, codein examples, text that appears on the screen, or text that you enter.
xviii
1Introducing Oracle Business Intelligence
Enterprise Edition
This chapter describes how to get started with Oracle Business Intelligence EnterpriseEdition and explains how to sign in, sign out, and navigate Oracle BI EE. It alsodescribes the Home page, the global header, how to act for others, how to setpreferences, and how Oracle BI EE interacts with other products.
Topics
This chapter includes the following sections:
• Introduction to Oracle BI Enterprise Edition
• Where Do I Store and Manage Oracle BI EE Objects?
• Signing In to Oracle BI Enterprise Edition
• Signing Out of Oracle BI Enterprise Edition
• Navigating Oracle BI Enterprise Edition
• What Is the Oracle BI EE Home Page?
• What Is the Oracle BI EE Global Header?
• Where Can I Get Help or More Information?
• About Privileges and Permissions
• About Acting for Other Users
• Acting for Other Users
• Setting Preferences
• How Does Oracle BI EE Interact with Other Products?
• Downloading BI Desktop Tools
• Topics of Interest in Other Guides
• System Requirements and Certification
Introduction to Oracle BI Enterprise EditionOracle BI Enterprise Edition is a powerful tool for analyzing and presenting data.
Oracle BI Enterprise Edition (sometimes referred to as Oracle Business Intelligence)provides a full range of business intelligence capabilities that allow you to:
Introducing Oracle Business Intelligence Enterprise Edition 1-1
• Collect up-to-date data from your organization
• Present the data in easy-to-understand formats (such as tables and graphs)
• Deliver data in a timely fashion to the employees in your organization
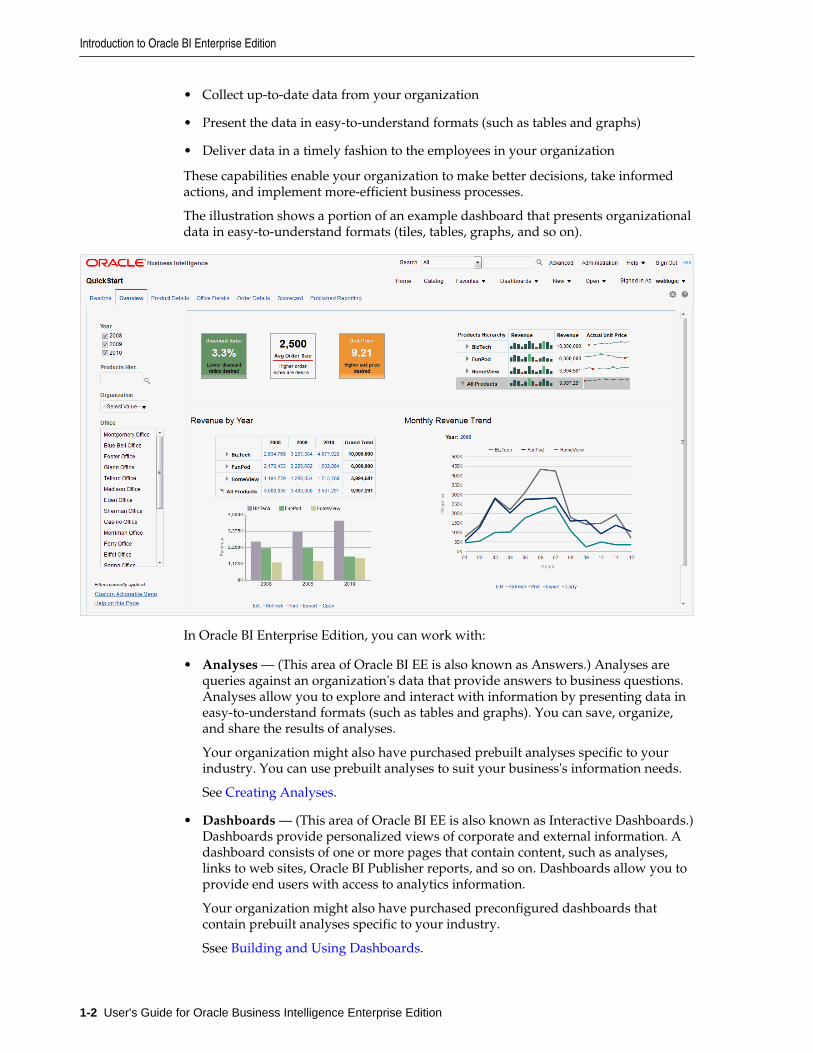
These capabilities enable your organization to make better decisions, take informedactions, and implement more-efficient business processes.
The illustration shows a portion of an example dashboard that presents organizationaldata in easy-to-understand formats (tiles, tables, graphs, and so on).
In Oracle BI Enterprise Edition, you can work with:
• Analyses — (This area of Oracle BI EE is also known as Answers.) Analyses arequeries against an organization's data that provide answers to business questions.Analyses allow you to explore and interact with information by presenting data ineasy-to-understand formats (such as tables and graphs). You can save, organize,and share the results of analyses.
Your organization might also have purchased prebuilt analyses specific to yourindustry. You can use prebuilt analyses to suit your business's information needs.
See Creating Analyses.
• Dashboards — (This area of Oracle BI EE is also known as Interactive Dashboards.)Dashboards provide personalized views of corporate and external information. Adashboard consists of one or more pages that contain content, such as analyses,links to web sites, Oracle BI Publisher reports, and so on. Dashboards allow you toprovide end users with access to analytics information.
Your organization might also have purchased preconfigured dashboards thatcontain prebuilt analyses specific to your industry.
Ssee Building and Using Dashboards.
Introduction to Oracle BI Enterprise Edition
1-2 User's Guide for Oracle Business Intelligence Enterprise Edition
• Filters, Selection Steps, and Prompts — Filters, selection steps, and prompts allowyou to limit or specify the data that is displayed in dashboards and analyses.
See Filtering and Selecting Data for Analyses. For information on working withprompts, see Prompting in Dashboards and Analyses.
• Agents — (This area of Oracle BI EE is also known as Delivers.) Agents enable youto automate your business processes. You can use agents to provide event-drivenalerting, scheduled content publishing, and conditional event-driven actionexecution. You can schedule agents and can trigger them with a specific condition,which enables you to deliver timely information to users.
See Delivering Content.
• Conditions — Conditions are objects that return a single Boolean value that isbased on the evaluation of an analysis or of a Key Performance Indicator (KPI). Youuse conditions to determine whether something is to be done, for example whetheran agent is to deliver its content.
See Working with Conditions.
• Actions — Actions provide functionality to navigate to related content or to invokeoperations, functions, or processes in external systems. You can include actions invarious objects, such as analyses and dashboard pages. Actions allow users to takethe proper action based on the business insight that they gained from the data thatthey received.
See Working with Actions.
• Scorecards — (This area of Oracle BI EE is known as Oracle Scorecard and StrategyManagement). Scorecards allow you to model the objectives and initiatives thatcomprise your corporate strategy, evaluate their performance by assigning KPIs,and determine and display overall performance.
See Scorecarding.
• Other Products — Oracle BI EE interacts in various ways with other products. Forexample, with Oracle Hyperion Smart View for Office, you can access and runanalyses from Oracle BI EE within your Microsoft Office applications (that is, Excel,Word, and PowerPoint).
See How Does Oracle BI EE Interact with Other Products?.
Note: These areas of Oracle BI EE (that is, Analyses, Agents, Dashboards, andso on) are sometimes referred to as Presentation Services.
Where Do I Store and Manage Oracle BI EE Objects?You use the Oracle BI Presentation Catalog to store the objects, such as analyses,dashboards, and KPIs, that you and other users create using Oracle BI EE.
Users have their own personal folder (My Folders), where they can store the objectsthat they create. You can access the objects in a personal folder and save content intothat folder. Users can add sub-folders to their personal folders to organize theircontent in the way that is the most logical to them.
You can also store objects in shared folders where other users or groups can access theobjects. A combination of business logic security, catalog object security, and data levelsecurity determines who can view data and objects, edit objects, and delete objects
Where Do I Store and Manage Oracle BI EE Objects?
Introducing Oracle Business Intelligence Enterprise Edition 1-3
from the catalog. Your administrator creates and maintains the catalog's shared folderstructure.
For more information, see What is the Oracle BI Presentation Catalog? and ManagingObjects in the Oracle BI Presentation Catalog. See Configuring and Managing theOracle BI Presentation Catalog in System Administrator's Guide for Oracle BusinessIntelligence Enterprise Edition.
Signing In to Oracle BI Enterprise EditionYou need a few pieces of information to sign in to the application.
To access Oracle BI EE, you use a URL, a user ID, and a password that have beenprovided by your organization.
Note: Oracle BI EE requires that the web browser be set to accept cookies. Ituses a cookie to track a user's signed-in session.
You might not be prompted to enter values in all fields of the Sign In page (asdescribed in the following procedure), if you have already signed on usingsingle sign-on (SSO).
1. In the address field of a browser, enter the URL that was provided by yourorganization.
2. On the Sign In page, select the language in which you want to work.
You can change the default entry for this box by selecting another language in theUser Interface Language field in the Preferences tab of the My Account dialog. Formore information, see Setting Preferences.
Note: On Windows, if you select the Install files for complex script andright-to-left languages (including Thai) option on the Languages tab of theRegional and Language Options dialog, Hebrew fonts display in the wrongdirection, that is left to right rather than right to left.
The workaround is to deselect the Install files for complex script and right-to-left languages (including Thai) option as follows:
a. In the Control Panel, click the Regional & Language Options button todisplay the Regional and Language Options dialog.
b. Click the Languages tab.
c. Deselect the Install files for complex script and right-to-left languages(including Thai) option.
d. Click OK.
3. Enter your user ID and password.
4. Select the Accessibility Mode box if you want content for Oracle BI EE to berendered in a browser in a way that facilitates the use of a screen reader.
Signing In to Oracle BI Enterprise Edition
1-4 User's Guide for Oracle Business Intelligence Enterprise Edition
If you select this box, then the BI Composer wizard in accessibility mode is used asthe analysis editor (rather than the Analysis editor). See Using BI Composer toWork with Analyses and What Is the Analysis Editor?
For more information on accessibility, see Accessibility Features.
5. Click Sign In. One of the following pages (depending on what has been configuredfor you) is displayed:
• Your personal dashboard, named My Dashboard.
• The Home page. See What Is the Oracle BI EE Home Page?.
• A dashboard that is specific to your job function (for example, Call Centerrepresentative).
A dashboard (whether My Dashboard or one specific to your job function) typicallycontains analyses and other information for your area of responsibility. Introduction to Oracle BI Enterprise Edition shows an example of a dashboard.
You can now navigate Oracle BI EE. See Navigating Oracle BI Enterprise Edition.
Tip: Once you have signed in, you can select the dashboard to be displayedwhen you sign in thereafter. For information, see Setting Preferences.
Signing Out of Oracle BI Enterprise EditionYou must sign out properly to completely exit the application.
Note:
Do not close the browser window to sign out of Oracle BI EE.
• In the global header, click Sign Out.
Navigating Oracle BI Enterprise EditionThe interface provides simple access to the various areas of the application.
After signing in to Oracle BI EE, you are presented with one of the following pages,depending on what has been configured for you:
• Your personal dashboard, named My Dashboard
• The Home page
• A dashboard that is specific to your job function (for example, Call Centerrepresentative)
This page is your starting point for working in Oracle BI EE. You can find the analyses,dashboards, and other things that you access frequently on the Home page. If youcannot find what you are looking for, enter the name of the item in the Search box atthe top of the page. Or click the Catalog link to explore all available content. As youwork, you can use the global header and the Home page as the primary ways tonavigate Oracle BI EE:
• The global header — The global header is displayed at the top of the Oracle BI EEinterface and is always available as you work. It enables you to access thefunctionality that Oracle BI EE provides. For example, you can access the Home
Signing Out of Oracle BI Enterprise Edition
Introducing Oracle Business Intelligence Enterprise Edition 1-5
page, access dashboards, open objects (such as analyses and dashboard prompts),create new objects, and so on. Privileges determine which functionality is availableto you in the global header. Your administrator can modify the global header bychanging the order of the links, or by adding links specific to your company orindustry. For example, your administrator could add a link to the OracleTechnology Network (OTN). See What Is the Oracle BI EE Global Header?.
• The Home page — From the Home page, you can learn how to get started withOracle BI EE, create and modify objects, and browse and manage objects. See WhatIs the Oracle BI EE Home Page?.
After you have accessed the starting point of a task, the interface then presents youwith the page, dialog, or editor that you use to perform the task.
Note: It is recommended that you not use the browser's Back button tonavigate Oracle BI EE, unless no other navigation methods are available. Thebrowser Back button might not maintain the state of the dashboard uponreturn. Breadcrumbs are the recommended navigation approach. See AboutNavigating With Breadcrumbs.
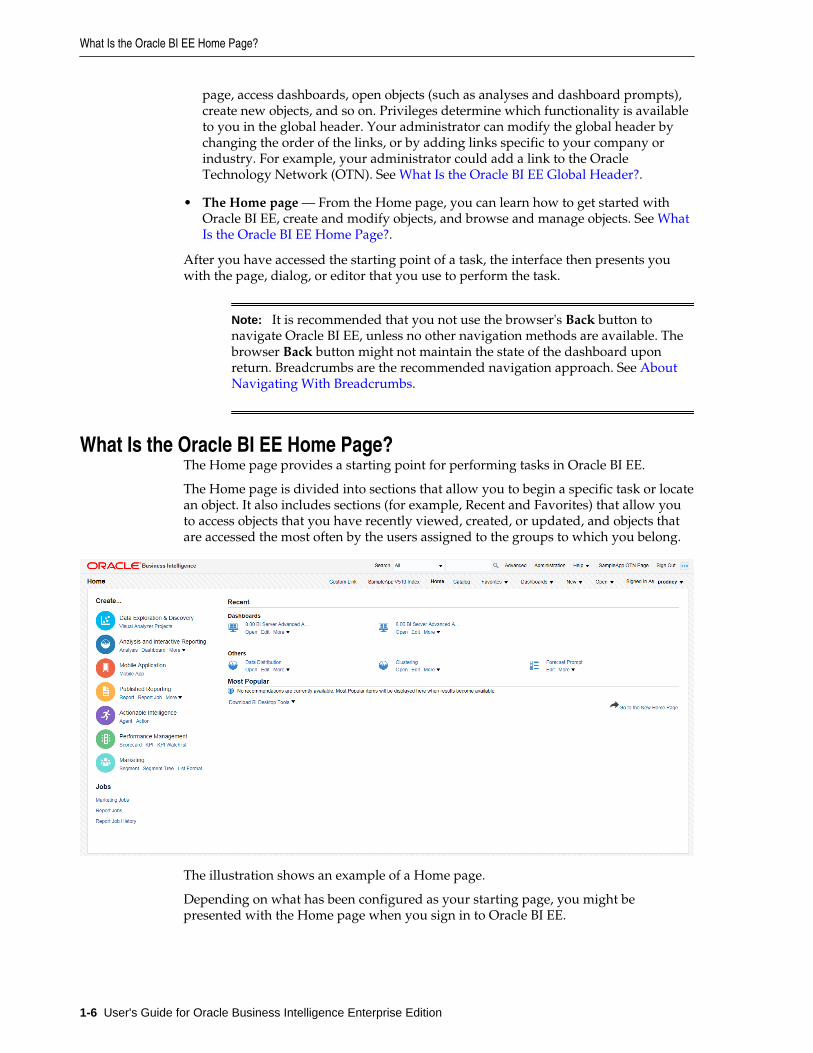
What Is the Oracle BI EE Home Page?The Home page provides a starting point for performing tasks in Oracle BI EE.
The Home page is divided into sections that allow you to begin a specific task or locatean object. It also includes sections (for example, Recent and Favorites) that allow youto access objects that you have recently viewed, created, or updated, and objects thatare accessed the most often by the users assigned to the groups to which you belong.
The illustration shows an example of a Home page.
Depending on what has been configured as your starting page, you might bepresented with the Home page when you sign in to Oracle BI EE.
What Is the Oracle BI EE Home Page?
1-6 User's Guide for Oracle Business Intelligence Enterprise Edition
Where Can I Get Help or More Information?Oracle BI EE provides direct access to guides, context-sensitive help, and libraries thatcontain conceptual and procedural information to help you understand Oracle BI EE.
Specifically, you can access:
• Oracle Business Intelligence Enterprise Edition Help — Each Oracle BI EE userinterface page, tab, editor, pane, and dialog has a help topic associated with it. Eachof these topics contains overview information, links to related concept andprocedures, and an explanation of each component.
To access the online help for a page, editor, tab, or dialog, click its Help button.
Alternatively, for a page, editor, or tab, you can select xxx Help (where xxx is thename of the page, editor, or tab) from the Help menu that is located in the globalheader. For example, for help on the Catalog page, select Catalog Page Help . SeeWhat Is the Oracle BI EE Global Header?
• Help Tables of Contents for Oracle BI EE, Oracle BI Publisher, and Marketing —Navigating through these Table of Contents is a good way to get acquainted withthe products and access a particular topic of interest.
To access one of these tables of contents, click Help Contents on the Help menu inthe global header and then select the appropriate table of contents.
• Oracle Business Intelligence Enterprise Edition Documentation Library — Thebooks in the Oracle BI EE documentation set are included in the FusionMiddleware Documentation Library on the OTN.
To access the Oracle BI EE documentation library, click Documentation on theHelp menu in the global header.
• Oracle Technology Network (OTN) — On OTN, you can find information that isspecific to Oracle Business Intelligence and information about all other Oracleproducts. OTN provides services and resources to help developers, databaseadministrators (DBAs), and architects share and find expertise and best practicesabout how to design, build, deploy, manage, and optimize applications. Examplesof the types of items that you find on OTN include information about industry-standard technologies such as JAVA and Linux, all Oracle product documentation,discussion forums, Oracle software, blogs and podcasts, and technical articles thatare written by other OTN members.
To access OTN, click OTN on the Help menu in the global header.
Where Can I Get Help or More Information?
Introducing Oracle Business Intelligence Enterprise Edition 1-9
2Creating Analyses
This chapter describes how to create analyses in Oracle Business IntelligenceEnterprise Edition, including how to specify the criteria for analyses, display theresults, and examine the SQL statements. It also explains subject areas and columns,the double column feature, and variables.
Topics
This chapter includes the following sections:
• What Is an Analysis?
• What Are Subject Areas and Columns?
• Understanding the Double Column Feature
• What Is the Analysis Editor?
• What Is the Process for Constructing Analyses?
• Creating New Analyses
• Specifying the Criteria for Analyses
• Saving Columns to the Catalog
• Changing the Sort Order of Subject Areas and Subject Area Folders
• Displaying the Results of Analyses
• Adding Prompts to Analyses
• Examining the Logical SQL Statements for Analyses
• Saving Analyses
• Creating Agents from Analyses
• Editing Analyses
• About Embedding an Analysis in a Dashboard
• Working with Direct Database Requests
• Using Variables
• Where Can I Reference Variables?
• What Is the Syntax for Referencing Variables?
• What Predefined Presentation Variables Are Available?
Creating Analyses 2-1
• Example of Referencing a Variable in a Title View
What Is an Analysis?An analysis is a query against an organization's data that provides answers to businessquestions.
Analyses let you explore and interact with information by visually presenting data intables, graphs, pivot tables, and so on. You can save, organize, and share the results ofanalyses.
Analyses that you create can be saved in the Oracle BI Presentation Catalog andintegrated into any Oracle BI EE dashboard. You can enhance analyses throughfeatures such as graphs, result layout, calculated items, and drilling.
How Do I Work with an Analysis?You use an editor to work with an analysis.
To work with an analysis, you use one of the following editors:
• The Analysis editor — A feature-rich editor that allows you to explore and interactwith information by visually presenting data in tables, graphs, pivot tables, and soon. See What Is the Analysis Editor?
You have access to this editor if you have been granted the Access to Analysisprivilege by the administrator.
• The BI Composer wizard — A simple-to-use wizard that allows you to create, edit,or view analyses without the complexities of the Analysis editor. See Using BIComposer to Work with Analyses.
You have access to this editor only if you have been granted the Access to BIComposer privilege by the administrator.
You specify which editor you want to use on the Preferences tab of the My Accountdialog. However, if you have turned on accessibility mode either in the Sign In page orthe Preferences tab of the My Account dialog, then the BI Composer wizard inaccessibility mode is used as the analysis editor, regardless of your choice.
How Is an Analysis Processed?When an analysis is processed, the request is sent in the form of logical SQLstatements to the Oracle BI Server.
The BI Server then generates queries against the appropriate data sources. When theBI Server receives the query results, they are in a format that is not yet suitable forreturning to the user. The BI Server merges the results and applies any additionalcalculations or filters that pertain to the results. The BI Server then sends the data toOracle BI Presentation Services to format the results for display.
How Can I Always See the Most Current Results of an Analysis?Embedding an analysis in a dashboard causes it to execute automatically and displaythe most current results every time the dashboard is accessed.
For example, if you are a sales executive whose company captures sales data on adaily basis, then you might want to have the dollar volume of product that was soldtoday be displayed on the front page of your dashboard.
What Is an Analysis?
2-2 User's Guide for Oracle Business Intelligence Enterprise Edition
You can embed a saved analysis by using the Dashboard editor. See Adding Contentto Dashboards.
What Are Subject Areas and Columns?Subject areas and columns are the building blocks for an analysis.
A subject area contains folders, measure columns, attribute columns, hierarchicalcolumns, and hierarchy levels that represent information about the areas of anorganization's business or about groups of users with an organization. Subject areasusually have names that correspond to the types of information that they contain, suchas Marketing Contracts, Service Requests, and Orders.
A subject area corresponds to the presentation layer in an Oracle BI metadatarepository. In a repository, the subject area is the highest-level object in thepresentation layer and represents the view of the data that end users see when theycreate or edit an analysis.
A related subject area is an external data source that is connected to a primary subjectarea in an analysis.
Individuals who design and build metadata repositories (such as a BusinessIntelligence strategist, metadata provider, or Extract Transform Load (ETL) developer)create subject areas using the Oracle BI Administration Tool. Generally, rather thancreating one large subject area for their company's data, they create multiple smallersubject areas. This enables them to provide a particular group of users or a particulararea of a company with the most important data that they need in one small subjectarea and the less important data in one or more related subject areas created from thesame business model layer. Having these smaller subject areas makes it easier forusers to find the data they need. It also makes it easier to maintain the data. See Creating Subject Areas in Metadata Repository Builder's Guide for Oracle BusinessIntelligence Enterprise Edition.
Note: The individuals who design and build metadata repositories canspecify that a subject area, folder (and its children), or column (both attributeand hierarchical) is to be hidden. A hidden subject area, folder, or column isnot visible in the Subject Areas pane but is visible elsewhere, such as in ananalysis or saved filter contents. (Because the object is still visible elsewhere,hiding a subject area, folder, or column in this way is not a solution forsecurity or access control.)
If the criteria of an existing analysis include a subject area, folder, or columnthat is subsequently hidden, the analysis is still accessible but the subject area,folder, or column is no longer visible in the Subject Areas pane of the Criteriatab Analysis editor.
Columns contain the individual pieces of data that an analysis returns. Columnsusually have names that indicate the types of information that they contain, such asAccount or Contact. Together with filters and selection steps, columns determine whatdata an analysis contains.
When you create an analysis, filter, or dashboard prompt, you first select the subjectarea with which you want to work. This is known as the primary subject area and isdisplayed in the Subject Areas pane. If, as you work, you find that you need moredata, you can add additional subject areas that are related to the primary subject areathat you have chosen. (You can add related subject areas only if they are available forthe primary subject area and only if you have permission to access them.)
What Are Subject Areas and Columns?
Creating Analyses 2-3
Note: You can add your own data to analyses too. For information, see Adding External Data to Analyses.
Typically, when you query a single subject area, all the measure columns that areexposed in that subject area are compatible with all the attribute columns andhierarchical columns that are exposed in the same subject area. However, when youcombine columns from multiple subject areas, you must ensure that you do notinclude combinations of measure columns with attribute columns and hierarchicalcolumns that are incompatible with one another.
For example, a measure column in one subject area might not be associated with theProject attribute column. If measure columns associated with the Project attributecolumn from another subject area are added to the analysis along with columns thatare not associated with Project, then the query might fail to return results, or cause theBI Server error No fact table exists at the requested level ofdetail: XXXX.
For an analysis to return data, you must select at least one column to include in theanalysis.
What Are the Types of Columns?Different types of columns are used in different situations.
Subject areas contain the following types of columns:
• Attribute Column — Holds a flat list of values that are also known as members.No hierarchical relationship exists between these members, as is the case formembers of a hierarchical column. An attribute column was referred to as apresentation column in previous releases (prior to 11g).
Examples include Produc tID or City.
• Hierarchical Column — Holds data values that are organized using both namedlevels and parent-child relationships. This column is displayed using a tree-likestructure. Individual members are shown in an outline manner. Hierarchies allowyou to drill deeper into the data, to view more detailed information. Examplesinclude Time or Geography. The illustration shows the Time folder and the Timeand Fiscal Time hierarchies expanded in the Subject Areas pane.
What Are Subject Areas and Columns?
2-4 User's Guide for Oracle Business Intelligence Enterprise Edition
What Is the Analysis Editor?
The Analysis editor lets you explore and interact with information by visually presenting data in tables, graphs, pivot tables, and so on.
You can include the views that you create in an analysis for display in dashboards.
The Analysis editor contains the following tabs:
• Criteria tab — Lets you specify the criteria for an analysis, including columns, andfilters. You can specify the order in which the results should be returned,formatting (such as headings, number of decimal places, styles such as fonts andcolors, and conditional formatting), and column formulas (such as adding a Rankor Percentile function). Additionally, you can change the sort order of the subjectarea and subject area folders. SeeChanging the Sort Order of Subject Areas andSubject Area Folders.
• Results tab — Lets you create different views of the analysis results such as graphs,tickers, and pivot tables. You can also add or modify selection steps.
• Prompts tab — Lets you create prompts that allow users to select values to filter ananalysis or analyses on a dashboard. Prompts allow users to select values thatdynamically filter all views within the analysis or analyses. You can also create
2-8 User's Guide for Oracle Business Intelligence Enterprise Edition
prompts for use with selection steps, both for member selection steps andqualifying condition steps.
• Advanced tab — Lets you edit XML code and examine the logical SQL statementthat was generated for an analysis. You can use the existing SQL statement as thebasis for creating a new analysis.
The tabs of the Analysis editor are organized into various panes and areas. As youwork, you can manage these panes to suit your needs. See Managing Panes in theAnalysis Editor Tabs.
You access the Analysis editor when you create (or edit) an analysis. See Creating NewAnalyses.
Note: If you are using Oracle BI EE in accessibility mode, then, when youcreate (or edit) an analysis, the Analysis editor is replaced by the BI Composerwizard. For more information on BI Composer, see Using BI Composer toWork with Analyses. See Accessibility Features.
Managing Panes in the Analysis Editor TabsEach of the tabs in the Analysis editor consists of several panes.
For example, the Results tab consists of the Subject Areas pane, the Catalog pane, theViews Pane, the Compound Layout, and the Selection Steps pane.
As you work, you can manage these panes to give yourself the most efficient workarea for the task that you are performing. For example, if you add multiple views tothe compound layout on the Results tab, then you might want to hide the other panesin the Results tab to maximize the area in which to see the views that you are adding.You can:
• Show or hide the panes that are displayed on the left side of the Analysis editor byclicking the sideways triangle button that is displayed between the left and rightsides.
• Expand or collapse an individual pane by clicking the plus or minus button in thetitle bar of the pane.
• Resize an expanded pane by dragging its splitter. For example, you can drag thesplitter on top of the Catalog pane up to increase the height of the pane.
• Show or hide a pane by clicking its show/hide button, if one is available for thepane on the toolbar. For example, you can show or hide the Filters pane in theCriteria tab by clicking Show/Hide Filters pane on the toolbar.
What Is the Process for Constructing Analyses?Creating useful analyses requires several steps.
Note:
If you are using Oracle BI EE in accessibility mode or you have selectedWizard (limited functionality) as the analysis editor, then you use the BIComposer wizard rather than the Analysis editor to construct analyses. See Using BI Composer to Work with Analyses and Accessibility Features.
What Is the Process for Constructing Analyses?
Creating Analyses 2-9
The process for constructing an analysis includes the following steps:
1. Creating New Analyses
2. Specifying the Criteria for Analyses
3. Displaying the Results of Analyses
4. Adding Prompts to Analyses
5. Examining the Logical SQL Statements for Analyses
6. Saving Analyses
Creating New AnalysesThis is one step in the process for constructing an analysis.
For more information, see What Is the Process for Constructing Analyses?
Creating an analysis allows you to add that analysis to dashboards.
• In the global header, click New, then Analysis, then one of the following options:
– Select a subject area. If you purchased Oracle Data Visualization, you can alsoselect an external data source (uploaded Microsoft Excel file).
The Analysis editor is displayed. You can now specify the criteria for theanalysis.
– Create Direct Database Query
See Working with Direct Database Requests.
– Create Analysis from Simple Logical SQL
The Analysis Simple SQL Statement dialog is displayed in which you enter SQLstatements for creating an analysis. You can display and manipulate within theAnalysis editor, and subsequently incorporate, and subsequently incorporatedinto dashboards and agents.
Specifying the Criteria for AnalysesThis procedure is a step in the process for constructing an analysis.
See What Is the Process for Constructing Analyses?.
You use the Criteria tab of the Analysis editor to specify the criteria for an analysis,including columns, filters, and selection steps. You also can specify:
• The default order in which columns are to be displayed in the analysis results
• The default sorting for the values that are displayed in views
• The default formatting (such as headings, number of decimal places, conditionalformats, and system-wide defaults)
• Column formulas (such as adding a Rank or Percentile function)
• The aggregation rules for column totals
• The sort order for subject area folders and folder objects within the Subject Areaspane
Creating New Analyses
2-10 User's Guide for Oracle Business Intelligence Enterprise Edition
1. In the Criteria tab, select the columns to be included in the analysis by doing one ofthe following:
• Double-clicking the columns in the Subject Areas pane.
• Dragging and dropping the columns from the Subject Areas pane to theSelected Columns pane. To select multiple non-contiguous columns, press andhold the Ctrl key, then click each column to include.
• Dragging and dropping saved columns from the Catalog pane.
The selected columns are displayed in a box in the Selected Columns pane. Eachcolumn box has two sections. The upper section shows the name of the folder thatcontains the column, for example, Customers. The lower section shows the name ofthe column, for example, Customer Name.
If you want to:
• Initiate a search within the subject areas that are displayed in the Subject Areaspane, click Search button.
• Change the sort order of the subject area folders and objects within each folder,click the Sort Subject Area button. Clicking the button executes the sort andcloses all subject area folders except the primary subject area.
• Add or remove related subject areas from which to select columns, click theAdd/Remove Subject Areas button in the Subject Areas pane to display theAdd/Remove Subject Areas dialog.
If you add a related subject area but do not add any columns from that subjectarea to the analysis, then the subject area is not related to the analysis after youclose and re-open the analysis.
• A check mark beside a subject area identifies a related subject area that has beenadded. A grayed out check mark identifies the primary subject area or a relatedsubject area whose data is currently being used in the analysis, named filter, orcolumn prompt. You cannot remove a primary subject area. You can remove arelated subject area only if its data is not currently being used.
• Refresh the content in the Subject Areas pane, click the Refresh button on theSubject Areas pane or click the arrow beside the button.
Clicking the button executes the default behavior of Refresh Display. Clickingthe arrow enables you to select Refresh Display or Reload Server Metadata torefresh the subject area's metadata.
2. Modify the columns or levels of hierarchical columns as needed using the SelectedColumns pane:
• Click the Options button to the right of a column name in the Selected Columnspane to display options to:
– Specify the sort order for columns. (You cannot specify the sort order forhierarchy levels.)
– Edit formulas for attribute columns and measure columns, includingcustomizing headings, and specifying the aggregation rule. (You cannotcustomize headings, specify the aggregation rule, or edit the formulas forhierarchical columns or for hierarchy levels.)
Specifying the Criteria for Analyses
Creating Analyses 2-11
– Edit column properties to control the formatting and interaction of columnsand hierarchy levels.
– Add filters for attribute columns and measure columns. (You cannot addfilters for hierarchical columns or hierarchy levels.)
– Delete the columns from the analysis. (You cannot delete hierarchy levels.)
• Click the Remove all columns from criteria button in the Selected Columnspane to remove all columns from the analysis.
• Click the Combine results based on union, intersection, and differenceoperations button in the Selected Columns pane to combine the results of twoor more analyses into a single result.
• Use the Drag Column buttons in the Selected Columns pane to place thecolumns in the default order for display in the analysis results.
3. Add and edit inline filters as needed using the Filters pane.
4. Create or edit selection steps as needed using the Selection Steps pane.
5. Add named filters, calculated items, and groups from the Oracle BI PresentationCatalog as needed using the Catalog pane.
6. Use the buttons on the toolbar for the Criteria tab, as needed, to show or hide theFilters pane, to show or hide the Selections Steps pane, and to edit the properties ofthe analysis, such as the type of message (default or custom) to be displayed if noresults are available.
You can now add views to the analysis.
Bear these guidelines in mind:
• In general, an analysis should contain at least one measure column. Measurecolumns are the key additive measurements of business performance, such asdollar sales per store, or the number of service requests opened and closed eachday. An analysis without any measure columns generally is not meaningful, andcan cause poor query performance or unexpected results. If you want to build ananalysis without any measure columns, then first consult the administrator.
• Generally, you should avoid including both a hierarchical column and an attributecolumn that is also a lower level in the hierarchical column in the same analysis,unless you have selection steps that limit the data in the analysis to only the samelevel as the attribute column. If you do so, the data for all levels above the level thatis the same as the attribute column will not be correct.
For example, suppose you have a hierarchical column named MerchandiseHierarchy that has these levels:
Total Product Brand
LOBProduct Type
Product
And you have another attribute column named Product Name, which is the samelevel as the Product level. If you include both Merchandise Hierarchy and theProduct Name attribute column in the same analysis, the data above the Productlevel will not be correct.
Specifying the Criteria for Analyses
2-12 User's Guide for Oracle Business Intelligence Enterprise Edition
4Adding Views for Display in Dashboards
This chapter describes the views that are available in Oracle Business IntelligenceEnterprise Edition to present the results of analyses in meaningful, intuitive ways. Itexplains how to add views for display in dashboards, how to modify values (that is,perform write back) in views, and how to set up master-detail linking of views. It alsodescribes interactions, drilling, sorting, and printing in views.
Topics
This chapter includes the following sections:
• What Are Views?
• What Types of Views Are Available?
• Adding Views to the Results of Analyses
• What Is the Recommended Visualizations Feature?
• Editing Views
• Modifying Values and Performing Write Back
• Interactions in Views
• Drilling in Views
• Sorting Data in Views
• Resizing Rows and Columns in Table Views, Pivot Table Views, and AdvancedTrellis Views
• Saving Views
• Renaming Views or Compound Layouts
• Rearranging Views
• Printing Views
• Changing Print and Export Options for Views
• Previewing How Views Are Displayed on a Dashboard
• Removing Views
• Refreshing the Results in Views
• Customizing Views for Delivery to Agent Users
• What Is Master-Detail Linking of Views?
Adding Views for Display in Dashboards 4-1
• Linking Views in Master-Detail Relationships
What Are Views?Views use the presentation capabilities of Oracle BI Enterprise Edition to help youlook at results of analyses in meaningful, intuitive ways.
You can add a variety of views to the results, such as graphs and pivot tables thatallow drilling down to more detailed information, explanatory text, a list of filters thatwere used to limit the results, and more.
When you display the results of a new analysis, the following views are displayed bydefault in the Compound Layout in the Results tab of the Analysis editor:
• A title view, which displays the name of the saved analysis.
• A table or pivot table view, which displays the results of the analysis, dependingon the types of columns that the analysis contains:
– If the analysis contains only attribute columns, only measure columns, or acombination of both, then a table is the default view.
– If the analysis contains at least one hierarchical column, then a pivot table is thedefault view.
You can customize or delete the existing views for an analysis, add other views, andcombine and position views anywhere in the pane.
Preparing multiple views of results can help you identify trends and relationships indata. If you are customizing results for display on a dashboard, then you can previewhow the combination and position of views looks when viewed on a dashboard.
You can then save the analysis with the collection of views.
What Types of Views Are Available?There are several types of views available for presenting data.
The table describes the types of views that are available.
Note: Your privileges control whether you can access all views or specificviews only.
View Name Description
Title Displays a title, a subtitle, a logo, a link to a custom online help page, andtimestamps to the results.
Table Displays results in a visual representation of data organized by rows andcolumns. A table provides a summary view of data and enables users tosee different views of data by dragging and dropping rows and columns.
What Are Views?
4-2 User's Guide for Oracle Business Intelligence Enterprise Edition
View Name Description
Pivot Table Displays results in a pivot table, which provides a summary view of datain cross-tab format and enables users to see different views of data bydragging and dropping rows and columns. Pivot tables structure datasimilarly to standard tables that contain column groups, but can displaymultiple levels of both row and column headings. Unlike regular tables,each data cell in a pivot table contains a unique value. By organizing datain this way, a pivot table is more efficient than a row-based table. Pivottables are ideal for displaying a large quantity of data, for browsing datahierarchically, and for trend analysis.
PerformanceTile
Displays a single aggregate measure value in a manner that is bothvisually simple and prominent, yet it immediately reveals summarymetrics to the user that will likely be presented in more detail within adashboard view.
Performance tiles:
• Focus the user's attention on simple, need-to-know facts directly andprominently on the tile.
• Communicate status through simple formatting by using color, labels,and limited styles, or through conditional formatting of thebackground color or measure value to make the tile visuallyprominent. For example, if revenue is not tracking to target, therevenue value may appear in red.
• Respond to prompts, filters, and user roles and permissions by makingthem relevant to the user and their context.
• Support a single, aggregate or calculated value.
Treemap Displays a space-constrained, two-dimensional visualization forhierarchical structures with multiple levels.
Treemaps:
• Are limited by a predefined area and display two levels of data.• Contain rectangular tiles. The size of the tile is based on a measure, and
the color of the tile is based on a second measure.• Are similar to a scatter plot graphs in that the map area is constrained,
and the graph allows you to visualize large quantities of data andquickly identify trends and anomalies within that data.
Heat Matrix Displays a two-dimensional depiction of data in which values arerepresented by a gradient of colors that are well suited for analyzing largeamounts of data and identifying outliers. Heat matrices structure datasimilarly to pivot tables in that they are formed by the grouping andintersection of rows and columns.
What Types of Views Are Available?
Adding Views for Display in Dashboards 4-3
View Name Description
Trellis Displays multidimensional data shown as a set of cells in a grid, whereeach cell represents a subset of data using a particular graph type. Datacan be represented with graphs, microcharts, and numbers.
The trellis view has two subtypes: Simple Trellis and Advanced Trellis.
Simple trellis views are ideal for displaying multiple graphs that enablecomparison of like to like. Advanced trellis views are ideal for displayingspark graphs that show a trend.
A simple trellis displays a single inner graph type, for example a grid ofmultiple Bar graphs. The inner graphs always use a common axis; that isto say, the graphs have a synchronized scale.
An advanced trellis displays a different inner graph type for eachmeasure. For example, a mixture of Spark Line graphs and Spark Bargraphs, alongside numbers. In this example, the Spark Line graph mightshow Revenue over time, and the Spark Bar graph might show Units Sold.A measure column displaying numbers might be placed adjacent to theSpark Line graphs, showing the Revenue measure as a total value for ayear.
In an advanced trellis, each measure column operates independently fordrilling, axis scaling, and so on.
For definitions of microchart and spark graph, see What Terms are Usedwith Trellis Views?
Graph Displays numeric information visually, which makes it easier tounderstand large quantities of data. Graphs often reveal patterns andtrends that text-based displays cannot. However, when precise values areneeded, graphs should be supplemented with other data displays, such astables.
A graph is displayed on a background, called the graph canvas.
For the types and subtypes of graphs that are available, see What Types ofGraphs Are Available?
Gauge Shows a single data value. Due to its compact size, a gauge is often moreeffective than a graph for displaying a single data value. Beside displayingthe data visually, each gauge also displays the result in numeric form
Gauges identify problems in data. A gauge usually plots one data pointwith an indication of whether that point falls in an acceptable orunacceptable range. Thus, gauges are useful for showing performanceagainst goals.
Depending on the data in the analysis, a gauge view might consist ofmultiple gauges in a gauge set. For example, if you create a gauge view toshow the sales data for the last twelve months, the gauge view consists oftwelve gauges, one for each month. If you create one to show the totalsales in the US, then the gauge view consists of one gauge.
A gauge or gauge set is displayed on a background, called the gaugecanvas.
For the types of gauges that are available, see What Types of Gauges AreAvailable?
What Types of Views Are Available?
4-4 User's Guide for Oracle Business Intelligence Enterprise Edition
View Name Description
Funnel Displays results as a three-dimensional graph that represents target andactual values using volume, level, and color. Typically, funnel graphs areused to graphically represent data that changes over different periods orstages. For example, funnel graphs are often used to represent the volumeof sales over a quarter.
Funnel graphs are well suited for showing actual compared to targets fordata where the target is known to decrease (or increase) significantly perstage, such as a sales pipeline.
In funnel graphs, the thresholds indicate a percentage of the target value,and colors provide visual information for each stage. You can click one ofthe colored areas to drill down to more detailed information.
For the types of funnel graphs that are available, see What Types of FunnelGraphs Are Available?
Map view Displays results overlain on a map. Depending on the data, the results canbe overlain on top of a map as formats such as images, color fill areas, barand pie graphs, and variably sized markers.
Filters Displays the filters in effect for an analysis. Filters, like selection steps,allow you to constrain an analysis to obtain results that answer aparticular question. Filters are applied before the query is aggregated.
Selection Steps Displays the selection steps in effect for an analysis. Selection steps, likefilters, allow you to obtain results that answer particular questions.Selection steps are applied after the query is aggregated.
Column Selector Adds a column selector in the results. A column selector is a set of drop-down lists that contain pre-selected columns. Users can dynamically selectcolumns and change the data that is displayed in the views of the analysis.
View Selector Adds a view selector in the results. A view selector is a drop-down listfrom which users can select a specific view of the results from among thesaved views.
Legend Adds a legend to the results, which enables you to document the meaningof special formatting used in results, such as the meaning of custom colorsapplied to gauges.
Narrative Displays the results as one or more paragraphs of text. You can type in asentence with placeholders for each column in the results, and specify howrows should be separated.
Ticker Displays the results as a ticker or marquee, similar in style to the stocktickers that run across many financial and news sites on the Internet. Youcan control what information is presented and how it scrolls across thepage.
Static Text Adds static text in the results. You can use HTML to add banners, tickers,ActiveX objects, Java applets, links, instructions, descriptions, graphics,and so on, in the results.
Logical SQL Displays the SQL statement that is generated for an analysis. This view isuseful for trainers and administrators, and is usually not included inresults for typical users.
You cannot modify this view, except to format its container or to delete it.
What Types of Views Are Available?
Adding Views for Display in Dashboards 4-5
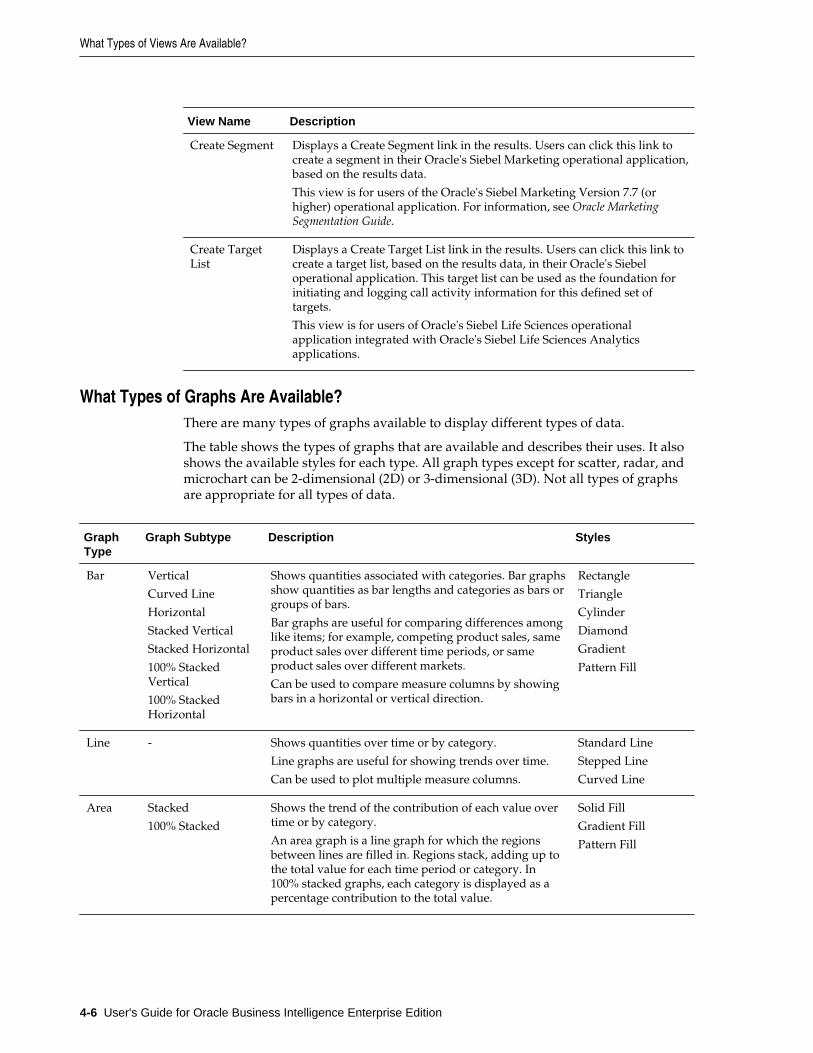
View Name Description
Create Segment Displays a Create Segment link in the results. Users can click this link tocreate a segment in their Oracle's Siebel Marketing operational application,based on the results data.
This view is for users of the Oracle's Siebel Marketing Version 7.7 (orhigher) operational application. For information, see Oracle MarketingSegmentation Guide.
Create TargetList
Displays a Create Target List link in the results. Users can click this link tocreate a target list, based on the results data, in their Oracle's Siebeloperational application. This target list can be used as the foundation forinitiating and logging call activity information for this defined set oftargets.
This view is for users of Oracle's Siebel Life Sciences operationalapplication integrated with Oracle's Siebel Life Sciences Analyticsapplications.
What Types of Graphs Are Available?There are many types of graphs available to display different types of data.
The table shows the types of graphs that are available and describes their uses. It alsoshows the available styles for each type. All graph types except for scatter, radar, andmicrochart can be 2-dimensional (2D) or 3-dimensional (3D). Not all types of graphsare appropriate for all types of data.
GraphType
Graph Subtype Description Styles
Bar Vertical
Curved Line
Horizontal
Stacked Vertical
Stacked Horizontal
100% StackedVertical
100% StackedHorizontal
Shows quantities associated with categories. Bar graphsshow quantities as bar lengths and categories as bars orgroups of bars.
Bar graphs are useful for comparing differences amonglike items; for example, competing product sales, sameproduct sales over different time periods, or sameproduct sales over different markets.
Can be used to compare measure columns by showingbars in a horizontal or vertical direction.
Rectangle
Triangle
Cylinder
Diamond
Gradient
Pattern Fill
Line - Shows quantities over time or by category.
Line graphs are useful for showing trends over time.
Can be used to plot multiple measure columns.
Standard Line
Stepped Line
Curved Line
Area Stacked
100% Stacked
Shows the trend of the contribution of each value overtime or by category.
An area graph is a line graph for which the regionsbetween lines are filled in. Regions stack, adding up tothe total value for each time period or category. In100% stacked graphs, each category is displayed as apercentage contribution to the total value.
Solid Fill
Gradient Fill
Pattern Fill
What Types of Views Are Available?
4-6 User's Guide for Oracle Business Intelligence Enterprise Edition
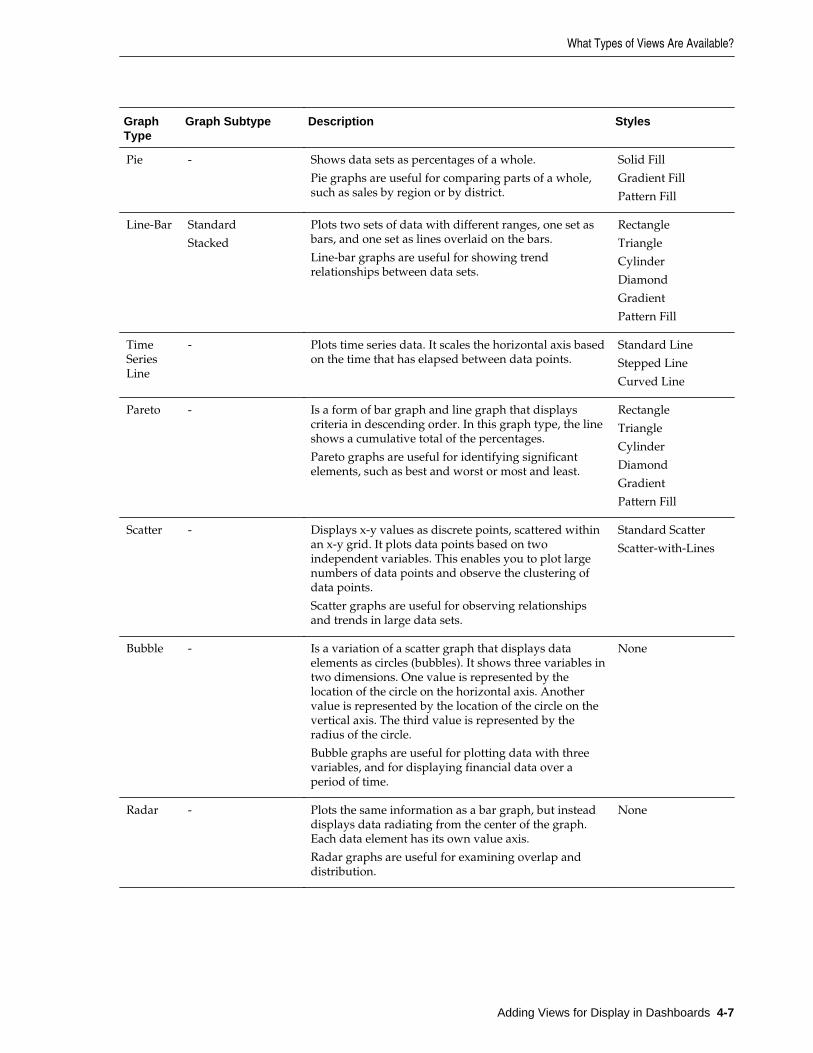
GraphType
Graph Subtype Description Styles
Pie - Shows data sets as percentages of a whole.
Pie graphs are useful for comparing parts of a whole,such as sales by region or by district.
Solid Fill
Gradient Fill
Pattern Fill
Line-Bar Standard
Stacked
Plots two sets of data with different ranges, one set asbars, and one set as lines overlaid on the bars.
Line-bar graphs are useful for showing trendrelationships between data sets.
Rectangle
Triangle
Cylinder
Diamond
Gradient
Pattern Fill
TimeSeriesLine
- Plots time series data. It scales the horizontal axis basedon the time that has elapsed between data points.
Standard Line
Stepped Line
Curved Line
Pareto - Is a form of bar graph and line graph that displayscriteria in descending order. In this graph type, the lineshows a cumulative total of the percentages.
Pareto graphs are useful for identifying significantelements, such as best and worst or most and least.
Rectangle
Triangle
Cylinder
Diamond
Gradient
Pattern Fill
Scatter - Displays x-y values as discrete points, scattered withinan x-y grid. It plots data points based on twoindependent variables. This enables you to plot largenumbers of data points and observe the clustering ofdata points.
Scatter graphs are useful for observing relationshipsand trends in large data sets.
Standard Scatter
Scatter-with-Lines
Bubble - Is a variation of a scatter graph that displays dataelements as circles (bubbles). It shows three variables intwo dimensions. One value is represented by thelocation of the circle on the horizontal axis. Anothervalue is represented by the location of the circle on thevertical axis. The third value is represented by theradius of the circle.
Bubble graphs are useful for plotting data with threevariables, and for displaying financial data over aperiod of time.
None
Radar - Plots the same information as a bar graph, but insteaddisplays data radiating from the center of the graph.Each data element has its own value axis.
Radar graphs are useful for examining overlap anddistribution.
None
What Types of Views Are Available?
Adding Views for Display in Dashboards 4-7
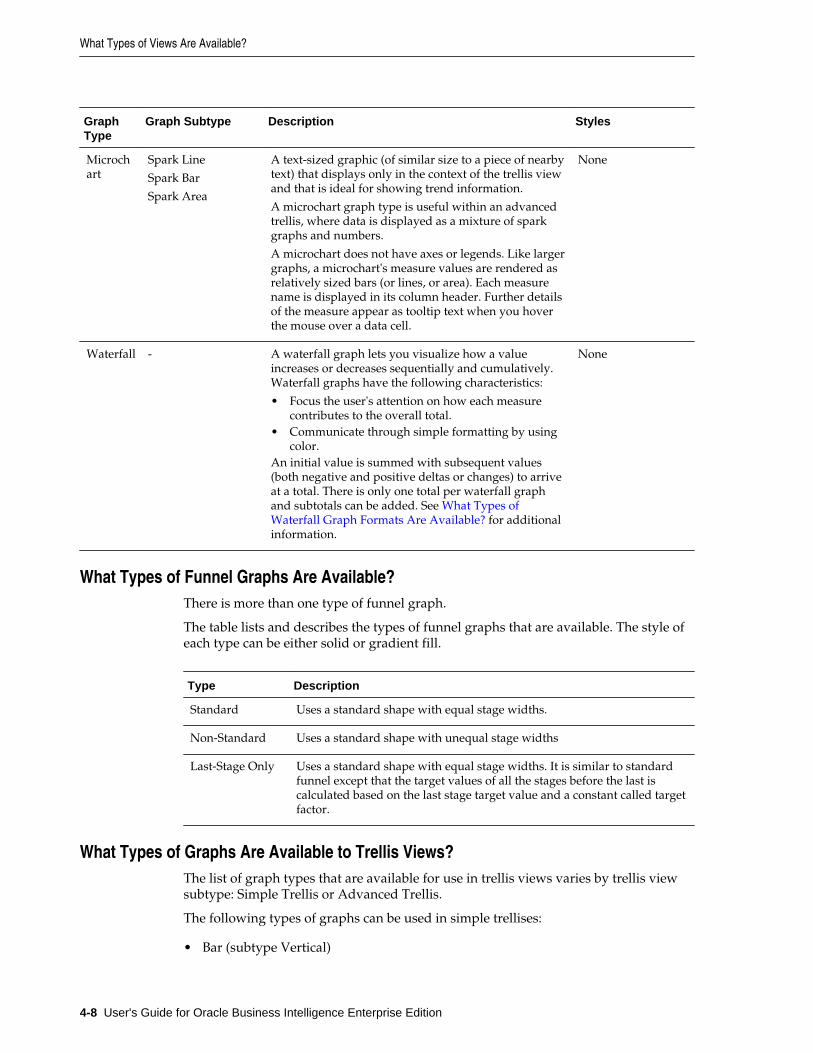
GraphType
Graph Subtype Description Styles
Microchart
Spark Line
Spark Bar
Spark Area
A text-sized graphic (of similar size to a piece of nearbytext) that displays only in the context of the trellis viewand that is ideal for showing trend information.
A microchart graph type is useful within an advancedtrellis, where data is displayed as a mixture of sparkgraphs and numbers.
A microchart does not have axes or legends. Like largergraphs, a microchart's measure values are rendered asrelatively sized bars (or lines, or area). Each measurename is displayed in its column header. Further detailsof the measure appear as tooltip text when you hoverthe mouse over a data cell.
None
Waterfall - A waterfall graph lets you visualize how a valueincreases or decreases sequentially and cumulatively.Waterfall graphs have the following characteristics:
• Focus the user's attention on how each measurecontributes to the overall total.
• Communicate through simple formatting by usingcolor.
An initial value is summed with subsequent values(both negative and positive deltas or changes) to arriveat a total. There is only one total per waterfall graphand subtotals can be added. See What Types ofWaterfall Graph Formats Are Available? for additionalinformation.
None
What Types of Funnel Graphs Are Available?There is more than one type of funnel graph.
The table lists and describes the types of funnel graphs that are available. The style ofeach type can be either solid or gradient fill.
Type Description
Standard Uses a standard shape with equal stage widths.
Non-Standard Uses a standard shape with unequal stage widths
Last-Stage Only Uses a standard shape with equal stage widths. It is similar to standardfunnel except that the target values of all the stages before the last iscalculated based on the last stage target value and a constant called targetfactor.
What Types of Graphs Are Available to Trellis Views?The list of graph types that are available for use in trellis views varies by trellis viewsubtype: Simple Trellis or Advanced Trellis.
The following types of graphs can be used in simple trellises:
• Bar (subtype Vertical)
What Types of Views Are Available?
4-8 User's Guide for Oracle Business Intelligence Enterprise Edition
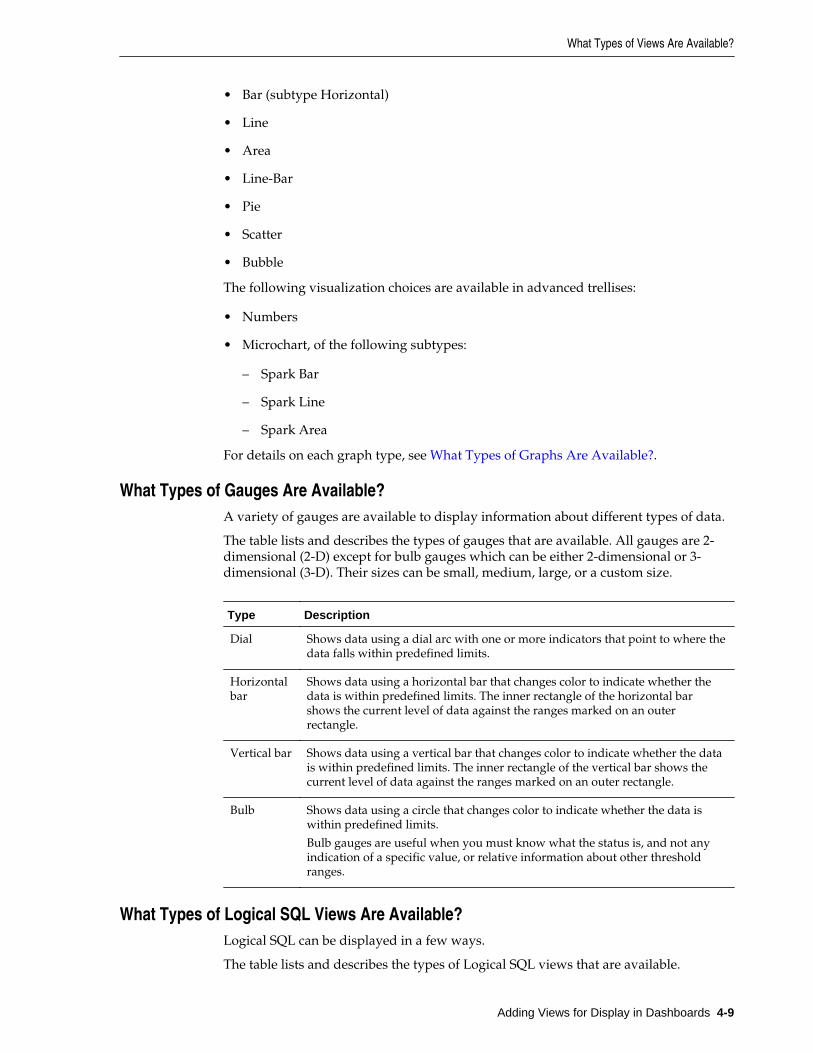
• Bar (subtype Horizontal)
• Line
• Area
• Line-Bar
• Pie
• Scatter
• Bubble
The following visualization choices are available in advanced trellises:
• Numbers
• Microchart, of the following subtypes:
– Spark Bar
– Spark Line
– Spark Area
For details on each graph type, see What Types of Graphs Are Available?.
What Types of Gauges Are Available?A variety of gauges are available to display information about different types of data.
The table lists and describes the types of gauges that are available. All gauges are 2-dimensional (2-D) except for bulb gauges which can be either 2-dimensional or 3-dimensional (3-D). Their sizes can be small, medium, large, or a custom size.
Type Description
Dial Shows data using a dial arc with one or more indicators that point to where thedata falls within predefined limits.
Horizontalbar
Shows data using a horizontal bar that changes color to indicate whether thedata is within predefined limits. The inner rectangle of the horizontal barshows the current level of data against the ranges marked on an outerrectangle.
Vertical bar Shows data using a vertical bar that changes color to indicate whether the datais within predefined limits. The inner rectangle of the vertical bar shows thecurrent level of data against the ranges marked on an outer rectangle.
Bulb Shows data using a circle that changes color to indicate whether the data iswithin predefined limits.
Bulb gauges are useful when you must know what the status is, and not anyindication of a specific value, or relative information about other thresholdranges.
What Types of Logical SQL Views Are Available?Logical SQL can be displayed in a few ways.
The table lists and describes the types of Logical SQL views that are available.
What Types of Views Are Available?
Adding Views for Display in Dashboards 4-9
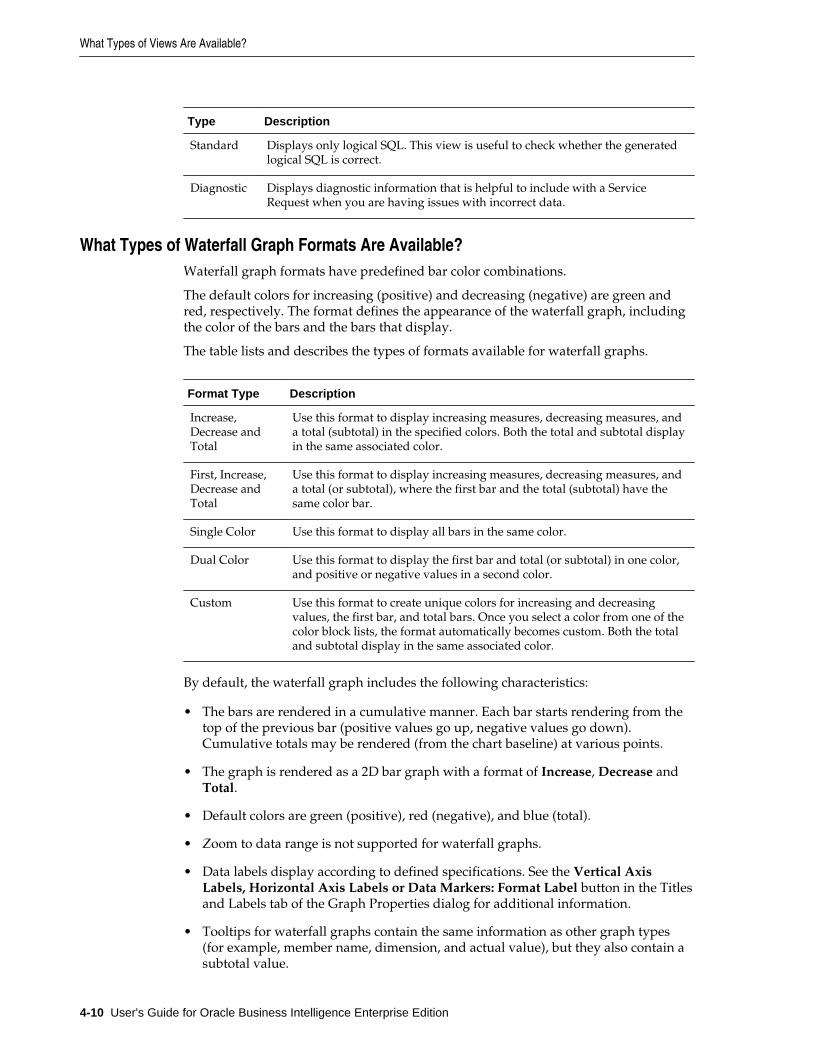
Type Description
Standard Displays only logical SQL. This view is useful to check whether the generatedlogical SQL is correct.
Diagnostic Displays diagnostic information that is helpful to include with a ServiceRequest when you are having issues with incorrect data.
What Types of Waterfall Graph Formats Are Available?Waterfall graph formats have predefined bar color combinations.
The default colors for increasing (positive) and decreasing (negative) are green andred, respectively. The format defines the appearance of the waterfall graph, includingthe color of the bars and the bars that display.
The table lists and describes the types of formats available for waterfall graphs.
Format Type Description
Increase,Decrease andTotal
Use this format to display increasing measures, decreasing measures, anda total (subtotal) in the specified colors. Both the total and subtotal displayin the same associated color.
First, Increase,Decrease andTotal
Use this format to display increasing measures, decreasing measures, anda total (or subtotal), where the first bar and the total (subtotal) have thesame color bar.
Single Color Use this format to display all bars in the same color.
Dual Color Use this format to display the first bar and total (or subtotal) in one color,and positive or negative values in a second color.
Custom Use this format to create unique colors for increasing and decreasingvalues, the first bar, and total bars. Once you select a color from one of thecolor block lists, the format automatically becomes custom. Both the totaland subtotal display in the same associated color.
By default, the waterfall graph includes the following characteristics:
• The bars are rendered in a cumulative manner. Each bar starts rendering from thetop of the previous bar (positive values go up, negative values go down).Cumulative totals may be rendered (from the chart baseline) at various points.
• The graph is rendered as a 2D bar graph with a format of Increase, Decrease andTotal.
• Default colors are green (positive), red (negative), and blue (total).
• Zoom to data range is not supported for waterfall graphs.
• Data labels display according to defined specifications. See the Vertical AxisLabels, Horizontal Axis Labels or Data Markers: Format Label button in the Titlesand Labels tab of the Graph Properties dialog for additional information.
• Tooltips for waterfall graphs contain the same information as other graph types(for example, member name, dimension, and actual value), but they also contain asubtotal value.
What Types of Views Are Available?
4-10 User's Guide for Oracle Business Intelligence Enterprise Edition
• Left-click interactions are not available for the total bar or the legend.
See Style tab of the Graph Properties dialog and Titles and Labels tab of the GraphProperties dialog for detailed information on editing waterfall graph properties.
Adding Views to the Results of AnalysesYou can add one or more views to the results of analyses to make the data easier tounderstand.
Bear these guidelines in mind:
• If you select a graph type or gauge type that is incompatible with the results, thenno results are shown.
• Do not use a pie graph to visualize data that includes negative values. Either filterthe analysis to ensure that all values are greater than 0 or use a different graphtype.
• As you design graphs, funnel graphs, and gauges, note that there are differences inthe display of a graph or gauge legend, depending on the whether the graph orgauge is displayed on a desktop or on a mobile device:
– On a desktop (where the graph or gauge format is Flash), the legend list isscrollable and the legend text does not wrap.
– On a mobile device (where the graph or gauge format is PNG), the legend list isnot scrollable and the legend text can wrap.
See What Is the Recommended Visualizations Feature?
1. In the Results tab of the Analysis editor (or alternatively in the Views Pane), clickthe New View button, then select a type of view to create in one of the followingways:
• If you know which view type you want to create, click it.
• If you want to have Oracle BI EE's recommended visualizations featureautomatically create the most appropriate view based on the data in youranalysis, click Best Visualization, rather than a specific view type.
• If you want to have Oracle BI EE's recommended visualizations feature providea ranked list of view types for you based on the data in your analysis as well ason what you want the view to illustrate, click Recommended Visualization forand then in the Select Visualization list, select your preference, such asDiscovering Patterns and Outliers.
Note: For some view types, you can also use the recommended visualizationsfeature to choose a recommended subtype.
The view is displayed in a container on the Compound Layout. (Note that defaultsare used to generate this view, such as the default view type, default formatting,and so on.)
2. To format the container for the view, click the Format Container button on theview container to display a formatting dialog.
Adding Views to the Results of Analyses
Adding Views for Display in Dashboards 4-11
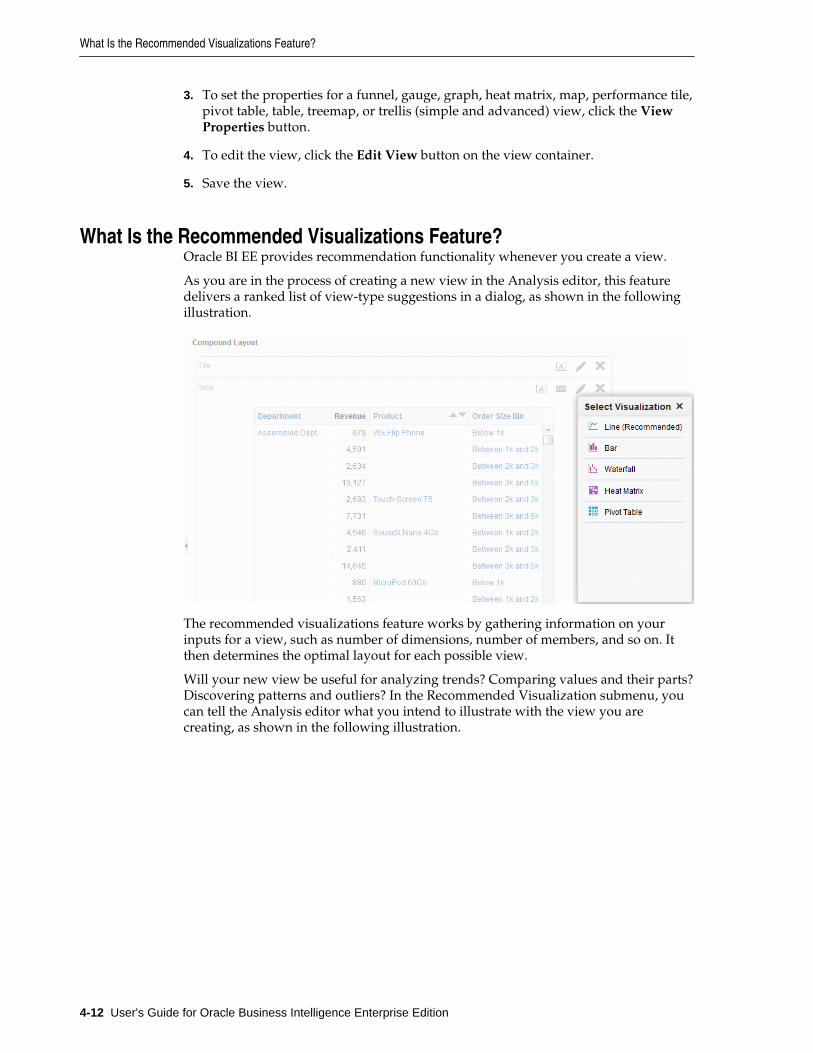
3. To set the properties for a funnel, gauge, graph, heat matrix, map, performance tile,pivot table, table, treemap, or trellis (simple and advanced) view, click the ViewProperties button.
4. To edit the view, click the Edit View button on the view container.
5. Save the view.
What Is the Recommended Visualizations Feature?Oracle BI EE provides recommendation functionality whenever you create a view.
As you are in the process of creating a new view in the Analysis editor, this featuredelivers a ranked list of view-type suggestions in a dialog, as shown in the followingillustration.
The recommended visualizations feature works by gathering information on yourinputs for a view, such as number of dimensions, number of members, and so on. Itthen determines the optimal layout for each possible view.
Will your new view be useful for analyzing trends? Comparing values and their parts?Discovering patterns and outliers? In the Recommended Visualization submenu, youcan tell the Analysis editor what you intend to illustrate with the view you arecreating, as shown in the following illustration.
What Is the Recommended Visualizations Feature?
4-12 User's Guide for Oracle Business Intelligence Enterprise Edition
6Filtering and Selecting Data for Analyses
This chapter explains how to construct filters, selection steps, groups, and calculateditems in Oracle Business Intelligence Enterprise Edition. It explains how to use theseobjects to specify the data that is displayed in analyses and dashboards.
Topics
This chapter includes the following sections:
• Saving Objects as Inline or Named
• What are Filters and Selection Steps?
• Working with Selections of Data
• Creating Column Filters
• Editing Column Filters
• Working with the EVALUATE_PREDICATE Function
• Applying a Named Filter to an Analysis
• Combining and Grouping Column Filters
• Using a Saved Analysis as a Filter
• Creating and Editing the SQL Statements for a Column Filter in an Analysis
• Working with Calculated Measures
• Working with Groups and Calculated Items
Saving Objects as Inline or NamedThis section describes saving objects as inline or named. It contains the followingtopics:
Topics
• What are Inline or Named Objects?
• What is the Folder Structure for Named Objects?
• Saving Filters as Inline or Named
• Saving Groups and Calculated Items as Inline or Named
Filtering and Selecting Data for Analyses 6-1
What are Inline or Named Objects?As you work with certain objects, you can create other objects that are saved withthose objects.
When you save one object with another, that object is saved "inline." You can savefilters, groups, and calculated items inline. For example, you can create a group as partof an analysis. When you save the analysis, the group is saved "inline" or along withthe analysis.
In addition to saving these objects inline, you can save them as individual objects withthe subject area in the Oracle BI Presentation Catalog. When you save an object on itsown, its becomes a "named" object. Named objects provide reusability, because youcan create one object and use it multiple times with any analysis, dashboard (forfilters), or dashboard page (for filters) that contains the columns that are specified inthe named object. When the named object is updated and saved, those updates areimmediately applied to all objects where the named object is used.
For example, after you save a group inline with an analysis, you can save the group asits own object in the catalog. You can then apply that named group from the Catalogpane to other analyses.
What is the Folder Structure for Named Objects?Named filters, groups, and calculated items are generally saved to their related subjectarea folder.
By saving the objects to a subject area folder, you ensure that they are available whenyou create an analysis for the same subject area.
Named objects saved in the /My Folders folder are available only to you. Objectssaved in the /Shared Folders folder are available to other users who have permissionto access the folders. If a subject area folder does not exist in your /My Folders folderor within the /Shared Folders folder, then the subject area folder is createdautomatically. When you save the object, the Save As dialog displays a default savepath to /My Folders/Subject Area Contents/<subject area>. However, the dialog'sFolders area continues to display all instances of the subject area folder in the catalog.
Saving Filters as Inline or NamedYou can save a filter as an inline filter or a named filter.
When you create an inline filter in the Criteria Tab's Filters pane of the Analysis editor,you can optionally save the inline filter as a named filter. Named filters can also becreated at the analysis level or as a standalone object from the global header.
A named filter can filter all or some of the analyses that are embedded in a dashboardor analyses that are embedded on the same dashboard page.
Saving Groups and Calculated Items as Inline or NamedSaving groups and calculated items allows those functions to be re-used throughoutthe application.
You can save groups and calculated item as an inline or named object:
• When you create a group or calculated item while editing and saving a view orwhile working in the Compound Layout, the group or calculated item is savedinline with the analysis.
Saving Objects as Inline or Named
6-2 User's Guide for Oracle Business Intelligence Enterprise Edition
• When you work in the Selection Steps pane:
– You can save a group or calculated item that is within a step as a named objectin the catalog.
– You can save a set of steps or the resulting members list for a column as anamed object. You cannot save a set of steps as a group if one of the stepsincludes a calculated item.
See Adding a Group to Another Analysis for information on adding a saved group toan analysis.
To save a calculated item or group as a named object to the catalog:
1. Display the Selection Steps pane.
2. Click the link for the calculated item or group, then click Save Calculated Item Asor Save Group As to display the Save As dialog.
3. Complete the dialog to save the object to the catalog.
To save a set of steps as a group to the catalog:
1. Display the Selection Steps pane.
2. Click the Save Selection Steps button to the far right of the column name.
3. Complete the Save Selection Steps dialog to save the group as an object to thecatalog.
What are Filters and Selection Steps?You use both filters and selection steps to limit the results that are displayed when ananalysis is run, so that the results answer a particular question.
Together with the columns that you select for an analysis, filters and selection stepsdetermine what the results contain. Based on the filters and selection steps, only thoseresults that match the criteria are shown. For example, depending on the industry inwhich you work, you can use filters and selection steps to learn who are the top tenperformers, what are the dollar sales for a particular brand, which are the mostprofitable customers, and so on.
Another kind of filter, called a prompt, can apply to all items in a dashboard. You canuse prompts to complete selection steps and filters at runtime. For more informationsee Prompting in Dashboards and Analyses.
Oracle BI Enterprise Edition provides the Filters view and Selection Steps view, whichyou can add to an analysis to display any filters or selection steps applied to theanalysis. Adding these views can help the user understand the information displayedin the analysis. For more information about how to add views to an analysis, see Adding Views for Display in Dashboards.
How Do Filters and Selection Steps Differ?Filters and selection steps are applied on a column-level basis and provide twomethods for limiting the data in an analysis.
A filter is always applied to a column before any selection steps are applied. Steps areapplied in their specified order. Filters and selection steps differ in various ways.
What are Filters and Selection Steps?
Filtering and Selecting Data for Analyses 6-3
Filters
You can apply filters directly to attribute columns and measure columns. You mustapply filters before the query is aggregated and affect the query and thus the resultingvalues for measures. For example, suppose that you have a list of members in whichthe aggregate sums to 100. Over time, more members meet the filter criteria and arefiltered in, which increases the aggregate sum to 200.
Selection Steps
Selection steps are applied after the query is aggregated and affect only the membersdisplayed, not the resulting aggregate values. For example, suppose that you have alist of hierarchical members in which the aggregate sums to 100. If you remove one ofthe members using a selection step, then the aggregate sum remains at 100.
You can create selection steps for both attribute columns and hierarchical columns.Selection steps are per column and cannot cross columns. Because attribute columnsdo not have an aggregate member, the use of selection steps versus filters for attributecolumns is not as distinctive as for hierarchical columns. While measure columns aredisplayed in the Selection Steps pane, you cannot create steps for them so steps do notaffect them. Measures are used to create condition steps for attribute and hierarchicalcolumns, such as Sales greater than $1 million.
Applying Filters to Attribute Columns to Affect Hierarchical ColumnsYou can use a filter on a related attribute column to affect the display of members in ahierarchical column.
For example, suppose a hierarchical column contains the levels Year, Quarter, andMonth. Suppose that a filter exists on the attribute column that corresponds to theYear hierarchy level. If you create a filter on Year to limit it to 2008 and 2009, thenwhen the hierarchical column is displayed in a view, only those two years are visible.This functionality depends on the way that the logical columns have been defined inthe business layer of the subject area in the Oracle BI Administration Tool.
Working with Selections of DataAs you specify which data members to include in an analysis, you create selections ofdata from the data source.
Each selection specifies the criteria for a set of members for a particular column, suchas Product or Geography. Each selection consists of one or more steps. A step is aninstruction that affects the selection, such as add Product members whose valuescontain the text ABC. The order in which steps are performed affects the selection ofdata. Each step acts incrementally on the results from previous steps, rather thanacting on all the members for that column.
You can view these selection steps in the Selection Steps pane. Steps are created usingthe following means:
• When you add a column to an analysis, a selection step is created automatically tostart with all members, unless you explicitly add specific members. As you dragand drop column members in the Results tab to add to the analysis, steps are alsocreated automatically. For example, suppose that you drag and drop the FY2007and FY2008 members from the Year hierarchical column to a pivot table. Theselection step Add FY2007, FY2008 is created.
• As you add groups and calculated items, steps are created automatically.
Working with Selections of Data
6-4 User's Guide for Oracle Business Intelligence Enterprise Edition
• When you use right-click interactions (such as Add Related or Keep Only) torefine the selection of data for a particular hierarchical column or attribute column,steps are created automatically. To remove these selection steps, use right-clickinteractions such as Remove Group or Remove Calculated Item. See Right-ClickInteractions in Views for additional information.
• You can create steps directly using the Selection Steps pane, to refine the selectionof data for a particular hierarchical column or attribute column. You can displaythe Selection Steps pane from various places including the Results tab, the Criteriatab, and some view editors.
Selection steps are one of the following types:
• Explicit list of members — A step can include a list of members for a column, suchas Boston, New York, Kansas, South. For hierarchical columns, the members can befrom different hierarchy levels. For attribute columns, the members are from onlythat column.
• Condition step — A step can specify that members are selected from a columnbased on a condition, which can be one of various types including based onmeasures or on top/bottom values. This member list is dynamic and determined atruntime.
• Based on hierarchy step — A step for hierarchical columns that enables you toselect the type of relationship with which to select members. You can select afamily relationship (such as children of or parent of), a specific hierarchy level (forlevel-based hierarchies only), or a level relationship (for level-based hierarchiesonly).
• Groups and calculated items — A step can include a group or calculated item. Youcan use groups and calculated items only with Add steps; you cannot use them inKeep Only or Remove steps.
For information, see Working with Groups and Calculated Items.
Note: When working with selection steps, if you search for members inhierarchical columns that are non-text (for example, date or time), then thesearch will yield no results.
Creating Selection StepsYou create steps in the Selection Steps pane, which you can display in various places.
You create a selection step to provide the instructions for specifying the criteria forselections of data from the data source. When you add a column to an analysis, animplicit Start with all members step is added. The "all" implies all the members of thecolumn after filters are applied.
For example, you can create a step to specify criteria for the following members in anOffice column: Baltimore, Austin, and Athens.
Creating selection steps in the Results tab allows users to choose the data mostimportant to them.
1. Display the Results tab of the Analysis editor.
2. If the Selection Steps pane is not visible, then click the Show Selection Steps panebutton on the toolbar to display it.
Working with Selections of Data
Filtering and Selecting Data for Analyses 6-5
The pane might also be collapsed at the bottom of the Results tab. Click the plussign icon to expand it.
3. For the column whose steps you want to define, click the Then, New Step link.
4. From the menu, select the option for the step type to create and complete theresulting dialog.
Selection steps are automatically created when you use the right-click interactions(such as Add Related or Keep Only) to refine the selection of data for a particularhierarchical column or attribute column in a view. See Right-Click Interactions inViews.
After you add selection steps to the analysis, you can go to the Results tab of theAnalysis editor and add the Selection Step view to the analysis. If you add theSelection Steps view, at runtime the user can view the selection steps that are appliedto the analysis. For more information about adding the selection steps view, seeSelection Steps editor of the Results tab.
Editing Selection StepsYou can edit existing selection steps in an analysis.
Use the Selection Steps pane to make changes to selection steps.
• Hover the mouse pointer over the step in the Selection Steps pane and click abutton on the resulting toolbar.
You can perform various tasks such as displaying a dialog for editing the step,deleting the step, or changing the order of the step in the list of steps.
For a group or calculated item, click its name to display a menu with options forediting and saving.
Saving Selection Steps as a Group ObjectSaving selection steps as a group object lets them be reused in multiple places.
If you have created a set of selection steps, then you can save and reuse the set as agroup object, as described in Saving Groups and Calculated Items as Inline or Named.
Working with Selection Steps and Double ColumnsIf your repository is configured for double columns, then you can create a selectionstep on a double column.
To create a selection step on a double column, select the display values for that columnand the step is automatically evaluated using the code values that correspond to thosedisplay values.
If you use double columns, then use care with the New Calculated Item dialog. Youcan include a positional operator in the custom formula for the calculated item, suchas $1, which specifies the column from the first row in the data set. When you includea positional operator, the display values cannot be mapped to the code values whenevaluating the formula.
For information on double columns, see Understanding the Double Column Feature.
Working with Selections of Data
6-6 User's Guide for Oracle Business Intelligence Enterprise Edition
Creating Column FiltersYou can create a named or inline filter in columns to display specific data.
For information about opening a filter for editing, see Editing Column Filters .
Note: If your repository is configured for double columns, and you want touse an operator other than is equal to / is in, is not equal to / is not in, or isbetween and specify code values rather than display values, then you shouldexplicitly choose the code column rather than the display column.
For information on double columns, see Understanding the Double ColumnFeature.
1. To create a named filter:
a. From the Oracle Business Intelligence Home page, locate the global header,hover over the New menu, and from the menu select Filter.
b. From the Select Subject Area dialog, choose the subject area for which you wantto create a filter.
c. From the Subject Areas pane of the Filter editor, double-click the column forwhich you want to create the filter.
2. To create an inline filter:
a. Either create an analysis or access an existing analysis for which you want tocreate a filter. Click the Criteria tab.
b. Locate the Filters pane and from the Filters Pane's toolbar, click the Create afilter for the current Subject Area button. The analysis' selected columns aredisplayed in the cascading menu.
c. Select a column name from the menu. Or select the More Columns option toaccess the Select Column dialog from which you can select any column from thesubject area.
Note: If you want to add a filter for a column located in a different subjectarea, then you must first add that subject area to the analysis by clicking theAdd/Remove Subject Area button in the Subject Areas pane.
3. In the Operator field of the New filter dialog, choose an operator for the filter. Theoperator list from which you can choose is populated based on the type of columnthat you selected. For more information about each operator, including the isprompted and is based on the results of another analysis operator options, seeOperators.
4. In the Value field, specify one or more values to use when applying the filter orcondition. You can:
• Type values, using a semicolon to separate the values.
• Select values from the list or calendar.
Creating Column Filters
Filtering and Selecting Data for Analyses 6-7
7Prompting in Dashboards and Analyses
This chapter explains how to construct prompts in Oracle Business IntelligenceEnterprise Edition and use them to specify the data that is displayed in dashboardsand analyses. It also describes the auto-complete functionality and explains how toadd dashboard prompts to dashboards and dashboard pages.
Topics
This chapter includes the following sections:
• What Are Inline and Dashboard Prompts?
• What are Column Prompts?
• Other Prompt Types
• What Types of User Input Options Can I Use With a Column or Variable Prompt?
• How Do Prompts Work in Oracle BI Mobile?
• Can Dashboard Prompts and Analysis Prompts Interact?
• In What Order Does Oracle BI EE Apply Prompts with Default Values?
• What Is Auto-Complete?
• Creating a Column Prompt
• Overriding a Selection Step With a Column Prompt
• Creating an Image Prompt
• Creating a Currency Prompt
• Creating a Variable Prompt
• Editing Prompts
• Adding a Dashboard Prompt to a Dashboard or Dashboard Page
• Adding a Hidden Dashboard Prompt to a Dashboard or Dashboard Page
What Are Inline and Dashboard Prompts?The two differences between inline prompts and dashboard prompts is where they arestored and their runtime behavior.
A prompt that is created at the analysis level is called an inline prompt because theprompt is embedded in the analysis and is not stored in the Oracle BI PresentationCatalog and, therefore, cannot be added to other analyses. Inline prompts allow the
Prompting in Dashboards and Analyses 7-1
end users to specify the data values that determine the content of the analysis. Aninline prompt can be a column prompt, variable prompt, image prompt, or currencyprompt. When you create an inline prompt, you select the columns and operators forthe prompt and specify how the prompt is displayed to the users and how the usersselect the values. The user's choices determine the content of the analyses that areembedded in the dashboard. An inline prompt is an initial prompt, meaning that itonly displays when the analysis is rendered. After the user selects the prompt value,the prompt fields disappear from the analysis and the only way for the user to selectdifferent prompt values is to re-run the analysis.
A prompt that is created at the dashboard level is called a dashboard prompt becausethe prompt is created outside of a specific dashboard and is stored in the catalog as anobject, which can then be added to any dashboard or dashboard page that contains thecolumns that are specified in the prompt. Dashboard prompts allow the end users tospecify the data values that determine the content of all of the analyses and scorecardobjects contained on the dashboard. A dashboard prompt can be a column prompt,variable prompt, image prompt, or currency prompt. Dashboard prompts arereusable, because you can create one prompt and use it many times. When the promptobject is updated and saved, those updates are immediately displayed in alldashboards where the prompt is used. A dashboard prompt is a specific kind of filterthat, when created, saved, and applied to a dashboard or dashboard pages, can filterall or some of the analyses and scorecard objects that are embedded in a dashboard oranalyses and scorecard objects that are embedded on the same dashboard page. Adashboard prompt is interactive and is always displayed on the dashboard page sothat the user can prompt for different values without having to re-run the dashboard.Users can create and save dashboard prompts to either a private folder or to a sharedfolder.
Note that for a dashboard using a column that was renamed in the Business Model,the existing dashboard prompts based on the renamed column do not work withnewly created analyses. The workaround for this issue is to use Catalog Manager torename the column in the catalog.
For more information about creating a column prompt, see Creating a ColumnPrompt.
What are Column Prompts?A column prompt is the most common and flexible prompt type.
A column prompt enables you to build very specific value prompts to either standalone on the dashboard or analysis or to expand or refine existing dashboard andanalysis filters. Column prompts can be created for hierarchical, measure, or attributecolumns at the analysis or dashboard level.
You can create intelligent prompts that are specialized for the user's business needsand roles so that the user can quickly and accurately find the appropriate data that isneeded to make a key business decision.
Oracle BI Enterprise Edition also enables you, as the content designer, to createcurrency prompts, image prompts, and variable prompts. For more information aboutthese types of prompts, see Other Prompt Types.
How Do Column Prompts and Selection Steps Interact?
Selection steps allow the user to provide or refine the data from attribute columns andmeasures columns and to provide a kind of filter for hierarchical columns. Note thatselection steps are applied after data aggregation. When you create selection steps fora column, you have the option of overriding one step of the selection with a dashboard
What are Column Prompts?
7-2 User's Guide for Oracle Business Intelligence Enterprise Edition
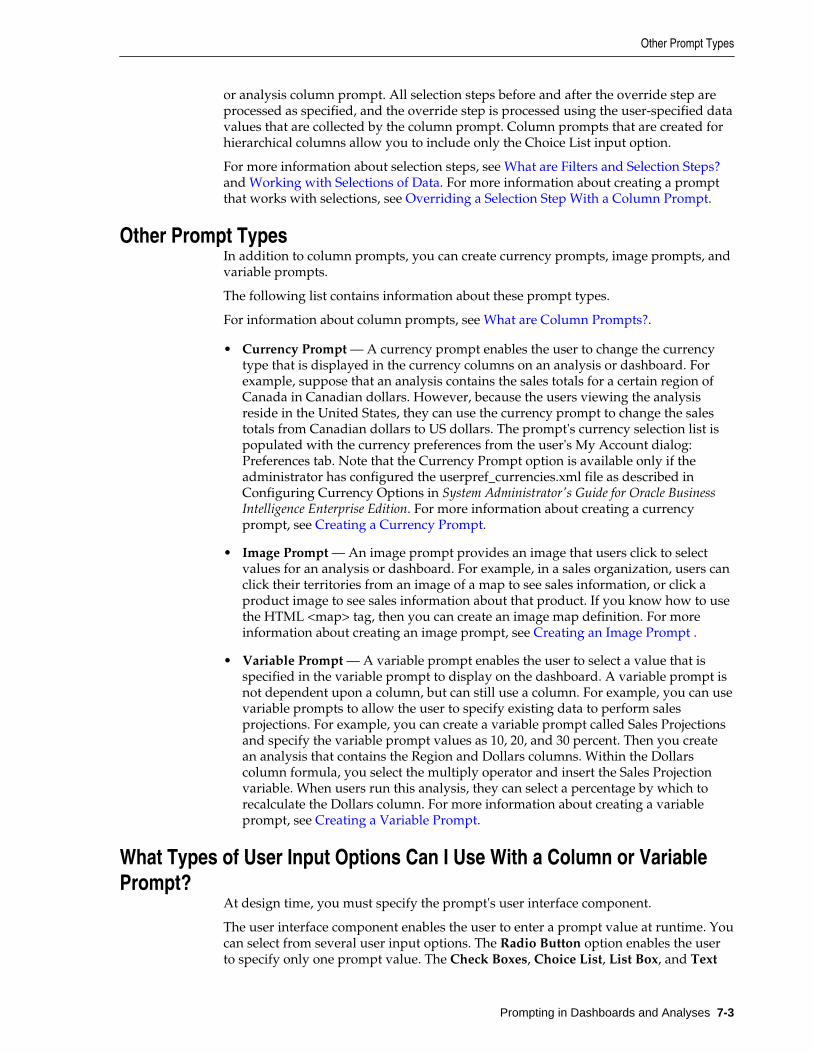
or analysis column prompt. All selection steps before and after the override step areprocessed as specified, and the override step is processed using the user-specified datavalues that are collected by the column prompt. Column prompts that are created forhierarchical columns allow you to include only the Choice List input option.
For more information about selection steps, see What are Filters and Selection Steps?and Working with Selections of Data. For more information about creating a promptthat works with selections, see Overriding a Selection Step With a Column Prompt.
Other Prompt TypesIn addition to column prompts, you can create currency prompts, image prompts, andvariable prompts.
The following list contains information about these prompt types.
For information about column prompts, see What are Column Prompts?.
• Currency Prompt — A currency prompt enables the user to change the currencytype that is displayed in the currency columns on an analysis or dashboard. Forexample, suppose that an analysis contains the sales totals for a certain region ofCanada in Canadian dollars. However, because the users viewing the analysisreside in the United States, they can use the currency prompt to change the salestotals from Canadian dollars to US dollars. The prompt's currency selection list ispopulated with the currency preferences from the user's My Account dialog:Preferences tab. Note that the Currency Prompt option is available only if theadministrator has configured the userpref_currencies.xml file as described in Configuring Currency Options in System Administrator's Guide for Oracle BusinessIntelligence Enterprise Edition. For more information about creating a currencyprompt, see Creating a Currency Prompt.
• Image Prompt — An image prompt provides an image that users click to selectvalues for an analysis or dashboard. For example, in a sales organization, users canclick their territories from an image of a map to see sales information, or click aproduct image to see sales information about that product. If you know how to usethe HTML <map> tag, then you can create an image map definition. For moreinformation about creating an image prompt, see Creating an Image Prompt .
• Variable Prompt — A variable prompt enables the user to select a value that isspecified in the variable prompt to display on the dashboard. A variable prompt isnot dependent upon a column, but can still use a column. For example, you can usevariable prompts to allow the user to specify existing data to perform salesprojections. For example, you can create a variable prompt called Sales Projectionsand specify the variable prompt values as 10, 20, and 30 percent. Then you createan analysis that contains the Region and Dollars columns. Within the Dollarscolumn formula, you select the multiply operator and insert the Sales Projectionvariable. When users run this analysis, they can select a percentage by which torecalculate the Dollars column. For more information about creating a variableprompt, see Creating a Variable Prompt.
What Types of User Input Options Can I Use With a Column or VariablePrompt?
At design time, you must specify the prompt's user interface component.
The user interface component enables the user to enter a prompt value at runtime. Youcan select from several user input options. The Radio Button option enables the userto specify only one prompt value. The Check Boxes, Choice List, List Box, and Text
Other Prompt Types
Prompting in Dashboards and Analyses 7-3
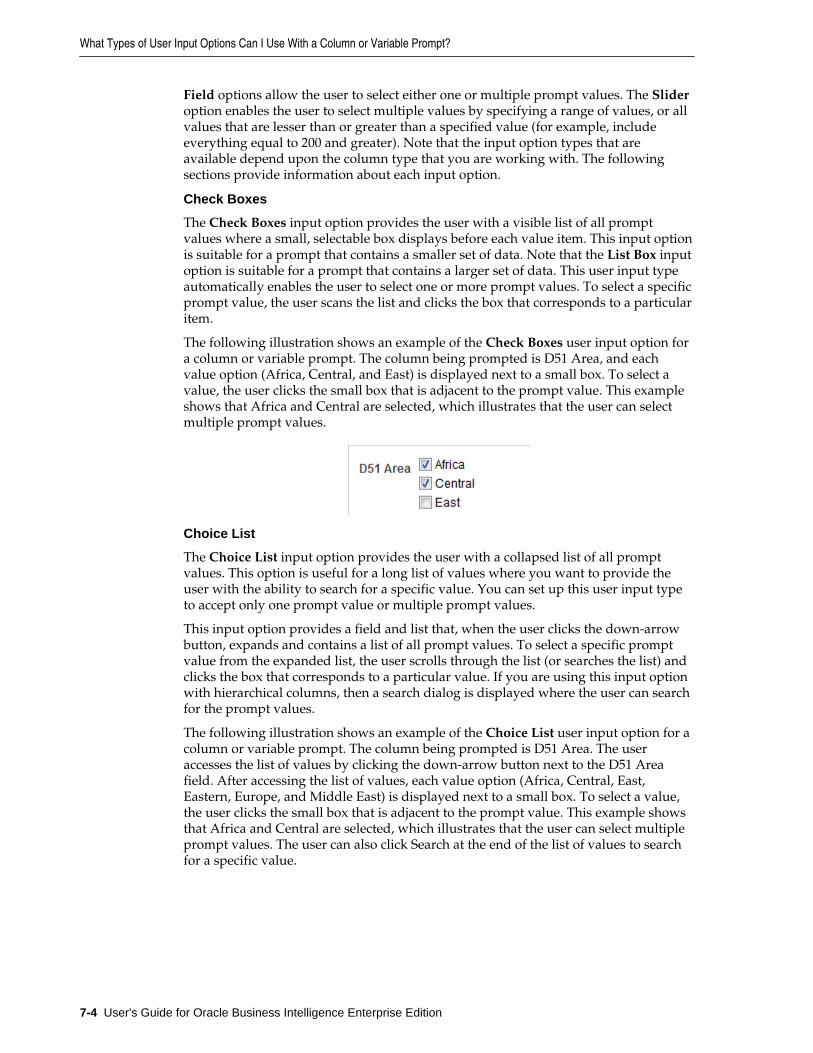
Field options allow the user to select either one or multiple prompt values. The Slideroption enables the user to select multiple values by specifying a range of values, or allvalues that are lesser than or greater than a specified value (for example, includeeverything equal to 200 and greater). Note that the input option types that areavailable depend upon the column type that you are working with. The followingsections provide information about each input option.
Check Boxes
The Check Boxes input option provides the user with a visible list of all promptvalues where a small, selectable box displays before each value item. This input optionis suitable for a prompt that contains a smaller set of data. Note that the List Box inputoption is suitable for a prompt that contains a larger set of data. This user input typeautomatically enables the user to select one or more prompt values. To select a specificprompt value, the user scans the list and clicks the box that corresponds to a particularitem.
The following illustration shows an example of the Check Boxes user input option fora column or variable prompt. The column being prompted is D51 Area, and eachvalue option (Africa, Central, and East) is displayed next to a small box. To select avalue, the user clicks the small box that is adjacent to the prompt value. This exampleshows that Africa and Central are selected, which illustrates that the user can selectmultiple prompt values.
Choice List
The Choice List input option provides the user with a collapsed list of all promptvalues. This option is useful for a long list of values where you want to provide theuser with the ability to search for a specific value. You can set up this user input typeto accept only one prompt value or multiple prompt values.
This input option provides a field and list that, when the user clicks the down-arrowbutton, expands and contains a list of all prompt values. To select a specific promptvalue from the expanded list, the user scrolls through the list (or searches the list) andclicks the box that corresponds to a particular value. If you are using this input optionwith hierarchical columns, then a search dialog is displayed where the user can searchfor the prompt values.
The following illustration shows an example of the Choice List user input option for acolumn or variable prompt. The column being prompted is D51 Area. The useraccesses the list of values by clicking the down-arrow button next to the D51 Areafield. After accessing the list of values, each value option (Africa, Central, East,Eastern, Europe, and Middle East) is displayed next to a small box. To select a value,the user clicks the small box that is adjacent to the prompt value. This example showsthat Africa and Central are selected, which illustrates that the user can select multipleprompt values. The user can also click Search at the end of the list of values to searchfor a specific value.
What Types of User Input Options Can I Use With a Column or Variable Prompt?
7-4 User's Guide for Oracle Business Intelligence Enterprise Edition
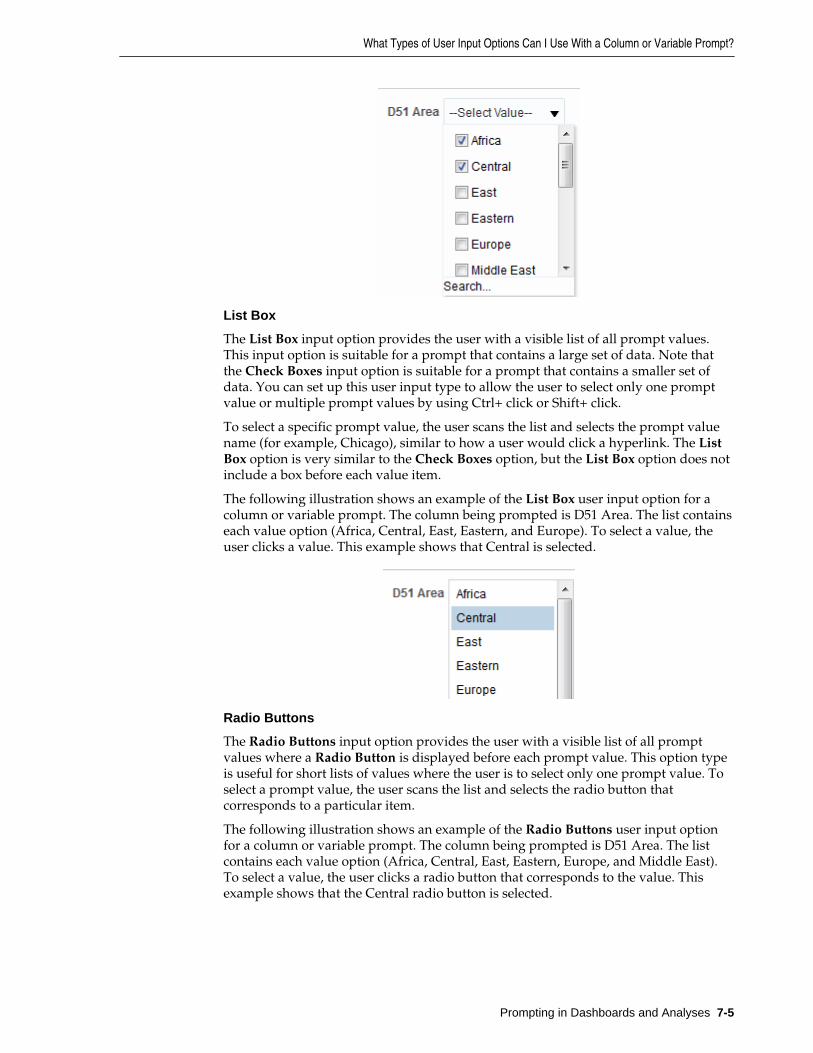
List Box
The List Box input option provides the user with a visible list of all prompt values.This input option is suitable for a prompt that contains a large set of data. Note thatthe Check Boxes input option is suitable for a prompt that contains a smaller set ofdata. You can set up this user input type to allow the user to select only one promptvalue or multiple prompt values by using Ctrl+ click or Shift+ click.
To select a specific prompt value, the user scans the list and selects the prompt valuename (for example, Chicago), similar to how a user would click a hyperlink. The ListBox option is very similar to the Check Boxes option, but the List Box option does notinclude a box before each value item.
The following illustration shows an example of the List Box user input option for acolumn or variable prompt. The column being prompted is D51 Area. The list containseach value option (Africa, Central, East, Eastern, and Europe). To select a value, theuser clicks a value. This example shows that Central is selected.
Radio Buttons
The Radio Buttons input option provides the user with a visible list of all promptvalues where a Radio Button is displayed before each prompt value. This option typeis useful for short lists of values where the user is to select only one prompt value. Toselect a prompt value, the user scans the list and selects the radio button thatcorresponds to a particular item.
The following illustration shows an example of the Radio Buttons user input optionfor a column or variable prompt. The column being prompted is D51 Area. The listcontains each value option (Africa, Central, East, Eastern, Europe, and Middle East).To select a value, the user clicks a radio button that corresponds to the value. Thisexample shows that the Central radio button is selected.
What Types of User Input Options Can I Use With a Column or Variable Prompt?
Prompting in Dashboards and Analyses 7-5
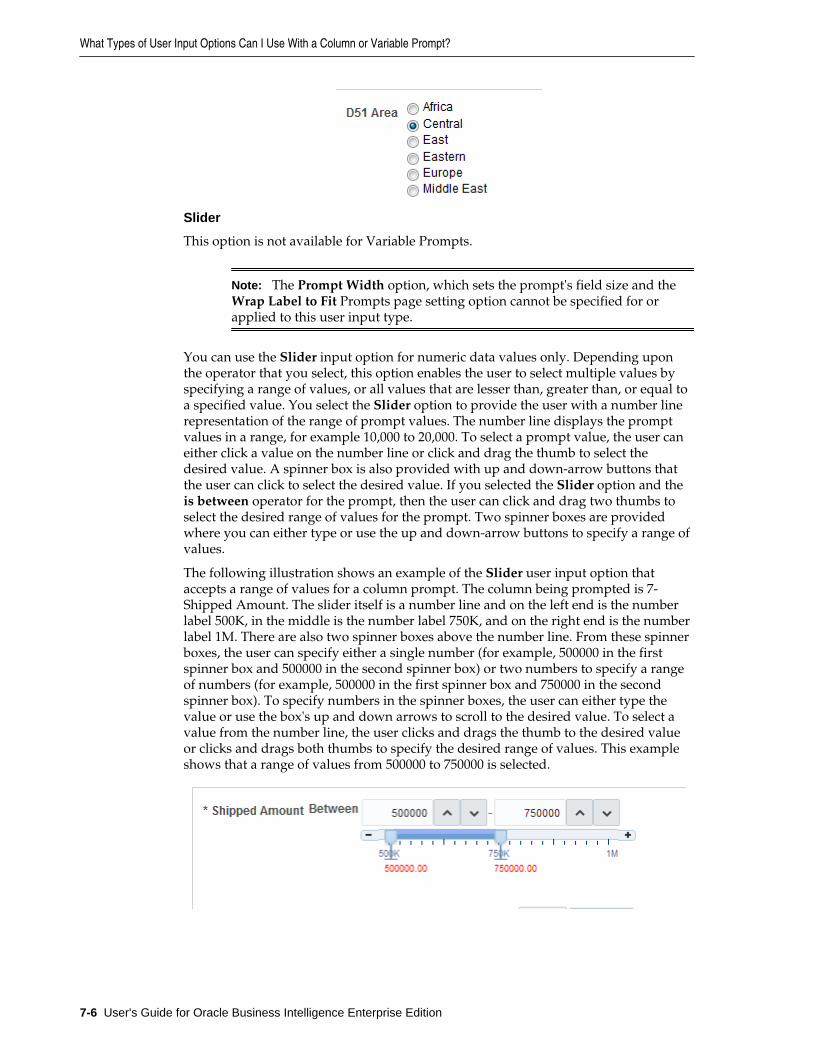
Slider
This option is not available for Variable Prompts.
Note: The Prompt Width option, which sets the prompt's field size and theWrap Label to Fit Prompts page setting option cannot be specified for orapplied to this user input type.
You can use the Slider input option for numeric data values only. Depending uponthe operator that you select, this option enables the user to select multiple values byspecifying a range of values, or all values that are lesser than, greater than, or equal toa specified value. You select the Slider option to provide the user with a number linerepresentation of the range of prompt values. The number line displays the promptvalues in a range, for example 10,000 to 20,000. To select a prompt value, the user caneither click a value on the number line or click and drag the thumb to select thedesired value. A spinner box is also provided with up and down-arrow buttons thatthe user can click to select the desired value. If you selected the Slider option and theis between operator for the prompt, then the user can click and drag two thumbs toselect the desired range of values for the prompt. Two spinner boxes are providedwhere you can either type or use the up and down-arrow buttons to specify a range ofvalues.
The following illustration shows an example of the Slider user input option thataccepts a range of values for a column prompt. The column being prompted is 7-Shipped Amount. The slider itself is a number line and on the left end is the numberlabel 500K, in the middle is the number label 750K, and on the right end is the numberlabel 1M. There are also two spinner boxes above the number line. From these spinnerboxes, the user can specify either a single number (for example, 500000 in the firstspinner box and 500000 in the second spinner box) or two numbers to specify a rangeof numbers (for example, 500000 in the first spinner box and 750000 in the secondspinner box). To specify numbers in the spinner boxes, the user can either type thevalue or use the box's up and down arrows to scroll to the desired value. To select avalue from the number line, the user clicks and drags the thumb to the desired valueor clicks and drags both thumbs to specify the desired range of values. This exampleshows that a range of values from 500000 to 750000 is selected.
What Types of User Input Options Can I Use With a Column or Variable Prompt?
7-6 User's Guide for Oracle Business Intelligence Enterprise Edition
8Formatting Analyses, Views, and
Dashboard Pages
This chapter explains how to apply formatting to analyses, views, and dashboardpages in Oracle Business Intelligence Enterprise Edition. It describes cosmeticformatting, conditional formatting, custom format masks, and custom format strings.
Topics
This chapter includes the following sections:
• What Can be Formatted?
• Formatting Columns in Analyses
• What is Cosmetic Formatting?
• Applying Conditional Formatting to Tables, Pivot Tables, Performance Tiles,Graphs, Heat Matrices, and Trellises
• Storing Custom Files Locally and Using the fmap Function to Reference Them
• Custom Format Masks
• Custom Format Strings
What Can be Formatted?After you create and run an analysis, default formatting rules are applied to theanalysis' results.
Default formatting rules are based on cascading style sheets and XML message files.You can create additional formatting to apply to specific results. Additional formatshelp you to highlight blocks of related information and call attention to specific dataelements. You can also use additional formatting to customize the general appearanceof analyses and dashboards.
You can apply formatting to the following:
• Columns in analyses, as described in Applying Formatting to Columns in Analyses
• Views, as described in Applying Formatting to Views
• Dashboard pages, as described in Applying Formatting to Dashboard Pages
Applying Formatting to Columns in AnalysesAs you work with columns in an analysis, you can specify their formatting.
Formatting Analyses, Views, and Dashboard Pages 8-1
The formatting that you apply is visible when the column is displayed in views suchas tables and pivot tables. For information, see Formatting Columns in Analyses.
Applying Formatting to ViewsThere are multiple ways to apply formatting to views.
You can apply formatting to views in the following ways:
• In the View editor: When you edit a view in its editor, you can generally displayvarious dialogs that allow you to format either the view itself or its pieces, asapplicable. Formatting options are unique to the view type. Formatting that youspecify in the view editor overrides any formatting that was specified for columns.
• In the Compound Layout: When you use the Compound Layout, you can click abutton on the toolbar of the container for each view to display a formatting dialog.Use that dialog to apply formatting to the view's container, such as to place a greenbackground on the container for a table.
Applying Formatting to Dashboard PagesYou can apply formatting to the page layout columns and sections of dashboardpages.
When you edit a dashboard page, you can edit the properties of its columns andsections and apply cosmetic formatting. For information, see What is CosmeticFormatting? and Building and Using Dashboards.
Formatting Columns in AnalysesApplying specific formatting to columns helps bring attention to data when it meetscriteria.
When you build an analysis, you can edit properties for columns to control theirappearance and layout. You can also specify formatting to apply only if the contents ofthe column meet certain conditions. By default, the specifications for a column applyonly to the current analysis.
If your account has the appropriate privileges, then you can save the user-specifiedcolumn properties as the systemwide default settings to use every time that data fromthat column, or columns of that particular data type, is displayed in results. Theproperties that you can save as defaults include formatting ones and other propertiessuch as those that affect interactions and data write back.
Because groups and calculated items are simply members of their respective columns,they inherit the formatting from the column and follow the same precedence order asfor other members, unless you specifically apply formatting to the groups orcalculated items.
This section contains the following topics:
• What Kinds of Formatting Can I Apply?
• Applying Formatting to a Column
• Saving Formatting Defaults
Formatting Columns in Analyses
8-2 User's Guide for Oracle Business Intelligence Enterprise Edition
What Kinds of Formatting Can I Apply?You can use the tabs in the Column Properties dialog to customize how content isdisplayed for columns in views. Hierarchy levels provide an additional detail offormatting for hierarchical columns.
The following list provides examples of the kinds of formatting that you can apply:
• Apply cosmetic formatting to the column or hierarchy level, such as font familyand size.
• Assign alternate folder and column heading names and apply custom formatting tothem.
• Control the display of duplicate data, such as repeating column labels.
• Override the default formatting for columns and data values with customformatting.
• Apply conditional formatting to the column or hierarchy level, which enablesdifferent formatting to be applied based on the values. For example, values greaterthan $1 million can be formatted with a green color.
Applying Formatting to a ColumnYou can set default formatting for columns.
You can override the default settings by formatting columns in editors for data views,such as tables.
1. Open the analysis in which you want to edit formatting and behavior in theCriteria tab of the Analysis editor, and then:
2. Add or locate the column or hierarchy level to modify. (Expand a hierarchicalcolumn to see its levels.)
3. Click the Options button to the right of the column name or hierarchy level namein the Selected Columns pane, and click Column Properties or Hierarchy LevelProperties.
4. In the Column Properties dialog, click the Style tab and specify how you want eachcell and its contents to be displayed in the analysis. For example, change the cellborder to red and the cell content to be displayed in a 14-point Arial font.
5. In the Column Properties dialog, click the Column Format tab to specify variousproperties such as those for heading names and value suppression.
6. Click the Data Format tab to specify how you want to override the data's defaultdisplay characteristics. The options that display on this tab depend upon the datatype (text, date and time zone, or numeric).
7. Click the Conditional Format tab to add conditional formatting to a column orhierarchy level.
8. If you accessed the Column Properties dialog from the Criteria tab, you canoptionally click Save as Default and click the appropriate option to restore or tosave defaults, if you have the appropriate privileges.
Formatting Columns in Analyses
Formatting Analyses, Views, and Dashboard Pages 8-3
9. Click OK to save your changes.
Saving Formatting DefaultsYou can override column formatting defaults using the provided style sheet.
When you use the tabs in the Column Properties dialog to customize how content isdisplayed for columns in views, you override the Oracle Business Intelligence stylesheet and the system defaults for the column or hierarchy level.
You have the option of saving the modified properties for just the column or hierarchylevel within the analysis, of saving the properties as systemwide defaults for the datatype, or of saving the properties as systemwide defaults for the column or hierarchylevel so that its formatting and behavior is the same no matter in which analysis itdisplays. Anyone who uses this column or hierarchy level or a column or hierarchylevel of this data type in subsequent analyses therefore uses the settings in the ColumnProperties dialog by default. To save systemwide properties, you must have theappropriate privileges.
The ability to set a systemwide default can provide consistency and save time withinyour organization. For example, suppose that your organization had decided to useArial as the font family for all text columns in all analyses. Suppose that a decision islater made to switch to Times New Roman for all text columns. You can simply saveTimes New Roman as the systemwide default for text columns. All existing analysesthat contain text columns in which the font family is specified as Default (Arial) areupdated automatically.
What is Cosmetic Formatting?Cosmetic formatting affects the visual appearance of data in columns and hierarchylevels, views, and columns and sections on dashboard pages.
You can apply cosmetic formatting, copy and paste cosmetic formatting attributes, andsave a formatted analysis to use with the columns of another analysis.
You can display various dialogs that provide access to and control over variouscosmetic attributes. Depending on the object that you are formatting, the dialogdisplays different options, such as font, cell, and border controls, background color,additional formatting options such as cell padding, and custom CSS style options forHTML.
Using a Saved Analysis to Modify the Cosmetic Appearance of Other AnalysesYou can import the formatting from a saved analysis into other analyses.
After you have customized the cosmetic appearance of an analysis using the Criteriatab and the Results tab and have saved it, you can import the formatting from thesaved analysis and its views to new or existing analyses. Some views, such as gauge,graph, heat matrix, performance tile, and treemap do not support formatting byimporting. This section contains the following topics:
• Where is the Import formatting from another analysis Button?
• Which View Types Support Imported Formatting?
• How is Imported Formatting Applied?
• Importing Formatting Using a Saved Analysis
What is Cosmetic Formatting?
8-4 User's Guide for Oracle Business Intelligence Enterprise Edition
Where is the Import formatting from another analysis Button?You can use a saved analysis to modify the cosmetic appearance of other views byclicking the Import formatting from another analysis button.
This button is available on the following toolbars:
• The Compound Layout toolbar — When you click this button, the formatting isapplied to all applicable views in the layout. See Applying Formatting fromContainers.
• The view editor toolbar — When you click this button, the formatting is appliedonly to the view that you are editing. See Which View Types Support ImportedFormatting?.
Which View Types Support Imported Formatting?Some view types support formatting imported from other views.
The following list describes the components that support the use of a saved analysisfor formatting other views:
• View Types — You can import formatting from the following view types:
– Legend — Imports formatting for the legend title, the caption, and the legendcontainer. Textual content is not imported.
– Narrative — Imports only the text font color. Textual properties such as prefix,postfix, and narrative texts are not imported.
– Pivot table, table, and trellis — Imports formatting for the columns, green barspecifications, sub-totals and grand totals, and section properties.
– Static Text — Imports only the text font color. Textual content is not imported.
– Title — Imports formatting for the title, logo, subtitle, start time, and help URL.
– View Selector — Imports only the caption formatting.
• Compound Layout — You can import formatting that was specified after clickingthe Format Container button for the view in the Compound Layout.
How is Imported Formatting Applied?Imported formatting is applied differently than local formatting.
Formatting is applied slightly differently depending on whether you are importingformatting that was applied to columns, to views, or to view containers in theCompound Layout.
Applying Formatting from Columns
This functionality works best for views when attribute, measure, or hierarchicalcolumn numbers align precisely or for a single column template that can be applied toall columns.
If a single column exists in the saved analysis, then its formatting is applied to allcolumns in the tables, pivot tables, and trellises of the target analysis.
For multiple columns, formatting is applied positionally, from left to right for columnheadings and values. A column that exceeds the number in the saved analysis gets the
What is Cosmetic Formatting?
Formatting Analyses, Views, and Dashboard Pages 8-5
closest column's format repeated. For example, suppose the saved analysis containsfour columns formatted with these colors in this order: red, green, blue, yellow. In thetarget analysis, its six columns would acquire these colors in this order: red, green,blue, yellow, yellow, yellow.
Applying Formatting from Views
Formatting is applied to a view only if a view of that type exists in the target analysis.
The imported formatting applies to all views of that type in the target analysis. Forexample, suppose that a saved analysis contains a legend to which you havecustomized formatting. If you import that formatting into a target analysis thatcontains three legends, then all three legends inherit that formatting.
Applying Formatting from Containers
In the Compound Layout, you can specify formatting properties (such as backgroundcolor, borders, and padding) for view containers.
When you import that container formatting using a saved analysis, the views in thetarget analysis inherit the exact container formatting properties as the views in thesaved analysis.
The layout of the views in the two analyses need not be exactly the same for containerformatting to work correctly. If the target analysis contains more views than the sourceanalysis, then the extra views inherit the imported formatting. For example, suppose asaved analysis contains two tables that are stacked on top of each other in theCompound Layout. Suppose the target analysis contains four tables that are laid outtwo by two. The source analysis has only one layout column of two table views. Thetwo tables in each of the first and second layout columns of the target analysis inheritthe applied formatting.
Importing Formatting Using a Saved AnalysisUsing a saved analysis to import formatting helps ensure consistency across analyses.
You can use the format of a saved analysis like a template.
1. Display either the analysis in which you want to import formatting in the Resultstab of the Analysis editor, or display the view in its editor.
2. Click the Import formatting from another analysis button.
3. In the Select Analysis dialog, navigate to the saved analysis and click OK.
Applying Conditional Formatting to Tables, Pivot Tables, PerformanceTiles, Graphs, Heat Matrices, and Trellises
In tables, pivot tables, performance tiles, graphs, heat matrices, and trellisesconditional formatting helps direct attention to a data element if it meets a certaincondition.
For example, you can show below-quota sales figures in a certain color, or display animage such as a trophy next to the name of each salesperson who exceeds quota by acertain percent.
This section describes how to apply conditional formatting in tables, pivot tables,performance tiles, heat matrices, and trellises. For information on graphs, see GraphFormatting Based on Columns. This section contains the following topics:
• How is Conditional Formatting Applied?
Applying Conditional Formatting to Tables, Pivot Tables, Performance Tiles, Graphs, Heat Matrices, and Trellises
8-6 User's Guide for Oracle Business Intelligence Enterprise Edition
• Can Conditional Formats Be Based on Another Column?
• What Factors Affect Conditional Formats?
• Applying Conditional Formatting
• Example of Conditional Formatting for Ranking
How is Conditional Formatting Applied?You apply conditional formatting by selecting one or more columns or hierarchylevels in the analysis to use, specifying the condition to meet, and then makingspecifications for font, cell, border, and style sheet options to apply when the conditionis met.
The conditional formats can include colors, fonts, images, and so on, for the data andfor the cell that contains the data. Your specifications apply only to the contents of thecolumns or hierarchy levels in the tables and pivot tables for the analysis with whichyou are working.
You can add multiple conditions so that the data is displayed in one of severalformats, based upon the value of the data. For example, below-quota sales can bedisplayed in one color, and above-quota sales can be displayed in another color. Whenyou specify multiple conditions, all the conditions are verified and the formats aremerged for the conditions that are true. In the event of a conflict when trying to mergemultiple formats, the condition that is last verified as true affects the format that isdisplayed.
Note: Conditional formatting is not supported for direct database requests.
Can Conditional Formats Be Based on Another Column?You can create conditional formats to apply to one column based on the values of asecond column, for display in tables, pivot tables, and trellises.
For example, you can create a conditional format to color the D50 Region columngreen when values of the 1 - Revenue column are greater than $9 million, as shown.
Applying Conditional Formatting to Tables, Pivot Tables, Performance Tiles, Graphs, Heat Matrices, and Trellises
Formatting Analyses, Views, and Dashboard Pages 8-7
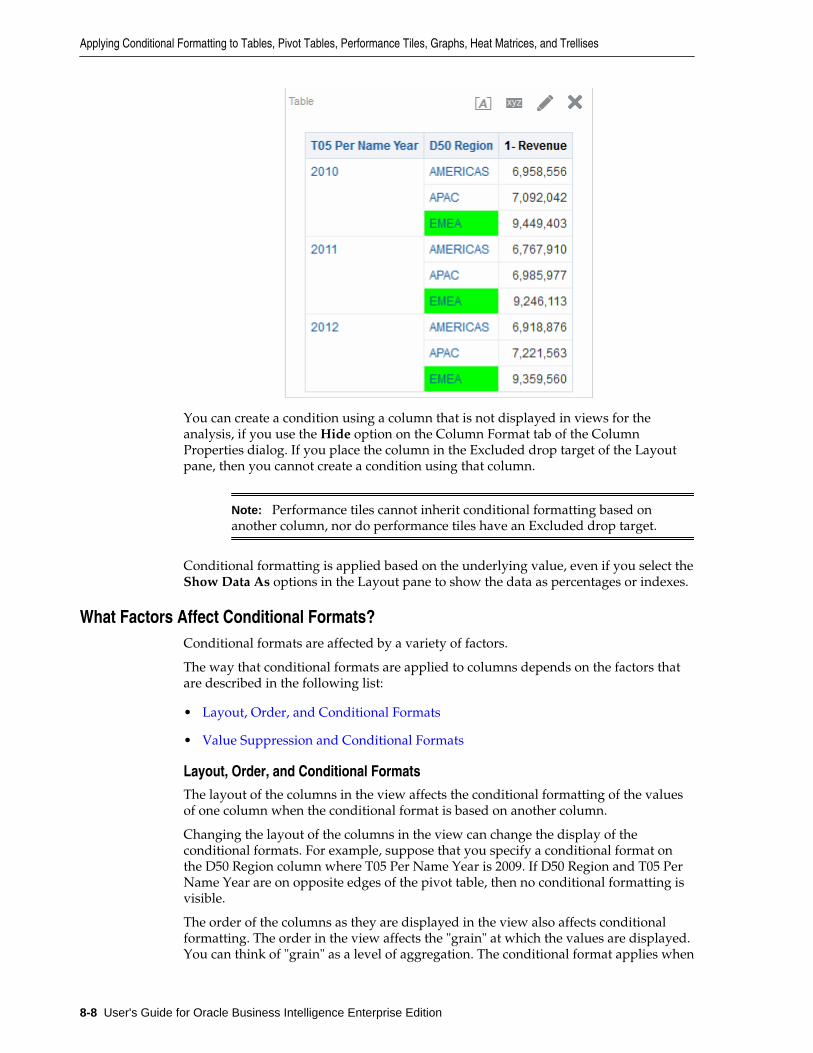
You can create a condition using a column that is not displayed in views for theanalysis, if you use the Hide option on the Column Format tab of the ColumnProperties dialog. If you place the column in the Excluded drop target of the Layoutpane, then you cannot create a condition using that column.
Note: Performance tiles cannot inherit conditional formatting based onanother column, nor do performance tiles have an Excluded drop target.
Conditional formatting is applied based on the underlying value, even if you select theShow Data As options in the Layout pane to show the data as percentages or indexes.
What Factors Affect Conditional Formats?Conditional formats are affected by a variety of factors.
The way that conditional formats are applied to columns depends on the factors thatare described in the following list:
• Layout, Order, and Conditional Formats
• Value Suppression and Conditional Formats
Layout, Order, and Conditional FormatsThe layout of the columns in the view affects the conditional formatting of the valuesof one column when the conditional format is based on another column.
Changing the layout of the columns in the view can change the display of theconditional formats. For example, suppose that you specify a conditional format onthe D50 Region column where T05 Per Name Year is 2009. If D50 Region and T05 PerName Year are on opposite edges of the pivot table, then no conditional formatting isvisible.
The order of the columns as they are displayed in the view also affects conditionalformatting. The order in the view affects the "grain" at which the values are displayed.You can think of "grain" as a level of aggregation. The conditional format applies when
Applying Conditional Formatting to Tables, Pivot Tables, Performance Tiles, Graphs, Heat Matrices, and Trellises
8-8 User's Guide for Oracle Business Intelligence Enterprise Edition
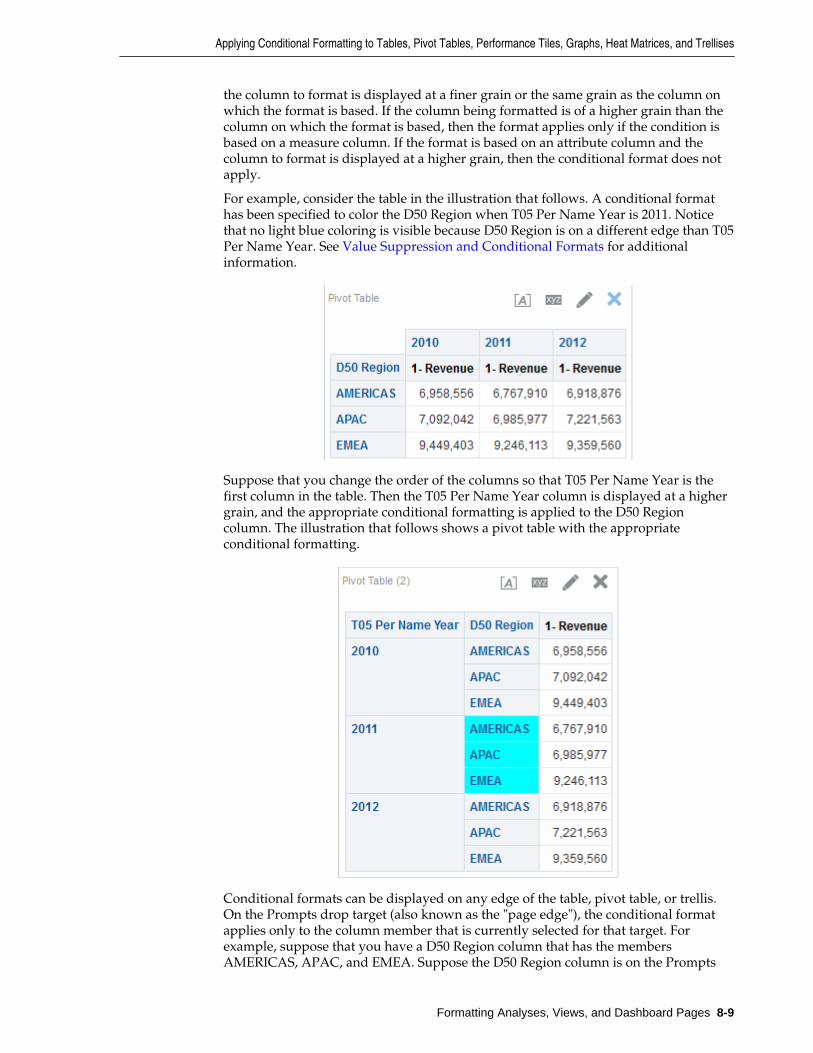
the column to format is displayed at a finer grain or the same grain as the column onwhich the format is based. If the column being formatted is of a higher grain than thecolumn on which the format is based, then the format applies only if the condition isbased on a measure column. If the format is based on an attribute column and thecolumn to format is displayed at a higher grain, then the conditional format does notapply.
For example, consider the table in the illustration that follows. A conditional formathas been specified to color the D50 Region when T05 Per Name Year is 2011. Noticethat no light blue coloring is visible because D50 Region is on a different edge than T05Per Name Year. See Value Suppression and Conditional Formats for additionalinformation.
Suppose that you change the order of the columns so that T05 Per Name Year is thefirst column in the table. Then the T05 Per Name Year column is displayed at a highergrain, and the appropriate conditional formatting is applied to the D50 Regioncolumn. The illustration that follows shows a pivot table with the appropriateconditional formatting.
Conditional formats can be displayed on any edge of the table, pivot table, or trellis.On the Prompts drop target (also known as the "page edge"), the conditional formatapplies only to the column member that is currently selected for that target. Forexample, suppose that you have a D50 Region column that has the membersAMERICAS, APAC, and EMEA. Suppose the D50 Region column is on the Prompts
Applying Conditional Formatting to Tables, Pivot Tables, Performance Tiles, Graphs, Heat Matrices, and Trellises
Formatting Analyses, Views, and Dashboard Pages 8-9
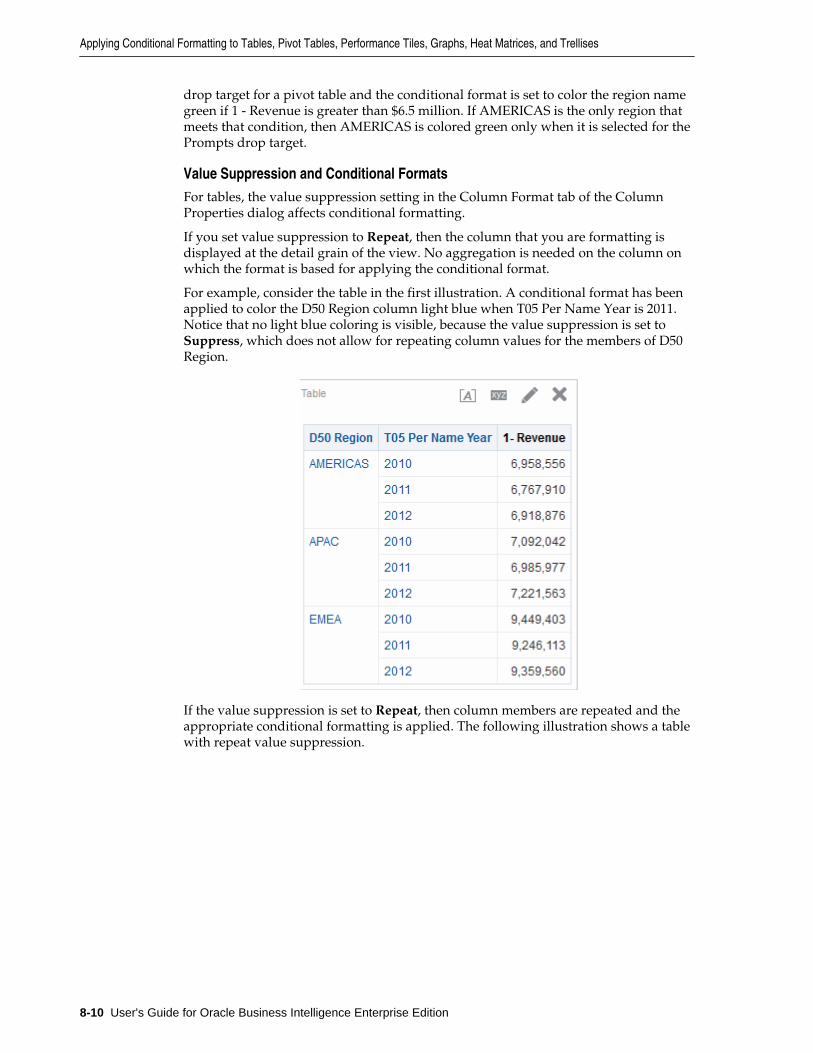
drop target for a pivot table and the conditional format is set to color the region namegreen if 1 - Revenue is greater than $6.5 million. If AMERICAS is the only region thatmeets that condition, then AMERICAS is colored green only when it is selected for thePrompts drop target.
Value Suppression and Conditional FormatsFor tables, the value suppression setting in the Column Format tab of the ColumnProperties dialog affects conditional formatting.
If you set value suppression to Repeat, then the column that you are formatting isdisplayed at the detail grain of the view. No aggregation is needed on the column onwhich the format is based for applying the conditional format.
For example, consider the table in the first illustration. A conditional format has beenapplied to color the D50 Region column light blue when T05 Per Name Year is 2011.Notice that no light blue coloring is visible, because the value suppression is set toSuppress, which does not allow for repeating column values for the members of D50Region.
If the value suppression is set to Repeat, then column members are repeated and theappropriate conditional formatting is applied. The following illustration shows a tablewith repeat value suppression.
Applying Conditional Formatting to Tables, Pivot Tables, Performance Tiles, Graphs, Heat Matrices, and Trellises
8-10 User's Guide for Oracle Business Intelligence Enterprise Edition
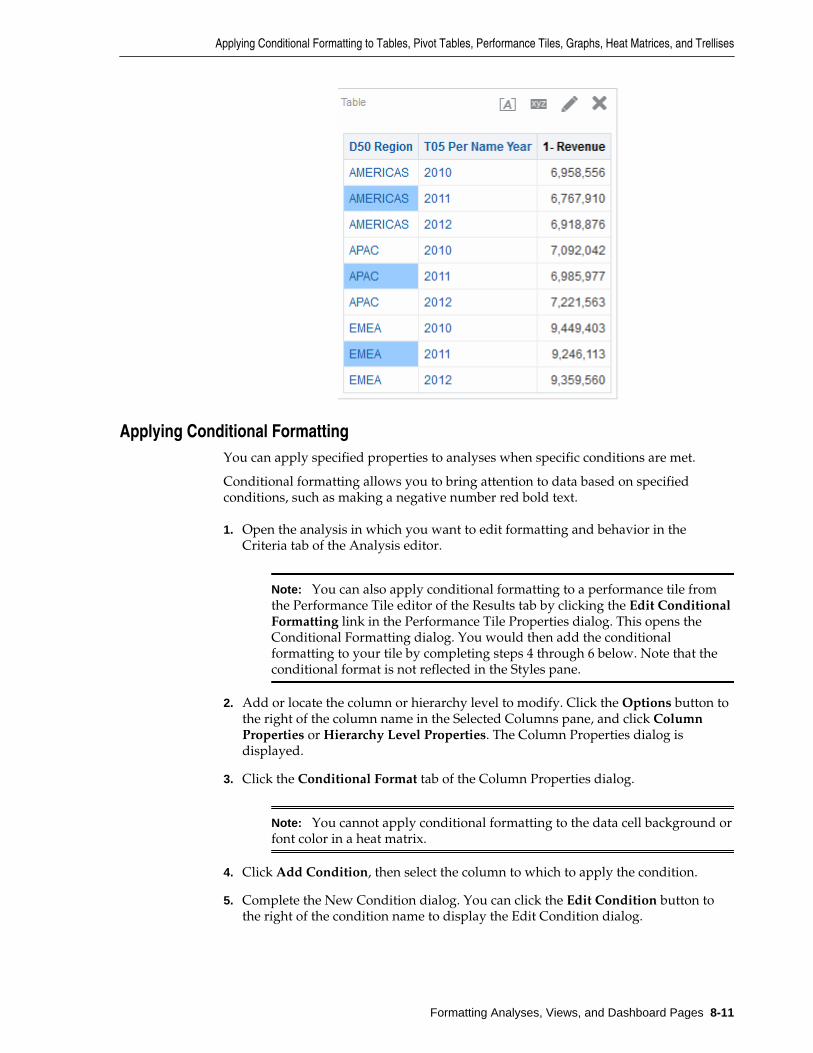
Applying Conditional FormattingYou can apply specified properties to analyses when specific conditions are met.
Conditional formatting allows you to bring attention to data based on specifiedconditions, such as making a negative number red bold text.
1. Open the analysis in which you want to edit formatting and behavior in theCriteria tab of the Analysis editor.
Note: You can also apply conditional formatting to a performance tile fromthe Performance Tile editor of the Results tab by clicking the Edit ConditionalFormatting link in the Performance Tile Properties dialog. This opens theConditional Formatting dialog. You would then add the conditionalformatting to your tile by completing steps 4 through 6 below. Note that theconditional format is not reflected in the Styles pane.
2. Add or locate the column or hierarchy level to modify. Click the Options button tothe right of the column name in the Selected Columns pane, and click ColumnProperties or Hierarchy Level Properties. The Column Properties dialog isdisplayed.
3. Click the Conditional Format tab of the Column Properties dialog.
Note: You cannot apply conditional formatting to the data cell background orfont color in a heat matrix.
4. Click Add Condition, then select the column to which to apply the condition.
5. Complete the New Condition dialog. You can click the Edit Condition button tothe right of the condition name to display the Edit Condition dialog.
Applying Conditional Formatting to Tables, Pivot Tables, Performance Tiles, Graphs, Heat Matrices, and Trellises
Formatting Analyses, Views, and Dashboard Pages 8-11

Custom Format Strings
8-24 User's Guide for Oracle Business Intelligence Enterprise Edition