used car market report
TRANSCRIPT

2012Used Car Market Report
$25017th Edition
1 2012 Used Car Market Report
1WISEGUY
2 A Note From Sandy Schwartz, Manheim President
3 Year in ReviewThe auto industry performed well in 2011, despite a weak economic backdrop. Further recovery in 2012 is expected, but risks abound.
8 The Remarketing IndustryAuction industry volumes fell in 2011 as the drop in commercial consignments more than offset the in-crease in dealer consignment. Technology advanced rapidly, enabling buyers and sellers to efficiently and effectively participate in live and digital auctions.
12 DealersUsed vehicle retail sales rose more than 5% to 38.8 mil-lion units in 2011. Dealers increasingly turned to online channels to both buy and sell in the wholesale market.
• Q&A with NADA
• Q&A with NIADA
19 RentalNew vehicle sales into rental declined marginally in 2011, but the average fleet size grew significantly. High used vehicle values lowered depreciation expense and boosted industry profits.
22 LeasingLease originations increased for a third consecutive year while lease maturities declined for a second year. A growing share of off-lease units were acquired by either the lessee or the grounding dealer.
25 RepossessionsRepossessions declined again in 2011 as loan portfolios performed very well. The shortage of fleet and lease units increased buyer interest in repossessions sold at auction.
28 Commercial and Government FleetsCommercial fleet units in service stabilized, but gov-ernment fleets continued to contract due to budget constraints. After experimenting with longer life cycles, many fleet managers returned to remarketing vehicles with closer to historic mileage norms.
31 SalvageMore dealers participated in salvage auctions as buyers and sellers of low-priced vehicles. Repairable units with nonsalvage titles were in high demand.
Remarketing Evolution ContinuesWhile change remained constant for auto dealers in 2011, dealers continued to adapt by embracing new strategies to be more efficient and profitable. These new strategies included the adoption of digital technology in record numbers. Digital and mobile advances have provided dealers with more ways to effectively manage their used vehicle operations than ever before. With change here to stay, dealers now have the tools needed for success right in the palm of their hands.
Webb: “Settle down there boy, we’ll get some tail winds, too.”
manheim.com
2012Used Car Market Report $250
17th Edition

2 2012 Used Car Market Report
2012Used CarMarket Report
Sandy SchwartzPresidentManheim
A Note From Sandy Schwartz,Manheim President
The wholesale automotive industry has probably never experienced a year like 2011. This 17th edition of Manheim’s Used Car Market Report analyzes the events that made the year so challenging and exciting, including the supply and demand for used vehicles, digital and mobile technol-ogy advances, changes in how customers want to conduct business, and how the business of remarketing continues to evolve.
Manheim and our customers adjusted to a cyclical drop in vehicle supply and the realization that working smarter and more effectively will be critically important going forward.
After reviewing our future direction and listening to our customers, we aligned our physical and digital assets with our personnel and services, and accelerated our invest-ment in technology.
Even with fewer vehicles entering the wholesale market-place over the past few years – a condition that will likely continue – we believe that physical auctions will play an important role within the wholesale industry for many years to come. But, even as we improve the live auction experience, we have embraced the changes made possible by technology to support our digital auction channels and online services.
Through all of the changes in remarketing during the past decade, the one constant has been the reliability of the auction process in live and digital channels in determining the market value of any vehicle on any day.
Today, our customers purchase approximately 25 percent of the vehicles remarketed through a Manheim digital chan-nel. But as we continue to roll out new mobile applications and online services, and dealers gain confidence in buying and selling vehicles online, we believe that number will rise quickly above 50 percent. At Manheim, our goal is not to dictate where buyers and sellers connect, but rather to ensure that they can quickly and confidently transact in any manner that is convenient for them, whether that is by smartphone, tablet, PC, or bidding in a lane.
In 2011, we conducted a series of successful pilot tests of our newest and most exciting service, Simulcast Everywhere. Simulcast was launched nearly 10 years ago and was an immediate success because it enabled online bidders to participate in live auctions on their personal computers. Simulcast Everywhere goes a step further by bringing the auctioneer and live auction to the seller’s location. Simulcast Everywhere enables sellers to remarket vehicles faster, and that allows dealers to search larger inventories and bid on more vehicles earlier in the remar-keting cycle. It is an innovation that enables all of us – dealers, commercial consignors, and Manheim – to work more effectively.
I look forward to seeing you in 2012, sharing our plans, and hearing your ideas about how we can help you succeed. The foundation of our success depends on providing you with the highest level of service.
Sincerely,
Sandy Schwartz President

3 2012 Used Car Market Report
2012Used CarMarket Report Year in Review and Outlook
Tom WebbChief EconomistManheim Consulting
Follow Tom Webb on his blog and on Twitter: Blog: http://manheimconsulting.typepad.com/Twitter: @TomWebb_Manheim
Amid a weak economic backdrop, auto manufacturers, rental car companies, lenders, and – most importantly – dealers increased revenues and earnings in 2011. This was achieved even as businesses, financial mar-kets, and consumers wrestled with the uncertainty created by the European sovereign debt issue and the inability of U.S. policymakers to provide an environ-ment conducive to long-term planning or investing. And, of course, it was the auto industry that naturally bore the brunt of the tremendous supply disruptions resulting from Japan’s earthquake and tsunami.
The auto industry’s revenue growth in 2011 was, in large part, a simple bounce-back from deep recession lows, but the improvement in profitability was the result of business restructurings, productivity gains, effective use of new technolo-gies, and – in the case of dealers – good old-fashioned customer service and selling. To achieve similar gains in 2012, the industry will need to be blessed with an economic recovery that has solidified to withstand inevitable outside pressures. How likely is that scenario? Let’s consider that question before looking at industry-specific trends and projections.
Uncertainty Swirled, but Consumers Spent
Heightened uncertainty makes it difficult for economic forecasters, but, more importantly, it restrains businesses and can stop a weak recovery in its tracks. And, in 2011, uncertainty reigned. As evidence, consider this:
• When we wrote this section for the 2011 Used Car Market Report, Congress and the president were in the throes of debate regarding a continuing budget resolution and whether or not all the Bush-era tax cuts should be extended.
• When we were writing the midyear update, the U.S. debt ceiling debate was in full force. That led to a downgrade in the U.S. credit rating and the formation of a congressional “super committee” that failed to reach a resolution.
• And, as we wrote this review, policymakers wrangled over the future of the payroll tax cut before offering up a two-month extension.
All of these were cases of kicking the can down the road. And some of the kicks were awfully puny!
But, despite the self-imposed headwinds, the recovery became more self-reinforcing and more balanced in 2011. The economy showed several fits and starts during the course of the year, but that was often due to outside shocks such as the supply disruptions resulting from Japan’s earthquake or the host of domestic weather events ranging from floods and fires to hurricanes and tornadoes.

4 2012 Used Car Market Report
Year in Review and Outlook
Through it all, consumer spending supplied a steady underlying support to the economy. After falling by a record 7% in 2009, total retail sales rose 6.4% in 2010 and another 7.7% in 2011. This occurred despite low consumer confidence and weak income growth. In fact, in 2011, the disconnect between consumer spending and consumer confidence took on historic proportions.
A popular explanation for that disconnect is that high-income households, which account for the bulk of retail sales, kept on spending and thus, further increased their share of total purchases in 2011. That’s a factor, but there were two other causes that were more impor-tant. First, the retail sales tally is indifferent as to whether the purchase is made with a pay-check, a welfare check, or food stamps. In the latter two cases (which accounted for a grow-ing share of purchases in 2011), the buyer is not exuding confidence. Second, there is more inflation contained in the total retail sales num-ber than many realize. Total inflation remained subdued in 2011, but several important neces-sities had rapidly rising prices. For example, the cost of food consumed at home rose by 6% in 2011 and gasoline prices were up 33%. When inflation causes higher spending on necessities, the increase in retail sales should not be regarded as a sign of con-sumer confidence.
To enable their spending, consumers had to draw down their savings rate. After averaging more than 5% in 2010, the savings rate fell to 3.5% by the end of 2011. Like higher spending levels, the decline in savings rate was likely more a reflection of need, rather than of increased consumer confidence. And, of course, the lower savings rate means that further gains in retail sales will require growing personal income or stronger household balance sheets.
Review
1fromReviewppt
complete
2fromReviewppt
complete
Annual Net Change in Nonfarm PayrollsIn Millions
Source: Conference Board and Dept. of Commerce
0
20
40
60
80
100
120
140
-15%
-10%
-5%
0%
5%
10%
15%
Jan95
Jan97
Jan11
Jan99
Jan01
Jan03
Jan05
Jan09
Jan07
3fromReviewppt
complete
Retail Sales versus Consumer Confidence Consumer Confidence Retail Sales Year-Over-Year Percent ChangeCONSUMERCONFIDENCE
RETAILSALES
Source: Bureau of Labor Statistics
U.S. Personal Savings Rate3-Month Moving Average
Source: U.S. Dept of Commerce
0%
1%
2%
3%
4%
5%
6%
7%
1101 02 03 04 05 06 07 08 09 10-6-5-4-3-2-10123
Jan00
Jan01
Jan02
Jan03
Jan05
Jan04
Jan07
Jan08
Jan10
Jan11
Jan09
Jan06
4fromReviewppt
complete
5fromReviewppt
complete
6fromReviewppt
complete
Total U.S. Nonfarm PayrollsIn Millions
Source: Bureau of Labor Statistics
125.0
127.5
130.0
132.5
135.0
137.5
140.0
Dec99
Dec01
Dec11
Dec03
Dec09
Dec07
Dec05
Initial Jobless Claims Four-Week Moving AverageIn Thousands
Source: Bureau of Labor Statistics
200
300
400
500
600
700
Dec99
Dec02
Dec01
Dec11
Dec03
Dec04
Dec05
Dec07
Dec08
Dec10
Dec00
Dec09
Dec06
Household Net Worth In Trillions
Source: Federal Reserve Board
1Q71
1Q76
1Q86
1Q81
1Q11
1Q91
1Q96
1Q06
1Q01
$0$10$20$30$40$50$60$70$80

5 2012 Used Car Market Report
Year in Review and Outlook
Employment
The income statement of consumers is dictated overwhelmingly by labor market conditions. Employment grew by an average of 137,000 per month in 2011, a significant improvement from 2010’s average of 78,000 per month and, of course, much better than the large losses recorded in 2008 and 2009. If employment gains in 2012 exceed 173,000 per month (not a totally unreasonable forecast), it would be the fastest annual growth rate since 2006. Such growth would, however, make only a small dent in the 6.1 million employment deficit that we currently suffer relative to the previous peak. And, as can be seen in the accompanying chart, total employment in December 2011 was virtually same as it was in May 2001, a time when the U.S. population was smaller by 32 million people.
Nevertheless, as we have said in the past, analysts should focus on the doughnut (employment), not the hole (unemployment). Payrolls are grow-ing, and they will continue to grow. Initial jobless claims have also fallen significantly. That should raise the job security and confidence of those already employed.
Home Values Continue to Fall, but at a Slower Rate
The typical family’s net worth resides predominantly in their home. Thus, the collapse in the housing market pushed household net worth down by an astonishing $11.6 trillion between the second quarter of 2007 and sec-ond quarter of 2010. Net worth has since grown, but primarily because of the writing-off of debt through foreclosures and bankruptcies. And total household net worth is still $9.4 trillion below its previous peak.
As 2011 ended, the Case-Shiller Price Index showed home values continu-ing to hit new post-bubble lows. The year-over-year decline was 3.4%, which pushed prices 32% below their 2006 peak. We are optimistic that home prices will find a bottom in 2012. Lower home values, record low mortgage rates, and a healthy rental market have already enticed inves-tors back into the market. An improvement in owner-occupied purchases will come as underwriting standards become more consistent and as the shadow inventory created by existing and pending foreclosures winds down.
Nevertheless, it is clear that the collapse in housing will have a multi-gen-erational impact. Each year an increasing share of potential home buyers will consist of individuals who never experienced the free ride of rapidly rising home values, but instead know only the downside of short sales, foreclo-sures, and underwater mortgages. Thus, another housing bubble will not appear for many decades, if ever. And, in addition to feeding on itself, the housing bubble provided a tremendous amount of liquidity that, through home equity loans and cash-out refinancings, found its way into the new and used vehicle sales market.
4fromReviewppt
complete
5fromReviewppt
complete
6fromReviewppt
complete
Total U.S. Nonfarm PayrollsIn Millions
Source: Bureau of Labor Statistics
125.0
127.5
130.0
132.5
135.0
137.5
140.0
Dec99
Dec01
Dec11
Dec03
Dec09
Dec07
Dec05
Initial Jobless Claims Four-Week Moving AverageIn Thousands
Source: Bureau of Labor Statistics
200
300
400
500
600
700
Dec99
Dec02
Dec01
Dec11
Dec03
Dec04
Dec05
Dec07
Dec08
Dec10
Dec00
Dec09
Dec06
Household Net Worth In Trillions
Source: Federal Reserve Board
1Q71
1Q76
1Q86
1Q81
1Q11
1Q91
1Q96
1Q06
1Q01
$0$10$20$30$40$50$60$70$80
New Car and Light-Duty Truck SalesSeasonally Adjusted Annual Rate – 3-Month Moving Average Millions of Units
Case-Shiller Composite Home Price Index�Seasonally Adjusted 7
fromReviewppt
complete
8fromReviewppt
Source: Case-Shiller
50
100
150
200
250
Jan87
Jan11
Jan91
Jan99
Jan03
Jan07
Jan95
Source: Automotive News
5
10
15
20
Jan87
Jan89
Jan11
Jan91
Jan93
Jan97
Jan99
Jan03
Jan05
Jan01
Jan09
Jan07
Jan95
Ratio of Used Vehicles Retailed�to New Vehicles Retailed
9fromReviewppt
Source: Automotive News and CNW Marketing Research
2.00
2.25
2.50
2.75
3.00
3.25
3.50
87 1191 99 03 079579 83
Review
1fromReviewppt
complete
2fromReviewppt
complete
Annual Net Change in Nonfarm PayrollsIn Millions
Source: Conference Board and Dept. of Commerce
0
20
40
60
80
100
120
140
-15%
-10%
-5%
0%
5%
10%
15%
Jan95
Jan97
Jan11
Jan99
Jan01
Jan03
Jan05
Jan09
Jan07
3fromReviewppt
complete
Retail Sales versus Consumer Confidence Consumer Confidence Retail Sales Year-Over-Year Percent ChangeCONSUMERCONFIDENCE
RETAILSALES
Source: Bureau of Labor Statistics
U.S. Personal Savings Rate3-Month Moving Average
Source: U.S. Dept of Commerce
0%
1%
2%
3%
4%
5%
6%
7%
1101 02 03 04 05 06 07 08 09 10-6-5-4-3-2-10123
Jan00
Jan01
Jan02
Jan03
Jan05
Jan04
Jan07
Jan08
Jan10
Jan11
Jan09
Jan06

6 2012 Used Car Market Report
Year in Review and Outlook
New and Used Vehicle Sales
New car and light-duty truck sales totaled 12.8 million in 2011, an increase of 10% from 2010. This fell short of our forecast of 13.1 million for the year, but that was due to lost sales resulting from inventory shortages in the aftermath of the Japan earthquake. In the first four months of 2011, new vehicles sold at a 13.1 million annualized rate. In the final four months, the pace was 13.3 million. It was the 11.9 million sales pace in the middle four months of the year that dampened the annual total.
Importantly, the increase in new vehicle sales in 2011 was not driven by sales into fleet (retail deliveries rose 12%, while fleet sales were up only 3%) or by heavy incentives (in fact, industry-wide incentive spending was down for the year and net new vehicle transaction prices were up substantially for the second consecutive year).
New vehicle sales should continue to improve in 2012 (we’re looking for 13.6 million), but long-term expectations should be kept in check. Slower household formation rates, reduced miles of travel, lower scrappage rates, and demographic shifts all suggest that the underlying rate of demand for new vehicles is in the 15 million to 15.5 million range, not the 17 million annual sales rate that was achieved during the seven-year period between 1999 and 2005.
Used vehicle retail sales were 38.8 million in 2011, the strongest level in four years. The percentage gain in used vehicle sales in 2011 (+5%) was only half that of new vehicles, but used vehicle sales did not fall as steeply during the recession. And, in fact, the ratio of used vehicles retailed to new vehicles sold remained high at more than 3-to-1 for the third consecutive year.
New Car and Light-Duty Truck SalesSeasonally Adjusted Annual Rate – 3-Month Moving Average Millions of Units
Case-Shiller Composite Home Price Index�Seasonally Adjusted 7
fromReviewppt
complete
8fromReviewppt
Source: Case-Shiller
50
100
150
200
250
Jan87
Jan11
Jan91
Jan99
Jan03
Jan07
Jan95
Source: Automotive News
5
10
15
20
Jan87
Jan89
Jan11
Jan91
Jan93
Jan97
Jan99
Jan03
Jan05
Jan01
Jan09
Jan07
Jan95
Ratio of Used Vehicles Retailed�to New Vehicles Retailed
9fromReviewppt
Source: Automotive News and CNW Marketing Research
2.00
2.25
2.50
2.75
3.00
3.25
3.50
87 1191 99 03 079579 83
4fromReviewppt
complete
5fromReviewppt
complete
6fromReviewppt
complete
Total U.S. Nonfarm PayrollsIn Millions
Source: Bureau of Labor Statistics
125.0
127.5
130.0
132.5
135.0
137.5
140.0
Dec99
Dec01
Dec11
Dec03
Dec09
Dec07
Dec05
Initial Jobless Claims Four-Week Moving AverageIn Thousands
Source: Bureau of Labor Statistics
200
300
400
500
600
700
Dec99
Dec02
Dec01
Dec11
Dec03
Dec04
Dec05
Dec07
Dec08
Dec10
Dec00
Dec09
Dec06
Household Net Worth In Trillions
Source: Federal Reserve Board
1Q71
1Q76
1Q86
1Q81
1Q11
1Q91
1Q96
1Q06
1Q01
$0$10$20$30$40$50$60$70$80

7 2012 Used Car Market Report
Year in Review and Outlook
Manufacturer certified pre-owned (CPO) sales totaled more than 1.7 million in 2011, a record high. Fifteen brands, 10 of which were Asian, had best-ever CPO sales. Many of these brands have long-established CPO programs that emphasize dealer train-ing and often offer low-rate financing for certified vehicles.
Likewise, used vehicles retailed by the seven publicly-traded dealership groups also reached a new high in 2011, at just under 1 million units. On a same-store basis, these dealership groups have had nine consecutive quarters of increasing retail used unit volumes. There has been some erosion in margins on these sales, but faster turns, slower depreciation, and low interest rates have reduced holding costs and led to record profits.
The Year Ahead: Continued Recovery, but with Tempered Expectations
Despite the previously mentioned uncertainty and the shocks that will surely arise (from both here and abroad), we can more confidently pre-dict this year, than we could last year, that the U.S. economy will grow and that new and used vehicle sales will rise. That’s because even an anemic recovery (like we had in 2011) gener-ates momentum. And, although the recovery will now enter its third year, there is tremen-dous slack in the economy and unprecedented pent-up demand. Continued job growth will unleash that demand. Additionally, commercial businesses and financial institutions are generating strong cash flows and building reserves. That will enable them to with-stand temporary shocks. So, unlike 2008, they won’t be contributing to turmoil and volatility in the market, they will be calming it.
So, why do we temper our outlook and what are the risks that the economy will reverse course? The biggest dampening effect will continue to be consumer deleveraging. The downturn in home values has left a hole in household balance sheets that will take years to repair. And, although the housing industry will likely find a bottom in 2012, there is no way that it will make the same contribution to overall growth that it once did. Likewise, austerity and job cuts at the state and local levels (a loss of 625,000 jobs over the past three years) are winding down, but that will not suddenly change into new spending and hiring. Meanwhile, the amount of federal fiscal stimulus will be less in 2012 and monetary policy has little room left to be more accommodating.
As to the risk of the economy slipping into another recession, we noted last year that the European sovereign debt issue was the number one threat. That picture has not gotten any prettier, and a plan to deal with it has yet to be formulated, much less implemented. For Europe, the problem has gotten worse and dire consequences are inevitable, but the risk of contagion aborting the U.S. recovery has diminished. U.S. banks and other financial institutions are much better prepared than they were a year ago to withstand the possible fallout.
This year, our chief threat is once again ourselves. Although our debt and deficit issues need not – and cannot – be solved in the short term, there is a limited window of opportunity to rationally address the issue. Failure to do so will simply make the necessary hard choices harder and the easy alternatives all the more harmful in the long run.
Percent Change Used Units Retailed – Same Store BasisPublicly-Traded Dealership GroupsWeighted Average for KMX*, AN, PAG, SAH, GPI, ABG and LAD
11fromReviewppt
2004
*KMX shifted forward one month to correspond with calendar quarter Source: Company filings
-25%-20%-15%-10%
-5%0%5%
10%15%20%
2005 2006 2007 2008 2009 2010 2011
10fromReviewppt
fromemail:
The 2011 CPO sales is 1.67 million. Please drop off the oldest year when you add 2011.
1.73 per ppt
complete Source: Automotive News
11E01 02 03 04 05 06 07 08 09 10
Certified Pre-Owned (CPO) Sales In Millions
0.0
0.5
1.0
1.5
2.0

8 2012 Used Car Market Report
2012Used CarMarket Report The Remarketing Industry
The shortage and aging of vehicles in the wholesale market dominated the headlines in 2011 and influenced the actions of buyers and sellers. Fortunately, the adaptation of digital technology to every aspect of selling and buying vehicles enabled industry participants to manage their businesses in real time under challenging circumstances.
Supply Shortages Shrink Sales at NAAA Member Auctions
A significant reduction in commercial consignment volumes more than offset the increase in dealer consignment in 2011. Preliminary numbers suggest that the number of vehicles remarketed through the member auctions of the National Auto Auction Association (NAAA) declined by about 8% in 2011 to less than 7.8 million units. This marked the fourth consecutive year of lower volume.
With residuals strong and volumes declining, grounding dealers bought a growing share of off-lease vehicles. Likewise, strong demand for late-model vehicles enabled the rental industry to sell more vehicles directly to local dealers, and allowed commercial fleets to sell more units directly to company employees.
Auctions remarketed fewer late-model used vehicles as the changing mix of sellers shifted auction volume toward older units. Dealer consignment sales increased by more than 10%, while rental, off-lease and other commercial seller volumes fell more than 20% in 2011. Dealer consignment accounted for 55% of total NAAA volume, compared to 45% in 2010 and less than 40% in 2009.
While timing and channel selection decisions impact the age mix of wholesale supply, so too do past new vehicle sales. Between 2004 and 2007, 66.6 million new vehicles were sold, so vehicles of these model years are disproportionately represented in the vehicle population compared to the low supply of 2008 through 2011 model year vehicles.
The Manheim Used Vehicle Value Index Posts an Annual Gain of 3.7%
The Manheim Used Vehicle Value Index topped out in May at 127.8 and remained at historically high levels adjusted for mileage and seasonality through year-end. For the year, the Index averaged 124.9, up from 120.5 in 2010, for a gain of 3.7%. Even older high-mileage vehicles often commanded prices that were thousands of dollars higher than a year earlier. As a result, deal-ers specializing in under-$5,000 units often turned to salvage and government auctions to find inventory.
Small and midsized cars had substantially higher prices in 2011 than in 2010. All other market segments showed flat pricing or, in some cases, declines. The spike in wholesale values for fuel-efficient vehicles corresponded with the run-up in gas prices, but it was driven more by the supply disruption in new vehicle inventory (due to the Japan earthquake) than by pump prices.
3
Quarterly Call
Manheim Used Vehicle Value IndexJanuary 1995 = 100
Source: Manheim Consulting
059695 97 99 0098 01 02 03 0604 07 08 09 10 1195
100
105
110
115
125
120
complete
from Quarterly Call pdfpg 3
5complete
from Quarterly Call pdf pg 5
7complete
from Quarterly Call pdf pg 7
Used Vehicle Price Trends – Selective Market ClassesJanuary 1997 = 100 Compact Cars Midsize Cars Luxury Cars Pickups SUV/CUV
70
80
90
110
100
120
130
140
Jan07
Jul07
Jan08
Jul08
Jan09
Jul09
Jan10
Jul10
Jan11
Jul11
Source: Manheim Consulting
Source: National Auto Auction Association and CNW Market Research
99 00 01 02 03 04 05 06 07 08 09 10 11-12.5%
-10.0%
-5.0%
0%
5.0%
7.5%
-7.5%
2.5%
-2.5%
Percent Change in Auction Volume,Used Retail Sales and Manheim Index Auction Volume Used Retail Sales Manheim Index

9 2012 Used Car Market Report
Manufacturer Incentives Impact Wholesale Values of Luxury Cars and Pickup Trucks
Prices of luxury vehicles and pickup trucks underperformed the overall market in the sec-ond half of the year due to higher manufacturer incentives on comparable new vehicles. Year-end sales campaigns among luxury brands, especially German makes, were more gener-ous than those of recent years. Pickup truck inventory was relatively high throughout the year, so manufacturers stimulated demand with cash rebates and financing incentives.
Auction Volumes to Hold Steady in 2012
With new vehicle sales rising again in 2012, dealer consignment volumes should grow for the fourth consecutive year. The number of commercial fleet units and repossessions sold at auction should remain steady. There will, however, be another significant reduction in off-lease volumes in 2012. The net result will be relatively stable total auction volumes for the year, but with big shifts in the makes, ages, mileage, and price points of vehicles being sold.
Technology Transforms the Wholesale Marketplace
A decade ago, the Internet gave rise to digital upstream auction channels where the strong relationships between related buyers and sellers overcame the inherent risk in buying vehicles without personally inspecting them. Auto companies and their franchised dealers, as well as corpora-tions and their employees, were ideally paired to transact online since buyers knew the product and they counted on the seller to stand behind the vehicle. In this unique slice of the wholesale marketplace, vehicles could be remarketed using stock photographs and simple condition reports (CRs).
Although the technology also made it possible for unrelated buyers and sellers to transact with each other, few did so because they lacked the information needed to make informed judgments. And, with ample choice in live auction channels, buyers did not see the advantage of bidding online.
The promise of a 24/7 open auction environment that met all of the conditions needed by sellers and buyers began to take shape over the past decade as technology advanced and auction companies established processes to make the digital mar-ketplace more effective. For example, Manheim white papers and case studies demonstrated to sellers the need to price vehicles close to market values in order to generate active bidding. The accuracy and consistency of electronic CRs were improved to overcome any buyer hesitation. Arbitration policies were modified to reflect the transportation time and cost involved in remote buying and selling. And, dealer training programs, such as Manheim’s Wholesale Institute, were launched to teach dealers the best uses of the technology and how to develop effective strategies for online selling and buying.
The Remarketing Industry
3
Quarterly Call
Manheim Used Vehicle Value IndexJanuary 1995 = 100
Source: Manheim Consulting
059695 97 99 0098 01 02 03 0604 07 08 09 10 1195
100
105
110
115
125
120
complete
from Quarterly Call pdfpg 3
5complete
from Quarterly Call pdf pg 5
7complete
from Quarterly Call pdf pg 7
Used Vehicle Price Trends – Selective Market ClassesJanuary 1997 = 100 Compact Cars Midsize Cars Luxury Cars Pickups SUV/CUV
70
80
90
110
100
120
130
140
Jan07
Jul07
Jan08
Jul08
Jan09
Jul09
Jan10
Jul10
Jan11
Jul11
Source: Manheim Consulting
Source: National Auto Auction Association and CNW Market Research
99 00 01 02 03 04 05 06 07 08 09 10 11-12.5%
-10.0%
-5.0%
0%
5.0%
7.5%
-7.5%
2.5%
-2.5%
Percent Change in Auction Volume,Used Retail Sales and Manheim Index Auction Volume Used Retail Sales Manheim Index
10 2012 Used Car Market Report
The Remarketing Industry
In 2011, online bidders accounted for 25% of all Manheim sales. Additionally, the majority of dealers and commercial sellers connect through Manheim.com daily to manage their accounts, search inventory, post vehicles for sale, and arrange for other services that promote suc-cessful outcomes in digital channels. A true 24/7 marketplace, which freed dealers and commercial sellers from their desktop computers, was then enabled by the advent of smartphones.
Other milestones and achievements that brought us to a fully digital marketplace include:
• High-speed broadband service, which enabled dealers to bid in Simulcast auctions. With Simulcast, dealers had the familiarity of the live auction, heard the call of the auctioneer, and could inspect vehicles prior to sale. Dealers then saved time by bidding through their computers.
• OVE.com was launched as a 24/7 digital channel in 2006. Over time, the functionality embedded in OVE.com expanded. Today buyers on OVE.com can place proxy bids, purchase vehicles at Buy It Now prices, and interact directly with sellers. Sellers can accept “if” bids, contact bidders, monitor bidding activity, change reserve prices, and manage their inventory between live and digital channels.
• Data captured in online channels was increasingly used to help buyers and sellers improve their remarketing performance.
• Manheim.com became the single portal through which customers accessed all their remarketing needs – such as live and digital auctions, account management, inventory searches, bid placement, and interac-tions with one another.
• The smartphone and iPad provided the technological leap that made 24/7 digital wholesale markets possible. Dealers were no longer dependent on a personal computer. As more mobile applications were launched, buyers and sellers accessed Manheim and all of its services to fulfill the promise of the Anytime+Anywhere marketplace.
• As dealers shifted from desktops to mobile devices, Manheim Mobile piloted Simulcast Everywhere in 2011. This new service enabled real-time bidding in live auctions that could be conducted anywhere the vehicles were located – dealer-ships, car rental lots, or marshaling yards.
Today, virtually all franchised dealers and most independent dealers have bid on vehicles via Simulcast or OVE.com. Manheim Consulting research shows that once dealers have had a successful experience buying a vehicle online, they then fill an increasing percentage of their inventory needs through digital channels.
Manheim Digital Statistics for 2011
• In 2011, an average of 118,000 customers logged in each month to Manheim websites and apps, representing an 11% increase over 2010.
• The total number of OVE.com consignors was up 25% from 2010 due to an increase in dealer sellers. The number of vehicles offered by dealer sellers was up 22% over 2010.
• Manheim received more than 4 million visits to its Mobile website, iPhone app, and Android app in 2011. The iPhone and iPad accounted for 64% of mobile visits, and Android devices accounted for 32% of mobile visits.
• A quarter of all Manheim sales came from Simulcast or OVE.com in 2011, compared to 21% in 2010.

11 2012 Used Car Market Report
The Remarketing Industry
Functionality and Use of Manheim Mobile Grows
The revolution in mobile device functionality has transformed when, and where, buyers and sellers conduct business. Mobile devices are quickly displacing desktop computers as the dominant means of interaction in the wholesale market. Manheim Mobile, which was launched in the first quarter of 2010, recorded nearly 300% more visits in 2011 than the previ-ous year. Today, mobile applications enable buyers and sellers to do anything through a mobile device that they can do in person or over a desktop computer. Services range from researching price and vehicle information to account management and placing bids. Dealers are no longer limited to business hours to manage their inventory and bid on vehicles. And sellers can continuously monitor bidding activity, which enables them to make price adjustments or respond to bidder questions in real time.
Successful Selling in Digital Channels Requires Giving Buyers More and Better Information
Commercial sellers have learned that to effectively sell to an unrelated party, they need to provide enough information to generate bids at the fair value for the vehicle. That’s why most commercial consignors provide multiple photographs and full CRs. Dealers, as more recent sellers on OVE.com, provide condition information on just over one-third of their listings, and in some cases, it is a seller’s disclosure rather than a third-party inspection and report.
Studies by Manheim Consulting have repeatedly demonstrated that listings with electronic CRs and photographs attract more bidders and generate higher retention than those without.
Effective Online Selling Also Requires Reasonable Reserve Prices
Bidders will bypass listings when reserve prices are far from market value. In 2011, more than 55% of all listings were “market priced;” but only 35% of dealer listings were in that sweet spot. As dealers refine their digital remarketing strategies, the percentage of OVE.com dealer listings with comprehensive CRs, and appropriate Buy Now prices will continue to increase, just as it has throughout the last two years. Buy Now transactions account for about 63% on OVE.com, and that percentage is increasing as more dealers carry limited inventory and need specific vehicles for customer orders or stock.
Simulcast Everywhere Optimizes the Experience for Buyers and Sellers
Simulcast has been around for nearly a decade and is now an essential tool for most used car managers. Simulcast allows dealers to remotely buy vehicles and to get a sense of the overall market as each vehicle arrives at the block. Simulcast ensures that the number of bidders is not limited to those standing in the lane that day. From the dealers’ perspective, Simulcast expanded the inventory they could bid on and allowed them to manage their time more effectively.
The next step for Simulcast was to make it portable for the seller and the buyer. There is no inherent requirement that Simulcast sales be limited to auction lanes and accessed only through desktop computers. In fact, Manheim specialty equipment and heavy truck auctions have been successfully Simulcasted from marinas, RV lots, and other locations for several years.
In 2011, Manheim pilot-tested Simulcast Everywhere, a new service that brings the auction to the seller’s location and enables buyers to bid in real time through a mobile device. Vehicles are staged sequentially with a live auctioneer conduct-ing each sale. Dealers are able to search pre-sale lists and view seller disclosures before the auction.
With Simulcast Everywhere, sellers will not have to move vehicles to an auction, but will still be able to generate the excitement of a live sale. Buyers will be able to search and buy vehicles in all channels through computers and mobile devices.

12 2012 Used Car Market Report
2012Used CarMarket Report
Used vehicle sales by franchised and independent dealers rose in 2011 as the economy continued its slow recovery and as the availability of retail financing increased, especially for subprime shoppers. Wholesale supplies remained tight, however, so finding enough of the right vehicles was tough and acquisition costs were significantly higher.
The shortage of used vehicles in the wholesale market was driven by lower off-lease and repossession volumes. Dealer consignment volumes rose significantly in 2011. Nevertheless, even the older, less expensive vehicles that typically come from dealer consignment were in short supply relative to demand. With demand for used vehicles high across the board, wholesale prices continued to rise in 2011, reaching a peak in May and then remaining at historically high levels at year-end.
New and Used Vehicle Sales Rise in 2011
New vehicle sales rose 10% in 2011 to 12.8 million units. Although sales were the highest since 2008, the total was still three million units below what analysts regard as “normal.” Between 2008 and 2011, only 48 million new vehicles were sold, compared to 67 million in the prior four years. This low level of new vehicle sales will create a deficit in the supply of vehicles from these model years for years to come.
Used vehicle sales in 2011 totaled 38.8 million, up 5.2% from 2010, approximately half the rate of increase for new vehicles. New and used vehicle demand responds to the same economic factors; however, used vehicle sales are much less volatile.
Dealers Increase Their Share of the Used Vehicle Market
In 2011, used vehicle sales by franchised dealers increased 8% to slightly more than 13.8 million units and sales by independent dealers increased by 5.6% to just under 13.8 million. Private party sales (11.2 million) rose only 1% from 2010. With vehicle owners finding dealers willing to pay top dollar for their car or truck and also finding credit readily avail-able through them, dealers gained share in the used vehicle market at the expense of private party transactions.
Certified Pre-Owned (CPO) Vehicle Sales Rise 6.4% in 2011
Franchised dealers sold more than 1.7 million CPO vehicles in 2011, up 6.4% from 2010 despite the tight supply of late-model vehicles. CPO programs enable customers to purchase a used vehicle with superior warranty protec-tion and often with better financing terms.
Dealers
Dealers
1
2
3
needs data
61 817166 76 86 91 0196 1106
Source: Automotive News
468
101214161820
New Car and Light-Duty Truck SalesMillions of Units
Dealers Post Largest Used Unit Sales Gain Since 1993Annual Percent Change in Used Unit Sales by Dealers
Source: CNW Marketing Research
-10%-8%-6%-4%-2%0%2%4%6%8%
10%
0590 9291 9695 97 99 0098 01 02 03 060493 94 07 08 1009
2011 is a Manheim Consulting estimate based onboth internal and industry sources.
Source: National Auto Auction Association Surveys, 2001-2010
01 1002 03 04 05 06 07 08 09 11E0%
10%
20%
30%
40%
50%
60%
Dealer-Consignment Sales as Percentage of Total Auction Volume
needs data
39.4040.0140.5046.3051.6050.9050.0042.0039.3045.4055.50
from Quarterly Call pdf pg 15
15
Used Vehicle Sales Inherently More Stable Than New Vehicle Sales New Vehicle Sales Used Vehicle Sales
Source: Automotive News & CNW Marketing Research
-25%-20%-15%-10%
-5%0%5%
10%15%20%
77 79 81 83 0585 87 89 91 95 97 99 01 0393 07 09 11

13 2012 Used Car Market Report
In 2011, vehicle manufacturers increased their support of pre-owned vehicles with greater marketing and with more low-rate, low-down payment, loans.
CPO certification favors late model off-lease, executive and program vehicles remarketed in closed upstream channels. In addition, in 2011, grounding dealers bought a high percentage of the off-lease units returned to their stores. For some brands, more than 50% of the end-of-term units were bought by the grounding dealer and more than 80% were bought within upstream channels by franchised dealers. This left a very limited supply for remarketing through open auctions where independent dealers are active buyers.
Wholesaling Percentages Decline at Franchised Dealerships
In 2011, franchised dealers held onto a higher percentage of their trade-ins, including off-brand units, if they were consis-tent with the dealer’s target customer. Internet marketing sites such as AutoTrader.com have enabled franchised dealers to better merchandise their own and off-brand used vehicles online since visitors search by make and model rather than a specific dealership.
While most franchised dealers still wholesale trade-ins that are not consistent with their image and clientele, many of these dealers have also begun to sell older, less-expensive, units on their existing lots or at separate locations. In addition, many dealers have recently leaned towards retailing an aged used vehicle at a wholesale-like price, rather than actually wholesaling it. This offers the opportunity to generate F&I income, allows salespeople at least some commission, creates potential service revenue, and possibly garners a lifetime customer. Of course, it also runs the risk of lowering gross mar-gins throughout the department.
Dealers Devote More Effort to Finding the Right Inventory
The most common complaint from both franchised and independent dealers was the increased effort they had to put into inventory acquisition. Dealers scanned pre-sale lists, mined online listings, and attended or participated in multiple live and digital auctions each week. While auctions rolled out more tools and services to make it easier for dealers to search, evaluate, and bid on vehicles Anytime+Anywhere, there is no denying that reduced wholesale supplies challenged dealers.
Franchised dealers used a variety of marketing strategies to simultaneously prompt the sale of a new vehicle and provide the dealer with a sellable used unit. Existing customers received direct mail solicitations offering to buy their vehicle at cur-rent high market prices. Similarly, dealership service personnel encouraged customers in for repair to have their vehicle appraised. The value often exceeded the owner’s expectation and led to a new vehicle sale.
Independent Dealers Increasingly Adopt Online Channels
Independent dealers had to adapt both their sourcing strategies and sometimes their business model to an environment of high prices and tight supply. This meant tapping more local and regional sources and venturing farther away to buy vehicles. Besides traditional whole car auctions, salvage and repo auctions attracted dealers looking for lower-priced units.
In 2011, dealers attended more physical auctions and searched for, bid on, and bought more vehicles in digital auctions. The need to shop efficiently and to see more inventory, as well as the convenience of logging on through a mobile device, increased the independent dealer’s use of digital channels in 2011. Dealers simply don’t want to be away from their stores more than one day a week, so digital channels and services have become essential to the conduct of their business.
Dealers
Used Vehicle
2
3
Source: Automotive News
1101 02 03 04 05 06 07 08 09 10
Certified Pre-Owned (CPO) Sales In Millions
0.0
0.5
1.0
1.5
2.0
Manheim Used Vehicle Value IndexJanuary 1995 =100
Source: Manheim Consulting
059695 97 99 0098 01 02 03 0604 07 08 09 10 11 1295
100
105
110
115
125
120
complete
from Quarterly Call pdfpg 3
14 2012 Used Car Market Report
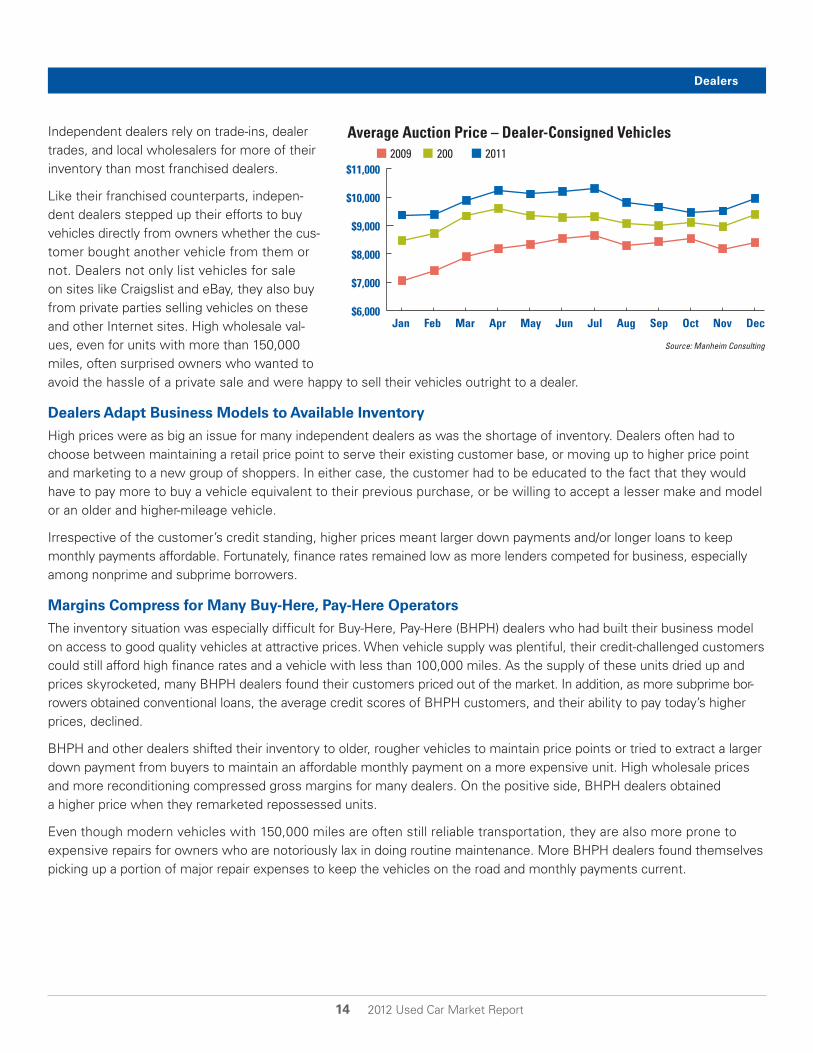
Independent dealers rely on trade-ins, dealer trades, and local wholesalers for more of their inventory than most franchised dealers.
Like their franchised counterparts, indepen-dent dealers stepped up their efforts to buy vehicles directly from owners whether the cus-tomer bought another vehicle from them or not. Dealers not only list vehicles for sale on sites like Craigslist and eBay, they also buy from private parties selling vehicles on these and other Internet sites. High wholesale val-ues, even for units with more than 150,000 miles, often surprised owners who wanted to avoid the hassle of a private sale and were happy to sell their vehicles outright to a dealer.
Dealers Adapt Business Models to Available Inventory
High prices were as big an issue for many independent dealers as was the shortage of inventory. Dealers often had to choose between maintaining a retail price point to serve their existing customer base, or moving up to higher price point and marketing to a new group of shoppers. In either case, the customer had to be educated to the fact that they would have to pay more to buy a vehicle equivalent to their previous purchase, or be willing to accept a lesser make and model or an older and higher-mileage vehicle.
Irrespective of the customer’s credit standing, higher prices meant larger down payments and/or longer loans to keep monthly payments affordable. Fortunately, finance rates remained low as more lenders competed for business, especially among nonprime and subprime borrowers.
Margins Compress for Many Buy-Here, Pay-Here Operators
The inventory situation was especially difficult for Buy-Here, Pay-Here (BHPH) dealers who had built their business model on access to good quality vehicles at attractive prices. When vehicle supply was plentiful, their credit-challenged customers could still afford high finance rates and a vehicle with less than 100,000 miles. As the supply of these units dried up and prices skyrocketed, many BHPH dealers found their customers priced out of the market. In addition, as more subprime bor-rowers obtained conventional loans, the average credit scores of BHPH customers, and their ability to pay today’s higher prices, declined.
BHPH and other dealers shifted their inventory to older, rougher vehicles to maintain price points or tried to extract a larger down payment from buyers to maintain an affordable monthly payment on a more expensive unit. High wholesale prices and more reconditioning compressed gross margins for many dealers. On the positive side, BHPH dealers obtained a higher price when they remarketed repossessed units.
Even though modern vehicles with 150,000 miles are often still reliable transportation, they are also more prone to expensive repairs for owners who are notoriously lax in doing routine maintenance. More BHPH dealers found themselves picking up a portion of major repair expenses to keep the vehicles on the road and monthly payments current.
Dealers
4
5
needs data
6
needs data
Average Auction Price – Dealer-Consigned Vehicles 2009 200 2011
Source: Manheim Consulting
Jan Feb Mar Apr May Jun Jul Sep Oct Nov DecAug$6,000
$7,000
$8,000
$9,000
$10,000
$11,000
15 2012 Used Car Market Report
Independent Dealers Still Limited in Floorplan Lines
Independent dealers have always faced more challenges in terms of floor-plan credit. Prior to the recession, however, dealers with good credit could often borrow from small local and regional banks against their inventory or get a personal line of credit. But many of these sources dried up during the credit crisis, so independent dealers either used their own funds to purchase vehicles or relied on lenders such as Manheim Financial Services (MAFS). In 2011, the number of dealers served by MAFS increased by more than 17% and available credit lines rose by nearly 13%.
Even as lenders like MAFS stepped up their commitments to indepen-dent dealers, the rapid increase in vehicle prices often meant that dealers had to stock fewer units and try to turn them faster to reach their sales goals. The best scenario for the independent dealer was to acquire a vehi-cle and immediately retail it based upon a firm customer order. Using features like Retail View on OVE.com, more dealers showed online vehi-cles to prospective buyers, negotiated a price, and then bought the vehicle online at the “Buy It Now” price.
Inventory Management Systems Link Dealers Directly to Auction Inventory
Inventory management systems that evaluate local sales and price trends and recommend stocking selections are proven tools that maxi-mize inventory turns. In 2011, vAuto launched a new service, Provision, that blends the resources of AutoTrader and Manheim to provide a comprehen-sive inventory solution that addresses the key questions of what cars to stock, what to pay, and where to find them. Provision, and other IMS systems, combine market data and technology to optimize each dealer’s inventory mix and facilitate the vehicle search and bidding process.
Provision, and other IMS systems, link dealers directly to Manheim and other online inventory sources so they can search for specific models, see run lists, and create proxy bids or “click to purchase” and buy the unit immediately. Inventory management systems save dealers time in searching multiple inventory lists for the right vehicles for their stores.
Interest in Dealer Consignment Grows
Because dealer vehicles vary greatly in terms of the total volume per dealer as well as the age, condition and make of those vehicles, the remarketing process at dealerships has often been more opportunistic than structured. Small dealers will often sell vehicles locally to another dealer or to a wholesaler to get cash immediately. Some large dealers favor sealed-bid auctions once a week or month, even though this is time consuming, adds administrative costs, and ties up cash until the cars are sold.
Dealers
Value of Condition Reports: Dealer Consignments
Manheim Consulting reviewed live and Simulcast auction data from dealer con-signment sales from January through November of 2011. During this time period, only 9% of dealer-consigned units were sold with condition reports (CRs), compared to 97% of vehicles in commercial sales. The 9% of dealer units sold with a CR in 2011 actually represented a 36% increase vs. last year. The increase in dealer units being offered at the auction with a CR drove Simulcast activity up substantially in 2011.
The study shows that vehicles with CRs had fewer arbitration claims and attracted more online bidders, which resulted in a higher online sales per-centage – 48% of vehicles sold with a CR in the $30,000-and-up price range were directly impacted by a Simulcast buyer. These vehicles also experienced a retention lift, especially those in the $10,000-to-$25,000 price range.
View the complete case study by visiting www.manheim.com/consulting and search under the “Presentations” tab.

16 2012 Used Car Market Report
Participation in the dealer lanes at auction and retention have both been rising as the supply of cars and trucks in fleet/ lease lanes declined. The combination of more buyers for dealer consignments and recognition that even small changes can influence returns has altered how many dealers remarket their unwanted units, choosing auctions over other channels.
Manheim now Simulcasts all dealer lane sales, and that has brought more remote buyers into these sales. But to appeal to online bidders, dealers have to provide the same condition information routinely available on fleet and off-lease vehicles. Dealer units with condition reports receive more online bids than vehicles remarketed only with seller disclosures.
Dealers Ask for More Remarketing Training
The shift from selling the majority of their vehicles in a live auction to offering their inventory 24/7 sequentially in multiple digital as well as live auctions can be a daunting task for dealers. Dealers, even large regional and national chains, often rely upon local store management to handle the wholesaling of unwanted units. Developing the sophistication and comfort with remarketing through multiple channels takes time and experience. Just as it has taken years to reach the point where the majority of dealers have bid on and bought a vehicle through a digital channel, building up the expertise at the dealer level to do the same when remarketing a vehicle takes time.
At the request of dealers, The Wholesale Institute has expanded its syllabus to include remarketing training for both in-lane and digital channels. This, and other efforts by auction staff, is encouraging dealers to set reserve prices consistent with market values, to represent vehicles in the lanes, to include a “Buy It Now” or “Make an Offer” options available in digital listings, and to provide prospective bidders with photos and condition reports (CRs). Dealers are also encouraged to list their vehicles in pre-sale inventory where they can be shown with both the lane assignment and approximate run time so that bidders can participate via Simulcast.
Manheim Consulting Evaluates Dealer Remarketing Performance
In an effort to assist dealers in optimizing their remarketing strategies, Manheim Consulting periodically evaluates individual dealer performance by comparing actual prices obtained against auction values of comparable vehicles in the same peri-ods. By letting the numbers speak for themselves, the analyses enable dealers to optimize remarketing by type of vehicle and channel.
Dealers have expressed satisfaction with the performance reports provided to them and, in an indication of how they are being used inter-nally, made specific requests for additional data to help them make smarter decisions.
The Manheim Consulting staff has now produced hundreds of reports for individual dealers. Overall, the conclusions support more proactive involvement by dealers in remarketing their vehicles. With overall dealer-ship profits under continuous pressure, dealers cannot ignore the potential to improve returns on wholesale units by applying the same techniques used by large consignors. The acceptance of business intelli-gence and technologies in dealership operations evolved slowly through 2005. Since then, driven by both need and improved functionality, these tools have become essential in maintaining financial performance.
Dealers
Dealers
1
2
3
needs data
61 817166 76 86 91 0196 1106
Source: Automotive News
468
101214161820
New Car and Light-Duty Truck SalesMillions of Units
Dealers Post Largest Used Unit Sales Gain Since 1993Annual Percent Change in Used Unit Sales by Dealers
Source: CNW Marketing Research
-10%-8%-6%-4%-2%0%2%4%6%8%
10%
0590 9291 9695 97 99 0098 01 02 03 060493 94 07 08 1009
2011 is a Manheim Consulting estimate based onboth internal and industry sources.
Source: National Auto Auction Association Surveys, 2001-2010
01 1002 03 04 05 06 07 08 09 11E0%
10%
20%
30%
40%
50%
60%
Dealer-Consignment Sales as Percentage of Total Auction Volume
needs data
39.4040.0140.5046.3051.6050.9050.0042.0039.3045.4055.50
17 2012 Used Car Market Report
2012Used CarMarket Report
Q&A With NADA Chairman William P. Underriner
National Automobile Dealers Association (NADA)
William P. Underriner, president and co-owner of Underriner Motors in Billings, Mont., is chairman of the National Automobile Dealers Association and represents Montana’s franchised new-car dealers on the association’s board of directors.
In the automobile business since 1984, Underriner took over the family business in 2001. He currently owns Honda, Hyundai, Buick, and Volvo franchises in Billings. Previously, he served three terms as treasurer of NADA and on the association’s Executive, Industry Relations, Dealership Operations, and Membership committees. He has also served as chairman of the association’s Finance and Convention committees. Underriner has held a variety of offices with the Montana Automobile Dealers Association, including chairman of the board.
Franchised dealers focused on their used car operations during the period of low new vehicle sales. Do you believe they will continue to emphasize used cars in the future?
Franchised dealers will continue to focus more of their resources on used cars in 2012. Many consumers are still uncertain about the current economy and are opting to buy lower-priced vehicles. Dealers are the best at adapting to changes in their local markets. Depending on a dealer’s circumstance, this retailing out of lower-priced trade-ins can make good business sense.
Auto companies are emphasizing their certified pre-owned (CPO) programs. Do consumers understand the value in the CPO designation compared to non-CPO units?
CPO vehicles have seen a surge in popularity. These vehicles offer customers a compromise between buying new and pre-owned and are in high demand. CPO vehicles do hold more value due to the mechanical inspection and additional warranty usually offered on these vehicles. CPO vehicles create more service business for the dealer besides what is in the certification process itself.
Franchised dealers retailed more of their off-brand trades in 2011. Does this represent profit opportunity for the fran-chised dealer or just a reflection of the current market?
Maintaining used vehicle inventory has been a challenge all year for all dealers. This constrained supply makes keeping off-brand vehicles a great strategy, but dealers still need the auction channel because they still need to wholesale units that are too far out of their target market.
In 2011, franchised dealers actively sought customers’ vehicles they would like to stock. Do you see them con-tinuing to try to acquire inventory directly?
We have seen franchised dealers buying used cars directly from their service customers. This makes sense because these vehicles have usually been properly serviced and cared for and dealers know the vehicles. These solicitations give the dealer a chance to acquire a good quality used vehicle and also the chance to sell a new vehicle.
Are all dealers spending more time and effort to find the used vehicles they need?
Yes, dealers are spending more time sourcing used car inventory. But using digital tools, searching online inventory, and attending live auctions allow us to see more inventory. This is a more effi-cient and better use of time and resources.
Can you give us your perspective on how digital technol-ogy has changed both acquiring used car inventory and remarketing of used cars by franchised dealers?
The digital market has made buying and selling used cars easier and more efficient. It also provides the ability to buy beyond our local market. Digital technology has changed the entire industry, and this trend will continue. Dealers must be proactive instead of reactive. Online vehicle condition reports are much more accurate today than when online buying first began, and this greatly reduces the risk to the buyer. This doesn’t mean dealers have given up on brick-and-mortar auctions. Auctions are like attending a sporting event. You can watch the event live rather than from your chair at home in front of the TV.
What kind of expertise does today’s used car manager need?
Dealer principals and general managers have had to take a more active role in used car management and operations. In this new economy, most dealers have operated with a smaller, more effi-cient staff, thereby creating the need for both dealer principals and general managers to be actively involved in the used car department. Used car managers must have knowledge of the market as well as current economic trends and vehicle valuations. NADA, along with partners such as Manheim, has developed an online solution, AppraisalPRO, which displays market data and is simple to use. It includes the next step forward for dealers – a mobile application with a VIN scanner.

18 2012 Used Car Market Report
2012Used CarMarket Report
Q&A With NIADA President Don Fincher
National Independent Automobile Dealers Association (NIADA)
Don Fincher became president of NIADA in 2011. Don has spent his entire working life in the auto retail industry, starting out at the age of 15 in his father’s store. After 18 years, Fincher took over one of his father’s stores and has operated that Buy Here, Pay Here store in Texas ever since. He has been active in NIADA and previously served as president of the Houston and Texas IADAs.
How would you describe business conditions for indepen-dent used vehicle dealers in 2011?
In general, demand for used vehicles improved and people wanted to replace their older cars with something better. There is always a base demand for used vehicles, but in 2011 we saw more cus-tomers coming in to replace their older vehicles. With retail credit more available, we see demand for used cars and trucks continuing to improve. The limiting factors for many customers are today’s high used car prices.
Many independent dealers relied on credit lines from local lenders in the past, but this changed after the credit crisis. How are used car dealers financing their busi-nesses today?
Many large operators have been able to attract private capital to replace the bank lines they previously relied on, but smaller, family-owned dealerships are often limited to their own capital or lines provided by auctions or specialty lenders. This can be a challenge for dealers who want to expand their inventory or grow their business.
How does the small used vehicle dealer stay profitable in this environment?
Used car dealers have always been resilient and kept costs, espe-cially overhead, down while managing inventory. But many successful dealers are niche sellers, and that often gives the small dealer a better chance to compete against larger, less focused operations. There are very successful smaller dealers who stock mainly pickup trucks and sport utility vehicles or mid-size trucks for commercial use. Some dealers make a very good return buying repairable units from salvage auctions. They suc-ceed with a small, but focused, inventory and provide good customer service.
The shortage of used vehicles pushed prices to record levels in 2011. What has that meant for used vehicle dealers?
High used car prices have made it more difficult for dealers to stock as many vehicles as they did in the past, so they have to be sure they carry the right models. Many dealers are now selling older, higher mileage vehicles. I know many dealers who used to pass on vehicles with more than 150,000 miles on them who now bid on them at the auctions. We’re learning that a high-mile-age car or truck can be mechanically sound and has a lot of life left in it. Our customers are also being educated to the value of these vehicles.
I don’t see the shortage abating soon. It will get better as new vehicle demand increases and more trade-ins come back to the auctions, but we are always going to have a shortage of 2008 through 2011 models.
Have dealers altered their sourcing strategies given the current shortage?
Dealers, myself included, still rely on auctions for much of their inventory. But market conditions have encouraged us to tap other potential sources, including buying some inventory directly from owners. Even small dealers advertise locally that they will make an offer on your car or truck.
Do you see NIADA members buying more of their inven-tory in digital auctions?
Yes, I do. I’m one of those people who spent his life in the lanes bidding on units that I inspected. It’s hard to transition to the digi-tal world, but I’ve gone through the training, and I know that I have to be active in both live and digital auctions.
Auctions have done a great job making the online experience work. With arbitration and inspection standards and more vehicles with condition reports, it is easier to buy with confidence.

19 2012 Used Car Market Report
2012Used CarMarket Report
Rental
Rental Industry Revenues Rise
The rental industry generated record revenues of $22.4 billion in 2011, up from $20.6 billion in 2010. A slow recovery in business and leisure travel resulted in more rental volume, but a sharp increase in the size of the rental fleet resulted in more competition and lower rates. Vehicles in service grew sharply due to a shift in mix between local and daily rental. In 2011, the rental industry purchased slightly fewer (1.40 million versus 1.41 million) new vehicles than in 2010, so the increase in fleet size reflected longer lengths of service.
Risk Vehicles Reduce Seasonal Swings in Fleet Size
Although risk vehicles enable rental companies to operate a mixed-brand fleet and negotiate purchases by make and model, they also prevent com-panies from adjusting fleet size to seasonal variations in demand. Rental demand peaks during the summer vacation period, with smaller peaks during spring breaks and from Thanksgiving through the New Year. When program vehicles dominated rental fleets, automakers shipped vehicles to rental companies in the spring and repurchased them in the fall. Thus, it was easier to downsize fleets in the early fall and add units in anticipa-tion of summer rentals. With risk vehicles now accounting for more than 70% of the fleet at most rental companies, there is less seasonal variation in overall fleet size and therefore more rate competition during slow travel months.
Cost Avoidance Influences Vehicle Service Life
Achieving favorable operating economics, depreciation in particular, dictates careful selection of vehicles equipped with features that support higher residual values. It also requires service lives that are often more than one year and sometimes as long as 18 months and 45,000 miles or more. Rental companies, like their commercial fleet counterparts, try to remove vehicles from service before they require another tire change or costly repair.
Rental
Rental
1
2
3
needs data
U.S. Car Rental Market Revenue In Billions
Source: Auto Rental News 2012 Fact Book
01 02 03 04 05 06 07 08 10 1109$0
$5
$10
$15
$20
$25
System Revenue Passenger Enplanements In Thousands of Scheduled Passengers
2009 2010 2011
45,000
50,000
55,000
60,000
65,000
70,000
75,000
Jan Feb Mar Apr May Jun Jul Sep Oct Nov DecAug
Source: Bureau of Transportation Statistics U.S. Department of Transportation
New Vehicle Sales Into Rental and�Rental Fleet Size In Millions
New Purchases Average Fleet Size
Source: Bobit Business Media
0.8
1.0
1.2
1.4
1.6
1.8
2.0
2.2
99 0100 0302 04 08 10 110605 0907
18.2016.4316.4617.6418.9120.4121.4921.4920.0520.5922.40
1.570698 1.7333911.686076 1.8290001.675712 1.7380001.711582 1.6430001.772285 1.6170001.936146 1.6650002.079675 1.7140462.054373 1.7680001.897486 1.8614611.503734 1.8130001.128426 1.6370001.412070 1.6290001.399353 1.760761

20 2012 Used Car Market Report
Rental
Small rental operators, especially those that are located off-airport, buy used vehicles for their fleets. Lack of supply, however, limited these purchases in 2011. In addition, in the second quarter, major rental companies also turned to used vehicles when confronted by cancellations and delivery delays. Rental companies see used vehicles as a potential source of seasonal supply and have experimented with sourcing and integrating used vehicles into fleets for a service life of three to five months. But currently, the supply of quality late-model vehicles is not adequate to make this a significant source.
Rental Companies Strive to Reduce Days to Sale
Rental companies are focused on reducing fixed costs, recovering the cost of customer damage to vehicles, raising employee productivity, and applying life cycle cost management across the fleet. Remarketing strategies are still evolving within the industry as companies embrace digital technology to expose their inventory to more buyers – often even before vehicles come out of service. The profitability of a rental company is highly dependent, not just on the price paid for each vehicle, but equally important, on the value obtained when the unit is taken out of service. Remarketing channels that reduce days to sale and avoid expenses, transportation in particular, are favored by this industry. In other words, digital channels are important.
In 2010, online channels operated by auction partners and Hertz’s own Dealer Direct channel combined to account for 47% of the company’s remarketing volume. In 2012, that share is expected to exceed 60%. Enterprise, which has exposure to customers who need a replacement car and thousands of local outlets, has long had an established channel of sales direct to customers. In 2011, what they refer to as “referral sales” topped 65,000 units. Hertz also offers both direct retail and “Rent-to-Buy” programs. In 2011, those channels handled 13% of Hertz’s remarketing volume. Most other major rental companies are also experimenting with ways to obtain a price closer to retail for their off-rental inventory.
Independent and Franchised Dealers Compete for Off-Rental Units
When program vehicles dominated rental fleets, closed factory auctions, both live and upstream, were the dominant remarketing channel. Franchised dealers snapped up the nearly-new models, usually with less than 12,000 miles, for sale as Certified Pre-Owned vehicles. Today’s off-rental vehicle is older, often with four times the mileage and in need of recon-ditioning. Thus, independent used vehicle dealers, including BHPH dealers, are also major buyers of off-rental vehicles.
In order to maximize end-of-service net proceeds, rental companies try to remarket vehicles in the shortest time and preferably without incurring transportation costs. However, local dealers and wholesalers cannot absorb all the inventory in areas like Orlando, Las Vegas, and Los Angeles that have high concentrations of rental vehicles. In these markets, excess vehicles need to be transported to distant auc-tions, or online channels are needed to bring buyers who are outside the market to the cars.
4
5
needs data
complete
data from body copy in word docPlease update the chart for 2011 as follows: Avis =50% risk; Hertz 70% risk; Dollar 97% risk
6from rental ppt
complete
Percentage of Fleet Accounted For by Risk Units
Source: Company Reports
Avis Budget
1107 08 09 10 1107 08 09 10 1107 08 09 100
10%20%30%40%50%60%70%80%90%
100%
Dollar/Thrifty Hertz
Average Auction Price – Rental Risk Units 2008 2009 2010 2011
Source: Manheim Consulting
Jan Feb Mar Apr May Jun Jul Sep Oct Nov DecAug$8,500
$9,500
$10,500
$11,500
$12,500
$13,500
$14,500
$15,500
New Vehicle Sales into Rental by Month 2009 2010 2011
Source: Bobit Business Media
Jan Feb Mar Apr May Jun Jul Sep Oct Nov DecAug
47939 118634 9770973108 151271 134575106095 147196 159683111531 119973 147740111395 162218 12844280166 128648 12015059458 88891 9329286169 110524 11758499321 107819 116801108425 93972 92657109018 86555 88398142839 96683 102003
0
50,000
100,000
150,000
200,000

21 2012 Used Car Market Report
Rental
Digital Channels Attract Distant Buyers
With wholesale supplies tight in 2011, dealers were more willing than ever to bid in digital channels for off-rental vehicles. Digital channels, such as OVE.com, Simulcast, and Simulcast Everywhere sales, enable companies to attract distant buyers if the vehicles have accurate CRs and fair reserve prices.
Overall, the member auctions of NAAA remarketed more than half of all off-rental vehicles in 2011. The prices they received reached record levels, even as the average mileage remained relatively high.
Supply of Rental Vehicles Will Rise in 2012
In 2011, the rental industry reacted to order cancellations from Japanese and U.S. auto companies in the second quarter by keeping some units in service longer than anticipated. However, as deliveries increased, companies were able to defleet older units and take advan-tage of high wholesale values. In the fourth quarter of 2011, rental companies stepped up their defleeting, but the increase in auction vol-ume had no adverse impact on pricing.
Now that the switch to risk vehicles is essen-tially complete, dealers can expect that the supply of off-rental vehicles will essentially match the number of new rental vehicles purchased each year. With replacement levels expected to rise in 2012 and 2013, the number of off-rental units, albeit with high mileage, will also increase.
4
5
needs data
complete
data from body copy in word docPlease update the chart for 2011 as follows: Avis =50% risk; Hertz 70% risk; Dollar 97% risk
6from rental ppt
complete
Percentage of Fleet Accounted For by Risk Units
Source: Company Reports
Avis Budget
1107 08 09 10 1107 08 09 10 1107 08 09 100
10%20%30%40%50%60%70%80%90%
100%
Dollar/Thrifty Hertz
Average Auction Price – Rental Risk Units 2008 2009 2010 2011
Source: Manheim Consulting
Jan Feb Mar Apr May Jun Jul Sep Oct Nov DecAug$8,500
$9,500
$10,500
$11,500
$12,500
$13,500
$14,500
$15,500
New Vehicle Sales into Rental by Month 2009 2010 2011
Source: Bobit Business Media
Jan Feb Mar Apr May Jun Jul Sep Oct Nov DecAug
47939 118634 9770973108 151271 134575106095 147196 159683111531 119973 147740111395 162218 12844280166 128648 12015059458 88891 9329286169 110524 11758499321 107819 116801108425 93972 92657109018 86555 88398142839 96683 102003
0
50,000
100,000
150,000
200,000
7from rental ppt
complete
8from rental ppt
complete
Average Mileage – Rental Risk Units 2008 2009 2010 2011
Source: Manheim Consulting
Jan Feb Mar Apr May Jun Jul Sep Oct Nov DecAug25,00027,50030,00032,50035,00037,50040,00042,50045,000
1.0001.1251.2501.3751.5001.6251.7501.8752.000
Total Wholesale Supply of�Off-Rental VehiclesIn Millions
Source: Manheim Consulting
95 96 13121110 14 1597 98 99 0100 06 07 080302 04 05 09
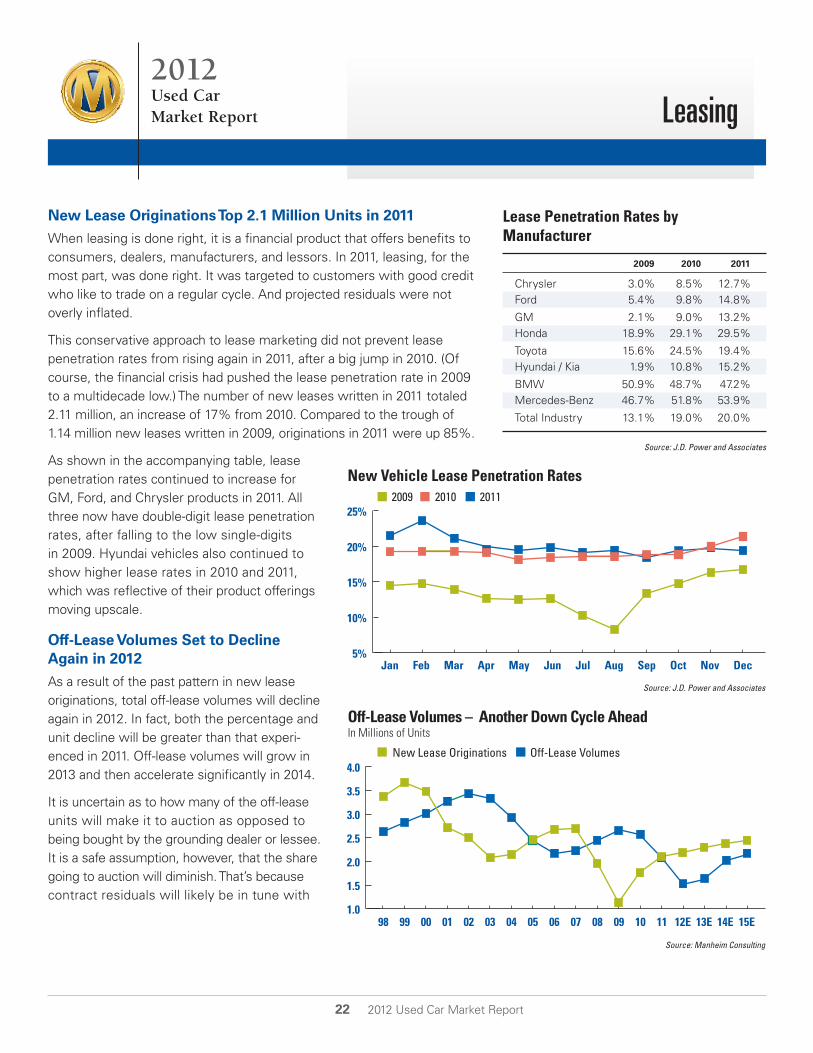
22 2012 Used Car Market Report
2012Used CarMarket Report
New Lease Originations Top 2.1 Million Units in 2011
When leasing is done right, it is a financial product that offers benefits to consumers, dealers, manufacturers, and lessors. In 2011, leasing, for the most part, was done right. It was targeted to customers with good credit who like to trade on a regular cycle. And projected residuals were not overly inflated.
This conservative approach to lease marketing did not prevent lease penetration rates from rising again in 2011, after a big jump in 2010. (Of course, the financial crisis had pushed the lease penetration rate in 2009 to a multidecade low.) The number of new leases written in 2011 totaled 2.11 million, an increase of 17% from 2010. Compared to the trough of 1.14 million new leases written in 2009, originations in 2011 were up 85%.
As shown in the accompanying table, lease penetration rates continued to increase for GM, Ford, and Chrysler products in 2011. All three now have double-digit lease penetration rates, after falling to the low single-digits in 2009. Hyundai vehicles also continued to show higher lease rates in 2010 and 2011, which was reflective of their product offerings moving upscale.
Off-Lease Volumes Set to Decline Again in 2012
As a result of the past pattern in new lease originations, total off-lease volumes will decline again in 2012. In fact, both the percentage and unit decline will be greater than that experi-enced in 2011. Off-lease volumes will grow in 2013 and then accelerate significantly in 2014.
It is uncertain as to how many of the off-lease units will make it to auction as opposed to being bought by the grounding dealer or lessee. It is a safe assumption, however, that the share going to auction will diminish. That’s because contract residuals will likely be in tune with
Leasing
Lease Penetration Rates by Manufacturer
2009 2010 2011
Chrysler 3.0% 8.5% 12.7%Ford 5.4% 9.8% 14.8%
GM 2.1% 9.0% 13.2%Honda 18.9% 29.1% 29.5%
Toyota 15.6% 24.5% 19.4%Hyundai / Kia 1.9% 10.8% 15.2%
BMW 50.9% 48.7% 47.2%Mercedes-Benz 46.7% 51.8% 53.9%
Total Industry 13.1% 19.0% 20.0%
Source: J.D. Power and Associates
Off-Lease Volumes – �Another Down Cycle AheadIn Millions of Units
New Lease Originations Off-Lease Volumes
Leasing
1
2
3
from Leasing ppt
needs datafor November and Dec. 2011
from Leasing ppt
complete
from Leasing ppt
complete
New Vehicle Lease Penetration Rates 2009 2010 2011
Source: J.D. Power and Associates
Jan Feb Mar Apr May Jun Jul Sep Oct Nov DecAug5%
10%
15%
20%
25%
Source: Manheim Consulting
98 02010099 03 04 05 15E06 07 08 09 10 11 12E 13E 14E
Average Gain or Loss on�Ford Credit Lease Returns
Source: Ford Credit Auto Lease Trust 2011-B
2007 2008 2009 2010 6 Mos.2011
-$4,000
-$3,000
-$2,000
-$1,000
$0
$1,000
$2,000
$3,000
$4,000
1.0
1.5
2.0
2.5
3.0
3.5
4.0

23 2012 Used Car Market Report
Leasing
market values and because a growing number of captive finance companies have put in place both carrots and sticks to encourage grounding dealers to buy end-of-term units. The message to dealers is clear: “You want to be that grounding dealer.”
Lease “Pull-Aheads” Worked Well
With wholesale vehicle values at record levels, dealers and lessors found it an ideal time to pull customers out of their leases early in order to secure a new sale as well as a needed piece of used vehicle inventory. Customers, meanwhile, were pleasantly surprised to find that they could get into a new ride for the same, or lower, monthly payment.
The pull-aheads in 2011 will reduce off-lease volumes in 2012 by only a small amount, as most of them reflected a shift of less than six months and were done early enough in the year so that dealers could sell the end-of-term unit before model-year closeout. In addition, we expect the effective use of pull-aheads will continue in 2012. Beyond the lessor’s desire to cement customer loyalty and the dealer’s desire for quality used vehicle inventory, pull-aheads can help quicken the trade cycle. The economics of monthly payments make 24-month leases a diffi-cult sell, but it is possible to put customers in a 36-month lease and then pull them out after 30 months.
End-of-Term Residuals: From Big Losses to Big Gains
Lease remarketers are not unaccustomed to cyclical swings in their port-folio performance. Recently, they went from large losses on end-of-term units in 2008 to record profits in 2011. There is no precise aggregated data on the performance of all lease portfolios, but the accompanying graphic depicting the results for Ford Credit is not atypical.
These swings in end-of-term gains and losses are often built into the business model. That’s because “projected” residuals are, in fact, heavily influenced by history. Thus, for example, the losses of 2008 resulted in overly pessimistic residuals forecasts for vehicles put out on lease that year. And, when those units came back to market in 2011, wholesale pricing was at an all-time high. Swings between gains and losses are also amplified by the fact that lease return rates are strongly and inversely correlated to used vehicle values. Again, with Ford Credit as the example, we see that the lease return declined from 82.2% (when prices were at their low) to just 57.5% in the first half of 2011 (when used prices were at record levels).
And, by comparing actual contract residuals to projected ALG residuals, we see that the spread between the two has remained relatively con-stant. This proves that in the last cycle the swing between end-of-term losses and end-of-term profits was the result of market forces and inaccu-rate residual forecasts. It was not the result of changes in the level of lease subvention.
Off-Lease Volumes – �Another Down Cycle AheadIn Millions of Units
New Lease Originations Off-Lease Volumes
Leasing
1
2
3
from Leasing ppt
needs datafor November and Dec. 2011
from Leasing ppt
complete
from Leasing ppt
complete
New Vehicle Lease Penetration Rates 2009 2010 2011
Source: J.D. Power and Associates
Jan Feb Mar Apr May Jun Jul Sep Oct Nov DecAug5%
10%
15%
20%
25%
Source: Manheim Consulting
98 02010099 03 04 05 15E06 07 08 09 10 11 12E 13E 14E
Average Gain or Loss on�Ford Credit Lease Returns
Source: Ford Credit Auto Lease Trust 2011-B
2007 2008 2009 2010 6 Mos.2011
-$4,000
-$3,000
-$2,000
-$1,000
$0
$1,000
$2,000
$3,000
$4,000
1.0
1.5
2.0
2.5
3.0
3.5
4.0
4
5
complete
needs data
6needs data
Contract Residuals vs. ALG Residuals – Ford Credit Leases Contract Residual ALG Residual
Source: Ford Credit Auto Lease Trust 2011-B
2007 2008 2009 2010 6 Mos.2011
40%
42%
44%
46%
48%
50%
52%
54%
56%

24 2012 Used Car Market Report
Leasing
Off-Lease Remarketing Continues to Shift Online and Upstream
All captive finance companies, as well as the major independents, have at least one Internet upstream platform that offers end-of-term vehicles to an ever-widening audience of dealers prior to sale at physical auction. The technology, platforms, and tools available for electronic remarketing of off-lease vehicles have improved significantly in recent years.
Securities and Exchange Commission filings show that GMAC’s Internet sales of off-lease vehicles first exceeded sales at physical auc-tions in 2007. In 2010, the ratio was more than three Internet sales for every one sold at auc-tion. Likewise, sales on Toyota Dealer Direct accounted for 54% of all Toyota off-lease sales in the fiscal year ending March 31, 2011. Given that demand for off-lease units contin-ues to grow at the same time that supply declines, the share of sales accounted for by online and upstream channels will surely increase further. In addition, captive finance companies will continue to improve the pro-cesses that enable them to protect residual values, enhance brand image, and provide profit opportunities for their dealer networks.
Distribution of Ally (GMAC) Off-Lease Sales in U.S.
PercentFor calendar year ending December 31 2006 2007 2008 2009 2010
Auction Physical 44% 39% 38% 25% 18%
Internet 38% 43% 47% 57% 60%Sale to grounding dealer 12% 12% 10% 11% 12%
Other (including sale to lessee) 6% 6% 5% 7% 10%
Source: GMAC SEC filings
Distribution of Toyota Financial Services Off-Lease Sales in U.S.
PercentFor fiscal year ending March 31 2007 2008 2009 2010 2011
Toyota Dealer Direct To grounding dealer 36% 41% 33% 42% 43%
Not to grounding dealer 13% 7% 8% 10% 11%At Auction 51% 51% 59% 48% 45%
Source: Toyota Financial Services SEC filings

25 2012 Used Car Market Report
2012Used CarMarket Report
Repossession Volumes Decline Again in 2011
Repossession volumes are determined by con-tracts outstanding, their aging, and their static pool loss performance. Those forces combined to produce a record number of repossessions in 2009, and then a steep decline in both 2010 and 2011. The peak-to-trough swing was from an estimated 1.9 million units in 2009 to 1.3 million in 2011, or a decline of 32%.
Given the recent growth in originations and some easing in lending standards, reposses-sion volumes will likely grow in future years. It is clear, however, that households have increased the priority that they associate with making their monthly car payment and, as such, delinquencies and default rates will be lower than they otherwise would be for any given set of economic circumstances. In addi-tion, strength in wholesale used vehicle pricing (a condition which we think will persist for some time) has meant more borrowers have positive (or only slightly negative) equity in their vehicle loan and, thus, are less likely to default. These two factors, which substantially reduced repossession rates in 2010 and 2011, will keep repossession volumes from returning to their 2009 peak anytime soon.
Severity of Loss Remains Low
In those cases in which repossessions did occur in 2010 and 2011, lenders experienced a significant reduction in the severity of loss. This reflected the strength of wholesale used vehicle prices, more conservative loan-to-value ratios in the underlying contract, and the gen-eral aging of portfolios. The trend in severity of loss experienced by Ford Motor Credit is not atypical of the industry.
RepossessionsRepo
1
2
3
from repo ppt
complete
from repo ppt
complete
from repo ppt
complete
Source: S&P/Experian
Credit Default Rates Auto Index Bank Card Index First Mortgage Index
0%1%2%3%4%5%6%7%8%9%
10%
Nov 05
Nov06
Nov07
Nov08
Nov09
Nov10
Nov11
0
.5
1.0
1.5
2.0
98 99 00 01 02 03 04 05 06 10 1107 08 09
Number of Repossessions In Millions of Units
Source: Manheim Consulting
Source: Ford Motor Credit
$0
$2,000
$4,000
$6,000
$8,000
$10,000
$12,000
0.0%
0.5%
1.0%
1.5%
2.0%
2.5%
3.0%
3.5%
2007 2008 2009 20112010
Repossession Frequency and Severity –�Ford Credit Severity (dollars per vehicle) Frequency (as percent of contracts outstanding)
Repo
1
2
3
from repo ppt
complete
from repo ppt
complete
from repo ppt
complete
Source: S&P/Experian
Credit Default Rates Auto Index Bank Card Index First Mortgage Index
0%1%2%3%4%5%6%7%8%9%
10%
Nov 05
Nov06
Nov07
Nov08
Nov09
Nov10
Nov11
0
.5
1.0
1.5
2.0
98 99 00 01 02 03 04 05 06 10 1107 08 09
Number of Repossessions In Millions of Units
Source: Manheim Consulting
Source: Ford Motor Credit
$0
$2,000
$4,000
$6,000
$8,000
$10,000
$12,000
0.0%
0.5%
1.0%
1.5%
2.0%
2.5%
3.0%
3.5%
2007 2008 2009 20112010
Repossession Frequency and Severity –�Ford Credit Severity (dollars per vehicle) Frequency (as percent of contracts outstanding)

26 2012 Used Car Market Report
Repossessions
Lenders Enjoy a Reduced Cost-of-Funds in 2011
Lender concentration in loan originations is much greater in the new vehicle market than it is for used vehicles. The top five lenders accounted for 43% of all new vehicle loans in the third quarter of 2011, according to Experian. The top five used vehicle lenders accounted for only 22% of the loans in that segment. Likewise, new research by Experian has documented the importance of BHPH financing in the used vehicle market. In the third quarter of 2011, BHPH financing represented 14.3% of all the loans made in the used vehicle market.
Experian data also confirms that the lengthening of used vehicle loan terms continues. In the third quarter of 2011, the average loan term on a used vehicle was 60 months – not substantially different from the aver-age term of 63 months on a new vehicle loan. Loans of three years or less represented only 7.8% of the used vehicle finance market.
The overall health of the auto retail financing market continues to be supported by a well-functioning, asset-backed securitization (ABS) mar-ket. Total issuance in 2011 reached its highest level since 2007 and was nearly double the amount issued in 2008.
In addition to increased issuance, auto ABS funding in 2011 came at rea-sonable terms and spreads, reflecting the overall strong performance of these instruments, even in times of recession. That superior performance is the result of overcollateralization, strict reserve requirements, and a term structure that is consistent with the underlying capital. In addition, the indirect lending model, in which the vast majority of these loans were originated, incorporates a strong professional, and mutually beneficial, rela-tionship between the dealership F&I office and the underwriting lender.
Repossession Remarketing Continues to Move Upstream and Online
Lenders are always focused on converting repossessed units into cash as quickly as possible. Although the biggest stumbling block to a quick sale is often outside the control of the lender or auction (such as state laws that dictate the process of collateral collection and liquidation), auctions and lenders have been successful in streamlining the processes that they do control.
Top Five New Vehicle Lenders by Market Share
Third Quarter, 2011
Ally 11.9%Ford 8.3%
Toyota 7.9%Honda 7.6%
Chase 7.1%All others 57.1%
Source: Experian Automotive
Top Five Used Vehicle Lenders by Market Share
Third Quarter, 2011
Wells Fargo 7.1%Ally 4.0%
Chase 3.9%Capital One 3.8%
Toyota 2.8%All others 78.4%
Source: Experian Automotive
7
from repo ppt
complete
6
from repo ppt
complete
Source: Securities Industry and Financial Markets Association
$0
$5
$10
$15
$20
$25
2Q07
1Q07
3Q07
4Q07
1Q08
2Q08
3Q08
4Q08
1Q09
1Q10
3Q10
4Q10
1Q11
2Q11
4Q11
3Q11
2Q10
2Q09
3Q09
4Q09
Auto ABS IssuanceIn Billions
Source: Experian-Oliver Wyman Market Intelligence Reports
Risk Distribution of Auto LoansThird Quarter, 2011
80% 8.7%
Deep Subprime 11.1%
Subprime 8.7% Super Prime 39.3%
Nonprime 15.8%Prime 25.1%
Risk Distribution of Auto Loans
Third Quarter, 2011

27 2012 Used Car Market Report
Repossessions
In addition, in 2011, repossession remarket-ing made significant advances in moving upstream. For example, Renovo Services partnered with Manheim to list its repos-sessed vehicles at storage facilities directly on OVE.com. Successfully listing and selling vehicles that are located at repossession storage lots requires quality, and cost-effective, mobile inspections and, of course, an Internet platform that attracts a large buyer base.
Given that repossessed units are often remarketed with no reconditioning, they are often purchased by wholesalers who do some cosmetic work and then re-wholesale the unit. This arbitrage should not be looked at as a lost opportunity by the remarketing lender, but rather as the wholesale market efficiently getting vehicles to dealers in the condition they desire.
7
from repo ppt
complete
6
from repo ppt
complete
Source: Securities Industry and Financial Markets Association
$0
$5
$10
$15
$20
$25
2Q07
1Q07
3Q07
4Q07
1Q08
2Q08
3Q08
4Q08
1Q09
1Q10
3Q10
4Q10
1Q11
2Q11
4Q11
3Q11
2Q10
2Q09
3Q09
4Q09
Auto ABS IssuanceIn Billions
Source: Experian-Oliver Wyman Market Intelligence Reports
Risk Distribution of Auto LoansThird Quarter, 2011
80% 8.7%
Deep Subprime 11.1%
Subprime 8.7% Super Prime 39.3%
Nonprime 15.8%Prime 25.1%

28 2012 Used Car Market Report
2012Used CarMarket Report Commercial and Government Fleets
Fuel Efficiency of Fleets Continues to Improve
Since 2008, fleet managers have responded to tighter budgets by reducing units in service, adapting vehicle selector lists to more closely match driver requirements, using telematics to optimize fuel consumption, and, in some cases, keeping vehicles in service up to 20,000 more miles over historical norms.
In 2011, budget constraints again skewed purchases in favor of smaller vehicles and engines. The typical commercial fleet today has a higher percentage of compact and midsize cars, fewer sport utility vehicles, and minivans often doing the work previously performed by larger and more expensive commercial vans. The aim of every fleet manager is to provide a vehi-cle that is comfortable and has the carrying capacity required for its function.
Commercial Fleets Buy More Vehicles in 2011
In 2011, new vehicle purchases by commercial fleets rose 16% to more than 531,000 units. In addition, businesses as well as individual owner/operators purchased more than 270,000 medium and heavy-duty trucks, up more than 39% from 2010. Although fleets bought more vehicles in 2011, annual demand will remain below pre-2008 levels until business activity requires an increase in vehicles in operation.
Commercial fleet managers took advantage of strong demand and high prices for their end-of-service units in 2011. With less competition from late-model trade-ins and the dwindling supply of off-lease units, 3-year-old sedans and light-duty trucks coming out of fleet service were much sought-after by independent and franchised dealers.
Mileage Remains High on End-of-Service Fleet Vehicles
Shortages of parts following the Japanese earthquake and longer order-to-delivery periods for many models caused fleet managers to shift remarketing from the second to the third quarter. But life-cycle costs tipped in favor of shorter service life in 2011 to avoid higher maintenance, in particular tire replacement, and to take advantage of high used vehicle prices.
In 2011, the average end-of-service midsize fleet car sold at auctions had 72,000 miles, only slightly less than the 73,100 miles in 2010, but up from 65,000 miles in 2009. The average mileage of vans and pickup trucks coming out of fleets remained above 100,000 miles, as it has for years.
Auction Prices for Fleet Vehicles Set New Highs in 2011
Mileage- and seasonally adjusted auction prices for end-of-service midsize cars and pickup trucks reached an all-time high in April 2011, exceeding the previous peak reached in the first half of 2010. Prices for fleet vehicles moderated immediately after that, but then accelerated again in November and December.
Fleets
1
2
3
From Fleetppt
complete
From Fleetppt
complete
From Fleetppt
complete
New Vehicle Sales Into Commercialand Government Fleets In Thousands
Commercial Government
Source: Bobit Business Media
01 02 03 04 05 06 07 08 09 10 110
200
400
600
800
1,000
1,200
Average Auction Price –�Midsize Fleet Cars Unadjusted Mileage- and Seasonally Adjusted
Source: Manheim Consulting
Jan02
Jan03
Jan04
Jan05
Jan06
Jan07
Jan08
Jan09
Jan11
Jan12
Jan10
Average Auction Price –�End-of-Service Fleet Pickups Unadjusted Mileage- and Seasonally Adjusted
Source: Manheim Consulting
$4,000
$5,000
$6,000
$7,000
$8,000
$9,000
$10,000
$11,000
Jan02
Jan03
Jan04
Jan05
Jan06
Jan07
Jan08
Jan09
Jan11
Jan12
Jan10
$5,000
$6,000
$7,000
$8,000
$9,000
$10,000

29 2012 Used Car Market Report
Commercial and Government Fleets
Fleet managers remarket vehicles directly to employees, to local dealers, and to whole-salers, as well as through digital and live auctions. Sales to employees increased for many companies in 2011 due to greater employment stability and better access to retail financing.
Digital Remarketing of Fleet Vehicles Grows in 2011
National Auto Auction Association members remarket between 45% and 50% of all end-of-service fleet vehicles through auctions. Recently, strong dealer demand and improved online seller tools have attracted more fleet vehicles into digital channels. In 2011, fleet management companies participated in a record number of Special Manheim Online Event Sales in addition to in-lane Simulcast sales.
Fleet vehicles remarketed to dealers, wholesalers, and employees are often not reconditioned, other than removal of logos and decals. Commercial fleet units remar-keted through auctions are inspected and, due to the growing popularity of online chan-nels, have detailed ECRs and photographs. Fleet managers and fleet management companies use guidebooks and Manheim Market Report (MMR) in setting floor prices for their inventory. But, just as in 2010, transaction prices often exceeded those values, making auctions a favored remarketing channel.
Government Fleet Purchases Fell for the Fourth Consecutive Year
Government fleet managers found themselves under increased pressure in 2011 to reduce budgets by cutting units in service and then taking additional steps to lower operating costs. As a result of the downsizing of units in operation, gov-ernment fleets acquired only 214,500 units in 2011, down 1% from 2010, and well off the peak of 313,000 units acquired in 2007. Whereas commercial fleet demand is likely to rise again in 2012, government fleet demand will probably remain weak as a result of mandates to reduce fleet costs. The federal government, for example, wants to reduce the annual fleet budget by 20%.
Fleets
1
2
3
From Fleetppt
complete
From Fleetppt
complete
From Fleetppt
complete
New Vehicle Sales Into Commercialand Government Fleets In Thousands
Commercial Government
Source: Bobit Business Media
01 02 03 04 05 06 07 08 09 10 110
200
400
600
800
1,000
1,200
Average Auction Price –�Midsize Fleet Cars Unadjusted Mileage- and Seasonally Adjusted
Source: Manheim Consulting
Jan02
Jan03
Jan04
Jan05
Jan06
Jan07
Jan08
Jan09
Jan11
Jan12
Jan10
Average Auction Price –�End-of-Service Fleet Pickups Unadjusted Mileage- and Seasonally Adjusted
Source: Manheim Consulting
$4,000
$5,000
$6,000
$7,000
$8,000
$9,000
$10,000
$11,000
Jan02
Jan03
Jan04
Jan05
Jan06
Jan07
Jan08
Jan09
Jan11
Jan12
Jan10
$5,000
$6,000
$7,000
$8,000
$9,000
$10,000

30 2012 Used Car Market Report
Commercial and Government Fleets
Government fleets remarketed slightly more vehicles than they bought in 2011, and usually through Simulcast live auctions. More dealers, especially BHPH dealers, participated in these sales last year as they searched for affordable inventory.
The General Services Administration (GSA) manages the purchase and remarketing of end-of-service vehicles for federal agencies. At Manheim, more than half of GSA vehicles are sold to online bidders. By contrast, munic-ipal and state government fleet vehicles are most often remarketed locally in periodic live auctions. Most of these vehicles have more than 100,000 miles on them, and buyers range from local taxi companies to private individuals and independent used car dealers. More dealers, especially BHPH dealers, participated in these sales in 2011 as they searched for affordable inventory.
Selling Strategy: Impact on Sales Results From Sale Day Consolidation and Like Seller Presence
Manheim Consulting analyzed sales results when a medium- size fleet altered its auction strategy from selling units as they became available to waiting to accumulate a larger number before offering them at auction. The results told Manheim con-sultants that the seller needed at least 21 vehicles to optimize sale and price goals. The financial gain from consolidation out-weighed the added expense of holding some vehicles more than a week longer. In addition, the best results were obtained when the seller’s vehicles were included with those of other fleets. More dealers were attracted by the opportunity to bid on a large number of similar units in a single sale.
View the complete case study by visiting www.manheim.com/consulting and search under the “Presentations” tab.
Return on Reconditioning
Manheim Consulting analysts reviewed all auction transactions for dealer and fleet/lease vehicles from April 2010 to March 2011 that included Insight pre- and post sale inspections. The study looked at the return on reconditioning investments.
This comprehensive analysis provides Manheim Market Report (MMR) performance data by vehicle price category where the condition grade increased as a result of reconditioning. Although most vehicle grades saw a positive return on investment from reconditioning that boosted the condition grade, the improvement was greatest for those vehicles with a pre-sale condition grade below 3. The price increase on these vehicles returned $2.41 for every dollar invested, compared to only $1.22 for every dollar invested on vehicles with pre-sale grades above 3.
View the complete case study by visiting www.manheim.com/consulting and search under the “Presentations” tab.

31 2012 Used Car Market Report
2012Used CarMarket Report
Salvage Auctions: A Source of Inventory for Used Vehicle Dealers
In 2011, salvage auction participants found conditions comparable to those of whole-car auctions. Tight supplies and strong demand led to higher prices, which challenged buyers to work harder to find vehicles at prices that accurately reflected the profit potential in each unit, whether it was to be dismantled for parts or repaired and retailed.
These conditions have been in place for more than a year and are expected to persist through 2012. They are the result of more than three years of below-normal new vehicle sales, the elimination of 750,000 vehicles in the 2009 cash-for-clunkers program, and an aging vehi-cle population. Older vehicles are less likely to have collision insurance, so fewer damaged vehicles are flagged as a total loss.
Historical data reflects the flattening in scrap-page volumes in recent years. Offsetting some of the decline in age- and accident-related sal-vage supply was the greater volume of vehicles destroyed by 2011 floods, ice, hail, snowstorms, and tornadoes.
SalvageSalvage
1
2
3
fromSalvageppt
complete
need data
fromTRA Sales summary png
complete
Whole Crushed Auto Body PricesAverage Price Per Gross Ton
2010 2011
DecJunJan Feb Mar Apr July Aug OctMay Nov
Source: American Recycler Magazine, Marketwatch
Sep
TRA Sales as Percent of ACV*
22%
20%
24%
26%
28%
30%
32%
Jan11
Mar11
Jul11
May11
Nov11
*Actual Cash ValueSource: Total Resource Auctions
Sep11
$150
$200
$250
$300
$350
New Vehicle Sales and ScrappageIn Millions
New Vehicle Sales Scrappage
10 11 12E08 090705 06040301 0298 99 00
Source: RL Polk, Automotive News and Manheim Consulting estimates
10111213141516171819
9
Average Age in Years of Vehicles Declared a Total Loss
Q1 Q3 Q1 Q3 Q1 Q3 Vehicles 2009 2009 2010 2010 2011 2011
Convertible 10.01 10.77 10.29 10.99 11.03 11.51Coupe 10.37 10.71 10.69 11.06 10.99 11.35
Hatchback 9.69 9.83 9.54 9.66 9.37 9.49Sedan 9.55 9.69 9.82 10.02 9.95 10.22
Wagon 8.50 8.59 8.60 8.73 8.80 8.68Other Passenger 10.19 11.40 10.64 11.64 10.85 11.87
Pickup 9.77 10.51 10.65 11.19 11.01 11.28Van 9.68 10.00 10.20 10.49 10.41 10.62
SUV 8.50 8.80 9.16 9.36 9.49 9.56
Source: Industry Trends Report Q4 2011, Mitchell International, Inc.
Average Vehicle Actual Cash Value
Vehicles Q1 2009 Q3 2009 Q1 2010 Q3 2010 Q1 2011 Q3 2011
Convertible $ 9,118.86 $ 9,055.25 $ 9,748.87 $ 9,300.77 $ 9,762.15 $ 10,477.75Coupe $ 6,018.66 $ 5,852.99 $ 6,229.73 $ 6,285.75 $ 6,384.64 $ 6,788.25
Hatchback $ 6,011.09 $ 5,952.06 $ 6,464.55 $ 6,500.82 $ 6,764.07 $ 7,384.18Sedan $ 6,048.94 $ 5,979.02 $ 6,306.39 $ 6,439.08 $ 6,538.71 $ 6,980.71
Wagon $ 7,255.43 $ 6,964.85 $ 7,226.39 $ 7,445.75 $ 7,277.93 $ 8,128.72Other Passenger $ 17,811.05 $ 12,707.58 $ 15,931.98 $ 14,924.15 $ 15,574.72 $ 12,292.53
Pickup $ 8,413.04 $ 8,216.10 $ 9,198.22 $ 8,964.99 $ 9,711.52 $ 9,493.56Van $ 5,157.33 $ 4,981.87 $ 5,471.17 $ 5,563.32 $ 5,578.23 $ 5,778.54
SUV $ 7,976.14 $ 8,125.52 $ 8,806.50 $ 9,109.67 $ 9,010.37 $ 9,314.67
Source: Industry Trends Report Q4 2011, Mitchell International, Inc.

32 2012 Used Car Market Report
Salvage
Vehicle Aging Reflected in Total Loss Statistics
The aging vehicle population is reflected in the multiyear trend of insurance total loss units being older. But they still had higher actual cash values (ACV). In 2011, the average age of total loss units increased in every high-volume vehicle segment. Although ACVs peaked in the second quarter, third-quarter levels remained close to historic highs following the pattern in whole car auction values.
Salvage Auctions Remarket More Clean Titled Vehicles
There is no precise industry data on the volume of non-insurance vehicles remarketed through salvage auctions, but anec-dotal evidence points to a significant increase over the last year or so. Manheim’s Total Resource Auctions (TRA) recorded a large increase in the number of older, higher-mileage vehicles, usually with clean titles, remarketed through their auctions in 2011. These included cars and trucks donated to charities, subprime repossessions, and even lightly damaged rental fleet units. However, dealer consignments accounted for the biggest year-over-year gain. Many 10- to 12-year-old vehicles have noticeable cosmetic flaws, but they still provide reliable transportation. In the past, these vehicles were almost solely traded locally among dealers and wholesalers; but, in 2011, high prices encouraged sellers of these units to use salvage auctions. And with more inventory for sale, TRA sales attracted more dealers searching for under-$5,000 vehicles.
Dealer Participation Increases in Salvage Auctions
Dealers, including BHPH operators, have discovered that salvage auctions are a good source of low-priced inventory. Because 47 of TRA’s auctions are co-located with a Manheim whole-car auction, dealers are exposed to salvage inventory, when they attend a whole car sale which resulted in more crossover buying and selling. But even in TRA’s freestanding salvage auctions, dealers search pre-sale lists and bid on these units with the intention of retailing them.
While most dealer purchases are clean-titled units, buyers also recognize that salvage titles often reflect a circumstance rather than an actual condition. Typically a salvage title is attached to a vehicle when the cost of repairs exceeds 75% of its actual cash value. However, stolen vehicles are often branded with a salvage title irrespective of condition. Likewise, older cars that have not been in an accident might get a salvage title merely because of age and mileage. Dealers are cautious buyers when it comes to salvage vehicles; but shortages throughout the wholesale used vehicle market encouraged dealer bidding, since dealers knew they could repair and retail the unit for a profit.
Foreign Buyers Compete for Late-Model Repairable Units
Exporters represent an important buyer group especially interested in later model, damaged vehicles that will be restored and sold. Typically the customer has already agreed to a purchase price and made a deposit on the vehicle, so the foreign buyer can value the vehicle quickly and frequently accepts the “buy it now” price rather than risking not getting the unit in the live auction.
The export market softened early in 2011 as demand from Europe weakened. However, export demand picked up in the second half, with increased buying from Mexico and Latin America. Exports to Mexico declined several years ago after an adverse tariff revision, which made it uneconomical to import used vehicles into the country. However, in 2011 the auction invoice was once again used for tariff purposes, which made the U.S. an attractive source of used vehicles for Mexican importers. These buyers, unlike those exporting to Europe and the Middle East, often compete with U.S. dealers for the more affordable units.

33 2012 Used Car Market Report
Salvage
Prices for Salvage Vehicles Rise in 2011
Salvage auctions remarket everything from burned-out vehicles to the occasional lightly damaged late model sports car. Across the board – irrespective of condition or title – prices were higher in 2011. However, the factors that influence the value of each vehicle are specific to the ultimate disposition of the unit. Repairable units bring higher prices than the major-ity of the vehicles, which are dismantled into parts and salvageable metals.
At TRA sales, insurance vehicles recovered a rising percentage of actual cash value through the first half of 2011 and then stabilized at a relatively high level for the remainder of the year. Vehicles that will be dismantled and crushed, including the majority of insured units, are valued on the basis of recoverable parts, global metal and commodity prices, the val-ues of used radiators, and, of course, the going rate for auto bodies.
As an economical alternative to a new part, the demand for recovered parts continued to increase in 2011. Higher global commodity prices also resulted in higher prices for crushed auto bodies. The value of crushed auto bodies has risen steadily over the last three years and in 2011 was consistently above the $300 mark until year-end, when prices dipped slightly below that level.
Non-insurance vehicles purchased by dealers and exporters also saw a price increase through-out the year that mirrored the general trend in whole-car auctions.
Salvage Vehicle Buyers Depend on Digital Auctions
TRA vehicles are sold through Simulcast live auctions or at Buy-It-Now prices posted on the TRA and OVE.com websites. Recently, the appeal of Buy-It-Now prices in TRA or OVE channels has seen a big increase.
Sellers are encouraged to place a Buy-It-Now price on all units, especially for those likely to be bought for export. Those customers are usually searching for specific makes and models for an identified customer. The Buy-It-Now price allows the exporter to quote a retail price without the risk of not getting the car in the live auction. Likewise, domestic used vehi-cle dealers also appreciate both online search and Buy-It-Now prices that allow them to acquire vehicles immediately for their lots.
Simulcast auctions allow bidders to inspect vehicles ahead of the weekly sale and also to view the vehicle during the sale, either from photos or directly from the auction lane if the vehicle is drivable. Salvage auction participants embraced digital channels so that Simulcast and online volume represent a much higher percentage of total volume than in whole-car auctions. At TRA, the combined percentage in 2011 exceeded 40%, compared to the 25% of whole cars sold through Manheim digital channels.
Salvage
1
2
3
fromSalvageppt
complete
need data
fromTRA Sales summary png
complete
Whole Crushed Auto Body PricesAverage Price Per Gross Ton
2010 2011
DecJunJan Feb Mar Apr July Aug OctMay Nov
Source: American Recycler Magazine, Marketwatch
Sep
TRA Sales as Percent of ACV*
22%
20%
24%
26%
28%
30%
32%
Jan11
Mar11
Jul11
May11
Nov11
*Actual Cash ValueSource: Total Resource Auctions
Sep11
$150
$200
$250
$300
$350
New Vehicle Sales and ScrappageIn Millions
New Vehicle Sales Scrappage
10 11 12E08 090705 06040301 0298 99 00
Source: RL Polk, Automotive News and Manheim Consulting estimates
10111213141516171819
9

Manheim Consulting: A Unique Resource for the Remarketing Industry
For nearly a decade, Manheim Consulting statisticians, mathematicians, and business analysts have conducted research and performance studies for Manheim clients. Using the data generated from every vehicle listing, every visit to a live or digital auction, every bid, and every outcome, our analytical team helps clients maintain effective remarketing strategies as technology, market conditions, and buyer and seller expectations change.
Client services include:
• Proprietary client research, including remarketing performance studies for dealers;
• Client and industry presentations on economic and used vehicle industry conditions; and
• Case studies and white papers on topics important to remarketing and automotive professionals. (Visit www.manheim.com/consulting and search under the “Presentations” tab.)
The mid-year and full-year Used Car Market Reports examine the economic underpinnings of the entire used vehicle market and sector-specific trends that influence the supply and pricing of used vehicles.
The Manheim Used Vehicle Value Index is the most reliable and widely followed indicator of wholesale used vehicle values. The Index is updated on the fifth business day of each month. In January, April, July, and October, Manheim’s chief economist, Tom Webb, hosts a conference call during which he responds to participant questions and provides supplemental data on the used vehicle marketplace.
For more information on these and other services provided by Manheim Consulting, visit www.manheim.com/consulting.
Technology-based Services A Unique Portfolio of Products and Services for Dealers
Keeping in mind the challenges dealers confront in searching for the vehicles they need in multiple live and digital channels, Manheim developed a suite of online products and services that help dealers more efficiently manage their used vehicle business.
Manheim’s leadership in technology is demonstrated by myManheimEverywhere, a cutting-edge suite of products and services that allow customers to transact with Manheim however, and whenever, they wish.
The myManheimEverywhere portfolio includes: SimulcastEverywhere: Virtual sales from any location with a live auctioneer, enabling real-time bidding and buying;
• myMobile: Access to Manheim products and services via a mobile device;
• myLot: List and sell vehicles from your lot or other location;
• myAccount: Instant access to your payment and financing information; and
• myCentralAuction: Process all transactions in one place at one time.