the used car market report 2012 - university of buckingham
TRANSCRIPT

Centre for Automotive Management The University of Buckingham Business School www.buckingham.ac.uk/cam
The Used Car Market Report 2012
A REPORT BY BCA

The Used Car Market – a report by BCA
3
Foreword
We are delighted to bring you this
22nd edition of the BCA Used Car
Market Report.
This year's research looks at the
effect that continuing financial
pressures are having on private
motorists' decisions on buying and
running their car, and the impact of
prolonged, lower new car volumes
on the used car market.
Our editor, Professor Peter N C
Cooke, the Professor of Automotive Management, the Centre for Automotive
Management at The University of Buckingham is a well-known commentator
on the automotive industry.
Professor Cooke spent over 20 years in the motor industry and has taught,
researched and written about the industry at business schools for a similar
period. He has undertaken much work on the fleet, used car and LCV sectors
and edited the BCA Used Car Market Report for several years.
The Buckingham Automotive team has sought to retain the best aspects of
this long-standing report, and has developed new analysis and commentary
on the changing shape of used car market.
Given the uncertainty surrounding the UK’s gloomy economic outlook, and
the implications for the automotive sectors, the BCA Used Car Market Report
2012 is most timely for everyone involved in the used vehicle industry.
Jon Olsen CEO BCA Vehicle Remarketing

The Used Car Market – a report by BCA 4
Contents
Foreword 3
Introduction 6
Overview
Used car market stable The new car market The used car market Consumer perspective
7
789
10
UK Market Review
Used car volumes continue to rise Used:new car ratios Used car market sectors Dealers’ used car volumes Private sector used car sales UK car market value rises Dealer/private sector used car market value Used car selling prices Used car prices at auction Car parc oldest for quarter of a century Cars being scrapped earlier The ‘parc turn’ indicator Car parc ageing rapidly Company car disposals fall
12
1212121315161718181920212223
Consumer Experience
Part One – What Used Car to Buy? What used car to buy next? 'Crunch Factors' Part Two – Where to Buy From? Which used car retailer to buy from? Buying from franchised and non-franchised dealers Three-quarters of motorists buy a used car Seven out 10 families own a car Hatchbacks and saloons most popular Buying used rather than new? Sales of used diesels fall Used car satisfaction rises once more Part Three – Dealer Relations and Buying Intentions Used car customer follow-up Buying a car in the next year? What type of car to buy next? Where to buy the next car? Part Four – Economic Recovery, Running Costs, and Keeping in Touch What car to buy during economic recovery? Reducing personal motoring carbon footprint Offsetting the rising cost of fuel Steps Taken to Cut Car Running Costs Keeping Customers in the Loop A Good Deal is Still the Critical Factor
25
262627282829293031323233353536363738383940414243

The Used Car Market – a report by BCA 5
Contents
Regional Review
'Friends and Family' Holds More Sway This Year Dealer follow-up calls When to buy the next car? Where to buy the next car? What car to buy next? How satisfied are used car owners? Cutting Back on Running Costs
44
44454646474849
European Overview
New car market EU15 markets New member states Used car volumes Car parc Parc Turn Percentage Used:new volume ratios Used car sales per 1,000 population United Kingdom, Germany. Italy France, Spain
50
50515253545556575859
United Kingdom Economic Situation
The UK Economy – A Macroeconomic Viewpoint Not for the Faint Hearted Mid Year Financial Crisis Do We Have a Plan B? Used Car Market
61
6162646366
Prospects, Buyers and Follow-ups
Tyre-kicking Has Gone Online Social Media Presence A Fickle Mistress Customer Contact – What Is It Really? Car Owners' Preferences What Car To Consider Buying? Strategic Implications
67
67676768697071
LCVs – A Black Hole on the Horizon?
New LCV Sales Plummet Replacing Overage Vehicles The Used LCV Supply Gap Not Yet Critical Emerging Issues for the LCV Industry
72
7273747475
Dealers Need to Face Changes in Consumer Behaviour 76
BCA – Europe's Leading Vehicle Remarketing Company 79
BCA Network 82
Statistical Data 83
Research 97

The Used Car Market – a report by BCA 6
Introduction
The BCA Used Car Market Report 2012 aims to provide the same invaluable insight
into the latest developments in the UK used car industry that each of our previous
editions has done.
The UK Market Review is based on statistical information from national sources. This
is updated and compared with previous years’ data to provide an authoritative
assessment of volume and value trends in the used car market.
The Consumer Perspective section of the report is based on a BMRB International
survey of UK car owners. This contains a review of the key issues that influence used
car buyers when deciding which car to buy, where to buy from and what car owners
expect when buying a used car.
This year, the consumer survey also looked at what type of car motorists might
consider buying as the country's economy struggles to recover, and how high fuel
prices would have to rise before car owners decide to change to a more fuel-efficient
car. Respondents were also asked if they had taken any concerted steps to reduce
their car running costs and how they prefer their used car dealer to keep in contact
with them.
The European section of the Used Car Market Report contains updated trend
information on Europe’s new and used car markets.
Other sections include ‘United Kingdom Economic Situation’ looking at the impact of
the economy on the country's new and used car markets – while 'People, Buyers and
Follow-ups' considers the critical role of communications from used car retailers' and
their customers' point of view.
The report also looks briefly at the used LCV market and the key issues driving this
key automotive sector. The used LCV sector will be examined in more detail in the
forthcoming ‘Used LCV Market Report 2013'.
BCA is pleased to provide this 2012 edition of its Used Car Market Report to all those
associated with the UK automotive industry.

The Used Car Market – a report by BCA 7
Overview
Used car market stable
The severe 2008/2009 economic downturn pushed combined new and used car
volumes below the nine million mark to 8.8 million units in 2008, dipping to 8.3 million
the following year.
Thereafter, combined sales settled at 8.6 million units in 2010 and 2011 as stronger
used car volumes offset the impact of the weaker new car market.
Market volumes new vs. used; 2002 – 2011
2.02.12.42.32.42.62.62.6
2.0 1.9
6.36.7
7.17.47.3
6.87.2
6.6 6.6 6.7
9.79.8
9.29.7
9.4 9.5
8.88.3
8.6 8.6
1
2
3
4
5
6
7
8
9
10
2002 2003 2004 2005 2006 2007 2008 2009 2010 2011
Mill
ions
New Used Total
Source: SMMT/BMRB
Following an 11-year spell comfortably over two million units, new car sales fell to
1.99 million in 2009 – falling back to 1.94 million units in 2011 after a brief recovery
to 2.03 million in 2010.
The UK accounted for 15.2% of Western Europe's new car market in 2011,
compared with 15.6% the previous year – and holds third place in the European new
car sales league ahead of Italy (1.75 million) by 193,000 units.
UK used car volumes dropped during the recession to 6.3 million units in 2009.
Despite a weak and uncertain economy used car volumes rose to 6.6 million in 2010,
edging up to 6.7 million units in 2011.

Overview
The Used Car Market – a report by BCA 8
The new car market
Following six years over the £30 billion mark, the value of the UK new car market
dipped to £28 billion in 2008 and 2009 as new car volumes fell steeply during
recession.
The new car market value recovered to £28.7 billion in 2010 and reached £29 billion
the following year, despite a 90,000 drop in new car volumes in 2011.
New car market volume and value; 2002 – 2011
1.9 1.9
2.1
1.7
2.42.4
2.6 2.6 2.6
2.3
32.4
33.5
32.4 32.2 32.433.0
28.1 28.028.7 29.0
1.0
1.2
1.4
1.6
1.8
2.0
2.2
2.4
2.6
2.8
3.0
2002 2003 2004 2005 2006 2007 2008 2009 2010 2011
Mill
ions
20
25
30
35
£ b
illion
Volume Value Scrappage deals
0.30.1
Source: SMMT//BMRB
Despite the boost from 285,000 scrappage deals, new car registrations fell steeply to
1.99 million units in 2009, and have failed to improve significantly since. 2011 saw
new car volumes slip 4.4% to 1.94 million compared with 2010's figure of 2.03 million
units.
Private sector new car sales dropped 14.1% and 134,911units to 823,094 in 2011.
New car sales to the 25-plus fleet sector broke through the one million mark once
more last year, rising 4.7% to 1.02 million units, pushing this sector's new car market
share up to an all-time high of 52.5%.
As high prices of fuel, food, household essentials and high unemployment continue to
erode car buyers' confidence and spending power, new car volumes remain relatively
weak in 2012 – edging up 2.7% on 2011's low base to 1.06 million for the first six
months of the year – still some 15% below 2007's pre-recession level.
However, the SMMT believes the new car market is stabilising, with the 12-month
running total of 1.97 million units, at the end of June 2012, some 30,000 above
2011's full year figure. It predicts the UK's new car market will rise 1.6% to 1.97
million in 2012 – and by a further 1.0% to 1.99 million units in 2013.

Overview
The Used Car Market – a report by BCA 9
The used car market
UK used car sales topped seven million for four out of five years from 2003, falling
back to 6.3 million units in 2009 as recession hit the used car market hard. While
hopes of an economic recovery saw used car volumes rise to 6.6 million in 2010,
growth slowed to 6.7 million units in 2011 as the economy headed towards a double-
dip recession. UK used car market values edged upwards in 2011 to a new high of
£35.7 billion.
Used car market volume and value; 2002 – 2011
6.7
6.3
7.1
7.47.3
6.8
7.2
6.6 6.66.7
28.1
32.0
30.0
32.3
33.933.3
32.4
34.235.0
35.7
4
5
6
7
8
2002 2003 2004 2005 2006 2007 2008 2009 2010 2011
Mill
ions
20
25
30
35
40
£ billion
Volume Value
Source: BMRB
Stronger supply and sales of 6-8 year-old cars saw used car market volumes grow by
118,000 units to 6.69 million in 2011, as weaker supply from lower new car sales
continued to hamper sales of younger used vehicles.
Dealers' and private sector used car volumes both grew in 2011 – the former's up 2%
to 3.74 million and the latter's 7% higher at 2.63 million units.
Sales of cars in the 0-2 year age group dropped 9.5% to 642,000 units in 2011 –
this segment's share of the market down to 9.6% from 10.8% the previous year.
Sales of 3-5 year-old cars fell by 6.2% to 1.73 million units, their used car market
share slipping 2.2% to 25.8%.
The 6-8 year age group's sales volumes continued to rise in 2011, up 7.4% and
124,000 to 1.79 million units, their share of the market 1.4 points higher at
26.8% – boosted by high volumes of new cars sold in the first half of the 2000s.
Sales of 9 years-plus cars grew for the second year running, rising by 7.5% to
2.53 million and 37.8% of the used car market.
Overview
The Used Car Market – a report by BCA 10
Consumer perspective
Twenty-four per cent of this year's consumer survey's respondents had bought a car
over the past two years, three-quarters of them choosing to buy a used car instead of
a new vehicle.
'Views of friends and family' (24%) edged 'personal experience of make and
model' (21%) into second place amongst the issues motorists consider when
thinking about what used car they might buy next. ‘Independent Internet sites'
were a factor with 16% of used cars buyers, while 'used car sites/showrooms'
(12%) and 'dealers' websites' (10%) are also significant factors.
'Price' (41%), 'low mileage' (31%) and 'make and model', cited by 30% of car
owners, are 'crunch factors' in deciding which particular used car to buy –
although 'engine size' (18%) and 'body type' (17%) are also key factors.
Affordability tops motorists' priorities when deciding which used car retailer to
buy a car from. 'I got a good deal on the car' was the number one issue for a
third of survey respondents, followed by 'the right car at the best possible price'
for three out of 10 used car buyers. A fifth of used car owners look to 'trade in'
their existing car and prefer to do business with a 'local dealer'.
Diesel-engined cars’ used car market share dipped to 33% in 2012 from 34% in
2011 and 36% in 2010 – as fewer fleet vehicles from 2009's low new car
volumes reached the marketplace and private used car buyers looked towards
smaller, petrol-driven models.
Owners' satisfaction with their used car rose two points to 95% this year – 67%
of them saying they were 'very satisfied', while 28% were 'quite satisfied' with
their latest used vehicle.
This year's report shows a marked drop in the number of car owners who believe
they will 'certainly' or 'quite likely' buy a used car in the next 12 months – down
3% to 11% in 2012 from 14% the previous year. The number of motorists who
believe there is a '50:50 chance' they will buy a car in the next year edged up
one point to 9%.
Three-quarters of car owners plan to replace their car with a used one next time
they make a change. However, there has been a swing of 4% towards diesel this
time – 30% of prospective used car buyers saying they intend to go in this
direction – a long way short of diesels' current 50% share of the new car market.
The number of car owners saying they will deal with a franchised dealer next time
rose by 5% to 50% in this year's survey, half of them trading in their old car.
Thirty per cent of motorists plan buying privately or from a friend, while 13% are
considering doing business with a non-franchised used car retailer.

Overview
The Used Car Market – a report by BCA 11
Faced with a gloomy economic outlook, nine out of 10 motorists intend to
replace their car with a different type of vehicle next time. Top of their shopping
list are 'a car with better fuel consumption', 'lower road tax', 'a smaller car',
'best purchase price' and 'lower CO2' – all things that used car buyers have a
great degree of control over.
'Walking more often' and 'cutting the number of journeys' top the list of
measures motorists have in mind to cut their personal CO2 – with other steps
such as 'driving more slowly', 'reducing annual mileage', 'buying a car with lower
emissions' and 'buying a smaller car' also in the frame.
Over half of this year's respondents (53%), believe the higher price of fuel will
eventually push them into 'buying a more fuel efficient vehicle' or 'change their
driving habits' – or both
Car owners show a clear preference for receiving the least invasive type of
communication from the dealer they bought their used car from; ones they can
read and absorb when it suits them and not the sender. Email leads the field in
this respect, cited by a fifth of survey respondents as their preferred means of
contact, followed by letters/mailing then websites.
Evolution or revolution?
The Overview points to an automotive industry in evolution, some would claim closer
to revolution on a number of fronts;
The second recession in under four years, and the prospect of an agonisingly
slow economic recovery is reflected in prolonged low new car market volumes –
'starving' the used car market of younger, lower mileage units – with no prospect
of a significant upturn in sight.
Younger used car availability will become much tighter before it improves, with
the pent-up demand for younger and middle-aged used cars increasingly difficult
to satisfy for some considerable time to come.
Diverging private sector and business new car buyer patterns mean the mix of
cars that will ultimately enter the used car market will differ significantly from the
historic stock profile with associated revenue and profit implications.
New and used car markets appear to have become increasingly price sensitive in
recession which, in turn, will put increased pressure on 'value for money' - and
dealer margins.
Perhaps dealers may have to rethink car buyers' affordability in terms of selling
new or used cars, and consider the product offering more in terms of monthly
payments than a one-off capital price?

The Used Car Market – a report by BCA 12
UK Market Review
Used car volumes continue to rise
2011 saw car buyers'
confidence and incomes
eroded by a powerful mix of
high inflation, escalating fuel
costs, rising unemployment
and an economy heading
towards a double-dip
recession.
This saw new car sales fall
4.4% to 1.94 million last
year – around a half a
million units lower than pre-
recession market volumes.
A rise of 1.8% in used car volumes to 6.7 million units and flat used car selling prices
saw the used car market value edge up £0.7 billion to a new high of £35.7 billion last
year.
Used:new car ratios
The ratio of used car sales to new car sales rose
for the second year running in 2011 to 3.4:1, as
used car volumes increased to 6.7 million and
new car volumes dropped 90,000 to 1.94 million
units.
Used car market sectors
Rising sales of 6-8 year-old
cars helped used car
volumes rise by 1.8% and
118,000 units to 6.7 million
as sales of cars in the 0-2
and 3-5 year age groups
slipped further in 2011.
Dealers' and the private
sector's used car sales both
grew in 2011 – dealers'
volumes up 2% to 3.74
million and private sales 7%
higher at 2.63 million units.
Car volume trends; 2007 – 2011
2.42.1 2.0 2.0 2.0
7.16.7
6.36.6 6.7
0
1
2
3
4
5
6
7
8
2007 2008 2009 2010 2011
Mill
ions
New Used
Source: SMMT/BMRB
Used:new car ratios; 2007 – 2011
2007 3.0:1
2008 3.2:1
2009 3.2:1
2010 3.3:1
2011 3.4:1
SMMT/BMRB
Volume of used car sales by source; 2007 – 2011
0.4
2.7
4.0
7.1
0.4
2.7
3.6
6.7
0.6
2.2
3.5
6.3
0.5
2.4
3.7
6.6
0.3
2.6
3.7
6.7
0.0
1.0
2.0
3.0
4.0
5.0
6.0
7.0
8.0
Mill
ions
2007 2008 2009 2010 2011
Other/Auction Private Dealers Total
Source: BMRB
The used car market edged up to a new high of £35.7 billion

UK Market Review
The Used Car Market – a report by BCA 13
Looking at the age profile of used cars sold in 2011 shows the market continues to
change:
Sales of cars in the 0-2 year age group fell for the third year running in 2011, by
9.5% to 642,000 units, pushing this segment's share of the used car market
down to 9.6% from 10.8% the previous year.
Sales of 3-5 year-old cars also dropped last year, by 6.2% to 1.73 million units,
their used car market share slipping 2.2% to 25.8%.
Used car market volume by age of car; 2007 – 2011
642710
989 978
762
1725
1840188418821949
1632 15831481
1793
1669
2489
2208 2174
25292352
500
1000
1500
2000
2500
3000
2007 2008 2009 2010 2011
Tho
usan
ds
0-2 3-5 6-8 9+ yrs
Source: BMRB
Sales of cars in the 6-8 year age group continued to rise in 2011 by 7.4% and
124,000 units to 1.79 million, driving this sector's market share up 1.4 points to
26.8% – as record high volumes of new cars sold in the first half of the 2000s
bolstered supply in this segment of the used car market.
9 years-plus used car volumes grew for the second year, rising 7.5% to 2.53
million and 37.8% of the used car market.
Dealers’ used car volumes
Stronger sales of 6-8 year-old cars helped used car retailers' volumes grow 2% to
3.74 million units in 2011, their share of the market remaining at 55.9% (see overleaf).
Dealers' sales in the 0-2 year age group slipped by 1.5% to 535,000 units, but
their share of this segment rose to 83.3% in 2011.
Dealers' 3-5 year-old used car volumes rose by 1.8% and 23,000 to 1.33 million
units, their share of this sector reaching a three-year high of 76.8%.
Sales of cars in the 6-8 year age group continued to rise in 2011

UK Market Review
The Used Car Market – a report by BCA 14
Dealers’ used car volumes and market share; 2002 – 2011
3.57
3.87
3.66
3.874.01 3.97
3.613.53
3.673.74
55.955.856.0
54.3
56.3
54.8
53.353.653.654.3
2.0
2.5
3.0
3.5
4.0
4.5
5.0
2002 2003 2004 2005 2006 2007 2008 2009 2010 2011
% M
arket share
40
45
50
55
60
Mill
ions
Millions Market share
Source: BMRB
While dealers' sales of cars in the 6-8 year age group rose for the second year in
2011, their share of this segment slipped 0.9% to 62.8% as retailers faced fierce
competition in this buoyant sector of the market.
Dealers’ used car volume by age of car; 2007 – 2011
663
856
854
543 535
15421462
13581302 1325
1063 11261034
780
965
759 755
473513
606
0
200
400
600
800
1000
1200
1400
1600
1800
2007 2008 2009 2010 2011
Tho
usan
ds
0-2 3-5 6-8 9+yrs
Source: BMRB
Used car retailers' share of the 9 years-plus group fell to 29.9% in 2011, their
volumes dropping 0.5% to 755,000 as a growing number of buyers turned to
private sources for cheaper cars.

UK Market Review
The Used Car Market – a report by BCA 15
Dealers' used car sales
continued to edge towards
older cars. As new car
volumes feeding the market
settled around two million
units for the fourth
successive year in 2011,
retailers were forced to look
to older units for adequate
used car supply.
Sales of 0-2 year-old cars
now account for just 14% of
dealers' used car volumes,
while sales of cars in the 6-8
year group account for 30% of their used car business compared with 24% five years
earlier.
Private sector used car sales
Higher volumes in the 6-8 year group (+15.9%) pushed the private sector's used car
volumes up 7% to 2.63 million units in 2011 – its share of the used car market rising
1.9 points to 39.3%.
Private to private used car volumes by age of car; 2007 – 2011
609399 65 47
281278317
326313
598708
348
513442
16441774
15061594
1703
0
200
400
600
800
1000
1200
1400
1600
1800
2000
2007 2008 2009 2010 2011
Tho
usan
ds
0-2 3-5 6-8 9+yrs
Source: BMRB
The private sector's sales of 0-2 year-old cars dropped by 33,000 units to
60,000 units in 2011, its share of this segment dipping to 9.4%.
Volume share of dealers’ used car sales, by age of car 2011
6-8 years30%
3-5 years36%
0-2 years14%
9+years20%
Source: BMRB
Retailers were forced to look to older units for adequate used car supply

UK Market Review
The Used Car Market – a report by BCA 16
While private-to-private sales of 3-5 year-old cars rose by 3,000 to 281,000 units
last year, their share of the sector slipped from 11.3% to 10.7% year on year, as
dealers fought hard for supply in a sector weakened by ongoing low new car
volumes.
The private sector’s sales of cars in the 6-8 year age group rose 15.9% and
70,000 to 513,000 units, taking 28.6%of this segment compared with 26.5% the
previous year.
Private-to-private 9 years-plus used car volumes grew by 130,000 units to 1.77
million last year, their market share edging up to 70.2% from 69.9%.
The unpredictable supply of quality, 0-5 year-old cars saw used car retailers focusing
more on vehicles in the 6-8 year age group, where there is currently a stronger supply
from the high new car volumes in the early 2000s.
Last year a struggling economy heading for a double-dip recession, falling family
incomes, high unemployment and stubbornly high inflation, saw consumer confidence
hit hard and more used car buyers turn to older, cheaper used cars.
UK car market value rises
The total value of the UK's new
and used car markets rose by £1
billion to £64.7 billion in 2011, as
higher used car volumes offset a
drop in new car sales – some way
short, though, of the pre-recession
high of £66.3 billion reached in
2007.
While new car volumes fell by 4.4%
last year, a move towards larger
cars and prestige marques (SMMT registration data) saw the value of the new car
market edge up £0.3 billion to £29 billion.
Higher used car volumes made up for flat average used car selling prices – reflecting
an ageing mix of used car sales. This helped push the value of the used car market
up £0.7 billion to a new high of £35.7 billion last year – £6.7 billion higher than the
new car market value.
New and used car market values; 2007 – 2011
£ billions 2007 2008 2009 2010 2011
New 33.0 28.1 28.0 28.7 29.0
Used 33.3 32.4 34.2 35.0 35.7
Total 66.3 60.5 62.2 63.7 64.7
Used % * 50.2 53.6 55.0 54.9 55.2
* as % of total market value
Source: BMRB
The value of new and used car markets rose to £64.7 billion in 2011

UK Market Review
The Used Car Market – a report by BCA 17
Dealers/private sector used car market value
Dealers' used car market value edged up £0.3 billion to £26.8 billion in 2011, higher
used car volumes counteracting lower selling prices from the ageing used car sales
profile. The private sector's market value also increased, by £0.6 billion to £7.4 billion
last year, a combination of higher volumes and selling prices.
Value of used car sales by source; 2007 – 2011
1.7 1.4 1.7 1.53.4
7.05.9 5.66.8 7.4
25.724.0
25.226.5 26.8
33.3 32.434.2 35.0 35.7
0
5
10
15
20
25
30
35
40
2007 2008 2009 2010 2011
£ B
illio
ns
Other/Auction Private Dealers Total
Source: BMRB
Share of used car market value; 2002 – 2011
76.374.274.7 75.3 75.5 75.175.673.774.077.0
21.3 19.5 18.2 17.8 17.6 17.721.6
16.419.3 20.7
0
10
20
30
40
50
60
70
80
90
2002 2003 2004 2005 2006 2007 2008 2009 2010 2011
%
Franchised/non-franchised Private to private
Source: BMRB
Franchised and non-franchised used car dealers retained their three-quarters share
(75.1%) of used car market value in 2011; the private sector's share rising to 20.7%,
as fewer used car buyers resorted to auction or other sources last year.

UK Market Review
The Used Car Market – a report by BCA 18
Used car selling prices
Overall average used car selling prices remained flat at £5,336 in 2011, compared
with £5,332 the previous year, Dealers’ average used car selling prices slipped from
£7,295 to £7,169, while the private sector's average used car prices edged up £66 to
£2,815.
The chart below shows the relationship between dealers' used car selling prices and
the Retail Price Index (RPI) over a 20-year period. While the two indices have followed
much the same trend over this time span, dealers' selling prices tend to be lower
than RPI during periods of economic downturn and credit restrictions.
Average dealers' used car selling prices; 1998 - 2011
164.8162.1
223.9
199.2
147.3142.8
139.5134.8
131.6129.6
124.9
118.0
107.8
152.4154.7
159.3
174.6169.6
179.6185.3
193.3
203.9
213.7
203.6
186.0
148.4
138.6
117.4 103.7
120.9
120.6
121.3
132.8
101.4
162.4158.1
164.5163.0166.7
174.1177.5
178.3178.0183.6
202.9
207.2
100
110
120
130
140
150
160
170
180
190
200
210
220
230
1988
1989
1990
1991
1992
1993
1994
1995
1996
1997
1998
1999
2000
2001
2002
2003
2004
2005
2006
2007
2008
2009
2010
2011
RPI Dealers' used car selling price
Source: BCA
The gap between selling prices is currently wider than any point since 1990. Is this a
sign of the length and depth of the current recession, price sensitivity or a shift
towards older used cars?
Given the forecasts of at least a further 18 months of economic woes, it could be
some time before the two indices converge once more – although this will be helped
by the significant fall in the RPI index, which dropped from 5.5% to 2.8% over the
past 18 months, and is expected to fall further.
Used car prices at auction
Average used car prices at auction fell steeply during recession to £4,836 at the end
of 2008. They made a strong recovery during 2009 and 2010 reaching £6,451 in
December 2011 – a rise of £1,515 over the three year period.
Average used car selling prices remained flat at £5,336

UK Market Review
The Used Car Market – a report by BCA 19
Average used car prices at auction; 2009 – 2012
£5,9
38
£5,7
92£5
,792 £5
,905
£5,9
74£5
,985
£5,7
52£5
,626 £5
,790
£5,6
62£5
,633
£5,8
88£6
,252
£5,9
63
£6,2
01£6
,451
£6,0
40£6
,244
£5,9
74
£5,5
99£6
,098
£5,9
64
£5,9
05
£5,7
84£5
,802
£5,6
56£5
,871
£5,7
91£5,9
59£5
,939
£6,1
88£5
,903£6
,021£6
,217
£6,2
23
£6,0
28£5
,850
£5,1
36£5
,571
£5,5
82£5
,641 £5
,773
£4,000
£4,500
£5,000
£5,500
£6,000
£6,500
£7,000
Jan-09
Mar May July Sept Nov Jan10
Mar May July Sept Nov Jan-11
Mar May July Sept Nov Jan-12
Mar May
Source: BCA
Apart from a seasonal blip in April, auction prices remain firm in 2012; fleet and lease
values reaching a record high of £8,042 in June this year – even though the average
fleet car sold had recorded 3,000 miles more than those coming to market 18 months
earlier. Good quality vehicles remain in short supply in the fleet sector and buyers
continue to focus on quality and value, while competition for the best vehicles is
fierce.
The rise in average values at the 'value-for-money' end of the market reflects the
squeeze on household budgets and the increased demands from motorists for
affordable transport.
However, the supply side of the auction market cannot be overlooked. There have, at
times, been supply constraints of the best, retail quality cars which, in a competitive
remarketing environment, are contributing to the general strength in auction values.
Cars in parc oldest for quarter of a century
The UK car parc rose steadily for decades to 30.2 million in 2007, settling around
that level since as new car market volumes fell to two million units in 2009 and have
failed to recover from that point.
The average age of cars in the parc, which had fallen to a 14-year low of 6.69 years
in 2004, has climbed to 7.44 over the past six years – the highest figure for over a
quarter of a century (see overleaf). The average age of cars in the parc will reach new
heights over the next few years as the bulge of new cars sold in the early 2000s head
for the 10-years plus mark – and will only decrease when new car volumes
substantially exceed two million units for several years.
Fleet and lease auction values reached a record high of £7,934

UK Market Review
The Used Car Market – a report by BCA 20
UK car parc – average age of car; 2002 – 2011
30.430.330.130.330.229.0 29.4 29.8 29.9
28.5
7.25
7.06
6.88
6.706.78
6.69 6.786.79
6.93
7.44
10.0
15.0
20.0
25.0
30.0
35.0
2002 2003 2004 2005 2006 2007 2008 2009 2010 2011
Mill
ions
5.00
5.50
6.00
6.50
7.00
7.50
Averag
e age
Millions Average age
Source: SMMT
Cars being scrapped earlier
The number of
cars running until
the 12-year mark
rose to 75.3% at
the end of 2011,
from 71.7% the
previous year, as
most of the
400,000 ten-years-
plus units, traded
in under the
scrappage scheme
in 2009/2010,
were replaced by
younger cars.
Cars continue to
be scrapped
earlier; only 36.1% of them on the country's roads at the 15-year point compared
with 40% ten years earlier.
UK car parc survival rate; 2011 vs. 2002
30
40
50
60
70
80
90
100
1 2 3 4 5 6 7 8 9 10 11 12 13 14 15
Years
Sur
viva
l rat
e %
2011 2002
Source: SMMT Cars continue to be scrapped earlier

UK Market Review
The Used Car Market – a report by BCA 21
The ‘parc turn’ indicator
The ‘parc turn’
indicator, which
expresses annual
new and used car
volumes as a
percentage of the
UK car parc, is a
useful way of
monitoring car
sales trends.
The overall ‘parc
turn’ slipped from
28.4% in 2010 to
28.3% in 2011, 5.5
points below
2003's figure when
new and used car sales were both at a peak. This was due to flat new and used car
volumes of 8.6 million and the car parc rising 0.1 million to 30.4 million units.
The new car parc turn fell to 6.3% in 2011 from 6.6% the previous year, reflecting a
drop of 4.4% and 90,000 units in new car volumes.
In contrast, an
increase of 1.8%
(118,000 units) in
used car sales saw
the used car parc
turn rise marginally
to 22%.
Franchised and
non-franchised
dealers' slice of the
used car parc turn
edged up to 12.2%
last year, while the
private-to-private
sector's share rose
0.5 points to 8.6%.
Car parc turn; 2002 – 2011
23.522.1
20.921.8 22.0
24.824.523.2
24.823.1
6.36.66.66.97.97.78.08.89.09.1
28.328.427.629.0
31.532.3
33.832.0 32.532.5
0
5
10
15
20
25
30
35
2002 2003 2004 2005 2006 2007 2008 2009 2010 2011
%
Used % parc New % parc Total
Source: SMMT/BMRB
Dealer vs. private sector used car parc turn; 2002 – 2011
13.2
11.911.6
12.1 12.2
13.7
13.112.6
13.5
12.5
8.68.1
7.3
8.98.9
9.710.1
9.6
10.3
9.5
5.0
7.5
10.0
12.5
15.0
2002 2003 2004 2005 2006 2007 2008 2009 2010 2011
%
Dealer % of parc Private % of parc
Source: SMMT/BMRB
The overall 'parc turn' slipped from 28.4% in 2010 to 28.3% in 2011

UK Market Review
The Used Car Market – a report by BCA 22
Car parc ageing rapidly
While the car parc is destined to settle around the 30 million mark for at least the
next three years, the average age of cars on the country's roads has increased
rapidly. This will continue to do so as current new car volumes flat line around two
million units and cars from record new car sales in the early 2000s are approaching
the 10-years plus mark.
The used car
supply chain is
essentially a
funnel; new cars
feed into the top of
the funnel and flow
down to ultimately
become used cars,
changing hands
four times on
average before
they are scrapped
(source SMMT).
It's stating the
obvious, if the flow of new cars slows down markedly for some considerable time,
this has a dramatic impact on the supply of younger used cars available to be sold.
The effect of the last four years' low new car volumes, and similar low forecasts, is
shown in the following chart which illustrates the striking change in the volumes of
cars in the various age group segments.
UK car parc segments; 2000 – 2015
4.344.07
3.893.853.823.883.984.38
4.584.624.865.055.155.09
4.754.42
5.74
5.795.866.056.19
6.546.847.01
7.297.557.567.28
6.856.57
6.436.25
5.87
6.226.566.856.81
7.087.317.31
7.056.65
6.396.266.085.79
5.535.29
14.9514.6714.24
13.6513.55
12.80
11.9511.60
11.2611.0610.9410.7810.9011.0311.0911.22
2015
2014
2013
2012
2011
2010
2009
2008
2007
2006
2005
2004
2003
2002
2001
2000
Millio
ns o
f ca
rs
0-2 years 3-5 years 6-8 years 9+ years
Source: SMMT/Buckingham
UK new car sales; 2000 – 2015
0.28
0.11
2.34
2.22 2.20
1.94
1.921.71
2.13
2.40
2.57
2.442.46
2.56 2.58
2.10
1.952.00
1.0
1.2
1.4
1.6
1.8
2.0
2.2
2.4
2.6
2000
2001
2002
2003
2004
2005
2006
2007
2008
2009
2010
2011
2012
2013
2014
2015
Mill
ions
of
cars
New car sales Scrappage deals New car sales forecast
2.031.99
Source: SMMT/Buckingham
Used cars change hands four times on average before they are scrapped
UK Market Review
The Used Car Market – a report by BCA 23
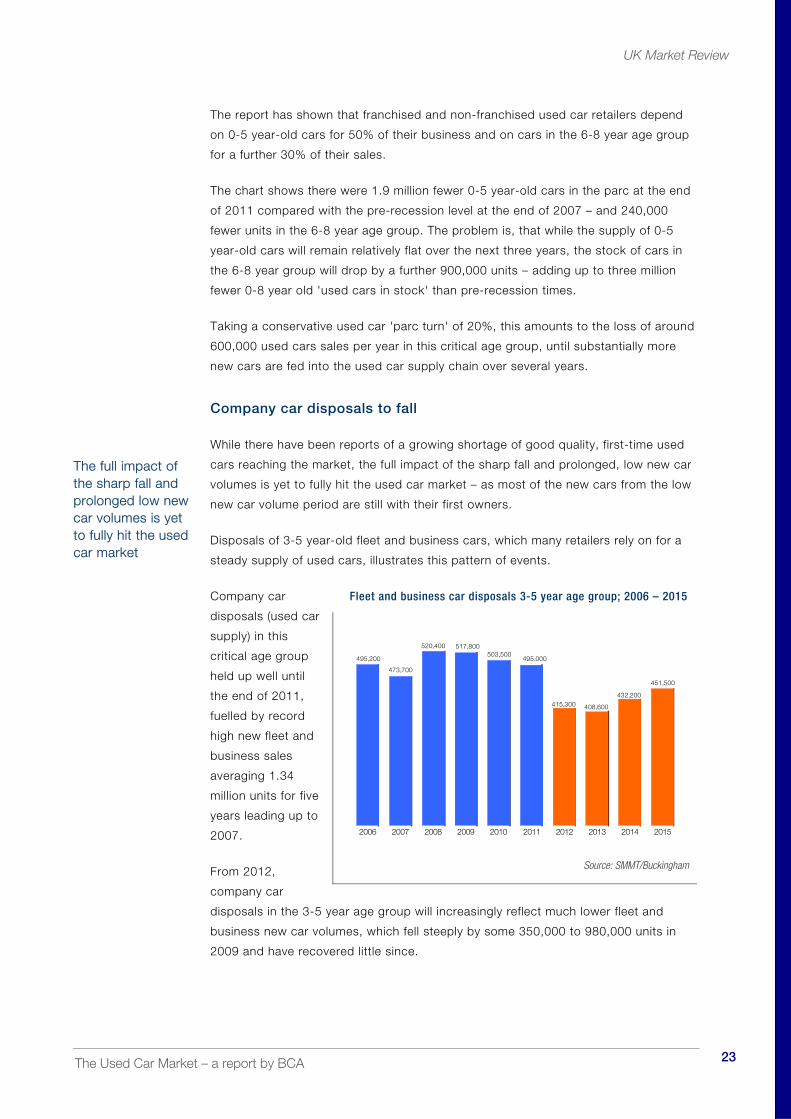
The report has shown that franchised and non-franchised used car retailers depend
on 0-5 year-old cars for 50% of their business and on cars in the 6-8 year age group
for a further 30% of their sales.
The chart shows there were 1.9 million fewer 0-5 year-old cars in the parc at the end
of 2011 compared with the pre-recession level at the end of 2007 – and 240,000
fewer units in the 6-8 year age group. The problem is, that while the supply of 0-5
year-old cars will remain relatively flat over the next three years, the stock of cars in
the 6-8 year group will drop by a further 900,000 units – adding up to three million
fewer 0-8 year old 'used cars in stock' than pre-recession times.
Taking a conservative used car 'parc turn' of 20%, this amounts to the loss of around
600,000 used cars sales per year in this critical age group, until substantially more
new cars are fed into the used car supply chain over several years.
Company car disposals to fall
While there have been reports of a growing shortage of good quality, first-time used
cars reaching the market, the full impact of the sharp fall and prolonged, low new car
volumes is yet to fully hit the used car market – as most of the new cars from the low
new car volume period are still with their first owners.
Disposals of 3-5 year-old fleet and business cars, which many retailers rely on for a
steady supply of used cars, illustrates this pattern of events.
Company car
disposals (used car
supply) in this
critical age group
held up well until
the end of 2011,
fuelled by record
high new fleet and
business sales
averaging 1.34
million units for five
years leading up to
2007.
From 2012,
company car
disposals in the 3-5 year age group will increasingly reflect much lower fleet and
business new car volumes, which fell steeply by some 350,000 to 980,000 units in
2009 and have recovered little since.
Fleet and business car disposals 3-5 year age group; 2006 – 2015
495,200
473,700
520,400 517,800503,500
495,000
415,300 408,600
432,200
451,500
2006 2007 2008 2009 2010 2011 2012 2013 2014 2015
Source: SMMT/Buckingham
The full impact of the sharp fall and prolonged low new car volumes is yet to fully hit the used car market

UK Market Review
The Used Car Market – a report by BCA 24
This will see company car disposals in this key age sector drop substantially over the
next two to three years, some 100,000 units lower than the peak of 520,000 reached
in 2008 – until such time as new fleet and business car volumes stage a marked
recovery.
Should the economy begin to show signs of recovery and/or car owners can't hold on
to their old car any longer, the growing shortage of younger used cars will become
more apparent as consumer demand rises.
Some initial conclusions
The UK Market Review portrays an industry in the midst of a long-term economic
downturn, with the impact of a lengthy period of low new car volumes flushing
through the used car supply chain. The impending and prolonged shortage of
younger used cars coming to market will take something like a decade to pass
through the system.
The following points might be considered:
Perhaps the strongest single message from this section of the report is the steep
climb in the average age of cars in the UK car parc. It has reached the highest
point for at least a quarter of a century at 7.44 years – up from 6.69 in 2004.
Could the average age of cars in the parc surpass eight years before it turns
around?
The used car market accounts for more than 55% of the value of car sales in the
United Kingdom and is £6.7billion greater than the new car market.
A change in buying patterns away from new cars to used cars as private buyers
seek to retain a ‘younger car’, but avoiding the greater expense of buying a new
one.
An increase in private-to-private sales suggests some sellers are seeking to cut
out the middleman or can no longer afford a younger vehicle.
The implications from the UK Market Review are significant in terms of franchised
dealer operations with less focus on new car sales and greater profit opportunities
from their used car activities. There is also a strong likelihood of reduced service
opportunities as the car parc continues to age, given that motorists tend to switch to
non-franchised outlets for maintenance when their car's warranty finishes.
The average age of cars has reached the highest point for a quarter of a century at 7.44 years
The Used Car Market – a report by BCA 25
The Consumer Perspective
The Consumer Perspective section of the BCA Used Car Market Report looks at the
pattern of car ownership in the UK and the key issues that motorists take into
account when deciding what used car to buy and where to buy from.
BCA commissioned BMRB International to carry out face-to-face interviews with
4,000 car owners in the UK to identify their preferences and experiences in buying
and owning a used car – what persuaded them to buy their latest used car, what
influenced their choice of seller, what type of car they might buy next time they make
a change, where they might buy it, and when.
This year, the consumer research also looked at what type of car motorists might
look for during the current economic uncertainty, and how high the price of fuel
would need to be before they would think about buying a more fuel-efficient car
and/or changing their pattern of driving. Car owners were also asked if they had
taken any concerted steps to reduce their car running costs and how they prefer the
dealer they bought their car from to keep in touch with them.
Fieldwork for the BMRB consumer research took place during late March 2012.
The Consumer Experience section is split into four parts;
What Used Car to Buy? – looks at the issues which influence used car buyers’
decision on what car to consider buying and the crunch factors when deciding which
particular used car to buy.
Where to Buy From? – this part of the report considers what factors influence car
owners when choosing which dealer to buy their used car from, and what matters
most when buying from a franchised or non-franchised used car retailer. It also looks
at the pattern of car ownership in the country, why motorists buy a used car instead
of a new one, the type of used car they decided to buy – and how satisfied they are
with their purchase.
Dealer Relations and Buying Intentions – looks at used car retailers’ ongoing
relationship with their customers, when motorists might next be in the market for
another car, what type of car they plan to buy next and where they might buy from.
Fuel Prices, Economic Uncertainty and Car Running Costs – assesses what type
of car motorists might buy next time in the face of financial pressures and ongoing
economic uncertainty, and how they might combat the rising cost of fuel. It also looks
at what steps car owners have already taken to cut their motoring costs and what
they are prepared to do to cut their personal carbon footprint.
Car owners were asked if they had taken steps to reduce their car running costs

The Consumer Perspective
The Used Car Market – a report by BCA 26
Part One – What Used Car to Buy?
What used car to buy next?
For the first time, 'views of friends and family', cited by 24% of car owners in this
year's survey, edged 'personal experience of make and model' (21%) into second
place when motorists thought about what used car they might buy next.
Influences on type of used car considered
2
4
4
4
6
6
8
8
8
10
12
15
21
24
16
Social media
Car TV shows
Dealer advice
Specialist motor mags
Car TV ads
General car mags
Newspaper adverts
Cars on street
Consumer reports
Dealer websites
Used car physical sites
Test drive
Independent Internet sites
Personal experience
Family & friends %
Source: BMRB
The influence of ‘independent Internet sites' increased from 12% to 16% of used cars
buyers this year, while 'used car sites/showrooms' (12%) and 'dealers' websites'
(10%) also had a part to play helping some used car shoppers decide which used car
to look for.
As in previous surveys, used car buyers are much less likely to be influenced by
'general car magazines', 'car TV adverts', 'dealer advice' or 'car TV shows', whilst
very few car owners felt 'social media' (Facebook or Twitter) could help their used car
buying deliberations.
Women (28%) depend more on the 'views of friends or family' than men (20%), who
rely on a blend of 'personal experience of make and model' (21%) and 'independent
car Internet sites' (16%) to settle on what car they might buy next.
While 'independent dealer websites' are important to a fifth of car buyers in the 25-34
year age group, they are not on 65 years-plus motorists' radar (5%). 'Consumer
reports' are of more interest to wealthier car owners and owners of cars in the
£15,000 plus band, who are also influenced more than others by a blend of 'personal
experience', 'test drive', 'used car showrooms/sites' and 'dealer advice'.
The influence of 'independent Internet sites' increased this year

The Consumer Perspective
The Used Car Market – a report by BCA 27
'Crunch factors'
'Price' (41%), 'low mileage' (31%) and 'make and model', mentioned by 30% of
respondents, are firmly established as 'crunch factors' in deciding which particular
used car to buy – although 'engine size' (18%) and 'body type' (17%) can make the
difference on some occasions.
Critical factors in choosing a used car
41
31 30
1817
1412
108 8 7
3
0
5
10
15
20
25
30
35
40
45
%
Price
Low m
ileag
e
Mak
e/m
odel
Engine
size
Body t
ype
Age
Fuel
optio
n
Insur
ance
Specific
ation
Safety
Colour
Enviro
nmen
tal
Source: BMRB
Men and women have much the same views on the top-three 'crunch factors',
although 'age of vehicle' has more influence with women (18%) than men (11%).
However, the opposite is true for 'body type', cited as a factor by 19% of men but
just 14% of women.
While 'price' outstrips all other considerations for 56% of 17-24 year-olds and 50% of
low-income used car buyers, it only matters to three out of 10 older and wealthier car
owners who are more interested in the 'age of vehicle' and 'specification'.
‘Price’, which remains a top priority for half of motorists who bought a car for less
than £3,000, only makes a difference to a fifth of car buyers with cars in the £10,000
to £15,000 band and a quarter of those with cars priced over that mark. Owners of
cars costing more than £10,000 were more influenced by a mix of 'low mileage',
'make and model of vehicle', 'body type', 'age of vehicle and 'fuel option' that best
met their expectations.
Men and women have much the same views on the top-three 'crunch factors'

The Consumer Perspective
The Used Car Market – a report by BCA 28
Part Two – Where to Buy From?
Which used car retailer to deal with?
Affordability tops motorists' priorities when deciding which used car retailer to buy a
car from. 'I got a good deal on the car' topped the shopping list for a third of survey
respondents, followed by 'the right car at the best possible price', which was in the
frame for three out of 10 of last year's used car buyers. A fifth of used car owners
look to 'trade in' their existing car and prefer to do business with a 'local dealer'.
Factors influencing choice of dealer
1
2
2
3
3
4
7
7
9
10
11
12
13
14
19
19
29
33
Dealer contact
Showroom facilities
Internet/onlline
Read about dealer
Low finance
Quick delivery
Easy negotiation
Aftersales
Recommended
Bought before
Wide choice
Friendly,helpful
Warranty
Reliable, trustworthy
Local
Trade-in
Right car, price
Good deal %
Source: BMRB
Dealer experience is also a prominent aspect of the buying process, in the form of
'the dealer appeared reliable and trustworthy' (14%) and 'staff are friendly, helpful
and professional', mentioned by 12% of used car owners.
There is little difference in men's and women's buying priorities in this year's survey.
Getting 'the right car at the best possible price' far outweighs all other considerations
for young used car buyers, who also rely more heavily on the 'dealer appeared
reliable and trustworthy' (32%).
The chief concern for two out of five wealthier car buyers is the 'dealer appeared
reliable and trustworthy', which is of little interest to low-income motorists (5%) who
are more focused on buying from a 'local and convenient' used car retailer (36%).
While 'the right car at the best possible price' tops the list for people buying cars
costing up to £10,000, other factors are more influential over that price level – 'trade
in', 'local dealer', 'friendly, helpful staff, 'dealer was recommended' and 'lack of sales
pressure' can sometimes play a key role in clinching the deal on higher value cars.
Dealer experience is a prominent aspect of the buying process

The Consumer Perspective
The Used Car Market – a report by BCA 29
Buying from franchised and non-franchised dealers
Used car buyers are quite clear what they want from franchised dealers selling the
same make of car – two out of five expect a 'good deal on the car', 28% want the
'right car at the best possible price' and 25% 'look to trade in their old car'.
A little further down the list, some car owners head to a franchised dealer because of
their 'friendly, helpful and professional staff' (17%), or they have 'bought a car from
them before (16%).
Factors influencing choice of dealer
8
7
4
4
3
30
28
17
19
9
16
7
6
10
7
2
10
2
3
16
15
15
11
11
17
18
39
28
25
7
Got a good deal
Right car right price
Trade-in
Local
Friendly, helpful
Bought before
Reliable/trustworthy
Warranty
Lack of pressure
Range of choice
Aftersales
Quick delivery
Recommendation
Showroom facilities
Low finance
%
Franchised dealer same make
Used car retailer
Source: BMRB
Three out of 10 car owners who chose to buy from a non-franchised used car retailer
did so because 'they got a good deal on the car' and/or the dealer had 'the right car
at the best possible price', cited by 28% of this group this year. Dealing with 'friendly,
helpful and professional staff', or having 'bought a car from them before', is much
less of an concern for non-franchised used car retailers' customers than those who
had bought from a franchised point.
Three-quarters of motorists buy a used car
Twenty-four per cent of this year's consumer survey's respondents had bought a car
over the past two years, three-quarters of them choosing to buy a used car instead of
a new vehicle (see overleaf).
More men (26%) than women (23%) had bought a car in the past 24 months, 72% of
men and 77% of women opting to buy a used car rather than a new one.
Dealing with 'friendly, helpful staff' is less of a concern for non-franchised retailers' customers

The Consumer Perspective
The Used Car Market – a report by BCA 30
Cars bought over past two years – by age group
2426
23
16
2832
27
16
28
7477
80
87
81
7072
6064
0
10
20
30
40
50
60
70
80
90
All ages Men Women 17-24 25-34 35-44 45-54 55-64 65+
Age
%
% bought car in last two years % of these bought used
Source: BMRB
Motorists in the 35-44 year age group were the top buyers of cars on this occasion; a
third of them buying a car during the past two years, compared with just 16% of 17-
24 year-olds and 65 years-plus car owners. Nearly nine out of ten 25-35 year-olds
(87%), and 81% of those in the 35-44 age group, chose to buy a used car, in
contrast to just 60% of older motorists.
While three out of 10 wealthier car owners had bought a car in the previous two
years, just one in 10 low-income families followed suit, 67% of the former opting for a
used car compared to 85% of the latter.
Seven out of 10 families own a car
Similar to last year, seven out of 10 families (72%) own at least one car (see overleaf)
– 5% fewer, though, than two years ago, as the effects of the second recession in
four years, high inflation and rising fuel and maintenance costs has badly eroded car
owners' disposable incomes.
Households of car owners in the 35-54 age group have the most cars in their
families, 83% of them have at least one car, 30% of them owning two cars. The
lowest car ownership is found in 65 years plus and low-income households, where
just 62% of the former and 37% of the latter run a car.
A third of wealthier families own two cars, 9% of them in the three-car family bracket
– mostly those in the 45-54 year age group with a high percentage of used cars
costing more than £10,000.
Motorists in the 35-44 year age group were the top buyers of cars

The Consumer Perspective
The Used Car Market – a report by BCA 31
Four years of economic
downturn and financial
hardship has seen the
number of families
without a car rise five
points to 28% over the
past two years. Two-
car households
dropped 3% to 22%,
and the number of
three-car families fell
from 8% to 5% of
households during the
same period.
Hatchbacks and saloons most popular
Hatchbacks (47%) and
saloons (22%) remain
motorists' most popular
used cars, taking the
same share of the
market as last year.
Apart from MPVs,
which saw their share
rise from 6% to 10% in
2012, demand for other
variants was stable
year on year.
Women (52%) favour
hatchbacks more than
men (43%), who have more appetite for MPVs/People Carriers (12%) than women, at
7%. While a fifth of motorists in the 35-44 year group opt for an MPV, mostly in the
£10,000-£15,000 band, estate cars find favour with 55-64 year-olds, and saloons are
preferred by three out of 10 older motorists.
Estates and MPVs are twice as popular in the £10,000 to £15,000 price band, while
Sports Cars/Coupe and Prestige variants are favoured most by used car buyers
spending £20,000 plus.
Cars in the household
Two22%
Three or more4%
One45%
None28%
Source: BMRB
Type of used car bought
Hatchback47%
Saloon22%
Prestige1%
Micro/City2%
MPV10%
Sports/Coupe4%Off-road
4%
Other3%
Estate7%
Source: BMRB
Four years of economic downturn has seen the number of families without a car rise four points to 28%

The Consumer Perspective
The Used Car Market – a report by BCA 32
Buying used rather than new
Reasons for buying
a used car rather a
new one are firmly
established. A third
of car owners said
'I couldn't afford a
new car', a fifth
believe 'used cars
offer better value
for money', and
14% of motorists
are convinced
'there is lower
depreciation with
used cars'.
While a quarter of
men and a fifth of women said 'used cars offer better value for money', more women
(38%) than men (30%) said 'they couldn't afford a new car'.
Two-fifths of car owners between 17 and 34 years of age and low-income motorists
bought a used car because 'they were unable to afford a new one', in contrast to just
one fifth of older and wealthier motorists who found themselves in a similar position.
55-64 year-olds believe more strongly than other groups that 'used cars provide
better value for money' (28%) and 'there is lower depreciation with used cars' (23%).
While ‘I couldn’t afford a new car’ is the major influence in buying a used car costing
up to £5,000, it is of little concern for car owners who paid £10,000 to £15,000 for
their last used car (8%) – and those who bought more expensive vehicles (12%).
Sales of used diesels stall
Diesel-engined cars’ used car market share dipped to 33% this year from 34% in
2011 and 36% in 2010 – as fewer fleet vehicles from 2009's low new car volumes,
reached the marketplace and more private used car buyers looked towards smaller,
petrol-driven models.
Diesel new car volumes climbed four percentage points to 50.6% of the new car
market in 2011; rising 4.8% to 981,594 units, driven by higher sales (4.7%) to fleet
operators and a 14% drop in private sector new car volumes.
Fleet operators dominate the diesel new car market. Diesels accounted for close to
two-thirds (63.2%) of new cars sold to the 25-plus fleet sector in 2011 (644,230
units), compared with just 36.6% of private new car volumes – 337,364 units.
Buying new or used?
4
6
11
14
21
34
More choice
Needed quickly
Always buy used
Depreciation
Better value
Couldn't afford new %
Source: BMRB
Diesel-engined cars' used car market share dipped to 33% this year

The Consumer Perspective
The Used Car Market – a report by BCA 33
Motorists in the 35-44 year age group are the biggest diesel buyers, 41% of them
choosing a diesel-engined used car last time, as did 35% of wealthier used car
buyers. Diesels remain a less attractive proposition for 65 year-plus (24%) and low-
income (21%) used car owners many of whom prefer a smaller, petrol vehicle.
The high fleet and
premium sectors'
diesel new car
content can be
seen in the
£10,000 to
£15,000 used car
band – where two
thirds of vehicles
bought run on
diesel, as do seven
out of 10 used
cars priced
between £15,000
and £20,000.
Although 'better fuel consumption' still tops the reasons for buying a diesel used car,
the number of car owners citing this dropped to 57% compared with 68% in last
year's consumer survey – as petrol-engined cars become more frugal on the fuel
front and the significant diesel/petrol price gap remains. A quarter of used car buyers
believe a diesel is a 'more reliable engine', while nearly a fifth are confident this type
of used car 'maintains its value better'.
Used car satisfaction rises once more
Used car owners'
satisfaction with their
used car rose two
points to 95% this year
– 67% of them saying
they were 'very
satisfied' and 28%
'quite satisfied'.
The number of 17-24
year-old used car
owners, 'very satisfied'
with their car, jumped
10% to a high of 68%
this year, with a further
21% 'quite satisfied'.
Reasons for buying diesel
57
24
18
8 86
0
10
20
30
40
50
60%
Fuelconsumption
More reliableengine
Maintainsvalue
Engine lastslonger
High mileage Environment
Source: BMRB
Used car satisfaction
Quite dissatisfied2%
Neither2%
Quite satisfied28%
Very dissatisfied 1%
Very satisfied67%
Source: BMRB
Used car owners' satisfaction with their used car rose two points to 95%

The Consumer Perspective
The Used Car Market – a report by BCA 34
Used car satisfaction within all other age groups is well over the 90% mark, topped
by 55-64 year-olds and 65 plus motorists at 98% and 97% respectively – with
wealthiest used car buyers the most satisfied contingent at 99%. Although 92% of
low-income used car owner declared they were 'satisfied with their car, just 55%
claimed to be 'very satisfied' compared with the average of 67% – suggesting many
in this group run older vehicles.
The number of car owners ‘satisfied’ with their used car also rises in line with
purchase price – reaching 96% for cars costing between £5,000 and £10,000, 97%
between the £10,000 and £15,000 mark – and 100% for cars priced over £20,000.

The Consumer Perspective
The Used Car Market – a report by BCA 35
Part Three – Dealer Relations and Buying Intentions
Used car customer follow up
The BCA consumer survey asks used car owners if the dealer they bought their car
from, keeps in touch to see if they are satisfied with their vehicle, are interested in
servicing their car, or might be thinking of buying another car. This year's results
show that just 52% car owners had heard from their selling dealer since they bought
their car, compared to 56% in last year's survey.
Overall, the
percentage of
used car
customers
contacted by
dealers to find out
if they 'were
satisfied with their
car' or were
interested in
'having it serviced'
both fell to their
lowest point in the
survey's history.
'Satisfaction' calls
dropped 3% to
27% while
'servicing' was 4% lower at 31%.
Franchised dealers selling the same make of used car have a much better record on
customer contact than their non-franchised counterparts; 73% kept in touch with
their used car buyers compared with 40% of independent dealers, 57% versus 18%
on servicing' and 13% versus just 4% to see if the owner might be 'interested in
buying another car'.
17-24 year-old car owners and low-income motorists are least likely to hear from the
retailer they bought their car from – three out of five saying they had heard nothing
since they took delivery of their vehicle. Used car buyers in the 55 years plus group
and wealthier motorists are most likely to be approached about 'servicing their car' or
if they 'might be interested in buying another vehicle' – the latter aspect unheard of
by low-income car owners.
Eighty-five per cent of owners of cars costing between £10,000 and £15,000 had
heard from their supplying dealer, three out of five about 'servicing' and a fifth on the
topic of 'changing their car'.
Dealer contact with used car customers
31
1
73
57
13
4
1818
40
4
0
10
20
30
40
50
60
70
80
Contact Servicing car Satisfied with car Change car Sell tofriend/family
%
Franchised dealer same make Non-franchised dealer
Source: BMRB
The percentage of used car customers contacted by dealers to find out if they were satisfied fell to its lowest point

The Consumer Perspective
The Used Car Market – a report by BCA 36
Buying a car in the next year?
Car owners are
clearly not immune
from the impact of
the long-running
spell of financial
pressures,
recession or
gloomy economic
outlook. This
year's consumer
research shows a
significant drop in
the number of car
owners who think
they will 'certainly'
or 'quite likely' buy a car in the next 12 months – down 3% to 11% in 2012 from 14%
last year. The number of motorists who believe there is a '50:50 chance' they will buy
a car in the next year edged up one point to 9%.
Men are more likely to buy a car in the next 12 months than women, 13% of the
former feel they will 'certainly' or 'quite likely' do so, compared with just 10% of
women. Sixteen per cent of 35-44 year-olds feel they might buy a used car in the
next year in contrast to just 3% of 65 years-plus motorists – while a fifth of car
owners who bought a used car in the £10,000 to £20,000 band, and 35% of those
with cars in the £20,000 group, feel they might follow suit.
What type of car to buy next?
Three-quarters of
car owners intend
to replace their car
with a used one
when they make a
change. However,
there has been a
swing of 4%
towards diesel this
time – 30% of
prospective used
car buyers saying
they plan to go in
this direction next
time – a long way
short though of
diesels' current 50% plus share of the new car market.
Likelihood of buying a car in the next year
3
8 9
26
20
30
3
0
5
10
15
20
25
30
%
Certainlywill
Quitelikely
50:50chance
Unlikely Certainlynot
Won'tbuy again
Don'tknow
Source: BMRB
Next car bought will be
12
1
1
3
3
4
7
27
40
Don't Know
Used car alternative
Used car hybrid
Nearly new petrol
Nearly new diesel
New car diesel
New car petrol
Used car diesel
Used car petrol %
Source: BMRB
Three-quarters of car owners intend to replace their car with a used one

The Consumer Perspective
The Used Car Market – a report by BCA 37
While four out of five car owners in the 25-34 age group plan to buy a used car next
time they replace their car, a third looking for a diesel, only 62% of older motorists
are planning a similar move, just 17% heading in the diesel direction. The biggest
potential buyers of a used car are those who spent £5,000- £10,000 last time (92%),
and owners of used cars that cost between £15,000 and £20,000 (88%).
Where to buy the next car?
While some car owners might consider more than one option, the number of
respondents saying they will deal with a franchised dealer next time rose by 5% to
50% in this year's survey, half of them planning to trade in their old car. Other
potential used car sources remain unchanged; 30% of motorists have in mind buying
privately or from a friend, while a further 13% are considering doing business with a
non-franchised used car retailer.
Nearly three out of
five car owners
over the age of 35
say a franchised
dealer will be their
first port of call
when they get
round to buying a
used car to replace
their current
vehicle – which
rises to seven out
of 10 in the case of
better-off used car
buyers.
Two out of five 17-
24 year-olds and
low-income car buyers say they will buy privately or from a member of their family
next time, as will half of buyers of cars in the £1,000 to £3,000 band. On the other
hand, three out of five owners of cars costing between £10,000 and £15,000 are
intent on doing business with a franchised dealer.
Where next car will be bought
13
7
6
5
4
3
12
22
50
Don't know
Other
Auction
Car supermarket
Family friend
Internet trader
Used car dealer
Private
Franchised dealer %
Source: BMRB
The number of respondents saying they will deal with a franchised dealer next time rose by 5%

The Consumer Perspective
The Used Car Market – a report by BCA 38
Part Four – Economic Recovery, Running Costs and
Keeping in Touch with Customers,
What car to buy during an economic recovery?
The economy is in the midst of a double-dip recession, prices of essential goods and
fuel have spiralled in recent years, and unemployment is uncomfortably high. The
Governor of the Bank of England, Mervyn King, predicts it could take five more years
for a full economic recovery – three years longer than he originally expected.
Faced with this gloomy outlook, what type of car might car owners consider buying to
help them offset financial pressures? The answer? The 'status quo' is under severe
threat.
Buying a car during slow economic recovery
2
2
3
5
8
9
9
12
13
14
14
20
27
Bigger car
New instead of used
Low interest loan
Lower depreciation
Best part-exchange price
Same type of car
Used instead of new
Lower maintenance
Lower CO2
Best purchase price
Smaller car
Lower road tax
Better fuel consumption %
Source: BMRB International
Just 9% of car owners say they will 'buy the same car again', down from 14% last
year and 20% who expressed this view in 2010. Simple arithmetic, therefore,
suggests that nine out of 10 motorists intend to replace their car with a different type
of vehicle next time.
Top of the shopping list are 'a car with better fuel consumption', 'lower road tax', 'a
smaller car' 'best purchase price' and 'lower CO2' – all things that used car buyers
have a great deal of control over. Significant progress on all or most of these
measures could produce dramatic savings.
.
Just 9% of car owners say they will 'buy the same car again'

The Consumer Perspective
The Used Car Market – a report by BCA 39
There remains little difference between men and women, and across the age and
social groups, on what steps motorists might take to protect their motoring needs
and withstand the 'slings and arrows' of the country's economy
Men (29%) appear more intent than women (24%) on changing to a 'car with better
fuel consumption', a step too far, though, for the vast majority of younger car owners,
just 16% of whom said this is tolerable. On the price front, people with cars in the
£10,000 to £15,000 group, are more resolved than others to cut costs when they
replace their car. A third of them are considering a move to 'a car with better fuel
consumption' and/or one with 'a lower road tax', while a quarter are thinking about
'buying a used car rather a new one' and/or negotiating 'the best possible price'.
Reducing personal motoring carbon footprint
The number of cars owners prepared to take steps to cut their personal carbon
footprint rose to 94% this time. Support for such measures is wide spread with the
exception of 65 years-plus (76%) and low-income respondents (72%).
Steps to reduce personal motoring carbon footprint
16
6
6
9
9
10
13
14
15
15
15
15
16
16
21
29
No action
Drive off-peak times
Work from home
Cycle more often
Car share
Switch off air conditioning
Use public transport more
Accelerate less quickly
Avoid heavy braking
Avoid short trips
Buy smaller car
Car with lower emissions
Reduce annual mileage
Drive more slowly
Cut journeys
Walk more often %
Source: BMRB
'Walking more often' and 'cutting the number of journeys', favoured by 29% and 21%
of car owners respectively, top the list of measures motorists have in mind to cut
their personal CO2 – with other steps such as 'driving more slowly', 'reducing annual
mileage', 'buying a car with lower emissions' and 'buying a smaller car' also in the
frame.
Men appear more intent than women on changing to a 'car with better fuel consumption'

The Consumer Perspective
The Used Car Market – a report by BCA 40
Women (33%) are more likely to 'walk more often' than men at 24%. However, when
it comes to 'driving more slowly', 19% of men cite this as one of their contributions to
offset the threat of climate change compared with just 13% of women.
Surprisingly, owners of higher value cars (in the £15,000 to £20,000 price group) are
the most determined eco warriors. Three out of 10 have vowed to 'cut the number of
journeys', 'avoid heavy braking', 'switch off air conditioning when possible' and 'car
share whenever possible' – while a third have in mind 'cutting unnecessary journeys'.
Offsetting the rising cost of fuel
AA statistics show that, at June 2012, the UK has the 10th highest unleaded fuel
price in Europe (12th last year) – and the second highest pump price for diesel.
By June 2012, the average price for unleaded fuel had dropped three pence, year on
year, to an average of 133.8 ppl, while the price for diesel was virtually the same as
that 12 months earlier at 139.3 ppl. What shouldn't be overlooked, of course, is
today's fuel prices represent a 50 pence per litre hike for petrol and 40 pence rise for
diesel in a little over three years – a heavy burden on private motorists in particular.
It is fair to assume that fuel prices will rise considerably in the long term as global
demand pushes up refinery prices, and the government returns to increasing fuel tax
to fill the huge 'black hole' in motor taxes on the horizon from lower CO2 emissions.
So how high will fuel prices need to be before motorist are forced to consider
switching to a more fuel-efficient car and/or alter their driving pattern?
Fuel price to force change of car or pattern of driving
47
8
8
1
5
3
10
3
4
3
47
8
7
1
5
2
10
3
5
4
98
No effect
Don't Know
£1.70 plus per litre
£1.65 per litre
£1.60 per litre
£1.55 per litre
£1.50 per litre
£1.45 per litre
£1.40 per litre
£1.35 per litre
£1.30 per litre
%
Change car Pattern of driving
Source: BMRB
Owners of higher value cars are the most determined eco warriors

The Consumer Perspective
The Used Car Market – a report by BCA 41
Over half of this year's respondents (53%), believe the higher price of fuel will
eventually push them into 'buying a more fuel efficient vehicle' or change their 'driving
habits' – or both. The only groups who feel less inclined to make a change are 65
years plus car owners, who are probably less affected because their annual mileage
is lower and many already run smaller, more economical cars.
Car owners most concerned by the prospect of much higher fuel prices are 17-24
year-olds (65%), in complete contrast to owners of cars costing over £20,000 – who
might share others views on fuel-efficient vehicles, but have no intention of changing
their driving habits.
Steps taken to cut car running costs
As average earnings continued to run well behind inflation, many families are having
to count their pennies and look for substantial savings in their household expenditure,
not least in their car running costs.
Steps taken to substantially cut car running costs
2
3
4
4
5
7
9
11
11
12
12
14
16
22
17
Lower cost service provider
Fewer cars in the household
Lower insurance premium
DIY service\repairs
Close windows when possible
Shorter trips
Change to car lower insurance
More fuel--efficient car
Use public transport
Switch off air conditioning
Bought a smaller car
Accelerate less quickly
Avoid heavy breaking
Drive more slowly
Tyres at right pressure %
Source: BMRB
In this regard, 70% of car owners said they had already taken some steps to cut their
car operating costs. While the leading measures adopted might appear somewhat
lightweight in their own right, together 'keeping tyres at the right pressure' (22%),
driving more slowly' (17%), 'avoiding heavy braking' (16%) and 'accelerating less
quickly' (14%) can deliver meaningful, long-term savings.
While men were keen to make progress on these top-four measures, more women
(14%) had changed to a smaller car than men (10%).
Owners of cars costing over £20,000 have no intention of changing their driving habits

The Consumer Perspective
The Used Car Market – a report by BCA 42
Few younger drivers have taken practical steps to cut their motoring costs, unlike
owners of cars costing between £15,000 and £20,000 – half of them are 'keeping
their tyres at the right pressure', three out of five 'are avoiding heavy braking' and a
fifth are 'accelerating less quickly'.
Keeping customers in the loop
There has been considerable attention given recently to Customer Relationship
Management (CRM) – or how motor retailers should best communicate with their
customers.
In this regard, the spotlight has been fixed firmly on websites, email and social media
such as Facebook and Twitter. However, the focus seems to have been rather one
sided – concentrating purely on how retailers could fully exploit all manner of high-
tech techniques to sell more cars and aftersales and satisfy and retain more
customers.
In a world where consumers are subjected to a barrage of often aggressive 'sales
intrusions' through their PC, down their telephone line or through their letter box, how
do used car owners want their selling dealer to keep in touch with them?
To this end, this year's BCA consumer survey asked used car owners 'how do you
prefer to be kept informed of new or used car sales offers, servicing and other
opportunities by the dealer you bought your latest car from?'.
Keeping in touch – customers' preferences
28
13
1
1
1
2
4
6
9
14
15
18
Don't know
Other
Text message
Radio
Telephone call
TV
Press
Website information
Letter\mailing
Email %
Source: BMRB
The Consumer Perspective
The Used Car Market – a report by BCA 43
Car owners show a clear preference for receiving the least invasive type of
communication; ones they can read and absorb when it suits them and not the
sender – which can be extensive, if needs be, and can be retained and returned to at
leisure. Email leads the field in this respect, cited by 18% of survey respondents,
followed by the 'written word' in the form of letters/mailing and websites at 15% and
14% respectively.
Motorists appear to dislike incoming telephone sales calls and, despite the fervour for
social media in the manufacturer and retailer arena, they seem to have little
enthusiasm for being kept up to date by Twitter or Facebook – or, for that matter, by
text messaging.
Car owners in the 25-44 year group much prefer email or surfing websites to other
forms of communication, while men (17%) lean more towards websites than women
at 11%. Email is the outright winner for people with used cars costing more than
£10,000, while owners of cars in the £20,000 plus band also appreciate being kept
up to date by letter and website.
A good deal is still the critical factor
The Consumer Perspective section suggests car owners resist any form of sales
pressure, with better-informed, buyers and prospects seeking to gain the initiative
during the buying process.
Car buyers are making an expensive acquisition – as well their personal
experience, many are seeking advice from family and friends and increasingly
trawling independent, dealer and manufacturer websites to build up a
comprehensive 'case file'.
A good deal is still the critical factor – indeed, the crunch issue in many cases –
but the decision is more complex than just price; the buyer wants a top-class
blend of service and experience.
Three-quarters of car owners buy a used car rather than a new one - is the effort
put into selling used cars as strong and professional as that associated with new
car sales?
While diesel-engined new cars are overridingly popular, in the long term they will
could become less popular as used cars, unless would-be buyers can truly justify
the significantly higher price by greater fuel economy or genuine economic
benefit.
Motorists appear to dislike incoming telephone sales calls

The Used Car Market – a report by BCA 44
Regional Review
The BMRB consumer research provides a useful insight into the pattern of car
owners' buying and owning experiences across the UK regions.
This year's consumer survey shows that a third of Welsh motorists had bought a new
or used car during the past 24 months, followed by three out 10 East Anglian,
Northern and Scottish car owners. London remains the lowest car buying region per
head, just 15% of respondents living there had bought a new or used car in the past
two years, compared to 11% in the previous year's survey.
Car bought over past two years
15
25
26
33
31
21
23
26
22
30
29
London
South East
South West
Wales
East Anglia
East Midlands
West Midlands
Yorks/Humb
North West
North
Scotland
%
Source: BMRB
West Midlands topped the used car buying table this year; 84% of car buyers opting
for a used car last time they changed their vehicle, as did 82% of East Anglian car
owners. Just three out of five Scottish and London motorists had bought a used car,
last time, in contrast to three-quarters of car owners living in Yorkshire/Humberside,
the East Midlands, Wales and the South West.
‘Friends and family’ holds more influence this year
‘Personal experience of make/model’ is the outright winner for East Anglian car
buyers (55%) when considering what car to buy and for 36% of Northern motorists
(see overleaf). The influence of 'friends and family' is stronger this year; top of the list
for car owners in seven of the 11 UK regions when making up their mind what type of
car to consider buying.
'Independent Internet sites' holds more sway in the West Midlands (23%), Yorkshire
and Humberside (18%) and the South East, also 18%, than other areas of the country
– while taking a 'test drive' is an influential factor for a third of car owners in East
Anglia.
'Personal experience of make/model' is the outright winner
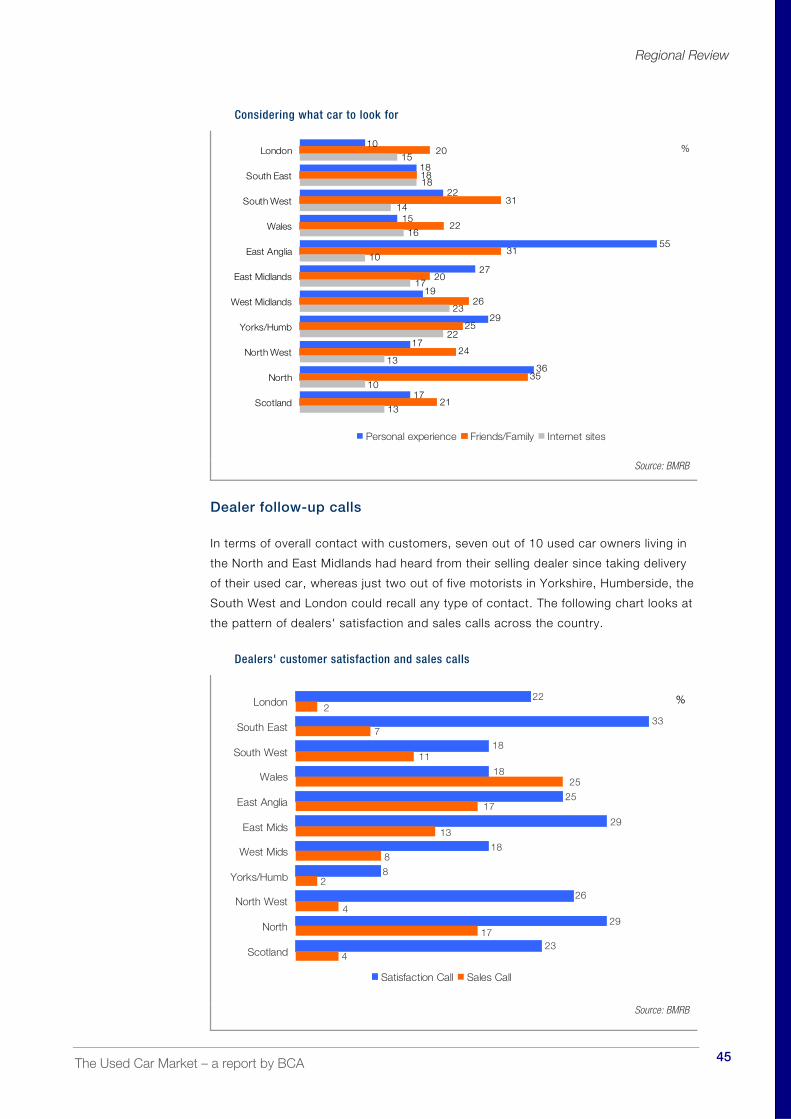
Regional Review
The Used Car Market – a report by BCA 45
Considering what car to look for
1721
13
27
19
29
17
36
55
15
10
18
22
35
24
25
26
20
31
22
31
18
20
10
13
22
23
17
15
18
14
10
16
London
South East
South West
Wales
East Anglia
East Midlands
West Midlands
Yorks/Humb
North West
North
Scotland
%
Personal experience Friends/Family Internet sites
Source: BMRB
Dealer follow-up calls
In terms of overall contact with customers, seven out of 10 used car owners living in
the North and East Midlands had heard from their selling dealer since taking delivery
of their used car, whereas just two out of five motorists in Yorkshire, Humberside, the
South West and London could recall any type of contact. The following chart looks at
the pattern of dealers' satisfaction and sales calls across the country.
Dealers' customer satisfaction and sales calls
234
18
33
22
18
25
29
26
8
18
29
17
4
2
8
13
17
25
11
7
2London
South East
South West
Wales
East Anglia
East Mids
West Mids
Yorks/Humb
North West
North
Scotland
%
Satisfaction Call Sales Call
Source: BMRB

Regional Review
The Used Car Market – a report by BCA 46
A third of South Eastern used car buyers had been asked if they were 'satisfied' with
their car, while three out of 10 East Midlands' and Northern motorists had also been
approached on this front.
A quarter of used car owners living in Wales and East Anglia had been approached
about perhaps 'buying another car', but this type of initiative was almost unheard of
in Scotland, the North West and London.
When to buy the next car?
The number of car owners who say they will 'certainly' or 'quite likely' buy a car in the
coming 12 months is highest in Wales and the West Midlands (16%) – and least likely
in the North West and Scotland, where just 7% of this year's survey respondents felt
the same way.
Buying a car in the next 12 months
1
4
1
2
4
7
2
6
1
2
1
8
6
9
10
9
12
9
7
10
7
5
4
10
8
5
12
12
8
6
14
16
10
80
81
81
77
80
83
75
79
83
76
77
London
South East
South West
Wales
East Anglia
East Midlands
West Midlands
Yorks/Humb
North West
North
Scotland
%
Certainly Quite likely 50/50 Unlikely/Not
Source: BMRB
Sixteen per cent of Northern and 15% of North Western car owners said they felt it
was '50/50' whether they would buy a car in the coming year, while just 17% of
Scottish and Yorkshire/Humberside motorists said there was any chance of them
'buying a car at all' in the next 12 months.
Where to buy the next car?
The popularity of franchised dealers has risen in this year's survey; more than half of
car owners in six of the 11 UK regions planning to go in this direction next time they
replace their car – particularly so in Yorkshire/Humberside where 70% of motorists
say a franchised dealer will be their first port of call (see overleaf).
Popularity of franchised dealers has risen

Regional Review
The Used Car Market – a report by BCA 47
Where to buy the next car
567
24
47
46
70
52
55
54
44
35
57
39
18
11
16
14
15
30
7
18
11
10
20
27
26
24
37
42
23
28
28
26
London
South East
South West
Wales
East Anglia
East Midlands
West Midlands
Yorks/Humb
North West
North
Scotland
%
Franchised dealer Non-franchised dealer Private/family
Source: BMRB
‘Non-franchised used car retailers’ are favoured more in East Anglia (30%) the North
(18%) and the South West (18%) than other UK regions. On the other hand, 42% of
Londoners, 37% of motorists in the East Midlands, and 28% of East Anglian and
South Western car owners plan to buy ‘privately’ or from a ‘friend or family member’
when they next change their car.
What car to buy next?
What type of car next?
66
76
72
58
60
74
82
72
57
70
82
9
5
5
4
12
16
2
6
7
7
4 4
9
21
10
3
17
10
7
10
11
16
10
9
17
13
13
20
13
14
15
12
London
South East
South West
Wales
East Anglia
East Midlands
West Midlands
Yorks/Humb
North West
North
Scotland
%
Used car Nearly new New car Don't know
Source: BMRB

Regional Review
The Used Car Market – a report by BCA 48
Four out of five East Midlands and Northern car owners plan to buy a used car next
time they change, as do three-quarters of motorists living in the South West and East
Anglia. Nearly-new cars are more the province of prospective car buyers in East
Anglia (16%) and Wales (12%), but of little interest to motorists in the East Midlands,
where just 2% are considering such a move.
Buying a new car appeals to 17% of car owners in London and 16% in Scotland, but
much less so to motorists living in the East Midlands and the North of England.
How satisfied are used car owners?
The most satisfied car owners, overall, are Londoners, 99% of whom said they were
either ‘very satisfied’ or ‘quite satisfied’ with their used car – followed very closely by
98% of respondents living in East Anglia and Yorkshire/Humberside. In contrast, only
87% of South Western motorists were happy with their used car, 73% 'very satisfied'
and just 14% in the 'quite satisfied' bracket.
While three-quarters of Welsh, East Anglian and Northern used car buyers said they
were 'very satisfied' with their car, as is now customary, fewer used car buyers living
in London (57%) said they felt the same about their latest used vehicle.
Very satisfied and quite satisfied used car owners
59
75
62
67
70
61
75
75
73
70
57
37
18
31
31
26
35
23
20
14
26
42
Scotland
North
North West
Yorks/Humb
West Midlands
East Midlands
East Anglia
Wales
South West
South East
London %
Very satisfied Quite satisfied
Source: BMRB
Buying a new car appeals less to motorists living in the East Midlands and the North
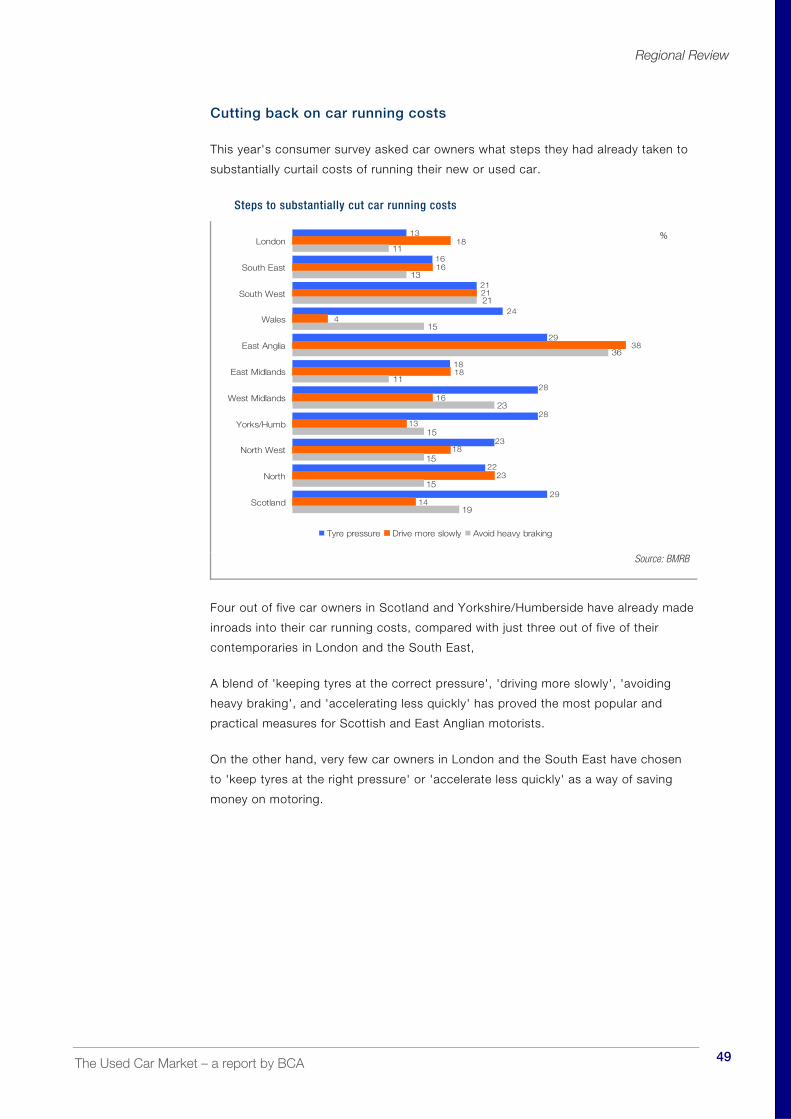
Regional Review
The Used Car Market – a report by BCA 49
Cutting back on car running costs
This year's consumer survey asked car owners what steps they had already taken to
substantially curtail costs of running their new or used car.
Steps to substantially cut car running costs
2914
19
21
16
13
24
29
22
23
28
28
18
18
16
21
4
38
18
16
13
18
23
15
36
21
13
11
11
23
15
15
15
London
South East
South West
Wales
East Anglia
East Midlands
West Midlands
Yorks/Humb
North West
North
Scotland
%
Tyre pressure Drive more slowly Avoid heavy braking
Source: BMRB
Four out of five car owners in Scotland and Yorkshire/Humberside have already made
inroads into their car running costs, compared with just three out of five of their
contemporaries in London and the South East,
A blend of 'keeping tyres at the correct pressure', 'driving more slowly', 'avoiding
heavy braking', and 'accelerating less quickly' has proved the most popular and
practical measures for Scottish and East Anglian motorists.
On the other hand, very few car owners in London and the South East have chosen
to 'keep tyres at the right pressure' or 'accelerate less quickly' as a way of saving
money on motoring.

The Used Car Market – a report by BCA 50
European Overview This section of the Used Car Market Report looks at new and used car markets in key
European states which make up the EU27, plus the three European Free Trade
Association countries (EFTA). Western Europe is the original EU15 states plus EFTA.
EU15 Austria, Belgium, Denmark, Finland, France, Greece, Germany, Ireland, Italy,
Luxembourg, the Netherlands, Portugal, Spain, Sweden, the UK
EU25 EU15 plus the Czech Republic, Estonia, Hungary, Latvia, Lithuania, Poland,
Slovakia, Slovenia
EU27 EU 25 plus Bulgaria, Romania
EFTA3 Iceland, Norway, Switzerland
Western Europe EU15 plus EFTA3
Europe has a population of 500 million and a car parc of some 236 million passenger
cars, 199 million of them in Western European countries. According to ACEA (European
Automobile Manufacturers Association), Europe has 3.5 million people involved in
automotive manufacturing, accounting for a quarter of worldwide passenger car
production.
New car market
Europe's new car registrations hit an all-time high of 16 million units in 2007, falling to
14.7 million in 2008 in the face of recession. While wide-spread scrappage incentive
schemes held new car volumes at 14.5 million in 2009, they fell to 13.8 million and 13.6
million respectively in 2010 and 2011 – some two million units below the average for the
five years prior to the 2008/2009 economic downturn.
European new car volumes ; EU27 plus EFTA 2003 - 2011
15.8
15.115.3 15.3
13.613.8
14.514.7
16.0
10
11
12
13
14
15
16
17
2003 2004 2005 2006 2007 2008 2009 2010 2011
Mill
ions
of ca
rs
Source: ACEA

European Overview
The Used Car Market – a report by BCA 51
Western Europe's (EU15/EFTA) new car sales, which accounted for 94.4% of the
EU27 total, fell 1.3% to 12.81 million in 2011, while the EU's 'new member states'
saw their new car volumes drop 2.9% to 706,706 units last year.
EU15 markets
Of the major European major markets, only Germany saw its new car sales rise in
2011, by 8.8% to 3.17 million, stretching its lead at the top of the European new car
sales table. Second-placed France saw its new car volumes fall 2.1%, as did other
major markets – the UK (-4.4%), Italy (-10.9%) and Spain (-17.7%).
EU15 new car registrations; 2011
3.17
2.20
1.941.75
0.81
0.57 0.570.36 0.30
0.17 0.15 0.13 0.10 0.09 0.050.00
0.50
1.00
1.50
2.00
2.50
3.00
3.50
Mill
ions
German
y
Fran
ce UKIta
lySpain
Belgium
Nethe
rland
s
Austri
a
Sweden
Denmar
k
Portug
al
Finlan
d
Greece
Irelan
d
Luxe
mbu
rg
Source: ACEA
Greece and Portugal, down by 31% and 31.3% respectively, also experienced a
marked fall in new car volumes in 2011. Western European markets with stronger
new car sales in 2011 were Austria (8.4%), Denmark (9.7%) and Norway (8.3%).
The German new car market proved more resilient than other major EU markets
in 2011, its new car sales rising 8.8% to 3.17 million last year – much in line with
2007's pre-recession volumes – see overleaf. The French new car market, on the
other hand, slipped by 2.1% to 2.2 million in 2011, retaining second place in the
European new car sales league.
In a struggling economy, Italian new car sales tumbled by a further 10.9% to 1.75
million in 2011, three-quarters of a million units fewer than the 2.5 million
recorded in 2007. Spain saw its new car market suffer the biggest drop of the
EU's major markets in 2011, falling 17.7% and 173,956 units to 808,059, around
half the level of new car sales reached five years earlier.
The German new car market has proved more resilient than other major EU markets

European Overview
The Used Car Market – a report by BCA 52
New car sales major EU markets; 2002 - 2011
2.202.252.27
2.152.01 2.01 2.07 2.00 2.06 2.05
3.172.91
3.81
3.25 3.24 3.27 3.323.47
3.153.09
1.751.96
2.28
2.25 2.26 2.24 2.33
2.50
2.162.16
0.810.980.95
1.381.33
1.52 1.531.63 1.61
1.16
1.942.03
2.442.34
2.572.582.56
1.99
2.402.13
0.0
0.5
1.0
1.5
2.0
2.5
3.0
3.5
4.0
2002 2003 2004 2005 2006 2007 2008 2009 2010 2011
Mill
ions
of
units
France Germany Italy Spain United Kingdom
Source: ACEA
UK new car market volumes fell 4.4% to 1.94 million in 2011, consolidating its
third place in the European new car sales league.
The major markets of France, Germany, Italy, Spain and the UK accounted for 72.8%
of overall EU new car registrations in 2011, compared with 73.6% in 2010 – as just
Germany recorded a rise in new car volumes last year.
New member states
New car sales new EU member states, 2011
277.4
173.3
81.768.2
58.445.1
19.1 15.4 13.2 8.8
0
50
100
150
200
250
300
Polan
d
Czech
Rep
l
Roman
ia
Slov
akia
Slov
enia
Hunga
ry
Bulgar
ia
Esto
nia
Lithu
ania
Latvi
a
Tho
usan
ds
Source: ACEA

European Overview
The Used Car Market – a report by BCA 53
Eastern European new car markets had mixed results in 2011. Poland's new car
volumes fell 12.2% to 277,430, while the Czech Republic saw its new car sales rise
2.4% to 173,282 units. However, Hungary and Slovakia fared better last year – the
former's sales were 3.7% higher at 45,097, while the latter's were up 6.5% to 68,203
units.
Used car volumes
Overall European used car volumes are considerably higher than EU new car sales;
indeed the five major markets in this report alone account for over 23 million used car
sales annually.
Used car volumes, 2011
6.76.4
5.5
2.8
1.81.6
10.8 0.8 0.8
0.5
0
1
2
3
4
5
6
7
Mill
ions
UK
German
y
Franc
eIta
ly
Netherl
ands
Spain
Sweden
Austria
Belgium
Portug
al
Denmark
Source: National Trade Bodies
The major EU used car market trends' chart, overleaf, shows UK used car volumes
fluctuated somewhat over the past 10 years – from a high of 7.4 million units in 2006
to 6.3 million as recession hit used car sales hard in 2009.
As the economy struggled to recover, UK used car sales edged up to 6.6 million in
2010 and 6.7 million units in 2011, securing first place in Europe’s used car sales
league.
Germany’s used car market volumes, which had fallen steadily for a decade, staged a
recovery, rising 400,000 to 6.4 million units in 2010 and 2011. French and Spanish
used car sales have also recovered from the economic downturn, the former settling
at 5.5 million units for the past two years – while the latter rose 300,000 units to 1.7
million units in 2010, slipping back to 1.6 million the following year.
The UK secured first place in Europe's used car sales league

European Overview
The Used Car Market – a report by BCA 54
Used car volumes major markets, 2002 - 2011
5.45.65.55.45.45.35.5
5.25.5 5.5
6.16.3
6.76.6
6.86.86.8
6.0
6.4 6.4
3.22.9
3.23.12.92.9
3.02.7 2.8 2.8
1.51.71.61.6
1.41.7
1.21.4
1.7 1.6
6.7
7.1
6.36.6 7.2
6.8
7.47.3
6.66.7
0
1
2
3
4
5
6
7
8
2002 2003 2004 2005 2006 2007 2008 2009 2010 2011
Mill
ions
France Germany Italy Spain United Kingdom
Source: National Trade Bodies
While Italian used car volumes, have remained relatively flat since 2009 at 2.8 million,
they are some way short of the high of 3.2 million reached in 2007 and 2008.
Car parc
Parc sizes, 2009
42.9
36.5
31.4 30.4
22.0
7.6
5.2 4.5 4.4 4.32.1
0
5
10
15
20
25
30
35
40
45
Mill
ions
German
yIta
ly
Fran
ce UKSpain
Nethe
rland
s
Belgium
Portug
al
Austri
a
Sweden
Denmar
k
Source: Eurostat
Around 70% of Europe’s 236 million car parc is concentrated in the five main markets
of France, Germany, Italy, Spain and the United Kingdom. Car ownership rates vary
widely across Europe. There are 470 cars per 1,000 population for Europe as a

European Overview
The Used Car Market – a report by BCA 55
whole; Western Europe recording a figure of around 500, compared with 300 cars per
1,000 people in the new EU member states.
The UK has the youngest car parc of the EU’s major markets at 7.44 years compared
with Germany's 8.1, France's 8.2, and Italy with an average of age of 7.5 years.
Parc turn percentage
The dynamism of any car market is measured by the churn in the marketplace i.e. –
the number of vehicles changing hands each year relative to the total car parc – a
figure known as the ‘parc turn’. Countries, with a well-developed wholesale
infrastructure for used cars, and tax-friendly treatment of used car sales, normally
produce a much higher churn of vehicles. The parc turn percentage essentially
highlights how easy, or otherwise, it is for car owners to buy a new or used car.
Parc turn percentages, 2011
31.030.3
28.426.5 26.0
24.4
22.420.6
12.510.9
0.0
5.0
10.0
15.0
20.0
25.0
30.0
35.0
%
Nethe
rland
s
Sweden UK
Austri
a
Belgium
Fran
ce
German
y
Portug
alIta
lySpain
Source: ACEA/National Trade Bodies
With combined new and used car volumes of 8.6 million, the UK is the most dynamic
of the major European car markets recording a parc turn of 28.4% in 2011, some
distance ahead of France’s 24.4% and Germany's figure of 22.4%. This underlines
the UK’s well-developed used car industry infrastructure and strong wholesale
market.
Spain’s parc turn dropped one point to 10.9% in 2011 as it suffered a 174,000 fall in
new car sales, continuing to prop up the parc turn table – well short of the figures
achieved by the major markets in the UK, France and Germany.
The UK is the most dynamic of the major European car markets
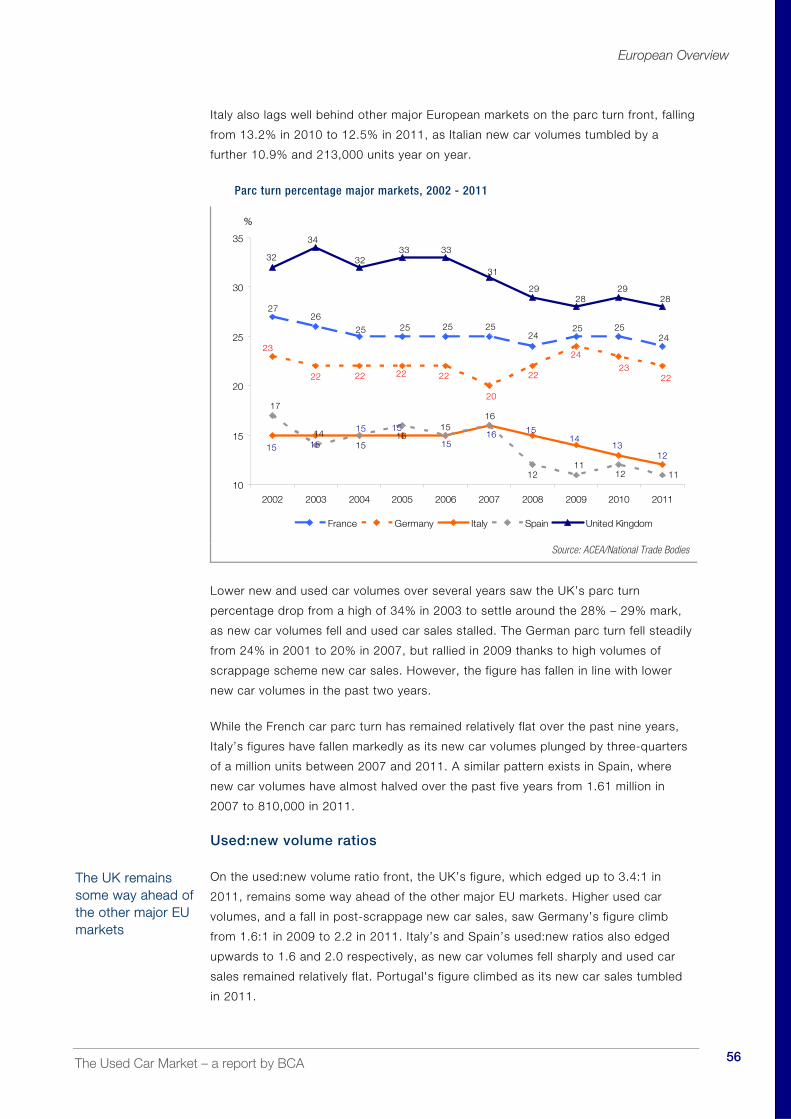
European Overview
The Used Car Market – a report by BCA 56
Italy also lags well behind other major European markets on the parc turn front, falling
from 13.2% in 2010 to 12.5% in 2011, as Italian new car volumes tumbled by a
further 10.9% and 213,000 units year on year.
Parc turn percentage major markets, 2002 - 2011
242525
2726
25 25 25 2524
2223
2423
22 22 22 22
20
22
121315 15
15 15
1516 14
15
111211
14
17
1516
1516
12
2829
33 3332
34
32
28
31
29
10
15
20
25
30
35
2002 2003 2004 2005 2006 2007 2008 2009 2010 2011
%
France Germany Italy Spain United Kingdom
Source: ACEA/National Trade Bodies
Lower new and used car volumes over several years saw the UK’s parc turn
percentage drop from a high of 34% in 2003 to settle around the 28% – 29% mark,
as new car volumes fell and used car sales stalled. The German parc turn fell steadily
from 24% in 2001 to 20% in 2007, but rallied in 2009 thanks to high volumes of
scrappage scheme new car sales. However, the figure has fallen in line with lower
new car volumes in the past two years.
While the French car parc turn has remained relatively flat over the past nine years,
Italy’s figures have fallen markedly as its new car volumes plunged by three-quarters
of a million units between 2007 and 2011. A similar pattern exists in Spain, where
new car volumes have almost halved over the past five years from 1.61 million in
2007 to 810,000 in 2011.
Used:new volume ratios
On the used:new volume ratio front, the UK’s figure, which edged up to 3.4:1 in
2011, remains some way ahead of the other major EU markets. Higher used car
volumes, and a fall in post-scrappage new car sales, saw Germany’s figure climb
from 1.6:1 in 2009 to 2.2 in 2011. Italy’s and Spain’s used:new ratios also edged
upwards to 1.6 and 2.0 respectively, as new car volumes fell sharply and used car
sales remained relatively flat. Portugal's figure climbed as its new car sales tumbled
in 2011.
The UK remains some way ahead of the other major EU markets

European Overview
The Used Car Market – a report by BCA 57
Used:new volume ratios, 2011
1.4
1.6
2.0
2.2
2.2
2.4
2.9
3.3
3.3
3.4
5.0
Belgium
Italy
Spain
Austria
Germany
France
Denmark
Netherlands
Sweden
UK
Portugal
Source: ACEA/ National Trade Bodies
Used car sales per 1,000 population
The EU major market pattern continues with used car sales per 1,000 population
indicator; the UK’s figure of 108 beating France’s 85 and Germany’s 79 by some
considerable distance. Italy (47) and Spain (34) have the lowest used car sales per
1,000 people in western Europe, underlining the huge potential for growth in these
used car markets.
Used car sales per 1,000 population, 2011
109
108
107
97
89
85
79
72
72
47
34
Netherlands
UK
Sweden
Austria
Denmark
France
Germany
Portugal
Belgium
Italy
Spain
Source: National Trade Bodies
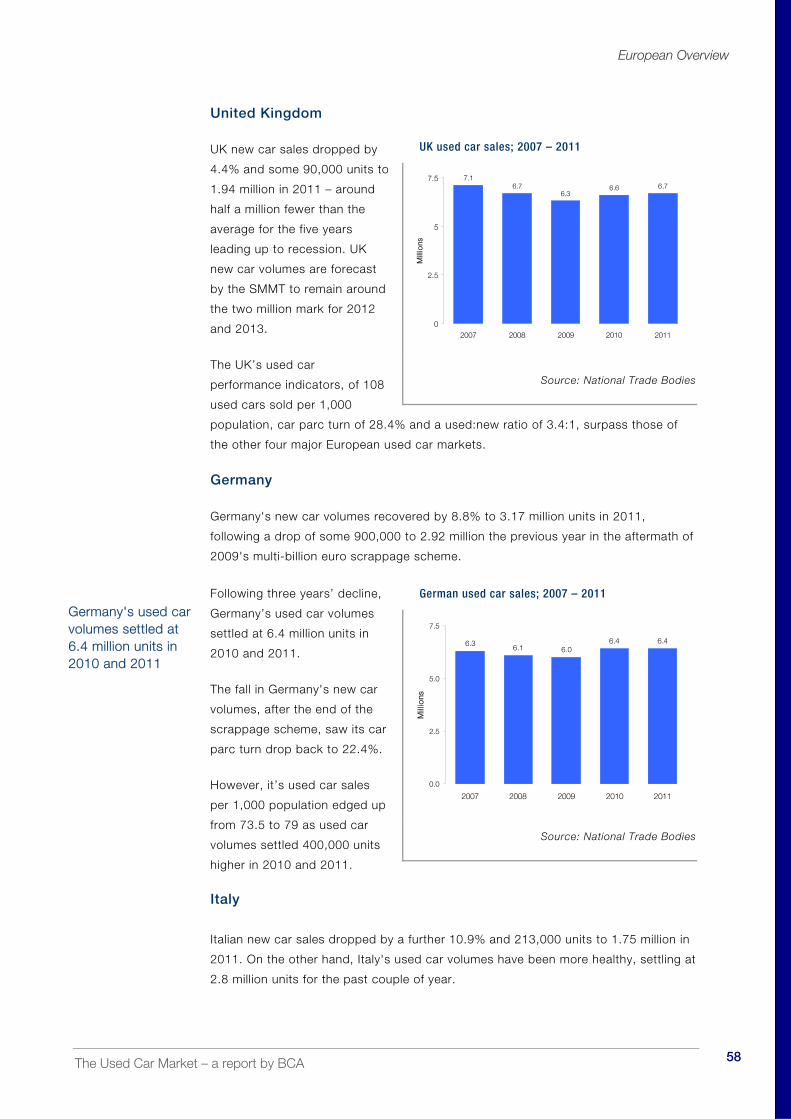
European Overview
The Used Car Market – a report by BCA 58
United Kingdom
UK new car sales dropped by
4.4% and some 90,000 units to
1.94 million in 2011 – around
half a million fewer than the
average for the five years
leading up to recession. UK
new car volumes are forecast
by the SMMT to remain around
the two million mark for 2012
and 2013.
The UK’s used car
performance indicators, of 108
used cars sold per 1,000
population, car parc turn of 28.4% and a used:new ratio of 3.4:1, surpass those of
the other four major European used car markets.
Germany
Germany's new car volumes recovered by 8.8% to 3.17 million units in 2011,
following a drop of some 900,000 to 2.92 million the previous year in the aftermath of
2009's multi-billion euro scrappage scheme.
Following three years’ decline,
Germany’s used car volumes
settled at 6.4 million units in
2010 and 2011.
The fall in Germany's new car
volumes, after the end of the
scrappage scheme, saw its car
parc turn drop back to 22.4%.
However, it’s used car sales
per 1,000 population edged up
from 73.5 to 79 as used car
volumes settled 400,000 units
higher in 2010 and 2011.
Italy
Italian new car sales dropped by a further 10.9% and 213,000 units to 1.75 million in
2011. On the other hand, Italy's used car volumes have been more healthy, settling at
2.8 million units for the past couple of year.
UK used car sales; 2007 – 2011
7.16.7
6.36.6 6.7
0
2.5
5
7.5
2007 2008 2009 2010 2011
Mill
ions
Source: National Trade Bodies
German used car sales; 2007 – 2011
6.3 6.1 6.06.4 6.4
0.0
2.5
5.0
7.5
2007 2008 2009 2010 2011
Mill
ions
Source: National Trade Bodies
Germany's used car volumes settled at 6.4 million units in 2010 and 2011

European Overview
The Used Car Market – a report by BCA 59
Italy’s used car market
performance indicators are very
low, however – used car sales
per 1,000 people at 47, a
used:new ratio of 1.6:1, and a
car parc turn of only 12.5%,
remain well short of French,
German and the UK's much
higher figures.
France
French new car market
volumes fell by 2.1% to 2.2
million in 2011, compared with
2010's higher scrappage-
fuelled figures; holding on to
second place in the European
new car sales league.
French used car volumes grew
230,000 to 5.47 million units in
2010 remaining there in 2011 –
second only to the UK for
performance ratios within the
EU's major markets – used car
sales per 1,000 population
(85.0), car parc turn (24.4%)
and a used:new ratio of 2.5:1.
Spain
Spain's new car volumes fell
by 17.7% and 173,956 units
to 808,059 in 2011. However,
its used car market fared
somewhat better, slipping just
4.4% to 1.58 million units.
While Spain's used car sales
per 1,000 population dropped
from 35.9 to 34.3, its
used:new ratio rose to 2.0:1
from 1.7:1 – and its car parc
turn was one point lower at
11.9%.
Italian used car sales; 2007 – 2010
3.23.0 2.9 2.8 2.8
0.0
2.0
4.0
2007 2008 2009 2010 2011
Mill
ions
Source: National Trade Bodies
French used car sales; 2007 – 2011
5.65.4
5.25.5 5.5
0
2
4
6
2007 2008 2009 2010 2011
Mill
ions
Source: National Trade Bodies
Spanish used car sales; 2007 – 2011
1.7
1.51.4
1.71.6
0
0.5
1
1.5
2
2007 2008 2009 2010 2011
Mill
ions
Source: National Trade Bodies

European Overview
The Used Car Market – a report by BCA 60
Additional sources include:
ACEA (Association des Constructeurs Européens d’Automobiles)
Office for National Statistics
Verband der Automobilindustrie e.v.
Statistisches Bundesamt Deutschland
Zentralverband des dt. KFZ-Gewerbes
Ministerie de l’Equipement, des Transports et du Logement
CCFA (Comité des Constructeurs Français d’Automobiles) France
Centraal Bureau voor de Statistiek, Nederland
FederAuto, Belgium
National Institute for Statistics, Belgium
Danish Automobile Federation
Danmarks Statistik
ANFIA - Studies & Statistics, Italy
INE, España
GANVAM, España
Marketing Systems Iberia
ACAP (Associacão do Comércio Automóvel de Portugal)
Statistik Austria

The Used Car Market – a report by BCA 61
United Kingdom Economic Situation
Professor Peter N C Cooke
While the United Kingdom is not a member of the Eurozone and is unlikely to be for at
least a decade, if ever, half its exports still go to Europe. Any Euro collapse would
therefore have a disastrous impact on an already fragile, debt-ridden, UK economy.
Indeed, many commentators have down rated expectations for economic growth as a
result of the current crisis of confidence in the Euro.
The Euro crisis has had more summits than the Alps. At the time of writing, no
sustainable resolution seems to be emerging beyond bold rhetoric and pleas from the
debtor states for a longer period to get their economies on a sustainable footing.
Chancellor Merkel, on the other hand, is getting more than a little tired of being asked
to write an open-ended cheque to support weaker economies.
Machinations in the Eurozone have an impact on UK businesses and personal
expectations – on new car and LCV volumes and ultimately used car sales.
The UK economy – a macroeconomic viewpoint
UK Gross Domestic Product fell by 0.7% in second quarter of 2012 compared with
the previous quarter – far greater than anticipated by even the most pessimistic
forecasters due, in part, to a contraction of 5.2% in construction industry output.
UK quarterly GDP; 2006 - 2012
1.3
0.8 1.0
-1.1
-2.1
-0.7 -0
.3
0.6 0.7
-0.5
0.2
-0.4
-0.3
0.6
0.4
-0.7
-0.4
0.5
0.30.
6
0.6
0.4 0.5 1.
1
-0.1
-2.1
-5.5
-3.6
-1.0
2.4
-0.8
0.90.8
3.43.1 3.0 3.02.7 2.9
4.7
4.0
2.8
1.1
-6.1
-2.1
1.0
2.11.5
0.8
1.6
-4.5
0.0
-7.0
-6.0
-5.0
-4.0
-3.0
-2.0
-1.0
0.0
1.0
2.0
3.0
4.0
5.0
2006
Q1
2006
Q2
2006
Q3
2006
Q4
2007
Q1
2007
Q2
2007
Q3
2007
Q4
2008
Q1
2008
Q2
2008
Q3
2008
Q4
2009
Q1
2009
Q2
2009
Q3
2009
Q4
2010
Q1
2010
Q2
2010
Q3
2010
Q4
2011
Q1
2011
Q2
2011
Q3
2011
Q4
2012
Q1
2012
Q2
-7.0
-6.0
-5.0
-4.0
-3.0
-2.0
-1.0
0.0
1.0
2.0
3.0
4.0
5.0
vs.Previous Quarter vs. Quarter previous year
%%
Source: ONS
Machinations in the Eurozone have an impact on new car and ultimately used car sales

United Kingdom Economic Situation
The Used Car Market – a report by BCA 62
The figures also show a steady fall in the GDP trend versus the same quarter in 2011
– essentially a further slowing down of economic output which is currently 4% lower
than the outset of the 2008/2009 recession. The orange line is indeed a roller coaster
which, we are regularly assured ‘is about to turn and start to recover’.
The following chart shows the two key inflation measures recognised by everyone
but, arguably, understood by few. The key issue is that prices have failed to drop
back to the Bank of England’s target level of 2% target year-on-year increase, albeit
both indicators are now coming down.
RPI and CPI; 2006 - 2012
-2.0
-1.5
-1.0
-0.5
0.0
0.5
1.0
1.5
2.0
2.5
3.0
3.5
4.0
4.5
5.0
5.5
6.0
Jan
2006
Jan
2007
Jan
2008
Jan
2009
Jan
2010
Jan
2011
Jan
2012
%
% c
hang
e ye
ar o
n ye
ar
RPI CPI
Source: ONS
More importantly for many, the Consumer Price Index (CPI) is now the figure used as
the base for determining adjustments to index-linked state benefits.
Not for the faint hearted
The UK economic situation might be summed up in a number of bullet points,
although perhaps not for the faint hearted. Consider the implications for both new
and used car businesses, suppliers and customers – as well as the wider economy.
The economy is in recession and informed opinion suggests this situation could
continue for a third quarter.
The Bank of England has confirmed quantitative easing will be continued, and
funds will be made available to banks to lend to industry as well as assurances
that, should there be significant problems with the Eurozone, banks will be able
to draw down whatever funds are necessary. The problem with such largesse is
the impact on pensions, long-term investment and inflation.

United Kingdom Economic Situation
The Used Car Market – a report by BCA 63
Family net incomes have dropped by something like £12 a week or 7.1% in the
past year. Consider the impact this might have on a private motorist buying a first
or replacement used car.
Unemployment remains high albeit, in recent months, it has shown signs of
coming down. The hardest hit are under 25s – a classic used car buying
segment. Part of the challenge is to make the younger group employable and
create jobs to replace manufacturing where earlier generations started their
working life.
At the time of writing, the level of new jobs being created in the private sector is
outrunning the loss of jobs in the public sector. That could, in turn, increase
demand for used cars and used LCVs for start-up situations.
There is still a high degree of confusion over employment law and policy versus a
family-friendly economy. Which should take priority? Is this a time for pragmatists
to rule?
The Coalition has indicated ‘growth with austerity’, but has not yet spelt out what
this actual means for businesses.
SMEs are still being starved of finance as banks seek to rebuild their balance
sheets and larger organisations hoard in excess of £750 billion in cash reserves.
A growing proportion of these funds are being invested abroad where the tax
regime may be more clement. In mid June, the Governor of the Bank of England
announced, belatedly, a loosening of low-cost funds to banks to lend to business
rather than hoard to rebuild their balance sheets.
Any continued strength of sterling versus the Euro could, towards the end of this
year, lead to the major car manufacturers, with underutilised manufacturing
capacity in Europe, storming the UK with low-cost special deals for new cars.
What might be the impact on the used car market?
The relative stability and strength of sterling over the Euro might be judged by the
policy of many international businesses transferring all their cash at the end of
the day into sterling in London – then moving it back the following day.
Do we have a Plan B?
Whether, at mid year, a ‘Plan B’ is emerging, or even exists, is a moot point. There
are signs across Europe that ‘austerity alone may not be the solution’, but the UK is
not in the Eurozone. The Bank of England and the Chancellor have announced further
attractive funding for banks ‘to lend to industry’. One concern is whether banks have
been too brutal in the past, and SMEs are concerned about asking for funds because
of the terms, conditions and rates they will be expected to accept. Would there be
implications for both new and used car sales?
SMEs are still being starved of finance
Whether a 'Plan B' is emerging, or even exists, is a moot point

United Kingdom Economic Situation
The Used Car Market – a report by BCA 64
Forecast new car volumes; 2012 - 2015
Before we examine new car sales forecasts, it is interesting to consider how the
shape of the United Kingdom car market has changed over the past decade.
Consider the following points – how many apply to your own new and used vehicle
business experience?
Historic mainstream manufacturers have lost significant market share – no single
brand now has anything like a consistent 20% share. In living memory, three
motor manufacturers used to dominate the market with 80% of new market
volumes between them which, of course, used to feed through to the used
vehicle market.
How will Chinese indigenous brands be accepted alongside western brands? Will
used vehicle prices be a bonus or an Achilles’ Heel until there is market
familiarity?
Customers are no longer satisfied with the ‘evolutionary model’ whereby a vehicle
would go through several facelifts before being replaced. ‘Radical new products’
are demanded with the associated costs and risks for the manufacturer. This, in
turn, can create used car problems.
There has been a steady and indeed growing demand for niche products
including luxury cars and premium brands as the new car market has become
more segmented.
It is against such pressures that any forecasts have to be made. Macroeconomic
professional forecasts are often such that one might as well wear a pointy hat and
carry a ginger tomcat as a forecasting aid.
The key is probably sensitivity to qualitative issues and the ability, in the United
Kingdom, to think away from the affluent south east market, which is surprisingly
stable. In future, regional splits and analyses will become ever more important.
The chart overleaf shows how registrations fell from a peak of 2.5 million in the mid
2000s to 1.94 million in 2011 – or to an underlying demand of 1.71 million in 2009 if
new car scrappage deals are discounted.
The hatched area, in 2009 and 2010, illustrates new cars sold under the auspices of
the scrappage scheme, where private buyers received a £2,000 subsidy when trading
in a 10 years-old plus car for a new one.
Arguably, many of these scrappage vehicles are ‘lost to the industry’ in that they will
be retained by their proud owners for several years – many of whom will ‘probably
never buy another new car’. The Korean and Czech motor industries did particularly
well out of the UK scrappage incentive. As such, the scrappage units could
contribute to the emerging shortfall of younger, higher-value used cars.
Historic mainstream manufacturers have lost significant market share

United Kingdom Economic Situation
The Used Car Market – a report by BCA 65
UK new car registrations; 2000 - 2015
0.28
0.11
2.34
2.22 2.20
1.94
1.921.71
2.13
2.40
2.57
2.442.46
2.56 2.58
2.10
1.97 1.99
1.0
1.2
1.4
1.6
1.8
2.0
2.2
2.4
2.6
2000
2001
2002
2003
2004
2005
2006
2007
2008
2009
2010
2011
2012
2013
2014
2015
Mill
ions
of
cars
New car sales Scrappage deals New car sales forecast
2.031.99
Source: SMMT/Buckingham
There have been calls from at least one European industry leader to reintroduce some
form of scrappage or subsidy to boost new car sales in Europe. It is the writer’s
opinion that any such move would be counter-productive, and the nations, which
would benefit most, would be Korea, CEE states and other producers of the smallest,
lowest-priced cars.
For 2012, the Centre for Automotive Management Team forecasts volumes much in
line with 2011. It may be necessary to drop this projection slightly in the coming
months in the light of the most recent economic performance. Equally, if the
Eurozone-manufacturers decide to force feed new car sales later in the year, these
forecasts could be conservative.
Looking beyond 2012 and 2013, growth will probably be slow, much in line with
economic performance and new car sales are not likely to hit 2.2 million units until
2015 – or beyond.
The key factors influencing the economy might be as follows;
Speed of economic recovery in the United Kingdom and the problems within the
Eurozone
Tight financial situation – both domestic and SMEs – but with new sources of
funds becoming available. Equally, innovative higher-risk lenders are moving into
the market.
Apparent inability, as yet, of the government to stimulate the economy.
Underlying personal employment and political uncertainty with further growth in
unemployment. Coalition does little to repair this issue
Looking beyond 2012 and 2013, growth will probably be much in line with economic performance

United Kingdom Economic Situation
The Used Car Market – a report by BCA 66
Many other problems could be identified, but 2012 is not looking like a year full of
economic promise. ‘Muddling through and getting back to zero rate growth in the
foreseeable future’ would be acceptable to many in the Treasury.
Two factors might change this somewhat pessimistic new car sales forecast by
generating increased volumes:
Car manufacturers taking advantage of the favourable sterling; Euro exchange
rate and importing high volumes of new cars from the Eurozone to the United
Kingdom
Manufacturers and dealers self registering significant numbers of units towards
the end of the year.
Used Car Market
It has been often claimed that the role of the new car market is to create vehicles for
the used car market. The UK used car market is about three times the new car
market in volume terms, and around £6 billion greater in value.
There will be a shortage of younger used cars for nearly a decade; the car parc of
units under five years old is around 2.5 million units lower than that of pre-recession
times. This, in turn, will lead to a new way of looking at the used car market – we
anticipate successful used car operators will appoint a Used Car Supply Manager,
whose sole task will be to ensure a steady supply of used cars to match customers'
expectations.
Both the new and used car industries are so large that they are closely linked with the
rest of the UK economy. Any significant change elsewhere can impact quickly on the
automotive sector, particularly changes and hiccups in the financial services sector.
There will be a shortage of younger used cars for nearly a decade

The Used Car Market – a report by BCA 67
Prospects, Buyers and Follow-ups
Professor Peter N C Cooke
Many a guru claims we are in the ‘age of communications’ and ‘we can enhance the
consumer experience through communication’ – generally without defining
‘communication’. This magic word, at its most basic, means not just talking at people
in whatever form, but listening, too, then responding properly to feedback.
Tyre-kicking has gone online
But just how good are used car dealers at 'communicating' in the proper sense of the
word? ‘Tyre-kicking has gone on line’ is one clear message about the car buying
process. Google research has shown 86% of car owners start their research on what
car they might buy using search engines, yet more than half of these don’t end up
buying their first choice of brand.
In the pre-digital era, car buyers used to make five or more dealer visits during the
buying process, their experience restricted largely to the showroom. Today,
consumers make only 1.3 visits on average, which means dealers must interact
effectively with customers via on-line channels – and make the most of that one
'golden' chance when they get face to face with the customer.
Social media presence
Experts suggest a social media presence on Facebook, Twitter and Linkedin are vital.
Some take this environment one step further and claim the fast-growing adoption of
Smartphone technology means it is important to have a mobile-friendly website,
optimised with localised search technology. More manufacturers and dealers are
investing in such technology. Online, one in five searches has local content and one
in three on a mobile. Car buyers are increasingly searching for dealership and car
information while on the move.
A fickle mistress
Technology is, however, a fickle mistress. One can have all the technology under the
sun, yet get absolutely nowhere. It is critical to get the basics right. Car buyers are
increasingly demanding and that can influence every demographic group. ‘Silver
Searchers’ can be a formidable adversary indeed. They have time and may have the
inclination to prepare their homework thoroughly, and woe betide the salesperson
who cannot handle their most searching questions in that potentially short, but critical
first meeting.
.
'Tyre kicking has gone on line' is one clear message about the car buying process

Prospects, Buyers and Follow-ups
The Used Car Market – a report by BCA 68
‘Doing the basics well’ is a message that does not always get listened to –
technology is no substitute for personalised service, for product knowledge and an
awareness of stock availability – all the more complicated for used cars. A
salesperson is at an immediate, embarrassing disadvantage if a potential buyer walks
on to the site knowing as much, if not more, about the product range and stock
availability than the person whose task it is to sell to them
More than ever, the opinions of potential buyers are being formed outside the
dealership, by friends and family, by other users of electronic devices and
communications. Advocates claim dealers need to have a structured online
engagement and monitoring system in place using a sophisticated CRM program.
Customer Contact – what is it really?
The concept of customer contact is probably as old as Adam and Eve getting
together, yet do used car dealers pay more than lip service to it? Dealers spend a
fortune on trying to win new customers – advertising, websites, a presence on
Facebook, contact through Twitter – but how much time and effort is spent on
keeping in contact with their existing customer base?
Experience and surveys suggest dealers' sales staff are all too often not particularly
good at keeping in touch with existing customers and trying to interest them, or their
friends and family, in buying another car – bearing in mind a quarter of families own
two or more cars. Just how often do salespeople personally follow up recent, and not
so recent, buyers of used cars?
According to
this year's
consumer
survey, nearly
half of used car
owners had not
heard anything
from the dealer
they bought
their used car
from – as the table shows this is, sadly, 'par for the course'.
The number of existing customers who said they had been approached to see if they
were interested in replacing or buying another car has slipped to less than one in 10
car buyers in this year's survey – while the possibility of selling a car to a 'friend or
family member' appears to be off most dealers' radar.
Quite simply, contact with the existing customers has declined in an increasingly
difficult and competitive market – when long-term experience suggests it's around
nine times easier to retain an existing customer than find a completely new one . . .
Customer contact; 2007 – 2012
2007 2008 2009 2010 2011 2012
No contact 45% 48% 44% 44% 44% 48%
Servicing car 34% 32% 35% 32% 35% 31%
Satisfied with car 31% 30% 27% 32% 27% 24%
Change car 12% 14% 15% 14% 15% 9%
Sell to friend/family 3% 4% 3% 3% 1% 3%
Source: BMRB
Just how often do salespeople personally follow up buyers of used cars?

Prospects, Buyers and Follow-ups
The Used Car Market – a report by BCA 69
Car owners' preferences
Social media is undoubtedly a growing force and very much the hot topic for industry
consultants and media specialists. But, how do prospects and consumers prefer to
be contacted? This year, the BCA consumer survey asked car owners how they
prefer the dealer who sold them their used car to keep in touch with them.
Keeping in touch – customers' preferences
28
13
1
1
1
2
4
6
9
14
15
18
Don't know
Other
Text message
Radio
Telephone call
TV
Press
Website information
Letter\mailing
Email %
Source: BMRB
While a number of issues arrive from the chart, the overriding message is that car
owners prefer a ‘passive approach’ and much prefer gathering information in their
own time when they are ready to do so.
The top five responses could all be classed as a form of ‘passive data
communication' and account for three out of five of overall responses. On the other
hand, telephone, Twitter, Facebook and Text Messaging, which might be broadly
classified as ‘intrusive communication’, jointly account for just 7% of responses.
The most interesting response is perhaps the ‘don’t knows’ accounting for 28% of
the total contacted, to which one might add the ‘other’ count of 13%. Have these
would-be buyers not thought about it or are rather indifferent to the means of
contact?
Given the hugely positive responses claimed by electronic media companies on how
highly successful their communications platforms are for clients, email and websites
appear to be the most successful by some distance. Perhaps the message is ‘give us
the information in an easily-digestible format, and we'll will pick it up and look at it
when we are ready’. Maybe there is much wisdom in the phrase ‘you can take a
horse to water but not make it drink’?
The top responses could all be classed a form of 'passive data communication'

Prospects, Buyers and Follow-ups
The Used Car Market – a report by BCA 70
While electronic media offers a cost-effective way to reach a wide audience, it is
important to ensure the message being put over is both relevant and meaningful for
the target audience.
What used car to consider buying?
A well-worn definition of 'marketing' is 'to identify, attract, satisfy and retain
customers at a profit'. Used car dealers can spend considerable sums of money and
effort trying to interest car buyers in what they have to offer (attract) – but are they
spending their time and money wisely? Are they 'pressing all the right buttons' that
influence car buyers when deciding what used car to consider buying?
Each year's BCA consumer survey asks car owners what factors have the biggest
influence on them in this regard.
Influences on type of used car considered
2
4
4
4
6
6
8
8
8
10
12
15
21
24
16
Social media
Car TV shows
Dealer advice
Specialist motor mags
Car TV ads
General car mags
Newspaper adverts
Cars on street
Consumer reports
Dealer websites
Used car physical sites
Test drive
Internet sites
Personal experience
Family & friends %
Source: BMRB
The top two factors, 'family and friends' and 'personal experience' account for 45%
responses – once more, two passive influences. Although, if one adds 'Internet sites',
which are essentially passive, the total rises to 61% of car owners' responses. Again,
a case of personal decision and timing.
The media –in the form of newspapers, magazines and TV activities appear to have
little influence on the type of used car motorists first look for – with 'social media' yet
to make inroads at this crucial stage of the car buying process.
'Social media' yet to make inroads

Prospects, Buyers and Follow-ups
The Used Car Market – a report by BCA 71
The strategic message coming from this list of car owners' preferences is the huge
importance placed on 'friends, family and personal experience', when deciding what
used car to look for. Does this merit some sort of rethink on dealers' high-tech and
sales activities?
Strategic implications
A number of strategic implications might be extracted from the foregoing comments.
Salespeople appear to more focused on winning new customers, losing sight of
the potential from existing customers and their friends, family and colleagues.
Contacts with existing customers can offer a wide range of service and value-
added opportunities as well as leads for car sales. The most obvious opportunity
is the 'family fleet'. Remember, every 17 year-old may one day be a respectable
buyer looking for a first or second used car.
Customers and prospects want to feel in control of their purchasing preferences
and decisions and may not be party to social media or other means of electronic
intrusion. Remember, older men and women buy used cars too and still have
significant purchasing power. According to the Institute of Fiscal Studies, more
than 40% of 'pensioners' are now in the top half of the income scale.
Car buyers look for meaningful information and professionalism – although
contact with them to build a relationship does not mean a weekly contact with
‘an offer they can’t afford to miss'. Database management will allow dealers to
follow a customer's acquisition cycle and gather service business as well. The
‘bus syndrome’, of ‘nothing for an hour and then three come together’, is all too
easily replicated with uncoordinated electronic media use.
One hears and reads much talk about ‘enhancing the customer experience’, but
equally important is 'silence' and not constantly bombarding individuals with
unsolicited, inappropriate offers.
Quite simply, think through the objective of customer communications – keeping
customers happy, building loyalty and retention, prospecting, pitching the right
product at the right time – and getting in touch discreetly to interest them in
discussing their plans on the car front.
Customers may not be party to social media or other means of electronic intrusion

The Used Car Market – a report by BCA 72
LCVs – A Black Hole on the Horizon?
Professor Peter N C Cooke
The UK's new and used LCV markets are much smaller than the new and used car
sectors. Nonetheless, LCVs have a critical role to play in the economy and, it might
be argued, used LCVs have a crucial role to play in the country's economic recovery.
The majority of new LCVs are bought in large numbers by a relatively small group of
large fleets – public utilities, government, local authorities, short-term rental and
logistics companies are amongst the major buyers. Their purchasing power allows
them to negotiate attractive prices, finance and tight delivery schedules.
When these big players change their vehicles they expect to achieve good disposal
values. Their sheer size and sophisticated disposal routes mean they can defleet
relatively quickly, with a minimal loss, if any, when their level of business means they
need to downsize their fleet. These sometimes younger, lower mileage used LCVs are
generally bought by small/medium enterprises (SMEs) at much lower prices than
equivalent new vehicles.
The used LCV market equilibrium has clearly been upset over the past four to five
years by the steep drop in new LCV sales since 2007, a reflection of the most severe
and lasting economic downturn on record.
New LCV sales plummet
The chart shows new LCV registrations between 2000 and 2011. Considering the
weak state of the economy, and the dearth of new car volumes, it is somewhat
surprising, and curious, that new LCV sales rose by 37,000 units in 2010 and the
same amount in 2011.
UK new LCV registrations; 2000 - 2011
239
254266
304
330323 327
338
289
186
223
260
100
150
200
250
300
350
2000
2001
2002
2003
2004
2005
2006
2007
2008
2009
2010
2011
Tho
usan
ds
of un
its
Source: SMMT
The used LCV market equilibrium has been upset over the past for to five years

LCVS – A Black Hole on the Horizon?
The Used Car Market – a report by BCA 73
Two such increases don’t represent a trend, however – with new LCV registrations
going into reverse, once more, in 2012. Sales volumes for the first six months of 2012
are down 10.1% on the previous year at 119,786 units – with the rolling year total
standing at 246,701. This is some 13,000 units less than 2011's total of 260,000,
and 90,000 fewer than 2007's all-time high of 338,000 units.
Replacing overage vehicles
Two consecutive year rises in sales, in 2010 and 2011, is somewhat difficult to justify,
beyond that it happened. The explanation for the growth is probably quite complex
and perhaps lies with rental and utility companies replacing over-age vehicles,
possibly using accumulated funds to source new LCV units at exceptional prices. In
addition, growth was from a very low base in 2009.
It would be reasonable to expect the incremental volumes of used LCVs from such
fleet updates to have had a detrimental effect on used LCV auction prices. However,
the following chart shows no such thing happened; indeed average used LCV prices
at auction have held up remarkably well over the past two years.
Average LCV auction prices; 2009 - 2012
£2,9
24 £3,1
17£3
,544
£3,4
73 £3,5
95£3
,468
£3,5
66 £3,7
45 £3,8
62£3
,858
£3,9
02£4
,008
£4,4
27 £4,5
85£4
,500 £4
,633
£4,4
66£4
,280
£4,1
12
£4,2
11£4
,146
£4,1
79£4
,030
£4,0
67 £4,2
22
£4,1
46
£4,1
80£3
,969
£4,2
18
£4,1
40
£4,1
30£4
,056
£4,4
09£4
,301
£4,3
03£4
,275 £4
,483
£4,2
72£4
,227
£4,2
71£4
,370
£4,1
71
£2,000
£2,500
£3,000
£3,500
£4,000
£4,500
£5,000
Jan-09
Mar May July Sept Nov Jan-10
Mar May July Sept Nov Jan-11
Mar May July Sept Nov Jan-12
Mar May
Source: BCA
More importantly, the age of used LCVs coming to auction in June 2012 has risen by
over six months and they have an additional 7,000 miles on the clock than 12 months
earlier.
These apparent anomalies – older units, higher mileage and higher selling prices
suggests there are more complex, perhaps strategic issues at play – which may not
yet be critical, but could possibly impact on the rate of economic recovery later in the
recovery cycle.
The age of used LCVs coming to auction has risen by over six months

LCVS – A Black Hole on the Horizon?
The Used Car Market – a report by BCA 74
The used LCV supply gap?
Assuming demand for used LCVs in a ‘normal economic period’ would be in the
region 310,000 a year (the exact number is not critical), the crucial issue is the lack of
new LCV sales below the dotted line.
This represents a potential shortfall of some 375,000 first-time used LCVs being built
up between 2008 and 2013 (and counting until new volumes reach some 300,000
units) – the effects of which will hit hard in 2013/2014 as the desperately low new
LCV volumes from 2009 come up for replacement.
UK new LCV registrations; 2000 – 2013
239
254266
304
330323 327
338
289
186
223
260
236
250
100
150
200
250
300
350
2000
2001
2002
2003
2004
2005
2006
2007
2008
2009
2010
2011
2012
2013
Tho
usan
ds
of
units
Supply Gap
Source: SMMT
Not yet critical
In a period of continuing recession or, at best, a flat economy, such a severe shortfall
in potential used LCV stock is not yet critical. Demands can and are being met by
fleets and businesses extending replacement cycles.
The problem comes when the economy starts to recover. Government has indicated
there will be pressure to boost new housing starts, to refurbish the country's
infrastructure, with the private sector driving recovery forward. However, SMEs and,
more importantly, start-ups may have difficulty sourcing younger used LCVs to
support their businesses.
This represents a potential shortfall of some 375,000 first-time used LCVs
LCVS – A Black Hole on the Horizon?
The Used Car Market – a report by BCA 75
In the building industry, alone, there are some 876,000 small businesses – one fifth of
UK enterprises. Similar scenarios exist for services being outsourced by local
authorities and for the SMEs that provide delivery services for the burgeoning online
shopping industry. In 2010, there was an increase of some 87,000 sole proprietor
businesses.
Emerging issues for the used LCV industry
The latent and looming black hole in used LCV supply might once have caused a
rubbing of hands at the thought of incremental profit opportunities for retailers. All
very well, if all of the competition is doing the same. However, the used LCV sector is
likely to remain a highly competitive sector, and plans need to be developed and
implemented ready for the recovery – which will come at some stage.
Used LCV dealers might consider the following points:
In terms of assured used LCV supply, will one source be sufficient or might it be
prudent to establish a number and have agreements with them?
Are there additional value-added services such as servicing, finance, warranties
and insurance that might be developed to generate incremental profit, if the
volume of used LCVs and margins are squeezed?
Given there will probably be significant changes to the used LCV supply chain,
contingency actions, repositioning or diversification may need to be considered.
Realign the business
The used LCV industry is volatile, supplies of good quality, younger used vehicles are
already limited, and there is a strong likelihood the market will be 'starved' of these
over next few years.
The used LCV market may also become more competitive and used LCV retailers
might well have to realign their business to meet the threat of the looming shortage of
traditional stock.

The Used Car Market – a report by BCA 76
Dealers Need to Face the Challenge of Changes in Consumer Behaviour
Tim Peake, Group Strategy Director, Trader Media Group.
The biggest challenge facing used car dealers in today’s market is the changing
behaviour of consumers. Consumers know how to use online tools to search for cars
and are better informed than ever before, but are dealers as well informed?
Auto Trader research shows that consumers are browsing and researching online
much more than ever before. They are now searching for cars using not just PCs but
increasingly mobile devices, including tablets. The information available to consumers
is available to dealers. If a consumer can search for a car in a local area and discover
how much a vehicle is selling for so can a dealer, but how many actually do?
Engagement continues to grow
Source: Auto Trader
Most dealers don't seem prepared to do it
High street supermarkets do it, Amazon does it. The travel industry now does it. But
most car dealers don’t seem to want to do it. Using dynamic market intelligence to
support decisions is second nature for most successful retailers.
They all invest time and money making sure they know what consumers want, when
they want it and how much they are willing to pay for it. This is an essential and well
proven ingredient in any successful retail business.
Consumers are browsing online much more than ever before
-
5,000,000
10,000,000
15,000,000
20,000,000
25,000,000
30,000,000
35,000,000
40,000,000
45,000,000
Jan-10 Jan-11 Jan-12
Searches Ad views

Challenge of Changes in Consumer Behaviour
The Used Car Market – a report by BCA 77
Research also shows that 50% of usage takes place out of the home, enabling car
buyers to access the web in different environments where they couldn’t before. The
busiest time of day on Auto Trader and most used car sites is in the evening between
7pm and 11pm. In addition 30% of consumers are now willing to transact online,
while 85% would be willing to pay a 10% deposit online – 5 years ago this would
have been zero. Trust in the Internet, and transacting on the Internet has improved
significantly.
The almost universal use of online search tools today means the buying process has
changed. In 2000, a car buyer would average seven visits to a dealer’s forecourt
during the research phase whereas in 2011 it was down to two visits.
The 'zero moment of truth'
The point of purchase has also changed. We used to simply rely on the classic
stimulus and then first and second 'moment of truth’ to sell anything, from fridges to
TVs to cars. The Internet has created an interloper between the stimulus and first
moment of truth – the 'zero moment of truth'. We all now have the capacity to
research and price the potential product before we venture into the dealership.
Dealers acknowledge that car buyers now turn up at the dealerships with greater
knowledge than ever before.
Essential dealers respond quickly
It’s a sobering thought that today 25 million people use their mobile device to go
online every month. Auto Trader Mobile sees 27 million searches per month, that’s
58,000 cars viewed per hour and over 7,000 calls made every day. On average 16%
actually search on the way to a dealer. With all this online activity it is essential a
dealer’s online presence stands out, is mobile optimised and that the dealer responds
quickly to enquiries.
Unique visits to Auto Trader by mobile
Source: Auto Trader
16% search on the way to a dealer

Challenge of Changes in Consumer Behaviour
The Used Car Market – a report by BCA 78
However, even if a dealer has a strong online presence, and a frequently updated and
easy to navigate website, if the basics are ignored then all that investment will have
been wasted. Phone calls and emails are usually the final point of a car buyer’s
research – ignore these requests at your peril! Unfortunately many do. A recent
mystery shop of 1,300 dealers found that 50% had ignored requests for information
and had failed to respond within 24 hours.
Data – an opportunity not a threat
The automotive industry is awash with data, yet it is surprising how little of it is
practically used. It seems old habits die hard and data is seen by many as a threat to
tried and trusted instinct, experience and judgement. Dealers should use this instinct,
experience and judgement to complement the data and not to second guess it.
We do know that dealers who use market intelligence products to support their
decisions are more profitable. A recent survey of over 6,000 dealerships, with more
than 20 used cars in stock, found that 54% of their stock has low current regional
demand – and only 40% of their vehicles are priced to deliver strong Internet
response and good margin – the remainder are either priced too high or too low.
Intelligence is invaluable and readily available
Intelligence on market trends, pricing and local demand when buying, selling and
retailing stock, is invaluable and also readily available. Understanding which are the
most sought-after makes and models and what price should be paid for them will
help a dealer stock the right product and buy it at the right price.
Furthermore, having an effective pricing strategy once cars are on the forecourt to
maximise stock turn will have a significant effect on overall profitability – a key
objective of any successful used car retail operation. The average UK stock turn is 5-
6 times per year. However, there are used car operations achieving significantly
better who clearly benefit from the increased opportunities in F&I, servicing, repeat
business and return on capital invested.
Analysing the available market data and making intelligent use of this to influence
pricing and purchase decisions will not only provide a competitive advantage, it will
also set the benchmark for other dealers in the area.
The winners of the future
But the intelligent use of data isn’t just an occasional activity – it should underpin the
business on a daily basis. Those dealers that start to act like retailers in their attitude
towards data will be the winners of the future, evolving from traditional dealers to
become Internet car retailers. Those that don’t will continue to struggle as consumer
power increases fuelled by the on-going transparency created by the Internet.
Dealers should use instinct, experience and judgement

The Used Car Market – a report by BCA 79
BCA – Europe’s Leading Vehicle Remarketing Company
BCA is Europe’s largest vehicle remarketing company with 19 UK remarketing
centres and a dedicated administrative hub and data centre, plus a further 26
Mainland European facilities. BCA employs over 2,100 well-trained and highly-
motivated staff delivering a wide range of services to buyers and sellers of used
vehicles.
BCA sells around 600,000 vehicles in the UK annually, with a further 200,000 sold in
Europe through a variety of physical and online channels. The company is on target
to sell 130,000 vehicles online in the UK during 2012, with around 100,000 online
sales taking place in Europe.
BCA – we’re easy to do business with
BCA is innovative and adaptive to changing market conditions. The company has
moved a long way in a short period, from being just an Auction Company selling in a
physical environment to a Multi-Channel Remarketing Company, selling vehicles
through a variety of physical and online channels and offering a range of
complementary services.
BCA has listened to its customers and is focusing on delivering services that meet
their needs, whether they are a buyer or seller. By constantly measuring customer
satisfaction and benchmarking service levels, BCA works with its customers to deliver
effective outcomes in a highly competitive marketplace.
BCA delivers a constant and significant investment in highly-skilled staff to develop
technology solutions appropriate for the marketplace we operate in. This brings
benefits to customers in terms of efficiencies and profitability, rather than just being
technology for technology’s sake.
BCA sets the pace for online sales
BCA has long been the leader in the provision of physical auction services and
continues to be so both in the UK and on mainland Europe. Now, the BCA online
offering is the most attractive available in terms of choice of platform, quality of stock,
quality of information, robustness of the technology and the ease of use. Our
customers tell us they want to buy and sell used vehicles online 24/7, 365 days a
year to gain a competitive edge – and that is exactly the opportunity BCA gives them.
BCA offers a choice of online routes to market - Live Online, Bid Now, Buy Now and
e-Auction – and vehicles can be Offsite or Onsite when they are offered for sale.
BCA’s Live Online dominates the sector with 106,000 vehicles sold in 2011.

BCA – Europe's Leading Vehicle Remarketing Company
The Used Car Market – a report by BCA 80
Up to 1,700 Live Online sale sections are staged every month and 90% of BCA stock
is available through this route. Buyer support is massive with over 2,500 individual
trade customers purchasing every month in the UK.
BCA has the infrastructure and expertise to support the requirements of multiple
physical and online selling channels. Sales activity is supported with a sophisticated
logistics operation, accounting for around 850,000 collections and deliveries and
120,000 end-of-life inspections in the UK alone, while 732,000 vehicles are pre-sale
prepared using a range of specialist services.
BCA develops E-Sales key enablers
BCA has invested in a number of specialised products and services to support the
wider remarketing activity.
Autograde – launched in 2011 – standardised BCA’s gate appraisal system to
automatically generate a vehicle condition grade based on the defects identified.
BCA’s goal is that every car offered for sale whether online, in the auction hall, or via
any other sales channel including any vehicles located ‘offsite’ will be ‘condition
graded’ accurately, truthfully and objectively. Accurate condition and grading
statements are critical to building buyer confidence – particularly for remote bidders –
and BCA continues to work closely with trade associations NAMA, the RMI and the
BVRLA to agree industry standards.
BCA Assured – also launched in 2011 – provides peace of mind to buyers with a
report on a 30 point mechanical check carried out by an independent motoring
organisation. This includes an onsite drive to test brakes (to VOSA standards), as well
as checks on warning lights, tyre depths, engine noise, limited gearbox check,
suspension and fluid levels. The report appears in pre-sale cataloguing on the BCA
website and a printed copy is available with the vehicle when it is sold.
Appraise Value and Sell – this online tool launched in 2012 and comprises three
modular components that provide a range of benefits for used car sellers. The tool
generates consistent and objective appraisals, powered by BCA Autograde, accurate
real time valuations – BCA Marketprice – using the UK’s largest used vehicle
databank and Smart Sell – a seamlessly linked remarketing process. Sellers can use
just one, two or all three functions and as a web-based tool the product can be used
by any computer with an internet connection – from tablet to desktop.
Arbitration – BCA is setting the industry standard with resolution policies that reflect
the changing environment of the remarketing sector. The Live Online Dispute and
Arbitration Policy (LODRAP) and Mechanical Dispute and Arbitration Policy (MEDRAP)
are now fully enshrined within BCA’s Terms & Conditions.

BCA – Europe's Leading Vehicle Remarketing Company
The Used Car Market – a report by BCA 81
Mobile Technology – customers are increasingly choosing to interact with the
remarketing sector via mobile devices and BCA is leading the way in developing
responsive web technology that identifies the device that is viewing the company’s
website and configures itself appropriately. This ‘app-free’ approach means any
customer can interact with BCA online through any mobile device and enjoy the
optimum result.
More customers deal with BCA
BCA talks and listens to customers to meet their needs.
Many major volume sellers use BCA for their remarketing programmes, often
exclusively, including vehicle manufacturers, leasing and contract hire operators, daily
rental companies, financial institutions, government bodies and utilities, dealers and
traders. BCA’s selling service is based on delivering the best residual value for
vehicles and fastest speed of cash to bank, with total security and peace of mind.
BCA does much more than sell used vehicles for its vendor customers. The company
offers a range of bespoke outsourced services that go much, much further. These
include:
Remarketing Managing Partner for volume sellers
Managing upstream Affinity Sales/Driver Sales
Running manufacturer Stock Market and Fleet Repatriation Services,
Delivering full service De-Fleet Management
Operating as a Pan-European Remarketing Partner delivering a structured sales
programme across multiple markets
Running Offsite Sales Programmes for a range of vendors
Handling all ‘end of life’ vehicle movements as a Logistics Partner.
The exclusive MyBCA loyalty programme delivers a range of benefits for professional
motor industry buyers, linked to the volume of vehicles they purchase from BCA. It
also offers customers access to business-critical information on the latest trends and
movements in the used vehicle market.
For all its customers, BCA offers end-to-end operational fulfilment, the highest quality
of service and value adding relationship management.

The Used Car Market – a report by BCA 82
BCA Network

The Used Car Market – a report by BCA 83
Statistical Data
This section of the Used Car Market Report includes data taken from the 2012 BMRB
International survey of 4,000 UK car owners, providing an insight into their views and
preferences in buying or owning a used car.
It supplies background information on the Consumer Experience and Regional
sections of the report, and allows readers to draw comparisons with their own views
and experience of the UK used car market.
NB All responses are percentages.

Statistical Data
The Used Car Market – a report by BCA 84
Q How many cars are in your household?
Total Men Women 17-24 25-34 35-44 45-54 55-64 65+ AB C1 C2 D E
One 45 46 45 33 47 49 45 48 47 43 45 51 49 31
Two 22 25 20 16 18 31 31 28 12 34 25 21 9 4
Three or more 4 4 4 7 2 3 8 5 2 9 4 3 1 2
None 28 25 30 43 32 17 17 19 38 14 26 24 41 63
Scotland North Yorks & Humb
North West
West Mids
East Mids
East Anglia
Wales South West
South East
London
One 39 53 49 45 45 42 43 49 50 46 41
Two 25 16 20 28 26 24 28 26 24 22 13
Three or more 10 1 4 2 4 2 7 8 3 6 2
None 26 30 27 26 25 32 21 17 22 26 44
Q Have you bought a new or used car recently?
Total Men Women 17-24 25-34 35-44 45-54 55-64 65+ AB C1 C2 D E
Yes, new in 2007 or earlier 3 3 3 0 2 3 2 4 6 4 4 2 2 1
Yes, new in 2008 2 2 1 0 1 1 1 2 3 2 2 1 1 0
Yes, new in 2009 2 2 2 1 1 1 2 3 4 4 2 1 2 1
Yes, new in 2010 2 3 2 1 1 2 3 4 3 3 3 2 1 1
Yes, new in 2011 3 3 3 2 2 3 5 4 3 6 3 2 1 1
Yes, new in 2012 1 1 1 1 1 2 1 2 1 2 1 1 1 0
Yes, used in 2007 or earlier 7 8 6 3 7 7 9 9 7 7 6 9 6 4
Yes, used in 2008 3 4 2 0 5 4 5 4 2 4 4 4 2 1
Yes, used in 2009 5 5 4 4 6 6 6 5 3 6 5 5 4 2
Yes, used in 2010 6 5 6 4 7 9 7 5 3 7 6 6 5 3
Yes, used in 2011 9 10 9 6 12 14 10 11 5 12 9 10 6 5
Yes, used in 2012 3 4 3 3 6 4 3 3 1 2 4 4 3 2
No 54 50 58 76 50 46 48 47 59 42 51 54 66 79
Scotland North Yorks & Humb
North West
West Mids
East Mids
East Anglia
Wales South West
South East
London
Yes, new in 2007 or earlier 3 7 4 2 3 5 5 1 3 2 2
Yes, new in 2008 1 1 2 1 1 0 1 3 1 2 1
Yes, new in 2009 4 3 2 2 1 2 3 4 2 2 1
Yes, new in 2010 3 3 3 4 1 1 2 4 1 2 1
Yes, new in 2011 7 5 3 1 2 2 3 3 4 2 2
Yes, new in 2012 1 - 1 2 0 2 1 1 2 1 2
Yes, used in 2007 or earlier 6 8 6 7 5 12 10 2 11 6 4
Yes, used in 2008 4 3 3 5 4 4 3 2 5 2 2
Yes, used in 2009 4 6 4 4 7 4 13 7 4 5 3
Yes, used in 2010 4 8 7 4 6 5 8 8 5 7 4
Yes, used in 2011 11 9 10 9 8 8 14 14 11 10 4
Yes, used in 2012 3 4 3 2 5 3 4 5 4 3 2
No 52 42 52 58 55 52 36 50 47 55 71

Statistical Data
The Used Car Market – a report by BCA 85
Q What most strongly influences the type of used car you would consider buying?
Total Men Women 17-24 25-34 35-44 45-54 55-64 65+ AB C1 C2 D E
Views of friends or family 24 20 28 27 29 22 24 22 16 23 23 24 26 22 Personal experience particular make/model
21 21 21 12 20 21 25 28 20 27 22 18 13 15
Independent car internet sites 16 19 13 17 22 21 12 18 5 16 17 17 14 13
Test drive 15 16 14 17 16 18 13 13 14 18 13 12 19 9
Used car showroom/sites 12 12 13 9 11 13 12 12 16 11 11 16 10 9
Franchised \ used car dealer websites
10 11 9 9 9 13 9 12 9 10 10 12 10 3
Newspaper advertisements 8 9 8 8 8 8 8 11 8 4 8 10 15 12
Cars you see on the street 8 8 8 8 10 5 11 7 6 4 8 9 12 13
Consumer reports programmes 8 6 9 2 6 11 11 8 6 13 7 5 4 1
General motoring magazines 6 7 4 6 5 8 6 5 3 5 8 5 5 4
Car TV adverts 6 6 5 13 5 5 4 4 3 5 8 6 4 3
Car TV shows 4 5 3 12 5 2 3 2 1 3 6 4 2 1
Specialist motoring magazines 4 5 3 5 2 3 5 6 3 6 3 3 3 3
Selling franchised/used car dealer advice
4 4 3 2 7 4 1 2 7 5 3 3 5 4
Social Media (i.e. Facebook, Twitter) 2 2 2 5 4 1 1 1 - 1 2 4 3 1
Other 7 8 7 5 4 6 10 8 10 10 7 6 7 5
Scotland North Yorks & Humb
North West
West Mids
East Mids
East Anglia
Wales South West
South East
London
Views of friends or family 21 35 25 24 26 20 31 22 31 18 20 Personal experience particular make/model
17 36 29 17 19 27 55 15 22 18 10
Independent car internet sites 13 10 22 13 23 17 10 16 14 18 15
Test drive 17 6 17 12 17 16 33 7 16 15 15
Used car showroom/sites 11 14 14 16 15 9 8 11 13 10 13
Franchised \ used car dealer websites
13 8 15 9 6 9 6 6 13 12 8
Newspaper advertisements 11 2 8 6 4 9 19 6 19 5 7
Cars you see on the street 7 5 6 10 9 6 9 - 11 8 11
Consumer reports programmes 6 8 8 3 12 10 9 5 10 8 6
General motoring magazines 6 4 5 7 4 5 9 8 7 8 1
Car TV adverts 8 1 2 4 6 3 5 14 8 3 8
Car TV shows 6 - 3 3 4 2 2 12 7 3 5
Specialist motoring magazines 3 2 6 4 4 5 8 5 6 3 3
Selling franchised/used car dealer advice
5 - 4 3 2 2 4 1 3 6 6
Social Media (i.e. Facebook, Twitter) 3 - - 2 1 2 - 4 1 4 2
Other 11 5 8 8 9 4 7 6 6 8 5

Statistical Data
The Used Car Market – a report by BCA 86
Q What were the crunch factors that affected your decision to buy your latest used car?
Total Men Women 17-24 25-34 35-44 45-54 55-64 65+ AB C1 C2 D E
Price 41 41 40 56 44 41 40 36 30 30 46 42 48 50
Mileage (low) 31 32 29 36 28 32 33 28 29 31 28 35 29 18
Make/model of vehicle 30 29 31 34 34 26 27 31 31 33 29 29 30 18
Engine size 18 19 16 20 15 18 15 21 20 16 13 20 24 22 Body type (e.g. estate or hatchback)
17 19 14 8 11 19 16 23 22 17 16 16 19 13
Age of the vehicle 14 11 18 19 13 16 10 13 17 20 12 12 13 7
Fuel option 12 13 11 4 11 11 17 14 14 13 15 9 11 7
Insurance group 10 10 10 17 10 10 16 5 3 6 14 11 9 10
Specification 8 11 5 2 5 12 8 12 8 13 11 5 2 1
Safety 8 12 4 11 9 8 7 10 3 8 6 11 7 7
Colour 7 5 9 12 8 4 7 9 2 4 7 8 9 8
Scotland North Yorks & Humb
North West
West Mids
East Mids
East Anglia
Wales South West
South East
London
Price 40 36 60 34 40 40 54 26 39 39 42 Mileage (low) 39 31 31 31 27 26 28 21 32 34 28 Make/model of vehicle 34 20 30 29 37 25 43 27 37 25 27 Engine size 19 16 18 13 16 20 22 21 15 19 20 Body type (e.g. estate or hatchback) 14 14 9 21 17 10 30 24 19 17 13
Age of the vehicle 18 7 20 19 6 11 11 20 15 15 8
Fuel option 22 19 9 16 9 3 20 2 14 10 14
Insurance group 10 6 17 9 12 18 3 11 13 7 4 Specification 11 4 10 13 4 8 3 7 4 9 15
Safety 7 8 8 9 14 6 - - 3 9 20 Colour 2 3 2 5 12 12 7 6 4 9 6
Q What influenced your decision to buy your used car from that particular dealer?
Total Men Women 17-24 25-34 35-44 45-54 55-64 65+ AB C1 C2 D E
Got a good deal on the car 33 33 33 34 42 38 27 35 23 33 34 26 45 24 Right car at best possible price
29 28 30 46 19 19 29 39 34 38 24 26 25 5
Could trade in my old car 19 20 18 14 15 15 16 31 22 20 21 17 20 14
Local and convenient 19 21 16 20 20 11 23 25 16 18 13 23 22 36 Dealer reliable and trustworthy
14 15 12 32 13 6 16 15 14 12 11 18 15 19
Staff friendly, helpful and professional
12 12 13 18 11 13 11 9 16 11 14 10 15 14
Wide choice of vehicles 11 10 11 15 4 16 4 15 13 10 12 14 3 10
Have bought a used car from them before
10 7 13 15 4 14 9 11 9 9 11 8 16 6
Offered a warranty or vehicle had warranty
10 12 7 6 2 9 13 15 11 9 8 12 10 10
Recommended by friend 9 8 10 21 8 5 7 5 14 8 8 10 10 7 Easy negotiation, lack of sales pressure
7 8 7 18 6 5 9 12 2 10 9 4 4 -
Good aftersales service 7 7 7 8 7 7 3 12 7 9 8 5 6 -
Quick delivery of car wanted 4 5 2 - 2 6 2 6 4 4 4 6 2 6

Statistical Data
The Used Car Market – a report by BCA 87
Q What influenced your decision to buy your used car from that particular dealer?
Scotland North Yorks & Humb
North West
West Mids
East Mids
East Anglia
Wales South West
South East
London
Got a good deal on the car 36 27 27 23 42 45 42 52 42 26 - Right car at best possible price
27 32 26 21 14 48 30 41 14 44 18
Could trade in my old car 17 17 21 19 23 9 20 71 24 8 55
Local and convenient 19 21 28 23 24 20 18 20 27 4 18 Dealer reliable and trustworthy
13 5 16 15 19 8 25 13 13 11 15
Staff friendly, helpful and professional
17 26 13 7 17 6 16 18 8 9 -
Wide choice of vehicles 21 13 21 16 3 - 12 21 4 4 30 Have bought a used car from them before
9 11 30 6 13 4 8 13 5 7 -
Offered a warranty or vehicle had warranty
10 16 6 4 13 6 12 13 9 11 -
Recommended by friend 13 12 19 5 6 5 - - 9 10 - Easy negotiation, lack of sales pressure
3 5 12 11 7 - 12 10 7 8 -
Good aftersales service - 11 11 12 11 5 15 13 - 3 -
Quick delivery of car wanted 2 3 5 4 3 8 3 11 - 5 -
Q Has the dealer you bought your car from contacted you for the following reasons?
Total Men Women 17-24 25-34 35-44 45-54 55-64 65+ AB C1 C2 D E To find out if you were happy with your car
24 22 25 38 8 21 23 29 32 22 29 21 22 18
About servicing the car 31 32 29 12 24 25 32 40 39 42 27 23 20 31 To see if you were thinking about changing the car
9 7 10 - 5 14 4 11 11 7 16 7 2 -
To see if a friend or a family member was interested in buying a car
3 1 5 - 5 3 - 2 4 1 5 3 - -
Nothing/no contact 48 48 49 56 62 52 49 33 42 39 48 55 60 58
Other answers 1 1 2 - 2 - - 4 - 1 1 2 - -
Don't Know 3 2 3 - 2 - 6 5 2 1 3 5 4 3
Scotland North Yorks & Humb
North West
West Mids
East Mids
East Anglia
Wales South West
South East
London
To find out if you were happy with your car
23% 29% 8% 26% 18% 29% 25% 18% 18% 33% 22%
About servicing the car 37% 43 24 28 20 48 46 35 12 35 -
To see if you were thinking about changing the car
4% 17 - 4 8 13 17 25 11 7 -
To see if a friend or a family member was interested in buying a car
5% 10 5 - - 6 - 11 - 2 -
Nothing/no contact 43% 30 67 49 57 30 43 41 63 44 60
Other answers - - - 3 3 - - - - - 18
Don't Know 7% 4 1 2 3 6 - - 3 2 -

Statistical Data
The Used Car Market – a report by BCA 88
Q What type of car did you last purchase?
Total Men Women 17-24 25-34 35-44 45-54 55-64 65+ AB C1 C2 D E
Off road/4 x 4 4 4 5 - 3 6 3 6 7 4 6 5 3 4
Saloon 22 22 22 16 20 25 18 25 30 20 21 19 32 29
Estate 7 9 5 3 5 6 8 14 8 5 6 12 4 9
Hatchback 47 43 52 70 54 36 53 40 39 49 48 44 46 42
M.P.V/People carrier 10 12 7 1 8 22 8 7 5 12 9 11 6 8
Sports car/coupe 4 5 3 4 6 5 3 5 1 6 4 5 2 2
Prestige e.g. Jaguar 1 1 - - - - 1 - 2 1 0 - 1 -
Micro/City Car 2 1 2 3 1 0 4 1 2 2 2 2 2 1
Other 2 1 3 1 3 1 1 2 4 1 3 2 1 5
Scotland North Yorks & Humb
North West
West Mids
East Mids
East Anglia
Wales South West
South East
London
Off road/4 x 4 4 4 4 3 5 3 - 6 15 4 1 Saloon 21 20 25 17 25 13 30 34 23 20 29 Estate 7 5 6 8 4 5 17 5 7 9 6 Hatchback 43 43 50 58 52 56 38 36 49 45 32
M.P.V/People carrier 13 24 10 10 7 9 9 8 3 9 14 Sports car/coupe 4 - 4 1 4 4 - 6 - 8 10 Prestige e.g. Jaguar 3 - - 2 - - - - - - 1 Micro/City Car 4 - 2 1 - 5 - - - 3 -
Other 2 5 - - 1 5 3 3 3 1 3
Q What influenced you most in buying a used car with a diesel engine?
Total Men Women 17-24 25-34 35-44 45-54 55-64 65+ AB C1 C2 D E
Environmental considerations 6 6 6 6 3 6 9 9 9 3 3 3 6
Maintain value better 18 18 18 15 24 18 21 15 12 24 15 18 15
More reliable engine 24 27 18 30 15 30 15 33 24 18 30 24 21 30
Better fuel consumption 58 61 52 9 64 67 49 67 55 61 64 61 46 12
Engine would last longer 9 9 6 6 12 9 12 6 6 9 6 9 6
Do a high annual mileage 9 12 3 15 3 12 9 6 12 9 3 12
Other 12 12 9 3 18 12 9 9 6 12 9 9 9 21
Don't Know 6 3 9 15 6 6 6 6 3 3 3 15 3 3
Scotland North Yorks & Humb
North West
West Mids
East Mids
East Anglia
Wales South West
South East
London
Environmental considerations 6 6 6 12 6 6 21
Maintain value better 12 24 24 15 30 27 15 33
More reliable engine 24 55 27 15 43 49 24 6 15 18
Better fuel consumption 67 82 24 58 40 46 73 37 85 67 37
Engine would last longer 3 18 9 9 18 21 6 9
Do a high annual mileage 21 12 21 12 3 15
Other 18 15 15 12 33 15 3
Don't Know 6 6 15 33 9 3 15

Statistical Data
The Used Car Market – a report by BCA 89
Q Which of these reasons influenced you to buy a used car rather than a new car?
Total Men Women 17-24 25-34 35-44 45-54 55-64 65+ AB C1 C2 D E
Couldn't afford a new car 34 31 38 46 39 34 39 27 24 23 34 39 45 40
Used better value for money 21 24 19 15 22 25 24 28 15 30 22 21 13 7
Lower depreciation with used cars
14 16 12 5 12 16 18 23 11 18 16 14 9 5
Always buy used cars 11 12 9 4 10 12 13 15 11 10 11 11 14 6
Needed a car quickly 6 6 6 10 5 6 8 6 2 5 5 8 7 4
More choice when buying a used car
4 5 4 3 6 7 3 5 2 4 5 5 4 3
Don't Know 6 6 7 12 6 4 4 5 6 5 7 5 7 9
Scotland North Yorks & Humb
North West
West Mids
East Mids
East Anglia
Wales South West
South East
London
Couldn't afford a new car 34 34 34 28 35 43 40 31 39 32 35
Used better value for money 25 29 20 12 23 25 24 38 22 20 14
Lower depreciation with used cars
13 28 14 15 15 14 21 17 15 13 7
Always buy used cars 8 14 17 12 11 10 19 10 11 9 6
Needed a car quickly 8 7 3 8 5 7 5 8 7 3 6
More choice when buying a used car
3 1 4 4 3 3 5 13 4 4 6
Don't Know 9 5 4 8 6 5 1 4 3 7 9
Q How likely is it you or a member of your family will buy a used car in the next year?
Total Men Women 17-24 25-34 35-44 45-54 55-64 65+ AB C1 C2 D E
Certainly will 3 4 2 4 4 4 4 2 1 3 2 3 3 2
Quite likely 8 9 8 11 10 12 8 7 2 10 10 9 5 2
50:50 chance 9 12 6 8 14 8 12 8 5 10 8 12 8 4
Unlikely 26 27 25 24 24 30 35 25 20 35 28 24 20 13
Certainly not in the next 12 months
20 19 21 17 18 24 19 23 19 21 17 24 22 14
Won't be buying a car in the future
30 25 35 30 27 19 20 33 50 20 32 25 37 61
Don't Know 3 3 3 6 3 2 2 1 3 2 4 2 4 3
Scotland North Yorks & Humb
North West
West Mids
East Mids
East Anglia
Wales South West
South East
London
Certainly will 2 1 2 1 6 2 1 7 4 4 0
Quite likely 5 8 9 6 10 9 12 9 7 10 7
50:50 chance 10 16 6 14 8 12 10 4 8 5 12
Unlikely 39 18 20 27 24 16 22 24 48 24 23
Certainly not in the next 12 months
23 18 21 21 21 19 28 27 12 20 19
Won't be buying a car in the future
20 38 40 28 26 39 27 25 19 34 34
Don't Know 1 1 1 3 6 3 - 4 2 4 5
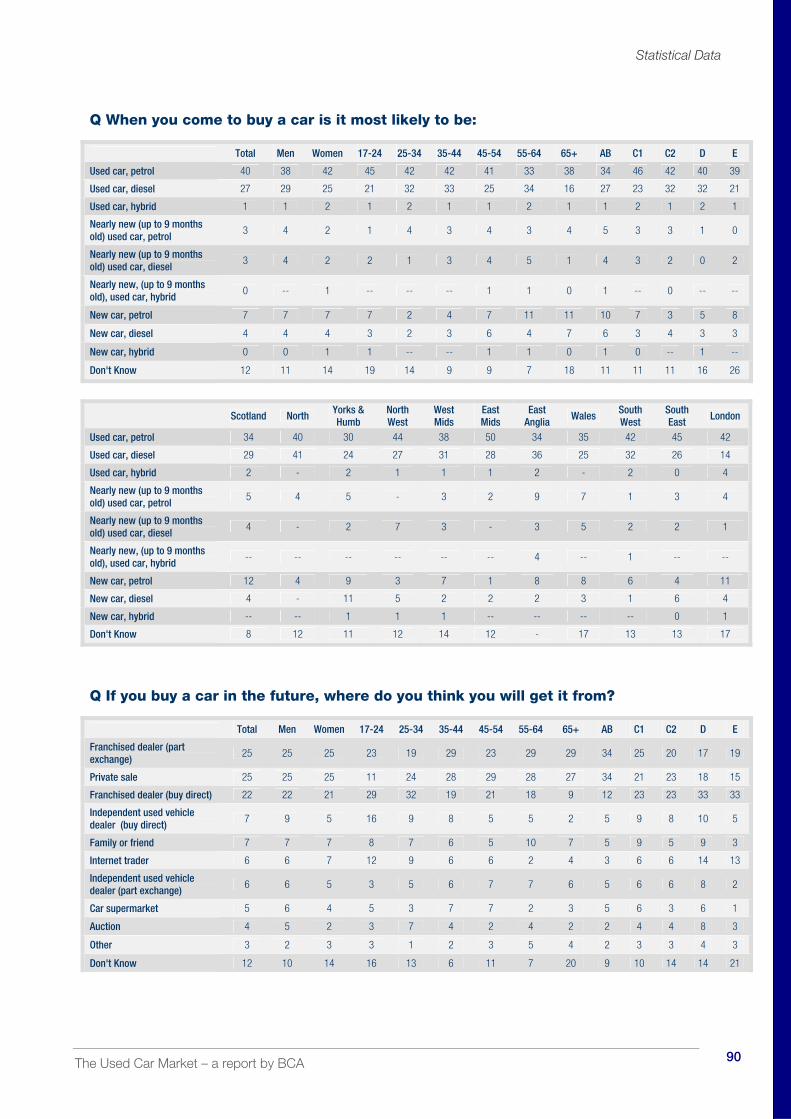
Statistical Data
The Used Car Market – a report by BCA 90
Q When you come to buy a car is it most likely to be:
Total Men Women 17-24 25-34 35-44 45-54 55-64 65+ AB C1 C2 D E
Used car, petrol 40 38 42 45 42 42 41 33 38 34 46 42 40 39
Used car, diesel 27 29 25 21 32 33 25 34 16 27 23 32 32 21
Used car, hybrid 1 1 2 1 2 1 1 2 1 1 2 1 2 1
Nearly new (up to 9 months old) used car, petrol
3 4 2 1 4 3 4 3 4 5 3 3 1 0
Nearly new (up to 9 months old) used car, diesel
3 4 2 2 1 3 4 5 1 4 3 2 0 2
Nearly new, (up to 9 months old), used car, hybrid
0 -- 1 -- -- -- 1 1 0 1 -- 0 -- --
New car, petrol 7 7 7 7 2 4 7 11 11 10 7 3 5 8
New car, diesel 4 4 4 3 2 3 6 4 7 6 3 4 3 3
New car, hybrid 0 0 1 1 -- -- 1 1 0 1 0 -- 1 --
Don't Know 12 11 14 19 14 9 9 7 18 11 11 11 16 26
Scotland North Yorks & Humb
North West
West Mids
East Mids
East Anglia
Wales South West
South East
London
Used car, petrol 34 40 30 44 38 50 34 35 42 45 42
Used car, diesel 29 41 24 27 31 28 36 25 32 26 14
Used car, hybrid 2 - 2 1 1 1 2 - 2 0 4
Nearly new (up to 9 months old) used car, petrol
5 4 5 - 3 2 9 7 1 3 4
Nearly new (up to 9 months old) used car, diesel
4 - 2 7 3 - 3 5 2 2 1
Nearly new, (up to 9 months old), used car, hybrid
-- -- -- -- -- -- 4 -- 1 -- --
New car, petrol 12 4 9 3 7 1 8 8 6 4 11
New car, diesel 4 - 11 5 2 2 2 3 1 6 4
New car, hybrid -- -- 1 1 1 -- -- -- -- 0 1
Don't Know 8 12 11 12 14 12 - 17 13 13 17
Q If you buy a car in the future, where do you think you will get it from?
Total Men Women 17-24 25-34 35-44 45-54 55-64 65+ AB C1 C2 D E
Franchised dealer (part exchange)
25 25 25 23 19 29 23 29 29 34 25 20 17 19
Private sale 25 25 25 11 24 28 29 28 27 34 21 23 18 15
Franchised dealer (buy direct) 22 22 21 29 32 19 21 18 9 12 23 23 33 33
Independent used vehicle dealer (buy direct)
7 9 5 16 9 8 5 5 2 5 9 8 10 5
Family or friend 7 7 7 8 7 6 5 10 7 5 9 5 9 3
Internet trader 6 6 7 12 9 6 6 2 4 3 6 6 14 13
Independent used vehicle dealer (part exchange)
6 6 5 3 5 6 7 7 6 5 6 6 8 2
Car supermarket 5 6 4 5 3 7 7 2 3 5 6 3 6 1
Auction 4 5 2 3 7 4 2 4 2 2 4 4 8 3
Other 3 2 3 3 1 2 3 5 4 2 3 3 4 3
Don't Know 12 10 14 16 13 6 11 7 20 9 10 14 14 21

Statistical Data
The Used Car Market – a report by BCA 91
Q If you buy a car in the future, where do you think you will get it from?
Scotland North Yorks & Humb
North West
West Mids
East Mids
East Anglia
Wales South West
South East
London
Franchised dealer (part exchange)
27 18 29 32 26 20 14 14 20 34 21
Private sale 29 37 41 20 20 27 40 30 19 23 14
Franchised dealer (buy direct) 22 17 19 19 16 32 23 24 24 18 26
Independent used vehicle dealer (buy direct)
2 2 6 9 7 5 5 7 6 9 14
Family or friend 2 10 4 7 7 5 13 4 10 7 9
Internet trader 2 3 7 8 8 5 5 2 4 5 16
Independent used vehicle dealer (part exchange)
5 8 12 4 7 10 17 3 8 4 1
Car supermarket 3 2 5 3 7 8 5 8 2 3 11
Auction - - 4 3 5 6 5 2 3 5 6
Other 5 2 2 5 3 1 1 0 4 3 2
Don't Know 11 15 7 11 11 12 2 17 13 13 16
Q Overall, how satisfied are you with your used car?
Total Men Women 17-24 25-34 35-44 45-54 55-64 65+ AB C1 C2 D E
Very satisfied 67 66 68 68 64 66 63 68 80 70 67 67 65 55
Quite satisfied 28 29 26 21 30 29 32 30 17 28 28 27 25 37 Neither satisfied nor dissatisfied
2 2 2 2 2 2 3 2 1 1 1 3 5 2
Quite dissatisfied 2 2 3 4 3 2 2 - 2 1 2 3 2 5
Very dissatisfied 1 1 1 5 1 2 - 0 - - 2 1 2 1
Scotland North Yorks & Humb
North West
West Mids
East Mids
East Anglia
Wales South West
South East
London
Very satisfied 59 75 67 62 70 61 75 75 73 70 57
Quite satisfied 37 18 31 31 26 35 23 20 14 26 42 Neither satisfied nor dissatisfied
- - 2 1 1 4 - - 5 4 -
Quite dissatisfied 2 3 - 4 1 - 3 3 6 1 1
Very dissatisfied 2 4 - 2 1 - - 2 2 0 -
Q How expensive will the price of fuel have to be for you to change to a more full-efficient car?
Total Men Women 17-24 25-34 35-44 45-54 55-64 65+ AB C1 C2 D E
£1.30 per litre 8 10 6 6 11 6 9 9 6 6 8 8 9 10
£1.35 per litre 3 4 2 2 3 6 1 3 2 4 3 2 3 3
£1.40 per litre 4 4 5 2 4 8 4 3 4 5 2 7 5 4
£1.45 per litre 3 3 4 4 4 4 1 4 3 2 5 1 4 6
£1.50 per litre 10 10 9 11 11 12 9 10 5 11 10 8 6 11
£1.55 per litre 3 3 2 3 2 3 1 4 3 2 2 4 3 1
£1.60 per litre 5 6 5 5 7 7 5 4 5 5 6 7 5 4
£1.65 per litre 1 1 1 2 1 0 2 - 1 2 0 0 1 1
£1.70 plus per litre 8 10 6 13 9 7 8 7 6 8 7 8 10 6
No effect 47 44 49 35 39 41 52 48 61 49 48 45 42 45
Don't Know 8 6 11 18 10 6 7 9 5 5 9 9 11 9

Statistical Data
The Used Car Market – a report by BCA 92
Q How expensive will the price of fuel have to be for you to change to a more full-efficient car?
Scotland North Yorks & Humb
North West
West Mids
East Mids
East Anglia
Wales South West
South East
London
£1.30 per litre 3 8 3 12 7 5 14 5 8 8 13
£1.35 per litre 2 1 - 1 3 - - 3 1 9 4
£1.40 per litre 7 9 2 5 4 8 - 12 5 1 3
£1.45 per litre 6 2 1 2 2 2 9 6 3 3 3
£1.50 per litre 10 10 12 6 8 9 13 6 6 12 12
£1.55 per litre 1 1 1 6 1 2 8 2 2 2 4
£1.60 per litre 9 4 8 3 8 3 2 3 10 5 3
£1.65 per litre 1 - - 1 - 1 1 - 2 1 3
£1.70 plus per litre 8 2 9 11 11 4 13 9 5 8 6
No effect 48 58 60 45 45 55 37 48 49 42 36
Don't Know 4 7 5 7 12 11 3 5 9 10 13
Q How expensive will the price of fuel have to be for you to change your pattern of driving?
Total Men Women 17-24 25-34 35-44 45-54 55-64 65+ AB C1 C2 D E
£1.30 per litre 9 11 7 6 11 7 10 11 7 7 9 9 11 9
£1.35 per litre 4 4 3 1 5 5 2 6 4 4 4 3 5 7
£1.40 per litre 5 5 5 5 5 6 4 5 3 5 4 5 4 8
£1.45 per litre 3 3 4 4 4 5 1 5 3 3 3 4 4 7
£1.50 per litre 10 11 9 13 10 12 12 7 6 11 10 8 12 9
£1.55 per litre 2 2 3 2 3 2 1 3 3 2 3 2 2 1
£1.60 per litre 5 5 4 4 5 7 4 4 3 5 5 5 4 2
£1.65 per litre 1 0 1 1 1 - 1 - 0 1 - 0 - 1
£1.70 plus per litre 7 8 6 8 7 8 8 6 4 5 8 7 9 4
No effect 47 46 48 37 40 42 51 46 61 51 46 46 40 46
Don't Know 8 5 11 18 9 5 8 7 5 5 9 11 9 7
Scotland North Yorks & Humb
North West
West Mids
East Mids
East Anglia
Wales South West
South East
London
£1.30 per litre 5 13 1 11 7 7 19 5 8 10 13
£1.35 per litre 4 2 1 2 5 0 - 2 1 9 5
£1.40 per litre 5 4 4 5 6 6 5 4 6 4 5
£1.45 per litre 4 2 1 5 2 4 10 6 2 3 3
£1.50 per litre 12 6 11 8 8 8 15 9 9 11 12
£1.55 per litre 3 1 1 5 1 2 2 6 1 3 1
£1.60 per litre 9 - 4 5 8 1 - 5 8 3 4
£1.65 per litre 1 - - 0 - - - - 2 - 3
£1.70 plus per litre 7 3 10 8 8 5 9 9 8 5 6
No effect 44 61 62 46 43 52 37 50 50 44 36
Don't Know 6 8 6 6 12 14 2 5 6 9 12

Statistical Data
The Used Car Market – a report by BCA 93
Q If economic recovery remains slows, what might you look for when you change car?
Total Men Women 17-24 25-34 35-44 45-54 55-64 65+ AB C1 C2 D E Car with better fuel consumption
27 29 24 16 23 31 29 33 23 28 27 28 22 20
Car with lower road tax 20 18 21 14 28 20 18 23 15 20 20 21 18 15
Best possible purchase price 14 15 13 11 14 13 18 16 10 18 12 12 12 11
Smaller car 14 13 15 16 11 16 13 15 13 13 14 14 16 14
Car with lower CO2 13 14 12 11 11 14 18 14 9 15 14 12 11 11 Car with lower maintenance costs
12 10 13 10 12 9 12 17 9 13 12 10 11 9
Used car instead of new car 9 9 10 6 10 9 11 10 8 7 9 12 11 6
Same type of car 9 10 9 8 5 12 11 11 7 10 9 10 8 9
Best possible part--exchange price
8 7 9 1 8 11 10 10 4 11 8 5 7 6
Car with lower depreciation 5 6 4 2 7 6 6 3 4 5 5 5 3 4
Low interest finance 3 4 2 5 4 2 4 2 1 3 4 3 1 2
Lower specification\ performing car
3 3 2 4 3 2 3 2 1 3 2 3 2 2
New car instead of used car 2 1 3 3 2 1 2 1 4 3 2 2 2 1
Less prestigious car 2 2 1 2 5 2 1 1 1 2 1 2 1 1
Don't Know 27 29 24 16 23 31 29 33 23 28 27 28 22 20
Scotland North Yorks & Humb
North West
West Mids
East Mids
East Anglia
Wales South West
South East
London
Car with better fuel consumption
22 30 28 22 37 29 41 20 36 23 18
Car with lower road tax 19 17 20 19 18 25 29 15 29 14 21
Best possible purchase price 12 13 15 11 22 12 21 5 15 16 9
Smaller car 19 9 16 14 9 21 20 16 15 11 11
Car with lower CO2 13 7 14 12 14 10 34 13 10 12 14 Car with lower maintenance costs
10 9 18 8 13 10 19 7 13 11 13
Used car instead of new car 8 12 8 7 11 13 12 7 12 10 5
Same type of car 8 9 12 7 4 9 10 4 13 12 7 Best possible part--exchange price
6 14 9 4 16 10 21 9 6 3 7
Car with lower depreciation 10 6 4 4 6 3 2 5 8 3 4
Low interest finance 4 5 1 3 3 1 - 4 4 2 4 Lower specification\ performing car
3 1 1 - 4 4 4 4 - 3 6
New car instead of used car 2 3 4 2 1 1 4 0 2 2 4
Less prestigious car 6 - 2 - 2 - - 1 1 2 3
Don't Know 22 40 15 16 18 11 10 37 16 24 26

Statistical Data
The Used Car Market – a report by BCA 94
Q How do you prefer to be kept informed of new or used car sales offers, servicing and other opportunities by the dealer you bought your latest car from?
Total Men Women 17-24 25-34 35-44 45-54 55-64 65+ AB C1 C2 D E
Email 18 17 18 19 23 24 17 17 6 23 16 17 11 12
Letter\mailing 15 15 15 10 15 10 18 16 16 16 14 13 15 13
Website information 14 17 11 16 23 16 13 14 5 14 13 16 13 10
Press 9 10 8 3 6 9 9 9 15 8 6 10 14 15
TV 6 6 6 13 6 4 4 6 5 5 6 6 8 5
Telephone call 4 4 5 8 3 2 5 4 6 6 2 5 6 5
Radio 2 2 2 3 3 1 1 2 1 2 1 3 2 2
Text message 1 2 1 4 1 2 1 1 1 1 1 2 2 1
Facebook 1 1 1 2 1 1 - 0 - - 1 1 1 2
Twitter 1 1 0 2 1 1 - - - - 0 1 1 -
Website 'live chat' 0 -- 0 -- 0 0 -- -- -- -- 1 -- -- --
Other 13 12 13 6 7 13 15 14 19 15 11 11 13 14
Don't know 28 26 31 32 28 24 25 28 35 20 36 27 32 32
Scotland North Yorks & Humb
North West
West Mids
East Mids
East Anglia
Wales South West
South East
London
Email 17 12 14 14 21 19 19 20 17 19 20
Letter\mailing 12 20 20 18 14 9 24 5 13 14 16
Website information 14 8 15 14 17 12 9 6 13 16 20
Press 21 9 10 7 4 7 21 9 13 3 9
TV 5 1 7 7 5 4 2 11 5 7 6
Telephone call 5 4 5 2 7 4 5 11 5 2 6
Radio 2 - 4 3 - 1 - 7 2 1 -
Text message 1 1 4 2 1 3 - 1 2 - 3
Facebook 1 - 2 - - 0 3 1 - - 0
Twitter - - 2 - - 1 3 - - - 1
Website 'live chat' -- -- -- -- -- -- -- -- -- 1 --
Other 13 5 23 20 14 10 13 8 8 13 8
Don't know 16 52 20 27 23 35 15 39 34 33 19

Statistical Data
The Used Car Market – a report by BCA 95
Q Which of the following measures are you prepared to take to reduce your personal motoring carbon footprint?
Total Men Women 17-24 25-34 35-44 45-54 55-64 65+ AB C1 C2 D E
Walk more often 29 24 33 32 28 32 27 31 21 32 29 28 24 20 Cut out unnecessary journeys
21 21 21 16 21 22 21 26 18 25 20 20 18 16
Reduce annual mileage 16 18 14 10 16 16 19 16 17 16 14 17 21 11
Drive more slowly 16 19 13 14 13 17 14 20 15 15 16 17 17 12
Buy smaller car 15 15 16 13 14 17 17 19 11 15 19 12 18 11
Avoid short journeys 15 15 16 14 17 17 17 17 10 14 19 15 13 10 Buy a car with lower carbon dioxide emissions
15 14 17 10 16 16 16 19 13 20 17 11 12 7
Avoid heavy breaking 15 16 13 14 13 12 15 17 18 15 18 13 11 12 Check tyre pressures frequently
15 16 13 12 20 13 18 9 14 15 15 15 13 9
Accelerate less quickly 14 15 13 12 17 13 10 16 15 15 16 10 13 11
Use public transport 13 13 14 8 11 13 12 17 18 18 14 9 13 8
Switch of air conditioning 10 9 10 6 11 15 8 12 6 10 11 8 8 9
Car share 9 8 10 17 14 10 7 7 4 7 10 10 10 6
Cycle more often 9 11 6 10 7 11 11 7 5 8 11 8 8 2
Work from home 6 6 6 5 7 8 9 5 0 9 5 4 3 3
Take no action 16 17 14 12 14 13 17 12 24 16 11 19 16 28
Scotland North Yorks & Humb
North West
West Mids
East Mids
East Anglia
Wales South West
South East
London
Walk more often 26 23 24 23 24 37 39 25 38 26 35
Cut out unnecessary journeys 27 27 23 21 19 23 33 12 25 18 13
Reduce annual mileage 21 19 16 16 18 11 16 13 20 13 15
Drive more slowly 20 17 13 15 15 13 29 12 18 15 13
Buy smaller car 23 20 16 17 13 17 23 11 15 9 18
Avoid short journeys 17 15 16 17 15 16 12 8 16 14 19 Buy a car with lower carbon dioxide emissions
18 19 20 13 11 15 18 21 14 15 10
Avoid heavy breaking 18 11 13 13 22 8 26 18 22 11 10 Check tyre pressures frequently
26 13 15 18 16 12 15 11 18 11 5
Accelerate less quickly 19 12 16 14 17 10 21 10 14 13 7
Use public transport 17 14 11 12 13 13 14 8 16 11 19
Switch of air conditioning 10 5 8 9 13 6 11 20 11 8 9
Car share 5 6 10 5 14 8 13 16 14 8 9
Cycle more often 12 4 2 9 6 13 6 7 10 9 13
Work from home 8 2 2 5 5 5 5 4 7 8 6 Take no action 8 9 3 6 11 11 1 16 7 17 9

Statistical Data
The Used Car Market – a report by BCA 96
Q Have you taken any steps to substantially reduce your car running costs?
Total Men Women 17-24 25-34 35-44 45-54 55-64 65+ AB C1 C2 D E
Use public transport 11 11 11 4 10 8 10 18 15 14 10 10 9 10
Lower cost insurance 9 8 10 5 10 13 10 10 6 9 10 8 12 5
Opted for shorter trips 7 7 6 7 7 6 7 7 8 6 7 6 10 7 Close windows when possible
5 5 5 4 8 5 6 4 6 7 4 6 2 4
Changed to car with lower insurance premium
4 4 5 1 5 7 3 3 5 4 5 4 4 2
DIY service\repairs 4 6 2 3 4 5 5 3 3 2 3 7 6 3
Reduced number of cars 3 3 3 2 4 2 2 3 3 3 2 4 2 2
Drive less often 2 2 1 1 1 3 2 2 1 2 2 1 - 2 Lower cost service provider
2 2 1 1 2 1 1 3 2 1 2 1 3 1
Walk\cycle (more) 1 1 1 - 1 2 1 2 - 1 1 1 2 2
Don't drive 1 0 1 1 0 0 1 1 - 0 0 1 2 1
Scotland North Yorks & Humb
North West
West Mids
East Mids
East Anglia
Wales South West
South East
London
Use public transport 12 9 11 9 11 12 18 8 8 9 20
Lower cost insurance 14 13 11 3 17 9 13 12 10 8 2
Opted for shorter trips 6 2 10 9 8 5 6 7 8 5 6
Close windows when possible 8 9 6 2 9 4 5 6 7 4 3 Changed to car with lower insurance premium
6 1 3 5 10 3 6 6 4 3 2
DIY service\repairs 4 3 4 2 10 7 2 3 5 1 4
Reduced number of cars 4 - 4 2 5 3 3 2 2 2 4
Drive less often 1 - 1 1 4 3 - 3 1 2 2
Lower cost service provider 2 - 1 2 2 - - 2 1 3 2
Walk\cycle (more) 1 - - 3 1 1 5 - - 1 1
Don't drive 2 - 2 0 - 1 - - 1 1 -

The Used Car Market – a report by BCA 97
Research
The BCA Used Car Market Report is based on information from the Society of Motor
Manufacturers and Traders (SMMT) and many other trade and industry sources in the
UK and across Europe.
In addition, a consumer survey was carried out by BMRB International, based on
interviews with 4,000 respondents, representative of the UK adult population aged 17
years and over. Fieldwork for this research was undertaken in late March 2012.
The Used Car Market Report was written and produced for BCA Vehicle Remarketing
by Professor Peter N C Cooke and the automotive group at The Centre for
Automotive Management, University of Buckingham Business School, The University
of Buckingham, Buckingham, MK18 1EG
Copyright BCA 2012
Any part of this report may be reproduced for non-commercial purposes subject to
acknowledgement.
Any organisation wishing to use this report --- in part or in whole --- for commercial
gain, should firstly obtain permission from the Public Relations Department at BCA.
Telephone: +44 (0) 1252 878555. Fax: +44 (0) 1252 743447
Web site: http://www.bca-europe.com
E-mail: [email protected]