use of locally available materials in pavement sub … · · 2017-04-18use of locally available...
TRANSCRIPT

USE OF LOCALLY AVAILABLE MATERIALS IN
PAVEMENT SUB-BASE
SHUBHAKANTA BARIK
DEPARTMENT OF CIVIL ENGINEERING
NATIONAL INSTITUTE OF TECHNOLOGY
ROURKELA-769008, ODISHA, INDIA
2015
USE OF LOCALLY AVAILABLE MATERIALS IN
PAVEMENT SUB-BASE
Thesis Submitted in Partial Fulfillment of
the Requirements for the Award of Degree
of
MASTER OF TECHNOLOGY
in
CIVIL ENGINEERING DEPARTMENT
[Specialization: Transportation Engineering]
By
Shubhakanta Barik
(Roll No. 213CE3080)
Under the guidance of
Prof. Mahabir panda
DEPARTMENT OF CIVIL ENGINEERING
NATIONAL INSTITUTE OF TECHNOLOGY
ROURKELA-769008, ODISHA, INDIA
Department of Civil Engineering
National Institute of Technology
Rourkela-769008, Odisha, India
www.nitrkl.ac.in
__________________________________________________
Certificate
This is to certify that the work in the thesis entitled, “Use of Locally Available Materials
in Pavement Sub-Base” by Shubhakanta Barik is a record of an original exertion carried out by
him under my supervision and guidance in partial fulfilment of the requirements for the grant of
the degree of Master of Technology in Department of Civil Engineering with specialization in
Transportation Engineering. Neither this project nor any portion of it has been acquiesced for
any degree or academic honour elsewhere.
Prof. Mahabir Panda
Professor
Department of Civil Engineering
Date: National Institute of Technology, Rourkela

Dedicated to
My Parents

ACKNOWLEDGEMENT
My sincere thanks go to the God for the blessings that have been bestowed upon me in all my
endeavours.
I encompass my deep sense of gratitude and respect to my thesis supervisor, Prof. Mahabir
Panda, Department of Civil Engineering, National Institute of Technology, Rourkela, for his
invaluable guidance, suggestions, concern, colossal assistance, motivation, encouragement and
endorsement throughout my research work. This thesis was completed successfully by his
patience and perseverance.
I am really grateful and acknowledge the assistance and support of Prof. S. K. Sarangi, Director,
Prof. S. K. Sahu, Head of the Department, Prof. U. Chattaraj, Prof. P. K. Bhuyan, Prof. K. K. Paul
and other faculties of Civil Engg. Dept., for the accomplishment of the project work. I also
acknowledge Prof. J. Bera, Dept. of Ceramic Engineering, Prof. R. K. Patel, Dept. of Chemistry,
Prof. D. K. Bisoyi, Dept. of Physics, Prof. M. Equibddin, Dept. of Mining Engg., and Prof. R.
Sarkar, Dept. of Ceramic Engineering, for their generous help, support, suggestions,
encouragement, motivation and inspiration for my research work.
I am also thankful for deep sense of sincerity to acknowledge the support of Larsen & Toubro
(L&T) ECC and L&T IDPL, particularly their officers involved in the Sambalpur Rourkela
Tollway Limited (SRTL) for providing all sorts of materials required used in the experimental
works of this project work and for also some financial support for carrying out this project work.
The support rendered by Rourkela Steel Plant (RSP) authorities, and Professors and staff of
various central facilities of NIT Rourkela are thankfully acknowledged.

I would also like to thank Mr. S. C. Xess, Lab Assistant, Mr. H. M. Garnayak, lab attendant, Rahul
Bhai and Sambhu for their kind support in the laboratory during the experiments.
I also appreciate the collective ideas, understanding, support, encouragement and experiences of
Jyoti bhai, Siddharth bhai, Debashis bhai and my batchmates Saswat, Manoj and others, which
contributed significantly to my thesis work.
Most essentially, I would like to express my wholehearted gratitude to my Parents and elder sister.
Without their love, affection, support, encouragement and inspiration, this exertion would not be
possible.
Shubhakanta Barik

i
Abstract
Now-a-days the depletion of natural resources has been a major issue in the construction
sector from which the road segment cannot be excluded. Because of the extensive road
construction processes the aggregate demand is so huge that lots of blastings, quarrying, crushing
and transportation activities are consuming a lot of energies, but also the aggregate materials are
depleting fast and are in short supply. On the other hand, industrial wastes, by-products and locally
available unused materials which are considered as non-conventional materials are causing
environmental and dumping problems, but can have a potential for their application in road
constructions. In the present study, an attempt has been made to utilise two types of materials such
as the slag, a waste material from the steel industries and locally and abundantly available gravel
(moorum) in the road sub-bases. The chemical composition, phase composition, toxic and heavy
metals present in both the slag and its leachate water are studied. Its gradation and other physical
properties are studied by using suitable tests and techniques. Conventional crushed aggregates are
also used in conjunction with the slag or moorum to satisfy the desired grading for use in a
particular layer as per the specifications of the Ministry of Road Transport and Highways. The
optimum percentage of the slag and moorum that can be used in sub-base layer is found to be 80%
and 50% respectively. In case of moorum, cement has also been used in required quantity to get
the desired strength. The physical properties have been studied. It is observed that both the slag
and hard moorum have excellent properties as road aggregates and can be used in the road base
and sub-base applications.
Key words: slag, moorum, XRD analysis, toxicity, unconfined compressive strength

ii
CONTENTS
Page No.
ACKNOWLEDGEMENT
Abstract i
List of tables vi
List of figures viii
List of Abbreviations x
CHAPTER-1
INTRODUCTION
1.1. Background of the study 1
1.2. Problem Statement 2
1.3. Locally available materials 3
1.3.1. Slag from steel plant industries 4
1.3.2. Locally available Hard Moorum 4
1.4. Objectives 5
CHAPTER-2
LITERATURE REVIEW
2.1. Introduction 6
2.2. Characterisation of slag 6
2.2.1. Chemical composition and phase analysis 6
2.2.2. Toxic Leaching Characteristic Procedure (TCLP) 11

iii
2.3. Physical properties of slag and moorum 12
2.4. Critical review 15
CHAPTER-3
EXPERIMENTAL METHODOLOGY
3.1. Introduction 16
3.2. Characterisation of slag 16
3.2.1. X-Ray Fluorescence 16
3.2.2. X-Ray Diffraction 18
3.2.3. Scanning Electron Microscopy (SEM) and Electron Dispersive X-Ray
spectroscopy (EDX) 18
3.2.4. Toxic Characteristic Leaching Procedure (TCLP) 19
3.3. Physical Properties and Strength Tests 19
3.3.1. Gradation 20
3.3.2. Blending of aggregates 21
3.3.3. Determination of Water Absorption and Specific Gravity 21
3.3.4. Determination of Plasticity Index 21
3.3.5. Aggregate Impact Test 22
3.3.6. Combined Flakiness Index 22
3.3.6. Modified Proctor Test 23
3.3.7. Determination of California Bearing Ratio (CBR) 23
3.3.8. Unconfined Compression Test 23

iv
3.3.8.1. Cube Specimen 24
3.3.8.2. Cylinder Specimen 26
3.4. Materials used 28
CHAPTER-4
RESULTS AND DISCUSSIONS
4.1. Characterization of slag 29
4.1.1. Chemical Composition 29
4.1.2. Phase Analysis 30
4.1.3. Elemental Composition 35
4.1.4. Toxicity Characteristic Leaching Procedure (TCLP) 42
4.2. Physical Properties 43
4.2.1. Gradation 43
4.2.2. Blending 44
4.2.2.1. Blending of Slag and Crushed aggregates 44
4.2.2.2. Blending of Crushed aggregates 47
4.2.2.3. Blending of Moorum and Crushed aggregates 48
4.2.3. Other Properties 51
4.2.3.1. UCS Test Results 54
CHAPTER-5
SUMMARY AND FUTURE SCOPE
5.1. General 58

v
5.1.1. Characterization of Slag 58
5.1.2. Physical Properties 58
5.2. Summary 59
5.3. Future scope of work 60
REFERENCES 61

vi
List of tables Page No.
Table 2.1. Chemical composition of steel slag from different studies 11
Table 3.1. Grading for Granular Sub-base Materials [Table 400-1, MoRTH (2013)
specification] 20
Table 4.1. Chemical composition of the slag samples determined by XRF technique 29
Table 4.2 (a) XRD peaks of slag samples corresponding to position [2θ (degrees)]
and relative intensity [%], as analyzed by X’pert HighScore software 30
(b) Presence of phases in the slag samples corresponding to their reference
codes used in table 4.2 (a) 32
Table 4.3. Elemental Composition of different points from each of two slag
samples determined by EDX 36
Table 4.4. The concentration of heavy or toxic elements in leachate water of the
slag samples observed by AAS. 42
Table 4.5. Sieve size analysis of the slag, crushed aggregates and moorum samples 43
Table 4.6 (a) Blending of the slag and crushed aggregates to meet the desired
gradation for GSB Grading II 45
(b) Blending of the slag and crushed aggregates to meet the desired
gradation for GSB Grading IV 45
Table 4.7. Blending of the crushed aggregates to meet the desired gradation for
GSB Grading IV 47
Table 4.8 (a) Blending of moorum and crushed aggregates to meet the
requirements of GSB Grading II as per the MoRTH Specifications 48
(b) Blending of moorum and crushed aggregates to satisfy the grading
requirements of Materials for Stabilization with Cement as per MoRTH
Specifications 49

vii
(c) Blending of moorum and crushed aggregates to satisfy the
Grading III Limits for Cement Bound Materials for Base/Sub-bases
as per IRC SP: 89(2010) 49
Table 4.9 (a) Physical properties of the slag, individual crushed aggregates and moorum 52
(b) Physical properties of the combination of the slag and crushed
aggregates, a combination of crushed aggregates only, and combination
of moorum and crushed aggregates for use in different layers. 53
Table 4.10 (a) Unconfined Compressive Strength results of cube specimens (7 days) 55
(b) Unconfined Compressive Strength results of cylindrical specimens (7 days) 55

viii
List of figures Page No
Figure 2.1. SEM photography of a polished section (grains> 2 mm)
[P. Chaurand., et al. (2006)] 7
Figure 2.2. XRD patterns of steel slag samples [Weiguo Shen., et al. (2009)] 8
Figure 2.3. X-ray diffraction of steel slag [Wang and Yan (2010)] 9
Figure 2.4 (a) SEM morphologies and EDX analysis of hydration products at the
age of 28 days-SEM picture [Wang and Yan (2010)] 9
(b) EDX result of point 1 10
(c) EDX result of point 2 10
Figure 3.1 (a) Principle of XRF
(b) XRF Instrument 17
Figure 3.2. Tampers for use with a vibrating hammer for Unconfined
Compressive Strength test [IS: 4332 (Part V) -1970] 24
Figure 3.3. Sequences involved in preparation and testing of UCS of
cube specimens 25
Figure 3.4. Sequences involved in preparation and testing of UCS of
cylinder specimens 27
Figure 4.1. Intensity variation of different slag samples and the phases
corresponding to their peaks 32
Figure 4.2. Magnified pictures (4000×) of two slag samples
using Nova NanoSEM-450 35
Figure 4.3. EDX spectrum of three different points from each of two slag samples 36
Figure 4.4. Graph of sieve size ~ mean %age passing of the slag,
crushed aggregates and moorum 44

ix
Figure 4.5 (a) Blending of the slag and crushed aggregates to meet the
desired gradation for GSB Grading II 46
(b) Blending of the slag and crushed aggregates to meet the
desired gradation for GSB Grading IV 46
Figure 4.6. Blending of the crushed aggregates to meet the desired
gradation for GSB Grading IV 47
Figure 4.7 (a) Blending of moorum and crushed aggregates to meet the
requirements of GSB Grading II as per the MoRTH Specifications 50
(b) Blending of moorum and crushed aggregates to satisfy the
grading requirements of Materials for Stabilization with Cement
as per MoRTH Specifications 50
(c) Blending of moorum and crushed aggregates to satisfy the
Grading III Limits for Cement Bound Materials for
Base/Sub-bases as per IRC SP: 89(2010) 51
Figure 4.8 (a) UCS values of cube specimens for use in the drainage layer of
cement treated sub-base [A40=35% +A10=50% +A6 =15%] 56
(b) Comparison of the UCS values of cube specimens with the
equivalent UCS values of cylinder specimens for use in the
cement treated base [Moorum=50%+ A10=15% +A6=35%] 56
(c) Comparison of UCS values of cube specimens with equivalent
UCS values of cylinder specimens for use in the filter layer of cement
treated sub-base [Moorum=50%+ A10=15% +A6=35%] 57

x
List of Abbreviations
ASTM : American Society for Testing and Materials
CA : Crushed Aggregate
CBR : California Bearing Ratio
EDS : Energy Dispersive Spectrometer
EDX : Electron Dispersive X-Ray spectroscopy
EPA : Environmental Protection Agency
GSB : Granular Sub-base
IS : Indian Standard
IRC : Indian Road Congress
MDD : Maximum Dry Density
MoRTH : Ministry of Road Transport and Highways
OMC : Optimum Moisture Content
SEM : Scanning Electron Microscope
SSA : Steel Slag Aggregate
TCLP : Toxic Leaching Characteristic Procedure
UCS : Unconfined Compressive Strength
XRD : X-Ray Diffraction
XRF : X-Ray Fluorescence

xi
Thesis Structure
Chapter 1 gives a brief idea about the conventional and non-conventional materials used
in the road construction and points out the objectives of the study using slag and moorum
as non-conventional materials.
Chapter 2 gives an overall idea about the findings in different past studies on the use of
either slag or moorum in road base or sub-base application.
Chapter 3 deals with the experimental methodology in which several test methods,
analytical techniques as per different standards, specifications and studies are used to
determine the characterisation of slag and also to find the physical properties of slag,
moorum and conventional crushed aggregates.
Chapter 4 provides the results of all the tests and techniques followed in chapter 3 and
checks their validation with reference to corresponding standards and specifications.
Chapter 5 summarizes the conclusions obtained from the results and discussions and gives
some scopes for future work.

1
Chapter 1
INTRODUCTION
1.2.Background of the study
Road transportation contributes to the economic, industrial, social and cultural
development of a country. India now has the second largest road network in the world. The
extensive road construction programme by the Government of India has resulted in a high
development process in the road industry. Thousands of kilometres of roads are being constructed
every year across India in the shape of either urban roads (under National Highways Development
Programme) or rural roads (under Pradhan Mantri Gramin Sadak Yojna). [Indian Highways, May
2011]
Generally pavement structures used for road construction are flexible and rigid. A flexible
pavement consists of four components: soil subgrade, sub-base course, base course and surface
course where the vertical load transmission takes place from the top (surface) to the bottom
(subgrade). A well compacted granular arrangement consisting of well-graded aggregates forms a
good pavement (flexible) which transfers the compressive stresses through a wider area. The base
layer, immediately below the surface layer provides support to the pavement transmitting the load
to the layers below. The sub-base layer, below the base layer, not only provides the support to the
pavement structure and transmits traffic loads to the subgrade but also provides frost action and
drainage. The sub-base is generally composed of two layers, the lower (filter) layer forms the
separation preventing the intrusion of subgrade soil into the upper layers and the upper (drainage)

2
layer composed of granular sub-base (or GSB) materials drains the water away which enters
through surface cracks. [Yoder & Witczak, Principles of Pavement design]
A rigid pavement usually consists of a cement concrete slab, with a granular base or sub-
base course provided below for drainage, to control pumping, to control frost action and to control
shrink and swell of the subgrade. The rigid pavement differs from the flexible pavement in the
load distribution phenomenon. In the rigid pavement, the critical condition occurs due to the
maximum flexural stress in the slab due to the wheel load and the temperature changes whereas
compressive stresses are distributed throughout the flexible pavement. Though rigid pavements
possess the noteworthy flexural strength or flexural rigidity, flexible pavement is widely used in
construction because of its smooth riding surface and lower cost of construction. [Yoder &
Witczaak]
However in semi-rigid pavements bonded materials are utilized in the base or sub-base
course of pavement layer, giving them higher flexural strength than the conventional flexible
pavement layers. The materials for bound base or sub-base layer may consist of aggregate, soil or
combination of both modified with stabilizers such as lime, cement, fly ash or commercial
stabilizers to give desired strength. [IRC SP:89 (2010)]
1.3. Problem Statement
Traditionally, the materials which are used in highway construction are also used in other
construction activities (like buildings, industrial set ups, dams, power houses etc.). Aggregates for
base and sub-base use are composed of sand, crushed aggregates, gravels or natural materials that
provide the necessary strength and durability. To meet the enormous demands of construction the

3
above natural aggregate resources are heavily consumed for the construction of roads, especially
in urban markets. The extraction of aggregates from hills through quarrying operations, crushing
and transportation etc. are not only responsible for the environmental degradation in the form of
loss of forest lands, vibrations, dust, noise, pollution hazards etc. but also consume a large amount
of energy depleting the energy sources.[Indian Highways, May 2011]
The generation of a vast quantity of waste materials from industries like iron, steel, coal,
etc. is causing a shortage of dumping space and creating severe environmental pollution. Solid
waste generation from steel industries such as power plant fly ash, acid sludge from by-product
plant, tar sludge, B.F. slag, steel slag, coke breeze, calcined lime, dolomite dust and steel scrap etc.
are generated in vast quantities causing environmental degradation. [Viswanathan & Gangadharan
(1996)]
1.4. Locally available materials
Industrial wastes or by-products, locally available materials can be used to partially replace
the natural aggregates in base or sub-base application, which are not used for other construction
purposes but available in huge quantities at a nominal cost. These materials, may not match the
desired standards or specifications but provide a prospect for their optimal utilization in road
construction. Use of the above materials may result in a decrease in the construction cost of roads,
satisfying the quality requirements and could also help in improving the strength and durability of
the pavement. In the present work slag from steel plant industries and locally available hard
moorum are used as non-conventional materials in road base and sub-bases.

4
1.4.1. Slag from steel plant industries
India is now the fourth largest crude steel producer in the world contributing pig iron,
sponge iron, alloy and non-alloy steel. Slag is a by-product generated during the manufacturing of
pig iron and steel. During the process of pig iron making (in the blast furnace) and steel production
(in steel melting shop), slag is produced by the action of fluxes upon gangue materials within the
iron ore. The slag primarily consists of silicon, calcium, aluminum, iron, magnesium and
manganese in various combinations. Under controlled cooling slag becomes hard and dense, which
can achieve the required strength to sustain heavy loads making it especially suitable for use in
road construction. [Indian Mining Yearbook-2011].
The amount of slag generated is so vast that it produces a dumping problem and can also
be hazardous to the environment. So due to the extensive growth of construction and sufficient
availability of slag, it can be used as a partial substitute for the natural aggregate materials in road
base and sub-base applications. The cost of slag is lower than that of natural aggregate materials,
and it is sufficiently available. The slag when used in road sub base in bounded form, its hazardous
effects can be minimized making it environmentally sheltered. So the above factors can make the
use of slag in road base and sub-base layer economic and cost effective from a construction point
of view and also take care of the environmental problems.
1.4.2. Locally available Hard Moorum
Moorum is a fragmented weathered rock that occurs with varying proportions of silt and
clay. It is a low-grade marginal material having the low bearing capacity and high water absorption
value than that of the conventional natural aggregates. India is rich in hard moorum, but the quality
differs significantly from place to place [Ransinchung. et al. (2014)]. In the present study, the

5
locally available hard moorum is tried to be used in base, and sub-base layer of pavement and
cement stabilization/modification is done to make it suitable for use in different layers of
pavement.
1.5. Objectives
The present work is focussed on the use of a combination of slag or locally available hard
moorum and conventional crushed aggregates (of different nominal size) for use in the base or
sub-base layer of the pavement.
The objectives of this work are
To determine the chemical composition, phase composition and explore the presence of
hazardous materials in the slag and its leachate water.
To determine the physical properties of slag and explore its suitability for use in the sub-
base layer of pavement.
To determine the physical characteristics of locally available hard moorum and explore its
suitability for use in the base or sub-base layer of the pavement.
To assess the effects of cement stabilization in base or sub-base with natural aggregates
and locally available gravel (hard moorum).
.

6
Chapter 2
LITERATURE REVIEW
2.1. Introduction
This chapter is focussed on the literature review of some studies associated with the
utilisation of slag and moorum in base and sub-base of road pavement within the recent past. The
characterisation of slag and the physical properties and strength parameters of slag and moorum,
as obtained in several works have been studied.
2.2. Characterisation of slag
Basic oxygen furnace (BOF) steel slag is a residue obtained from the basic oxygen
converter during steel-making operations. It can be partially used as a construction material for
roads. Though it is an attractive construction material, before the application its long-lasting
behaviour and the related environmental influences should be considered into account. BOF slag
is generally composed of silicon, calcium, iron and some potential toxic elements or known as
toxic elements, like chromium and vanadium. [P. Chaurand., et al. (2006)].
2.2.1. Chemical composition and phase analysis
The identification of various kind of phases present in slag, structural techniques used are:
X-ray diffraction (XRD), SEM coupled with energy dispersive X-ray spectroscopy (EDS) micro-
analysis and X-ray absorption spectroscopy (XAS) [P. Chaurand., et al. (2006)].
X-ray diffraction technique is a non-destructive, rapid analytical method which provides
the data regarding the crystal structure, atomic arrangements and phase composition of the material

7
under study. In the XRD technique, the slags were finely grounded and analysed with a Philips
PW 3710 X-ray diffractometer using a Co Kα radiation at 40 kV (voltage) and 40 mA (current).
The diffractograms were operated within the 2θ range of [8–90ᵒ] with a numeration time of 13
s/step.
The Scanning Electron Microscope is also a non-destructive and technique used to study
the morphology and composition of the sample. Phillips SFEG (XL30) scanning electron
microscope (SEM) coupled with an Oxford Instruments energy dispersive spectrometer (EDS) was
used to observe the composition of elements present in the slag. It was operated at fifteen keV
taking the size of slag varied between 200 to 500µm. Taking the counting time in the 60–200
s/point range, semi-quantitative analyses of particular portions were observed.
Figure 2.1. SEM photography of a polished section (grains> 2 mm) [P. Chaurand., et al.
(2006)]
A new type material comprised of steel slag, fly ash and phosphogypsum were used as a
road base material in China. The chemical composition of the raw materials: steel slag, fly ash,

8
and phosphor-gypsum were determined. The XRD patterns of two slag (steel slag) samples are
illustrated in fig.2.2. [Weiguo Shen., et al. (2009)].
Figure 2.2. XRD patterns of steel slag samples [Weiguo Shen., et al. (2009)]
Electric arc furnace (EAF) steel slags were used as replacements for natural aggregates,
within the base for flexible pavements. The chemical composition of the aggregates were analysed
by XRF (X-ray fluorescence) and then the toxic characteristics of the EAF slags were measured
with the ICPAES (inductively coupled plasma-atomic emission spectrometer) methodology in
terms of initial concentration of heavy/toxic metals [Pasetto and Baldo (2010)].
The hydration products of steel slag can be mineralogically determined by X-ray
diffraction. TTR ||| diffractometer was used having nickel-filtered Cu Kα1 radiation (=1.5405 Å),
the voltage of 50 kV and current of 200 mA [Wang and Yan (2010)]. The SEM was used to
determine the microstructures and the EDX were used detect the element distribution.

9
Figure 2.3. X-ray diffraction of steel slag [Wang and Yan (2010)]
Figure 2.4 (a) SEM morphologies and EDX analysis of hydration products at the age of 28 days-
SEM picture [Wang and Yan (2010)]

10
Figure 2.4 (b) EDX result of point 1 Figure 2.4 (c) EDX result of point 2
Various analytical methods are used to determine the chemical and mineralogical
characterizations of LD slags and to identify the phases that are liable to pavement instability [J.
Waligora., et al. (2010)]. The mineral phases present in the slag were identified by X-ray
diffraction (XRD) technique using a Bruker AXS D8 Advance diffractometer having a Co source
(Kα=1.79 Å), taking scanning range 2θ [5–99.9°] with a step of 0.005°/s at room temperature 25
°C. Complementary analyses were done using scanning electron microscopy (SEM) coupled with
energy dispersive spectrometer (EDS) using a silicon drift detector (SSD), taking the operating
distance 10 mm, acceleration tension of 20 kV and numeration time mounted at 40 s/point range
(for semi-quantitative analyses).
The chemical composition of steel slag obtained from different studies is given in the table
below. The chemical composition of steel slag (range of compounds) from various steel plants of
India as per the “Indian Mining Yearbook (IMYB)-2011” is also given in table 2.1.

11
Table 2.1. Chemical composition of steel slag from different studies
Compound Emery
(1982)
Chaurand et
al. (2006) Aiban
(2006)
Shen et
al.
(2009)
Wang and
Yan
(2010)
Huang et
al. (2012)
IMYB
(2011)
CaO 41.3 41.3 25-42 50.51 40.46 45-60 45-50
SiO2 15.6 12.5 12-17 14.38 17.09 10-15 15-20
Al2O3 2.2 2.4 2-4 1.35 4.53 1-5 1-2
Fe2O3 20 31.2 20-28
5.22 23.86
3-9 -
FeO - - 14.8 7-20 15-25
MgO 6.9 4.3 6-10 4.49 10.46 3-13 5-10
P2O5 - 1.1 - 1.12 - 1-4 -
MnO 8.9 6.1 8-12 - - 2-6 1-5
TiO2 0.5 0.8 0-1 0.49 - - -
2.2.2. Toxic Leaching Characteristic Procedure (TCLP)
The Environmental Protection Agency of United States (or USEPA) in 1992 has introduced
regulatory levels for toxic materials present in hazardous wastes. USEPA standards were used to
determine the toxicity characteristics of the metal leachate obtained from steel slag aggregates
[Aiban (2006)] or EAF slag aggregates [Pasetto and Baldo (2010)]. The detection of the
concentration of heavy metals were done by either atomic absorption spectrophotometer (AAS) or
inductively coupled plasma-atomic emission spectrometer (ICPAES) methodology following
toxic characteristic leaching procedure (TCLP). The concentration of toxic or heavy metals was
found to be within the limits.

12
2.3. Physical properties of slag and moorum
Slag as a residual or by-product is often utilised in the construction of cementitious
applications to optimise the utilisation of natural available aggregate materials and conservation
of natural resources. Ferrous slags (blast furnace slag, steel making, manufactory and ferroalloy)
are the industrial by-products can be used in pavement construction because of their wide
convenience and scope of applications. [J. J. Emery (1982)]. In an European stabilized base layer
60% blast furnace slag (0 to 60 mm), 25% steel slag (0 to 15mm) and 15% granulated blast furnace
slag mixture was compacted with 10% water by mass using standard highway equipment that
showed excellent results.
Industrial wastes and by-products are also utilised in recycling processes, manufacturing
of new products, or as construction materials to minimise their environmental effects. The steel
slag aggregate (SSA) was utilised in road construction in Saudi Arabia, which is a by-product of
the steel manufacturing process [Saad Ali Aiban (2006)]. Two types of SSA materials were taken:
material finer than 5 mm (labelled 0 – 5 mm) and material having sizes up to 37 mm (labelled 0 –
37 mm). Several gradations were tried taking mixture of SSA, locally available marl, marl fines,
and sand and the gradation corresponding to the maximum CBR (as per ASTM method) was taken.
The CBR value of proposed gradation was found to be 119 at moulding moisture content of 5%.
In a modified gradation, 10 % SSA fines were added to the proposed gradation gave highest CBR
value of 383. Similarly different percentages of dune sand were added to SSA and compacted at 5
% moisture content. The highest CBR value of 406 was obtained at a sand percentage of 15 %.
Locally available marl (having maximum CBR value of 224) was used to reduce the consumption
of SSA, taking a blend of equal proportions of SSA and marl produced CBR values reaching 400.
These values were far more than the values presented by pure marl of same gradation.

13
A field trial was used having
A compacted subgrade (comprised of the existing marl and mixed with sand in some
places).
A 100 mm thick fine SSA (0-5 mm) filter layer.
A 200 mm SSA (0–37 mm) base course reconstituted to modified gradation
The asphalt concrete layers (a 70 mm thick base layer and a 40 mm thick wearing layer)
The field trial showed an excellent performance over the years even under poor drainage and
submerged conditions.
The steel slag combined with limestone aggregates were used in different proportions to
achieve desired density and shear strength in Egyptian roads. The grain size distribution, porosity,
unit weight, Los Angeles abrasion value, angle of internal friction, bulk specific gravity, water
absorption of steel slag and limestone aggregates were found out. OMC and MDD for various
blended mixes were determined; the OMC decreased, and the MDD increased with increase in
slag percentage. California bearing ratio and resilient modulus were increased with increase in slag
percentage up to 70%. For the blend mix of 70% steel slag percentage to 30% limestone gave
highest CBR value (of 370 %) and resilient modulus (of 4000 Mpa). Theoretical analysis of the
blended layer was achieved using a finite element (FE) computer programme (FENLAP)
estimating the deflection, vertical strain, vertical stress and radial stress [Behiry (2012)].
Fly ash and phosphor-gypsum modified steel slag aggregates were used in road base
construction in China [Weiguo Shen., et al. (2009)]. The particle size distribution and apparent
density of individual materials were determined. The mixture prepared by blending of materials
was stored for 4 hours and then compacted (at optimum moisture content after 1 hour of cement

14
addition) into a 50 mm dia×50 mm height cylinder mould to prepare cylinder specimen. The
relative compaction with the MDD was found to be 97%. For Standard Proctor compaction test
and Unconfined Compression Test T0804-94 specifications (China) were followed which are
similar to the ASTM codes. The stabilized soil samples were sealed in plastic bags and stored at
room temperature and a 95% relative humidity, and then soaked in water for 24 hours (at room
temperature) before compressive strength tests. A steel slag to fly ash ratio around 1:1 having
phosphor-gypsum dosage of 2.5% was found to be optimum giving a 7-day strength of 1.86 Mpa
and 28 day strength of 8.36 Mpa that meets the requirements (China criteria of semi-rigid road
base material).
Basic oxygen furnace (BOF) slag as well as electric arc furnace (EAF) slag is also used for
road base as well as road base asphalt concrete. In a trial, the mix design and performance
characterization of the bituminous mixes was done in Italy. Gyratory compaction tests, indirect
tensile strength tests, fatigue tests, permanent deformation tests and stiffness modulus tests (at
various temperatures) of the mixtures of EAF slag and asphalt showed better mechanical
characteristics than those of the conventional natural aggregate and asphalt mixture, satisfying the
acceptable criteria for Italian road construction. [Pasetto and Baldo (2010)]. In a moisture damage
investigation of the road, the BOF prepared asphalt mixtures were characterised by resilient
modulus tests, indirect tensile strength tests. The freeze-thaw tests showed better moisture
sensitivity of BOF slag mixture than that of the basalt mixture [Jun Xie., et al. (2012)].
The moorum collected from Sukrut (Uttar Pradesh) was mixed with Ganga sand and
cement stabilised for use in Wet Mix Macadam (WMM) [Ransinchung., et al. (2014)]. The
physical properties of moorum, Ganga sand, crushed aggregate and stone dust were found out. The
proportions of individual aggregates were determined so that the mixture would satisfy the desired

15
gradation of MoRTH specifications. Ordinary Portland Cement was used as a stabiliser and
varying the cement content the CBR tests and the unconfined compressive strength tests were
conducted. The results showed highest CBR value (423%) and unconfined compressive strength
(18.55 kg/cm2) at 9 percent cement content.
2.4. Critical review
From different studies, it has been observed that steel slag can be used as a material for
road construction. It's physical, and engineering properties were found to be superior as compared
to those of natural aggregates. From the characterisation and leaching studies, it was confirmed
that it has almost no hazardous effects on the environment. So there is scope for utilisation of slag
in unbound road pavements after this satisfies the desired specifications and characteristics,
leachate water toxicity.
A limited literature is observed on the application of hard moorum in road construction.
From the studies, it can be observed that moorum has a potential for use in road base and sub-
bases. As the properties of moorum vary from place to place, more studies are required to
generalise the properties of moorum and how effectively it can be used in road pavement
applications.

16
CHAPTER-3
EXPERIMENTAL METHODOLOGY
3.1. Introduction
The materials whether natural aggregates or industrial wastes/by-products or locally
available materials must satisfy the desired physical properties and strength parameters (for use in
base or sub-base layer of road pavement) before their application. Apart from these tests, the
materials which have a potential to affect the environment are also subjected to some chemical
tests and characterisation to check whether they are environmentally acceptable or not. In this work
chemical composition and characterization of slag were undertaken. The physical properties of
slag, natural crushed aggregates and moorum were determined as per respective codes,
specifications and certain literature. The test methods carried out in this work are presented below.
3.2. Characterisation of slag
As regards characterisation of slag is concerned, its chemical composition and phase
compositions were determined. The presence of any toxic or heavy metals was studied both in the
slag as well as in the leachate water collected from the slag. Several analytical techniques and their
methodology used for the above are briefly discussed.
3.2.1. X-Ray Fluorescence
A high energetic primary X-radiation is bombarded on the sample, resulting ejection of
electrons from the inner shell. Higher energy level electrons from the outer shell will jump down
to fill the vacancy emitting fluorescence radiation which is different for different materials. So

17
using a detector, the presence of a particular compound in the sample can be found. Slag samples
were finely grounded to get a homogeneous mixture and then analysed using an X-ray fluorescence
spectrometer. The mean chemical composition of 12 slag samples was expressed in terms of
percentage of total weight. The basicity was expressed as the ratio of CaO to SiO2, which defines
the chemical composition and metallurgical properties of slag. [Source:
http://encyclopedia2.thefreedictionary.com/Basicity]
Figure 3.1 (a) Principle of XRF Figure 3.1 (b) XRF Instrument
[Source: http://xrf-spectroscopy.com/ ]

18
3.2.2. X-Ray Diffraction
The X-ray diffraction technique was used to determine the phase composition of slag
samples. The slag samples were grounded (to pass a standard 75µm IS sieve) and homogenised
before analysis. XRD analysis was performed on a PW 3020 Philips diffractometer using Cu Kα
(λ=0.15405 nm) radiation. The diffraction data was taken in the scanning range (2θ range) of 10ᵒ
to 90ᵒ, taking a scan speed of 20ᵒ per minute and a step size of 0.05. “X’pert high score” software
was used for analysis of the XRD data. The Cu Kα2 radiation was stripped from the collected data
by the software before analysis.
A correlation was made between the XRF and XRD data to confirm the composition and
the phases present in the slag samples.
3.2.3. Scanning Electron Microscopy (SEM) and Electron Dispersive X-Ray spectroscopy
(EDX)
The electron dispersive X-Ray spectroscopy is also a non-destructive, analytical technique
used to determine the elemental composition of the materials under study [Wikipedia]. The
principle of EDX is same as that of X-ray fluorescence but in case of the former the elemental
composition of samples are determined. The slag samples were analysed by means of scanning
electron microscopy using a NOVA NANO SEM FEG operated at a voltage of 310V and 90µA
current). The samples were put in the holder, and EDX spectrum of different points were observed.

19
3.2.4. Toxic Characteristic Leaching Procedure (TCLP)
Toxic characteristics leaching procedure as per the Environmental Protection Agency
(EPA) of United States (method 1311:1992) was used to prepare the leachate water as per the
following. Deionized (DI) water was taken as reagent water. 5g of finely grounded slag samples
was taken in a beaker, 96.5 ml DI water was added to it and mixed using a magnetic stirrer for 5
minutes. The pH of the solution was found to be 10, so 3.5 ml 1 N hydrochloric acid was added
and heated at 50ᵒC for 10 minutes. The pH of the sample was found to be more than 5. So extraction
fluid 2 was used according to the procedure. The extraction fluid was prepared by taking 5.7 ml
glacial acetic acid, and the volume was made up to 1 litre. 5g slag sample (total 6 number of
samples) was taken in an extraction vessel and 100 ml (20 times the weight of the solid sample)
extraction fluid was added to each vessel. Then the vessels were covered and rotated at a constant
speed of 30±2 rpm for 18±2 hours at room temperature. Then each solution was filtered through a
0.7 µm glass fibre filter, and the filtrate was acidified (to a pH<2) with nitric acid for metal
detection. Each solution was stored at 4ᵒC before analysis using an Atomic Absorption
Spectrometer in which the concentration of heavy and toxic elements was observed and compared
with the regulatory levels of EPA.
3.3. Physical Properties and Strength Tests
In the present work, an attempt on the utilisation of slag has been made in the sub-base
layer of the flexible pavement. For the lower sub-base layer (or filter layer) a closed grading
(Grading II for Granular Sub-base Materials) was taken and for the upper layer (drainage layer) a
relatively uniform grading (GSB Grading IV) was considered as per MoRTH (2013)

20
specifications. The crushed aggregates were stabilized with cement for use in the drainage layer
of sub-base using GSB grading IV. Hard moorum was used both in cement stabilised base, and
cement stabilised sub-base filter layer taking the GSB Grading II of MoRTH (2013) specification
in both cases. The desired gradation of GSB grading II and IV as per MoRTH (2013) specification
corresponding to the standard IS sieve sizes are given in table 3.1.
Table 3.1. Grading for Granular Sub-base Materials [Table 400-1, MoRTH (2013)
specifications]
IS Sieve Size
(in mm)
Percentage passing the IS sieve
GSB Grading II GSB Grading IV
53 100 100
26.5 70-100 50-80
9.5 50-80 -
4.75 40-65 15-35
2.36 30-50 -
0.425 15-Oct -
0.075 0-5 0-5
3.3.1. Gradation
Gradation of the materials was determined by sieve size analysis taking IS sieves as
mentioned in table 3.1. The materials were stored in the oven for 24 hours and then cooled before
the sieve analysis. Wet sieving was done to find the gradation of finer materials (finer than 4.75
mm) in respect of moorum by washing the materials on a 75 µm IS sieve (until all the finer
materials were passed), drying the retained materials in oven (for 24 hours) and then sieving the
dried materials (after cooling) in designated IS sieves finer than 4.75 mm. The sieve size analysis

21
of 15 samples of slag, 5 samples each of 40 mm, 20 mm, 10 mm, and 6 mm crushed aggregate and
15 samples of hard moorum was done and the gradation results were shown in graphical forms
taking sieve size (in mm) in x-axis (log scale) and corresponding percentage passing in y-axis.
3.3.2. Blending of aggregates
After the gradation results of slag, moorum and crushed aggregates were obtained,
blending of the same materials was done by mixing different proportions of crushed aggregates
and also with slag or moorum to meet the desired gradation (either GSB grading II or grading IV
as specified in table 3.1) on a trial and error basis and the aggregate blend for which the percentage
passing was within the desired limits was used for further tests and analyses.
3.3.3. Determination of Water Absorption and Specific Gravity
The water absorption (%) of the samples were determined by the pycnometer method as
per the IS: 2386 (Part III). The bulk specific gravity and apparent specific gravity of both fine
(finer than 4.75 mm) and coarse aggregates (coarser than 4.75 mm) of slag and moorum, as well
as crushed aggregates, were also determined by the same method.
3.3.4. Determination of Plasticity Index
The liquid limit and plastic limit of aggregates were determined (taking materials finer than
425µm sieve) as per IS: 2720 (Part V) -1985 and the difference was expressed as the plasticity
index.

22
3.3.5. Aggregate Impact Test
The impact test of the individual materials, as well as the combined materials for use in
different pavement layers, were determined as per IS: 2386 (Part IV) -1963. Moorum samples for
which the water absorption values were found to be more than 2%, wet aggregate impact value
was determined as per IS: 5640 -1970. In wet impact test, the materials passed through 12.5 mm
sieve and retained on 10 mm sieve were filled in the container, weighed (A gram) and then
immersed in water for 3 days before testing. After impact (14 blows having 1-second interval), the
materials were washed through a 2.36 mm sieve and the retained materials were dried in an oven
for 24 hours before taking weight (A1). The wet impact value was expressed as the ratio of the
weight of materials passed 2.36 mm sieve to the total weight of materials taken as expressed in
equation 1.
𝑊𝑒𝑡 𝐼𝑚𝑝𝑎𝑐𝑡 𝑉𝑎𝑙𝑢𝑒 (%) = 𝐴−𝐴1
𝐴 × 100 (1)
3.3.6. Combined Flakiness Index
Specified thickness and length gauges are used to determine flakiness and elongation
indices respectively as per IS: 2386 (Part I) –1963. To determine the combined flakiness index the
aggregates were first passed through the thickness gauge, and the weight of the aggregates passed
thickness gauge was noted (A). The materials retained were then passed in the length gauge, and
the weight of the aggregates retained was noted (B). The combined flakiness index was expressed
as a percentage of total weight as given in equation 2.
𝐶𝑜𝑚𝑏𝑖𝑛𝑒𝑑 𝐹𝑙𝑎𝑘𝑖𝑛𝑒𝑠𝑠 𝐼𝑛𝑑𝑒𝑥 (%) =𝐴+𝐵
𝑇𝑜𝑡𝑎𝑙 𝑤𝑒𝑖𝑔ℎ𝑡 𝑜𝑓 𝑎𝑔𝑔𝑟𝑒𝑔𝑎𝑡𝑒𝑠 𝑡𝑎𝑘𝑒𝑛 (2)

23
3.3.6. Modified Proctor Test
Modified proctor test was conducted as per the IS: 2720 (Part 8) -1983 to find the maximum
dry density (MDD) at corresponding optimum moisture content (OMC). Compaction of materials
(up to a maximum size of 37.5 mm) was done taking a larger size mould (volume equal to 2250
cm3), compacting the materials in 5 layers and giving 55 blows to each. The water content of the
materials for each trial was determined by the oven dry method as per IS: 2720 (Part II)–1973.
3.3.7. Determination of California Bearing Ratio (CBR)
The CBR value of the combined blend of slag and crushed aggregates were determined as
per IS: 2720 (Part 16) -1987. The materials with maximum size up to 19 mm were compacted in a
standard CBR mould with an extension collar (with spacer disc at the top) by a compression testing
machine (static compaction) at a constant rate. The materials having a size larger than 19 mm were
replaced with an equal weight of materials passing 19 mm and retained on 4.75 mm sieve. The
samples were stored in water for four days before the penetration tests. The CBR values were
expressed in percentage at 2.5 mm penetration (which were found to be more than those at 5 mm
penetration).
3.3.8. Unconfined Compression Test
The unconfined compression test was used to determine the compressive strength of
moorum and crushed aggregate mixture. Cement was used as the binder to stabilise the non-plastic
mixture (crushed aggregates or combination of moorum and crushed aggregates) for their use in
road base and drainage or filter layer of sub-base.

24
3.3.8.1. Cube Specimen
The compressive strength of cement stabilised cube specimens (15 cm ×15 cm ×15 cm)
was determined as per IS: 4332 (Part V) -1970. Specimens were prepared to the predetermined
maximum dry density taking materials up to a maximum size of 37.5 mm compacted at the
optimum moisture content. The compaction was done through a vibratory hammer fitted to three
tampers with specified heights (as shown in fig.3.2.) for compaction in three layers (each of 5 cm)
of the cube.
Figure 3.2. Tampers for use with a vibrating hammer for Unconfined Compressive Strength test
[IS: 4332 (Part V) -1970]
The height A is different for all the tampers. The tampers with A=100 mm, 50 mm and 150
mm were used for compaction of the bottom 5 cm, the middle 5 cm and the top 5 cm of the cube
respectively. During the compaction of the top layer, another cube without baseplate was placed
squarely on the top of the cube to disallow spillage of any materials. The surface was levelled off

25
with a trowel, covered with a metal plate and stored at 27±2ᵒC for 24 hours. Then the specimen
was removed from the mould and stored for curing in a curing tin (160 mm x 160 mm x 155 mm
deep with well-fitting lid sealed with tape to maintain the optimum moisture content) at 27±2ᵒC.
The difference in weight before storage and after removal (7 days from the time of compaction)
was found to be within 2 g (which is much less than the allowable limit of 10 g) for all the
specimens. The specimens after removal from the tin were then immediately tested in the
Compression Testing Machine at a constant rate of loading (35 kgf/cm2/min) until failure. Fig. 3.3
gives the sequences involved in preparation and testing of UCS of cube specimens.
Figure 3.3. Sequences involved in preparation and testing of UCS of cube specimens (a)
Compaction of materials in a cube mould using a vibratory hammer, (b) cube mould covered with
a metal plate (160 mm× 160 mm× 3 mm), (c) removal of specimen from the mould after 24 hours,

26
(d) weight measurement of cube specimen inside a properly sealed curing tin (160 mm x 160 mm
x 155 mm), (e) Unconfined compression test of specimen (after 7 days) using a Compression
testing machine
3.3.8.2. Cylinder Specimen
The compressive strength of cylindrical specimens was determined using moulds having
101.6 mm diameter and 203.2 mm height as per ASTM-D1633 (2007). The height to diameter
ratio (2.00) was more as compared to other cylindrical specimens giving a better practical measure
(of compressive strength) reducing the complex stress conditions those may occur in case of the
later (having lower height to diameter ratio) because of shearing of specimens. The materials up
to a maximum size of 19 mm (larger size materials were replaced with equal weight of materials
passing 19 mm and retained on 4.75 mm sieve) were compacted to the predetermined maximum
dry density at the optimum moisture content. The specimens were removed from the moulds after
24 hours of compaction and stored at 23±1.7ᵒC in a BOD incubator after proper sealing to maintain
the moisture content. The difference in weight before and after curing was found to be within 1 g.
The specimens (removed from incubator after 7 days from the time of compaction) were tested in
the Compression Testing Machine and the compressive strength was multiplied by a height factor
of 1.25 to obtain the equivalent compressive strength of cube [as per IRC: SP:89-2010, Table 12:
Correction factors for various size and shape of test specimens]. Fig. 3.3 gives the sequences
involved in preparation and testing of UCS of cylinder specimens.

27
Figure 3.4. Sequences involved in preparation and testing of UCS of cylinder specimens (a)
Tamper used with vibratory hammer for compaction of cylindrical specimens, (b) Cylindrical
mould (101.6 mm diameter and 203.2 mm height) used for compaction, (c) Removal of specimen
from the mould after 24 hours, (d) Weighing of specimen after proper sealing, (e) Curing of
specimens in the BOD incubator at a constant temperature (23±1.7ᵒC) (f) Unconfined compression
test of specimen (after 7 days) using a Compression testing machine.

28
3.4. Materials used
Slag remaining as waste material and obtained from Rourkela Steel Plant premises
Locally available hard moorum
Crushed aggregates to be blended with slag or moorum to meet the desired gradation as
per MoRTH specification
Cement as a binder for cement stabilisation
Chemicals required to perform different chemical analyses

29
CHAPTER-4
RESULTS AND DISCUSSIONS
4.1. Characterization of slag
4.1.1. Chemical Composition
The chemical composition of the slag samples was determined by the XRF technique and
is presented in table 4.1.
Table 4.1. Chemical composition of the slag samples determined by XRF technique
Chemical composition Percentage
SiO2 27.33
FeO 20.91
Al2O3 6.03
CaO 31.03
MgO 9.24
MnO 4.50
S 0.10
TiO2 0.66
K2O 0.14
The basicity (CaO/SiO2) of the slag samples was found to be 1.14.

30
4.1.2. Phase Analysis
The phase composition of the slag samples was determined by the XRD method. The
different phases (in terms of corresponding references of X’pert HighScore software) present in
different slag samples were shown in table 4.2. The 2θ vs. the intensity variation of different slag
samples and the phases corresponding to their peaks are shown in fig. 4.1 after analyzed by the
software.
Table 4.2 (a) XRD peaks of slag samples corresponding to position [2θ (degrees)] and relative
intensity [%], as analysed by X’pert HighScore software
Position [2θ (degrees)] Relative Intensity Matched by (References)
Slag-1
18.6299 65 83-0114; 70-1435
26.6815 65.37 79-1910; 17-0445; 70-1435
29.4604 100 24-0027; 71-2108; 17-0445
31.4502 32.94 24-0027; 17-0445
38.0265 55.2 83-0114; 71-2108; 70-1435
42.1184 26.83 70-1435
Slag-2
18.6226 89.83 83-0114
26.6715 49.18 79-1910
29.4484 100 24-0027; 71-2108
38.0507 60.31 83-0114; 71-2108

31
Slag-3
18.6128 82.45 83-0114
26.6618 63.17 79-1910; 83-1563
29.4229 100 24-0027
38.011 59.86 83-0114; 83-1563
Slag-4
18.5937 83.67 83-0114
20.9032 30.8 79-1910
26.5942 38.34 79-1910
29.4223 100 24-0027
38.0033 54.52 83-0114
42.9454 70.89 24-0027; 75-1609
Slag-5
18.6097 88.11 83-0114
26.623 48.97 79-1910
29.4285 100 24-0027; 71-2108
38.0039 72.29 83-0114; 71-2108

32
Table 4.2 (b) Presence of phases in the slag samples corresponding to their reference codes used
in table 4.2 (a)
Reference no. Corresponding Phase
24-0027 CaCO3
79-1910 SiO2
83-0114 Mg(OH)2
71-2108 Ca2Fe2O5
75-1609 Fe3O4
17-0445 Ca3SiO5
70-1435 Al2TiO5
24-0234 Ca2SiO4
83-1563 Al2SiO5
Figure 4.1 (a) Position (2θ) ~Intensity variation of slag sample no.1

33
Figure 4.1 (b) Position (2θ) ~Intensity variation of slag sample no.2
Figure 4.1 (c) Position (2θ) ~Intensity variation of slag sample no.3

34
Figure 4.1 (d) Position (2θ) ~Intensity variation of slag sample no.4
Figure 4.1 (e) Position (2θ) ~Intensity variation of slag sample no.5

35
From the XRD analysis, the phases of the slag samples were found to be either the same
or a combination of the compounds as found in the chemical composition from the XRF technique.
The phases were found to be either in carbonate, silicate or hydroxide form rather than oxide form
which proves the slag being in a stable state and makes it suitable for construction applications.
4.1.3. Elemental Composition
The elemental composition of different points of the slag samples observed by the EDX
technique are shown in graphical and tabular forms. The EDX spectrum of three different points
from each of two slag samples (as shown in fig.4.2) are observed as in fig.4.2 and the presence of
the elements at a specific point in the slag samples with their percentage (by atomic weight) are
shown in table 4.3. The presence of any heavy metals present in the slag samples was also checked.
(a) Slag sample 1 (b) Slag sample 2
Figure 4.2. Magnified pictures (4000×) of two slag samples using Nova NanoSEM-450

36
Figure 4.3 (a) EDX Spectrum of point 1 of slag sample no.1
Table. 4.3 (a) Elemental Composition of point 1 of slag sample no.1

37
Figure 4.3 (b) EDX Spectrum of point 2 of slag sample no.1
Table. 4.3 (b) Elemental Composition of point 2 of slag sample no.1

38
Figure 4.3 (c) EDX Spectrum of point 3 of slag sample no.1
Table. 4.3 (c) Elemental Composition of point 3 of slag sample no.1

39
Figure 4.3 (d) EDX Spectrum of point 1 of slag sample no.2
Table. 4.3 (d) Elemental Composition of point 1 of slag sample no.2

40
Figure 4.3 (e) EDX Spectrum of point 2 of slag sample no.2
Table. 4.3 (e) Elemental Composition of point 2 of slag sample no.2

41
Figure 4.3 (f) EDX Spectrum of point 3 of slag sample no.2
Table. 4.3 (f) Elemental Composition of point 3 of slag sample no.2

42
The probable elements present in the slag samples were given as inputs, and the results have shown
that the peaks of the elements (of EDX spectrum) match with the peaks of the corresponding phases
of XRD spectrum. The input of heavy or toxic elements showed zero peaks in the spectrum and
had zero percent (by weight) at the specific points in the slag samples.
4.1.4. Toxicity Characteristic Leaching Procedure (TCLP)
The concentration of toxic or heavy elements in the leachate water observed by the Atomic
Absorption Spectrometer is given in table 4.4. These results are compared with the regulatory
levels of corresponding elements as per the EPA of United States.
Table 4.4. The concentration of heavy or toxic elements in leachate water of the slag samples
observed by AAS.
Heavy or toxic
element Concentration (mg/L)
US EPA Hazardous Waste
Permissible Limit (mg/L)
Arsenic 0.02 5
Chromium 1.09 5
Lead 0.50 5
Mercury NOT DETECTABLE 0.2
Copper 0.04 -
Nickel 0.13 -
Zinc NOT DETECTABLE -
Iron 0.55 -

43
The concentration of toxic elements in leachate water was found to be well within the
regulatory levels, and the concentration of heavy elements were also found to be very low (within
1 ppm).
4.2. Physical Properties
4.2.1. Gradation
The sieve size analysis results for slag, crushed aggregates and moorum samples are
presented in table 5.1 and the graph of sieve size and mean percentage passing is shown in the fig
5.1.
Table 4.5. Sieve size analysis of the slag, crushed aggregates and moorum samples
Sieve Size (in
mm)
Mean %age passing
SLAG A40 A20 A10 A6 Moorum
53.00 100.00 100.00 100.00 100.00 100.00 100
26.50 78.19 15.45 99.67 100.00 100.00 92.74
9.50 47.34 0.17 1.78 75.69 100.00 65.88
4.75 34.96 0.16 0.41 2.96 94.05 41.39
2.36 25.90 0.16 0.38 1.55 54.92 25.04
0.43 8.87 0.14 0.34 1.14 31.87 15.10
0.075 1.00 0.06 0.13 0.30 11.85 10.73

44
Figure 4.4. Graph of sieve size ~ mean %age passing of the slag, crushed aggregates and
moorum
4.2.2. Blending
4.2.2.1. Blending of Slag and Crushed aggregates
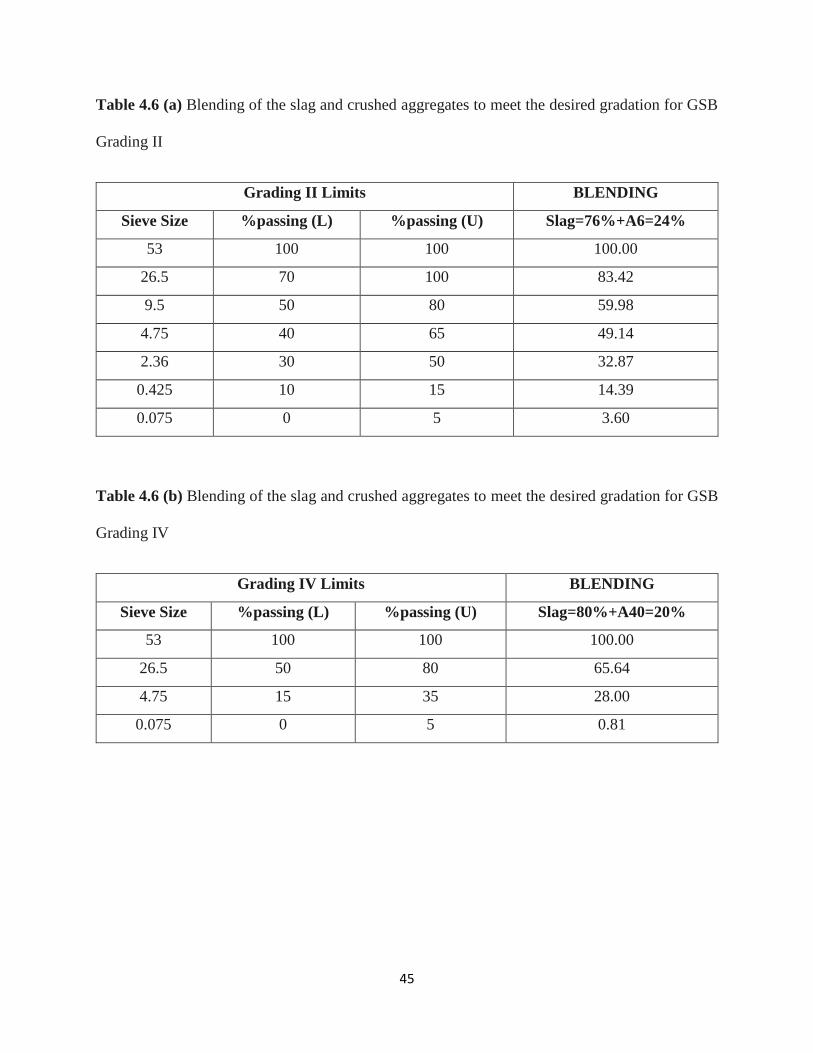
Blending of slag and crushed aggregates was done to meet the requirements of GSB
grading II (to be used in filter layer of GSB) and GSB grading IV (to be used in drainage layer of
GSB) as per MoRTH specifications. After so many trials, the final proportion of the aggregates
were found and are given in table 4.6.
-20
0
20
40
60
80
100
120
0.01 0.1 1 10 100
Me
an %
pas
sin
g
Sieve size (in mm)
SLAG MEANGRADING
A40 MEANGRADING
A20 MEANGRADING
A10 MEANGRADING
A6 MEAN GRADING
MORRUM MEANGRADING
45
Table 4.6 (a) Blending of the slag and crushed aggregates to meet the desired gradation for GSB
Grading II
Grading II Limits BLENDING
Sieve Size %passing (L) %passing (U) Slag=76%+A6=24%
53 100 100 100.00
26.5 70 100 83.42
9.5 50 80 59.98
4.75 40 65 49.14
2.36 30 50 32.87
0.425 10 15 14.39
0.075 0 5 3.60
Table 4.6 (b) Blending of the slag and crushed aggregates to meet the desired gradation for GSB
Grading IV
Grading IV Limits BLENDING
Sieve Size %passing (L) %passing (U) Slag=80%+A40=20%
53 100 100 100.00
26.5 50 80 65.64
4.75 15 35 28.00
0.075 0 5 0.81

46
Figure 4.5 (a) Blending of the slag and crushed aggregates to meet the desired gradation for
GSB Grading II
Figure 4.5 (b) Blending of the slag and crushed aggregates to meet the desired gradation for
GSB Grading IV
0
20
40
60
80
100
120
0.01 0.1 1 10 100
Me
an %
pas
sin
g
Sieve size (in mm)
Slag=76%+A6=24%
GRADING II(L)
GRADING II(U)
0
20
40
60
80
100
120
0.01 0.1 1 10 100
Me
an %
pas
sin
g
Sieve size (in mm)
GRADING IV(L)
GRADING IV(U)
Slag=80%+A40=20%

47
4.2.2.2. Blending of Crushed aggregates
Blending of different size crushed aggregates was done to meet the requirements of GSB
grading IV (for use in drainage layer of GSB) as per the MoRTH specifications using the same
procedure (trial and error method).
Table 4.7. Blending of the crushed aggregates to meet the desired gradation for GSB Grading IV
Grading IV Limits BLENDING
Sieve Size %passing (L) %passing (U) A40=35%+A10=50%+A6=15%
53 100 100 100.00
26.5 50 80 70.41
4.75 15 35 15.64
0.075 0 5 1.95
Figure 4.6. Blending of the crushed aggregates to meet the desired gradation for GSB Grading
IV
0
20
40
60
80
100
120
0.01 0.1 1 10 100
% p
assi
ng
sieve size (in mm)
BLENDING
GRADING IV(L)
GRADING IV(U)

48
4.2.2.3. Blending of Moorum and Crushed aggregates
Blending of moorum and crushed aggregates was done to meet the requirements of GSB
grading II for use in the cement treated base and the filter layer of sub-base. The proportions of
materials were selected for which the grading was best fitted within the desired limits.
But in case of moorum, the fines content was found to be very high and during blending it
was difficult to satisfy the limits of grading II taking the quantity of moorum more than 20 % of
the total weight of aggregates. So the blending of moorum and crushed aggregates was tried not
only to achieve a grading as close as possible to the desired grading of GSB grading II as per the
MoRTH Specifications but also to satisfy the grading limits of cement stabilization as per the
MoRTH Specifications as well as the grading requirements of cement bound base and sub-base
materials (Grading III) as per IRC SP: 89 (2010).
Table 4.8 (a) Blending of moorum and crushed aggregates to meet the requirements of GSB
Grading II as per the MoRTH Specifications
Grading II Limits for Granular Sub-base Materials
(MoRTH Specification) BLENDING
Sieve Size %passing (L) %passing (U)
Moorum=50%+A10=15%+
A6=35%
53 100 100 100
26.5 70 100 96.37
9.5 50 80 79.29
4.75 40 65 54.06
2.36 30 50 31.97
0.425 10 15 18.88
0.075 0 5 9.56

49
Table 4.8 (b) Blending of moorum and crushed aggregates to satisfy the grading requirements of
Materials for Stabilization with Cement as per MoRTH Specifications
Grading Limits of Materials for Stabilization with
Cement (MoRTH Specification) BLENDING
Sieve Size %passing (L) %passing (U)
Moorum=50%+A10=15%+A6=
35%
53 100 100 100
37.5 95 100 96.37
19 45 100 79.29
9.5 35 100 54.06
4.75 25 100 31.97
0.6 8 65 -
0.3 5 40 -
0.075 0 10 9.56
Table 4.8 (c) Blending of moorum and crushed aggregates to satisfy the Grading III Limits for
Cement Bound Materials for Base/Sub-bases as per IRC SP: 89(2010)
Grading III Limits for Cement Bound Materials for
Base/Sub-bases as per IRC SP: 89(2010) BLENDING
Sieve Size %passing (L) %passing (U)
Moorum=50%+A10=15%+A6=
35%
53 100 100 100
26.5 70 100 96.37
9.5 50 80 79.29
4.75 40 65 54.06
2.36 30 50 31.97
0.425 15 25 18.88
0.075 3 10 9.56

50
Figure 4.7 (a) Blending of moorum and crushed aggregates to meet the requirements of GSB
Grading II as per the MoRTH Specifications
Figure 4.7 (b) Blending of moorum and crushed aggregates to satisfy the grading requirements
of Materials for Stabilization with Cement as per the MoRTH Specifications
0
20
40
60
80
100
120
0.01 0.1 1 10 100
Me
an %
pas
sin
g
Sieve size (in mm)
BLENDING
GSB: GRADING II(L)
GSB: GRADING II(U)
0
20
40
60
80
100
120
0.01 0.1 1 10 100
Me
an %
pas
sin
g
Sieve size (in mm)
BLENDING
CEMENT ST. LIMIT(L)
CEMENT ST. LIMIT(U)

51
Figure 4.7 (c) Blending of moorum and crushed aggregates to satisfy the Grading III Limits for
Cement Bound Materials for Base/Sub-bases as per IRC SP: 89(2010)
From different trials, the optimum proportion of moorum that can be used in base and sub-
base was found to be 50 percent of the total weight of aggregates satisfying the above grading
requirements.
4.2.3. Other Properties
The physical properties of individual aggregates were determined following the procedure
as described in section 3.3 presented in table 4.9 (a). The physical properties of the combination
of aggregates (slag and crushed aggregates or only crushed aggregates or moorum and crushed
aggregates) were determined for their use in different layers taking the optimum proportions as
obtained in blending and presented in table 4.9 (b).
0
20
40
60
80
100
120
0.01 0.1 1 10 100
Me
an %
pas
sin
g
Sieve size (in mm)
BLENDING
CEMENT BOUND: GRADINGIII(L)
CEMENT BOUND: GRADINGIII(U)

52
Table 4.9 (a) Physical properties of the slag, individual crushed aggregates and moorum.
Property Slag A40 A20 A10 A6 Moorum
Plasticity Index (PI)
Liquid Limit (LL) 30.00 - - - 17.60 40.70
Plastic Limit (PL) - - - - - 20.60
PI=LL-PL NP NP NP NP NP 20.10
Water Absorption (%)
Coarse 1.95
0.22 0.30 0.41 0.76
4.60
Fine 6.94 4.90
Specific Gravity (Bulk)
Coarse 3.10
2.76 2.75 2.74 2.65
2.74
Fine 2.66 2.64
Specific Gravity
(Apparent)
Coarse 3.33
2.78 2.78 2.77 2.66
3.14
Fine 2.94 2.92
Combined Flakiness Index 17.59 54.68 65.65 92.03 - -
Impact Value 14.72 12.93 19.76 22.98 - 33.39
Optimum Moisture Content (%) - - - - - 6.20
Max. Dry Density (g/cc) - - - - - 2.32

53
Table 4.9 (b) Physical properties of the combination of the slag and crushed aggregates, a
combination of crushed aggregates only, and combination of moorum and crushed aggregates for
use in different layers.
Property
Granular
Sub-base
Filter
layer
(GSB II)
Granular
Sub-base
Drainage
layer
(GSB IV)
Cement
treated
Sub-base
Drainage
layer
(GSB IV)
2% cement
Cement
treated
Base
(GSB II)
4% cement
Cement
treated
Sub-base
Filter layer
(GSB II)
2.5% cement
Remarks
with ref.
to
slag=76%
+
A6=24%
slag=80%
+
A40=20%
A40=35%
+A10=50%
+A6 =15%
Moorum=50%
+ A10=15%
+A6=35%
Moorum=50%
+ A10=15%
+A6=35%
MOTRH
/IRC
Liquid Limit
(LL) 24.50 30.00 17.6 21.00 21.00 <45
Plastic Limit
(PL) - - - - - -
Plasticity
Index (PI) NP NP NP NP NP <20
Combined
Flakiness
Index 17.59 28.89 73.28 66.94 66.94 -
Impact
Value 14.72 14.77 18.84 23.01 23.01 <40
Wet Impact
Value - - - 31.45 31.45 <40
Optimum
Moisture
Content (%) 9.56 9.15 4.92 7.04 6.35 -
Max. Dry
Density
(g/cc) 2.34 2.43 2.32 2.38 2.35 -
CBR (%) 78.90 215.30 - - - >30

54
The combination of slag and crushed aggregates, a combination of crushed aggregates as
well as a combination of moorum and crushed aggregates in above proportions also gave
satisfactory results. The specific gravity of the slag samples was found to be much higher as
compared to that of crushed aggregates and moorum. Hence, the maximum dry density value was
found to be very high. The corresponding optimum moisture content (OMC) value was also found
to be more because of the high water absorption value. The impact values were found to be well
within the regulatory level of 40% for use in road base or sub-base applications as per the Bureau
of Indian Standards. The water absorption value of moorum was found to be more than 2 percent.
Hence, the wet impact value of the combination of moorum and crushed aggregates was
determined and found to be within the limits. The MDD values were found to be high in the case
of both base and sub-base layer applications with 4 percent and 2.5 percent cement content (as a
binder for stabilization) respectively.
4.2.3.1. UCS Test Results
The unconfined compressive strength values of the combination of crushed aggregates and
combination of moorum and crushed aggregate blends for use in different layers with varying
cement content are presented in table 4.10. The UCS values of cube specimens for use in the
drainage layer of cement treated sub-base is shown in fig.4.7 (a) and the comparison of UCS values
of cube specimens with the equivalent UCS values of cylinder specimens for cement treated base
and filter layer of cement treated sub-base is shown in fig.4.7 (b) and fig.4.7 (c) respectively.

55
Table 4.10 (a) Unconfined Compressive Strength results of cube specimens (7 days)
Cement treated
Sub-base Drainage layer
(GSB IV)
2% cement
Cement treated Base
(GSB II)
4% cement
Cement treated
Sub-base Filter layer
(GSB II)
2.5% cement
A40=35% +A10=50% +A6
=15%
Moorum=50%+ A10=15%
+A6=35%
Moorum=50%+ A10=15%
+A6=35%
OMC=4.92%
MDD=2.321 g/cc
OMC=7.04%
MDD=2.378 g/cc
OMC=6.35%
MDD=2.351 g/cc
Cement
content
(%)
UCS value
(MPa)
Cement
content
(%)
UCS value
(MPa)
Cement
content (%)
UCS value
(MPa)
1.50% 1.1 3.50% 4.0 2.00% 2.8
2.00% 2.2 4.00% 4.9 2.50% 3.1
2.50% 2.8 4.50% 5.4 3.00% 3.3
3.00% 3.2 5.00% 5.2 3.50% 3.5
Table 4.10 (b) Unconfined Compressive Strength results of cylindrical specimens (7 days)
Cement Treated Base Cement Treated Filter layer of Sub-base
OMC=7.04%
MDD=2.378 g/cc
OMC=6.35%
MDD=2.351 g/cc
Cement
content (%)
UCS value
(MPa)
Equivalent cube
strength (MPa)
Cement
content (%)
UCS value
(MPa)
Equivalent cube
strength (MPa)
3.50% 4.7 5.9 2.00% 2.7 3.4
4.00% 5.9 7.4 2.50% 3.3 4.2
4.50% 6.5 8.2 3.00% 3.7 4.6
5% 6.4 8.0 3.50% 3.9 4.9

56
Figure 4.8 (a) UCS values of cube specimens for use in the drainage layer of cement treated sub-
base [A40=35% +A10=50% +A6 =15%]
Figure 4.8 (b) Comparison of the UCS values of cube specimens with the equivalent UCS
values of cylinder specimens for use in the cement treated base [Moorum=50%+ A10=15%
+A6=35%]
0.0
0.5
1.0
1.5
2.0
2.5
3.0
3.5
1.00% 1.50% 2.00% 2.50% 3.00% 3.50%
Co
mp
ress
ive
stre
ngt
h (
Mp
a)
Cement Content (%)
UCS values of cube specimens
3.0
4.0
5.0
6.0
7.0
8.0
9.0
3.00% 3.50% 4.00% 4.50% 5.00% 5.50%
CO
MP
RES
SIV
E ST
REN
GTH
(M
PA
)
CEMENT CONTENT (%)
UCS values of cube specimens
Equivalent UCS values ofcylinder specimens

57
Figure 4.8 (c) Comparison of UCS values of cube specimens with equivalent UCS values of
cylinder specimens for use in the filter layer of cement treated sub-base [Moorum=50%+
A10=15% +A6=35%]
The UCS value of the combination of moorum and crushed aggregates was found to be
more as compared to that of the combination of crushed aggregates only for a particular cement
content. The equivalent UCS values of the cylinder specimens were found to be more as compared
to those of the cube specimens. The 7 days UCS values for cement bound materials should be
between 4.5 to 7 MPa for use in the base and between 1.5 to 3 MPa for use in sub-base (drainage
or filter layer) as per IRC SP: 89(2010). So depending on the required UCS value for construction
of a particular layer the corresponding cement content can be taken to satisfy the requirements.
2
2.5
3
3.5
4
4.5
5
5.5
1.50% 2.00% 2.50% 3.00% 3.50% 4.00%
CO
MP
RES
SIV
E ST
REN
GTH
(M
PA
)
CEMENT CONTENT (%)
UCS values of cube specimens
Equivalent UCS values ofcylinder specimens

58
CHAPTER-5
SUMMARY AND FUTURE SCOPE
5.1. General
From the experiments conducted on the slag samples and locally available hard moorum,
and from the analysis of results, the conclusions drawn are summarized below.
5.1.1. Characterisation of Slag
The slag sample used in this work contains about 30% by weight of both CaO, SiO2 and
20% by weight of FeO and some amount of Al2O3 and MgO, confirms the slag as steel
slag.
The phases present in the slag are in carbonate, hydroxide or silicate form rather than oxide
form making it suitable for construction purposes.
The heavy and toxic metals present in the slag and its leachate water are either zero or
negligible. Hence, the potential for environmental hazards is very low.
5.1.2. Physical Properties
The slag samples are well graded which require less amount of crushed (conventional)
aggregates for blending to meet the desired grading for use in different layers of sub-base.
For filter layer a maximum up to 76% slag and for drainage layer a maximum up to 80%
slag can be used to satisfy the desired grading (GSB grading II and grading IV respectively
as per the MoRTH specifications).

59
The finer material content in the moorum used for this work is very high. Hence, the
amount of moorum that can be used for base and sub-base is limited to 50% in the total
aggregate blend.
The impact values of the slag, crushed aggregates and wet impact value of moorum are
within the maximum limits for road base or sub-base applications.
The specific gravity of the slag aggregates is much higher than that of the crushed
aggregates. Hence, the MDD and CBR values of the slag and aggregate blends are very
high.
The specific gravity of moorum is comparatively more than that of the crushed aggregates.
Hence, the MDD values are also higher in the moorum aggregate blend.
Cement is used as a binder for stabilization of moorum because of its high plasticity (PI=
20). The UCS values of the combination of moorum and crushed aggregates specimens
satisfy the desired lower limits for use in the cement treated base or sub-base layers.
The UCS value of cement treated moorum-crushed aggregates blend is more as compared
to that of crushed aggregates blend for a particular cement content.
5.2. Summary
In this work, an attempt has been made to use the slag and locally available hard moorum
in different layers of road base and sub-base. The slag used in the study is well graded and can be
used as a major aggregate constituent (up to 80% of total aggregates) in the road sub-base
applications (both filter and drainage layer). Results have shown that it not only has excellent
physical properties and desired strength for use in road sub-base and but is also environmentally
safe. Locally available hard moorum used in this study contains more fine materials and can be

60
suitable for closed or dense grading applications (base or filter layer of sub-base) which can replace
the conventional aggregates up to a maximum of 50% by weight. The physical properties satisfy
the desired requirements. The minimum desired strength value for use in a particular layer can be
achieved by using a small amount of binder (cement). For a particular content of binder, moorum
has shown better strength than that of the conventional crushed aggregates.
5.3. Future scope of work
The strength parameters considered in the study are CBR and UCS. Apart from these tests
the repeated load triaxial test can also be performed to find out the effect of dynamic
loading in different layers, and the realistic resilient modulus values may be determined.
The permeability of the slag and crushed aggregate mixture can be determined especially
in the drainage layer of the sub-base by using suitable tests.

61
REFERENCES
1. Aiban, S. A. "Utilization of steel slag aggregate for road bases." Journal of Testing and
Evaluation 34, no. 1 (2006): 65.
2. Behiry, A. E. A. E. M. "Evaluation of steel slag and crushed limestone mixtures as subbase
material in the flexible pavement." Ain shams Engineering Journal 4.1 (2013): 43-53.
3. Chaurand, P., Rose, J., Briois, V., Olivi, L., Hazemann, J. L., Proux, O., Domas, J., &
Bottero, J. Y. "Environmental impacts of steel slag reused in road construction: A
crystallographic and molecular (XANES) approach." Journal of Hazardous
Materials 139.3 (2007): 537-542.
4. Emery, J. J., "Slag Utilization in Pavement Construction", Extending Aggregate Resources,
ASTM STP 774, 1982, pp.95-118.
5. http://encyclopedia2.thefreedictionary.com/Basicity
6. http://xrf-spectroscopy.com/
7. Indoria, R. P. “Alternative materials for Road Construction”, Indian Highways, May 2011
8. IS: 2386 (Part-I), “Methods of Test for Aggregates for Concrete: Particle Size and Shape”,
Bureau of Indian Standards, New Delhi, 1963
9. IS: 2386 (Part-III), “Methods of Test for Aggregates for Concrete: Specific Gravity,
Density, Voids, Absorption, Bulking”, Bureau of Indian Standards, New Delhi, 1963
10. IS: 2386 (Part-IV), “Methods of Test for Aggregates for Concrete: Mechanical Properties”,
Bureau of Indian Standards, New Delhi, 1963
11. IS: 2720 (Part 2), “Method of Test for Soils: Determination of Water Content”, Bureau of
Indian Standards, New Delhi, 1973.

62
12. IS: 2720 (Part 5), “Method of Test for Soils: Determination of Liquid and Plastic Limit”,
Bureau of Indian Standards, New Delhi, 1985
13. IS: 2720 (Part 8), “Methods of Test for Soils: Determination of Water Content-Dry Density
Relation Using Heavy Compaction”, Bureau of Indian Standards, New Delhi, 1983
14. IS: 2720, “Methods of Test for Soil (Part 16): Laboratory Determination of CBR”, Bureau
of Indian Standards, New Delhi, 1987
15. IS: 4332, “Methods of Test for Stabilized Soils (Part V): Determination of Unconfined
Compressive Strength of Stabilized Soils”, Bureau of Indian Standards, New Delhi, 1970
16. IS: 5640, “Method of Test for Determining Aggregates Impact Value of Soft Coarse
Aggregates”, Bureau of Indian Standards, New Delhi, 1970
17. IRC: SP:89. “Guidelines for Soil and Granular Material Stabilization using Cement, Lime
and Fly ash”, Indian Road Congress, New Delhi, 2010
18. Ministry of Road Transport and Highways, “Specifications for Road and Bridge Works”,
Indian Roads Congress, New Delhi, 2013
19. Potgieter, J. H., Potgieter, S. S., and Legodi, B. "Proposed modifications to the method for
the determination of available lime." Minerals engineering 14.5 (2001): 515-523.
20. Pasetto, M., & Baldo, N. "Experimental evaluation of high-performance base course and
road base asphalt concrete with electric arc furnace steel slags." Journal of hazardous
materials 181.1 (2010): 938-948.
21. Ranshinchung, G. D., Kumar, P., Kumar, B., Anupam, A. K., & Chauhan, A.
P. "Laboratory evaluation for the use of moorum and Ganga sand in wet mix macadam
unbound base course." Indian Highways 42.4 (2014).

63
22. Shen, W., Zhou, M., Ma, W., Hu, J., & Cai, Z. "Investigation on the application of steel
slag–fly ash–phosphogypsum solidified material as road base material." Journal of
Hazardous Materials 164.1 (2009): 99-104.
23. “Slag – Iron and Steel (Advance Release)”, Indian Minerals Yearbook (2011): Part- II,
50th Edition.
24. “Standard Test Methods for Compressive Strength of Molded Soil-Cement Cylinders”,
ASTM Standards, D1633, 2007.
25. USEPA, Method 1311: TCLP – Toxicity Characteristic Leaching Procedure. In: Test
Methods for Evaluating Solid Waste. 3rd ed. Washington, DC, 1992
26. Viswanathan, P. V. and Gangadharan, T. K. “Environmental and waste management in
iron and steel industry”, NML, Jamshedpur, pp.199-207, 1996
27. Waligora, J., Bulteel, D., Degrugilliers, P., Damidot, D., Potdevin, J. L., and Measson, M.
"Chemical and mineralogical characterizations of LD converter steel slags: A multi-
analytical techniques approach." Materials characterization 61.1 (2010): 39-48.
28. Wang, Q., and Yan, P. "Hydration properties of basic oxygen furnace steel
slag." Construction and Building Materials 24.7 (2010): 1134-1140.
29. Yi, H., Xu, G., Cheng, H., Wang, J., Wan, Y., & Chen, H. "An overview of the utilization
of steel slag." Procedia Environmental Sciences 16 (2012): 791-801.
30. Yoder, E. J. & Witczak, M. W. “Principles of Pavement Design”, Wiley India Pvt. Ltd.,
New Delhi, 1975