use of geographic information system (gis) in …
TRANSCRIPT

USE OF GEOGRAPHIC INFORMATION SYSTEM (GIS) IN STUDYING GROUNDWATER
CONTAMINATION: AN APPLICATION TO ARSENIC PROBLEM IN BANGLADESH
By
IBRAHIM TAIWO ABDULKADIR
(ID#: 230341)
For
CRP 514: Introduction to GIS Term 041 – 11th Offer
Course Instructor: Dr. Baqer Al-Ramadan
Date: December 19, 2004.

1
ABSTRACT
Assigning responsibility for the cleanup of groundwater contamination requires
the analysis of large amounts of complicated data. The data and findings produced
here are produced by the British Geological Survey and the Department of Public
Health Engineering (Bangladesh) undertaking a project funded by the UK
Department for International Development (DFID). One of the main aims of the
project was to assess the scale of the groundwater arsenic problem in order to aid
the rapidly developing arsenic mitigation programme. A second aim was to increase
our understanding of the origins and behavior of arsenic in Bangladesh aquifers.
These aims were subsequently expanded to include a broader range of
hydrochemical parameters.
GIS has become a powerful tool to allow volumes of data to be quickly and
accurately displayed. ArcView GIS is used to create base maps consisting of
divisions, districts, cities, building locations, villages, well locations, and other
features. A Microsoft Excel database is developed for the storage of environmental
data consisting of groundwater location, rare elements analysis, groundwater depth,
type and owners, and sampling locations. From this database, queries are
preformed and linked to ArcView for spatial analysis. Custom visualization tools
were developed to allow for complicated analysis of the data.

2
LIST OF FIGURES
Figure 1: Documented cases of arsenic problems in groundwater related to natural
contamination.
Figure 2: Distribution of well sites and year sampled for the DPHE/BGS National.
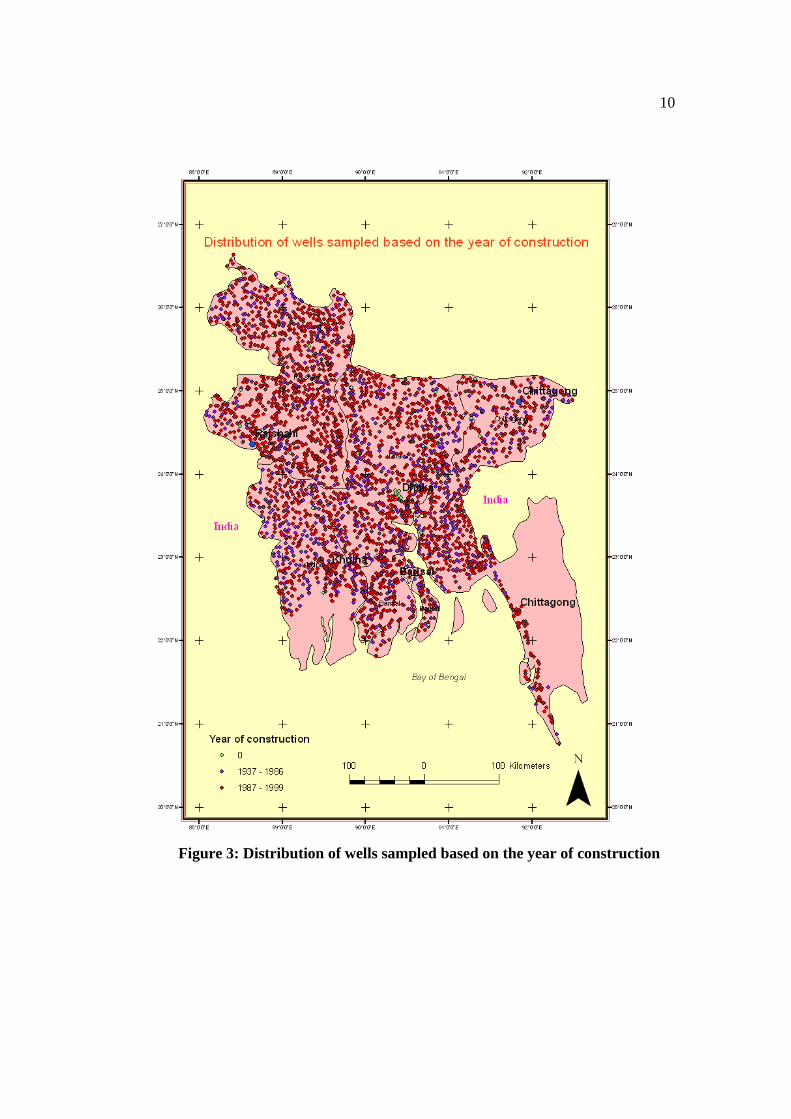
Figure 3: Distribution of wells sampled based on the year of construction.
Figure 4: The depth distribution of wells sampled in the National hydrochemical Survey.
Figure 5: Map of groundwater arsenic concentrations from the National Hydrochemical
Survey.
Figure 6: Average concentration of arsenic in wells from each of the six administrative
divisions.
Figure 7: Concentration of arsenic plotted against well depth for all sampled wells.
Figure 8: Classification of survey sample sites by lithological units.
Figure 9: Spatial variation of sodium in groundwater from the National Hydrochemical
Survey.
Figure 10: Sketch map of Bangladesh showing the major river systems and the locations
of three special study areas.

3
1. INTRODUCTION
Analyzing large amounts of groundwater and soil contaminant data generated from
numerous site investigations can be an overwhelming task. Especially when that data is in a
variety of formats, produced by numerous consultants, and have questionable levels of
accuracy. The use of GIS software like ArcView and a Microsoft Excel spreadsheet can
make the visualization of data much simpler. Before visualization and analysis can be done
an analytical database and GIS basemap must be developed. Microsoft Excel spreadsheet is
the preferred format for storing analytical data because of its simplicity and widespread use.
ArcView is used to compile, edit, and display GIS feature and raster data. ArcView’s ability
to retrieve data from a Microsoft Excel spreadsheet is a benefit, in that; the GIS data can be
displayed quickly and efficiently. Because data may exist in various digital or hardcopy
formats a database must be developed. This database must be robust enough to handle
various types of data but simple enough for novice Excel users to query data. It is also
important that the data is accurate and has source of information. Therefore quality assurance
or quality control methods are established and followed. In this project, data from the
analytical Excel spreadsheet is queried and displayed on basemap using a variety of
techniques that allow for hydrogeological analysis.
2. PROBLEM STATEMENT
There have been various surveys of water quality in Bangladesh. These surveys provided
useful data that gave a broad indication of major elements in groundwater contamination in
Bangladesh. Most of these data are then queried, analyzed and displayed on maps using
different techniques to give a reliable national picture of groundwater contamination by
Arsenic.

4
3. OBJECTIVES
The main aims of this project are:
(i) to produce maps showing the regional distribution of arsenic and other elements in
the groundwater and
(ii) to provide estimates of the percentage of wells exceeding various limits for arsenic
and other elements on maps.
4. STUDY LIMITATIONS /CONSTRAINTS
Most data used are from wells drilled by private contractors with no requirement or system to
record details of the borehole logs during and/on completion. In addition, details of the
government-drilled wells are not readily available. Hence, no sufficient sample density to
give a reliable national picture of ground water contamination by arsenic.
5. REVIEW OF LITERATURE
The first reported case of arsenic-contaminated groundwater (greater than 50 µgAsL) from
the Bengal Basin was recorded in 1978 in West Bengal (Acharyya et al., 2000) and the first
cases of arsenic poisoning there were diagnosed in 1983. These early cases of arsenic-
induced skin lesions were identified by K.C. Saha then at Department of Dermatology,
School of Tropical Medicine in Calcutta, India (Saha, 1995; Smith et al., 2000). The patients
seen were from West Bengal but by 1987 several patients had already been identified who
came from neighboring Bangladesh (Smith et al., 2000). The contamination of groundwater
by arsenic in Bangladesh was first confirmed by the Department of Public Health
Engineering (DPHE) in Chapai Nawabganj in late 1993 following reports of extensive
contamination in the adjoining area of West Bengal. The issue of arsenic contamination in
West Bengal achieved international recognition in 1995 when the School of Environmental

5
Studies (SOES) at Jadavpur University, Calcutta hosted an international conference on the
subject. Arsenic-affected patients from both West Bengal and Bangladesh were presented to
participants. Since the mid-1990s, SOES in conjunction with Dhaka Community Hospital
(DCH) have conducted field investigations over much of Bangladesh including a large
number of water analyses and tissue analyses. British Geological Survey (BGS) first became
involved in the groundwater arsenic issue in Bangladesh when it was awarded a grant by the
UK Department for International Development (DFID) to study arsenic contamination of
groundwater in Bangladesh and Argentina. Initial investigations were carried out in Chapai
Nawabganj in February 1997. These confirmed the high arsenic contamination of
groundwater in that area and established the reducing nature of the groundwater. The data
obtained pointed away from the pyrite oxidation hypothesis then being promoted by West
Bengal scientists. Thereafter, the DPHE with UNICEF assistance carried out a massive
screening programme of wells for arsenic across the whole of Bangladesh using simple field-
test kits.
The results of this survey showed for the first time the scale of the problem and identified the
centre of the worst-affected area as an area south-east of Dhaka. Northern Bangladesh was
also found to be substantially uncontaminated in terms of the prevailing Bangladesh drinking
water standard for arsenic (50 mg/kg). However, some hot spots had been found in northern
Bangladesh, including Chapai Nawabganj, largely because arsenic patients had been
identified there. Subsequent testing has confirmed the overall pattern that emerged from the
survey. In the world as a whole, the most noteworthy occurrences are in parts of West Bengal
and Bangladesh, Taiwan, northern China, Hungary, Mexico, Chile, Argentina and many parts
of the USA but particularly the south-west (figure 1).

6
Figure 1: Documented cases of arsenic problems in groundwater related to natural
contamination
6. STUDY AREA
Groundwater contamination by arsenic was first discovered in the west of Bangladesh in late
1993 following reports of extensive contamination of water supplies in the adjoining areas of
India. A World Bank Fact Finding Mission visited Bangladesh in April 1997 to assess the
situation and to initiate a mitigation programme. Part of their recommendations included a
broad-ranging Rapid Investigation Programme to collate the available data, fill in critical
gaps in knowledge and undertake surveys of the affected area
(http://www.bgs.ac.uk/arsenic/bphase1/b_intro.htm).
7. DATA AND THEIR SOURCE
The data used in this project are downloaded from
http://www.bgs.ac.uk/arsenic/bangladesh/datadownload.htm from which various maps in this
project were produced. See the appendix for the raw data in a Microsoft Excel spreadsheet

7
format. These data are by-product of survey carried out in Bangladesh from which
geochemical investigations were conducted on the collected water samples. A survey work
funded by UK Department for International Development (DFID) was carried out by both
British Geological Survey (BGS) and Department of Public Health Engineering (DPHE)
between January, 1998 and Mach, 2000.
The principal aims of the work were to: (i) compile, review and database existing
groundwater and sediment arsenic data from Bangladesh; (ii) review Bangladesh geology
and hydrogeology; (iii) carry out a systematic groundwater quality survey using laboratory
analyses of what were believed to be the 41 worst-affected districts of Bangladesh (out of 64
districts); (iv) carry out detailed geochemical investigations in three Special Study Areas, and
(v) model the movement of groundwater and arsenic in a typical Bangladesh situation.
8. TOOLS OF STUDY
Having downloaded the data from the said website and converted them from Excel formats to
shape files, a standard ArcGIS system (ArcView) was used to query and analyze data and
finally making different maps. See the list of figures for different maps generated from the
data. One of the important features of the results is the well-to-well variation in water quality.
9. METHODOLOGY OF STUDY
The sampling of wells from which groundwater data were collected was organized on a
district and upazila basis. Well selection was made using the following strategy:
(i) a 3 x 3 grid was penciled on the upazila map to divide the upazila into approximately nine
equal-area cells;
(ii) a route was planned between the cells; and

8
(iii) at least one well was selected from each cell ensuring that there was at least 2 km
between samples from adjacent wells.
In most of Bangladesh, the wells are predominantly in the shallow aquifer __usually in the
range 15-70 m depth. The number of deep wells in existence was small outside of the
southern coastal area, affected by salinity and the north-east region, where the shallow
aquifer is sometimes poor (Smith et al., 2000). A total of 326 samples were collected from
the deep aquifers for hydrogological analysis purpose.
The data in Microsoft Excel sheets are converted to shape files formats for compatibility with
ArcGIS. Thereafter, ArcGIS is used to query and display the data on different maps.
10. ANALYSIS/DISCUSSION
10.1 PRESENTATION OF DATA
10.1.1 DISTRIBUTION OF SAMPLED WELLS
A total of 3534 sites were sampled in the survey between 1998 and 1999. This amounts to a
sample density of approximately one per 37 km2 or an average site-to-site separation of about
6 km. The distribution of sample sites can be seen in figures 2 and 3.

9
The areas of low sample density are those where access is particularly difficult, for example
the south-western, the north-eastern and the western parts of the map.
Figure 2: Distribution of well sites and year
10
Figure 3: Distribution of wells sampled based on the year of construction

11
10.1.2 DEPTH OF SAMPLED WELLS
The depth distribution of wells is shown in figure 4. Of the sampled wells, about 70% were
in the depth interval 0-60 m. Although, there is a distinct geographical distribution which is
largely based on the minimum depth needed to obtain water of acceptable yield and quality
(notably salinity). In the southern coastal region, mangrove swamps of the Sundarbans in the
west mean that there are few people or wells present there.
Figure 4: The depth distribution of wells sampled

12
Further east, the wells either need to be very deep (greater than 150 m) as in the Barisal-
Patuakhali region or very shallow, as in the Lakshmipur-Noakhali region further to the east,
in order to avoid salinity. Relatively deep wells are also found in the Sunamganj-Sylhet
region where shallow aquifers are poor or non-existent. Very shallow wells are also found in
north-western Bangladesh where there is little or no overlying silt or clay layer. The cluster
of deep wells in central Bangladesh corresponds with the deep wells of the city of Dhaka
where extensive drawdown (and pollution) of the shallow aquifer necessitates the use of deep
wells.
10.1.3 GEOGRAPHICAL DISTRIBUTION OF ARSENIC
There is a distinct geographical distribution of arsenic with the greatest concentrations in the
south and south-east and the smallest concentrations in the north and north-west of
Bangladesh. This can be clearly seen in the map of the regional trends (figure 5). In the
arsenic map, the lowest concentration class symbols have been plotted first, then the symbols
for the next lowest class, and so on. Therefore where there is some overlap of symbols, the
higher concentration symbol will fall on top of the lower symbol and will tend to dominate
the map.
There is a large variation in the average arsenic concentration found in each administrative
division (figure 6). All divisions contain at least one well which exceeds the Bangladesh
standard. A broad north-south band of low As wells is found in SE Bangladesh. This follows
the Gorai-Bhairab valleys and may reflect a palaeo-channel.

13
Figure 5: Concentrations of groundwater arsenic

14
10.1.4 ARSENIC CONCENTRATION VERSUS WELL DEPTH
Perhaps the most important distinction in arsenic concentrations is between shallow and deep
wells (figure 7). Wells deeper than 150 m to 200 m show a sharp reduction in their average
Figure 6: Average concentration of arsenic in wells from each of the six administrative divisions

15
arsenic concentration and in the percentage of wells that exceed both the World Health
Organization (WHO) guideline value and the Bangladesh standard.
Figure 7: Concentration of arsenic plotted against well depth for all sampled wells

16
The “cut-off” depth depends on geographic location. Even though only 4% of sampled wells
in the 100 - 150 m depth range, 37% of them exceeded 50 µg/L. Therefore, in many areas it
appears that it would not be sufficient to drill just a little deeper for low-As water but wells
would need to exceed at least 150 m to provide low-As water.
10.1.5 ARSENIC VERSUS GEOLOGY
Each of the sampled wells was assigned to a geological unit based on the Geological Survey
Figure 8: Classification of sampled sites by lithological units

17
of Bangladesh classification as given by the most recent geological map of Bangladesh
(Alam et al. 1990). This allocation was based on the GPS measured well position and a
digital form of the geological map. The most significant observation is that high arsenic
concentrations are confined to recent (Holocene) sediments - conversely, the older sediments
are essentially arsenic-free.
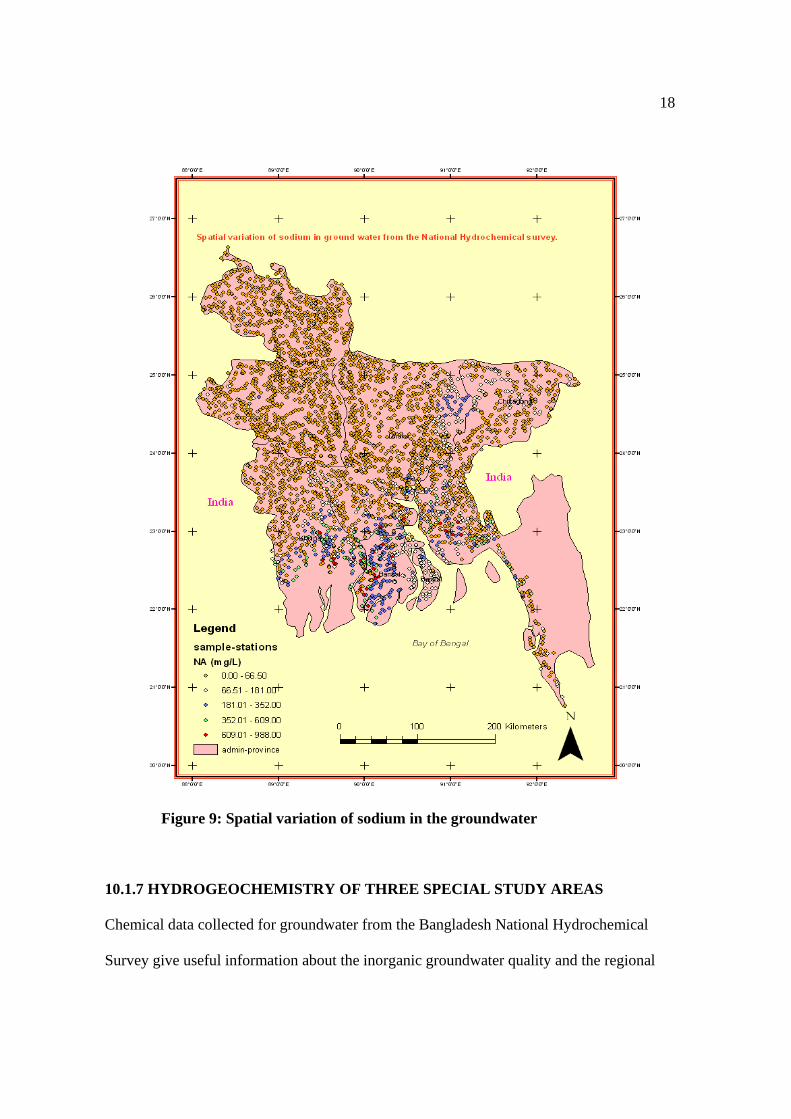
10.1.6 DISTRIBUTION OF SODIUM, POTASSIUM AND BORON
These elements are indicators of groundwater salinity and reflect relict seawater influences
either by marine inundation of low-lying areas or saline intrusion of near-coastal aquifers.
Concentrations of Na, K and B are in general greater in the deep groundwater sampled in the
survey, although this is because a large proportion of these were collected from the Barisal
region of southern (coastal) Bangladesh, as well as from the Sylhet region. Figure 9 shows
that, the highest concentrations of Na (like K and B) are mainly found in the south and south-
eastern parts of Bangladesh and in the low-lying haor region of the north-east.
18
10.1.7 HYDROGEOCHEMISTRY OF THREE SPECIAL STUDY AREAS
Chemical data collected for groundwater from the Bangladesh National Hydrochemical
Survey give useful information about the inorganic groundwater quality and the regional
Figure 9: Spatial variation of sodium in the groundwater

19
variations. These parameters are of great potential value in assessing hydrogeochemical
processes in the aquifers and for this reason, three Special Study Areas were chosen from
which more detailed groundwater chemical analysis were carried out. The areas chosen were
headquarter (sadar) upazilas of the Districts of Lakshmipur, Faridpur and Nawabganj (figure
10). The areas were selected as they have recognized arsenic problems and have differing
geological and hydrogeological characteristics.
Figure 10: Sketch map of Bangladesh showing the major river systems and the locations of the three Special Study Areas.
Arsenic concentrations in the three Special Study Areas clearly vary considerably. From the
statistical data (percentage exceedances), the worst-affected of the areas appears to be
Lakshmipur and the least-affected is Chapai Nawabganj. However, the highest absolute

20
concentrations (up to 2400 µg/L) were observed in the localized hot spot of Chapai
Nawabganj. This might go some way to explaining why reported arsenicosis cases have been
more prevalent in Chapai Nawabganj as As doses will have been considerably higher from
chronic use of such high-As drinking water.
11. CONCLUSIONS AND RECOMMENDATIONS
Arsenic contamination threatens water resources and has become an emerging issue in the
nation (Bangladesh). This project utilizes the ESRI’s ArcGIS Geostatistical Analyst to
analyze the spatial distribution patterns of arsenic in groundwater. The maps generated in this
project show an effective way to help investigate and remedy arsenic contamination in
Bangladesh. They provide visual representations of arsenic and other elements distributions
in groundwater and help environmental professionals prioritize their limited budgets for
groundwater cleanup, develop field investigation strategies and design
remedial systems.
The ability to use GIS created data along with data queried from a Microsoft Excel
spreadsheet is beneficial for contamination analysis. The ability of ArcView to display data
queried directly from Excel in a spatial context is extremely valuable.
There are uncertainties and limitations found in this project in using the sample data for the
determination of elemental distributions in groundwater for the study area. First, Most data
used are from wells drilled by private contractors with no requirement or system to record
details of the borehole logs during and/on completion. In addition, details of the government-
drilled wells are not readily available. Hence, no sufficient sample density to give a reliable
national picture of ground water contamination by arsenic. There is need to license drilling of
boreholes by the government and for details of the borehole logs to be logged in a systematic

21
way. This could form a beginning to an aquifer protection policy for the deep aquifers. Some
incentive would probably need to be given to private contractors to make such a notification
scheme work. It would be very useful to always record the lithological variations with depth
(sand, silt, clay, peat etc.) and the color of the sediments (grey, brown etc.). The texture is
obviously important in terms of potential groundwater yield but can also yield valuable
information about the depositional environment. The color is useful since it reflects the
oxidation state (and may be age) of the sediments. For example, a change from grey to
orange-brown may help to identify the Holocene-Pleistocene boundary.
The arsenic concentrations were significantly widely distributed. A larger size of random
samples should be needed if physical and economic constraints are not significant.
Second, arsenic concentrations in the groundwater can be influenced by rock types, soil
(Boyle et al., 1973), and hydrologic condition of the area. Arsenic, once released into the
ground, might undergo some physical, chemical and biological reactions that could possibly
alter concentration distribution (Manning et al., 1997b; Livesey et al., 1981; Matisoff et al.,
1982; 1991; Korte et al., 1991). Human errors and laboratory uncertainties during sampling
and data acquisition are also possible factors for prediction errors. These uncertainties and
limitations should be considered in the assessment of arsenic contamination.

22
REFERENCES:
Acharyya, A.K., Lahiri, S., Raymahashay, B.C. and Bhowmik, A. 2000: “Arsenic toxicity of
groundwater in parts of the Bengal basin in India and Bangladesh: The role of Quaternary
stratigraphy and Holocene fluctuation”. Environmental Geology, v. 39, p. 1127-1137.
Boyle, R.W. and Jonasson, I.R. 1973: “The geochemistry of As and its use as an indicator
element in geochemical prospecting”. Journal of Geochemical Exploration, v. 2, p. 251-296.
Korte, N.E. and Fernando, Q. 1991: “A review of arsenic (III) in groundwater”. Critical
Reviews in Environmental Control, v. 21, p. 1 39.
Livesey, N .T. and Huang, P .M. 1981: “Adsorption of arsenate by soils and its relation to
selected chemical properties and anions”. Soil Science, v. 131, p. 88-94.
Manning, B.A. and Goldberg, S. 1997: “Adsorption and stability of arsenic (III) at the clay
mineral-water interface”. Environmental Science & Technology, v. 31, p. 2005 2011.
Matisoff, G., Khourey, C.J., Hall, J .F., Varnes, A.W. and Strain, W .H. 1982: “The nature
and source of arsenic in northeastern Ohio groundwater”. Ground Water, v. 20, p. 446-456.
Saha, K.C. 1995: “Chronic arsenical dermatoses from tube- well water in West Bengal in
1983-87”. Indian Journal of Dermatology, v. 40, p. 1-12.
Smith, A.H., Lingas E.O. and Rahman, M. 2000: “Contamination of drinking-water by
arsenic in Bangladesh: A public health emergency”. Bulletin of the World Health
Organization, v. 78, p. 1093-1103 (also available from
www.who.int/bulletin/pdf/2000/issue9/bu0751.pdf).
http://www.bgs.ac.uk/arsenic/bphase1/b_intro.htm.
http://www.bgs.ac.uk/arsenic/bangladesh/datadownload.htm

23
ACKNOWLEDGEMENTS
My gratitude goes to Allah who gives me the opportunity of being in existence on the
surface of the earth till this period of time. I thank my able faculty, Dr. Baqer Al-
Ramadan, who has been taken me through ups and downs in knowing how to use
the software (ArcGIS). The data used in this project were produced by the British
Geological Survey and the Department of Public Health Engineering (Bangladesh)
undertaking a project funded by the UK Department for International Development
(DFID). Any views expressed are not necessarily those of DFID. Also, my
appreciation to DFID. Finally, my appreciation to my parents and beloved wife for the
opportunity they give me to have better education outside my home country
(Nigeria).