usda/nopc 2004 individual changes from intervention: how much can we expect? tom baranowski, ph.d....
TRANSCRIPT
USDA/NOPC USDA/NOPC 20042004
Individual Changes from Intervention: How Much Can We
Expect?
Tom Baranowski, Ph.D.Professor of Pediatrics (Behavioral Nutrition)
USDA/ARS - Children’s Nutrition Research CenterBaylor College of Medicine
Houston, TX

USDA/NOPC USDA/NOPC 20042004
Save the Best for Last?
Antagonize the Fewest People Since Most People
Have Already Left?
OR

USDA/NOPC USDA/NOPC 20042004
Effect Sizes
Objectives:
– Review school based interventions
– Provide critique of literature

USDA/NOPC USDA/NOPC 20042004
Inclusionary Criteria
To enhance confidence in estimates:
– School as unit
– Adequate power
To assess interesting possibilities:
– Environment vs. curriculum
– Innovation

USDA/NOPC USDA/NOPC 20042004
Studies Included
Elementary Schools:• CATCH• Eat Well & Keep
Moving• High 5 Alabama• Pathways• Bienestar• Cafeteria Power Plus
Middle Schools:• Planet Health• MSPAN• FV Make the Marks
USDA/NOPC USDA/NOPC 20042004
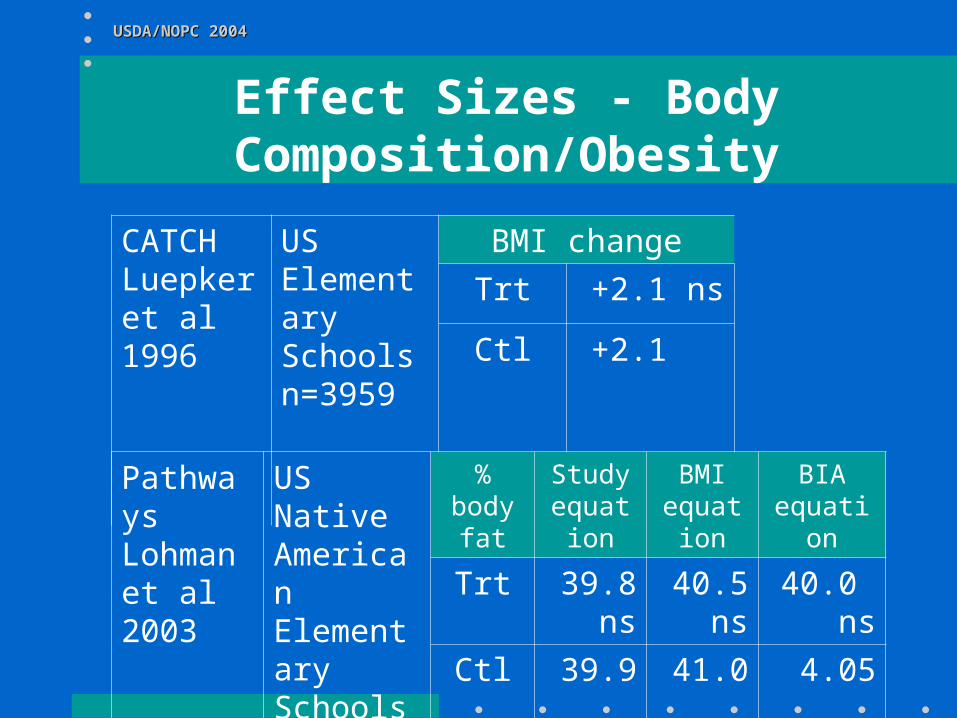
Effect Sizes - Body Composition/Obesity
CATCH Luepker et al 1996
US Elementary Schools n=3959
BMI change
Trt +2.1 ns
Ctl +2.1 ns
Pathways Lohman et al 2003
US Native American Elementary Schools n=1367
% body fat
Study equation
BMI equation
BIA equation
Trt 39.8 ns
40.5ns
40.0 ns
Ctl 39.9 41.0 4.05

USDA/NOPC USDA/NOPC 20042004
Effect Sizes - Body Composition/Obesity
Bienestar Trevino et al 2004
US Elementary Schools n=1221
% body fat - Crude change
Trt -1.10 ns
Ctl -0.71

USDA/NOPC USDA/NOPC 20042004
Effect Sizes - Body Composition/Obesity
Planet Health Gormaker et al, 1999
US Middle Schools n=1295
Girls Boys
Prevalence % Change
Trt -3.3% p=0.03 -1.5% ns
Ctl +2.2% -2.3%
Incidence % Change
Trt +5.5% ns +7.7% ns
Ctl +8.0% +9.6%
Remission % Change
Trt -31.5% p=0.04 -23.7% ns
Ctl -19.1% -26.5%
USDA/NOPC USDA/NOPC 20042004
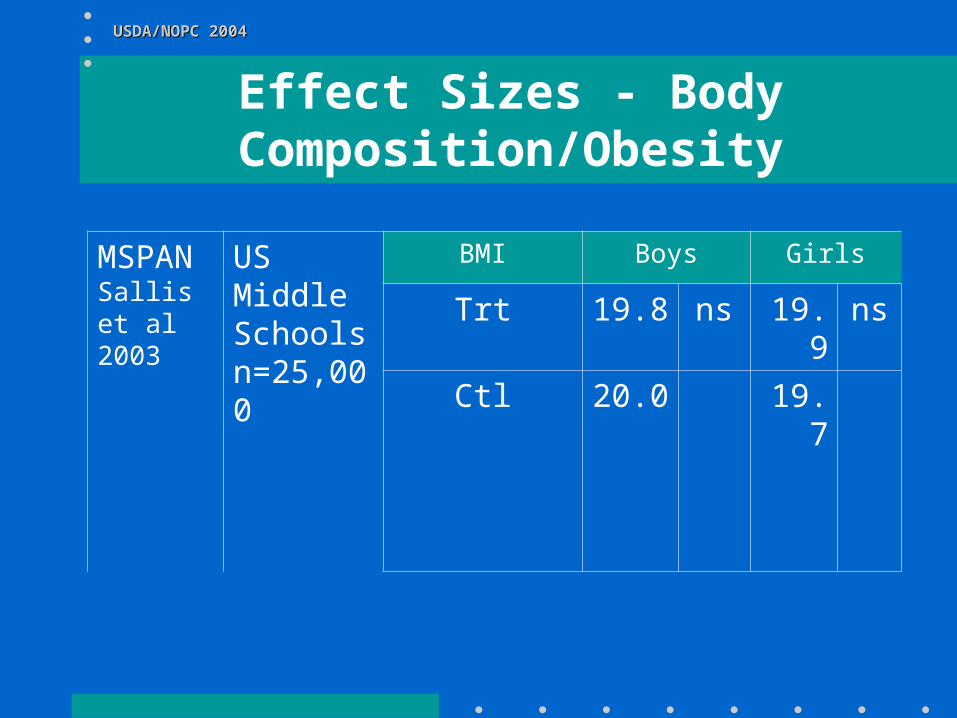
Effect Sizes - Body Composition/Obesity
MSPAN Sallis et al 2003
US Middle Schools n=25,000
BMI Boys Girls
Trt 19.8 ns 19.9 ns
Ctl 20.0 19.7

USDA/NOPC USDA/NOPC 20042004
Effect Sizes - Total Energy Intake
Eat Well & Keep Moving Gortmaker et al 1999
US Elementary Schools n=479
kJ/day adjusted (from 2 24-hdr)
Trt 8473 ns
Ctl 8690
CATCH Luepker et al 1996
US Elementary Schools n=1182
MJ/day change
Trt +0.1 p=0.01
Ctl +0.6

USDA/NOPC USDA/NOPC 20042004
Effect Sizes - Total Energy Intake
High 5 Alabama Reynolds et al 2000
US Elementary Schools n=1698
kcal/day
Follow Up 1 Follow Up 2
Trt 1521 ns 1598 ns
Ctl 1566 1570

USDA/NOPC USDA/NOPC 20042004
Effect Sizes - Total Energy Intake
Pathways Himes et al 2003
US Native American Elementary Schools n=1367
kcal/day at school lunch
Trt -17 ns
Ctl -70kcal/day all day
Ctl - Trt -263 p<0.01kcal/day outside school
Ctl - Trt -195 p<0.01

USDA/NOPC USDA/NOPC 20042004
Effect Sizes - Total Energy Intake
Planet Health Gortmaker et al 1999
US Middle Schools n=1295
J/day Boys Girls
Trt +630 p=0.05 +453 ns
Ctl +886 +701
USDA/NOPC USDA/NOPC 20042004
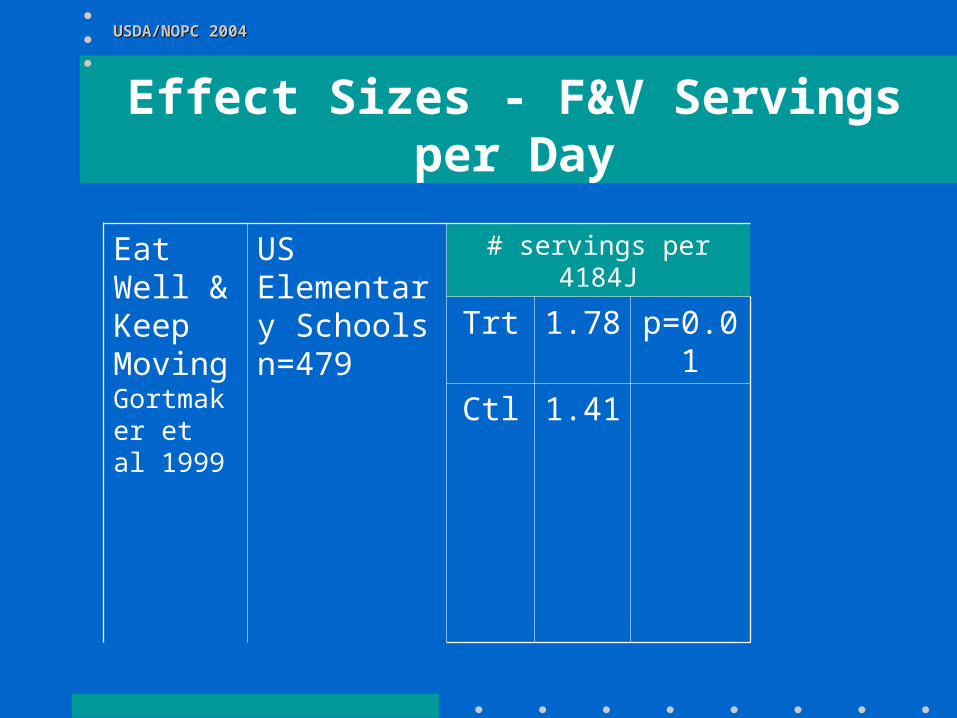
Effect Sizes - F&V Servings per Day
Eat Well & Keep Moving Gortmaker et al 1999
US Elementary Schools n=479
# servings per 4184J
Trt 1.78 p=0.01
Ctl 1.41
USDA/NOPC USDA/NOPC 20042004
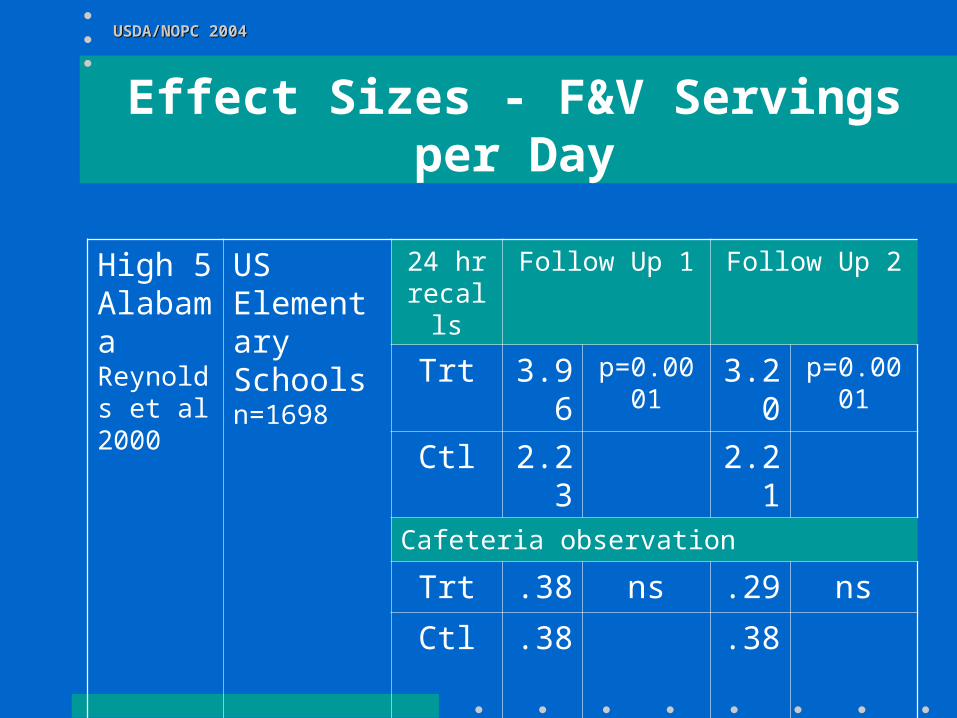
Effect Sizes - F&V Servings per Day
High 5 Alabama Reynolds et al 2000
US Elementary Schools n=1698
24 hr recalls
Follow Up 1 Follow Up 2
Trt 3.96 p=0.0001 3.20 p=0.0001
Ctl 2.23 2.21Cafeteria observation
Trt .38 ns .29 ns
Ctl .38 .38

USDA/NOPC USDA/NOPC 20042004
Effect Sizes - F&V Servings per Day
Cafeteria Power Plus Perry et al 2004
US Elementary Schools n=1168
lunch portions/school day from observation
FV F F, no J
Trt 1.3
ns
0.8
p<0.01
0.4
p<0.00
Ctrl 1.2 0.6
(staff verbal encouragements key)

USDA/NOPC USDA/NOPC 20042004
Effect Sizes - F&V Servings per Day
Planet Health Gortmaker et al 1999
US Middle Schools n=1295
Boys Girls
Trt +0.2 p=0.03 -0.2 ns
Ctl -0.2 -0.5

USDA/NOPC USDA/NOPC 20042004
Effect Sizes - F&V Servings per Day
FV Make the Marks Bere et al in press
Norway Middle Schools n=972
# portions/day FV F
Trt 1 free F 2.4 p=0.06
1.8 p=0.002
Trt 1 encouraged F
2.2 1.5
Ctl 2.0 1.3

USDA/NOPC USDA/NOPC 20042004
Effect Sizes - MVPA
CATCH Luepker et al 1996
US Elementary Schools n=1182
KJ/kg/h from observation of PE
Baseline
4th semester
6th semester
Trt 19.1 21.0
p<0.01
20.8
ns
Ctl 18.6 19.1 19.6

USDA/NOPC USDA/NOPC 20042004
Effect Sizes - MVPA
Eat Well & Keep Moving Gortmaker et al 1999
US Elementary Schools n=479
h/day
Trt +1.21 ns
Ctl +1.36
Pathways Himes et al 2003
US Native American Elementary Schools n=580
Average vector magnitude
24 hr-crude change
Trt +267 ns
Ctl +247(extensive analyses)

USDA/NOPC USDA/NOPC 20042004
Effect Sizes - MVPA
MSPAN Sallis et al 2003
US Middle Schools n=25,000
MV Kcal/day at school change scores
Boys Girls
PE Out of PE PE Out of PE
Trt +18.8 +22.3 p<0.00
+12.3 +6.5 ns
Ctl +11.5 +0.2 +7.4 +4.7
Planet Health Gortmaker et al 1999
US Middle Schools n=1295
H/day Boys Girls
Trt +.011 ns -0.10 ns
Ctl +0.07 -0.03

USDA/NOPC USDA/NOPC 20042004
Effect Sizes - Sedentary Behaviors
Eat Well & Keep Moving Gortmaker et al 1999
US Elementary Schools n=479
TV/Video, h/day
Trt 3.48 p=0.06
Ctl 4.03

USDA/NOPC USDA/NOPC 20042004
Effect Sizes - Sedentary Behaviors
Planet Health Gortmaker et al 1999
US Middle Schools n=1295
TV Watching. h/day-crude changes
Girls Boys
Trt -0.70 p=0.001 -0.70 p=0.003
Ctl -0.11 -0.35
MSPAN Sallis et al 2003
US Middle Schools n=25,000
Sedentary hrs/day
Boys Girls
Trt 4.4 ns 4.6 ns
Ctl 3.9 4.6

USDA/NOPC USDA/NOPC 20042004
Overview of Effect Sizes
• Changes in adiposity and related behaviors have been found– But not always– Sometimes moderated effects
• Changes tend to be small in absolute amounts– But one economic analysis suggests even
small changes can be cost effective

USDA/NOPC USDA/NOPC 20042004
Overview of Effect Sizes
• Desired changes tend to occur in treatment & control groups
– Minimizing differences
• Not sure want decreases in kcal
– But qualitative changes (more likely to get)

USDA/NOPC USDA/NOPC 20042004
Overview of Effect Sizes
• Reported in original units, not in SD units
– Error will vary across studies• Reflected in SD
• Compensation of effects outside of school?

USDA/NOPC USDA/NOPC 20042004
Hard to Compare
• Different interventions• Different measures• Different methods• Controlled for different variables• Reported results in different ways• Logically inconsistent across variables within
studies• Inconsistent findings across studies

USDA/NOPC USDA/NOPC 20042004
Mediating Variable Model (Conceptual)
Intervention Design
Implementation
Mediating Variables
Outcomes
Moderating Variables
Rewards?

USDA/NOPC USDA/NOPC 20042004
(see Baranowski, et al, 2003 Obesity Research)
Mediating Variable Model (2)

USDA/NOPC USDA/NOPC 20042004
Mediating Variable Model (3)
A model for program planning and outcome analysis
School physical education (PE) = curriculum = teacher training
School food service (SFS) = program = staff training
Social marketing campaign = school-based PE and SFS = family based = student based
School supported individualbehavioral change = SBIR = school-based activities = goal setting = goal review = problem solving = decision making = individual tailoring = asking skills
Parent intervention
PE teacher and curriculum = norms for what PE teachers do = self-efficacy to implement curriculum
PE environmental factors
Overall faculty = faculty support of the program and place of health in the school
SFS staff = outcome efficacy = self-efficacy to implement food service changes = norms for school staff
Administration = PE policies = SFS policies
Parents = make items available and accessible at home
SFS environmental factors = reduce NSLP to 700-800 kcal/meal by changing energy density to lower fat and more fiber = improve presentation of healthy foods = increase NSLP participation = change vending to more water = change snack bar to lower kcal (smaller portions, less fat), more FV, more water, less sweetened beverages
Diet and PE child psychosocial factors = preferences = self-efficacy = outcome expectancies = intrinsic motivation = barriers to PE = barriers to school lunch = knowledge of appropriate portion sizes
Home environmental factors = child's perception of availability and accessibility of FV, PA facilities and opportunities
Interventions Teacher/Staff/Parent Mediating VariablesEnvironmental and Psychosocial Mediators
Fruit and vegetable consumption = increase to 5-9 servings/dayDietary fat intake = decrease to 30% kcalBeverage consumption = increase water to 5-8 cups/day = decrease sweetened beverages to no more that one 12-ounce serving/day
Moderate to vigorous physical activity = increase to 3 bouts/week of 25-30 minutes each in school = increase to 3 bouts/week of 25-30 minutes each outside school
Inactivity = decrease TV watching and e-gaimes to 2 hours/day or less
Targeted Behaviors
Figure 1.3.3 Conceptual Model of STOPP-T2D Prevention Intervention

USDA/NOPC USDA/NOPC 20042004
Process Evaluation as Mediators
Design &
Development of
Intervention
Content-Types-Levels
N1 Exposure Initial Use Continued Use-Preference -Type -Type-Extent -Amount -Amount
Implementation-Fidelity-Extent
N2 Exposure Initial Use Continued Use-Preference -Type -Type-Extent -Amount -Amount
Resources -Types-Levels
Nk Exposure Initial Use Continued Use-Preference -Type -Type-Extent -Amount -Amount
Reach-Depth-Spread
BARRIERS
-Type-Diff
(Baranowski T, Stables G. Process Evaluation of the 5-A-Day Projects. Health Education &Behavior 2000, 27:157-166.)

USDA/NOPC USDA/NOPC 20042004
Intervention Implementation
• What are the 5 major contributors to obesity in each age group?– Provide foci for intervention
• How much change is needed to move physiological variables?– Need more controlled research, diet & PA– How much change get when move physical
variables?

USDA/NOPC USDA/NOPC 20042004
Intervention Implementation
• Need for innovation
– Basic research on manipulating moderators
– New procedures• Cameras with statements• Low cost / non curricular• Interactive multimedia games

USDA/NOPC USDA/NOPC 20042004
Intervention Implementation
• Need innovation (continued)– New theories
• Self concept/cognitive dissonance• Theory of planned behavior (EU)• Family influences• Food shopping?
– New locations• Summer day camp
• Gender & age difference in design - especially PA

USDA/NOPC USDA/NOPC 20042004
Implementation Psychosocial Change
• Need to monitor implementation (50%, 22%)
• Need to find ways around classroom teachers
• New PS measures - IRT?

USDA/NOPC USDA/NOPC 20042004
Psychosocial Change Behavior Change
• Need more basic correlates research– Not enough range in normal PS or behavior to
detect relationships?– Random (chaos theory) or determinate?
• Need mediating variables analyses• Need moderating variable analyses
– Gender– SES– Local environment

USDA/NOPC USDA/NOPC 20042004
Behavior Change Psychosocial Change Adiposity Change
• Does BMI discourage PA? When?
• PROP sensitivity predispose to obesity?
• Role of the hormones (leptin, ghrelin) in obesity prevention?
– Mediating vs. moderating effects?

USDA/NOPC USDA/NOPC 20042004
Need a National Discussion
• Role of schools?
• Role of families?
• Role of government?
• Role of child agencies?
– Boy Scouts, YMCA
USDA/NOPC USDA/NOPC 20042004
Thank You for Listening!
Merci Beaucoup!
Muchas Gratias!
Epharisto!
Tack Så Mycket!
Dzienkuje Bardzo!