usc price school of public policy usc …...usc price-schwarzenegger california issues poll february...
TRANSCRIPT

USC PRICE SCHOOL OF PUBLIC POLICY
&
USC SCHWARZENEGGER INSTITUTE OF STATE AND
GLOBAL POLICY
CALIFORNIA ISSUES POLL
in consultation with the California Civic Engagement Project and the USC Price Center for Social Innovation
February 2020
The USC Price-Schwarzenegger California Issues Poll was fielded by YouGov from February 1-15, 2020 in
English and Spanish and is a representative sample of 1,200 likely voters in California. Questions were
designed by USC Price faculty research experts. YouGov is a global public opinion and data company
based in London. YouGov interviewed 1,200 likely California voters (Democrats, Republicans, and no-
party-preference/other). Interviews were administered online via a panel recruited by YouGov, which
used sampling and post-stratification weights so that the 1,200 person sample was representative of
the likely California voter population. The survey was directed by Dr. Christian Grose, Dr. Gary Painter,
Dr. Mindy Romero and Dr. Pamela Clouser McCann of the USC Price School of Public Policy. Results
below may not sum to 100 due to rounding. Margin of error is +/-3.1.

USC Price-Schwarzenegger California Issues Poll February 2020
1
Topline findings:
A. Political Reform and Upcoming Legislative Redistricting: California likely voters favor the California
Citizens Redistricting Commission (CCRC) and rate its process as fair. Voters support federal legislation
for redistricting commissions in all 50 states.
During the Schwarzenegger administration, Governor Schwarzenegger pushed to pass the California
Citizens Redistricting Commission (CCRC). It passed via ballot initiative in 2008 and 2010 and will be used
for the second time in the 2022 redistricting cycle. On February 19-21, 2020, the state’s Applicant
Review Panel meets publicly to finalize the applicant pool to the California Citizens Redistricting
Commission from 19,000 to 120 applicants. In the poll, we randomly assigned voter respondents into a
group that learned details about how the California Citizen Redistricting Commission (CCRC) members
are selected and how they redraw the state’s electoral boundaries; and a group that did not learn any
information about the CCRC. This randomized survey experimental methods is on the cutting edge of
social science and public opinion methods.
When informed about the Applicant Review Panel and the process that the CCRC uses to draw electoral
district lines, California likely voters found the process fair, were less likely to say the process will favor
one party, and were more likely to say the process works well.
1. California likely voters who are informed about California’s method of redrawing election lines think
the system enhances fairness and say that it works well, but those not provided information about the
Commission rate the state’s redistricting method poorly. When asked “How fair is California’s method of
redrawing election district lines?,” only 24.2% of California voters said the state’s redistricting methods
were fair. However, when likely voters were informed about the California Citizens Redistricting
Commission and its selection process, public opinion in favor of the CCRC and its process jumped
dramatically. 65.1% of likely voters who learned about the CCRC process said California’s methods of
drawing lines was fair. This 40 percentage-point difference in perceptions of fairness between those
educated about the CCRC and those that were not informed about it suggests the state of California and
the CCRC need to educate the public about the Commission’s redistricting process in order to enhance
public confidence over the next several months.
These findings about fairness occur across party lines. More than 50% of Republican likely voters, more
than 60% of no-party-preference (NPP) voters, and more than 70% of Democratic likely voters rate the
CCRC redistricting and selection process as fair when told how the process works. Republican likely
voters who are uninformed about it are particularly likely to rate the redistricting process as unfair.
Similar findings exist for other measures of support for California’s redistricting process: 2. California Likely Voters Support a Key Provision of H.R. 1 (the Voting Rights bill passed by the U.S.
House in 2019 currently in the U.S. Senate). A majority of California likely voters favor a bill sponsored
by Congressman Alan Lowenthal (D-Long Beach) to require California’s Citizen Redistricting Commission
process to be used in all fifty states to draw congressional district lines. When asked if they favor “a new
bill in Congress” that “has proposed that an independent redistricting commission – with 5 Democrats, 5
Republicans, and 5 independents” be used to redraw lines, more than 60% of California likely voters
support this bill. Interestingly, voters told about the process of selection for the California Redistricting
Commission were slightly less likely (55.6%) than voters given no information about redistricting (63.1%)
to see the need for federal redistricting reform.

USC Price-Schwarzenegger California Issues Poll February 2020
2
In sum, as California likely voters learn about the California Citizens Redistricting Commission process,
they rate the process as one that is fair and they hope to see this method of redrawing lines in other
states. However, they are somewhat less likely to favor federal laws requiring redistricting commissions
when they learn about California’s CRC.
USC Price-Schwarzenegger California Issues Poll February 2020
3
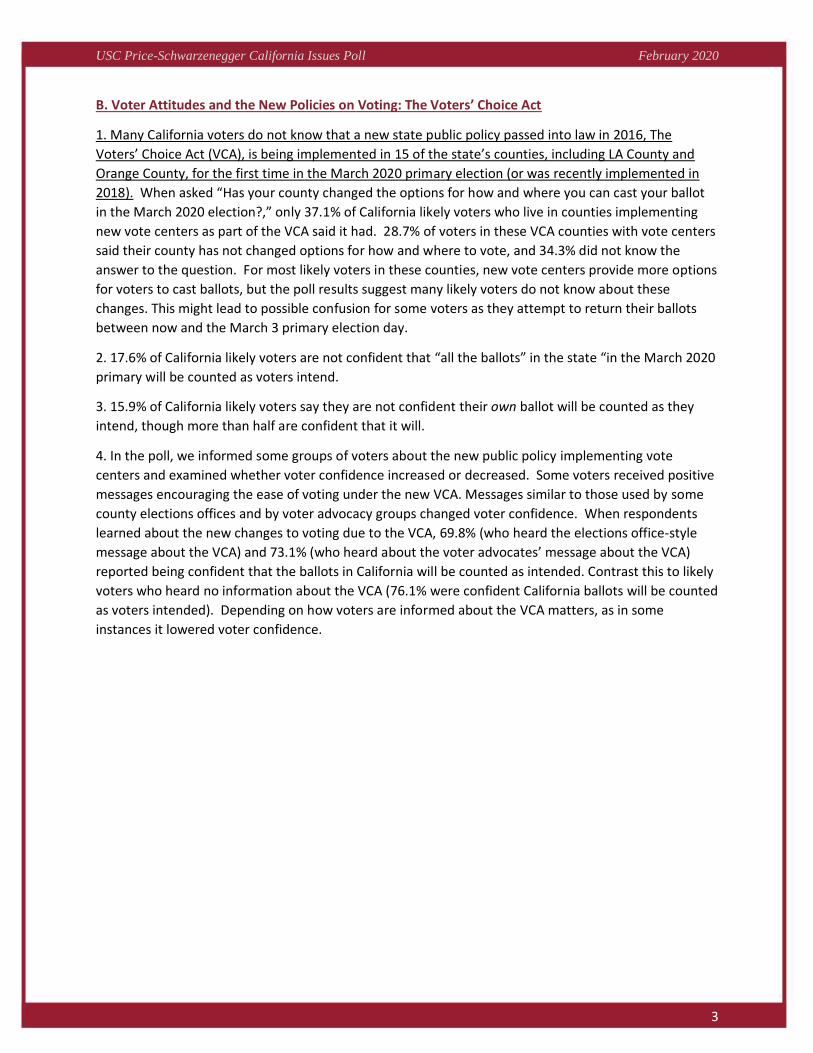
B. Voter Attitudes and the New Policies on Voting: The Voters’ Choice Act
1. Many California voters do not know that a new state public policy passed into law in 2016, The
Voters’ Choice Act (VCA), is being implemented in 15 of the state’s counties, including LA County and
Orange County, for the first time in the March 2020 primary election (or was recently implemented in
2018). When asked “Has your county changed the options for how and where you can cast your ballot
in the March 2020 election?,” only 37.1% of California likely voters who live in counties implementing
new vote centers as part of the VCA said it had. 28.7% of voters in these VCA counties with vote centers
said their county has not changed options for how and where to vote, and 34.3% did not know the
answer to the question. For most likely voters in these counties, new vote centers provide more options
for voters to cast ballots, but the poll results suggest many likely voters do not know about these
changes. This might lead to possible confusion for some voters as they attempt to return their ballots
between now and the March 3 primary election day.
2. 17.6% of California likely voters are not confident that “all the ballots” in the state “in the March 2020
primary will be counted as voters intend.
3. 15.9% of California likely voters say they are not confident their own ballot will be counted as they
intend, though more than half are confident that it will.
4. In the poll, we informed some groups of voters about the new public policy implementing vote
centers and examined whether voter confidence increased or decreased. Some voters received positive
messages encouraging the ease of voting under the new VCA. Messages similar to those used by some
county elections offices and by voter advocacy groups changed voter confidence. When respondents
learned about the new changes to voting due to the VCA, 69.8% (who heard the elections office-style
message about the VCA) and 73.1% (who heard about the voter advocates’ message about the VCA)
reported being confident that the ballots in California will be counted as intended. Contrast this to likely
voters who heard no information about the VCA (76.1% were confident California ballots will be counted
as voters intended). Depending on how voters are informed about the VCA matters, as in some
instances it lowered voter confidence.

USC Price-Schwarzenegger California Issues Poll February 2020
4
C. Policy Attitudes Toward Homelessness Differ when President Trump Takes Policy Stand. A majority
of Californians support the removal of tent encampments from public spaces for people experiencing
homelessness. However, if Donald Trump endorses removal of tent encampments used by people
experiencing homelessness, support for removal of tents drops significantly to below 50%.
1. If Trump weighs in on homelessness policy, the popularity of the policy goes down. 51.6% of California
likely voters favored removing “homeless tent encampments from public spaces.” But when asked if
voters would favor “President Trump” removing “homeless tent encampments from public spaces,”
then support for this policy dropped to 41.1%. Trump has previously claimed that he will have the
federal government intervene in California to remove people in tents from public spaces.
2. California likely voters also are less likely to favor the removal of tents in public spaces housing people
experiencing homelessness if the Department of Housing and Urban Development (HUD) threatens to
remove tents. 51.6% of California voters favored removing tents from public spaces, but this number
dropped to 47.3% if voters were informed that HUD would remove tents with people experiencing
homelessness.

USC Price-Schwarzenegger California Issues Poll February 2020
5
D. California likely voters rate the state’s elected officials much better than federal elected officials;
Newsom versus 2022 rivals; and presidential election matchups.
1. California likely voters rate their state legislature and governor more highly than the U.S. President.
When asked if they approve or disapprove of the following people or institutions, California likely voters
give much higher marks to state elected officials than federal elected officials:
President Donald Trump: 30.4% Approve / 65.3% Disapprove U.S. Congress: 17.2% Approve / 67.8% Disapprove Gov. Gavin Newsom: 49.2% Approve / 35.0% Disapprove California state legislature: 42.1% Approve / 37.8% Disapprove
2. Governor Gavin Newsom leads against a potential 2022 Republican opponent, though Newsom losessome support when going head-to-head against an independent candidate in 2022. When Newsom is paired against two hypothetical candidate matchups in November 2022, when he is up for reelection, he clears more than 50% of the vote against San Diego Mayor Kevin Faulconer, who is a Republican. However, we also asked likely voters if they would vote for Independent Assembly member Chad Mayes over Newsom. While Newsom still wins, he drops below 50% with almost one-third of the state’s voters saying they don’t know who they would choose.
Thinking ahead to the 2022 election for governor in California, who would you vote for in the general election if these were your two choices?
55.7% Gavin Newsom (Democrat), Governor of California 30.1% Kevin Faulconer (Republican), Mayor of San Diego 13.5% Don’t know/skipped
48.0% Gavin Newsom (Democrat), Governor of California 23.4% Chad Mayes (Independent), California State Assembly member 28.6% Don’t know/skipped
3. Donald Trump is likely to lose by a very large margin in November in California. All Democraticopponents easily defeat Donald Trump in head-to-head general election matchups when all Californialikely voters were asked who they would support.
30.4% Donald Trump / 59.9% Joe Biden / 6.2% I would not vote / 3.6% Don’t know/skipped
31.5% Donald Trump / 59.1% Elizabeth Warren / 5.7% I would not vote / 3.7% Don’t know/skipped
31.1% Donald Trump / 61.4% Bernie Sanders / 3.8% I would not vote / 3.7% Don’t know/skipped
30.5% Donald Trump / 56.6% Mike Bloomberg / 7.3% I would not vote / 5.6% Don’t know/skipped
30.8% Donald Trump / 57.2% Pete Buttigieg / 6.4% I would not vote / 5.6% Don’t know/skipped

USC Price-Schwarzenegger California Issues Poll February 2020
6
4. In the California primary, polling shows Sanders, Biden, and Warren ahead of the rest of the field;
followed by Bloomberg and Buttigieg. However, much of this poll was fielded before the Iowa caucus
results were released and before the New Hampshire primary vote.
21.4% Joe Biden 7.7% Mike Bloomberg 5.8% Pete Buttigieg 1.5% Tulsi Gabbard 2.7% Amy Klobuchar 29.2% Bernie Sanders 2.1% Tom Steyer 20.2% Elizabeth Warren 9.4% Someone else/skipped

USC Price-Schwarzenegger California Issues Poll February 2020
7
Survey Instrument – USC Price-Schwarzenegger California Issues Poll
A. Political Reform – California and Its Upcoming Redistricting
In the Price-Schwarzenegger California Issues Poll, California likely voters were surveyed about their
attitudes toward how California conducts its redistricting process. Voters were randomized into one of
three groups before answering the following questions about California’s redistricting practices: Voters
who learn about the CCRC redrawing lines, informed about legislators redrawing lines, or were given no
new information:
One group, called the control group, received no information about how California conducts its
redistricting and was simply asked questions about redistricting. The second group, called the “Voters
told about California Redistricting Commission” group, received information about how the California
Citizens Redistricting Commission selection process and line-drawing process works.2 This group was
then asked the exact same questions as those respondents who received no information. A third group
was given information suggesting that legislators redraw their own lines, and this group of respondents
was called “Voters told legislators conduct redistricting.”3 Again, this group of respondents was also
asked the exact same questions about redistricting and fairness. We did this in order to compare
attitudes among California voters (1) informed about the California Citizens Redistricting Commission
process; (2) told about legislator-drawn methods and; (3) given no information on how California draws
its lines. To understand how the CCRC process influences voters, we compare voters informed about
the CCRC with other voters not informed. When survey respondents are randomized into different
conditions such as this, any difference in responses uncovered is likely due entirely to the information
provided in the survey questions and is unlikely to be explained by other factors.
2 The “voters told about California Redistricting Commission” group were randomly assigned to receive the following information prior to answering questions about redistricting: “As you may know, congressional and state legislative lines are redrawn every 10 years. In 2021, California is required to redraw the electoral lines for its legislators. In most states, legislators choose their own voters by redrawing their own election boundaries. This means elected legislators pick their voters instead of voters choosing their legislators. In California, we use a different process. A panel of citizens are in charge of redrawing legislators’ lines. This independent panel is called the California Citizens Redistricting Commission, and thousands of California citizens have applied for the Commission this past year. The final commissioners are currently being selected. The commission is chosen by the nonpartisan Bureau of Audits in an attempt to remove politics and partisanship from the process. The citizens commission is composed of equal numbers of Democrats and Republicans, and also has commissioners from other parties or who are registered with no party preference. Once the commission of citizens from different political parties is chosen, they will choose which voters are redrawn into legislators’ election boundaries. This means the independent and nonpartisan citizens commission will redraw the lines that will be used for voters to choose their legislators.”
3 The “voters told legislators conduct redistricting” condition told voter respondents in the poll the following
before they answered their questions: “As you may know, congressional and state legislative lines are redrawn
every 10 years. In 2021, California is required to redraw the electoral lines for its legislators. In most states,
legislators choose their own voters by redrawing their own election boundaries. This means elected legislators
pick their voters instead of voters choosing their legislators.“

USC Price-Schwarzenegger California Issues Poll February 2020
8
Below summarizes California likely voters’ responses to questions on political reform and redistricting:
Q. [1/3 of voters were randomly assigned this question] How fair is California’s method of redrawingelection district lines?
24.2% Fair 43.6% Unfair 13.7% Neither fair nor unfair 18.2% Don’t know
Q. [1/3 of voters were randomly assigned to have the ongoing CCRC selection process described] Howfair is California’s method of redrawing election district lines?
65.1% Fair 11.9% Unfair 8.5% Neither fair nor unfair 14.5% Don’t know
Q. [1/3 of voters were randomly assigned to be told legislators often redraw electoral district lines] Howfair is California’s method of redrawing election district lines?
24.7% Fair 25.4% Unfair 11.6% Neither fair nor unfair 38.2% Don’t know
USC Price-Schwarzenegger California Issues Poll February 2020
9
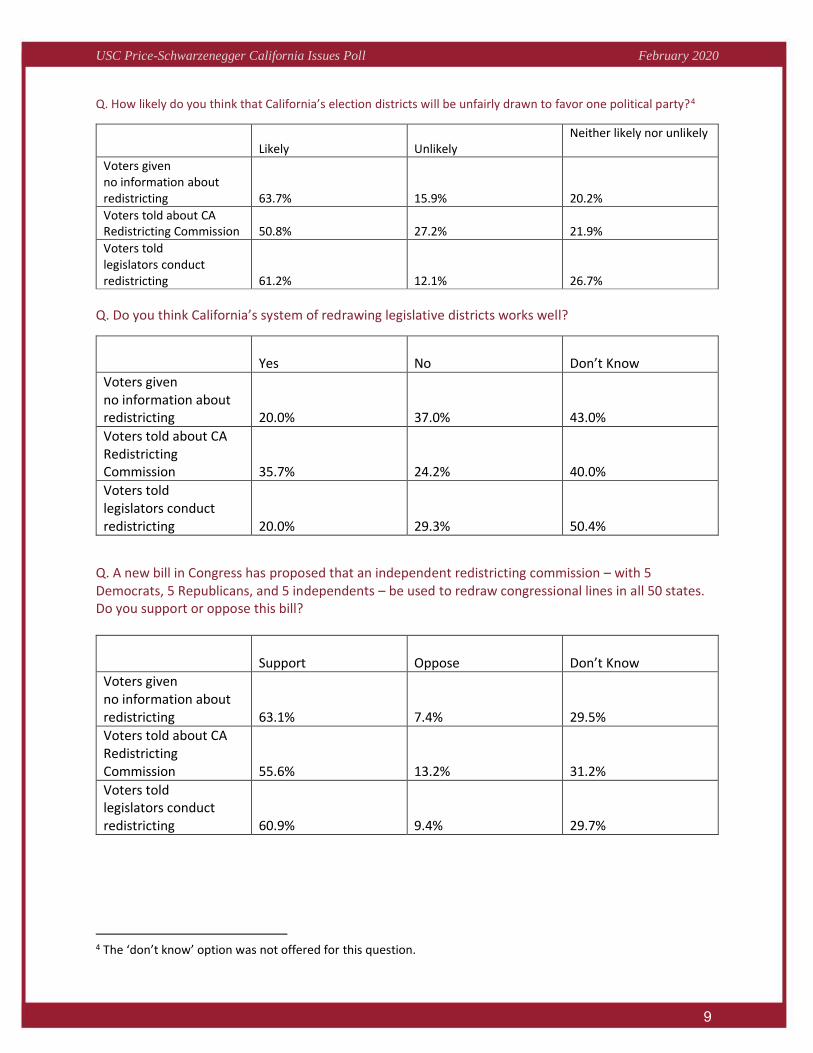
Q. How likely do you think that California’s election districts will be unfairly drawn to favor one political party?4
Likely Unlikely Neither likely nor unlikely
Voters given no information about redistricting 63.7% 15.9% 20.2%
Voters told about CA Redistricting Commission 50.8% 27.2% 21.9%
Voters told legislators conduct redistricting 61.2% 12.1% 26.7%
Q. Do you think California’s system of redrawing legislative districts works well?
Yes No Don’t Know
Voters given no information about redistricting 20.0% 37.0% 43.0%
Voters told about CA Redistricting Commission 35.7% 24.2% 40.0%
Voters told legislators conduct redistricting 20.0% 29.3% 50.4%
Q. A new bill in Congress has proposed that an independent redistricting commission – with 5Democrats, 5 Republicans, and 5 independents – be used to redraw congressional lines in all 50 states.Do you support or oppose this bill?
Support Oppose Don’t Know
Voters given no information about redistricting 63.1% 7.4% 29.5% Voters told about CA Redistricting Commission 55.6% 13.2% 31.2%
Voters told legislators conduct redistricting 60.9% 9.4% 29.7%
4 The ‘don’t know’ option was not offered for this question.
USC Price-Schwarzenegger California Issues Poll February 2020
10
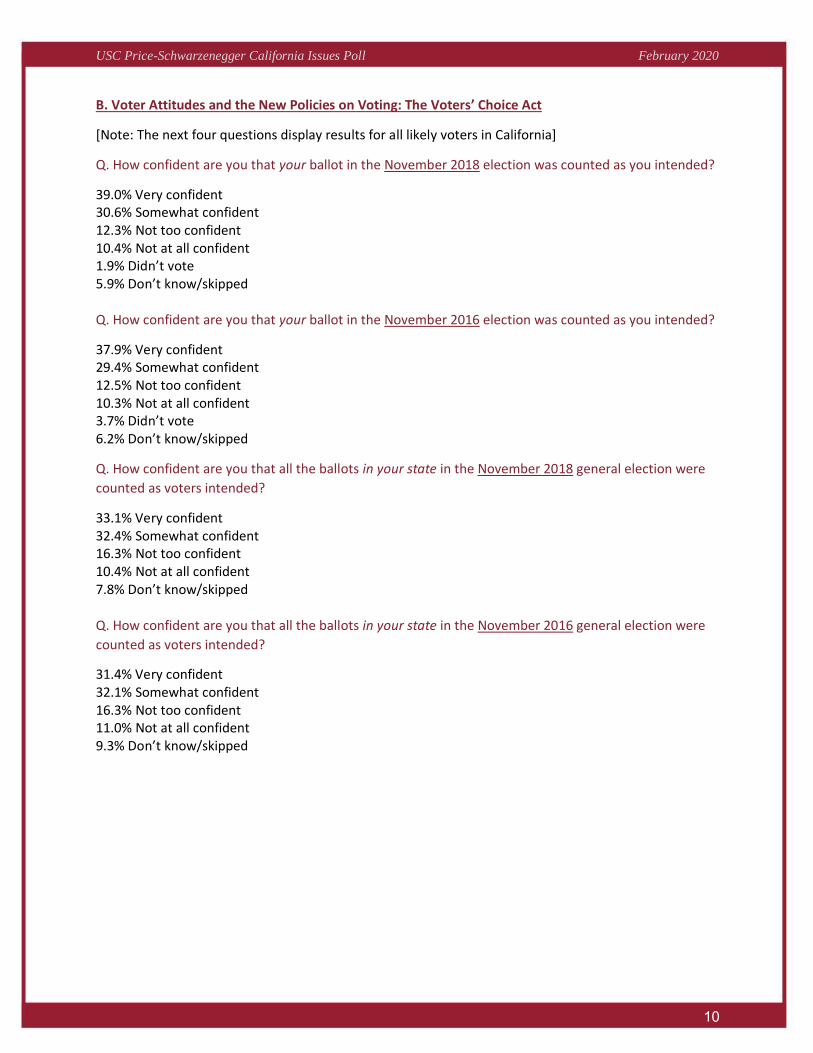
B. Voter Attitudes and the New Policies on Voting: The Voters’ Choice Act
[Note: The next four questions display results for all likely voters in California]
Q. How confident are you that your ballot in the November 2018 election was counted as you intended?
39.0% Very confident 30.6% Somewhat confident 12.3% Not too confident 10.4% Not at all confident 1.9% Didn’t vote 5.9% Don’t know/skipped
Q. How confident are you that your ballot in the November 2016 election was counted as you intended?
37.9% Very confident 29.4% Somewhat confident 12.5% Not too confident 10.3% Not at all confident 3.7% Didn’t vote 6.2% Don’t know/skipped
Q. How confident are you that all the ballots in your state in the November 2018 general election were
counted as voters intended?
33.1% Very confident 32.4% Somewhat confident 16.3% Not too confident 10.4% Not at all confident 7.8% Don’t know/skipped
Q. How confident are you that all the ballots in your state in the November 2016 general election were
counted as voters intended?
31.4% Very confident 32.1% Somewhat confident 16.3% Not too confident 11.0% Not at all confident 9.3% Don’t know/skipped
USC Price-Schwarzenegger California Issues Poll February 2020
11
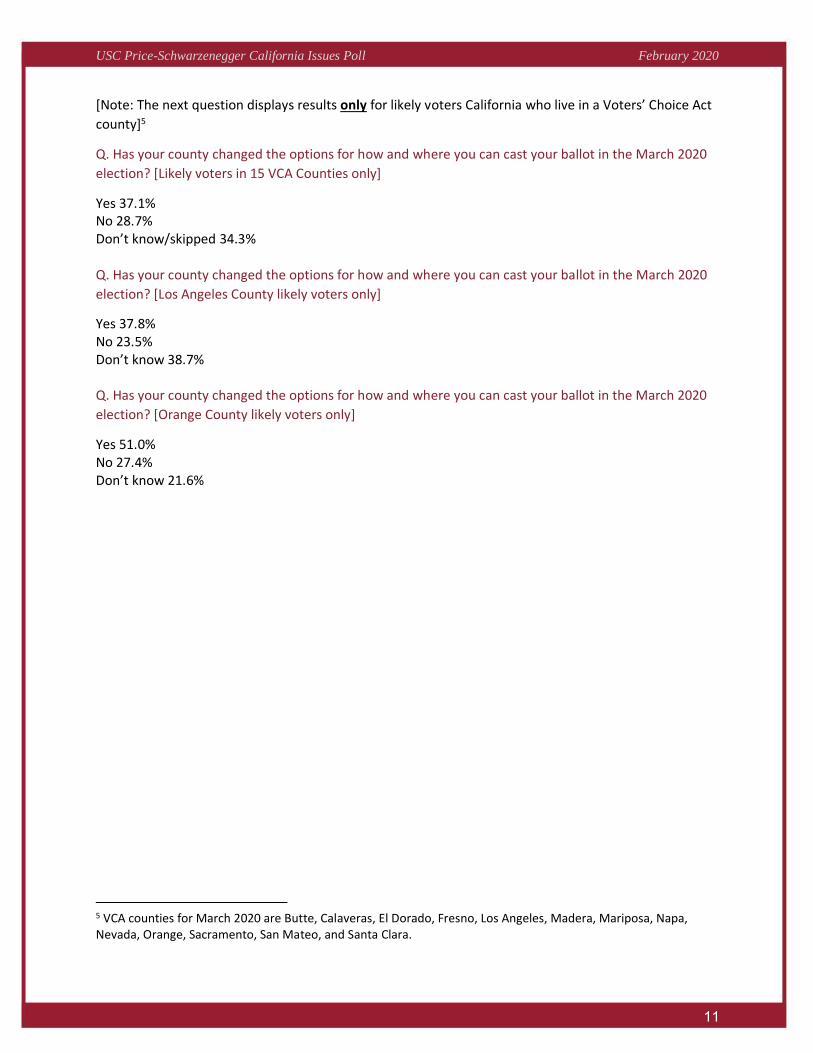
[Note: The next question displays results only for likely voters California who live in a Voters’ Choice Act
county]5
Q. Has your county changed the options for how and where you can cast your ballot in the March 2020
election? [Likely voters in 15 VCA Counties only]
Yes 37.1% No 28.7% Don’t know/skipped 34.3%
Q. Has your county changed the options for how and where you can cast your ballot in the March 2020
election? [Los Angeles County likely voters only]
Yes 37.8% No 23.5% Don’t know 38.7%
Q. Has your county changed the options for how and where you can cast your ballot in the March 2020
election? [Orange County likely voters only]
Yes 51.0% No 27.4% Don’t know 21.6%
5 VCA counties for March 2020 are Butte, Calaveras, El Dorado, Fresno, Los Angeles, Madera, Mariposa, Napa, Nevada, Orange, Sacramento, San Mateo, and Santa Clara.
USC Price-Schwarzenegger California Issues Poll February 2020
12
Before the next set of survey questions, respondents were randomly assigned to read about how voting
is changing in new Voters’ Choice Act counties. In the March 2020 election, in 15 California counties,
including LA County and Orange County, how and where one votes is changing (or recently changed in
2018) due to this new public policy. We wanted to see if messages informing voters about these changes
affected their attitudes about how they would vote and their confidence in the upcoming elections. The
messages were written to be of similar length and content, other than variations required to measure
each condition. This randomized survey experiment means any differences in voter opinions are due to
question wordings and messages, and these types of survey experiments are state of the art in public
opinion research.
Condition 1: County Elections Office/Voting is Changing: The first message, called “County Elections
Office Administrative Message” is similar to that currently used by the California Secretary of State’s
office, Los Angeles County, and other election administrators to inform voters about VCA changes and it
emphasizes changes to voting, including vote centers and that the voting location may change.6 The
purpose of this message is to inform voters about changes; and it is positively valenced. This is randomly
assigned to one-quarter of respondents before answering the next questions.
Condition 2: Voter Advocate Message/Voting is Changing: The second message, called “Voting
Advocates’ Message” was designed in conjunction with voting rights advocates.7 These advocates are
conducting voter outreach and education on the VCA and are interested in learning how the new public
policy can encourage greater civic participation. This message emphasizes the ease of voting under the
VCA, and is positively valenced. This is randomly assigned to one-quarter of respondents to read before
answering the next questions.
Condition 3: Neutral Message: The third message, called “Neutral Informational Message” is designed to
inform about the VCA. It uses similar language to that initially used (before VCA implementation began)
by the California Secretary of State and voter advocacy groups to explain changes to voting under the
new policy, and the tone is neutrally valenced.8 This message is randomly assigned to one-quarter of
respondents to read before answering the next questions.
6 The full “L.A. County” message is as follows: “Voting is changing in your county. Starting in the upcoming 2020 elections, voters now
have the option to cast a ballot in-person at any vote center in the county. Voter centers replace traditional polling places and provide
additional modern features to make voting easy and convenient. Having a single day to vote in-person is now a thing of the past, and
the location where you vote may change. Voters in your county can now vote early and have up to 10 days before Election Day,
including weekends. Voters can also complete and return their ballot by mail or drop it off at a drop box or vote center.”
7 This voters’ advocate message is as follows: “Voting is changing in your county. In 2020, choose the voting option that best suits your busy schedule. You can complete and return your ballot by mail or leave it in a mailbox or voting center. Would you rather vote in person? No problem. You can still. Your polling place may have changed, but you can find a voting center near your work, home, or school. Vote at any polling place in the county starting February 22 and until Election day. You can even vote on a weekend. Don’t wait. Avoid the lines. Vote early.”
8 The neutral message is as follows: “California recently passed The Voter’s Choice Act, a law that gives counties the option of
adopting a new voting system for how you vote in elections. Your county has chosen to adopt the new model. Under the model,
every registered voter can either mail in their completed ballot, or return at an official ballot drop box or a newly established vote
center. At vote centers, which replace traditional polling places, voters can cast their ballots in person, drop off their completed VBM
ballots, as well as receive a range of services. The location where you vote may change, but vote centers are open to voters for up to
ten days prior to Election Day, including weekends, and available for all voters to utilize countywide.”

USC Price-Schwarzenegger California Issues Poll February 2020
13
Condition 4: No message/control group: A fourth group of respondents was randomly assigned to have
no additional information before answering the subsequent questions.
Any differences in respondent attitudes across these four conditions is due to the messaging content in
the conditions.
Below we display the results for respondents’ answers to questions across these four different groups:
Q. By what method do you plan to cast your ballot in the March 2020 election?9
Vote by mailDrop off vote-by-mail ballot at official dropboxDrop off vote-by-mail ballot at polling place or vote centerVote in person at polling place or vote center
Results below are only for respondents in VCA counties:
Vote by mail
Drop off VBM ballot at official dropbox
Drop off VBM at polling place or vote center
Vote in person at polling place or vote center
County elections office msg. 43.8% 9.1% 13.3% 27.2%
Voter advocate msg. 50.6% 10.3% 12.9% 20.9%
Neutral message 45.2% 5.5% 17.1% 27.3%
No information 49.3% 7.1% 9.0% 29.8%
Q. Is this method of voting the same way that you typically vote?Yes / No / Don’t know
Results below are only for respondents in VCA counties:
Yes No Don’t know
County Elections Office msg. 81.4% 12.4% 6.2%
Voter advocate msg. 85.9% 12.7% 1.4%
Neutral message 84.2% 8.9% 6.8%
No information 84.6% 11.1% 4.2%
9 The responses “I am unlikely to vote” and “Don’t know” are not displayed. Since the poll is of likely voters, few answered that they were “unlikely to vote.”

USC Price-Schwarzenegger California Issues Poll February 2020
14
Q. Do you think voters in your state will have problems voting in the March 2020 primary?Yes / No / Don’t know
Results below are only for respondents in VCA counties:
Yes No Don’t know
County Elections Office msg. 20.1% 53.0% 26.9%
Voter advocate msg. 16.1% 70.5% 13.4%
Neutral message 14.1% 67.9% 17.9%
No information 19.2% 57.7% 23.1%
Q. How confident are you that your ballot in the March 2020 general election will be counted as youintend?
Results below are only for respondents in VCA counties:
Confident Not Confident Don’t know
County Elections Office msg. 67.2% 22.5% 8.9%
Voter advocate msg. 77.0% 18.4% 4.5%
Neutral message 75.8% 17.2% 7.0%
No information 78.1% 15.9% 6.0%
Q. How confident are you that all the ballots in your state in the March 2020 primary will be counted asvoters intend?
Confident Not Confident Don’t know
County Elections Office msg. 69.8% 22.1% 8.2%
Voter advocate msg. 73.1% 23.6% 3.3%
Neutral message 68.5% 22.5% 9.0%
No information 76.1% 17.6% 6.3%

USC Price-Schwarzenegger California Issues Poll February 2020
15
Q. All things considered, how do you feel about changes to California’s voting system?10
Positive Negative Neither Pos. nor Neg.
County Elections Office msg. 45.5% 16.5% 26.2%
Voter advocate msg. 55.2% 12.7% 26.2%
Neutral message 38.4% 21.9% 28.8%
No information 47.1% 14.3% 23.5%
10 “Don’t know” responses not displayed.
USC Price-Schwarzenegger California Issues Poll February 2020
16
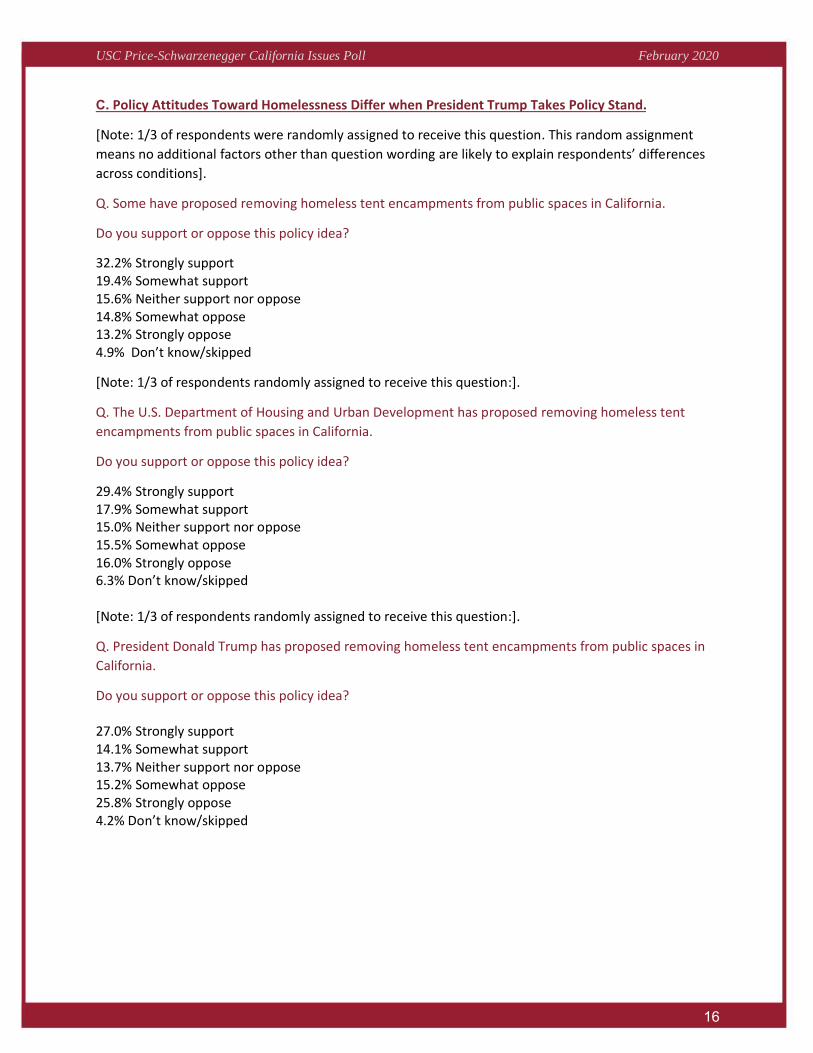
C. Policy Attitudes Toward Homelessness Differ when President Trump Takes Policy Stand.
[Note: 1/3 of respondents were randomly assigned to receive this question. This random assignment
means no additional factors other than question wording are likely to explain respondents’ differences
across conditions].
Q. Some have proposed removing homeless tent encampments from public spaces in California.
Do you support or oppose this policy idea?
32.2% Strongly support 19.4% Somewhat support 15.6% Neither support nor oppose 14.8% Somewhat oppose 13.2% Strongly oppose 4.9% Don’t know/skipped
[Note: 1/3 of respondents randomly assigned to receive this question:].
Q. The U.S. Department of Housing and Urban Development has proposed removing homeless tent
encampments from public spaces in California.
Do you support or oppose this policy idea?
29.4% Strongly support 17.9% Somewhat support 15.0% Neither support nor oppose 15.5% Somewhat oppose 16.0% Strongly oppose 6.3% Don’t know/skipped
[Note: 1/3 of respondents randomly assigned to receive this question:].
Q. President Donald Trump has proposed removing homeless tent encampments from public spaces in
California.
Do you support or oppose this policy idea?
27.0% Strongly support 14.1% Somewhat support 13.7% Neither support nor oppose 15.2% Somewhat oppose 25.8% Strongly oppose 4.2% Don’t know/skipped

USC Price-Schwarzenegger California Issues Poll February 2020
17
D. California likely voters rate the state’s elected officials much better than federal elected officials;
Newsom versus 2022 rivals; and presidential election matchups.
Q. Do you approve or disapprove of the way that Governor Gavin Newsom is handling his job?
49.2% Approve 35.0% Disapprove 15.8% Don’t know/skipped
Q. Do you approve or disapprove of the way that President Donald Trump is handling his job?
30.4% Approve 65.3% Disapprove 4.3% Don’t know/skipped
Q. Do you approve or disapprove of the way the California state legislature is handling its job?
42.1% Approve 37.8% Disapprove 20.0% Don’t know/skipped
Q. Do you approve or disapprove of the way the U.S. Congress is handling its job?
17.2% Approve 67.8% Disapprove 15.0% Don’t know/skipped
[Note: All respondents were asked the next five questions, but the question order was randomized.] Q. If the November Presidential General Election were held today, would you vote for Donald Trump or
Joe Biden?
30.4% Donald Trump 59.9% Joe Biden 6.2% I would not vote 3.6% Don’t know/skipped
Q. If the November Presidential General Election were held today, would you vote for Donald Trump or
Elizabeth Warren?
31.5% Donald Trump 59.1% Elizabeth Warren 5.7% I would not vote 3.7% Don’t know/skipped

USC Price-Schwarzenegger California Issues Poll February 2020
18
Q. If the November Presidential General Election were held today, would you vote for Donald Trump or
Bernie Sanders?
31.1% Donald Trump 61.4% Bernie Sanders 3.8% I would not vote 3.7% Don’t know/skipped
Q. If the November Presidential General Election were held today, would you vote for Donald Trump or
Mike Bloomberg?
30.5% Donald Trump 56.6% Mike Bloomberg 7.3% I would not vote 5.6% Don’t know/skipped
Q. If the November Presidential General Election were held today, would you vote for Donald Trump orPete Buttigieg?
30.8% Donald Trump 57.2% Pete Buttigieg 6.4% I would not vote 5.6% Don’t know/skipped
Q. Which candidate for president do you intend to vote for in the primary? [note: this question asked
only of those answering yes to “Do you intend to vote in the Democratic presidential primary?” and
identifies as a Democrat or registered no-party-preference; many responses to this question were
fielded before NH primary and mostly before Iowa caucus results released]
21.4% Joe Biden 7.7% Mike Bloomberg 5.8% Pete Buttigieg 1.5% Tulsi Gabbard 2.7% Amy Klobuchar 29.2% Bernie Sanders 2.1% Tom Steyer 20.2% Elizabeth Warren 9.4% Someone else/skipped
Q. Thinking ahead to the 2022 election for governor in California, who would you vote for in the generalelection if these were your two choices?
55.7% Gavin Newsom (Democrat), Governor of California 30.1% Kevin Faulconer (Republican), Mayor of San Diego 13.5% Don’t know/skipped

USC Price-Schwarzenegger California Issues Poll February 2020
19
Q. Thinking ahead to the 2022 election for governor in California, who would you vote for in the generalelection if these were your two choices?
48.0% Gavin Newsom (Democrat), Governor of California 23.4% Chad Mayes (Independent), California State Assembly member 28.6% Don’t know/skipped

USC Price-Schwarzenegger California Issues Poll February 2020
20
Schwarzenegger-Price California Issues Poll Team
CHRISTIAN GROSE - [email protected] - 213-740-1683
Christian Grose is Academic Director of the USC Schwarzenegger
Institute for State and Global Policy and Associate Professor of Public
Policy at the University of Southern California. He served as the
Director of the Political Science and International Relations Ph.D.
program from 2015-18.
He is the author of more than 30 articles and chapters about American politics, public policy; and political representation; including in the
American Journal of Political Science and the Journal of Politics. His book Congress in Black and White (Cambridge University Press) won the best book on race and politics award from the American Political Science Association. His research has been funded by the Russell Sage Foundation, the Leonardo DiCaprio Foundation, and the MIT Election Data Science Center. Grose directs USC’s Fair Maps and Political Reform Lab, where researchers, students, and policy practitioners work together to generate new ideas to reform American democracy. He is also an expert in political reforms and voting rights in California, including the top-two primary and the independent redistricting commission.
GARY PAINTER - [email protected] - 213-740-8754
Gary Painter is a Professor in the Sol Price School of Public Policy at the
University of Southern California. He also serves as the Director of the
Sol Price Center for Social Innovation and the Homelessness Policy
Research Institute. He recently published a co-authored book entitled,
“Payment by Results and Social Impact Bonds: Outcome-based
Payment Systems in the UK and US.” He has published numerous
articles in top journals such as the Review of Economics and Statistics,
Journal of Urban Economics, Urban Studies, Journal of Human
Resources, Journal of Policy Analysis and Management, Real Estate Economics, Journal of Real
Estate Finance and Economics, and Regional Science and Urban Economics.
Professor Painter is a leading figure in the field of social innovation. In addition to his recent book,
he works extensively with a variety of social innovation organizations and collective impact
networks to address some of the grand challenges that society faces. His current research focuses
on how to activate the social innovation process. Professor Painter also has extensive expertise in
housing, urban economics, and education policy, which shapes his research on how the social
innovation process can identify new models of social change within these complex policy areas.
He has served as a consultant for the National Association of Realtors, Pacific Economics Group,
Andrew Davidson Co., Fannie Mae, Grant Thorton LLP, Burr Consulting, and the Research Institute
for Housing America.

USC Price-Schwarzenegger California Issues Poll February 2020
21
MINDY ROMERO - [email protected]
Mindy Romero is a Research Assistant Professor and the founder and director of the California Civic Engagement Project (CCEP) at the University of Southern California’s Sol Price School of Public Policy in Sacramento. Romero is a political sociologist and holds a Ph.D. in Sociology from the University of California, Davis. Her research focuses on political behavior and race/ethnicity, and seeks to explain patterns of voting and political underrepresentation, particularly among youth and communities of color in California and the U.S.
Romero has been invited to speak about civic engagement and political rights in numerous venues, testifying before the National Commission on Voting Rights and the California Legislature, among others. Her research has been cited in major news outlets, including The New York Times, Washington Post, Los Angeles Times, Sacramento Bee, Politico and the Huffington Post. She has also been a frequent guest on National Public Radio, Capital Public Radio, and several other NPR-affiliated stations in California. She is a regular op-ed contributor to the Sacramento Bee.
Romero works with a wide array of policymakers, elected officials, voter education groups and community advocates to strengthen political participation and representation. She is currently a member of the Public Policy Institute Statewide Survey Advisory Committee, President of the Board of California Common Cause, and former Vice-Chair of the Social Services Commission for the City of Davis.
PAMELA MCCANN - [email protected] - 213-740-6841
Pamela McCann, Ph.D., is an associate professor at the USC Sol Price School of Public Policy. Dr. McCann previously served as an assistant professor of public affairs at the University of Washington.
Her research interests include U.S. political institutions, bureaucratic delegation, federalism, intergovernmental politics, legislative behavior, public policy, health policy, policy diffusion, state and local politics. She examines the influence of the states and state-level political
institutions on national political maneuvering and policy choices. In particular, Dr. McCann focuses on the influence of policy actors’ intergovernmental context on legislative choices. Her recent work addresses the impact of the interaction of state and national political institutions on political choices and policy outcomes.
Dr. McCann received her Ph.D. from the University of Michigan, where she received the Gerald R. Ford Fellowship (2010-2011) and the Rackham Pre-Doctoral Fellowship (2009-2010). She also earned the Ruth L. Kirschstein National Research Service Award (2008-2009; 2004-2005), and named National Science Foundation IDEAS IGERT fellow (2006-2008).