usa experiences & challenges with medical devices · 2019-09-10 · 2013 top 10 largest global...
TRANSCRIPT

USA Experiences & Challenges with Medical Devices
Third Supplementary Health Forum
October 5, 2017
Carmella Bocchino, Senior Advisor
America’s Health Insurance Plans (AHIP)
1

America’s Health Insurance Plans (AHIP) is the national association
whose members provide coverage and health-related services that
improve and protect the health and financial security of consumers,
families, businesses, communities and the nation.
Who We Are
2

America’s Health Insurance Plans and its members create and
accelerate positive change and innovation across the health care
system for consumers through market-based solutions and
public-private partnerships that advance affordability, value,
access and well-being.
Our Mission
3
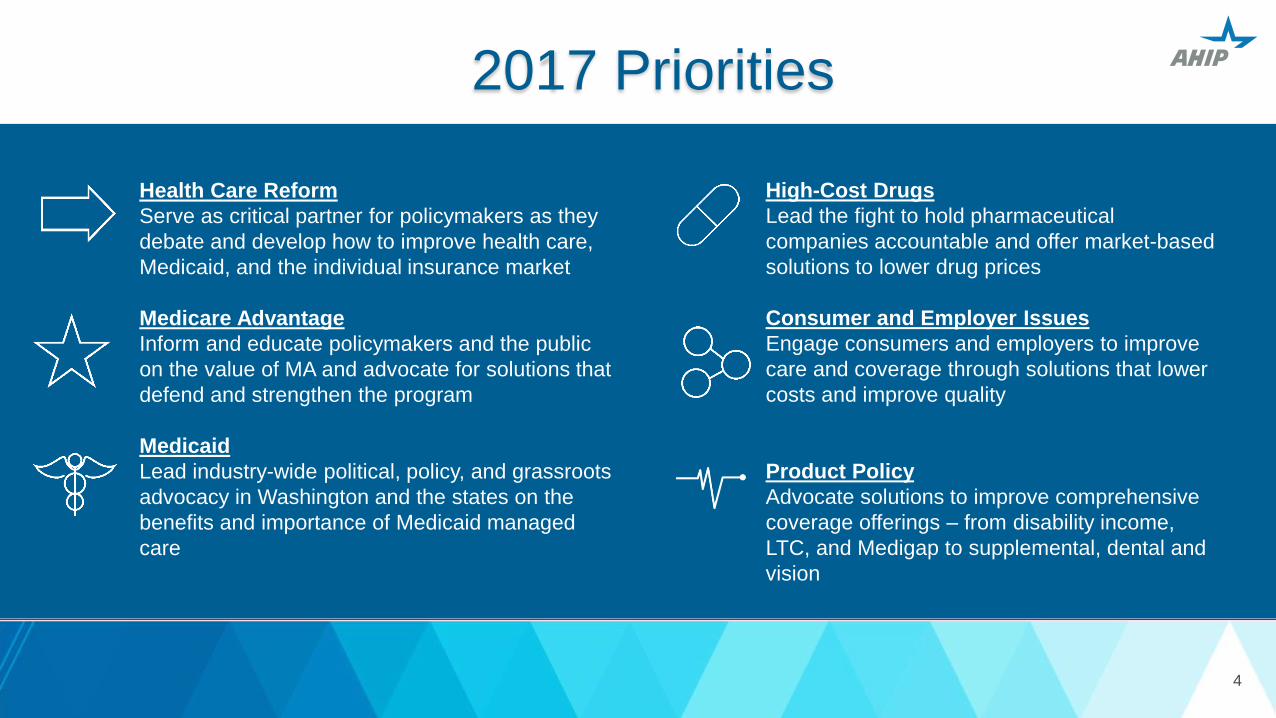
Health Care Reform
Serve as critical partner for policymakers as they
debate and develop how to improve health care,
Medicaid, and the individual insurance market
Medicare Advantage
Inform and educate policymakers and the public
on the value of MA and advocate for solutions that
defend and strengthen the program
Medicaid
Lead industry-wide political, policy, and grassroots
advocacy in Washington and the states on the
benefits and importance of Medicaid managed
care
High-Cost Drugs
Lead the fight to hold pharmaceutical
companies accountable and offer market-based
solutions to lower drug prices
Consumer and Employer Issues
Engage consumers and employers to improve
care and coverage through solutions that lower
costs and improve quality
Product Policy
Advocate solutions to improve comprehensive
coverage offerings – from disability income,
LTC, and Medigap to supplemental, dental and
vision
2017 Priorities
4

We will shape and drive market-based solutions and public policy
strategies to improve health, affordability and financial security by:
Promoting consumer
choice and market
competition
Simplifying the health care
experience for individuals
and families
Supporting constructive
partnerships with all
levels of government
Partnering with health care
providers on the journey from
volume to value
Addressing the burden of
chronic disease and social
factors that impact health
Pursuing the promise of
clinical innovations while
ensuring value
Harnessing data and technology
to drive quality, efficiency and
consumer satisfaction
AHIP’s Vision
5

6.6% 8.5%
9.6% 8.5%
7.3% 6.8%
6.5% 6.5% 4.6% 3.9% 4.0% 3.9% 3.8% 2.9%
5.3% 7.0%
4.9% 5.4%
5.5% 6.2%
6.3%
6.3%
6.2%
6.1%
6.0%
$0,0
$1,0
$2,0
$3,0
$4,0
$5,0
$6,0
NATIONAL HEALTH EXPENDITURES
U.S. healthcare spending now exceeds $3 trillion per year, with growth rates projected to accelerate through 2024
Source: Centers for Medicare and Medicaid Services (CMS) “NHE Tables” and “Historical and Projections 1960-2024”
National Health Expenditures and Annual Growth Rates Actuals 2000-2014, Projections 2015-2024
Actuals Projections
Nat
ion
al H
eal
th E
xpen
dit
ure
($ T
rilli
on
s)
6

Healthcare Spending in the U.S.
7 Source: National Health Expenditures: https://www.cms.gov/research-statistics-data-and-systems/statistics-trends-and-
reports/nationalhealthexpenddata/nationalhealthaccountshistorical.html

United States
Denmark
Canada
Germany
Australia
United
Kingdom
Japan
Healt
h E
xp
en
dit
ure
s a
s a
Perc
en
tag
e o
f G
DP
Life Expectancy (Age)
Health Expenditures as % of GDP vs. Life Expectancy U.S. vs. Selected Advanced Economies
France Netherlands
COMPARATIVE VIEW
The U.S. continues to be an outlier in healthcare spending as a percent of GDP, without commensurate returns on key measures of health system performance
Source: Organisation for Economic Co-operation and Development (OECD) iLibrary Health Statistics (2014) 8

9 AHIP Long-Range Strategic Planning | Environmental Assessment | June 2016
GLOBAL
The U.S. is by far the largest commercial health insurance market in the world, but other markets
are becoming more attractive as their financing systems and marketplaces evolve
$2,872
$511 $505
$411
$319
$230 $217 $198 $188 $142
$962
$18 $13 $38 $42 $6
$45 $25 $2 $12
USA China Japan Germany France United Kingdom Brazil Canada Italy AustraliaTotal Healthcare Market Private Insurance Market
Total Healthcare Market and Private Insurance Market ($B) by Country 2013 Top 10 Largest Global Insurance Markets1
Sources: 1. EIU Data Services (2013) 2. Daedal Research Global Health Insurance Market: Trends and Opportunities
*Note: Top player revenue may include some life insurance revenue
Market Distribution – Top Players vs. All Others (2013)1,2
Global Private Insurance Market
$1.24T
Top 6 Players by Revenue*
$643B (51%)
All Other Players $597B (49%)

INSURANCE COVERAGE
288 million Americans had health coverage in 2015, a 6% gain over 2013, with employer-sponsored heath benefits still the largest source of coverage
Estimated Total Population with Health Coverage Calculated in January, 2011-2015
Sources of Coverage 2015
Source: Health Leaders InterStudy, with U.S. Census “Coverage Rates by Type of Insurance: 2013 and 2014” 10
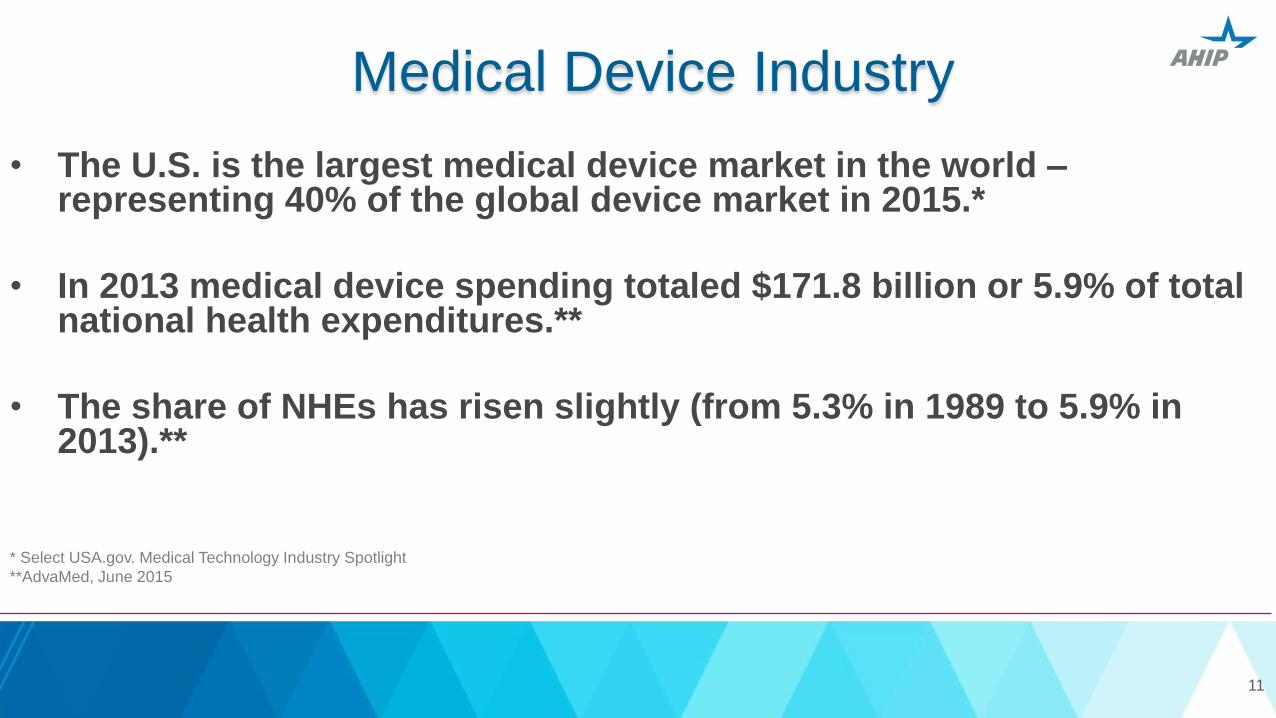
Medical Device Industry
11
• The U.S. is the largest medical device market in the world – representing 40% of the global device market in 2015.*
• In 2013 medical device spending totaled $171.8 billion or 5.9% of total national health expenditures.**
• The share of NHEs has risen slightly (from 5.3% in 1989 to 5.9% in 2013).**
* Select USA.gov. Medical Technology Industry Spotlight
**AdvaMed, June 2015

Medical Device Spending vs. NHE
AdvaMed, June 2015 12

MEDICAL TECHNOLOGY
The Medical Technology (Medtech) industry is projected to grow at a CAGR of 5.0% between 2013 and 2020 on account of increasing adaptability of technologies for medical devices
CAGR % Growth of Medical Technology Industry Segments 2013-2020
Source: Evaluate Medtech, World Preview 2014, Outlook to 2020 13

T A B L E
7–1 The 10 largest medical device companies, 2015
Global medical device revenue
Note: Some companies shown in this table, such as Johnson & Johnson, generate substantial revenues in industries other than medical devices; the figures for these
companies are for their medical device divisions only. Figures for Medtronic and Becton Dickinson reflect their acquisitions of Covidien and CareFusion,
respectively. Since its acquisition of Covidien, Medtronic has been headquartered in Ireland for tax purposes.
Source: Medical Product Outsourcing 2015; MedPAC Report to the Congress: Medicare and the Health Care Delivery System June 2017
Rank Company Country (in billions)
1 Medtronic United States $27.7
2 Johnson & Johnson United States 27.5
3 GE Healthcare United States 18.3
4 Baxter International United States 16.7
5 Siemens Healthcare Germany 15.8
6 Becton Dickinson United States 12.3
7 Philips Healthcare Netherlands 11.2
8 Cardinal Health United States 11.0
9 Abbott Labs United States 10.1
10 Stryker United States 9.7
14

FDA oversight: safety and effectiveness
• Premarket Requirements • Risk-based approval/oversight process
• Low risk devices (Class I) – no FDA review before marketing;
registration only
• Moderate risk devices (Class II) – Premarket notification before
marketing (510K) • Demonstration that “substantially equivalent” to device already on market
• High risk devices (Class III) – Premarket approval (PMA) before
marketing • Clinical data providing reasonable assurance of safety and effectiveness
15

T A B L E
7–2
Category Level of r isk to patient Examples
FDA classification and review of medical devices
Type of review before device can be marketed
Class I Low • Elastic bandages
• Examination gloves
• Handheld surgical instruments
Most devices required only to register;
a small share must submit a 510(k) notification.
Class II Moderate • Powered wheelchairs
• Infusion pumps
• Surgical drapes
Most devices must submit a 510(k) notification;
a small share of devices are required only to register.
Class III High • Heart valves
• Silicone breast implants
• Implanted cerebella stimulators
Devices must submit a PMA application;
in the past, a significant number of devices were able to
submit a 510(k) notification.
Note: FDA (Food and Drug Administration), PMA (premarket approval).
Source: Johnson 2016.
MedPAC Report to the Congress: Medicare and the HealthCare Delivery System June 2017
16

FDA oversight: safety and effectiveness
• Postmarket Surveillance
• Adverse Event Reporting • Hospitals and facilities required to report adverse events
• Postmarket Surveillance Studies • FDA can require studies as part of monitoring
• Unique Device Identifiers • Phased-in adoption to be completed by 2020
17

Main Drivers for Change
18
• Change delivery model from silos to care continuum
• Payment based on value (quality, safety and cost) not volume
• Current health care spending growth not sustainable
• Lackluster quality; improvement slow
• Consumer “skin in the game”
• Provider openness / readiness

Private Market Trends in Promoting Value
• Use of medical management review
• Demonstrating value -- positive results in quality outcomes
and cost savings
• Commitment and growth of delivery and payment reform
based on value
19

Medical Management: Promote Access to Safe,
Appropriate and Cost-Effective Care
• Significant gaps in evidence-based practice and actual care delivered
• Wide variation in provider performance and little/no correlation between spending and health care quality
• Safety concerns persist; especially for new therapies without a track record
• Therapies prone to overuse
• Treatments only effective for specific populations/conditions, often used more generally
• Significant amount of “low-value” care – services with little/no clinical benefit; risk of harm outweighs potential benefit
20

Medical Management • Adoption of medical management tools, such as medical necessity
reviews, formulary and provider tiered network designs, to improve care
and reduce costs for patients.
• Medical management tools help ensure care is consistent with
evidence-based practices.
• The value of medical management has been recognized in
numerous federal and state government-sponsored programs like
Medicare.
• It is critically important that policy makers recognize the importance of
these tools and their effectiveness in addressing long-standing
challenges to safe and affordable evidence-based health care.
21

Demonstrating Value
• How is value defined?
• Value = Quality +Delivery + Experience
Cost
22

Weaknesses of Fee for Service Payment
Excessive use of low-value services
Insufficient incentives to
improve quality of care
Poor coordination of care
23
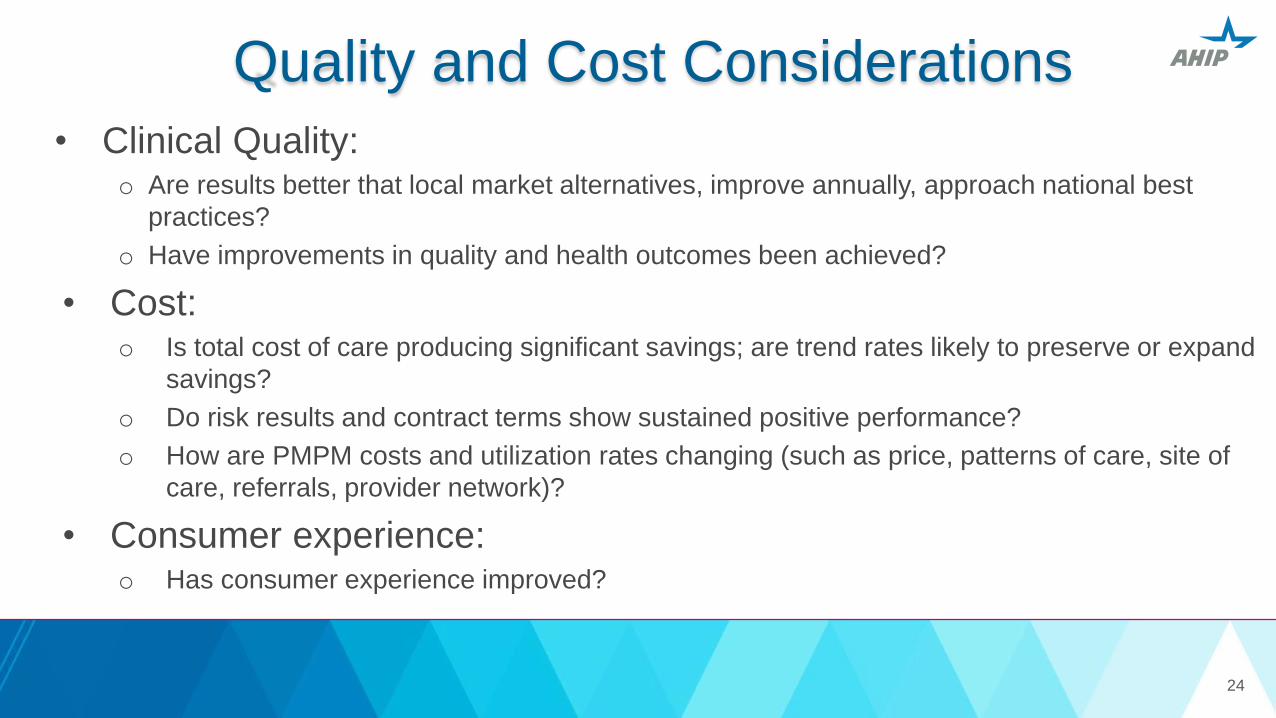
Quality and Cost Considerations
• Clinical Quality: o Are results better that local market alternatives, improve annually, approach national best
practices?
o Have improvements in quality and health outcomes been achieved?
• Cost: o Is total cost of care producing significant savings; are trend rates likely to preserve or expand
savings?
o Do risk results and contract terms show sustained positive performance?
o How are PMPM costs and utilization rates changing (such as price, patterns of care, site of
care, referrals, provider network)?
• Consumer experience: o Has consumer experience improved?
24
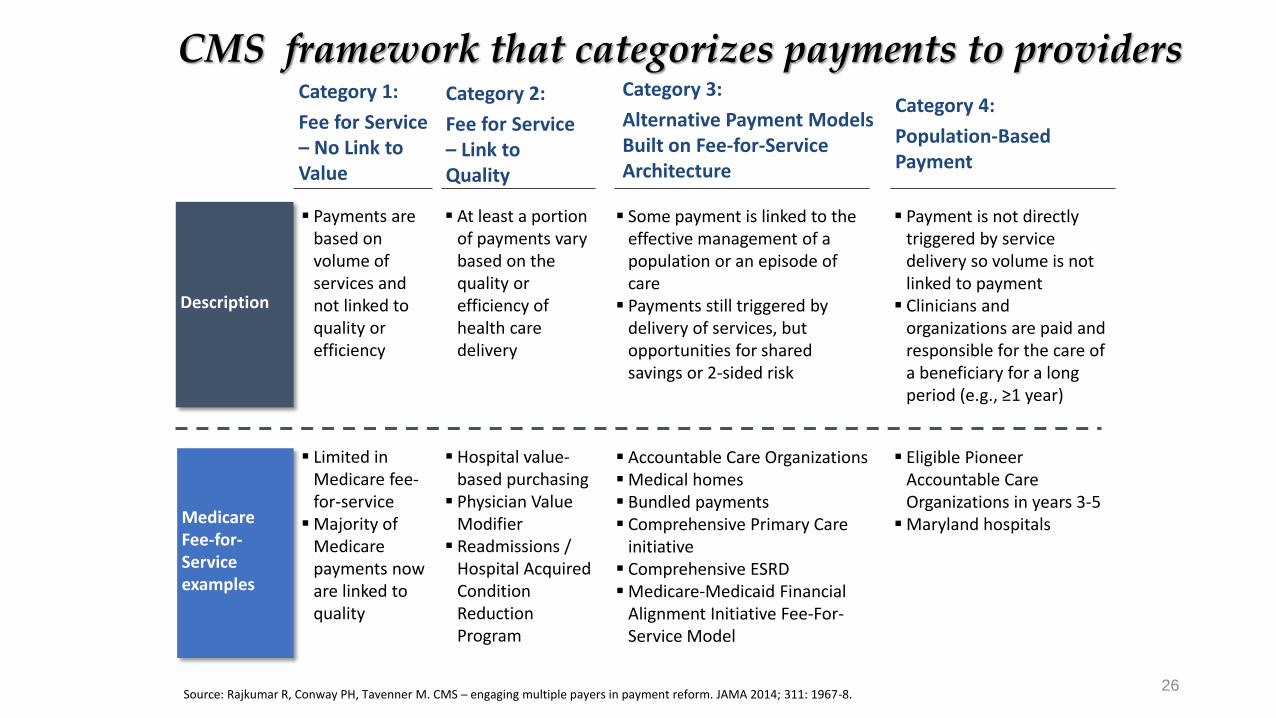
CMS framework that categorizes payments to providers
Description
Medicare Fee-for-Service examples
Payments are based on volume of services and not linked to quality or efficiency
Category 1:
Fee for Service – No Link to Value
Category 2:
Fee for Service – Link to Quality
Category 3:
Alternative Payment Models Built on Fee-for-Service Architecture
Category 4:
Population-Based Payment
At least a portion of payments vary based on the quality or efficiency of health care delivery
Some payment is linked to the effective management of a population or an episode of care
Payments still triggered by delivery of services, but opportunities for shared savings or 2-sided risk
Payment is not directly triggered by service delivery so volume is not linked to payment
Clinicians and organizations are paid and responsible for the care of a beneficiary for a long period (e.g., ≥1 year)
Limited in Medicare fee-for-service
Majority of Medicare payments now are linked to quality
Hospital value-based purchasing
Physician Value Modifier
Readmissions / Hospital Acquired Condition Reduction Program
Accountable Care Organizations Medical homes Bundled payments Comprehensive Primary Care
initiative Comprehensive ESRD Medicare-Medicaid Financial
Alignment Initiative Fee-For-Service Model
Eligible Pioneer Accountable Care Organizations in years 3-5
Maryland hospitals
Source: Rajkumar R, Conway PH, Tavenner M. CMS ─ engaging multiple payers in payment reform. JAMA 2014; 311: 1967-8. 26

Source: Authors' analysis of Leavitt Partners ACO Database
Growth of ACOs
27 Source: Muhlestein D, Sauders R, and McClellan M. Health Affairs. Growth of ACOs and Alternative Payment Models in 2017, June 28, 2017

Payment Reform Is Based on Shared Goals • Shared commitment to move away
from fee-for-service to shared-risk
• Increased focus on patient
outcomes, experience and
coordination of care
• Increased focus on reducing the
need for, and therefore the impact of,
high-cost services
• Value-based approaches are
increasingly customized to the
provider
28

Source: https://revcycleintelligence.com/news/how-alternative-payment-models-decrease-cancer-care-costs
Source: https://www.cms.gov/Newsroom/MediaReleaseDatabase/Fact-sheets/2016-Fact-sheets-items/2016-08-25.html
Collaboration and Analytics Are Key to Success
29
Operational Factors Technical Factors
• Leadership commitment
• Long-term relationship
• Appropriate patient panel size
• Clinical integration/network
adequacy
• Clinician acceptance of new
payment arrangements
• Data (e.g., claims history,
claims extract, hospital/ER
census)
• Analytic reports (predictive,
early identification of patients
at risk)
• Care management/Care
transition
• Consultative support

Bundled Payments/Episodes
• Combines care delivery, financing and engagement for entire
care cycle
• Features: o Defined care pathways
o Dedicated care coordinators and decision support
o Clear pricing linked to risk
o Incentives for appropriate use, appropriate site of care and outcomes
• Specialty bundles: o Comprehensive care for joint replacement, Bundled Payment for Care Improvement, ACE
initiative (orthopedic and cardiac conditions), heart bypass (CABG), and oncology and ESRD
bundles
30
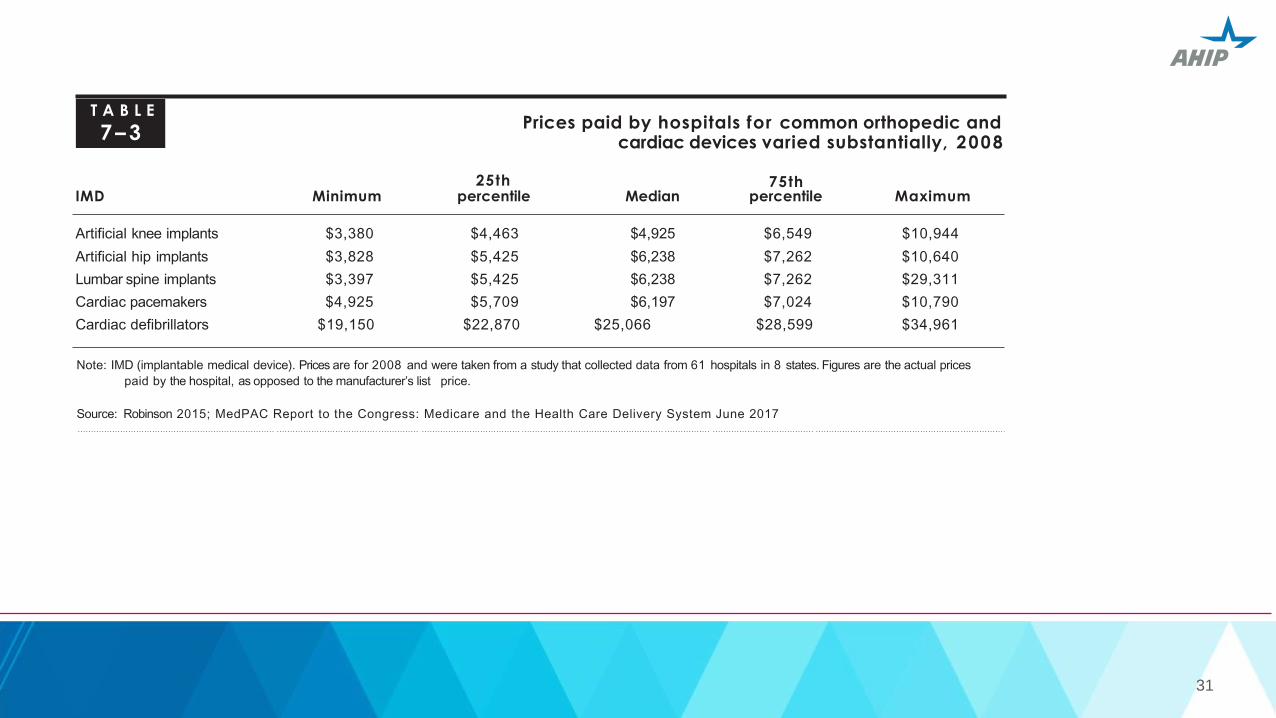
T A B L E
7–3
25th
Prices paid by hospitals for common orthopedic and cardiac devices varied substantially, 2008
75th IMD Minimum percentile Median percentile Maximum
Artificial knee implants $3,380 $4,463 $4,925 $6,549 $10,944
Artificial hip implants $3,828 $5,425 $6,238 $7,262 $10,640
Lumbar spine implants $3,397 $5,425 $6,238 $7,262 $29,311
Cardiac pacemakers $4,925 $5,709 $6,197 $7,024 $10,790
Cardiac defibrillators $19,150 $22,870 $25,066 $28,599 $34,961
Note: IMD (implantable medical device). Prices are for 2008 and were taken from a study that collected data from 61 hospitals in 8 states. Figures are the actual prices
paid by the hospital, as opposed to the manufacturer’s list price.
Source: Robinson 2015; MedPAC Report to the Congress: Medicare and the Health Care Delivery System June 2017
31

Source: https://revcycleintelligence.com/news/how-alternative-payment-models-decrease-cancer-care-costs
Source: https://www.cms.gov/Newsroom/MediaReleaseDatabase/Fact-sheets/2016-Fact-sheets-items/2016-08-25.html
New Models Deliver Better Outcomes, Satisfaction, Costs
32
Patient-Centered Medical
Home
Accountable Care
Models Episode/Bundled Payment
• Emergency department use
reduced 48-68%
• Hospital admissions reduced
34-51%
• Average hospital length of
stay reduced 21-44%
• End-of-life care improved as
length of time in hospice
increased 34%
• Pioneer ACOs generated
more than $37M in savings in
2015
• Pioneer ACOs increased
mean quality score to
92.26% in 2015; average
quality score increased 21%
since 2011
• Of the 12 Pioneer ACOs, 9
had overall quality scores
above 90% in 2015
• Inpatient days decreased by
17%
• Emergency department visits
decreased by 30%
• Oncology models flatten out
Rx spending after a 15-18%
increase per year

Estimated Impact of BPCI
33
Orthopedic surgery: inpatient hospitalization and 90 days post-
discharge (hip and knee)
• cost declined 3% in the first year; 4.2% decline in 21 month
• achieved by less use of institutional post-acute care and inpatient
rehab facilities
• no impact on quality of care
Cardiovascular surgery: inpatient hospitalization and 90 days post-
discharge
• cost declined 1.9% in first year; exponentially increased in later
months

Fraud and Abuse • Federal False Claims Act
o Protects the federal government from being overcharge or sold substandard goods or services
(submission of a false or fraudulent claim)
• Anti-Kickback Statute o Crime to knowingly, willfully offer, pay, solicit or receive remuneration to induce or reward referrals
of items/services reimbursed by the federal government
• Physician Self-Referral law o Prohibits referral for certain designated health services payable for Medicare/Medicaid to an entity which the
physician has ownership/investment interest
• Physician Payments Sunshine Act & Open Payments Program o Increases transparency around financial relationships between physicians/teaching hospitals/drug & device
manufacturers via the Open Payments Program, which requires drug/device manufacturers to publicly report
payments to physicians & teaching hospitals
34

/ahip
@ahipcoverage
AHIP
ahip.org
What can you do to help our System achieve the goals of
Better Care, Smarter Spending, and Healthier People?
Eliminate patient harm
Focus on better care, smarter spending, and better health
for the patient population you serve
Engage in accountable care and other alternative
contracts that move away from fee-for-service to model
based on achieving better outcomes at lower cost
Invest in the quality infrastructure necessary to improve
Focus on data and performance transparency
Health plans are major drivers of positive change
Test new innovations and scale successes rapidly
Relentlessly pursue improved health outcomes
35