u.s. trade deficit and the impact of changing oil prices. trade deficit and the impact of changing...
TRANSCRIPT

U.S. Trade Deficit and the Impact of
Changing Oil Prices
James K. Jackson
Specialist in International Trade and Finance
April 4, 2018
Congressional Research Service
7-5700
www.crs.gov
RS22204
U.S. Trade Deficit and the Impact of Changing Oil Prices
Congressional Research Service
Summary Imported petroleum prices fell from an average price of $91.23 per barrel of crude oil in 2014 to
an average price of $32.60 per barrel in 2016, or a drop of more than 60%. This represents the
lowest price per barrel of crude oil since early 2005. During 2017, the average monthly price per
barrel of oil rose nearly 20% to reach an average of $52 per barrel by December 2017 and
continued rising in 2018 to reach nearly $70 per barrel in early April 2018. Reflecting rising
prices, the volume of crude oil imports for 2017 were nearly flat for the year compared with
volume changes in 2016. The rise in the average price of a barrel of crude oil combined with a
slight increase in the amount, or the volume, of oil imports in 2017 compared with 2016 resulted
in a nearly 30% increase in the overall value of imported crude oil and a slight increase in the
share of the total U.S. merchandise trade deficit that is associated with the trade deficit in energy
imports.
In general, market demand for oil remains highly resistant to changes in oil prices and reflects the
unique nature of the demand for and the supply of energy-related imports. Turmoil in the Middle
East is an important factor that continues to create uncertainty in global petroleum markets and
was one of the most important factors in causing petroleum prices to rise sharply in early 2011
and in 2012. A slowdown in the rate of growth in the Chinese economy, combined with a rising in
raw material prices, an increase in the rate of economic growth among commodity-exporting
developing economies, and improved prospects of growth among many of the major developed
economies, all have pushed up demand for energy products. Fluctuations in U.S. energy
production, uncertainty concerning oil production decisions by various members of the
Organization of the Petroleum Exporting Countries (OPEC), and the potential impact of new
Iranian supplies of oil also have worked to push up the global market price of oil. Oil futures
markets in April 2018 indicate that oil traders expect crude oil prices to trend in the range of $63
per barrel through 2018, below early April 2018 market prices. At current prices and volumes,
energy imports in 2018 are projected to rise to about $200 billion, or about $25 billion more than
in 2017. This report provides an estimate of the initial impact of the changing oil prices on the
nation’s merchandise trade balance.

U.S. Trade Deficit and the Impact of Changing Oil Prices
Congressional Research Service
Contents
Background ..................................................................................................................................... 1
Recent Trends .................................................................................................................................. 3
Oil Import Volumes ................................................................................................................... 4 Oil Import Values ...................................................................................................................... 5 Oil Import Prices ....................................................................................................................... 7
Issues for Congress ........................................................................................................................ 10
Figures
Figure 1. Share of Petroleum and Non-Petroleum Products in the U.S. Trade Deficit ................... 2
Figure 2. Energy Trade Deficit as a Share of Total U.S. Merchandise Trade Deficit ...................... 3
Figure 3. Quantity of U.S. Imports of Energy-Related Petroleum Products ................................... 5
Figure 4. Value of U.S. Imports of Energy-Related Petroleum Products ........................................ 7
Figure 5. U.S. Import Price of Crude Oil ........................................................................................ 8
Figure 6. Quantity, Value, and Price of Imported Crude Oil
by the United States, 1973-2017 .................................................................................................. 9
Tables
Table 1. Summary Data of U.S. Imports of Energy-Related Petroleum Products, Including
Oil (not seasonally adjusted) ........................................................................................................ 4
Table 2. U.S. Imports of Energy-Related Petroleum Products, Including Crude Oil (not
seasonally adjusted) ...................................................................................................................... 5
Contacts
Author Contact Information ........................................................................................................... 11
U.S. Trade Deficit and the Impact of Changing Oil Prices
Congressional Research Service 1
Background According to data published by the Census Bureau of the U.S. Department of Commerce,1 the
average price of imported petroleum products averaged about $46 per barrel in 2017, or an
increase of 27% above the previous year. Oil futures markets in April 2018 indicate that oil
traders expected crude oil prices to trend at about $63 per barrel through the end of 2018, below
actual market prices of close to $70 per barrel reached in early April 2018.
Energy prices have fluctuated sharply over the past seven years, generally rising during the winter
and spring months and then declining in the fall. In 2008, prior to the financial collapse, the
average imported petroleum prices reached nearly $140 per barrel, before falling at a historic
rate.2 During the economic recession in 2009, however, average petroleum prices fell each month
between August 2008 and February 2009, but then reversed course and rose by 85% between
February and December 2009, climbing to nearly $80 per barrel at times.
In 2012, the average price of imported petroleum rose 1% over the same period in 2011 to reach
an average price of $101.07 per barrel. In 2013, oil prices averaged around $97 per barrel, falling
to an average monthly price of about $91 per barrel in 2014. Average imported petroleum prices
dropped throughout 2015, falling to an average price of $37 per barrel in December 2015.
Average imported petroleum prices rose through much of 2017 and into 2018, rising to close to
$70 per barrel in early April 2018, outpacing oil futures contacts. Imported energy products,
primarily crude oil, account for about one-fourth of the total annual U.S. energy consumption,
measured in btus.3
Turmoil in the Middle East, natural disasters, hurricanes, droughts, the rate of economic growth
in Asia and Europe, the prospects of Iranian oil exports, and the impact of low oil prices on U.S.
investment and production of petroleum and natural gas—the United States is now the world’s
largest combined producer of oil and natural gas—likely will continue to have a significant
impact on the course of oil prices for the foreseeable future. As a result of changing petroleum
prices, imported energy-related petroleum products accounted for a larger share of the U.S. trade
deficit in 2006-2008 and 2010-2011.4
Crude oil comprises the largest share by far within the broad category of energy-related imports.
Despite fluctuations in oil prices and sharp drops at times in the average annual price of imported
crude oil and the decline in the role of imported crude oil in the value of the U.S. trade deficit, the
trade deficit itself did not change appreciably. Instead, the composition of the trade deficit
changed, with non-petroleum products replacing petroleum products, as indicated in Figure 1.
1 U.S. Department of Commerce, U.S. Census Bureau, Report FT900, U.S. International Trade in Goods and Services,
Table 17, August 5, 2016. The report and supporting tables are available at http://www.census.gov/foreign-trade/Press-
Release/current_press_release/ftdpress.pdf. 2 For information about the causes of the run up in oil prices, see Hamilton, James, Causes and Consequences of the Oil
Shock of 2007-2008, Brookings Papers on Economic Activity, Spring 2009. 3 Monthly Energy Review, U.S. Energy Information Administration, January 2016, p. 3. 4 For additional information about U.S. oil imports, see out-of-print CRS Report R41765, U.S. Oil Imports: Context
and Considerations, by Neelesh Nerurkar, available upon request.

U.S. Trade Deficit and the Impact of Changing Oil Prices
Congressional Research Service 2
Figure 1. Share of Petroleum and Non-Petroleum Products in the U.S. Trade Deficit
Source: U.S. Department of Commerce, U.S. Census Bureau, Report FT900, U.S. International Trade in Goods
and Services, Table 17, March 7, 2018.
In isolation from other events, lower energy prices tend to aid the U.S. economy by lowering
energy costs for businesses, increasing consumer’s real incomes, and by making it a more
attractive destination for foreign investment. Foreign capital inflows, however, place upward
pressure on the dollar against a broad range of other currencies. Periods of volatility or
uncertainty in the global economy also spur investors to seek out such safe currencies as the
dollar, which tends to push up the international value of the dollar. To the extent that the additions
to the merchandise trade deficit are returned to the U.S. economy as payment for additional U.S.
exports or to acquire such assets as securities or U.S. businesses, the U.S. trade deficit could be
mitigated further. Lower energy prices also are expected to aid consumers by increasing their real
incomes and to aid some businesses. How consumers respond to lower energy costs, however, is
problematic. In 2015, consumers reportedly responded to lower energy costs by slightly
increasing their overall level of consumption and by increasing the saving rate and reducing credit
card debt. In contrast, energy producers have responded to lower energy prices by curtailing new
investments and by trimming payrolls, offsetting some of the stimulus to the economy provided
by lower imported petroleum prices.5
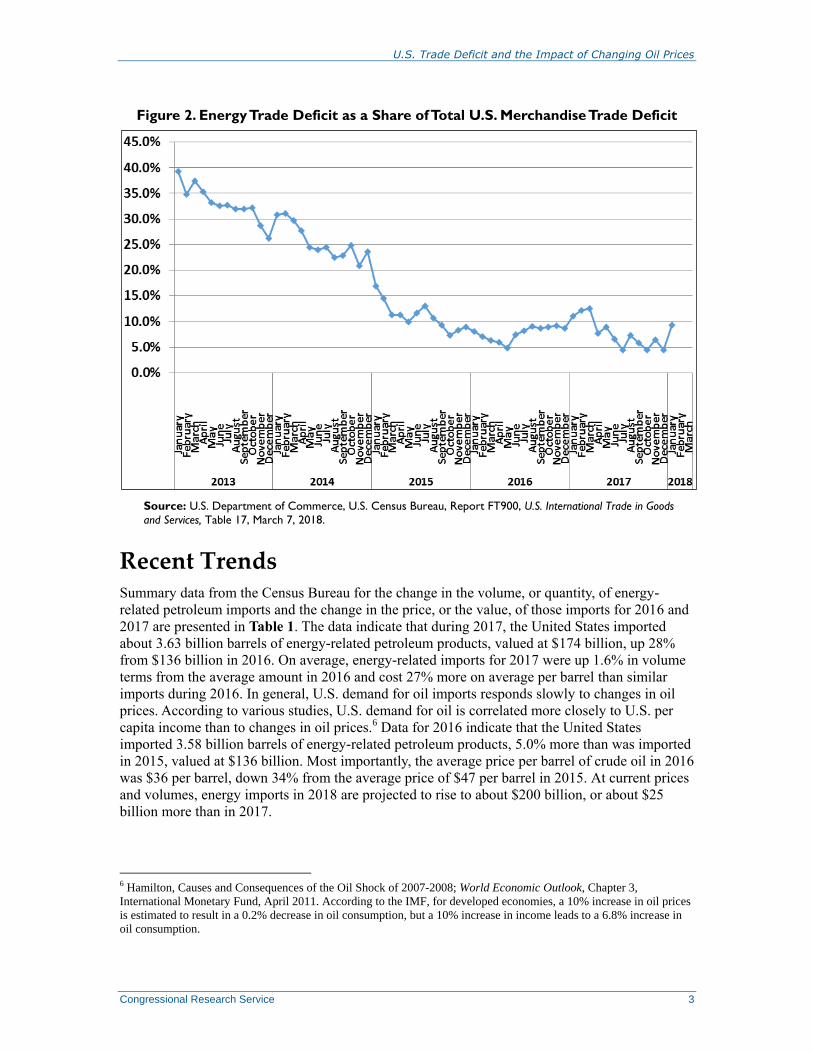
Oil prices in 2013 averaged less than those in 2012; combined with a decline in the volume of
imported oil, this resulted in a decline in the role of energy imports in the nation’s trade deficit
from 40% of the overall deficit in 2012 to 33% in 2013, as indicated in Figure 2. By January
2018, energy imports had risen to account for about 9% of the total U.S. trade deficit from a share
of 4% in December 2017, which stands at the lowest monthly share in over a decade.
5 Bureau of Economic Analysis, National Income and Product Accounts, Gross Domestic Product: Fourth Quarter and
Annual 2015, January 29, 2016; Bureau of Economic Analysis, GDP and the Economy: Advance Estimates for the
Fourth Quarter of 2015, February 2016.
U.S. Trade Deficit and the Impact of Changing Oil Prices
Congressional Research Service 3
Figure 2. Energy Trade Deficit as a Share of Total U.S. Merchandise Trade Deficit
Source: U.S. Department of Commerce, U.S. Census Bureau, Report FT900, U.S. International Trade in Goods
and Services, Table 17, March 7, 2018.
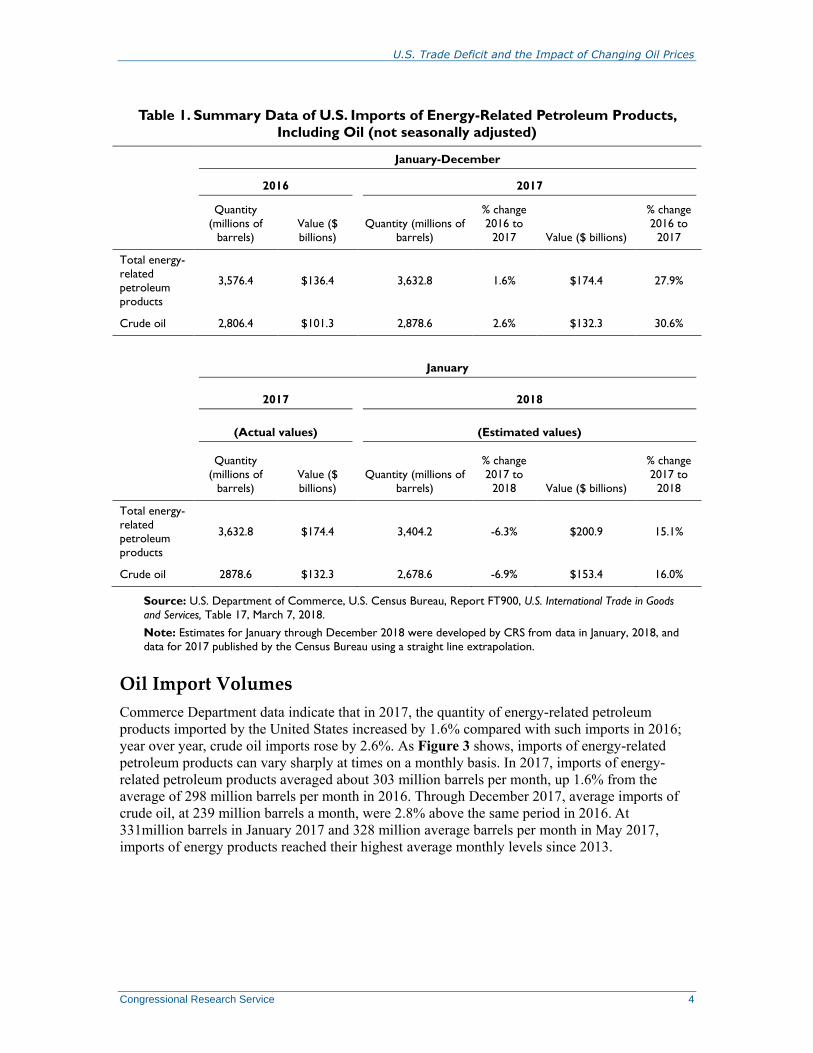
Recent Trends Summary data from the Census Bureau for the change in the volume, or quantity, of energy-
related petroleum imports and the change in the price, or the value, of those imports for 2016 and
2017 are presented in Table 1. The data indicate that during 2017, the United States imported
about 3.63 billion barrels of energy-related petroleum products, valued at $174 billion, up 28%
from $136 billion in 2016. On average, energy-related imports for 2017 were up 1.6% in volume
terms from the average amount in 2016 and cost 27% more on average per barrel than similar
imports during 2016. In general, U.S. demand for oil imports responds slowly to changes in oil
prices. According to various studies, U.S. demand for oil is correlated more closely to U.S. per
capita income than to changes in oil prices.6 Data for 2016 indicate that the United States
imported 3.58 billion barrels of energy-related petroleum products, 5.0% more than was imported
in 2015, valued at $136 billion. Most importantly, the average price per barrel of crude oil in 2016
was $36 per barrel, down 34% from the average price of $47 per barrel in 2015. At current prices
and volumes, energy imports in 2018 are projected to rise to about $200 billion, or about $25
billion more than in 2017.
6 Hamilton, Causes and Consequences of the Oil Shock of 2007-2008; World Economic Outlook, Chapter 3,
International Monetary Fund, April 2011. According to the IMF, for developed economies, a 10% increase in oil prices
is estimated to result in a 0.2% decrease in oil consumption, but a 10% increase in income leads to a 6.8% increase in
oil consumption.
U.S. Trade Deficit and the Impact of Changing Oil Prices
Congressional Research Service 4
Table 1. Summary Data of U.S. Imports of Energy-Related Petroleum Products,
Including Oil (not seasonally adjusted)
January-December
2016 2017
Quantity
(millions of
barrels)
Value ($
billions)
Quantity (millions of
barrels)
% change
2016 to
2017 Value ($ billions)
% change
2016 to
2017
Total energy-
related
petroleum
products
3,576.4 $136.4 3,632.8 1.6% $174.4 27.9%
Crude oil 2,806.4 $101.3 2,878.6 2.6% $132.3 30.6%
January
2017 2018
(Actual values) (Estimated values)
Quantity
(millions of
barrels)
Value ($
billions)
Quantity (millions of
barrels)
% change
2017 to
2018 Value ($ billions)
% change
2017 to
2018
Total energy-
related
petroleum
products
3,632.8 $174.4 3,404.2 -6.3% $200.9 15.1%
Crude oil 2878.6 $132.3 2,678.6 -6.9% $153.4 16.0%
Source: U.S. Department of Commerce, U.S. Census Bureau, Report FT900, U.S. International Trade in Goods
and Services, Table 17, March 7, 2018.
Note: Estimates for January through December 2018 were developed by CRS from data in January, 2018, and
data for 2017 published by the Census Bureau using a straight line extrapolation.
Oil Import Volumes
Commerce Department data indicate that in 2017, the quantity of energy-related petroleum
products imported by the United States increased by 1.6% compared with such imports in 2016;
year over year, crude oil imports rose by 2.6%. As Figure 3 shows, imports of energy-related
petroleum products can vary sharply at times on a monthly basis. In 2017, imports of energy-
related petroleum products averaged about 303 million barrels per month, up 1.6% from the
average of 298 million barrels per month in 2016. Through December 2017, average imports of
crude oil, at 239 million barrels a month, were 2.8% above the same period in 2016. At
331million barrels in January 2017 and 328 million average barrels per month in May 2017,
imports of energy products reached their highest average monthly levels since 2013.

U.S. Trade Deficit and the Impact of Changing Oil Prices
Congressional Research Service 5
Figure 3. Quantity of U.S. Imports of Energy-Related Petroleum Products
Source: U.S. Department of Commerce, U.S. Census Bureau, Report FT900, U.S. International Trade in Goods
and Services, Table 17, March 7, 2018.
Oil Import Values
As indicated in Table 2, the nominal dollar value of energy-related imports in 2017 was $174
billion, up 28% from the value of energy imports in 2016, which accounted for about 8% of the
value of total U.S. merchandise imports. In previous periods, energy prices have varied sharply,
occasionally not following the general trend of falling during the winter months, as indicated in
Figure 4. As Table 2 shows, the average price of imported oil in 2017 was $46 a barrel, up 27%
from an average price of $36 per barrel in 2016. In December 2017, the average price of imported
oil stood at $52 per barrel. By January 2018, the average monthly price of an imported barrel of
oil had risen to $55.
Table 2. U.S. Imports of Energy-Related Petroleum Products, Including Crude Oil
(not seasonally adjusted)
Period
Total energy-related
petroleum productsa Crude oil
Quantity
(millions of
barrels)
Value
($ billions)
Quantity
(millions of
barrels)
Thousands
of barrels
per day
(average)
Value
($ billions)
Unit price
(dollars)
2016
Jan-Dec. 3,576.4 $136.4 2,806.4 7,668 $101.3 $36.09

U.S. Trade Deficit and the Impact of Changing Oil Prices
Congressional Research Service 6
Period
Total energy-related
petroleum productsa Crude oil
Quantity
(millions of
barrels)
Value
($ billions)
Quantity
(millions of
barrels)
Thousands
of barrels
per day
(average)
Value
($ billions)
Unit price
(dollars)
January 291.4 $9.8 226.7 7,312 $7.3 $32.05
February 275.5 $8.0 214.9 7,411 $5.9 $27.49
March 302.3 $8.9 243.9 7,869 $6.7 $27.67
April 291.5 $9.5 228.9 7,629 $6.8 $29.53
May 286.2 $10.6 223.4 7,206 $7.6 $34.19
June 314.6 $13.2 244.8 8,159 $9.6 $39.38
July 294.9 $12.5 225.6 7,277 $9.3 $41.02
August 329.4 $13.5 256.6 8,279 $10.1 $39.38
September 301.7 $12.4 238.5 7,950 $9.3 $39.01
October 285.9 $12.1 224.6 7,247 $9.0 $40.03
November 305.7 $13.0 240.4 8,014 $9.8 $40.81
December 297.1 $12.8 238.1 7,679 $9.9 $41.40
2017
Jan-Dec. 3,632.8 174.4 2,878.6 7,887 132.3 45.96
January 331.2 15.3 258.9 8,353 11.4 43.94
February 295.2 13.9 235.3 8,402 10.6 45.25
March 323.3 15.4 259.9 8,383 12.0 46.26
April 287.5 13.7 229.2 7,641 10.4 45.40
May 329.0 15.4 265.0 8,548 11.9 45.03
June 308.8 14.2 248.8 8,292 11.1 44.68
July 296.3 13.3 235.1 7,585 10.2 43.20
August 318.0 14.7 251.7 8,118 11.1 44.11
September 276.3 13.4 210.5 7,017 9.5 45.16
October 296.8 14.8 234.7 7,570 11.1 47.26
November 300,5 15.7 235.6 7,852 11.8 50.10
December 270.2 14.6 214.0 6,903 11.1 52.10
2018
January 310.3 17.6 240.9 7,772 13.2 54.76
Source: U.S. Department of Commerce, U.S. Census Bureau, Report FT900, U.S. International Trade in Goods
and Services, Table 17, March 7, 2018.
a. “Energy-related petroleum products” is a term used by the Census Bureau and includes crude oil,
petroleum preparations, and liquefied propane and butane gas.

U.S. Trade Deficit and the Impact of Changing Oil Prices
Congressional Research Service 7
Figure 4. Value of U.S. Imports of Energy-Related Petroleum Products
Source: U.S. Department of Commerce, U.S. Census Bureau, Report FT900, U.S. International Trade in Goods
and Services, Table 17, March 7, 2018.
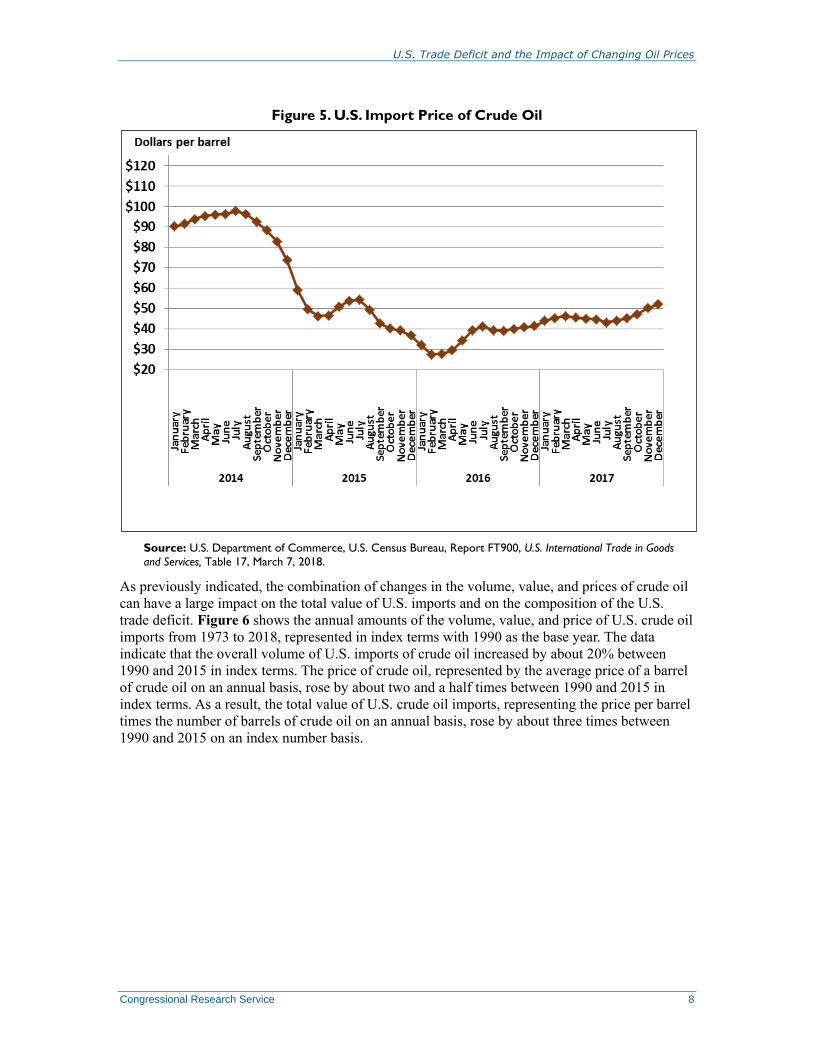
Oil Import Prices
Crude oil comprises the largest share of energy-related petroleum products imports. As is
apparent from Census Bureau data,7 the price of imported crude oil has fluctuated sharply at
times. For instance, from January 2008 to June 2008, the average price of crude oil increased by
39%, rising from $84 per barrel to $117 per barrel. As shown in Figure 5, oil import prices varied
in the general range of $90 and $108 per barrel between January 2012 and October 2014, after
which imported oil prices have experienced a sharp drop. Crude oil prices rose from an average
of $94 per barrel in January 2013 to $102 per barrel in September 2013, the highest average
monthly value recorded up to that point in 2013, but fell to an average imported price of $91.34 in
December 2013. In 2015, oil prices fell from $58.96 per barrel in January to $36.60 in December.
During 2017, oil prices trended upward, rising from a monthly average of $43 per barrel to a
monthly average $52 per barrel, the highest monthly average price since mid-2015.
7 Report FT900, U.S. International Transactions in Goods and Services, Table 17, August 5, 2016.
U.S. Trade Deficit and the Impact of Changing Oil Prices
Congressional Research Service 8
Figure 5. U.S. Import Price of Crude Oil
Source: U.S. Department of Commerce, U.S. Census Bureau, Report FT900, U.S. International Trade in Goods
and Services, Table 17, March 7, 2018.
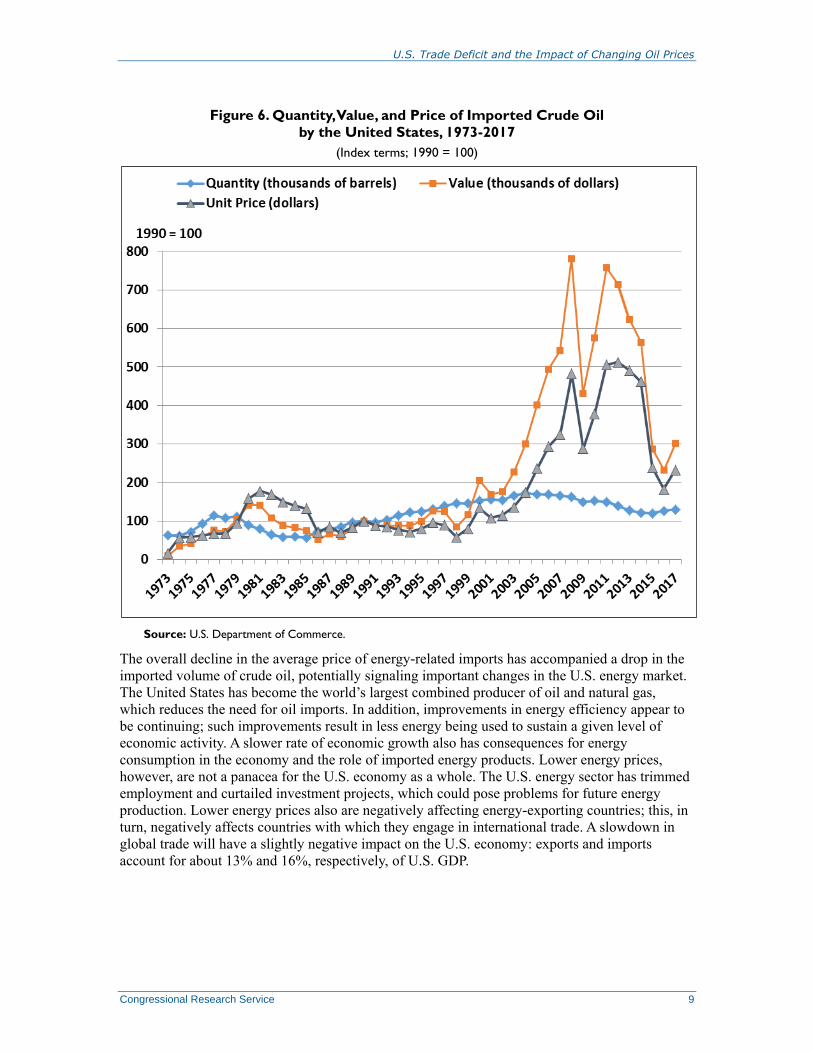
As previously indicated, the combination of changes in the volume, value, and prices of crude oil
can have a large impact on the total value of U.S. imports and on the composition of the U.S.
trade deficit. Figure 6 shows the annual amounts of the volume, value, and price of U.S. crude oil
imports from 1973 to 2018, represented in index terms with 1990 as the base year. The data
indicate that the overall volume of U.S. imports of crude oil increased by about 20% between
1990 and 2015 in index terms. The price of crude oil, represented by the average price of a barrel
of crude oil on an annual basis, rose by about two and a half times between 1990 and 2015 in
index terms. As a result, the total value of U.S. crude oil imports, representing the price per barrel
times the number of barrels of crude oil on an annual basis, rose by about three times between
1990 and 2015 on an index number basis.
U.S. Trade Deficit and the Impact of Changing Oil Prices
Congressional Research Service 9
Figure 6. Quantity, Value, and Price of Imported Crude Oil
by the United States, 1973-2017
(Index terms; 1990 = 100)
Source: U.S. Department of Commerce.
The overall decline in the average price of energy-related imports has accompanied a drop in the
imported volume of crude oil, potentially signaling important changes in the U.S. energy market.
The United States has become the world’s largest combined producer of oil and natural gas,
which reduces the need for oil imports. In addition, improvements in energy efficiency appear to
be continuing; such improvements result in less energy being used to sustain a given level of
economic activity. A slower rate of economic growth also has consequences for energy
consumption in the economy and the role of imported energy products. Lower energy prices,
however, are not a panacea for the U.S. economy as a whole. The U.S. energy sector has trimmed
employment and curtailed investment projects, which could pose problems for future energy
production. Lower energy prices also are negatively affecting energy-exporting countries; this, in
turn, negatively affects countries with which they engage in international trade. A slowdown in
global trade will have a slightly negative impact on the U.S. economy: exports and imports
account for about 13% and 16%, respectively, of U.S. GDP.

U.S. Trade Deficit and the Impact of Changing Oil Prices
Congressional Research Service 10
Issues for Congress The rise in the prices of energy imports in 2017 and early 2018, combined with a small increase
in the total volume of energy imports, resulted in a larger contribution to the overall U.S. trade
deficit in 2017 and 2018. The overall trade deficit, however, has stayed relatively flat. In previous
periods, as energy imports declined, imports of non-energy goods increased. This trend is being
reversed slightly with rising energy import prices. The average monthly price of imported oil
continues to be volatile, making it difficult to determine when and at what level the price will
stabilize in 2018. Oil futures markets seem to indicate a belief that the price will stabilize around
$63 per barrel through 2018, although these contract prices are lagging behind market prices. The
ubiquitous nature of oil in the economy generally means that changes in energy prices will affect
the U.S. rate of inflation and the rate of economic growth. Various factors, dominated by events in
the Middle East, a slowdown in the rate of economic growth in Asia and other developing
economies, and an increase in natural gas production in the United States, combined in 2015 to
push the cost of energy imports slightly lower than in 2014. The pace of economic growth in the
United States tracked slightly above 3% in the second and third quarters of 2017, which may have
affected both the level of oil imports and the price of such imports. The pace of economic growth
has improved in Europe, Asia, and among developing economies.
Typically, energy import prices have followed a cyclical pattern as energy prices rise in the
summer months and fall in the winter. The slowdown in the rate of economic growth in the
United States and elsewhere in 2009 sharply reduced the demand for energy imports and caused
oil prices to tumble from the heights they reached in July 2008. One important factor that can
affect crude oil prices is the impact Atlantic hurricanes have on the production of crude oil in the
Gulf of Mexico and droughts in the midwestern United States that can reduce the production of
corn and, therefore, the availability of ethanol, which puts upward pressure on gasoline prices.
Recently, the price of oil has been affected by increased energy production in the United States
and a combination of global economic events, including the slowdown in the Chinese economy; a
sharp drop in commodity prices that has negatively affected commodity producers and their
trading partners; the international exchange value of the dollar; an apparent agreement among
OPEC oil producers to reduce production in order to drive up prices; and the prospects of a
resumption of oil production in Iran, among other events.
The return to a positive rate of economic growth in the United States and globally placed upward
pressure on the prices of energy imports and contributed to the share of imported energy in the
United States’ merchandise trade deficit. Some of the impact of this deficit could be offset if some
of the dollars that accrue abroad are returned to the U.S. economy through increased purchases of
U.S. goods and services or through purchases of such other assets as corporate securities or
acquisitions of U.S. businesses. Some of the return in dollars likely will come through sovereign
wealth funds, or funds controlled and managed by foreign governments, as foreign exchange
reserves boost the dollar holdings of such funds. Such investments likely will add to concerns
about the national security implications of foreign acquisitions of U.S. firms, especially by
foreign governments, and to concerns about the growing share of outstanding U.S. Treasury
securities that is owned by foreigners.
At times, slower-than-expected rates of economic growth in various regions of the world have
reduced slightly the demand for oil and pushed down the average price of energy imports.
Increased energy production in the United States also reduced the amount of energy imports,
which may well have contributed to other forces that have tended at times to draw down the price
of energy in world markets. Higher prices for energy imports may have been one contributing
factor in spurring the economy to improve its energy efficiency, find alternative sources of

U.S. Trade Deficit and the Impact of Changing Oil Prices
Congressional Research Service 11
energy, or search out additional supplies of energy. While lower energy costs should improve
conditions for both producers and consumers, lower energy prices could dissuade energy
producers from investing in new sources of energy, while the increase in consumers’ real incomes
from lower energy prices could either spur consumption, or could encourage consumers to use
their extra income to increase saving and reduce debts.
Congress, through its direct role in making economic policy and its oversight role over the
Federal Reserve, could face the dilemma of a slower rate of economic growth, stagnant tax
revenues, and falling prices. Traditionally, sluggish economic growth has been addressed through
increased government spending and lowering interest rates to loosen credit and to stimulate
investment. With the U.S. economy operating at full employment at the end of 2017, such
stimulative measures may push up the rate of inflation. The impact on the U.S. merchandise trade
deficit also is not straightforward. While lower imported energy prices reduce the energy
component of the trade accounts, the overall value of exports and imports is determined by a
number of factors, including the international exchange value of the dollar, the domestic balance
of saving and investment, and relative rates of growth in demand for exports and imports.
Consequently, while the energy component of the U.S. trade deficit has fallen appreciably, the
overall U.S. trade deficit has not. If the rate of growth in the U.S. economy, even at low rates,
outpaces that of its trading partners, the overall trade deficit potentially worsens even with lower
energy prices due to a relatively stronger U.S. demand for imports than foreign demand for U.S.
exports and an inflow of foreign capital that puts upward pressure on the value of the dollar.
Under such circumstances, Congress potentially could face pressure to examine the causes of the
trade deficit and to address the underlying domestic macroeconomic factors that are generating
that deficit.
Author Contact Information
James K. Jackson
Specialist in International Trade and Finance
[email protected], 7-7751