u.s. trade concepts, performance, and policy: …. trade concepts, performance, and policy:...
TRANSCRIPT
U.S. Trade Concepts, Performance, and Policy:
Frequently Asked Questions
Wayne M. Morrison
Specialist in Asian Trade and Finance
James K. Jackson
Specialist in International Trade and Finance
Vivian C. Jones
Specialist in International Trade and Finance
M. Angeles Villarreal
Specialist in International Trade and Finance
Rachel F. Fefer
Analyst in International Trade and Finance
Ashley Feng
Research Associate
March 25, 2016
Congressional Research Service
7-5700
www.crs.gov
RL33944

U.S. Trade Concepts, Performance, and Policy: Frequently Asked Questions
Congressional Research Service
Summary Congress plays a major role in U.S. trade policy through its legislative and oversight authority.
There are a number of major trade issues that are currently the focus of Congress. For example,
bills were introduced in the 113th Congress to reauthorize Trade Promotion Authority (TPA), the
U.S. Generalized System of Preferences (GSP), and the U.S. Export-Import Bank, and legislative
action on these issues could be forthcoming in the 114th Congress. Additionally, Congress has
been involved with proposed free trade agreements (FTAs), including the Trans-Pacific
Partnership (TPP) involving the United States and 11 other countries and the Transatlantic Trade
and Investment Partnership (TTIP) between the United States and the European Union (EU). Also
of interest to Congress are current plurilateral negotiations for a Trade in Services Agreement
(TISA) and an updated multilateral Information Technology Agreement (ITA) in the World Trade
Organization (WTO). Trade and investment policies of major U.S. trading partners (such as
China), especially when they are deemed harmful to U.S. economic interests, are also of
continued concern to Congress. Recent improved U.S. relations with Cuba have resulted in the
introduction of several bills to boost bilateral commercial ties. The costs and benefits of trade to
the U.S. economy, firms, workers, and constituents, and the future direction of U.S. trade policy,
are the subject of ongoing debates in Congress.
This report provides information and context for these and many other trade topics. It is intended
to assist Members and staff who may be new to trade issues. The report is divided into four
sections in a question-and-answer format: trade concepts; U.S. trade performance; formulation of
U.S. trade policy; and trade and investment issues. Additional suggested readings are provided in
an appendix.
The first section, “Trade Concepts,” deals with why countries trade, the consequences of trade
expansion, and the relationship between globalization and trade. Key questions address the
benefits of specialization in production and trade, efforts by governments to influence a country’s
comparative advantage, how trade expansion can be costly and disruptive to workers in some
industries, and some unique characteristics of trade between developed countries.
The second section, “U.S. Trade Performance,” lists data on U.S. trade flows and focuses on the
U.S. trade deficit, including its implications for the U.S. economy. Questions address the causes
of trade deficits, the role of foreign trade barriers, and how the trade deficit might be reduced.
The third section, “Formulation of U.S. Trade Policy,” deals with the roles played by the
executive branch, Congress, the private sector, and the judiciary in the formulation of U.S. trade
policy. Information on how trade policy functions are organized in Congress and the executive
branch, as well as the respective roles of individual Members and the President, is provided. The
roles of the private sector and the judiciary are also discussed.
The fourth section, “U.S. Trade and Investment Policy Issues,” lists questions related to trade
negotiations and agreements and to imports, exports, and investments. The justification, types,
and consequences of trade liberalization agreements, along with the role of the WTO, are treated
in this section. The costs and benefits of imports, exports, and investments are also discussed,
including how the government deals with disruption and injury to workers and companies caused
by imports and its efforts to both restrict and promote exports. The motivations and consequences
of foreign direct investment flows are also discussed.

U.S. Trade Concepts, Performance, and Policy: Frequently Asked Questions
Congressional Research Service
Contents
Trade Concepts ................................................................................................................................ 1
The Basics of Trade ................................................................................................................... 1 Trade and Jobs ........................................................................................................................... 3 Economic Globalization ............................................................................................................ 5
U.S. Trade Performance .................................................................................................................. 7
The U.S. Role in the World Economy ....................................................................................... 7 The U.S. Trade Deficit .............................................................................................................. 8 Understanding Data on U.S. Trade and the Economy ............................................................. 13 U.S. Manufacturing and Services ............................................................................................ 16
Formulation of U.S. Trade Policy .................................................................................................. 20
Role of Congress ..................................................................................................................... 20 Role of the Executive Branch ................................................................................................. 21 Role of the Private Sector ....................................................................................................... 22 Role of the Judiciary ............................................................................................................... 23
U.S. Trade and Investment Policy Issues ...................................................................................... 24
Trade Negotiations and Agreements ....................................................................................... 24 Import Issues ........................................................................................................................... 28 Federal Export Issues .............................................................................................................. 29 Investment Issues .................................................................................................................... 32
Additional Readings ...................................................................................................................... 35
CRS Reports ............................................................................................................................ 35 CRS Insights and In Focus Products ....................................................................................... 38 Other Readings ........................................................................................................................ 39
List of Questions ........................................................................................................................... 39
Trade Concepts ........................................................................................................................ 39 U.S. Trade Performance .......................................................................................................... 39 Understanding Data on U.S. Trade and the Economy ............................................................. 40 U.S. Manufacturing and Services ............................................................................................ 40 Formulation of U.S. Trade Policy ........................................................................................... 40 Role of the Judiciary ............................................................................................................... 41 U.S. Trade and Investment Policy Issues ................................................................................ 41 Selected Import Issues ............................................................................................................. 41 Selected Export Issues ............................................................................................................. 41 Investment Issues .................................................................................................................... 42
Appendix ....................................................................................................................................... 42
Figures
Figure 1. U.S. Current Account Balance as a Percent of GDP: 1990-2015 .................................. 10
Figure 2. U.S. Exports and Imports of Goods and Services as a Percent of GDP: 1980-
2015 ............................................................................................................................................ 14
Figure 3. Real Manufacturing Output Index and Labor Productivity in U.S.
Manufacturing: 1987-2015 ......................................................................................................... 17
Figure 4. Manufacturing Value-Added as a percent of GDP: 1997-2014 ..................................... 18

U.S. Trade Concepts, Performance, and Policy: Frequently Asked Questions
Congressional Research Service
Figure 5. U.S. FDI Outflows and Inflows: 1990-2014 .................................................................. 34
Tables
Table 1. Largest Global Trading Economies Based on Total Trade in Goods and Services
(G&S): 2015 ................................................................................................................................. 7
Table 2. U.S. Merchandise Trade and Current Account Trade: 2005-2015 ..................................... 8
Table 3. The Ratio of National Savings to Total Investment and Current Account
Balances as a Percent of GDP for Major Economies in 2015 ..................................................... 11
Table 4. Top U.S. Trading Partners Ranked by Total Merchandise Trade, 2015 ........................... 15
Contacts
Author Contact Information .......................................................................................................... 44

U.S. Trade Concepts, Performance, and Policy: Frequently Asked Questions
Congressional Research Service 1
Trade Concepts1
The Basics of Trade
1. Why do countries trade?
Economic theory states that trade occurs because it is mutually enriching. It is asserted that it has
a positive economic effect like that caused by technological change, whereby economic efficiency
is increased, allowing greater output from the same amount of scarce productive resources. By
allowing each participant to specialize in producing what it is relatively more efficient at and
trading for what it is relatively less efficient at, trade (according to economic theory) can increase
economic well-being above what would be possible without trade. The benefit of trade is attached
to the product received (the import), not in the product given (the export). Hence, countries export
in order to pay for imports.2 There is a broad consensus among economists that trade expansion
has a favorable effect on overall economic well-being, but the gains will not necessarily be
distributed equitably. Although most economists hold that the benefits to the overall economy
exceed the costs incurred by workers who lose their jobs to increased trade, others argue that the
benefits are often overestimated and the costs are often underestimated.
Some goods that are imported into the United States, such as bananas, cannot be produced
economically in sufficient quantities to satisfy domestic demand. Many other products (including
intermediate goods) and services are imported because they can be produced less expensively or
more efficiently by firms in other countries. Many imports into the United States contain U.S.-
made components (such as semiconductors inside a computer) or U.S.-grown raw materials (such
as cotton used to make t-shirts). Consumers can benefit through access to a wider variety of
goods at lower costs. This raises consumer welfare (i.e., consumers have more money to spend on
other goods and services) and helps control the rate of U.S. inflation. Producers can benefit
through access to lower priced components or inputs that can be utilized in the production
process. Longer term, import competition can also pressure companies to reduce costs through
innovation, research, and development, leading to growth in economic output and productivity.
2. What is comparative advantage?
The idea of comparative advantage was developed by David Ricardo early in the 19th century and
its insight remains relevant today. Ricardo argued that specialization and trade are mutually
beneficial even if a country finds that it is more efficient at producing everything than its trading
partners. If one country produces a given good at a lower resource cost than another country, it
has an absolute advantage in its production. (The other country has an absolute disadvantage in
its production.) If all productive resources were highly mobile between countries, absolute
advantage would be the criterion governing what a country produces and the pattern of any trade
between countries. But Ricardo demonstrated that because resources, particularly labor and the
skills and knowledge it embodies, are highly immobile, a comparison of a good’s absolute cost of
production in each country is not relevant for determining whether specialization and trade should
occur. Rather, the critical comparison within each country is the opportunity cost of producing
any good—how much output of good Y must be forgone to produce one more unit of good X. If
1 This section was originally prepared by Craig K. Elwell, Specialist in Macroeconomics, Government and Finance
Division, CRS. 2 Although exports support jobs and economic activity, the end purpose of exporting is to obtain imports of goods and
services and hence boost consumer welfare.
U.S. Trade Concepts, Performance, and Policy: Frequently Asked Questions
Congressional Research Service 2
the opportunity costs of producing X and Y are different in each economy, then each country has
a comparative advantage in the production of one of the goods. In this circumstance, Ricardo
predicts that each country can realize gains from trade by specializing in producing what it does
relatively well and in which it has a comparative advantage and trading for what it does relatively
less well and in which it has a comparative disadvantage.
3. What determines comparative advantage?
Most often, differences in comparative advantage between countries occur because of differences
in the relative abundance of the factors of production: land, labor, physical capital (plant and
equipment), human capital (skills and knowledge including entrepreneurial talent), and
technology. Standard economic theory predicts that comparative advantage will be in activities
that make intensive use of the country’s relatively abundant factor(s) of production. For example,
the United States has a relative abundance of high-skilled labor and a relative scarcity of low-
skilled labor. Therefore, the United States’ comparative advantage will be in goods produced
using high-skilled labor intensively such as aircraft, and comparative disadvantage will be in
goods produced using low-skilled labor intensively such as apparel. In addition to differences in
factor endowments, differences in productive technology among countries create differences in
relative efficiency and may be a basis for comparative advantage. Nevertheless, some high skilled
services jobs, such as computer programming and graphic design, can today be easily done in a
country such as India because of the revolution in telecommunications.
4. Can governments shape or distort comparative advantage?
Government actions to influence comparative advantage can be grouped in two broad categories:
policies that indirectly nurture comparative advantage, most often by compensating for some
form of market failure, but not targeted at any specific industry or activity; and policies that aim
to directly create and nurture comparative advantage in particular industries. Indirect influence on
comparative advantage can emanate from government policies that eliminate corruption, enforce
property rights, remove unnecessary impediments to domestic market transactions, liberalize
trade and foreign investment barriers, assure macroeconomic stability, build transport and
communication infrastructure, support mass education, and assist technological advance. Policies
that try to exert a direct influence on comparative advantage may include policies to promote and
protect certain industries (such as through subsidies or trade protection) that are thought to have
significant economic potential. In this view, realizing that potential requires initial government
support to help a country obtain its economic targets.3 Some economists contend that direct
government policies may often distort a country’s trade and investment flows, reduce economic
efficiency, undermine more economically competitive industries that do not receive government
help, and diminish potential economic growth.
5. What is the terms of trade?
A nation’s terms of trade—the ratio of an index of export prices to an index of import prices—is a
measure of the export cost of acquiring desired imports. Increases and decreases in its terms of
trade indicate whether a nation’s gains from trade are rising or falling. A sustained improvement
in the terms of trade expands what a nation’s income will buy on the world market and can make
a significant contribution to the long-term growth of its economic welfare. When that occurs, a
3 This is based on the belief that only the government can marshal the large level of financial resources needed to
promote the development of targeted industries and that once a certain level of development is obtained, the
government role in the economy can be reduced and the role of the private markets will expand.

U.S. Trade Concepts, Performance, and Policy: Frequently Asked Questions
Congressional Research Service 3
nation’s economy as a whole is often said to have become more globally competitive.4 Similarly,
a falling terms of trade raises the export cost of acquiring imports, which reduces real income and
the domestic living standard. Although trade is considered a process of mutual benefit, each
trading partner’s share of those benefits can change over time, and movement of the terms of
trade is an indicator of that changing share.
Trade and Jobs
6. What are the costs of trade expansion?
Like technological change and other market forces, international trade creates wealth by inducing
a reallocation of the economy’s scarce resources (capital and labor) into relatively more efficient
industries that have a comparative advantage and away from less efficient activities that have a
comparative disadvantage. This reallocation of economic resources is often characterized as a
process of “creative destruction,” generating a net economic gain to the overall economy, but also
being disruptive and costly to workers in adversely affected industries that compete with imports.
Many of these displaced workers bear significant adjustment costs and may find work only at a
lower wage. Although economic analysis almost always indicates that the economy-wide gains
from trade exceed the costs, the perennially tough policy issue is how or whether to secure those
gains for the wider community while dealing equitably with those who are hurt by the process.
Economists generally argue that facilitating the adjustment and compensating for the losses of
those harmed by market forces, including trade, is economically less costly than policies to
protect workers and industries from the negative impacts of trade. While it is debatable how well
existing worker assistance policies have worked, funding is also a long-standing issue. A 2008
study by the Peterson Institute for International Economics, for example, estimated the lifetime
costs of worker displacement that were triggered by expanded trade in 2003 to be as high as $54
billion, but calculated that the United States spent less than $2 billion that year to address the
costs for workers connected to that displacement.5
7. Does trade “destroy” jobs?
Trade “creates” and “destroys” jobs in the economy just as other market forces do. Economy-
wide, trade creates jobs in industries that have a growing comparative advantage and destroys
jobs in industries that have a growing comparative disadvantage. In the process, the economy’s
composition of employment changes, but there may not be a net loss of jobs due to trade.
Consider that over the course of the rapid economic expansion that occurred from 1992 to 2000,
U.S. imports increased nearly 240%, but total employment grew by 22 million jobs and the
unemployment rate fell from 7.5% to 4.0% (the lowest unemployment rate in more than 30
years). From 2001 to 2007 (before the global financial crisis), U.S. employment grew by 7.1
million jobs, the unemployment rate dropped from 4.7% to 4.6%, while U.S. imports over the
period increased by 70.8%. From 2007 to 2010, the U.S. unemployment rate rose to 9.6%,
employment fell by 7 million, but U.S. imports declined by 2.0%. In times of economic hardship,
when unemployment is high, governments will sometimes try to stimulate some domestic
industries by protecting them from foreign competition. However, such measures are unlikely to
increase total employment and could be costly.6 The near-term cost can be an exacerbation of
4 It is important to note that economic competition does not occur between nations, but rather, between the industries of
those nations. 5 Peterson Institute for International Economics, Answering the Critics: Summary, by Gary C. Hufbauer, January 2008,
available at http://www.iie.com/publications/papers/print.cfm?ResearchId=948&doc=pub. 6 For example, protectionist measures placed on foreign steel imports (such as quotas and higher tariffs) might provide
(continued...)

U.S. Trade Concepts, Performance, and Policy: Frequently Asked Questions
Congressional Research Service 4
weakness in the economy as foreign governments may retaliate with their own protective
measures, causing a decline in exports. In the long run, trade protection may tend to reallocate
employment from unprotected domestic industries toward protected domestic industries, but not
increase total employment. However, more than just a transfer of well-being between sectors
occurs, as there will be a permanent cost to the whole economy arising from the less efficient
allocation of these resources.
8. Does trade reduce the wages of U.S. workers?
International trade can have strong effects, good and bad, on the wages of American workers.
Concurrent with the large expansion of trade over the past 25 years, real wages (i.e., inflation
adjusted wages) of American workers grew more slowly than in the earlier post-war period, and
inequality of wages between the skilled and less skilled worker rose sharply. Trade based on
comparative advantage tends to increase the return to the abundant factors of production—capital
and high-skilled workers in the United States—and decrease the return to the less-abundant
factor—low-skilled labor in the United States.7 Therefore, it is reasonable to expect that, other
factors constant, a large increase in imports, particularly from economies with vast supplies of
low-skilled labor (such as China), could negatively affect the wages of low-skilled U.S. workers
in import-sensitive industries. U.S. low-skilled workers have increasingly faced competition from
lower-cost producers, largely in developing countries. In many instances, economic globalization
(discussed below) has led U.S. multinational firms to source a significant share of their labor-
intensive production to lower-wage countries, which, to some extent, has put downward pressure
on the wages of U.S. workers in some import-sensitive industries. On the other hand, U.S.
workers in export-oriented industries on average are estimated to earn more than workers in non-
exporting industries.8 Overall, the evidence on whether or not trade has contributed to growing
income inequality in the United States is mixed and inconclusive.9 This is due in part because a
number of other factors, such as advancing technology (where the jobs that are generated may
require more advanced skills and higher education than was required in the past), may have had a
significantly larger impact on relative wages than foreign trade. For this reason, many economists
contend that the United States should implement policies that seek to enhance U.S. education and
skill levels to better enable U.S. workers to respond more effectively to the rapidly changing
nature of the global economy as well as technological advancements.10
(...continued)
short-term relief for steel firms and workers. However, such policies could boost overall prices for steel, which would
drive up cost for steel-users (such as auto producers) and subsequently reduce production levels and employment in
those industries. In addition, costs for consumers would rise, reducing their demand for goods and services. 7 In 2010, for example, the percent of the U.S. population that had completed some form of tertiary education (e.g.,
college) was 26.8% compared to 2.7% of the Chinese population. See Barro-Lee Educational Attainment Dataset, at
http://www.barrolee.com. 8 See the Brookings Institution, Export Nation: How U.S. Metros Lead National Export Growth and Boost
Competitiveness, by Emilia Istrate, Jonathan Rothwell, and Bruce Katz, July 2010, available at
http://www.brookings.edu/research/reports/2010/07/26-exports-istrate-rothwell-katz. 9 For a survey on the economic literature on this issue, see the World Bank and the International Labor Organization,
Making Globalization Socially Sustainable, September 2011, pp. 232-259; and the OECD, Divided We Stand: Why
Inequality Keeps Rising, Organization for Economic Cooperation and Development, 2011, pp, 21-45. The OECD study
concluded that “neither rising trade integration nor financial openness had a significant impact on either wage
inequality or employment trends within the OECD countries.” 10 A study by the Organization for Economic Cooperation and Development (OECD) estimated that a person with a
tertiary education can expect to earn over 79% more than a person with only an upper secondary education. A person
who has failed to obtain an upper secondary education in the United States can expect to earn only 64% of a high
school graduate’s earnings. See OECD Economic Indicators, Education at a Glance 2011, Country Note—United
(continued...)

U.S. Trade Concepts, Performance, and Policy: Frequently Asked Questions
Congressional Research Service 5
Economic Globalization
9. What is intra-industry trade?
A sizable portion of world trade sees countries exporting and importing goods from the same
industry to each other. This phenomenon is called intra-industry trade. This type of trade is
particularly characteristic of the large flows of products between advanced economies, which
have very similar resource endowments. This suggests that there is another basis for trade than
comparative advantage behind intra-industry trade: the use of economies of scale. Economies of
scale exist when a production process is more efficient (i.e., has lower unit costs) the larger the
scale at which it takes place. This scale economy becomes a basis for trade because while the
United States and Germany, for example, could be equally proficient at producing any of a wide
array of goods such as automobiles and pharmaceuticals that consumers want, neither has the
productive capacity to produce the full range of goods at the optimal scale. Therefore, a pattern of
specialization tends to occur with countries producing and trading some sub-set of these goods at
the optimal scale.
10. What is economic globalization?
Globalization has come to represent many things. In general, economic globalization refers
specifically to the increasing integration of national economies into a worldwide trading system.
Economic globalization involves trade in goods and services, and trade in assets (i.e., currency,
stocks, bonds, and real property), as well as the transfer of technology, and the international flows
(migration) of labor. Since 1950, global trade has consistently grown faster than world
production. For example, from 1980 to 2014, global exports of goods and services grew at an
average annual rate of 5.4% compared to average annual global GDP growth of about 3.5%.11
In
addition, global exports as a percent of world GDP over this period rose from 20.9% to 31.3%.
These data indicate that trade has been a driving force in the global economy.
Global integration in the United States (discussed in more detail in the next section) has advanced
quickly, with imports of goods and services as a share of GDP rising from 4.3% in 1950 to about
16.5% in 2014.12
More recent but far more dramatic has been the growth of international trade in
assets. From 1990 to 2007 (before the 2008 global financial crisis hit), gross capital flows to and
from the United States leaped by 1,495% as compared to a 248% advance of U.S. trade in goods
and services. The rising economic integration of the world economy has been facilitated by two
types of events: the myriad of technical advances in transport and communication, which have
reduced the natural barriers of time and space that separate national economies, and national and
multi-national policy actions that have steadily lowered various man-made barriers (i.e., tariffs,
quotas, subsidies, and capital controls) to international exchange.
11. What are global supply chains and how do they relate to economic globalization?
A supply chain is the interrelated organizations, resources, and processes that create and deliver a
product to the final consumer. A global supply chain organized mostly by multinational
corporations (MNCs) means that products that were once produced in one country may now be
produced by assembling components fabricated in several countries. To illustrate, the WTO
estimates that in 2011, intermediate manufactured products accounted for 55% of global non-fuel
(...continued)
States, September 13, 2011, p. 3, available at http://www.oecd.org/unitedstates/48685294.pdf. 11 See International Monetary Fund, World Economic Outlook Database, April 2015. 12 Council of Economic Advisers, Economic Report of the President and the Economist Intelligence Unit.

U.S. Trade Concepts, Performance, and Policy: Frequently Asked Questions
Congressional Research Service 6
trade,13
and that on average about 26% of the value of national exports in 2008 included foreign
content in the form of imported inputs used to produce these exports.14
Not only does such
geographically fragmented production raise the level of trade associated with a particular final
product, it also tends to raise the level of trade with both developing countries and developed
countries. The expansion of global supply chains (in both value terms and as a percent of total
global trade) has facilitated lower trade barriers and technological advances that have increased
the speed and lowered the cost of international transport and, perhaps most importantly,
accelerated the international flow of information that allows firms to coordinate geographically
fragmented production with relative ease. (The effect of globalization on U.S. trade flows are
discussed in the section on U.S. trade performance.)
Global supply chains present both challenges and opportunities for U.S. small- and medium-sized
enterprises (SMEs). On the one hand, SMEs face increased foreign competition because of
globalization. At the same time, SMEs have gained business opportunities by the increase in
outsourcing by U.S. and foreign MNCs. According to one study, U.S. SMEs accounted for 28%
of U.S. direct exports in 2007. However, this figure rises to 41% when the value of U.S. SME
sales to large U.S. exporting firms is included.15
12. How does globalization affect job security?
A greater degree of international economic integration and specialization can add to disruptive
forces in the marketplace, including concerns that over time high-wage and high-skilled U.S.
service sector jobs may now be vulnerable to “outsourcing” (i.e., shifting business functions from
the United States to countries with lower labor costs). Although most economists maintain that
globalization is unlikely to have a negative effect on overall U.S. employment rate or the average
U.S. worker wage, greater volatility of U.S. worker incomes and employment in some sectors is a
possible effect. For example, some U.S. MNCs have focused on performing high-end activities
associated with innovating products such as research and development (R&D), while outsourcing
component production and final product assembly to numerous overseas suppliers. Such activities
may reduce the number of U.S. manufacturing jobs in some industries, but boost the number of
service-related jobs in other industries. Some contend that globalization has increased volatility in
employment and earnings for many U.S. workers and argue that trade adjustment assistance
programs should be expanded to assist individuals negatively impacted by imports in order to
help them more rapidly obtain employment in other sectors. Others contend that a broader
challenge for the United States is to implement policies that promote a highly educated and
skilled work force and boost domestic innovation in order to help the U.S. labor force to respond
more quickly to the challenges and opportunities presents by the globalization process.
13 The value of global exports of non-fuel intermediate goods was over $7.7 trillion. 14 WTO, International Trade Statistics, 2013, p. 5. 15 OECD, WTO, and World Bank, Global Value Chains, Challenges, Opportunities, and Implications for Policy, July
18, 2014, p. 22.

U.S. Trade Concepts, Performance, and Policy: Frequently Asked Questions
Congressional Research Service 7
U.S. Trade Performance16
The U.S. Role in the World Economy
13. Which are the largest global trading economies?
The largest trading economies for total trade in goods and services in 2014 were the United
States, China, Germany, Japan, United Kingdom and France. China was the largest exporter of
goods and services, while the United States was the largest importer (see Table 1). In terms of the
largest merchandise trading economies in 2014, the top five were China, the United States,
Germany, Japan, France, and the Netherlands. The United States was the largest merchandise
importer and the second-largest merchandise exporter.17
While the United States is a major global
trader, the size of that trade relative to the size of the U.S. economy is much smaller than that of
other major trading economies. U.S. exports and imports of goods and services as a percent of
GDP in 2015 were 28.1%. This compares with 37.2% for Japan, 39.3% for China, 56.39% for
United Kingdom, and 83.5% for Germany.18
The U.S. share of global merchandise exports has changed significantly over the past five decades
or so, due largely to the rapid increase of global trade, especially among developing countries.19
The U.S. share of global merchandise exports over this period was as follows: 15.1% in 1960,
13.6% in 1970, 11.1% in 1980, 11.3% in 1990, 12.1% in 2000, 8.4% in 2010, and 8.8% in 2014.20
Table 1. Largest Global Trading Economies Based on Total Trade in Goods and
Services (G&S): 2015
(in billions of U.S. dollars)
Exports of
G&S
Imports of
G&S
Total Trade in
G&S
Total Trade as a %
of GDP
United States 2,253 2,785 5,038 28.1%
China 2,390 1,939 4,329 39.4%
Germany 1,517 1,273 2,790 83.6%
Japan 748 789 1,573 37.2%
United Kingdom 783 836 1,619 56.9%
Source: Economist Intelligence Unit.
Various organizations have developed indexes to assess the “openness” or “competitiveness” of
the U.S. economy relative to other global economies. For example, the Heritage Foundation
16 This section was updated by Wayne M. Morrison, Specialist in Asian Trade and Finance, Foreign Affairs, Defense,
and Trade Division. 17 If the 28 countries of the EU were treated as a single trading bloc, it would be the largest global trading economy for
total trade in goods and services (including the biggest exporter and importer). In terms of merchandise trade, the EU
would be the largest trading economy, trade, largest exporter, and second-largest importer (after the United States). 18 The Economist Intelligence Unit database. 19 The decline in the U.S. share of global merchandise exports may also be a reflection of the growing importance of
U.S. exports of services relative to U.S. merchandise exports. For example in 1980, services accounted for 17.9% of
U.S. global exports of goods and services, while in 2014 this figure was 30.9% (Source: Bureau of Economic
Analysis). 20 Historical data on global trade in services are limited.

U.S. Trade Concepts, Performance, and Policy: Frequently Asked Questions
Congressional Research Service 8
publishes an “Index of Economic Freedom.”21
Its 2014 report ranked the United States as the 12th
“freest” economy out of 186 economies (Hong Kong, Singapore, New Zealand, Australia,
Switzerland ranked as the top 5).22
Similarly, the World Economic Forum (WEF) produces an
annual “Global Competitiveness Index.”23
The WEF’s 2014-2015 report ranked the United States
third (up from fifth from the 2013-2014 report) after Switzerland and Singapore.24
The U.S. Trade Deficit
14. What is meant by the trade deficit?
A trade deficit occurs when a country’s imports are greater than its exports. There are various
measurements of the U.S. trade deficit. In general, most media reports on the U.S. trade deficit
refer to the balance of U.S. trade in goods (merchandise). In 2015, the U.S. merchandise trade
deficit was $759.3 billion, down from a peak of $816 billion in 2006. However, a large and
growing level of U.S. trade is in services, where the United States usually runs large annual
surpluses. In 2015, that surplus was $219.6 billion.25
By adding net exports of services to the
calculation, the U.S. trade deficit on goods and services was $464 billion in 2014.26
Further
adding in net transfer payments (such as investment income and dividends) and net transfer
payments (such as foreign aid) gives the broadest measure of a nation’s trade balance—the
current account balance. In 2015, the United States recorded a $484.1 billion current account
deficit, down from its historic peak of $807 billion in 2006 (see Table 2). The decline in the U.S.
trade deficit was largely caused by two major factors: the global economic crisis (which, for
example, significantly reduced U.S. demand for imports) and a decline in U.S. oil imports.
Table 2. U.S. Merchandise Trade and Current Account Trade: 2005-2015
(in billions of U.S. dollars)
Year
Census Basis Current Account Basis
Exports Imports
Merchandise Balance
Exports of G&S
Imports of G&S
Balance on Primary and
Secondary
Income27
Current Account
Balance
2005 904.4 1,670.9 -776.5 1,286.0 2,000.3 -31.2 -745.5
2006 1,037.1 1,855.1 -818.0 1,457.6 2,219.4 -45.0 -806.7
21 The index is based on assessments of the rule of law, limited government, regulatory efficiency, and open markets. 22 The Heritage Foundation, 2014 Index of Economic Freedom, available at http://www.heritage.org/index. 23 The WEF defines competitiveness as “the set of institutions, policies and factors that determine the level of
productivity of a country.” Its global competitive index scores are calculated by analyzing country-level data covering
12 categories, including institutions, infrastructure, macroeconomic environment, health and primary education, higher
education and training, goods market efficiency, labor market efficiency, financial market development, technological
readiness, market size, business sophistication and innovation. 24 World Economic Forum, Global Competitiveness Report 2014-2015, available at http://www.weforum.org/issues/
global-competitiveness. 25 U.S. exports and imports of services in 2015 were $710 billion and $491 billion, respectively. 26 Bureau of Economic Analysis. 27 Secondary income (current transfer) receipts and payments include U.S. government and private transfers, such as
U.S. government grants and pensions, fines and penalties, withholding taxes, personal transfers (remittances),
insurance-related transfers, and other current transfers.

U.S. Trade Concepts, Performance, and Policy: Frequently Asked Questions
Congressional Research Service 9
Year
Census Basis Current Account Basis
Exports Imports Merchandise
Balance Exports of G&S
Imports of G&S
Balance on Primary and
Secondary
Income27
Current Account
Balance
2007 1,1162.7 1,953.7 -821.0 1,653.5 2,358.9 -13.3 -718.6
2008 1,300.1 2,100.1 -800.0 1,841.6 2,550.3 17.9 -690.8
2009 1,056.9 1,557.9 -501.0 1,583.1 1,966.8 -0.2 -384.0
2010 1,278.5 1,913.9 -635.4 1,853.6 2,348.3 52.7 -442.0
2011 1,482.5 2.208.0 -725.5 2,127.0 2,675.6 88.3 -460.4
2012 1,545.8 2,276.3 -730.5 2,216.5 2,754.1 87.1 -450.0
2013 1,578.4 2,268.4 -690.0 2,280.2 2,756.6 101.6 -376.8
2014 1,620.5 2,347.7 -727.2 2,849.2 2,851.5 118.8 -389.5
2015 1,504.6 2,241.7 -737.1 2,236.2 2,763.4 55.7 -484.1
Source: U.S. Department of Commerce, U.S. International Trade Commission and the U.S. Bureau of Economic
Analysis.
Note: Data may not add up due to rounding.
15. Why does the United States run a trade deficit?
The most significant cause of the U.S. trade deficit is the low rate of U.S. domestic savings
relative to its investment needs. In order to make up for that shortfall, Americans must borrow
from countries abroad (such as China) with excess savings.28
Such borrowing enables Americans
to enjoy a higher rate of economic growth than would be obtained if the United States had to rely
sole on domestic savings.29
This in turn boosts U.S. consumption and the demand for imports,
producing a trade deficit.30
The U.S. trade deficit is an indicator that Americans consume more
than they produce. As long as foreigners (both governments and private entities) are willing to
loan the United States the funds to finance the lack of savings in the U.S. economy (such as by
buying U.S. Treasury securities), the trade deficit can continue. The United States, however,
accumulates more debt.31
As of March 2014, the U.S. public debt was $18.2 trillion, up from
$7.1 trillion in March 2004.32
28 This occurs, for example, when households buy on credit, businesses invest with borrowed funds, and the federal
government runs budget deficits. 29 U.S. gross national savings as a percent of GDP is among the lowest of any major global economy. If the United
States could only draw from domestic savings to fund domestic investment demand, real interest rates (and the costs of
borrowing) would likely increase significantly, which could negatively affect U.S. economic growth in the short run. 30 There are a number of other factors that also can affect the size of the U.S. trade deficit in the short run. For example,
falling oil prices can reduce the cost of oil imports and thus reduce the value of total U.S. imports. Differences in
economic growth between countries can affect trade balances as well. For example, more rapid economic growth in the
United States relative to its major trading partners could cause U.S. imports to rise faster than its exports, thus
increasing the size of the U.S. trade deficit. 31 If for some reason foreign investors lost faith in the U.S. economy, they might stop investing in the United States
and/or sell their holdings of U.S. assets. The United States would have to rely more on domestic savings, which could
cause U.S. interest rates to rise and lower U.S. GDP growth. 32 As of June 2015, foreigners held 34.1% of the total public U.S. debt and 58.2% of the amount of the U.S. public debt
that is privately held. “Treasury Bulletin.” Bureau of the Fiscal Service – U.S. Department of the Treasury, current
issue June 2015 https://www.fiscal.treasury.gov/fsreports/rpt/treasBulletin/current.htm.
U.S. Trade Concepts, Performance, and Policy: Frequently Asked Questions
Congressional Research Service 10
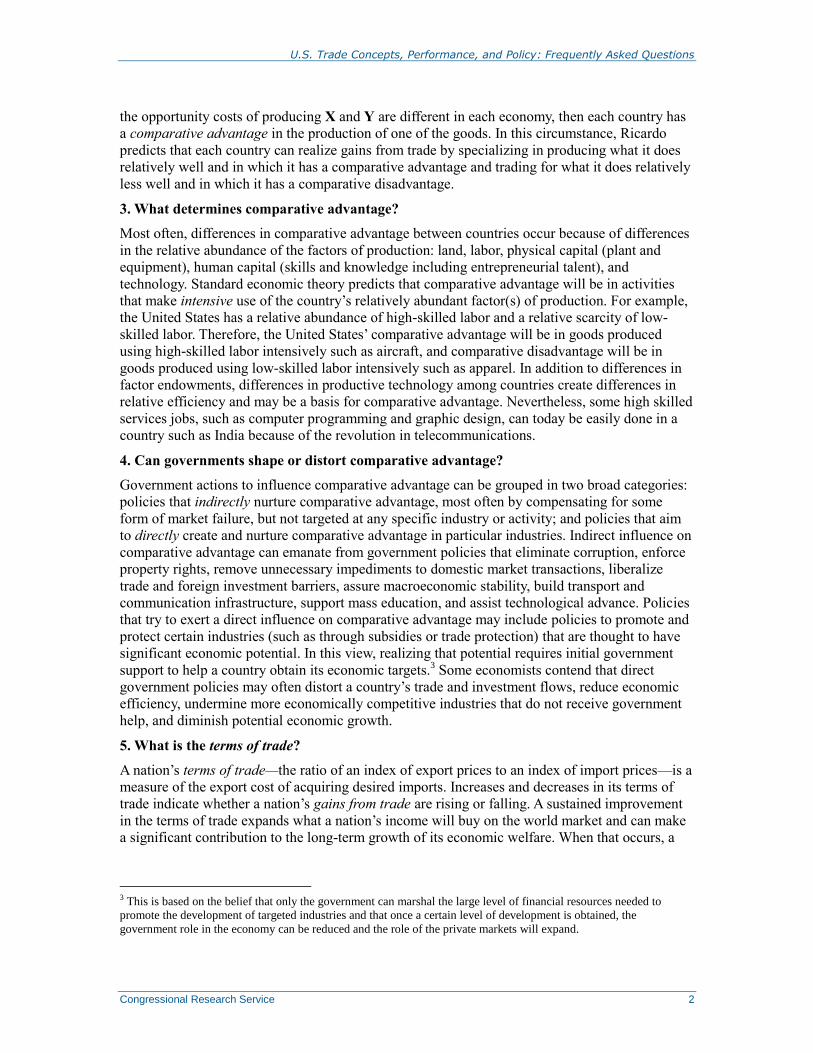
16. How significant is the size of the U.S. trade deficit and how does it compare with other
major economies?
Economists often look at the size of the U.S. trade deficit relative to the size of the U.S. economy
(gross domestic product, or GDP). This measurement is particularly useful in examining trends
over time or comparing U.S. data with those of other countries. As can be seen in Figure 1, the
U.S. balance on the current account relative to GDP deteriorated sharply from 1991 to 2006; it
reached a record high 5.8% of GDP in 2006. Since that time, the U.S. current deficit as a percent
of GDP has generally declined, due in large part to the effects of the global economic slowdown
that began around 2008.
Table 3 lists current account balances as a percent of GDP for the top 10 largest global economies
in 2014 (based on GDP on a purchasing power parity basis), along with data on the ratio of
domestic savings to total investment for each country.33
The countries with the largest current
account surpluses as a percent of GDP included Germany (8.0%), Russia (5.4%), and China
(2.7%). The largest economies with the biggest current account deficits as a percent of GDP
included the United Kingdom (4.7%), Brazil (3.3%) and the United States (2.5%).
Figure 1. U.S. Current Account Balance as a Percent of GDP: 1990-2015
(percent)
Source: Economist Intelligence Unit and International Monetary Fund.
33 A ratio of over 100 indicates countries that save more than they need for domestic investment, which makes them a
net global lender, and thus, such countries typically run current account surpluses. A ratio of below 100 indicates
countries that do not save enough to meet their investment needs. Such countries are net borrowers and typically run
current account deficits.

U.S. Trade Concepts, Performance, and Policy: Frequently Asked Questions
Congressional Research Service 11
Table 3. The Ratio of National Savings to Total Investment and Current Account
Balances as a Percent of GDP for Major Economies in 2015
(percent)
Domestic Savings/Investment Ratio Current Account Balance/GDP
Germany 141.5 8.0
Russia 135.6 5.4
Japan 115.1 3.3
China 106.1 2.7
France 99.5 -0.4
India 96.9 -1.0
United States 88.7 -1.9
Mexico 88.2 -2.5
Brazil 81.2 -3.3
United Kingdom 73.1 -4.7
Source: Economist Intelligence Unit.
Note: Countries are ranked according to the ratio of domestic savings to investment in 2013.
17. What role do foreign trade barriers play in causing bilateral trade deficits?
Some policymakers view the size of the U.S. trade deficit with certain countries (such as China,
where the U.S. merchandise trade deficit totaled $343 billion in 2014—by far the largest U.S.
bilateral trade imbalance) as an indicator that the trade relationship is “unfair” and the result of
distortive policies, such as subsidies, trade barriers, currency intervention, discriminatory
regulations, investment restrictions, and failure to establish an effective mechanism for protecting
intellectual property rights (IPR)—to name a few. Such policies tend to affect bilateral trade in
specific products and with particular countries and can negatively affect the profitability of U.S.
exporters and overseas investors. To some extent, such policies may also affect bilateral trade
balances, but do not necessarily affect the size of the overall (global) U.S. trade deficit, which, as
noted earlier, is largely a reflection of the level of U.S. savings. If distortive measures were
reduced in certain countries, U.S. exporters would sell more of their products to them. But if U.S.
consumption/savings behavior did not change, an increase in U.S. exports would likely result in
an increased demand for imports, and the overall U.S. trade deficit would likely remain relatively
unchanged (all things being equal). Similarly, the reduction of distortive trade policies in one
country might raise manufacturing costs to such an extent as to cause firms to move production to
another country. As a result, U.S. imports from the first country would fall, while imports from
the second country would rise. This would lower the U.S. trade deficit with the first country and
increase it with the other, and the overall U.S. trade deficit would be relatively unchanged.
18. How does the trade deficit affect the exchange value of the dollar?
Without sufficient inflows of capital, a trade deficit causes other parts of the economy to adjust,
particularly the country’s exchange rate—for the United States, this is the value of the dollar
relative to that of the Japanese yen, Canadian dollar, British pound, or European euro. The way
the adjustment mechanism works is that the excess of U.S. imports causes a surplus of U.S.
dollars to flow abroad. If these dollars are then converted to other national currencies, the dollar’s
excess supply tends to lower the price of the dollar relative to other currencies (exchange rate),
and the value of the dollar depreciates. This causes imports to be more expensive for American

U.S. Trade Concepts, Performance, and Policy: Frequently Asked Questions
Congressional Research Service 12
consumers and U.S. exports to be cheaper for foreign buyers. This process will gradually cause
U.S. imports to decrease and exports to increase, thereby decreasing the trade deficit.
Foreign holders of U.S. dollars may not always exchange them for other currencies because the
dollar holds a special status in global financial markets and because the U.S. economy is viewed
both as a safe haven for storing wealth and as an attractive destination for investments. In some
countries, the dollar is used as a medium of exchange, and in most countries it is used as a reserve
currency by central banks. Foreign governments can intervene to keep the value of their currency
from appreciating relative to the dollar by buying dollars and essentially sending them back to the
United States through purchasing U.S. Treasury securities or other U.S. assets. China, for
example, has been doing this since 1994, and, as a result, it has become the largest foreign holder
of U.S. Treasury securities (at nearly $1.3 trillion as of March 2015) and the largest holder of
foreign exchange reserves (at $37.3 trillion as of July 2014). Efforts by Japan in recent years to
boost economic growth by expanding its money supply have led some critics to charge that such
policies are largely aimed at depreciating the yen in order to boost Japanese exports.
Some analysts contend that several countries have intervened in currency markets to hold down
the value of their currencies and that this has hampered, to some extent, the realignment of global
trade balances, which in turn has negatively affected the U.S. economy. For example, a July 2012
study by the Peterson Institute for International Economics contends that “currency
manipulation,” based on “excessive” levels of foreign exchange reserves (FERs), is widespread,
especially in developing and newly industrialized countries. The study identified 22 economies
that “manipulate their currency” based on the size of their FERs as a percent of GDP and the
cumulative increase in FERs as a percent of GDP in 2012, the most significant of which were
China, Denmark, Hong Kong, South Korea, Malaysia, Singapore, Switzerland, and Taiwan. The
Peterson Institute estimated that currency intervention by the 22 economies increased the U.S.
current account trade deficit by $200 billion to $500 billion and caused the loss of 1 million to 5
million U.S. jobs.34
19. How is the trade deficit financed?
The U.S. trade deficit is financed by borrowing from abroad. This takes the form of net financial
inflows into the United States (which is reflected in the U.S. current account data). In 2013, U.S.
net financial inflows amounted to $93 billion. Foreigners acquired $906 billion in assets in the
United States (excluding financial derivatives), while Americans acquired $553 billion in assets
abroad. Within these totals, foreigners purchased an additional $141.8 billion in Treasury
securities and $44 billion in other government securities. Foreigners also invested $193 billion in
their companies located in the United States.35
20. Is the trade deficit a problem for the U.S. economy?
Many economists view the U.S. trade deficit as a dual problem for the economy. In the long term,
it generates debt that must be repaid by future generations. Meanwhile, the current generation
must pay interest on that debt. Whether the current borrowing to finance imports is worthwhile
for Americans depends on whether those funds are used for investment that raises future
standards of living or whether they are used for current consumption. If American consumers,
business, and government are borrowing to finance new technology, equipment, or other
productivity-enhancing products, the borrowing results in a deficit and can be paid off because
34 Peterson Institute for International Economics, Currency Manipulation, the US Economy, and the Global Economic
Order, by C. Fred Bergsten and Joseph E. Gagnon, December 2012. 35 These data are reported by the U.S. Bureau of Economic Affairs, U.S. International Transactions.

U.S. Trade Concepts, Performance, and Policy: Frequently Asked Questions
Congressional Research Service 13
such investments will boost the level of economic growth in the long run. If the borrowing is to
finance consumer purchases of clothes, household electronics, or luxury items, it pushes the
repayment of funds for current consumption on to future generations without investments to raise
their ability to finance those repayments, which implies that in the future, consumption levels will
have to fall in order to pay for the debt, which lowers future economic growth. Some economists
warn that, under certain circumstances, a continually rising U.S. trade deficit could spark a large
and sudden fall in the value of the dollar and financial turmoil in both the United States and
abroad.36
The U.S. current account deficit as a percent of GDP reached a peak of 5.8% in 2006 and has
fallen significantly since, declining to 2.4% in 2014, although much of that decline was the result
of the effects of the global economic slowdown.37
Although the U.S. economy has not yet fully
recovered to pre-crisis levels, foreign investors continue to look to the United States as a safe
haven for their money. As a result, the U.S. Treasury has had no problem selling securities to fund
the U.S. budget deficit. Eventually, however, if foreign investors stop offsetting the trade deficit
by buying dollar-denominated assets, U.S. interest rates would have to rise to attract more foreign
funds into U.S. investments. Rising interest rates could cause a crisis in financial markets and
may also raise inflationary pressures. Since global financial markets are now so closely
intertwined, turmoil in one market can quickly spread to other markets in the world.
21. How long can the United States keep running trade deficits?
U.S. deficits in trade can continue for as long as foreign investors are willing to buy and hold U.S.
assets, particularly government securities and other financial assets.38
Their willingness depends
on a complicated array of factors, including the perception of the United States as a safe haven for
capital, relative rates of return on investments, interest rates on U.S. financial assets, actions by
foreign central banks, and the savings and investment decisions of businesses, governments, and
households. The policy levers that influence these factors that affect the trade deficit are held by
the Federal Reserve (interest rates) as well as both Congress and the Administration (government
budget deficits and trade policy), and their counterpart institutions abroad.
22. How can the trade deficit be further reduced?
In reducing the U.S. trade deficit, the policy tool kit includes direct measures (trade policy) that
are aimed at imports, exports, and the exchange rate, and indirect measures (monetary and fiscal
policies) aimed at U.S. interest rates, saving rates, budget deficits, and capital flows. Monetary
and fiscal policies, however, usually address conditions in the U.S. macro-economy and generally
consider the trade deficit only as a secondary target.
Understanding Data on U.S. Trade and the Economy
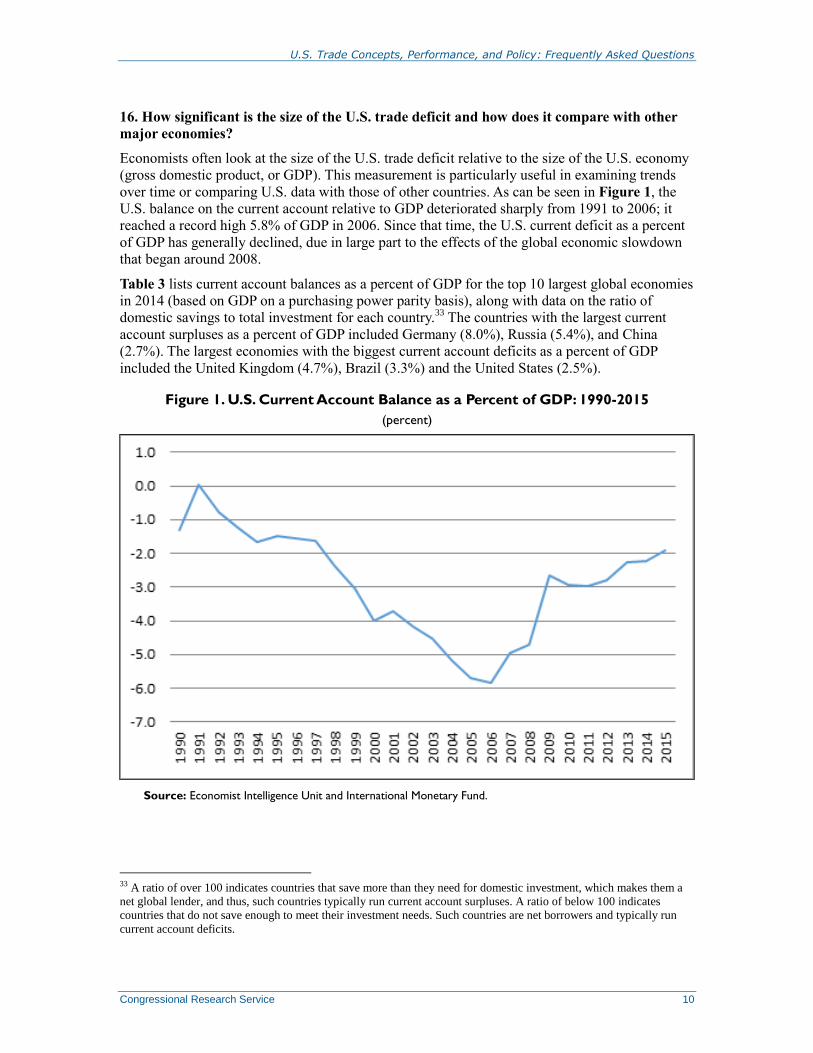
23. How important is trade to the U.S. economy?
As indicated in Figure 2, the level of U.S. trade in goods in services relative to GDP has risen
markedly over the past three decades. U.S. exports of goods and services as a percent of GDP
36 See for example, the Peterson Institute for International Economics, The Dollar and the Deficits: How Washington
Can Prevent the Next Crisis, by C. Fred Bergsten, November 2009, available at http://www.iie.com/publications/
papers/paper.cfm?ResearchID=1312. 37 International Monetary Fund, World Economic Outlook database, October 2014. 38 See Mann, Catherine L. Is the U.S. Trade Deficit Sustainable? Washington, Institute for International Economics,
1999. 224 pp. See also CRS Report RL33274, Financing the U.S. Trade Deficit, by James K. Jackson.
U.S. Trade Concepts, Performance, and Policy: Frequently Asked Questions
Congressional Research Service 14
rose from 9.8% in 1980 to 12.6% in 2015, while imports of goods and services increased from
10.3% to 15.5%. According to the U.S. Department of Commerce, in 2014, U.S. exports
“supported” 11.7 million jobs in the United States, which was 53.9% higher than 1993 levels.39
Figure 2. U.S. Exports and Imports of Goods and Services as a Percent of GDP:
1980-2015
(percent)
Source: Economist Intelligence Unit, based on data by the U.S. Bureau of Economic Analysis.
24. Who are the leading U.S. trade partners?
As shown in Table 4, in 2014, Canada was America’s largest merchandise trading partner,
followed by China, Mexico, and Japan. China was the largest source of U.S. imports, followed by
Canada, Mexico, and Japan. Canada was the largest destination of U.S. exports, followed by
Mexico, China, and Japan.
39 Commerce uses the term “supported” rather the term “created” because exports constitute one category of U.S. GDP,
which can expand or contract like other sectors of the economy. Jobs are gained and lost in various sectors, even when
the United States is at full employment. And when the U.S. economy is at less than full employment, the government
can use fiscal and monetary policy to boost economic growth in order to boost employment. In any given year, a
significant level of a company’s product could be exported. The aggregate demand coming from abroad helps support a
certain level of employment at the company. In some years, foreign demand may contract, leading to a decline in
exports. The company might respond by attempting to boost sales domestically. If that cannot be done, some workers
may be laid off, and some of these would seek employment in other sectors of the economy.

U.S. Trade Concepts, Performance, and Policy: Frequently Asked Questions
Congressional Research Service 15
Table 4. Top U.S. Trading Partners Ranked by Total Merchandise Trade, 2015
(in billions of U.S. dollars)
Rank Country Total trade U.S. Exports U.S. Imports U.S. Balance
World 3,746 1,505 2,241 -736
1 China 598 116 482 -365
2 Canada 576 280 295 -15
3 Mexico 531 236 295 -58
4 Japan 194 63 131 -69
5 Germany 174 50 124 -74
6 South Korea 115 44 72 -28
7 United Kingdom 114 56 58 -1.4
8 France 78 30 48 -18
9 Taiwan 67 26 41 -15
10 India 66 22 45 -23
Source: Data from U.S. Department of Commerce, as reported by U.S. Census Bureau
Note: Totals may not add up due to rounding.
25. How does economic globalization “complicate” interpretation of U.S. trade data?
Trade is becoming increasingly complex. In the past, companies tended to source most or all of
their production in one country, using inputs that were largely made domestically. Today, MNCs
produce worldwide, often using inputs that are sourced from the United States and worldwide.
China is a good example of this phenomenon. Since initiating free market reforms in 1979 and
opening up its economy to global trade and investment, China has emerged as a major center for
global supply chains. Because of China’s large pool of low-cost labor, many export-oriented
multinational corporations have moved production from other countries (primarily in Asia) to
China. In many cases, products that are “made in China” are actually products that are
“assembled in China,” using imported inputs (such as components) that are designed and
produced globally. The value added that occurs in China is often quite small relative to the total
value of the finished product when it is imported into the United States and elsewhere, and a
significant level of the profits from the sale of the product are estimated to accrue to the
multinational company that owns the brand.40
The rapidly changing nature of global supply chains has made it increasingly difficult to
understand and interpret the implications of trade data for the U.S. economy. To illustrate, when
the United States imports such products as iPhones and iPads, it attributes the full value of those
imports as occurring in China, even though the value added that occurred there is quite small.
Apple Inc., (the U.S. firm that developed these products) is the largest beneficiary in terms of the
profits generated by the sale of its products, and most of its product design, software
development, product management, marketing, and other high-wage functions and employment
occur in the United States.41
In other words, U.S. trade data may show where products are being
40 Chinese authorities report that nearly half of China’s exports and imports are conducted by foreign-invested firms
there. 41 Apple products, such as iPhones and iPads are developed in the United States, but are assembled in China using
imported components. One study estimates that the wages paid to Chinese assembly workers accounted for 1.8% of the
(continued...)

U.S. Trade Concepts, Performance, and Policy: Frequently Asked Questions
Congressional Research Service 16
imported from, but they often fail to reflect who ultimately benefits from that trade. In many
instances, U.S. imports from China are really imports from many countries. Yet, the full value of
the final imported product is attributed to China, which results in what one might consider to be
an inflated trade deficit figure. A joint study by the Organization for Economic Cooperation and
Development (OECD) and the WTO estimated that the U.S trade deficit with China would be
reduced by 25% in 2009 if bilateral trade flows were measured according to the value-added that
occurred in each country before it was exported.42
Additionally, one study estimated that 24.7%
of U.S. imports from Canada, and 39.8% of U.S. final merchandise imports from Mexico, consist
of value added from the United States.43
U.S. Manufacturing and Services
26. Is the U.S. manufacturing sector shrinking?
Media reports of factory closings and worker layoffs, and the plethora of labels indicating that
merchandise was made in China, Mexico, or any of a number of foreign countries, often reinforce
the perception that the U.S. manufacturing sector is shrinking. Two ways of examining this issue
are to look at U.S. manufacturing output and manufacturing employment. Such data paint a
mixed picture. To illustrate:
From 1987 to 2015, the value of real output by U.S. manufacturing increased by
83.1% (Figure 3).44
From 1980 to 2014, the value-added of U.S. manufacturing as a percent of GDP
fell from 20.5% to 12.0%, services grew from 56.0% to 68.5% of GDP (Figure
4).45
From 1987 to 2014, U.S. manufacturing became more efficient as labor
productivity (measured by output per hour) increased by 152.4% (Figure 3).46
U.S. employment in manufacturing peaked at 19.4 million in 1979, but fell to
12.3 million by 2015,47
while jobs in private services during this time increased
from 48.9 million to 100.3 million. In addition, U.S. employment in
manufacturing as a percent of total non-agricultural employment fell from 21.6%
in 1979 to 8.8% in 2014, while the level for private services grew from 54.3% to
70.5%.
(...continued)
value of an iPhone and 2.0% of the value of an iPad in 2010. Apple’s success is largely the result of its ability to
innovate, not manufacture. See Capturing Value in Global Networks: Apple’s iPad and iPhone, by Kenneth L.
Kraemer, Greg Linden, and Jason Dedrick, July 2011, available at http://pcic.merage.uci.edu/papers/2011/
Value_iPad_iPhone.pdf. 42 OECD/WTO Trade in value-Added (TIVA) Database: China, at http://www.oecd.org/sti/ind/TiVA%20China.pdf. 43 NBER Working Pater, Give Credit Where Credit is Due: Tracing Value Added in Global Production Chains,
September 2010, p. 32. 44 Real output peaked in 2007, fell sharply in 2008 and 2009, and rose each year from 2010 to 2013. Economic
Research Fed Reserves Bank of St. Louis “Manufacturing Sector: Real Output,” http://research.stlouisfed.org/fred2/
series/OUTMS#. 45 Bureau of Economic Analysis, Industry Data http://bea.gov/industry/gdpbyind_data.htm. 46 Bureau of Labor Statistics: Productivity. 47 Manufacturing employment fell to a low of 11.5 million in 2010. U.S. Council of Economic Advisors, the Economic
Report of the President 2016, Appendix B, Table B-14, p. 416.

U.S. Trade Concepts, Performance, and Policy: Frequently Asked Questions
Congressional Research Service 17
Business services employment within U.S. manufacturing has increased in recent
years, growing from 29.8% in 2002 to 32.6% of total U.S. manufacturing jobs in
2012; computer and electronic products had the largest increase, with business
services accounting for 67.2% of those manufacturing jobs in 2012.48
Figure 3. Real Manufacturing Output Index and Labor Productivity in U.S.
Manufacturing: 1987-2015
(2009=100)
Source: U.S. Bureau of Labor Statistics and Economic Research Fed Reserves Bank of St. Louis
Notes: Sharp decline of Real Output due to 2009 recession.
These data indicate that, while U.S. manufacturing output has increased, its importance relative to
the economy has declined. U.S. employment in manufacturing has declined in both the number of
workers and as a percent of non-agricultural employment. The decline in U.S. manufacturing
employment was likely partly caused by the increase in labor productivity (such as the
introduction of new technologies) as fewer workers are now needed for a given level of
production than were needed in the past. In addition, the jobs in the service sector increased
sharply, both in numbers and as a percent of non-agricultural employment. As noted earlier,
globalization may have impacted the U.S. manufacturing in some industries. Apple Inc. designs
its products in the United States but outsources most of its production to firms in China. Apple’s
main source of its profits stems from its ability to innovate new products and intellectual property
and engineering, not from the production of these products. In addition, many U.S. manufacturing
firms use imported inputs (such as parts) from low-wage countries in their production to lower
costs as part of global supply chain production. Also, from a statistical standpoint, some of the
48 Bureau of Labor Statistics, The Economic Effects of Significant U.S. Import Restraints, Eighth Update, 2013, p.19.

U.S. Trade Concepts, Performance, and Policy: Frequently Asked Questions
Congressional Research Service 18
“decline” in manufacturing may have resulted from reclassification of jobs in U.S. employment
data, that is, jobs that used be classified under manufacturing are now classified under services.
Manufacturing remains an important component of the U.S. economy. U.S. manufacturers are
estimated to perform 70% of all private-sector R&D and account for 60% of U.S. exports.49
According to the United Nations, in 2012, the United States ranked second after China in terms of
gross value added of manufacturing (i.e., the actual value of manufacturing that occurred in the
country, excluding inputs and raw materials used in production). The value for manufacturing in
China was $2.6 trillion versus $2.0 trillion for the United States.50
Figure 4. Manufacturing Value-Added as a percent of GDP: 1997-2014
(percent)
Source: Bureau of Economic Analysis, Industry Data.
Notes: Value added is equal to an industry’s gross output minus inputs.
27. What is trade in services, and how is it different from goods trade?
The term “services” refers to an expanding range of economic activities, such as audiovisual,
construction; computer and related services; energy; express delivery; e-commerce; financial,
professional; retail and wholesaling, transportation; tourism; and telecommunications. Services
account for a majority of U.S. economic activity—68% of U.S. gross domestic product (GDP)
and 80% of U.S. civilian employment. 51
Services are 30% of U.S. exports but, unlike trade in
49 Advanced Manufacturing National Program Office at http://www.manufacturing.gov/welcome.html. 50 United Nations, UNdata. 51 Office of the United States Trade Representative, https://ustr.gov/issue-areas/services-investment/services.
(continued...)

U.S. Trade Concepts, Performance, and Policy: Frequently Asked Questions
Congressional Research Service 19
goods, every year the United States exports more services than it imports. Surpluses in services
trade have partially offset U.S. trade deficits in goods trade.52
Services not only function as end-use products, but also act as the “lifeblood” of the rest of the
economy. For example, transportation services move intermediate products along global supply
chains and final products to consumers; telecommunications services open e-commerce channels;
and financial services provide credits for the manufacture and consumption of goods.
Intermediate services embedded within a global value chain can include services such as research
and development, design and engineering, and business services, such as legal and accounting.
As with trade in goods, foreign government barriers may prevent U.S. trade in services from
expanding to their full potential, but services barriers are often different from those faced by
goods suppliers. Many impediments in goods trade—tariffs and quotas, for example—are at the
border. By contrast, restrictions on services trade occur largely within the importing country and
serve as “behind the border” barriers. Some of these restrictions are in the form of government
regulations. One concern in international trade is ensuring that partner countries’ regulations are
applied in a nondiscriminatory and transparent manner that does not that favor domestic over
foreign service providers. Because services transactions more often require direct contact between
the consumer and provider than is the case with goods trade, many of the “trade barriers” that
foreign companies face pertain to the ability to establish a commercial presence in the consumers’
country in the form of direct investment or to the temporary movement of providers and
consumers across borders.
28. How is digital trade different from other trade in goods and services?
Non-tariff barriers related to digital trade establish restrictions that may impact what a firm offers
in a market or how it operates. Because digital trade is intangible and does not require direct
interaction between individuals, the trade barriers confronted are often in the form of localization
requirements that restrict the flow of commercial data. For example, data transfer regulations that
restrict cross-border data flows (“forced” localization barriers to trade), or require use of locally
based servers or infrastructure, may limit the type of financial transactions and services that a
firm can sell in a given country. Restrictions on cross-border data flow may prohibit the ability of
a provider that offers or relies on cloud-computing to enter a market. Similarly, country-specific
data regulations may create a disincentive for U.S. firms to invest in certain markets if a firm is
hindered in its ability to export its own data from a foreign affiliate to a U.S.-based headquarters
in order to aggregate and analyze information from across its global operations or to transfer
customer or human resources records.
The proponents of data localization seek to ensure privacy of citizens, security, and domestic
control. However, others point out that maintaining data within a country does not necessarily
guarantee security or protect a country from exposure to foreign attacks.53
Opponents of
localization restrictions on digital trade also point to lost efficiencies and increased costs of not
allowing a free flow of information across borders, and they support policies that protect privacy
without creating trade barriers.
(...continued)
U.S. Department of Labor, Monthly Labor Review: Industry employment and output projections to 2022, December
2013. 52 U.S. Bureau of Economic Analysis, online tool http://www.bea.gov/iTable/index_ita.cfm. 53 For more on data vulnerabilities and cybersecurity, see CRS Report R43317, Cybersecurity: Legislation, Hearings,
and Executive Branch Documents, by Rita Tehan.

U.S. Trade Concepts, Performance, and Policy: Frequently Asked Questions
Congressional Research Service 20
Other non-tariff barriers to digital trade may come in the form of regulations that require the use
of national standards or certification in order to operate.
Formulation of U.S. Trade Policy
Role of Congress
29. What role does Congress play in the making of trade policy?
The role of Congress in formulating international economic policy and regulating international
trade is based on express powers set out in Article 1, Section 8, of the U.S. Constitution, “To lay
and collect Taxes, Duties, Imposts and Excises” and “To regulate Commerce with foreign
Nations, and among the several States,” as well as the general provision “To make all Laws which
shall be necessary and proper” to carry out these specific authorities. Congress exercises this
power in many ways, such as through the enactment of tariff schedules and trade remedy laws,
and the approval and implementation of reciprocal trade agreements.
30. What committees take the lead in exercising congressional authority over trade?
Because of the revenue implications inherent in most trade agreements and policy changes, the
House Ways and Means Committee and Senate Finance Committee have primary responsibility
for trade matters. Each committee has a subcommittee dedicated exclusively to trade issues.
Other committees may have a role should trade agreements, policies, and other trade issues
include matters under their jurisdiction.
31. In what explicit ways does Congress make trade policy?
U.S. trade policy is founded on statutory authorities, as passed by Congress. These include laws
authorizing trade programs and governing trade policy generally in areas such as tariffs, non-tariff
barriers, trade remedies, import and export policies, political and economic security, and trade
policy functions of the federal government. Congress also sets trade negotiating objectives in law;
requires formal consultation from, and opportunity to provide advice on trade negotiations with
the executive branch; and conducts oversight hearings on trade programs and agreements to
assess their conformity to U.S. law and congressional intent.
32. How can individual Members affect trade policy decisions?
Individual Members affect trade policy first as voting representatives who determine collectively
the statutes governing trade matters. They may also exercise influence as sitting members on
relevant committees, in testimony before those committees, whether as a member of it or not, and
in exercising informal influence over other Members through the exercise of the political
authority and power invested in them by the electorate.
33. What is meant by fast track or Trade Promotion Authority (TPA)?
TPA (formerly known as fast track) refers to a statutory mechanism under which Congress
defines: 1) trade negotiating objectives, 2) authorizes the President to enter into reciprocal trade
agreements governing tariff and non-tariff barriers, 3) and allows implementing bills to be
considered under expedited legislative procedures, provided the President observes certain
statutory obligations in negotiating trade agreements, including notifying and consulting
Congress. The purpose of TPA is to preserve the constitutional role of Congress with respect to
consideration of implementing legislation for trade agreements that require changes in domestic
law, while also bolstering the negotiating credibility of the executive branch by assuring that the
trade implementing bill will receive expedited and unamended consideration.

U.S. Trade Concepts, Performance, and Policy: Frequently Asked Questions
Congressional Research Service 21
The last TPA expired in 2007. Legislation to renew TPA—the “Bipartisan Congressional Trade
Priorities and Accountability Act of 2015 (TPA-2015)—was introduced by Senators Hatch and
Wyden and Representative Ryan on April 16, 2015. The legislation, as reported by the Senate
Finance Committee, was joined with legislation extending Trade Adjustment Assistance (TAA)
into a substitute amendment to H.R. 1314 (an unrelated revenue measure), and the legislation
passed on May 22 by a vote of 62-37. In the House, the measure was voted on under a procedure
known as “division of the question,” which requires separate votes on each component, but
approval of both for the bill to pass. Voting on June 12, TPA (Title I) passed by a vote of 219-211,
but TAA (Title II) was defeated 126-302. On June 18, the House again voted on identical TPA
language as an amendment attached to H.R. 2146, an unrelated House bill. This amendment did
not include TAA. This legislation passed the House 218-206, and by the Senate 60-38. The
President signed the legislation (P.L. 114-26) on June 29, 2015.
Current negotiations on the proposed Trans-Pacific Partnership (TPP), the Transatlantic Trade and
Investment Partnership (T-TIP), the Trade in Services (TISA), and the World Trade Organization
(WTO) Doha Round agreements may require TPA in order to pass implementing legislation.
Role of the Executive Branch
34. Who is in charge of U.S. trade policy?
The President directs overall trade policy in the executive branch and performs specific trade
functions granted to him by statute. The chief adviser to the President on trade matters is the
United States Trade Representative (USTR), a Cabinet-level appointment that has primary
responsibility for developing, coordinating, and implementing U.S. trade policy, as well as
negotiating trade agreements and enforcing U.S. trade laws (see 19 U.S.C. 2171).
35. Why was the USTR created?
Congress created the USTR in 1962 (originally as the Office of the Special Representative for
Trade Negotiations) to heighten the profile of trade and provide better balance between
competing domestic and international interests in the formulation and implementation of U.S.
trade policy and negotiations, which were previously managed by the U.S. Department of State.
36. How are trade decisions made?
The USTR has primary responsibility for trade negotiation and trade policy decisions within the
executive branch. However, such decisions often involve areas of responsibility that fall under
other Cabinet-level departments, at times requiring a multi-department interagency process. To
implement this process, Congress established the Trade Policy Committee, chaired by the USTR
and consisting of the Secretaries of the Treasury, Commerce, State, Agriculture, Labor, and other
department heads as the USTR deems appropriate. The USTR subsequently established two sub-
Cabinet groups—the Trade Policy Review Group (TPRG) and the Trade Policy Staff Committee
(TPSC). The executive branch also solicits advice from a three-tiered congressionally established
trade advisory committee system that consists of private sector and non-federal government
representatives.
37. What are the functions of the executive branch in U.S. trade?
The executive branch executes trade policy in a variety of ways. It negotiates, implements, and
monitors trade agreements, and has responsibility for customs enforcement, collection of duties,
implementation of trading remedy laws, budget proposals for trade programs and agencies, export
and import policies, and agricultural trade, among others.

U.S. Trade Concepts, Performance, and Policy: Frequently Asked Questions
Congressional Research Service 22
38. When does the President get involved in trade decisions?
The President is responsible for influencing the direction of trade legislation, signing trade
legislation into law, and making other specific decisions on U.S. trade policies and programs
where he deems the national interest or political environment requires his direct participation.
This can take place in many areas of trade policy, such as requesting TPA/fast track authority,
initiating critical trade remedy cases, meeting or communicating with foreign heads of state or
government, and other areas subject to or requiring high political visibility.
Role of the Private Sector
39. What is the formal role of the private sector?
The formal role of the private sector in the formulation of U.S. trade policy is embodied in a
three-tiered committee system that Congress has provided in Section 135 of the Trade Act of
1974, as amended. Currently there are 28 committees (with about 700 citizen advisors), which are
administered by the USTR’s Office of Intergovernmental Affairs & Public Engagement (IAPE) in
cooperation with a number of other federal agencies.54
The three-tier system consists of (1) the
President’s Advisory Committee for Trade Policy and Negotiations (ACTPN); (2) five general
policy advisory committees dealing with environment, labor, agriculture, Africa, and
intergovernmental issues; and (3) 22 technical advisory committees in the areas of industry and
agriculture.55
These committees have been set up in order to ensure that private sector views are
known and considered in the formulation and implementation of U.S. trade policies and
programs.
40. What is the informal role that the private sector plays in the formulation of U.S. trade
policy?
The private sector helps shape U.S. trade policy in a number of informal ways. For example,
representatives from industry and non-government organizations may be invited to testify before
congressional committees on trade matters. Private sector representatives are also invited or
requested to testify before the United States International Trade Commission (USITC), the U.S.
Department of Commerce, or other government bodies to provide assessments of the potential
impact of pending trade actions, such as an antidumping or countervailing duty order, on their
industries and sectors. Private sector organizations also lobby Congress and the executive branch
to promote their interests in U.S. trade policy actions and agreements.
41. Why do groups attempt to lobby on trade decisions?
Trade is becoming a larger and increasingly integral part of the U.S. economy. Virtually all kinds
of agricultural and manufactured goods are tradeable—they can be exported and imported. In
addition, a growing number of services—once considered non-tradeable because of their
intangibility—can be bought and sold across borders because of technology advancements, such
as the Internet. As a result, how U.S. trade policy is shaped and implemented can affect a broad
spectrum of people in the United States. For some industries, firms, and workers, congressional
54 For additional information, see Statement of Lisa Garcia, Assistant U.S. Trade Representative for Intergovernmental
Affairs & Public Engagement, Before the House Ways and Means Committee, Hearing on Trade Advisory Committee
System, July 21, 2009, available at http://waysandmeans.house.gov/media/pdf/111/garcia.pdf. 55The main advisory committees include the ACTPN; the Agricultural Policy Advisory Committee (APAC); the
Agricultural Technical Advisory Committee for Trade (ATAC); the Industry Trade Advisory Committees (ITAC); the
Intergovernmental Policy Advisory Committee (IGPAC); the Labor Advisory Committee (LAC); the Trade Advisory
Committee on Africa (TACA); and the Trade and Environment Policy Advisory Committee (TEPAC).
U.S. Trade Concepts, Performance, and Policy: Frequently Asked Questions
Congressional Research Service 23
decisions to support a particular trade agreement or Department of Commerce rulings on
antidumping cases, subsidies, and other cases could affect both employment and growth. Those
decisions could also influence product choices of U.S. consumers. Such groups are also
concerned with obtaining greater market access in various countries. Consequently, groups
representing businesses, farmers, workers, consumers, and other segments of the economy strive
to make sure that their views on trade policy decisions are represented.
Role of the Judiciary
42. How do federal courts get involved in trade?
Legal challenges may be brought in federal court by importers, exporters, domestic
manufacturers, and other parties affected by governmental actions and decisions concerning trade.
Cases may involve, for example, customs classification decisions, agency determinations in
antidumping and countervailing duty (CVD) proceedings, presidential decisions to (or not to)
restrict imports under trade remedy statutes, or the constitutionality of state economic sanctions.
The federal government may also initiate legal proceedings against individuals and firms to
enforce customs laws or statutory restrictions on particular imports and exports. Some trade
statutes may preclude judicial review. For example, most preliminary determinations in
antidumping and CVD proceedings and governmental actions involving the implementation of
WTO and free trade agreements may not be challenged in federal court.56
While most federal
cases involving trade laws are heard in the U.S. Court of International Trade (see below), cases
may also be filed in other federal courts depending on the cause of action or proceeding involved.
Court decisions may significantly affect U.S. trade policy when they examine whether an agency
has properly interpreted its statutory mandate, determine whether an agency has acted outside the
scope of its statutory authority, decide how much deference should be granted the executive
branch under a particular statute, or rule on whether a trade statute violates the U.S. Constitution.
43. What is the U.S. Court of International Trade?
The U.S. Court of International Trade (USCIT) is an Article III federal court located in New York
City with exclusive jurisdiction over a number of trade-related matters, including customs
decisions, antidumping and countervailing duty determinations, import embargoes imposed for
reasons other than health and safety, and the recovery of customs duties and penalties. Formerly
known as the Customs Court, the USCIT was renamed in the Customs Court Act of 1980, which
also significantly enlarged its jurisdiction. The court consists of nine judges, no more than five of
whom may be from the same political party. Judges are appointed by the President with the
consent of the Senate. USCIT decisions are appealable to the U.S. Court of Appeals for the
Federal Circuit and to the U.S. Supreme Court. Statutory provisions related to the USCIT may be
found at 28 U.S.C. Sections 251-258 (establishment) and 28 U.S.C. Sections 1581-1585
(jurisdiction).
56 For further information, see CRS Report RS22154, World Trade Organization (WTO) Decisions and Their Effect in
U.S. Law, by Jane M. Smith, Brandon J. Murrill, and Daniel T. Shedd.
U.S. Trade Concepts, Performance, and Policy: Frequently Asked Questions
Congressional Research Service 24
U.S. Trade and Investment Policy Issues
Trade Negotiations and Agreements
44. Why does the United States negotiate trade liberalizing agreements?
The United States negotiates trade liberalizing agreements for economic and commercial reasons,
including to:
encourage foreign trade partners to reduce or eliminate tariffs and non-tariff
barriers and, in so doing, increase market access for U.S. exporters;
gain an advantage for U.S. exporters over foreign competitors in a third-country
market;
increase access to lower cost imports that help to control inflation and offer
domestic and industrial consumers a wider choice of products; and
encourage trading partners, especially developing countries, to rationalize their
trade regimes, and thereby improve the efficiency of their economies.
The United States also negotiates trade liberalizing agreements for foreign policy/national
security reasons, including to:
strengthen established alliances;
forge new strategic relationships; and
establish a presence in a geographic region.
45. What are the various types of trade liberalizing agreements?
In general, reciprocal trade agreements can be categorized by the number of countries involved:
bilateral agreements, such as free trade agreements (FTAs), are between two countries; regional
agreements, such as the North American Free Trade Agreement (NAFTA) and the proposed
Trans-Pacific Partnership (TPP) and the Transatlantic Trade and Investment Partnership (T-TIP),
involve three or more countries in a geographic region; plurilateral agreements involve a
number of countries (not always from the same region) that often negotiate to liberalize trade in a
specific sector, such as the proposed Trade in Services Agreement (TISA); and multilateral
agreements, such as those negotiated in the World Trade Organization (WTO), cover a
significant share of global trade.
Among major trade agreements, the TPP is currently a major focus, in that it is a proposed
comprehensive and high-standard free trade agreement (FTA) among 12 countries to liberalize
trade and investment through enhanced rules and disciplines and greater market access. It may
become a vehicle to advance a wider Asia-Pacific free trade area as well as a U.S. policy response
to the rapidly increasing economic and strategic linkages among Asian-Pacific states. It is
portrayed by the Administration as the key economic component of the “rebalance” to the Asia-
Pacific.
The TPP has slowly evolved from a more limited agreement among four countries concluded in
2006 into the current 12-country FTA negotiations, with the United States joining the negotiations
in 2008. Japan, the most recent country to participate, joined the negotiations in 2013. The United
States has existing FTAs with 6 of the 11 countries participating—Australia, Canada, Chile,
Mexico, Peru, and Singapore. The five TPP countries without existing FTAs with the United
States are Brunei, Japan, Malaysia, New Zealand, and Vietnam. Views on the agreement vary
widely. Proponents argue that the TPP has the opportunity to expand trade and investment
U.S. Trade Concepts, Performance, and Policy: Frequently Asked Questions
Congressional Research Service 25
opportunities with negotiating partners that make up 37% of total U.S. goods and services trade,
and establish trade and investment disciplines on new issues such as supply chain management,
state-owned enterprises (SOEs), regulatory coherence, and digital trade barriers, in a region of
strategic economic and geopolitical importance.
Proponents argue that the TPP has the opportunity to expand trade and investment opportunities
with negotiating partners that make up 37% of total U.S. goods and services trade, and establish
trade and investment disciplines on new issues such as supply chain management, state-owned
enterprises (SOEs), regulatory coherence, and digital trade barriers, in a region of strategic
economic and geopolitical importance. Opponents voice concerns over greater competition in
import sensitive industries, and how the potential TPP agreement might impact U.S. sovereignty
in establishing future U.S. regulations in areas such as health, food safety, and environment.
Ambassador Froman signed the concluded TPP on February 4, 2016, but Congress must pass
implementing legislation for the agreement to enter into force in the United States. Recently
signed Trade Promotion Authority (TPA) legislation guarantees certain legislative procedures for
congressional consideration of TPP implementing legislation, including an up or down vote by
Congress. Such procedures, however, are contingent on Congress’ determination that the
Administration has made sufficient progress in advancing congressional negotiating objectives
established in TPA and has followed TPA notification and consultation requirements.
46. Who benefits from trade liberalizing agreements? Who loses?
Economic theory suggests and empirical studies have generally concluded that economies as a
whole benefit when trade barriers are removed because economic resources (land, labor, and
capital) are employed more efficiently. However, economic theory and studies also point out that
the benefits of trade liberalization are not distributed evenly within an economy and not even
among economies. Some industries, firms, and workers “lose” if they cannot adjust to the
increased foreign competition resulting from the trade agreement or if particular provisions of the
trade agreement disadvantage their interests. Other industries, firms, and workers “win” if they
can take advantage of new market opening opportunities presented by the trade agreement or if
particular provisions of the trade agreement favor or promote their interests.
47. What is the World Trade Organization (WTO)?
The WTO is a 160-member body that establishes through negotiations and implements the
multilateral system of rules on trade in goods, services, agriculture, IPR, trade remedies, and on
other trade-related matters and adjudicates disputes under the rules. Fundamental principles of the
WTO include non-discrimination and national treatment in trade among the members. The WTO
was established in January 1995 as a part of the agreements reached by the signatories to the
General Agreement on Tariffs and Trade (GATT).57
The WTO administers the roughly 60
agreements and separate commitments made by its members as part of the GATT (for trade in
goods), the General Agreement on Trade in Services (GATS—for trade in services), and the
agreement on trade-related aspects of intellectual property rights (TRIPS). It also oversees
multilateral and plurilateral negotiations among its members.
48. How are disputes resolved under WTO agreements?
If a WTO member believes that another member has adopted a law, regulation, or practice that
violates a WTO agreement, the member may initiate dispute settlement proceedings under the
57 The GATT was first established in 1947, and up until 1994, it administered global trade rules. During the Uruguay
Round Agreements, the WTO was established as the successor to the GATT, staring in 1995.

U.S. Trade Concepts, Performance, and Policy: Frequently Asked Questions
Congressional Research Service 26
WTO Dispute Settlement Understanding. The process begins with consultations and, if these fail
to resolve the dispute, the member may request that the WTO establish a dispute panel. A panel
report may be appealed to the WTO Appellate Body by either disputing party. If the defending
member is found to have violated a WTO obligation, the member will be expected to remove the
challenged measure. If this is not done by the end of the established compliance period, the
prevailing member may request authorization from the WTO to take temporary retaliatory action.
In most cases, retaliation consists of tariff increases on selected products from the defending
member. From January 1995 to June 2014, 496 dispute settlement complaints have been filed in
the WTO, with the majority of disputes resolved through consultations and negotiations rather
than through a ruling by a WTO dispute settlement panel (or the WTO’s Appellate Body). WTO
members have an obligation to comply with WTO dispute resolution rulings, and if such
compliance is not forthcoming, the WTO member that filed the complaint can request
authorization to impose trade sanctions against, or seek compensation from, the defending WTO
member.58
WTO decisions do not have direct effect in U.S. law. Thus, in the event a U.S. statute is found to
be inconsistent with U.S. obligations in the WTO, the dispute findings may not be implemented
except through U.S. legislative action. Where an administrative action is successfully challenged,
the USTR decides what, if any, compliance action will be taken. If sufficient statutory authority
exists to amend or modify a regulation or practice or to issue a new determination in a challenged
administrative proceeding, the USTR may direct the agency involved to make the change,
provided that certain statutory procedures for such actions are followed.59
As a matter of policy,
the United States generally seeks to comply with WTO dispute settlement rulings that go against
it, as doing so helps ensure that other WTO members comply with rulings that have gone against
them, including those brought by the United States.
49. What is the Doha Round?
Since the GATT was signed in 1947, its signatories (member countries) have revised and
expanded the trade rules in various rounds of negotiations to liberalize global trade. The Doha
Development Agenda (DDA) is the ninth round and the first under the WTO. It is named after the
city where it was launched in November 2001—Doha, Qatar. The WTO members included
“development” in the title to reflect their intention to include issues of importance to developing
countries. The negotiations have primarily focused on three areas—agriculture, non-agricultural
goods,60
and services, although members have conducted negotiations in other areas as well, such
as rules. As of this writing, negotiators have not been able to reach agreement and conclude the
round. In December 2013, WTO members reached consensus on a Trade Facilitation Agreement
(TFA) to remove customs obstacles at the border. However, beginning in July 2014,
implementation of the agreement has been held up by India because of its concerns over food
security issues.61
On November 13, 2014, the USTR announced that the United States and India
had resolved their differences.62
As of March 2015, WTO members have reported on new efforts
made to formally accept the new TFA, with delegations outlining target dates for securing
58 See CRS Report RS20088, Dispute Settlement in the World Trade Organization (WTO): An Overview, by Daniel T.
Shedd, Brandon J. Murrill, and Jane M. Smith. 59 Uruguay Round Agreements Act, P.L. 103-465, §§123(g), 129, 19 U.S.C. §§3535(g), 3538. 60 This is referred to as the non-agricultural market access negotiations (NAMA), which includes manufacturing
products, fuels and mining products, fish and fish products, and forestry products. 61 See CRS Report R43592, Agriculture in the WTO Bali Ministerial Agreement, by Randy Schnepf. 62USTR, Press Release, November 13, 2014, athttp://www.ustr.gov/about-us/press-office/press-releases/2014/
November/Statement-by-Ambassador-Froman-on-US-India-WTO-Trade-Facilitation-Agreement.
U.S. Trade Concepts, Performance, and Policy: Frequently Asked Questions
Congressional Research Service 27
approval seeing that the agreement enter the WTO’s 10th Ministerial Conference in Nairobi next
December.
50. What are free trade agreements (FTAs)?
At a minimum, FTAs are agreements between/among two or more countries under which they
agree to eliminate tariffs and non-tariff barriers on trade in goods and services among them, but
each country maintains its own trade policies and regulations, including tariffs, on trade outside
the FTA. FTA partner countries may also agree to reduce barriers or otherwise establish rules of
behavior in other economic activities—investment, IPR, government procurement, worker rights,
and environmental protection.
51. How do FTAs that the United States negotiates generally differ from those negotiated
among other countries?
The United States currently has 14 FTAs in force that include 20 countries.63
The FTAs that the
United States negotiates are often more comprehensive and high standard than those that are
negotiated among other countries, particularly developing countries. The standard U.S. FTA
model includes not only the elimination of tariffs on trade in goods among the FTA partners, but
also reduction of barriers on trade in services, rules on foreign investment, requirements for IPR
protection, government procurement, and provisions on labor and environment, and several other
issues. The United States is currently negotiating a number of FTAs, including the TPP, involving
the United States and 11 other countries in the Asia-Pacific region; and the Transatlantic Trade
and Investment Partnership (T-TIP) between the United States and the European Union. The
United States has sought to make the TPP a comprehensive high standard free trade agreement
that can serve as template for future FTA negotiations, especially through addressing issues that
have not traditionally been address in other trade agreements, such as the development of new
rules on state-owned enterprises (SOEs) and digital trade.64
52. What are Trade and Investment Framework Agreements (TIFAs)?
A TIFA is an agreement between the United States and another country (for example Egypt) or
group of countries (for example, ASEAN) to consult on issues of mutual interest in order to
promote trade and investment among the participants. Most U.S. TIFAs are with developing
countries. The United States and its TIFA partner(s) agree to establish a joint ministerial-level
council as the overall mechanism for consultation with the possibility of establishing issue-
oriented working groups. A TIFA is a non-binding agreement and does not involve changes in
U.S. law; therefore, TIFAs do not require congressional approval. In some cases, TIFAs have led
to FTA negotiations.65
63 These include Australia, Bahrain, Canada, Chile, Colombia, Costa Rica, Dominican Republic, El Salvador,
Guatemala, Honduras, Israel, Jordan, Korea, Mexico, Morocco, Nicaragua, Oman, Panama, Peru, and Singapore. See
USTR, Free Trade Agreements, at http://www.ustr.gov/trade-agreements/free-trade-agreements. 64 For additional information on this issue, see CRS Report R42694, The Trans-Pacific Partnership (TPP) Negotiations
and Issues for Congress, coordinated by Ian F. Fergusson. 65 A listing of TIFAs can be found on the USTR’s website at http://www.ustr.gov/trade-agreements/trade-investment-
framework-agreements.

U.S. Trade Concepts, Performance, and Policy: Frequently Asked Questions
Congressional Research Service 28
Import Issues66
As noted earlier, countries export in order to obtain imports, which benefit various parts of the
economy. Lower-priced imports generally benefit the U.S. economy as a whole. However, in
some instances, imports may harm certain import-sensitive U.S. firms, in particular when foreign
firms or governments seek to employ trade-distorting measures. The federal government seeks to
use a number of trade tools to combat unfair foreign trade policies and assist those injured by
foreign trade. In some cases, such policies are intended to help create a “level playing field” for
U.S. producers and workers, induce foreign countries to eliminate trade-distortive policies, or to
help import-sensitive firms adjust to the changing nature of global competitive through the use of
Trade Adjustment Assistance (TAA).
53. What are other benefits of imports?
Consumers can benefit through access to a wider variety of goods at lower costs. This raises
consumer welfare (which means consumers have more money to spend on other goods and
services) and helps control the rate of U.S. inflation. Producers can benefit through access to
lower priced components or inputs that can be utilized in the production process. Longer term,
import competition can also pressure companies to reduce costs through innovation, research, and
development, leading to growth in economic output and productivity.
54. What are the costs of imports?
By affording increased competition to U.S. companies producing similar products, imports can
contribute to U.S. job losses and business failures. In some cases, import competition can cause
job losses and company failures that are concentrated in a region or sector, which can cause
considerable economic distress in a community. The use of unfair trade policies (such as export
subsidies) to boost sales in the United States can result in trade tensions.
55. What are the main U.S. trade remedy laws?
Two primary trade remedy laws aimed at unfair trade practices are the antidumping (AD) and
countervailing duty (CVD) statutes. Other trade remedy laws include Section 201 (see below),
Section 301 (focuses on violations of trade agreements or other foreign practices that are
unjustifiable and restrict U.S. commerce), and Section 337 (focuses on unfair practices in import
trade such as patent and copyright infringement).
56. What is the purpose of the countervailing duty law?
The purpose of the CVD law is to offset any unfair and injurious competitive advantage that
foreign manufacturers or exporters might enjoy over U.S. producers as a result of receiving a
government subsidy. As defined by the WTO, a subsidy is a financial contribution, such as a loan,
grant, or tax credit, provided by a government or other public entity that confers a specific benefit
to manufacturers or exporters of a product. Countervailing duties, if imposed, are designed to
equal the net amount of the foreign subsidy and are levied upon importation of the subsidized
goods into the United States.
57. What is the purpose of the antidumping law?
Dumping generally refers to an unfair trade practice in which an exporter sells goods in one
export market at lower prices than comparable goods sold in the home market or in other export
66 This section was prepared by Vivian C. Jones, M. Angeles Villarreal, and Mary Jane Bolle, Specialists in
International Trade and Finance, Foreign Affairs, Defense, and Trade Division.

U.S. Trade Concepts, Performance, and Policy: Frequently Asked Questions
Congressional Research Service 29
markets. Companies may dump products to gain market share or deter competition. U.S. law
provides for the assessment and collection of antidumping duties when an administrative
determination is made that foreign goods are being dumped or sold at less than fair value in the
United States, and that such imports cause or threaten to cause material injury to a U.S. industry.
58. What is the import relief (safeguards) law?
Chapters 1 and 2 of the Trade Act of 1974, as amended, provide the President with the authority
to apply safeguard measures temporarily (increased tariffs or quotas) to restrict imports if they
threaten or cause serious injury to a domestic industry. Safeguard measures apply to products that
are not necessarily traded unfairly. This provision recognizes that liberalization of trade barriers
can change competitive conditions and that in certain cases domestic industries should be
provided a temporary period of relief to allow time for adjustment. The U.S. International Trade
Commission investigates and recommends on import relief cases, and the President takes final
action. Safeguard measures are permitted under WTO rules.
59. What is the Trade Adjustment Assistance (TAA) Program?
Congress passed the first trade adjustment assistance program as part of the Trade Expansion Act
of 1962 (P.L. 87-794) and it has extended and changed the TAA provisions over time. TAA was
developed to provide certain types of temporary assistance to workers, firms, farmers, and
communities that may be negatively impacted by foreign trade. Funding for TAA was $797
million in FY2013, down from $1.8 billion in FY2010.
Recent legislation in regards to TAA was introduced March 4, 2015, the Trade Preferences
Extension Act of 2015 (H.R. 1295) reauthorizes TAA through June 30, 2021 and restores some
benefits under the program that had been allowed to expire by: extending the termination
provisions of the Trade Act of 1974; authorizes $450 million in funding; extension of the
reemployment trade adjustment assistance; and authorizes appropriations for trade adjustment
assistance for workers, firms, and farmers. It was signed into law June 29, 2015 (P.L. 114-27).
60. What is the rationale for TAA?
In proposing the program, supporters in Congress argued that those injured by increased trade
competition as a result of public policy should not be required to bear the full cost of the impact.
Justification rested on arguments for (1) economic efficiency, by speeding the adjustment process
and returning idle resources to work more quickly, (2) equity, by compensating the losers of free
trade while spreading the cost of freer trade to society as a whole, and (3) as a way to defuse
domestic opposition to trade liberalizing agreements and measures. TAA skeptics argue that such
assistance is costly and economically inefficient, reduces worker and firm incentives to relocate
and adjust, and may not be equitable given that many economic groups hurt by changing
economic circumstances caused by factors other than trade policies are not afforded special
economic assistance. Despite disagreement, Congress has consistently found compromise
positions to maintain the program over the past five decades.
Federal Export Issues67
The federal government maintains a number of programs and policies to promote certain U.S.
exports. Some programs provide direct assistance to U.S. exporters, such as financing or trade
counselling. Other U.S. policies attempt to promote exports by negotiating trade liberalization
67 This section was prepared by M. Angeles Villarreal, Shayerah Ilias Akhtar, and Wayne M. Morrison, Specialists in
International Trade and Finance, Foreign Affairs, Defense, and Trade Division.
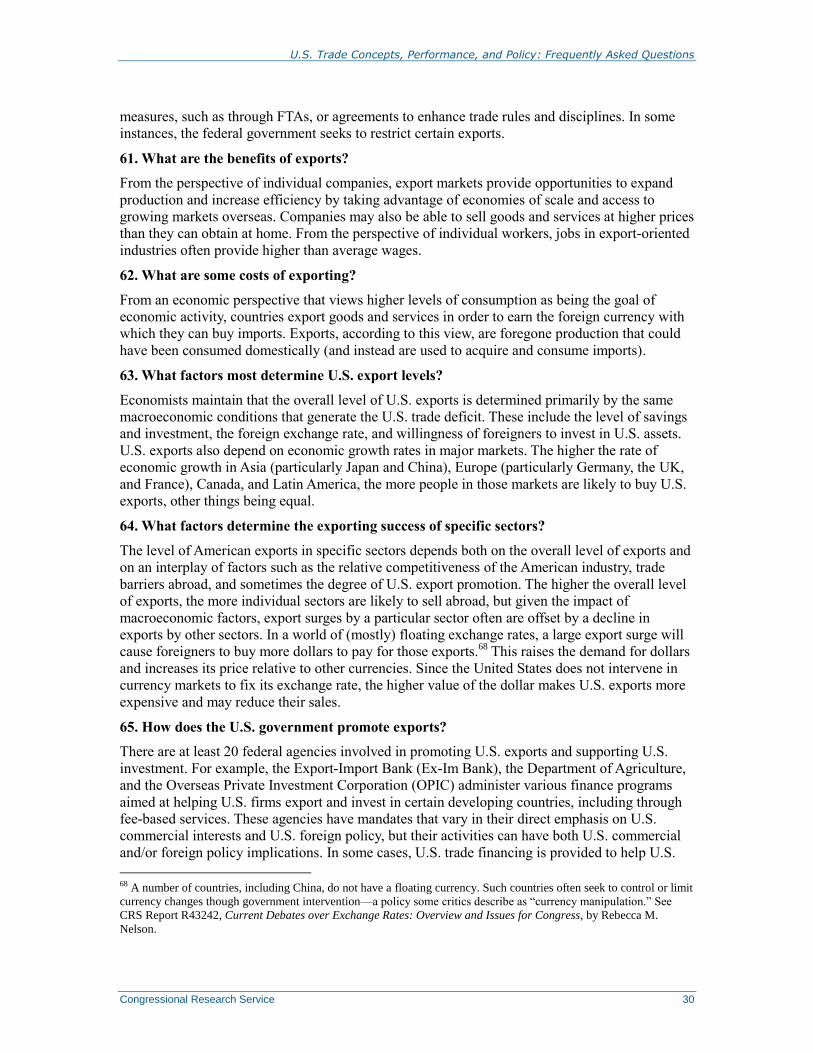
U.S. Trade Concepts, Performance, and Policy: Frequently Asked Questions
Congressional Research Service 30
measures, such as through FTAs, or agreements to enhance trade rules and disciplines. In some
instances, the federal government seeks to restrict certain exports.
61. What are the benefits of exports?
From the perspective of individual companies, export markets provide opportunities to expand
production and increase efficiency by taking advantage of economies of scale and access to
growing markets overseas. Companies may also be able to sell goods and services at higher prices
than they can obtain at home. From the perspective of individual workers, jobs in export-oriented
industries often provide higher than average wages.
62. What are some costs of exporting?
From an economic perspective that views higher levels of consumption as being the goal of
economic activity, countries export goods and services in order to earn the foreign currency with
which they can buy imports. Exports, according to this view, are foregone production that could
have been consumed domestically (and instead are used to acquire and consume imports).
63. What factors most determine U.S. export levels?
Economists maintain that the overall level of U.S. exports is determined primarily by the same
macroeconomic conditions that generate the U.S. trade deficit. These include the level of savings
and investment, the foreign exchange rate, and willingness of foreigners to invest in U.S. assets.
U.S. exports also depend on economic growth rates in major markets. The higher the rate of
economic growth in Asia (particularly Japan and China), Europe (particularly Germany, the UK,
and France), Canada, and Latin America, the more people in those markets are likely to buy U.S.
exports, other things being equal.
64. What factors determine the exporting success of specific sectors?
The level of American exports in specific sectors depends both on the overall level of exports and
on an interplay of factors such as the relative competitiveness of the American industry, trade
barriers abroad, and sometimes the degree of U.S. export promotion. The higher the overall level
of exports, the more individual sectors are likely to sell abroad, but given the impact of
macroeconomic factors, export surges by a particular sector often are offset by a decline in
exports by other sectors. In a world of (mostly) floating exchange rates, a large export surge will
cause foreigners to buy more dollars to pay for those exports.68
This raises the demand for dollars
and increases its price relative to other currencies. Since the United States does not intervene in
currency markets to fix its exchange rate, the higher value of the dollar makes U.S. exports more
expensive and may reduce their sales.
65. How does the U.S. government promote exports?
There are at least 20 federal agencies involved in promoting U.S. exports and supporting U.S.
investment. For example, the Export-Import Bank (Ex-Im Bank), the Department of Agriculture,
and the Overseas Private Investment Corporation (OPIC) administer various finance programs
aimed at helping U.S. firms export and invest in certain developing countries, including through
fee-based services. These agencies have mandates that vary in their direct emphasis on U.S.
commercial interests and U.S. foreign policy, but their activities can have both U.S. commercial
and/or foreign policy implications. In some cases, U.S. trade financing is provided to help U.S.
68 A number of countries, including China, do not have a floating currency. Such countries often seek to control or limit
currency changes though government intervention—a policy some critics describe as “currency manipulation.” See
CRS Report R43242, Current Debates over Exchange Rates: Overview and Issues for Congress, by Rebecca M.
Nelson.

U.S. Trade Concepts, Performance, and Policy: Frequently Asked Questions
Congressional Research Service 31
firms obtain a “level playing field” against certain foreign firms that may be receiving subsidized
financing from their respective governments. In addition, the Department of Commerce, through
the International Trade Administration (ITA), acts to promote U.S. exports of goods and services
(particularly by small and medium-sized companies) by providing a number of support services,
such as export counselling.69
Boosting U.S. exports was elevated as a priority issue with the
Obama Administration’s introduction of the National Export Initiative (NEI) in the 2010 State of
the Union Address.70
The NEI set a strategy to double U.S. exports by 2015 in an effort to boost
the economy and generate employment growth.71
The next phase of NEI is NEI/NEXT, which has
five objectives: to connect more American businesses to more global customers; to make the
exporting process easier and less expensive; to expand access for businesses to export financing
and insurance; to promote exports and the attraction and retention of investment as a priority for
American communities; and to create, foster, and ensure more exporting opportunities.
NEI/NEXT, among other things, also has a cross-cutting objective to improve government data to
support companies’ exporting decisions across all five specific objectives.
As the official U.S. export credit agency (ECA), Ex-Im Bank finances and insures U.S. exports of
goods and services with the goal of supporting U.S. jobs. On a demand-driven basis, it seeks to
support exports that the private sector is unwilling or unable to finance alone at commercially
viable terms for exporting; and/or to counter government-backed financing offered by foreign
countries through their ECAs. The rationales behind Ex-Im Bank’s activities remain subject to
congressional debate.
Ex-Im Bank operates under a renewable general statutory charter (Export-Import Bank Act of
1945, as amended), extended through the end of FY2109 by the Export-Import Bank Reform and
Reauthorization Act of 2015 (Division E, P.L. 114-94). This act lowered the Bank’s statutory
lending authority (“exposure cap” for outstanding portfolio) to $135 billion for each of FY2015-
2019 subject to certain conditions, and made reforms including to its policies or operations in risk
management, fraud controls, and ethics, as well as the U.S. approach to international negotiations
on disciplines on government-backed export credit financing.
66. Are U.S. export promotion programs beneficial to the U.S. economy?
This is a hotly debated question. A number of economic justifications have been given for
supporting or opposing government export promotion programs and policies. Economic theory
generally holds that free markets should determine the most efficient allocation of scarce
resources, based on supply and demand factors. However, market failures may prevent the market
from operating at its “optimal” or most efficient level, causing the market to either over-allocate
or under-allocate resources to various economic activities and leading to economic waste. Thus,
in order to remove such market failures and promote economic efficiency, some form of
government intervention may be warranted. The existence of imperfect information in the market,
spillovers, and imperfect competition are examples of market failures that often are cited as
justifying government export promotion programs, the presumption being that either the
composition or level of U.S. exports is below that which would maximize U.S. living standards.
From an economic perspective, much of the debate over export promotion involves whether some
69 These services are largely handled by ITA’s U.S. and Foreign Commercial Service (USFCS) Global Markets
division. Other ITA sections, including the Enforcement and Compliance and Industry and Analysis divisions, are also
involved in promoting U.S. exports. 70 See NEI website at http://trade.gov/nei. 71 The government also seeks to promote exports indirectly, such as by negotiating with other countries to remove trade
and investment barriers, improve transparency of trade laws and regulations, improving IPR protection, and urging
countries to implement policies to promote economic growth (which would boost their demand for imports).

U.S. Trade Concepts, Performance, and Policy: Frequently Asked Questions
Congressional Research Service 32
market failure actually has occurred, and whether government intervention can produce net
benefits for the economy as a whole.
Supporters of export promotion programs assume that market failures have occurred and have led
to significant misallocation of resources in the economy. Some view export promotion as a
corrective tool to ensure that resources are directed to their most efficient use. Proponents argue
that these policies can boost exports substantially, improve national living standards, and (during
periods of less than full employment) increase output and employment. An additional justification
used involves instances when U.S. firms find themselves unable to compete in certain overseas
markets because their foreign competitors have received significant levels of government support,
including subsidized export financing.72
U.S. policies to counter or offset such subsidies, it is
argued, will create a level playing field for U.S. firms and possibly induce other countries to
discontinue providing export subsidies.
Opponents of export promotion programs dispute that significant market failures have occurred,
and warn that government intervention may interfere with the efficient operation of the market.
Such critics argue that export promotion policies are little more than distortive subsidies that
favor some firms over others, reduce efficiency within the economy, result in terms-of-trade
losses, and diminish national living standards. In addition, while critics concede that trade
promotion programs may help boost employment and production during periods of less than full
employment, they question why exporting firms should be favored for assistance over other U.S.
firms. Some argue that broad monetary and fiscal policies aimed at stimulating domestic demand
may provide a more effective means of boosting the economy.
Many economists would argue that addressing market failures could boost U.S. economic
efficiency. However, various factors, such as global macroeconomic policies and the economic
growth rates of the United States and its major U.S. trading partners, trends in global trade
policies (such as expansion of trade liberalization policies or, conversely, increased trade
protectionism), and international exchange rates will likely be among the most significant forces
determining the level and composition of U.S. exports in the long run.
67. What does the U.S. government do to restrict exports and why?
Congress has authorized the President to control the export of various items for national security,
foreign policy, and economic reasons.73
Separate programs and statutes for controlling different
types of exports exist for nuclear materials and technology, defense articles and services, and
dual-use goods and technology. Under each program, licenses of various types are required before
an export can be undertaken. The U.S. Departments of Commerce, State, Energy, and the
Treasury administer these programs.
Investment Issues74
68. What are the main kinds of capital flows?
Generally, the two main kinds of capital flows are foreign direct investment (FDI) and foreign
portfolio investment (FPI). FDI involves the acquisition of real assets such as real estate, a
72 It is argued that losses to U.S. firms could be significant when such activities determine which firms are able to
obtain purchase agreements involving large infrastructure projects. 73 These include economic and trade sanctions that have been imposed against various countries and groups. 74 Prepared by James K. Jackson, Specialist in International Trade and Finance, Foreign Affairs, Defense, and Trade
Division.
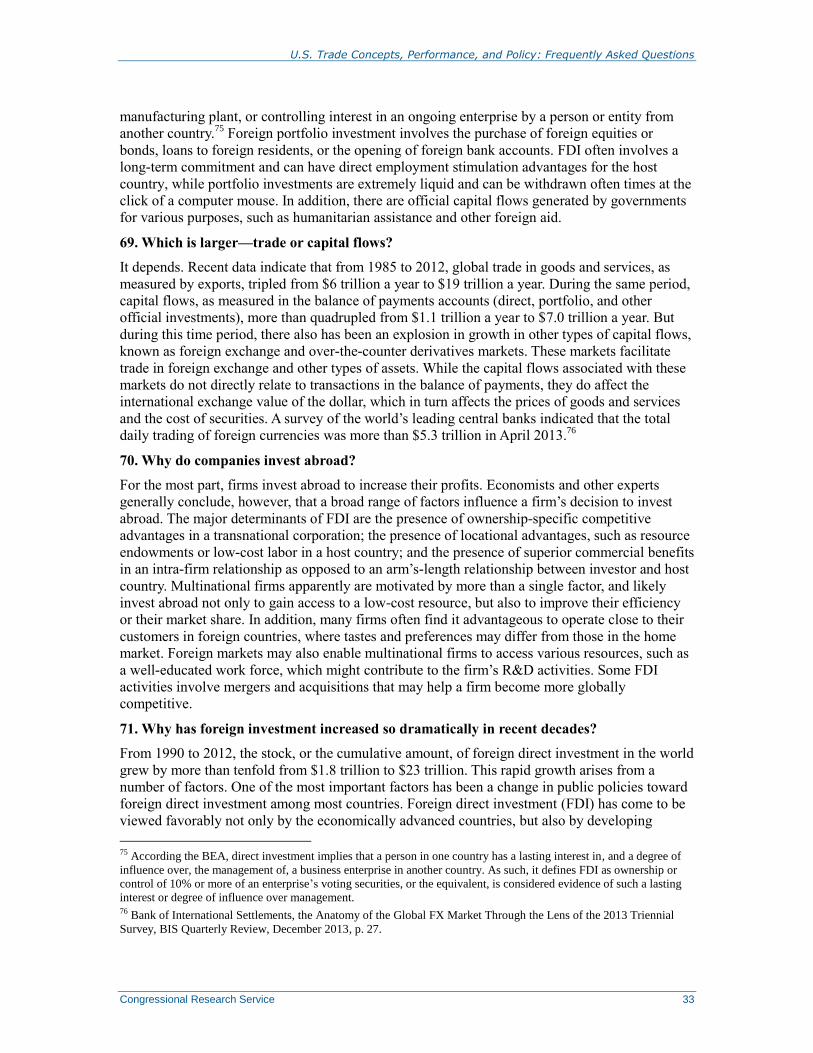
U.S. Trade Concepts, Performance, and Policy: Frequently Asked Questions
Congressional Research Service 33
manufacturing plant, or controlling interest in an ongoing enterprise by a person or entity from
another country.75
Foreign portfolio investment involves the purchase of foreign equities or
bonds, loans to foreign residents, or the opening of foreign bank accounts. FDI often involves a
long-term commitment and can have direct employment stimulation advantages for the host
country, while portfolio investments are extremely liquid and can be withdrawn often times at the
click of a computer mouse. In addition, there are official capital flows generated by governments
for various purposes, such as humanitarian assistance and other foreign aid.
69. Which is larger—trade or capital flows?
It depends. Recent data indicate that from 1985 to 2012, global trade in goods and services, as
measured by exports, tripled from $6 trillion a year to $19 trillion a year. During the same period,
capital flows, as measured in the balance of payments accounts (direct, portfolio, and other
official investments), more than quadrupled from $1.1 trillion a year to $7.0 trillion a year. But
during this time period, there also has been an explosion in growth in other types of capital flows,
known as foreign exchange and over-the-counter derivatives markets. These markets facilitate
trade in foreign exchange and other types of assets. While the capital flows associated with these
markets do not directly relate to transactions in the balance of payments, they do affect the
international exchange value of the dollar, which in turn affects the prices of goods and services
and the cost of securities. A survey of the world’s leading central banks indicated that the total
daily trading of foreign currencies was more than $5.3 trillion in April 2013.76
70. Why do companies invest abroad?
For the most part, firms invest abroad to increase their profits. Economists and other experts
generally conclude, however, that a broad range of factors influence a firm’s decision to invest
abroad. The major determinants of FDI are the presence of ownership-specific competitive
advantages in a transnational corporation; the presence of locational advantages, such as resource
endowments or low-cost labor in a host country; and the presence of superior commercial benefits
in an intra-firm relationship as opposed to an arm’s-length relationship between investor and host
country. Multinational firms apparently are motivated by more than a single factor, and likely
invest abroad not only to gain access to a low-cost resource, but also to improve their efficiency
or their market share. In addition, many firms often find it advantageous to operate close to their
customers in foreign countries, where tastes and preferences may differ from those in the home
market. Foreign markets may also enable multinational firms to access various resources, such as
a well-educated work force, which might contribute to the firm’s R&D activities. Some FDI
activities involve mergers and acquisitions that may help a firm become more globally
competitive.
71. Why has foreign investment increased so dramatically in recent decades?
From 1990 to 2012, the stock, or the cumulative amount, of foreign direct investment in the world
grew by more than tenfold from $1.8 trillion to $23 trillion. This rapid growth arises from a
number of factors. One of the most important factors has been a change in public policies toward
foreign direct investment among most countries. Foreign direct investment (FDI) has come to be
viewed favorably not only by the economically advanced countries, but also by developing
75 According the BEA, direct investment implies that a person in one country has a lasting interest in, and a degree of
influence over, the management of, a business enterprise in another country. As such, it defines FDI as ownership or
control of 10% or more of an enterprise’s voting securities, or the equivalent, is considered evidence of such a lasting
interest or degree of influence over management. 76 Bank of International Settlements, the Anatomy of the Global FX Market Through the Lens of the 2013 Triennial
Survey, BIS Quarterly Review, December 2013, p. 27.

U.S. Trade Concepts, Performance, and Policy: Frequently Asked Questions
Congressional Research Service 34
economies, which now often compete to bring in much-needed capital, technology, and technical
expertise. Currently, about three-fourths of all direct investment is placed among the highly
developed economies where consumer tastes and workers’ wages are comparable.
72. What are the levels of U.S. FDI outflows and inflows?
FDI flows to and from the United States have increased rapidly over the past few decades. From
1990 to 2014, the stock of U.S. FDI abroad rose from $431 billion to nearly $4.9 trillion, while
the stock of FDI in the United States increased from $395 billion to nearly $2.9 trillion (see
Figure 5). The largest destination for total (or the stock of) U.S. FDI outflows through 2013
included the Netherlands, Luxembourg, Canada, Ireland, and the United Kingdom, while the
largest sources of total FDI inflows included the United Kingdom, Japan, the Netherlands,
Canada, and Luxembourg.77
Figure 5. U.S. FDI Outflows and Inflows: 1990-2014
(in billions of U.S. dollars)
Source: Bureau of Economic Analysis.
Note: Data are on a historical-cost basis.
73. What are some of the benefits of FDI?
Generally, economists argue in favor of unimpeded international flows of capital, such as direct
investment, because they estimate that such flows positively affect both the domestic (home) and
foreign (host) economies. For the home country, direct investment benefits the individual firms
that invest abroad, because they are better able to exploit their existing competitive advantages
and to acquire additional skills and advantages. Direct investment also seems to be associated
with a strengthened competitive position, a higher level of skills of the employees, and higher
incomes of firms that invest abroad. Host countries benefit from inward FDI because the
investment adds permanently to the capital stock and often to the skill set of the nation. Direct
investment also brings technological advances, since firms that invest abroad generally possess
advanced technology, processes, and other advantages. Such investment also boosts capital
formation and contributes to a growth in a competitive business environment and productivity. In
77 Source: U.S. Bureau of Economic Analysis. Data are on a historical-cost basis.

U.S. Trade Concepts, Performance, and Policy: Frequently Asked Questions
Congressional Research Service 35
addition, direct investment contributes to international trade and integration into the global
trading community, since most firms that invest abroad are established multinational firms.
74. Are there costs associated with FDI?
Concerned observers argue that U.S. FDI in production facilities abroad supplants U.S. exports,
thereby reducing employment and wages in the U.S. economy. While it appears unlikely that the
overall U.S. employment level is affected by direct investment flows, jobs in particular
companies and sectors can be adversely affected when a company decides to produce similar
products abroad. For example, if a U.S. auto company closed an assembly line in the United
States and opened one in Mexico assembling the same product line, U.S. auto assembly jobs are
lost. Similarly, while inward flows of foreign direct investment tend to create new jobs, there
sometimes is concern that the new foreign owners may not serve as stable and dependable
community partners, as did the previous nationally based ownership.
75. What are Bilateral Investment Treaties (BITs)?
BITs are agreements between two countries for the reciprocal encouragement, promotion, and
protection of investments in each other’s territories. Most treaties contain basic provisions that
cover the following areas: scope and definition of investment, admission and establishment,
national (or non-discriminatory) treatment (often referred to as most-favored-nation treatment),
compensation in the event of expropriation or damage to the investment, guarantees of free
transfers of funds, and dispute settlement mechanisms, both state-state and investor-state. U.S.
BITs have to be ratified by the Senate.
76. What is the Committee on Foreign Investment in the United States (CFIUS) and what
does it do?
CFIUS is an interagency committee that serves the President in overseeing foreign investment
transactions that could affect the national security of the country. CFIUS was established initially
by an executive order of President Ford in 1975 with broad responsibilities and few powers. The
authority to review foreign investments, known as the Exon-Florio provision, was formally
established in 1988 with the passage of P.L. 100-418. In 2007, the Foreign Investment and
National Security Act (P.L. 110-49) established CFIUS itself in statute and expanded the role of
the committee in reviewing foreign investment transactions that could affect “homeland security”
and “critical industries.” Some foreign investors and foreign governments have objected to the
expanded role of CFIUS as being counter to the long-standing U.S. position of an open
investment climate. The authority granted to the President to block foreign investment
transactions, however, has been invoked only twice since 1988, although in a few instances,
issues and concerns raised by CFIUS have led foreign investors to cancel a planned purchase or
to divest itself of the purchase if the deal had had already been completed.
Additional Readings
CRS Reports
CRS Report R43841, International Trade and Finance: Key Policy Issues for the 114th Congress,
2nd Session, coordinated by Mary A. Irace and Shayerah Ilias Akhtar.
CRS Report RL31032, The U.S. Trade Deficit: Causes, Consequences, and Policy Options, by
Craig K. Elwell.
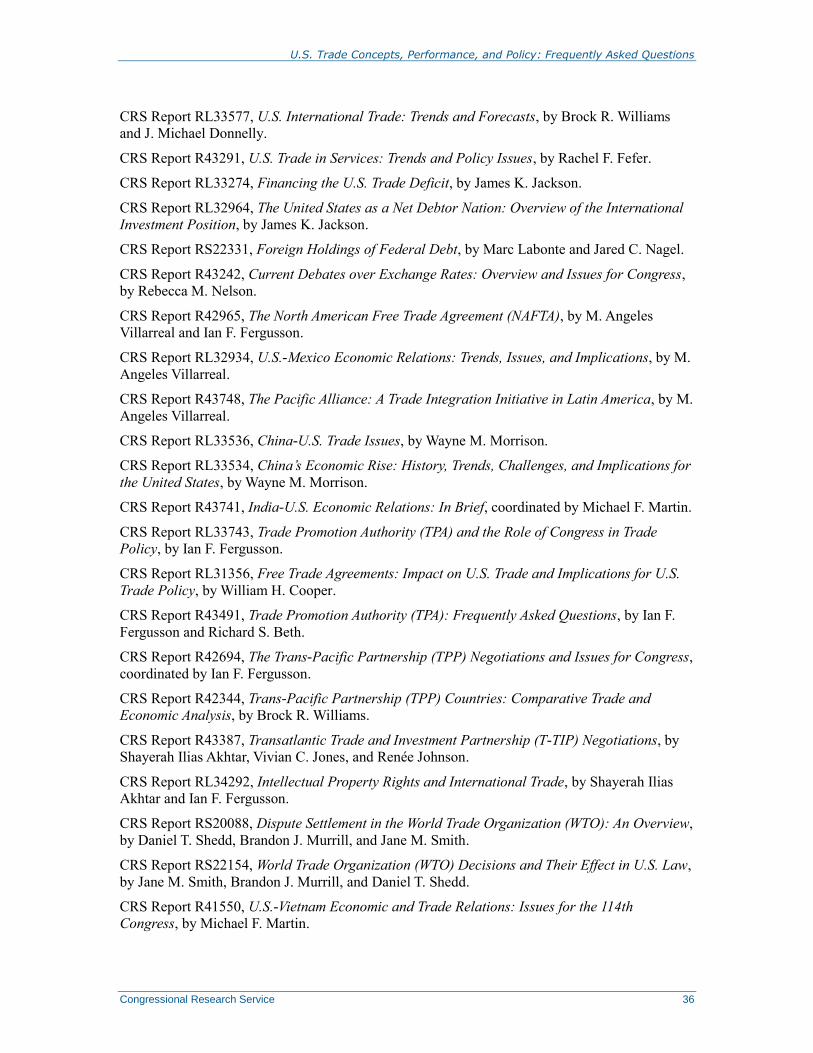
U.S. Trade Concepts, Performance, and Policy: Frequently Asked Questions
Congressional Research Service 36
CRS Report RL33577, U.S. International Trade: Trends and Forecasts, by Brock R. Williams
and J. Michael Donnelly.
CRS Report R43291, U.S. Trade in Services: Trends and Policy Issues, by Rachel F. Fefer.
CRS Report RL33274, Financing the U.S. Trade Deficit, by James K. Jackson.
CRS Report RL32964, The United States as a Net Debtor Nation: Overview of the International
Investment Position, by James K. Jackson.
CRS Report RS22331, Foreign Holdings of Federal Debt, by Marc Labonte and Jared C. Nagel.
CRS Report R43242, Current Debates over Exchange Rates: Overview and Issues for Congress,
by Rebecca M. Nelson.
CRS Report R42965, The North American Free Trade Agreement (NAFTA), by M. Angeles
Villarreal and Ian F. Fergusson.
CRS Report RL32934, U.S.-Mexico Economic Relations: Trends, Issues, and Implications, by M.
Angeles Villarreal.
CRS Report R43748, The Pacific Alliance: A Trade Integration Initiative in Latin America, by M.
Angeles Villarreal.
CRS Report RL33536, China-U.S. Trade Issues, by Wayne M. Morrison.
CRS Report RL33534, China’s Economic Rise: History, Trends, Challenges, and Implications for
the United States, by Wayne M. Morrison.
CRS Report R43741, India-U.S. Economic Relations: In Brief, coordinated by Michael F. Martin.
CRS Report RL33743, Trade Promotion Authority (TPA) and the Role of Congress in Trade
Policy, by Ian F. Fergusson.
CRS Report RL31356, Free Trade Agreements: Impact on U.S. Trade and Implications for U.S.
Trade Policy, by William H. Cooper.
CRS Report R43491, Trade Promotion Authority (TPA): Frequently Asked Questions, by Ian F.
Fergusson and Richard S. Beth.
CRS Report R42694, The Trans-Pacific Partnership (TPP) Negotiations and Issues for Congress,
coordinated by Ian F. Fergusson.
CRS Report R42344, Trans-Pacific Partnership (TPP) Countries: Comparative Trade and
Economic Analysis, by Brock R. Williams.
CRS Report R43387, Transatlantic Trade and Investment Partnership (T-TIP) Negotiations, by
Shayerah Ilias Akhtar, Vivian C. Jones, and Renée Johnson.
CRS Report RL34292, Intellectual Property Rights and International Trade, by Shayerah Ilias
Akhtar and Ian F. Fergusson.
CRS Report RS20088, Dispute Settlement in the World Trade Organization (WTO): An Overview,
by Daniel T. Shedd, Brandon J. Murrill, and Jane M. Smith.
CRS Report RS22154, World Trade Organization (WTO) Decisions and Their Effect in U.S. Law,
by Jane M. Smith, Brandon J. Murrill, and Daniel T. Shedd.
CRS Report R41550, U.S.-Vietnam Economic and Trade Relations: Issues for the 114th
Congress, by Michael F. Martin.

U.S. Trade Concepts, Performance, and Policy: Frequently Asked Questions
Congressional Research Service 37
CRS Report RS22640, What’s the Difference?—Comparing U.S. and Chinese Trade Data, by
Michael F. Martin.
CRS Report RS22823, Overview of Labor Enforcement Issues in Free Trade Agreements, by
Mary Jane Bolle.
CRS Report RL34470, The U.S.-Colombia Free Trade Agreement: Background and Issues, by M.
Angeles Villarreal.
CRS Report R43882, Latin America and the Caribbean: Key Issues for the 114th Congress,
coordinated by Mark P. Sullivan.
CRS Report RL32371, Trade Remedies: A Primer, by Vivian C. Jones.
CRS Report R41916, The U.S. Export Control System and the President’s Reform Initiative, by
Ian F. Fergusson and Paul K. Kerr.
CRS Report RL32461, Outsourcing and Insourcing Jobs in the U.S. Economy: Evidence Based
on Foreign Investment Data, by James K. Jackson.
CRS Report RL33388, The Committee on Foreign Investment in the United States (CFIUS), by
James K. Jackson.
CRS Report RL33436, Japan-U.S. Relations: Issues for Congress, coordinated by Emma
Chanlett-Avery.
CRS Report RS21857, Foreign Direct Investment in the United States: An Economic Analysis, by
James K. Jackson.
CRS Report RS21118, U.S. Direct Investment Abroad: Trends and Current Issues, by James K.
Jackson.
CRS Report R43052, U.S. International Investment Agreements: Issues for Congress, by
Shayerah Ilias Akhtar and Martin A. Weiss.
CRS Report RL34524, International Trade: Rules of Origin, by Vivian C. Jones.
CRS Report R43014, U.S. Customs and Border Protection: Trade Facilitation, Enforcement, and
Security, by Vivian C. Jones and Lisa Seghetti.
CRS Report R41495, U.S. Government Agencies Involved in Export Promotion: Overview and
Issues for Congress, coordinated by Shayerah Ilias Akhtar.
CRS Report R41929, Boosting U.S. Exports: Selected Issues for Congress, by Shayerah Ilias
Akhtar et al.
CRS Report R43581, Export-Import Bank: Overview and Reauthorization Issues, by Shayerah
Ilias Akhtar.
CRS Report R42844, IMF Reforms: Issues for Congress, by Rebecca M. Nelson and Martin A.
Weiss.
CRS Report R43671, Export-Import Bank Reauthorization: Frequently Asked Questions,
coordinated by Shayerah Ilias Akhtar.
CRS Report R43387, Transatlantic Trade and Investment Partnership (T-TIP) Negotiations, by
Shayerah Ilias Akhtar, Vivian C. Jones, and Renée Johnson.
CRS Report RL33867, Miscellaneous Tariff Bills: Overview and Issues for Congress, by Vivian
C. Jones.

U.S. Trade Concepts, Performance, and Policy: Frequently Asked Questions
Congressional Research Service 38
CRS Report RS22204, U.S. Trade Deficit and the Impact of Changing Oil Prices, by James K.
Jackson.
CRS Report R44044, U.S. Trade with Free Trade Agreement (FTA) Partners, by James K.
Jackson.
CRS Report R43988, Issues in International Trade: A Legal Overview of Investor-State Dispute
Settlement, by Brandon J. Murrill and Daniel T. Shedd.
CRS Report R44015, International Investment Agreements (IIAs): Frequently Asked Questions,
coordinated by Martin A. Weiss.
CRS Report RS20210, Trade Adjustment Assistance for Firms: Economic, Program, and Policy
Issues, by Mary Jane Bolle.
CRS Insights and In Focus Products
CRS In Focus IF10166, Environmental Provisions in Free Trade Agreements (FTAs), by Richard
K. Lattanzio and Ian F. Fergusson.
CRS In Focus IF10033, Intellectual Property Rights (IPR) and International Trade, by Shayerah
Ilias Akhtar and Ian F. Fergusson.
CRS In Focus IF10120, Transatlantic Trade and Investment Partnership (T-TIP), by Shayerah
Ilias Akhtar and Vivian C. Jones.
CRS In Focus IF10017, Export-Import Bank of the United States (Ex-Im Bank), by Shayerah Ilias
Akhtar.
CRS In Focus IF10161, International Trade Agreements and Job Estimates, by James K. Jackson.
CRS In Focus IF10112, Introduction to Financial Services: The International Foreign Exchange
Market, by James K. Jackson.
CRS In Focus IF10156, U.S. Trade Policy: Background and Current Issues, by Shayerah Ilias
Akhtar, Ian F. Fergusson, and Brock R. Williams.
CRS In Focus IF10052, U.S. International Investment Agreements (IIAs), by Martin A. Weiss and
Shayerah Ilias Akhtar.
CRS In Focus IF10149, African Growth and Opportunity Act (AGOA), by Brock R. Williams.
CRS In Focus IF10000, The Trans-Pacific Partnership (TPP): An Overview, by Brock R.
Williams and Ian F. Fergusson.
CRS In Focus IF10038, Trade Promotion Authority (TPA), by Ian F. Fergusson.
CRS In Focus IF10041, Reductions to Mandatory Agricultural Conservation Programs in
Appropriations Law, by Megan Stubbs.
CRS In Focus IF10049, Debates over “Currency Manipulation”, by Rebecca M. Nelson.
CRS In Focus IF10046, Worker Rights Provisions in Free Trade Agreements (FTAs), by Mary
Jane Bolle and Ian F. Fergusson.
CRS In Focus IF10002, The World Trade Organization, by Ian F. Fergusson and Rachel F. Fefer.
CRS In Focus IF10030, U.S.-China Trade Issues, by Wayne M. Morrison.
CRS In Focus IF10119, U.S.-China Relations, by Susan V. Lawrence and Wayne M. Morrison.

U.S. Trade Concepts, Performance, and Policy: Frequently Asked Questions
Congressional Research Service 39
CRS In Focus IF10110, China as the World’s “Largest Economy”, by Wayne M. Morrison.
CRS In Focus IF10139, China’s Currency Policy, by Wayne M. Morrison.
CRS In Focus IF10045, Cuba: President Obama’s New Policy Approach, by Mark P. Sullivan.
CRS In Focus IF10047, North American Free Trade Agreement (NAFTA), by M. Angeles
Villarreal.
Other Readings
Office of the United States Trade Representative, 2014 Trade Policy Agenda and 2013 Annual
Report, March 2014, at http://www.ustr.gov.
Office of the United States Trade Representative, 2014 National Trade Estimate Report on
Foreign Trade Barriers, March 2014, at http://www.ustr.gov.
Office of the United States Trade Representative, 2014 Special 301 Report, April 2014, at
http://www.ustr.gov.
U.S. Congress, House Ways and Means Committee, Overview and Compilation of U.S. Trade
Statutes, 2013 Edition, January 2013, at http://waysandmeans.house.gov/uploadedfiles/
2013_blue_book_.pdf.
The White House, Council of Economic Advisers, 2014 Economic Report of the President, at
http://www.whitehouse.gov/administration/eop/cea/economic-report-of-the-President/2014.
List of Questions
Trade Concepts
1. Why do countries trade?
2. What is comparative advantage?
3. What determines comparative advantage?
4. Can governments shape or distort comparative advantage?
5. What is the terms of trade?
6. What are the costs of trade expansion?
7. Does trade destroy jobs?
8. Does trade reduce the wages of U.S. workers?
9. What is intra-industry trade?
10. What is economic globalization?
11. What are global supply chains and how do they relate to economic globalization?
12. How does globalization affect job security?
U.S. Trade Performance
13. Which are the largest global trading economies?

U.S. Trade Concepts, Performance, and Policy: Frequently Asked Questions
Congressional Research Service 40
14. What is meant by the trade deficit?
15. Why does the United States run a trade deficit?
16. How significant is the size of the U.S. trade deficit and how does it compare with other major
economies?
17. What role do foreign trade barriers play in causing bilateral trade deficits?
18. How does the trade deficit affect the exchange value of the dollar?
19. How is the trade deficit financed?
20. Is the trade deficit a problem for the U.S. economy?
21. How long can the United States keep running trade deficits?
22. How can the trade deficit be further reduced?
Understanding Data on U.S. Trade and the Economy
23. How important is trade to the U.S. economy?
24. Who are the leading U.S. trade partners?
25. How does “economic globalization” complicate interpretation of U.S. trade data?
U.S. Manufacturing and Services
26. Is the U.S. manufacturing sector shrinking?
27. What is trade in services and how is it different from goods trade?
28. How is digital trade different from other trade in goods and services?
Formulation of U.S. Trade Policy
29. What role does Congress play in the making of trade policy?
30. What committees take the lead in exercising congressional authority over trade?
31. In what explicit ways does Congress make trade policy?
32. How can individual Members affect trade policy decisions?
33. What is meant by fast track or Trade Promotion Authority (TPA)?
34. Who is in charge of U.S. trade policy?
35. Why was the USTR created?
36. How are trade decisions made?
37. What are the functions of the executive branch in U.S. trade?
38. When does the President get involved in trade decisions?
39. What is the formal role of the private sector?
40. What is the informal role that the private sector plays in the formulation of U.S. trade policy?
41. Why do groups attempt to lobby on trade decisions?
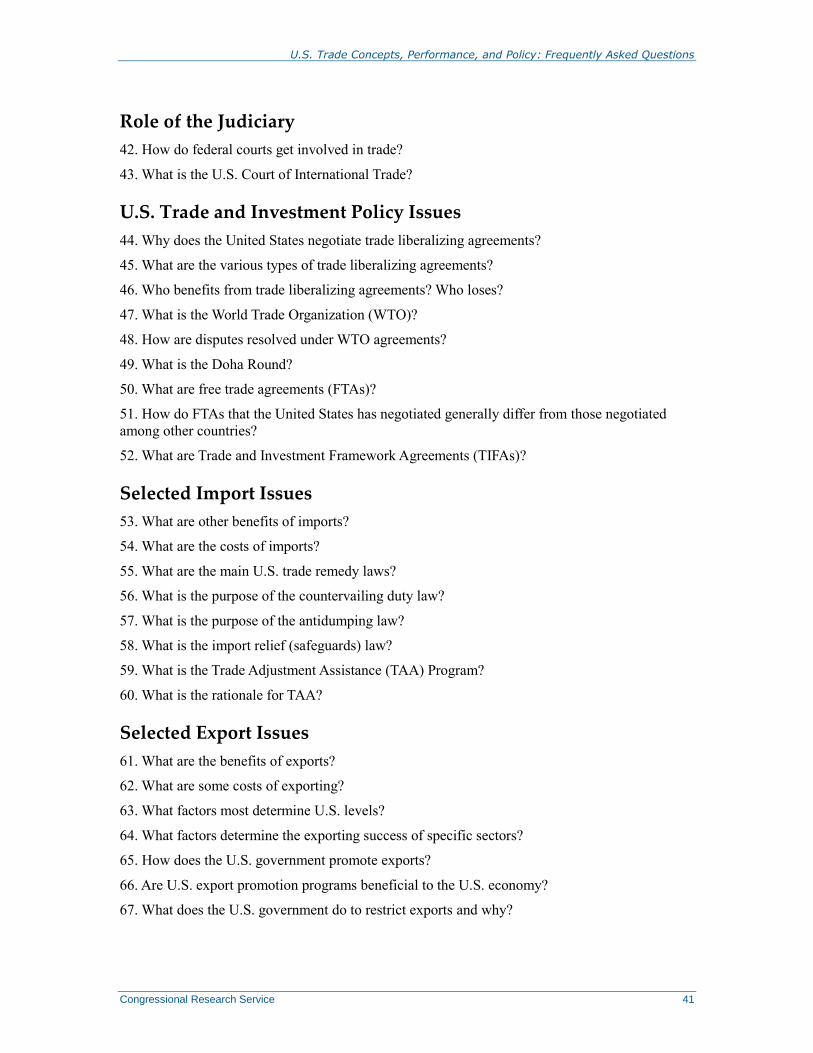
U.S. Trade Concepts, Performance, and Policy: Frequently Asked Questions
Congressional Research Service 41
Role of the Judiciary
42. How do federal courts get involved in trade?
43. What is the U.S. Court of International Trade?
U.S. Trade and Investment Policy Issues
44. Why does the United States negotiate trade liberalizing agreements?
45. What are the various types of trade liberalizing agreements?
46. Who benefits from trade liberalizing agreements? Who loses?
47. What is the World Trade Organization (WTO)?
48. How are disputes resolved under WTO agreements?
49. What is the Doha Round?
50. What are free trade agreements (FTAs)?
51. How do FTAs that the United States has negotiated generally differ from those negotiated
among other countries?
52. What are Trade and Investment Framework Agreements (TIFAs)?
Selected Import Issues
53. What are other benefits of imports?
54. What are the costs of imports?
55. What are the main U.S. trade remedy laws?
56. What is the purpose of the countervailing duty law?
57. What is the purpose of the antidumping law?
58. What is the import relief (safeguards) law?
59. What is the Trade Adjustment Assistance (TAA) Program?
60. What is the rationale for TAA?
Selected Export Issues
61. What are the benefits of exports?
62. What are some costs of exporting?
63. What factors most determine U.S. levels?
64. What factors determine the exporting success of specific sectors?
65. How does the U.S. government promote exports?
66. Are U.S. export promotion programs beneficial to the U.S. economy?
67. What does the U.S. government do to restrict exports and why?

U.S. Trade Concepts, Performance, and Policy: Frequently Asked Questions
Congressional Research Service 42
Investment Issues
68. What are the main kinds of capital flows?
69. Which is larger—trade or capital flows?
70. Why do companies invest abroad?
71. Why has foreign investment increased so dramatically in recent decades?
72. What are the levels of U.S. FDI outflows and inflows?
73. What are some of the benefits of FDI?
74. Are there costs associated with FDI?
75. What are Bilateral Investment Treaties (BITs)?
76. What is the Committee on Foreign Investment in the United States (CFIUS) and what does it
do?
Appendix This appendix provides a list of acronyms used throughout the report.
Acronym Name
Page
Number
ACTPN Advisory Committee for Trade Policy and Negotiations 22
AD Anti-Dumping 28
ASEAN Association of Southeast Asian Nations 27
BIT Bilateral Investment Treaties 35
CFIUS Committee on Foreign Investment in the United States 35
CVD Countervailing Duty 28
DDA Doha Development Agenda 26
ECA Export Credit Agency 31
Ex-Im Export-Import Bank 30
EU European Union Summary
FDI Foreign Direct Investment 24
FER Foreign Exchange Reserves 28
FPI Foreign Portfolio Investment 32

U.S. Trade Concepts, Performance, and Policy: Frequently Asked Questions
Congressional Research Service 43
FTA Free Trade Agreement 26
GATS General Agreement on Trade in Services 21
GATT General Agreement on Tariffs and Trade 25
GDP Gross Domestic Product 24
GSP U.S. Generalized System of Preferences Summary
IAPE Office of Intergovernmental Affairs & Public Engagement 22
IPR Intellectual Property Rights 11
ITA Information Technology Agreement Summary
ITA International Trade Administration 30
MNC Multinational Corporations 5
NAFTA North American Free Trade Agreement 24
NEI National Export Initiative 30
OECD Organization for Economic Cooperation and Development 16
OPIC Overseas Private Investment Corporation 30
R&D Research and Development 6
SME Small- and Medium-Sized Enterprises 6
SOE State Owned Enterprises 24
TAA Trade Adjustment Assistance 20
TFA Trade Facilitation Agreement 26
TIFA Trade and Investment Framework Agreements 27
TISA Trade in Services Agreement 21
TPA Trade Promotion Authority 20
TPP Trans-Pacific Partnership 21
TPRG Trade Policy Review Group 21
TPSC Trade Policy Staff Committee 21

U.S. Trade Concepts, Performance, and Policy: Frequently Asked Questions
Congressional Research Service 44
TRIPS Trade-Related Aspects of Intellectual Property Rights 25
T-TIP Transatlantic Trade and Investment Partnership 21
USCIT U.S. Court of International Trade 23
USITC United States International Trade Commission 22
USTR United States Trade Representative 21
WEF World Economic Forum 8
WTO World Trade Organization 25
Author Contact Information
Wayne M. Morrison
Specialist in Asian Trade and Finance
[email protected], 7-7767
M. Angeles Villarreal
Specialist in International Trade and Finance
[email protected], 7-0321
James K. Jackson
Specialist in International Trade and Finance
[email protected], 7-7751
Rachel F. Fefer
Analyst in International Trade and Finance
[email protected], 7-1804
Vivian C. Jones
Specialist in International Trade and Finance
[email protected], 7-7823
Ashley Feng
Research Associate
[email protected], 7-0738