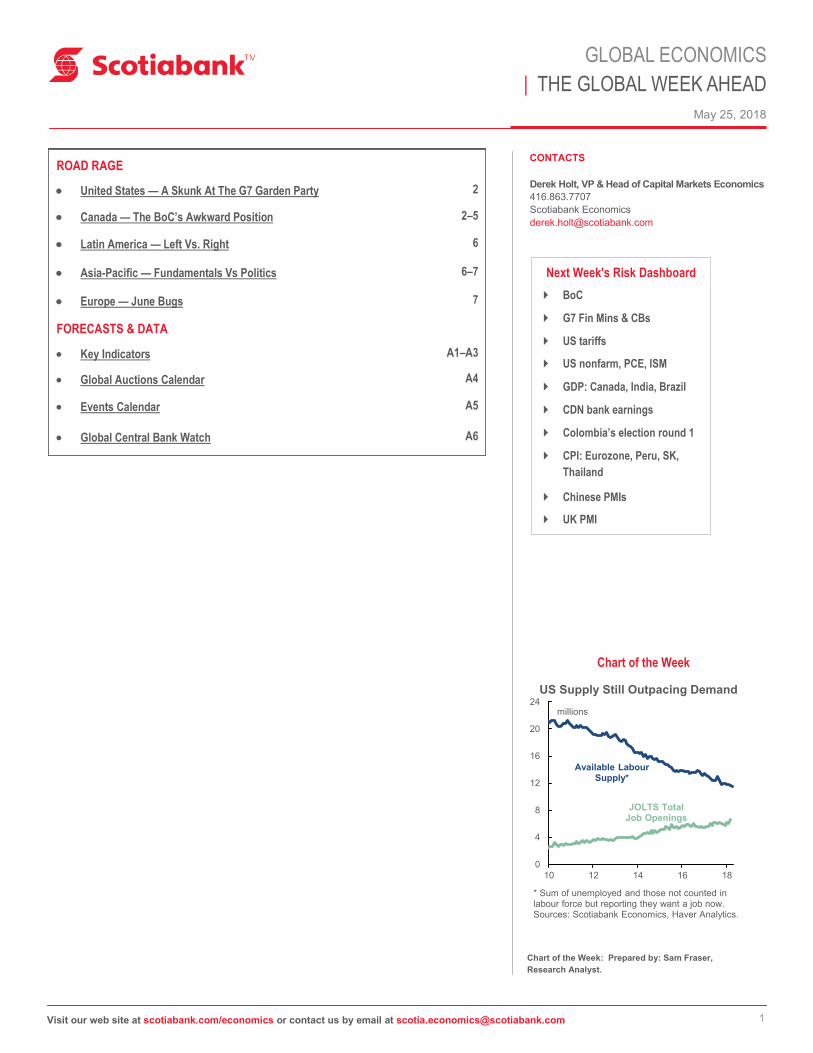
us supply still outpacing demand - gbm.scotiabank.com · global economics | the global week ahead...
TRANSCRIPT
1
May 25, 2018
GLOBAL ECONOMICS
| THE GLOBAL WEEK AHEAD
Visit our web site at scotiabank.com/economics or contact us by email at [email protected]
CONTACTS
Derek Holt, VP & Head of Capital Markets Economics
416.863.7707
Scotiabank Economics
Chart of the Week
ROAD RAGE
United States — A Skunk At The G7 Garden Party 2
Canada — The BoC’s Awkward Position 2–5
Latin America — Left Vs. Right 6
Asia-Pacific — Fundamentals Vs Politics 6–7
Europe — June Bugs 7
FORECASTS & DATA
Key Indicators A1–A3
Global Auctions Calendar A4
Events Calendar A5
Global Central Bank Watch A6
Next Week's Risk Dashboard
BoC
G7 Fin Mins & CBs
US tariffs
US nonfarm, PCE, ISM
GDP: Canada, India, Brazil
CDN bank earnings
Colombia’s election round 1
CPI: Eurozone, Peru, SK,
Thailand
Chinese PMIs
UK PMI
Chart of the Week: Prepared by: Sam Fraser,
Research Analyst.
0
4
8
12
16
20
24
10 12 14 16 18
US Supply Still Outpacing Demand
millions
* Sum of unemployed and those not counted in labour force but reporting they want a job now. Sources: Scotiabank Economics, Haver Analytics.
Available Labour Supply*
JOLTS Total Job Openings

2
May 25, 2018
GLOBAL ECONOMICS
| THE GLOBAL WEEK AHEAD
Visit our web site at scotiabank.com/economics or contact us by email at [email protected]
Road Rage
UNITED STATES—A SKUNK AT THE G7 GARDEN PARTY
US markets start off closed on Monday for the Memorial Day holiday and will turn to a heavy fundamentals-based calendar of
market risks late in the week.
Protectionism is likely to figure prominently when G7 Finance Ministers and central bank heads gather in Whistler, British
Columbia, Canada on Thursday evening and then hold press conferences on Saturday June 2nd. The theme of the meeting is
“investing in growth that works for everyone.” The full agenda is here. In the wake of President Trump’s instruction to the
Commerce Department to initiate a Section 232 investigation of auto imports as a national security threat it’s likely that US
Treasury Secretary Mnuchin and Fed Chair Powell may hear a lot of protests notwithstanding their distance from Trump as freer
traders. It will be interesting to see how protectionism is spun as something that “works for everyone”. This meeting tees up the
meeting of G7 leaders next month in Quebec. Canada holds the G7 Presidency this year.
The three main macro developments will be as follows. On balance, little wage and price pressure is expected while activity
readings drawn from hiring and manufacturing reports should indicate solid momentum. Since the Fed has signaled
tolerance toward modestly and temporarily overshooting its 2% inflation target, markets may put a bigger weight on possible
upsides to activity readings.
1. PCE inflation: Thursday’s update on consumer spending in April will begin to
inform Q2 consumption growth tracking. After 4% consumption growth in inflation-
adjusted terms during Q4, the first quarter began the year with a whimper at 1.1%
annualized consumption growth. The way Q1 averaged and ended hands-off
momentum of just under 1% annualized growth into Q2 before actual monthly data
begins to arrive. More important may be headline and core inflation pressures. After
CPI ticked higher to 2.5% y/y and core held steady at 2.1%, the price deflator for
total consumer spending might perform similarly but there is always risk in how CPI
translates into PCE inflation. The latter is of course the Fed’s preferred measure.
2. Nonfarm payrolls and wages: My best guess for Friday’s job growth is about
+180k and with wage growth stagnant at around 2.6% y/y. Wage growth has been
averaging 2.6% since the start of 2016 and, while it has had ups and downs within
a roughly 2.3–2.8% spread, the trend has been fairly stable. Of note, however, is
that recently rising inflation has eaten into nominal wage growth enough to keep
inflation-adjusted or real wages flat (chart 1). Ergo, consumers are neither gaining
nor falling behind a mild acceleration in the cost of living.
3. ISM-manufacturing: Friday’s ISM-manufacturing report for May should halt a
two-month deceleration that nevertheless still left strong growth intact. The best correlated regional gauges with ISM are the
Philly Fed and Richmond Fed manufacturing measures and they both moved materially higher in their latest readings.
Other reports will include the second estimate of Q1 GDP growth (Wednesday) that is usually just about relatively modest updates
of data received since the initial estimate and ahead of the third estimate that incorporates more complete service sector data.
Repeat sales house prices (Tuesday), the Conference Board’s consumer confidence measure for May (Tuesday), ADP private
payrolls for May (Wednesday), the Fed’s Beige book of regional conditions (Wednesday), pending home sales for April (Thursday)
and then construction spending for April (Friday) round things out.
CANADA—THE BoC’s AWKWARD POSITION
The Bank of Canada rate decision and statement on Wednesday will be the main event of the week. Monthly GDP arrives
afterward and the bank earnings season continues.
-2
-1
0
1
2
3
4
5
08 09 10 11 12 13 14 15 16 17 18
Price Pressures Crimping Real Wage Growth
y/y % change
US real average hourly earnings, private sector
Sources: Scotiabank Economics, Bloomberg.
Chart 1

3
May 25, 2018
GLOBAL ECONOMICS
| THE GLOBAL WEEK AHEAD
Visit our web site at scotiabank.com/economics or contact us by email at [email protected]
The BoC is forecast to hold its policy rate at 1.25% on Wednesday in a
statement-only affair. In our opinion, the BoC is in the awkward position of having to
run the risk of an overheating economy that would otherwise require tighter monetary
policy if it were not for key sources of heightened uncertainty, particularly of late.
Should those sources of uncertainty diminish, then the BoC may have to tighten
monetary policy at an expedited pace thereafter.
The main source of uncertainty lies in trade policy although broader geopolitical risks
remain present (Iran, NK, Eurozone, etc.). Just when it appeared that US-China trade
frictions were settling down as President Trump met his match in President Xi Jinping
and as the risk of abrogating the NAFTA agreement was pushed lower partly due to
domestic US lobbying efforts, recent developments have become more disturbing in
terms of possible implications.
The Trump administration’s surprise decision to have the Commerce Department use
Section 232 provisions to investigate whether auto and parts imports are a national
security threat puts both the global auto sector and NAFTA negotiations at risk. It’s
highly unlikely that the BoC would throw caution to the wind by raising borrowing costs
and adding to C$ strength until markets are better informed about which path the
investigations may pursue. My inclination is to think that the domestic lobby in the US—
including US auto manufacturers, consumer groups and the subsidiaries, suppliers and
dealer networks of foreign automakers—would aggressively push back on the threat of
tariffs, voluntary or involuntary export restraints, and other possible measures. The risk
of retaliation by America’s allies that are being targeted with potential measures could
also motivate cooler heads in the longer run. But that outcome needs to be further
informed by the outcome of the investigation, President Trump’s possible actions
thereafter and the international response. Until such point—which could take months—it
is conceivable that Canadian monetary policy is on hold and the US administration’s
tactics may essentially put added downside risk to the Canadian currency.
Regardless, a hold call could well allow potential imbalances to continue to fester over
time. Below is a list of several motivations for believing this.
1. The current real policy rate remains at about -1% and suggests that the BoC’s
three nominal overnight policy rate hikes since last July have only kept pace with
inflation (chart 2). If borrowing costs have risen at the same time that prices
charged to consumers have increased at an accelerated rate, then monetary
policy has arguably not tightened one bit; indeed it may remain excessively easy.
2. Relative to other global central banks, Canada’s real policy rate is looking rather
Japanese or European, yet the economy definitely is not (chart 3). The BoC is
behind the Fed’s cumulative policy rate hikes and the effects of Fed balance
sheet unwinding as the US tightens both conventional and unconventional
monetary policy. The Fed has hiked 150bps (soon 175bps) without breaking a
sweat while markets fret over the BoC’s three quarter-point rate hikes to date.
Starting points matter, such that the argument that the BoC cannot exceed the
pace of Fed rate hikes going forward seems invalid.
3. Broader financial conditions reinforce how easy financial conditions are at
present. High yield sits at a record high, various fixed income spreads are rather
tight and the currency is probably undervalued given where the terms of trade
sit. See charts 4–6.
-3
-2
-1
0
1
2
3
4
5Easy Canadian Money
real central bank policy rates, %
Sources: Scotiabank Economics, Bloomberg.
-3
-2
-1
0
1
10 11 12 13 14 15 16 17 18
%, overnight policy rate minus CPI y/y
Sources: Scotiabank Economics, Bank of Canada, Statistics Canada.
BoC's Real Policy Rate Hasn't Budged
80
90
100
110
120
130
140
13 14 15 16 17 18
A Frothy High Yield Market
index level
CAD High yieldcorporate bond
index
Sources: Scotiabank Economics, Bloomberg.
Chart 2
Chart 3
Chart 4

4
May 25, 2018
GLOBAL ECONOMICS
| THE GLOBAL WEEK AHEAD
Visit our web site at scotiabank.com/economics or contact us by email at [email protected]
4. The materially stronger-than-expected improvement in the terms of trade is a positive exogenous income shock to the
economy with trickle down benefits (chart 7). Its sharp weakening was the reason the BoC cut rates in 2015; a symmetrical
bias should lead to incremental policy tightening this time notwithstanding the major difference between now and back then
which is heightened uncertainty over trade policy directions. Indeed the terms of trade—export prices relative to import
prices—sit at the most elevated level since late 2014 with broad-based gains across commodities (charts 8–9). Production
bottlenecks in some sectors like limited pipeline capacity probably only fan inflation risk.
5. Recent activity readings have been mostly stronger in favour of a late Q1 into Q2 rebound narrative following transitory
headwinds earlier in the year while two of the BoC’s three core CPI measures are above 2% and rising somewhat faster than
stateside (chart 10).
6. Real wage growth lies at almost a two-year high with probable further upward pressure upon wage gains (chart 11). This
transparent price measure indicates a variety of influences including higher minimum wage effects with more to come but also
tightening labour market conditions.
7. Canada is running largely at capacity with the BoC’s twin output gap measures having shut (chart 12) and industrial capacity
utilization at about an eleven-year high (chart 13). We view a moderate evolving investment impulse that operates as a lift to
aggregate demand as more likely to generate further inflation than the BoC appears to believe.
0.0
0.1
0.2
0.3
0.4
0.5
0.6
0.7
0.8
09 10 11 12 13 14 15 16 17 18
Canadian Mortgage Bond Spreads
spread vs. Canadian 10-Year bond, %
Canadian Housing Trust Benchmark 10-Year
Source: Scotiabank Economics, Bloomberg.
0.4
0.6
0.8
1.0
1.2
1.4
1.6
1.8
2.0
09 10 11 12 13 14 15 16 17 18
Provincial Bond Spreads
spread vs. Canadian 10-Year bond, %
Province of Quebec Benchmark 10-Year
Source: Scotiabank Economics, Bloomberg.
Province of Ontario Benchmark 10-Year
0.70
0.75
0.80
0.85
0.90
0.95
1.00
1.05
1.10
1.15
98 00 02 04 06 08 10 12 14 16 18
Canada's Terms Of Trade
export / import prices
Source: Scotiabank Economics, Statistics Canada
0
100
200
300
400
500
600
700
00 02 04 06 08 10 12 14 16 18
Lumber Prices Going to the Moon
USD/mfbm
Sources: Scotiabank Economics, Random Lengths, Bloomberg.
Lumber near-by futures
0
20
40
60
80
100
120
140
160
14 15 16 17 18
Commodities in Recovery
index level, Jan 1. 2014= 100
Industrialmetals
Sources: Scotiabank Economics, Thomson Reuters, Bloomberg.
Preciousmetals
Agriculture
Energy
1.2
1.4
1.6
1.8
2.0
14 15 16 17 18
y/y % change
Sources: Scotiabank Economics, Statistics Canada, BEA.
CDN Core Inflation RisingFaster Than in the US
CA average core inflation
US core PCE
Chart 5 Chart 6 Chart 7
Chart 8 Chart 9 Chart 10

5
May 25, 2018
GLOBAL ECONOMICS
| THE GLOBAL WEEK AHEAD
Visit our web site at scotiabank.com/economics or contact us by email at [email protected]
-6
-3
0
3
07 09 11 13 15 17 19
Canadian Output Gap
%
Sources: Scotiabank Economics, Bank of Canada.
Traditional extended multivariate gap
Integrated framework gap
Scotiabank Economics
forecast
0
1
2
3
4
14 15 16 17 18
SEPH Hourly Earnings of All Empl.*
LFS Hourly Wage Permanent Empl.
Canadian Wage Growth
y/y % change
* Weighted hourly earnings of salaried and hourly employees. Sources: Scotiabank Economics, Statistics Canada.
8. The BoC forecasts inflation to persistently remain above 2% throughout the
2018–2021 forecast horizon despite Governor Poloz’s references to transitory
influences. Their forecasts embed an unknown rate profile that is assumed to
point to policy tightening. Should trade tensions subside and policy tightening be
delayed, there may be upside risk to the BoC’s inflation forecasts. Further, we
take the BoC’s remarks that the economy is 50% more sensitive to rate hikes
today than in past cycles as more of a caution on the ultimate terminal rate
versus an argument against remaining on a steady hike trajectory. The BoC’s
real neutral policy rate of 1% today is about ½% lower than a few years ago.
Given ranges applied to these estimates, it is not inconceivable that the real
neutral rate is as much as 50% lower today than in the past. This argument
does not counsel avoiding rate hikes with the present real policy rate set about
200bps below the BoC’s neutral real policy rate estimate.
9. The risk of abrogating the NAFTA agreement is probably low on balance due in
large part to the powerful business and political lobby in the US that favours
maintaining NAFTA and given the path to the mid-term Congressional elections.
Negotiating uncertainty will continue to overhang the outlook and our house
assumption is that no agreement will be reached and passed in all three
countries until at least next year. Monetary policy cannot be put on indefinite
hold throughout this period of time without exacerbating further domestic
imbalances.
10. On housing, weakness in the Toronto region is partly offset by strengths
elsewhere including Vancouver and offset by expected strengths in other areas
of the economy. A stronger housing market in southern Ontario is expected later
in the year and into next year. The key Spring market is mostly guarded against
rate risk already given rate commitments embedded within mortgage pre-
approvals that pass on lower rates to buyers while leaving it to lenders to hedge
the risk of higher rates than the commitments. Solid income gains, balanced
supply and demand ratios, higher immigration and transitory adjustments to
tightened macroprudential rules in the context of a very different mortgage
market in Canada than the US should enable the market to withstand tightened
monetary policy. Indeed, the BoC would likely be happy with sustained cooler
housing markets.
The Q2 bank earnings season wraps up with BNS (my employer) on Tuesday
followed by BMO, National and Laurentian on Wednesday.
Thursday’s GDP growth report may either validate a hawkish hold or a
possible rate hike. My regression model of GDP against higher-frequency activity
readings leans toward 0.3% m/m growth in seasonally adjusted terms back in March.
The BoC anticipated growth of 1.3% in Q1 in the April MPR after previously
forecasting Q1 growth of 2.5% in the January MPR. Current tracking of Q1 GDP
growth lies on the order of about 2% aided by the possibility that stronger growth in
imports than domestic spending over the past couple of quarters may have also
driven inventory investment. If so, then growth is somewhat exceeding the BoC’s
expectations to start the year. With that, the output gap is roughly shut right now
given that the BoC’s estimate for Q1 ranged from -0.1% to -0.4% using the
integrated framework and extended multivariate approaches respectively.
65
70
75
80
85
90
00 02 04 06 08 10 12 14 16 18
CDN Industry Faces Greater Capacity Pressures
%
US capacityutilization
rate
Sources: Scotiabank Economics, Federal Reserve Board, Statistics Canada.
Canadian capacity
utilization rate
Chart 11
Chart 12
Chart 13

6
May 25, 2018
GLOBAL ECONOMICS
| THE GLOBAL WEEK AHEAD
Visit our web site at scotiabank.com/economics or contact us by email at [email protected]
LATIN AMERICA—LEFT VS. RIGHT
Colombia’s election and a select number of macroeconomic updates will be the main focal points. The bigger Colombian
political risk is likely to come next month.
The first round of Colombia’s Presidential election will be held this Sunday.
There are five main candidates and the top two will go on to the second and
determining round on June 17th. Current polling (chart 14) indicates that the first round
may already be settled given the large leads held by right wing candidate Iván Duque
and left wing candidate Gustavo Petro. This election brings two firsts for Colombia.
One is the best chance the left has had to seriously contend. Two is the first electoral
challenge by a former member of a guerilla group. Petro was once a member of the
now departed M-19 Marxist rebel group. Duque is well in front of the current polls, but
polls have not performed well in Colombian politics. A major issue will be how voter
sentiment is expressed with respect to support for a former guerilla group member in
the wake of the contentious peace deal with the Revolutionary Armed Forces of
Colombia (a.k.a. Farc) that has divided voters.
Brazil’s Q1 GDP growth rate (Wednesday) is expected to begin to restore a more
favourable trend over the course of this year. Growth peaked in Q1 last year and
has been waning since with the economy’s growth rate just barely staying in the black
in Q4.
Is Peru’s inflation rate bottoming? The low of 0.36% y/y in March moved slightly higher in April for the first time since last
August. May’s reading will help to inform whether this is the start of an upward trend. Peru’s inflation rate is expected to rise by just
above 2% by year-end and the central bank has indicated it is looking through the transitory downsides.
Chile updates macro reports that will inform Q2 GDP growth tracking risks. April editions of reports on industrial production
(Thursday), retail sales (Friday) and the unemployment rate (Thursday) will be released. Q1 growth in year-ago terms was 4.2%
which was the strongest in almost five years.
Banxico releases meeting minutes to elaborate upon the May 17th hold decision. The minutes may already be stale in light of
the US Section 232 investigation of the global auto sector (including Mexico’s).
ASIA-PACIFIC—FUNDAMENTALS VS POLITICS
Whether a significant calendar of Asian macro releases will matter to global markets
will depend upon random possible developments surrounding the on-off summit
between the US and North Korea and somewhat related US-China trade tensions.
China updates purchasing managers’ indices on Wednesday evening (ET) for the
state versions and then starting on Thursday evening for the private manufacturing
PMI. They are May readings and so we are pushing well past the Lunar New Year
distortions and into the cleaner period during which it is easy to evaluate growth
momentum. PMIs are likely to continue to indicate that broad growth remains modest,
but a risk is whether US-China trade tensions begin to show up as a drag effect
on activity and sentiment. Some readings like the sometimes popular Keqiang index
have indicated somewhat waning growth momentum in China’s economy despite the
remarkable stability of Chinese GDP growth (chart 15). The index, however, speaks to
a time before services came to dominate growth in China’s economy and attaches
largely arbitrary weights to bank lending, electricity consumption and rail freight
volumes. These readings have been referenced as Premier Li Keqiang’s preferred
metrics following his remark in 2010 that GDP is “man made”. China also releases
0
10
20
30
40
Jan-18 Feb-18 Mar-18 Apr-18 May-18
%
Sources: Scotiabank Economics, Cifras y Conceptos.
Colombian Election Poll
Ivan Duque
Gustavo Petro
Sergio Fajardo
German Vargas Lleras
Humberto de la Calle
0
2
4
6
8
10
12
14
16
11 12 13 14 15 16 17 18
Is China's Growth MomentumWaning Again?
%
Sources: Scotiabank Economics, Bloomberg.
Li Keqiang Index
Chart 14
Chart 15

7
May 25, 2018
GLOBAL ECONOMICS
| THE GLOBAL WEEK AHEAD
Visit our web site at scotiabank.com/economics or contact us by email at [email protected]
industrial profits in April this weekend but the waning year-ago growth rate is mostly about a re-basing to the very rapid rates of
profit growth that were being registered a year ago.
India’s Q1 GDP growth rate will be released on Thursday morning (ET). Growth is expected to hang in just north of 7% y/y and
hence retain the acceleration that has been achieved toward the quickest growth rate since 2016Q3. The rupee has been among
the more challenged currencies this year and has lost about 6% of its value versus the USD since the end of January while
underperforming all other Asian FX crosses. The currency has stabilized more recently, partly in the aftermath of the FOMC
minutes that tamped down market expectations for additional Fed hikes this year. By corollary, that stems concerns about capital
flight from across Emerging Markets (EMs) and it may well be the case that respected academics piled on the anti-EM bandwagon
at precisely the wrong moment. Should next week’s growth figures remain resilient then it would reinforce more recent currency
moves.
Japan updates a wave of macro reports that will inform Q1 GDP revisions and Q2 growth tracking. They will include April’s
retail sales on Tuesday night (ET), industrial output and housing starts the following night plus Q1 capital spending also on
Thursday night. The capital spending figures can often lead to material Q1 GDP revisions when the imputed numbers are then
followed by actual estimates. It wouldn’t take much of a surprise on cap-ex to make the difference between growth and no growth
in the Japanese economy during the first quarter given the first swing at the estimates showed a slight contraction of -0.6% q/q in
seasonally adjusted annualized terms and downward revision to the prior quarter’s growth from 1.6% to 0.6%.
Last, a pair of regional CPI prints for May will be released by South Korea and Thailand on Thursday night (ET). Both countries
are expected to continue to register inflation that is well below the Bank of Korea’s 2% and toward the bottom end of the
Bank of Thailand’s 1–4% inflation targets.
EUROPE—JUNE BUGS
Three main considerations worth paying particular attention to in European
markets, with possible global market spillovers, will include the ongoing
dialogue over US tariff exemptions, cleaner post-Easter Eurozone inflation
readings, and waning UK growth signals.
Did the Easter Bunny wreak havoc with Eurozone inflation in April? That
seemed to be among the considerations given that ‘supercore’ inflation excluding
packaged holiday prices was somewhat more resilient than just plain old ‘core’
inflation in April (chart 16). We’ll find out more when May’s figures land on Thursday
but the first pass each month leaves important details out of the picture and so full
judgement will have to be deferred until the greater details and revisions on June
15th. Germany will provide a hint the day before when it updates CPI.
With the calendar flipping over into June on Friday, tariff waiver discussions
between the US and its allies are getting down to the final window of
opportunity before tensions surrounding the protectionist US steel and
aluminum measures rise. By the end of the third week in June, the US
administration must decide whether to grant the European Union a permanent
exemption from the tariffs just as both the EU and Japan (not granted a waiver)
notified the WTO this past week of their intention to impose retaliatory tariffs. Both notifications involved small amounts of US
goods including Japan’s targeted half billion of US exports and the EU’s targeted US$3.3 billion of US exports.
UK growth momentum will be informed by Friday’s purchasing managers’ index for the manufacturing sector in May. The
PMI has been declining for five consecutive months and so it’s hard to pin weakness upon temporary considerations like weather.
More likely is that the modest rise in the PMIs over 2016H2 and much of 2017 had more to do with the transitory positive
influences of post-Brexit currency depreciation that is now shaking out of the growth readings.
0.0
1.0
2.0
11 12 13 14 15 16 17 18
Did the Easter Bunny Skew Eurozone Inflation?
y/y % change
Sources: Scotiabank Economics, Bloomberg.
Eurozone core inflation
Eurozone supercore inflation ex. package
holidays
Chart 16

1 Visit our web site at scotiabank.com/economics or contact us by email at [email protected]
May 25, 2018
GLOBAL ECONOMICS | THE GLOBAL WEEK AHEAD
Key Indicators for the week of May 28 – June 1
NORTH AMERICA
Forecasts at time of publication. Source: Bloomberg, Scotiabank Economics.
A1
EUROPE
Country Date Time Indicator Period BNS Consensus LatestMX 05/28 09:00 Unemployment Rate (%) Apr 3.0 -- 2.9
US 05/29 09:00 S&P/Case-Shiller Home Price Index (m/m) Mar -- 0.7 0.8US 05/29 09:00 S&P/Case-Shiller Home Price Index (y/y) Mar 6.5 6.5 6.8US 05/29 10:00 Consumer Confidence Index May 128.5 128.0 128.7US 05/29 10:30 Dallas Fed. Manufacturing Activity May -- 24.5 21.8
US 05/30 07:00 MBA Mortgage Applications (w/w) MAY 25 -- -- -2.6US 05/30 08:15 ADP Employment Report (000s m/m) May 200 185.0 204.1CA 05/30 08:30 Current Account (C$ bn a.r.) 1Q -- -18.2 -16.3CA 05/30 08:30 IPPI (m/m) Apr -- -- 0.8CA 05/30 08:30 Raw Materials Price Index (m/m) Apr -- -- 2.1US 05/30 08:30 GDP (q/q a.r.) 1Q S 2.3 2.3 2.3US 05/30 08:30 GDP Deflator (q/q a.r.) 1Q S -- 2.0 2.0US 05/30 08:30 Wholesale Inventories (m/m) Apr P -- -- 0.3CA 05/30 10:00 BoC Interest Rate Announcement (%) May 30 1.25 1.25 1.25
CA 05/31 08:30 Real GDP (m/m) Mar 0.3 0.3 0.4CA 05/31 08:30 Real GDP (q/q a.r.) 1Q 1.9 2.0 1.7US 05/31 08:30 Initial Jobless Claims (000s) MAY 26 230.0 230.0 234.0US 05/31 08:30 Continuing Claims (000s) MAY 19 1750 -- 1741US 05/31 08:30 PCE Deflator (m/m) Apr 0.2 0.2 0.0US 05/31 08:30 PCE Deflator (y/y) Apr 2.0 2.0 2.0US 05/31 08:30 PCE ex. Food & Energy (m/m) Apr 0.1 0.1 0.2US 05/31 08:30 PCE ex. Food & Energy (y/y) Apr 1.9 1.8 1.9US 05/31 08:30 Personal Spending (m/m) Apr 0.3 0.4 0.4US 05/31 08:30 Personal Income (m/m) Apr 0.3 0.3 0.3US 05/31 09:45 Chicago PMI May -- 58.0 57.6US 05/31 10:00 Pending Home Sales (m/m) Apr 0.3 1.0 0.4
US 06/01 08:30 Nonfarm Employment Report (000s m/m) May 200 190.0 164.0US 06/01 08:30 Unemployment Rate (%) May 3.9 3.9 3.9US 06/01 08:30 Average Hourly Earnings (m/m) May -- 0.3 0.1US 06/01 08:30 Average Hourly Earnings (y/y) May 2.6 2.7 2.6US 06/01 08:30 Average Weekly Hours May -- 34.5 34.5US 06/01 08:30 Household Employment Report (000s m/m) May -- -- 3.0US 06/01 10:00 Construction Spending (m/m) Apr 0.5 0.9 -1.7US 06/01 10:00 ISM Manufacturing Index May 59.0 58 57
Country Date Time Indicator Period BNS Consensus LatestUK MAY 28- JUNE 3 Nationwide House Prices (m/m) May -- 0.2 0.2
SP 05/29 07:00 Budget Balance YTD (€ mn) Apr -- -- -4459
FR 05/30 02:45 Consumer Spending (m/m) Apr -- 0.2 0.1FR 05/30 02:45 GDP (q/q) 1Q P -- 0.3 0.3SP 05/30 03:00 CPI (m/m) May P -- 0.6 0.8SP 05/30 03:00 CPI (y/y) May P -- 1.7 1.1SP 05/30 03:00 CPI - EU Harmonized (m/m) May P -- 0.5 0.8SP 05/30 03:00 CPI - EU Harmonized (y/y) May P -- 1.7 1.1SP 05/30 03:00 Real Retail Sales (y/y) Apr -- -- 1.5SW 05/30 03:30 GDP (y/y) 1Q -- 3.3 3.3GE 05/30 03:55 Unemployment (000s) May -- -10.0 -7.0GE 05/30 03:55 Unemployment Rate (%) May -- 5.3 5.3PD 05/30 04:00 GDP (y/y) 1Q F -- -- 5.1EC 05/30 05:00 Business Climate Indicator May -- 1.3 1.4EC 05/30 05:00 Economic Confidence May -- 112.0 112.7EC 05/30 05:00 Industrial Confidence May -- 6.8 7.1PO 05/30 06:00 Real GDP (q/q) 1Q F -- -- 0.4

2 Visit our web site at scotiabank.com/economics or contact us by email at [email protected]
May 25, 2018
GLOBAL ECONOMICS | THE GLOBAL WEEK AHEAD
Key Indicators for the week of May 28 – June 1
EUROPE (continued from previous page)
Forecasts at time of publication. Source: Bloomberg, Scotiabank Economics.
A2
ASIA-PACIFIC
Country Date Time Indicator Period BNS Consensus LatestGE 05/30 06:00 Retail Sales (m/m) Apr -- 0.5 -0.3GE 05/30 08:00 CPI (m/m) May P -- 0.3 0.0GE 05/30 08:00 CPI (y/y) May P -- 1.9 1.6GE 05/30 08:00 CPI - EU Harmonized (m/m) May P -- 0.3 0.0GE 05/30 08:00 CPI - EU Harmonized (y/y) May P -- 1.8 1.4UK 05/30 19:01 GfK Consumer Confidence Survey May -- -8.0 -9.0
SZ 05/31 01:45 GDP (y/y) 1Q -- 2.3 1.9FR 05/31 02:45 CPI (m/m) May P -- 0.2 0.2FR 05/31 02:45 CPI (y/y) May P -- 1.8 1.6FR 05/31 02:45 CPI - EU Harmonized (m/m) May P -- 0.3 0.2FR 05/31 02:45 CPI - EU Harmonized (y/y) May P -- 2.1 1.8FR 05/31 02:45 Producer Prices (m/m) Apr -- -- 0.4SP 05/31 03:00 Real GDP (q/q) 1Q F -- 0.7 0.7SP 05/31 04:00 Current Account (€ bn) Mar -- -- -0.5UK 05/31 04:30 Net Consumer Credit (£ bn) Apr -- 1.3 0.3EC 05/31 05:00 Euro zone CPI Estimate (y/y) May -- 1.6 1.2EC 05/31 05:00 Euro zone Core CPI Estimate (y/y) May A -- 1.0 0.7EC 05/31 05:00 Unemployment Rate (%) Apr -- 8.4 8.5IT 05/31 05:00 CPI (m/m) May P -- 0.2 0.1IT 05/31 05:00 CPI (y/y) May P -- 0.8 0.5IT 05/31 05:00 CPI - EU Harmonized (m/m) May P -- 0.2 0.5IT 05/31 05:00 CPI - EU Harmonized (y/y) May P -- 0.9 0.6
IT 06/01 03:45 Manufacturing PMI May -- 53.0 53.5IT 06/01 04:00 Real GDP (q/q) 1Q F -- 0.3 0.3UK 06/01 04:30 Manufacturing PMI May -- 53.5 53.9IT 06/01 Budget Balance (€ bn) May -- -- -3.1IT 06/01 Budget Balance YTD (€ bn) May -- -- -30.1
Country Date Time Indicator Period BNS Consensus LatestCH 05/26 21:30 Industrial Profits YTD (y/y) Apr -- -- 3.1
SK MAY 27- JUNE 1 Department Store Sales (y/y) Apr -- -- 5.4
HK 05/28 04:30 Exports (y/y) Apr -- 9.1 8.0HK 05/28 04:30 Imports (y/y) Apr -- 12.1 10.7HK 05/28 04:30 Trade Balance (HKD bn) Apr -- -38.5 -55.5SK 05/28 17:00 Consumer Confidence Index May -- -- 107.1JN 05/28 19:30 Jobless Rate (%) Apr 2.5 2.5 2.5
JN 05/29 19:50 Large Retailers' Sales (y/y) Apr -- 0.2 0.1JN 05/29 19:50 Retail Trade (y/y) Apr -- 0.9 1.0AU 05/29 21:30 Building Approvals (m/m) Apr -- -3.0 2.6
JN 05/30 01:00 Consumer Confidence May -- 43.9 43.6SK 05/30 17:00 Business Survey- Manufacturing Jun -- -- 81.0SK 05/30 17:00 Business Survey- Non-Manufacturing Jun -- -- 81.0SK 05/30 19:00 Industrial Production (y/y) Apr -- -1.4 -4.3SK 05/30 19:00 Cyclical Leading Index Change Apr -- -- -0.2JN 05/30 19:50 Industrial Production (y/y) Apr P -- 3.6 2.4CH 05/30 21:00 Manufacturing PMI May 51.4 51.4 51.4CH 05/30 21:00 Non-manufacturing PMI May -- 54.8 54.8AU 05/30 21:30 Private Capital Expenditure 1Q -- 1.0 -0.2AU 05/30 21:30 Private Sector Credit (y/y) Apr -- 5.0 5.1HK MAY 30-31 Govt Monthly Budget Surp/Def (HKD bn) Apr -- -- -23.4PH MAY 30-31 Bank Lending (y/y) Apr -- -- 18.8
JN 05/31 00:00 Vehicle Production (y/y) Apr -- -- 0.2JN 05/31 01:00 Housing Starts (y/y) Apr -- -8.9 -8.3JN 05/31 01:00 Construction Orders (y/y) Apr -- -- -4.0
3 Visit our web site at scotiabank.com/economics or contact us by email at [email protected]
May 25, 2018
GLOBAL ECONOMICS | THE GLOBAL WEEK AHEAD
Key Indicators for the week of May 28 – June 1
ASIA-PACIFIC (continued from previous page)
Forecasts at time of publication. Source: Bloomberg, Scotiabank Economics.
A3
LATIN AMERICA
Country Date Time Indicator Period BNS Consensus LatestTH 05/31 03:30 Exports (y/y) Apr -- -- 6.3TH 05/31 03:30 Imports (y/y) Apr -- -- 6.7TH 05/31 03:30 Trade Balance (US$ mn) Apr -- -- 3015TH 05/31 03:30 Current Account Balance (US$ mn) Apr -- 2482 5751HK 05/31 04:30 Retail Sales - Volume (y/y) Apr -- -- 10.0IN 05/31 07:00 Fiscal Deficit (INR Crore) Mar -- -- 39140IN 05/31 08:00 Real GDP (y/y) 1Q 7.3 7.3 7.2NZ 05/31 18:00 ANZ Consumer Confidence Index May -- -- 120.5NZ 05/31 18:45 Terms of Trade Index (q/q) 1Q -- -2.0 0.8SK 05/31 19:00 CPI (y/y) May 1.6 1.7 1.6SK 05/31 19:00 Core CPI (y/y) May -- 1.4 1.4SK 05/31 19:00 GDP (y/y) 1Q F 2.8 2.8 2.8JN 05/31 19:50 Capital Spending (y/y) 1Q -- 3.2 4.3SK 05/31 20:00 Exports (y/y) May -- 10.9 -1.5SK 05/31 20:00 Imports (y/y) May -- 10.1 14.5SK 05/31 20:00 Trade Balance (US$ mn) May -- 5347 6609CH 05/31 21:45 HSBC Manufacturing PMI May 51.0 51.2 51.1TH 05/31 23:00 CPI (y/y) May 1.4 1.2 1.1TH 05/31 23:00 Core CPI (y/y) May -- 0.7 0.6JN MAY 31- JUNE 7 Official Reserve Assets (US$ bn) May -- -- 1256
JN 06/01 01:00 Vehicle Sales (y/y) May -- -- 0.5TH 06/01 03:30 Business Sentiment Index May -- -- 49.5
Country Date Time Indicator Period BNS Consensus LatestBZ 05/30 08:00 GDP (IBGE) (q/q) 1Q -- 0.3 0.1BZ 05/30 08:00 GDP (IBGE) (y/y) 1Q -- 0.9 2.1
CL 05/31 09:00 Industrial Production (y/y) Apr -- -- -2.4CL 05/31 09:00 Unemployment Rate (%) Apr -- -- 6.9CO 05/31 11:00 Urban Unemployment Rate (%) Apr -- -- 10.6
PE 06/01 01:00 Consumer Price Index (m/m) May 0.24 -- -0.1PE 06/01 01:00 Consumer Price Index (y/y) May 1.1 -- 0.5BZ 06/01 09:00 PMI Manufacturing Index May -- -- 52.3CL 06/01 09:00 Retail Sales (y/y) Apr -- -- 4.13BZ JUNE 1-6 Trade Balance (FOB) - Monthly (US$ mn) May -- -- 6142

4 Visit our web site at scotiabank.com/economics or contact us by email at [email protected]
May 25, 2018
GLOBAL ECONOMICS | THE GLOBAL WEEK AHEAD
Global Auctions for the week of May 28 – June 1
Source: Bloomberg, Scotiabank Economics.
EUROPE
A4
ASIA-PACIFIC
Country Date Time EventIT 05/28 05:00 Italy to Sell Up to 1.75 Billion Euros of 2020 Zero BondsIT 05/28 05:00 Italy to Sell 0.1% 2022 Linkers On May 28IT 05/28 11:00 Italy to Sell 1.3% 2028 Linkers On May 28
IT 05/30 05:00 Italy to Sell BondsNO 05/30 05:00 Norway to Sell BondsSW 05/30 05:03 Sweden Bond auction
Country Date Time EventCH 05/28 21:30 Heilongjiang to Sell BondsJN 05/28 23:35 Japan to Sell 40-Year Bonds
CH 05/30 01:00 Inner Mongolia to Sell BondsCH 05/30 21:30 Anhui to Sell BondsNZ 05/30 22:05 New Zealand Plans To Sell NZD200Mln 2.75% 2037 BondsJN 05/30 23:35 Japan to Sell 2-Year Bonds
CH 05/31 21:30 Sichuan to Sell Bonds

5 Visit our web site at scotiabank.com/economics or contact us by email at [email protected]
May 25, 2018
GLOBAL ECONOMICS | THE GLOBAL WEEK AHEAD
Events for the week of May 28 – June 1
Source: Bloomberg, Scotiabank Economics.
A5
NORTH AMERICA
EUROPE
ASIA-PACIFIC
LATIN AMERICA
Country Date Time EventUS 05/29 00:40 Fed's Bullard Speaks in Tokyo
CA 05/30 10:00 Bank of Canada Rate DecisionUS 05/30 14:00 U.S. Federal Reserve Releases Beige Book
US 05/31 06:00 Fed's Bullard Takes Part in MNI Roundtable in TokyoMX 05/31 10:00 Central Bank Monetary Policy MinutesCA 05/31 12:20 Bank of Canada Deputy Leduc speaks in Quebec CityUS 05/31 12:30 Fed's Bostic Speaks in Moderated Q&A in OrlandoUS 05/31 13:00 Fed's Brainard Speaks on Economic and Monetary Policy Outlook
Country Date Time EventIT 05/29 04:30 ECB's Visco Speaks at Bank of Italy Annual Meeting
SW 05/29 05:00 Riksbank's Ohlsson Gives SpeechEC 05/29 05:30 ECB's Mersch Speaks at Frankfurt Finance SummitEC 05/29 11:30 ECB's Lautenschlaeger Speaks at Colloquium in FrankfurtEC 05/29 12:00 ECB's Villeroy to Speak in ParisEC 05/29 12:00 ECB's Coeure Speaks at Roundtable Discussion in Paris
SZ 05/30 10:45 SNB's Jordan Speaks in Solothurn
SW 05/31 Riksbank's Skingsley Speaks in Kiev
SW 06/01 06:00 Riksbank's Ingves Gives SpeechIR 06/01 Ireland Sovereign Debt to be rated by S&PPO 06/01 Portugal Sovereign Debt to be rated by Fitch
Country Date Time EventJN 05/29 20:00 BOJ Governor Kuroda Speaks at Conference
Country Date Time EventCO 05/27 Presidential election: First Round

6 Visit our web site at scotiabank.com/economics or contact us by email at [email protected]
May 25, 2018
GLOBAL ECONOMICS | THE GLOBAL WEEK AHEAD
Global Central Bank Watch
Forecasts at time of publication. Source: Bloomberg, Scotiabank Economics.
A6
NORTH AMERICARate Current Rate Next Meeting Scotia's Forecasts Consensus ForecastsBank of Canada – Overnight Target Rate 1.25 May 30, 2018 1.25 1.25
Federal Reserve – Federal Funds Target Rate 1.75 June 13, 2018 2.00 2.00
Banco de México – Overnight Rate 7.50 June 21, 2018 7.50 7.50
EUROPERate Current Rate Next Meeting Scotia's Forecasts Consensus ForecastsEuropean Central Bank – Refinancing Rate 0.00 June 14, 2018 0.00 0.00
Bank of England – Bank Rate 0.50 June 21, 2018 0.50 0.50
Swiss National Bank – Libor Target Rate -0.75 June 21, 2018 -0.75 -0.75
Central Bank of Russia – One-Week Auction Rate 7.25 June 15, 2018 7.25 7.25
Sweden Riksbank – Repo Rate -0.50 July 3, 2018 -0.50 -0.50
Norges Bank – Deposit Rate 0.50 June 21, 2018 0.50 0.50
Central Bank of Turkey – Benchmark Repo Rate 8.00 June 7, 2018 8.00 8.00
ASIA PACIFICRate Current Rate Next Meeting Scotia's Forecasts Consensus ForecastsBank of Japan – Policy Rate -0.10 June 15, 2018 -0.10 -0.10
Reserve Bank of Australia – Cash Target Rate 1.50 June 5, 2018 1.50 1.50
Reserve Bank of New Zealand – Cash Rate 1.75 June 27, 2018 1.75 1.75
People's Bank of China – Lending Rate 4.35 TBA -- 4.35
Reserve Bank of India – Repo Rate 6.00 June 6, 2018 6.00 6.00
Bank of Korea – Bank Rate 1.50 July 12, 2018 1.50 1.50
Bank of Thailand – Repo Rate 1.50 June 20, 2018 1.50 1.50
Bank Negara Malaysia – Overnight Policy Rate 3.25 July 11, 2018 3.25 3.25
Bank Indonesia – 7-Day Reverse Repo Rate 4.50 June 28, 2018 4.50 4.50
LATIN AMERICARate Current Rate Next Meeting Scotia's Forecasts Consensus ForecastsBanco Central do Brasil – Selic Rate 6.50 June 20, 2018 6.50 6.50
Banco Central de Chile – Overnight Rate 2.50 June 13, 2018 2.50 2.50
Banco de la República de Colombia – Lending Rate 4.25 June 29, 2018 4.25 4.25
Banco Central de Reserva del Perú – Reference Rate 2.75 June 7, 2018 2.75 2.75
AFRICARate Current Rate Next Meeting Scotia's Forecasts Consensus ForecastsSouth African Reserve Bank – Repo Rate 6.50 July 19, 2018 6.50 6.50
Bank of Canada: No policy rate change is anticipated. Deepened uncertainty surrounding trade policy negotiations is likely to maintain near-term caution. As discussed in the Canada section of the Global Week Ahead, rising capacity strains, building wage and price pressures, improving terms of trade and a very low and negative real policy rate put the Bank in the position of having to possibly tighten at an expedited pace over time should nearer term risks subside.

May 25, 2018
GLOBAL ECONOMICS
| THE GLOBAL WEEK AHEAD
Visit our web site at scotiabank.com/economics or contact us by email at [email protected]
This report has been prepared by Scotiabank Economics as a resource for the clients of Scotiabank. Opinions, estimates and projections
contained herein are our own as of the date hereof and are subject to change without notice. The information and opinions contained herein
have been compiled or arrived at from sources believed reliable but no representation or warranty, express or implied, is made as to their
accuracy or completeness. Neither Scotiabank nor any of its officers, directors, partners, employees or affiliates accepts any liability whatsoever
for any direct or consequential loss arising from any use of this report or its contents.
These reports are provided to you for informational purposes only. This report is not, and is not constructed as, an offer to sell or solicitation of
any offer to buy any financial instrument, nor shall this report be construed as an opinion as to whether you should enter into any swap or
trading strategy involving a swap or any other transaction. The information contained in this report is not intended to be, and does not
constitute, a recommendation of a swap or trading strategy involving a swap within the meaning of U.S. Commodity Futures Trading
Commission Regulation 23.434 and Appendix A thereto. This material is not intended to be individually tailored to your needs or characteristics
and should not be viewed as a “call to action” or suggestion that you enter into a swap or trading strategy involving a swap or any other
transaction. Scotiabank may engage in transactions in a manner inconsistent with the views discussed this report and may have positions, or
be in the process of acquiring or disposing of positions, referred to in this report.
Scotiabank, its affiliates and any of their respective officers, directors and employees may from time to time take positions in currencies, act as
managers, co-managers or underwriters of a public offering or act as principals or agents, deal in, own or act as market makers or advisors,
brokers or commercial and/or investment bankers in relation to securities or related derivatives. As a result of these actions, Scotiabank may
receive remuneration. All Scotiabank products and services are subject to the terms of applicable agreements and local regulations. Officers,
directors and employees of Scotiabank and its affiliates may serve as directors of corporations.
Any securities discussed in this report may not be suitable for all investors. Scotiabank recommends that investors independently evaluate any
issuer and security discussed in this report, and consult with any advisors they deem necessary prior to making any investment.
This report and all information, opinions and conclusions contained in it are protected by copyright. This information may not be
reproduced without the prior express written consent of Scotiabank.
™ Trademark of The Bank of Nova Scotia. Used under license, where applicable.
Scotiabank, together with “Global Banking and Markets”, is a marketing name for the global corporate and investment banking and capital
markets businesses of The Bank of Nova Scotia and certain of its affiliates in the countries where they operate, including, Scotiabanc Inc.;
Citadel Hill Advisors L.L.C.; The Bank of Nova Scotia Trust Company of New York; Scotiabank Europe plc; Scotiabank (Ireland) Limited;
Scotiabank Inverlat S.A., Institución de Banca Múltiple, Scotia Inverlat Casa de Bolsa S.A. de C.V., Scotia Inverlat Derivados S.A. de C.V. – all
members of the Scotiabank group and authorized users of the Scotiabank mark. The Bank of Nova Scotia is incorporated in Canada with
limited liability and is authorised and regulated by the Office of the Superintendent of Financial Institutions Canada. The Bank of Nova Scotia is
authorised by the UK Prudential Regulation Authority and is subject to regulation by the UK Financial Conduct Authority and l imited regulation
by the UK Prudential Regulation Authority. Details about the extent of The Bank of Nova Scotia's regulation by the UK Prudential Regulation
Authority are available from us on request. Scotiabank Europe plc is authorised by the UK Prudential Regulation Authority and regulated by the
UK Financial Conduct Authority and the UK Prudential Regulation Authority.
Scotiabank Inverlat, S.A., Scotia Inverlat Casa de Bolsa, S.A. de C.V., and Scotia Derivados, S.A. de C.V., are each authorized and regulated
by the Mexican financial authorities.
Not all products and services are offered in all jurisdictions. Services described are available in jurisdictions where permitted by law.