april 2016 corporate presentation - gbm.scotiabank.com · capital projects, including the cactus...
TRANSCRIPT

April 2016Corporate Presentation

April 2016 | 1Corporate Presentation
AdvisoryForward‐Looking InformationThis presentation contains certain forward‐looking statements within the meaning of applicable United States securities legislation and “forward‐looking information” within the meaning of applicable Canadian securities legislation (collectively, “forward‐looking information”), which reflects management’s expectations about the Corporation’s future growth, results of operations (including future production and capital expenditures), performance (both operational and financial) and business prospects. All information and statements other than statements of historical fact is forward‐looking information. The information contained in this presentation does not purport to be all‐inclusive or to contain all information that potential investors may require.
In this presentation there is forward‐looking information in respect of the Corporation’s business; anticipated business activities and development plans; projected growth and execution of corporate plans and strategies; timing and success of development and exploitation activities; timing and development of the Corporation’s capital projects, including the Cactus Lake and Pirtuk SAGD projects; expectations regarding the Corporation’s ability to add production and reserves through exploration, development, exploitation and acquisitions; future oil and gas production levels; planned capital and operating expenditures; future operating costs; expected rate of return; hedging and other risk management plans and strategies; and future commodity prices. In addition, statements relating to “reserves” and “resources” are deemed to be forward‐looking information as they involve the implied assessment, based on certain estimates and assumptions, that the reserves and resources described exist in the quantities predicted or estimated and can be profitably produced in the future.
Although the forward‐looking information in this presentation reflects management’s current beliefs about the Corporation’s prospects, based on information currently available to management and on what management believes to be reasonable assumptions, there is no certainty that the actual results achieved will be consistent with such forward‐looking information. Forward‐looking information is not a guarantee of future performance and necessarily involves significant known and unknown risks, assumptions and uncertainties, some that are similar to other oil and gas companies and some that are unique to Northern Blizzard, which may cause Northern Blizzard’s actual results, performance, prospects and opportunities in future periods to differ materially from those expressed or implied by the forward‐looking information provided in this presentation. Any changes to the assumptions on which such forward‐looking information is based could cause actual results, performance or achievements to differ materially from the anticipated results expressed or implied in the forward‐looking information of the Corporation set out in this presentation. A large number of factors could affect the assumptions on which statements about forward‐looking information are made in this presentation or the underlying assumptions many of which are beyond the Corporation's control, including: general economic, market and business conditions; competition; fluctuations in oil and natural gas prices; and changes in laws or royalty regimes. Forward‐looking information is expressly qualified by the foregoing cautionary statements, is stated as of the date of preparation of this presentation and, except as required under applicable laws, Northern Blizzard assumes no obligation to update or revise such information to reflect new events or circumstances.
Presentation of Financial InformationUnless otherwise noted, all financial information for Northern Blizzard has been prepared in accordance with IFRS, as issued by the International Accounting Standards Board.
Non‐IFRS MeasuresIn addition to using financial measures prescribed by IFRS, references are made in this presentation to “EBITDA”, “net debt”, and “total payout ratio”, which are measures that do not have any standardized meaning as prescribed by IFRS. Accordingly, the Corporation's use of such terms may not be comparable to similarly defined measures presented by other entities. For further details on these non‐IFRS financial measures, refer to Northern Blizzard’s most recent management’s discussion and analysis.

April 2016 | 2Corporate Presentation
Presentation of Oil and Gas InformationAll oil and gas information in this presentation has been prepared and presented in accordance with NI 51‐101 adopted by the Canadian securities regulatory authorities. Unless otherwise specified, in this presentation, all production is reported on the basis of the Corporation’s working interest (“WI”) (operating and non‐operating) before the deduction of royalties payable. All numbers of wells and acreage information are presented on a gross basis. Unless otherwise indicated, reserves and resources information in this presentation is given as of December 31, 2015. For complete NI 51‐101 reserves disclosures, refer to the Annual Information Form dated March 11, 2016.
Discovered Petroleum Initially‐in‐Place or Discovered Oil Initially‐in‐Place (“DOIIP”), is defined in the Canadian Oil and Gas Evaluation Handbook as the quantity of oil that is estimated to be in place within a known accumulation prior to production. DOIIP is divided into recoverable and unrecoverable portions, with the estimated future recoverable portion consisting of production, reserves and contingent resources. There is no certainty that it will be economically viable or technically feasible to produce any portion of the DOIIP except for those portions already produced or identified in the independent reserves report. At December 31, 2015 all DOIIP that has not already been produced or classified as reserves would be classified as contingent resources or unrecoverable DOIIP . There are no contingent resources identified in this presentation. A portion of the quantities currently classified as unrecoverable DOIIP may become recoverable and reclassified as contingent resources or reserves in the future as additional technical studies are performed, commercial circumstances change or technological developments occur. The remaining portion may never be recovered due to the physical or chemical constraints represented by subsurface interaction of fluids and reservoir rocks.
The discounted and undiscounted net present value of future net revenues attributable to reserves and resources do not represent the fair market value of such reserves and resources. There is no assurance that the forecast prices and costs assumptions will be attained, and variances could be material. The recovery and reserve estimates of crude oil, natural gas and NGL reserves and resources provided in this presentation are estimates only and there is no guarantee that the estimated reserves or resources will be recovered. Actual crude oil, natural gas and NGL reserves and resources may be greater or less than the estimates provided in this presentation. The estimates of reserves and future net revenue for individual properties in this presentation may not reflect the same confidence level as estimates of reserves and future net revenue for all properties, due to the effects of aggregation.
The Corporation has adopted the standard of 6 Mcf:1 bbl when converting natural gas to oil equivalent. Boe conversions may be misleading particularly if used in isolation. A boe conversion ratio of 6 Mcf:1 bbl is based on an energy equivalency conversion method primarily applicable at the burner tip and does not represent a value equivalency at the wellhead. As the value ratio natural gas and crude oil based on the current prices of natural gas and crude oil is significantly different from the energy equivalency of 6:1, utilizing a conversion on a 6:1 basis may be misleading as an indication of value.
Advisory

April 2016 | 3Corporate Presentation
Corporate Highlights
1. Includes management and directors as reported on SEDI as of Mar 31, 2016.2. As at Mar 31, 20163. Discovered Oil Initially In Place; based on an independent reserve report effective Dec
31, 2015.4. Borrowing base review to be completed by May 31, 2016.5. As at Dec 31, 2015
6. Guidance issued Feb 12, 2016.7. Including hedging gains.8. Cash dividends plus capital expenditures divided by funds from operations (including
hedging gains). 80% payout assumes full cash dividend and 45% payout assumes an average Stock Dividend Program (“SDP”) participations rate of 74%.
9. Non IFRS measure, see Advisory.
Common Shares – TSX: NBZPublic Float 29.7 million shares / 26%Management(1) 5.0 million shares / 4%NGP / Riverstone 80.8 million shares / 70%Outstanding, Basic(2) 115.5 million sharesAnnual Dividend $0.48 per share
Balance SheetCredit Facility $475 million(4)
Senior Unsecured Notes US$276.3 million (due 2022)
Net Debt(5) $400.5 millionNet Debt to Fundsfrom operations(5)(9) 2.4x
ReservesDOIIP (net)(3) ~2.1 billion bbl2P Reserves(3) 153 million boePDP / 2P Reserves 38%1P / 2P Reserves 56%
2016 Annual Guidance(6)
Production 19,000 boe/dFunds from Operations(7) $120 millionCapital Expenditures $40 millionTotal Payout Ratio(8)(9) 80% / 45%Net Debt(9) $334 millionNet Debt to Funds from operations(9) 2.8x

April 2016 | 4Corporate Presentation
• Approximately 2.1 billion bbl DOIIP(1) with ~12% recovered• Low corporate decline rate of 17% – trending lower• Long reserve life index (2P = 21.9 years; PDP = 8.2 years)• Large inventory (>2,000) of low risk drilling locations with good capital efficiencies
Balance Sheet Strength• $475 million(2) bank facility• Senior unsecured notes
• US$276.3 million due 2022• No maintenance covenants
• 2016 year end net debt(3)/funds from operations(4) of 2.8x
Active hedging program(5)
• 2016 – 4.2 mmbbls @ C$79.50/bbl WTI & C$18.89/bbl WCS differential
• 2017 – 3.3 mmbbls @ C$66.50/bbl WTI & 2.6 mmbbls @ C$18.37/bbl WCS differential
• 2018 – 1.8 mmbbls @ C$60.04/bbl WTI
• NBRI is backed by two world class private equity firms• Differentiated access to capital
Investment Highlights
Strong Financial Position
Business Model
World‐Class Oil Resource Base
• Monthly dividend of $0.04 per common share• Capital allocation to projects that support long‐term value• Need approximately US$37/bbl WTI to breakeven and pay cash dividend in 2016• 70% of production cash flow positive at < WTI ~US$30/bbl(6)
Private Equity Sponsorship
Strong business model positioned for growth1. Discovered Oil Initially In Place; based on an independent reserve report effective Dec
31, 2015.2. Borrowing base review to be completed by May 31, 2016.3. Non‐IFRS measure. See Advisory.
4. Funds from operations including hedging gains.5. Based on a CAD/USD rate of 1.2985.6. Based on Q4 2015.

April 2016 | 5Corporate Presentation
World‐Class Oil Resource Base• Significant high‐quality oil resource
– Approximately 2.1 billion bbl DOIIP(1) with ~12% recovered
– Large inventory ( > 2,000) of low risk drilling locations with good capital efficiencies
• Long‐life low decline assets– Low corporate decline rate of 17% – trending
lower– Long reserve life index
• 2P = 21.9 years• PDP = 8.2 years
• Lower viscosity heavy oil– Ideally suited to EOR techniques (waterflood,
polymer flood, SAGD)
• Assets are located in Saskatchewan
1. Discovered Oil Initially In Place; based on an independent reserve report effective Dec 31, 2015.
High quality low cost asset base underpins sustainability and future growth

April 2016 | 6Corporate Presentation
Oil Production Decline
1. Source: CIBC Research Estimates; Enerplus’ decline for Canadian assets only.Low decline rate is key to sustainable business model
13,000
14,000
15,000
16,000
17,000
18,000
19,000
20,000
21,000
22,000
23,0001/1/2014
2/1/2014
3/1/2014
4/1/2014
5/1/2014
6/1/2014
7/1/2014
8/1/2014
9/1/2014
10/1/2014
11/1/2014
12/1/2014
1/1/2015
2/1/2015
3/1/2015
4/1/2015
5/1/2015
6/1/2015
7/1/2015
8/1/2015
9/1/2015
10/1/2015
11/1/2015
12/1/2015
1/1/2016
2/1/2016
3/1/2016
4/1/2016
5/1/2016
6/1/2016
7/1/2016
8/1/2016
9/1/2016
10/1/2016
11/1/2016
12/1/2016
bbl/d
Oil (bbl/d) 12% Decline 17% Decline Outlooked Oil (bbl/d)
46%
46%
45%
43%
43%
39%
39%
39%
39%
37%
35%
35%
35%
33%
33%
32%
32%
32%
32%
30%
28%
26%
25%
25%
25%
24%
24%
23%
23%
21%
21%
21%
20%
19%
19%
12%
16%
15%17
%
0%
10%
20%
30%
40%
50%
Dec
line
Rate
(%)
NBRI has one of the lowest decline rates
Net Base Production
April 2016 | 7Corporate Presentation
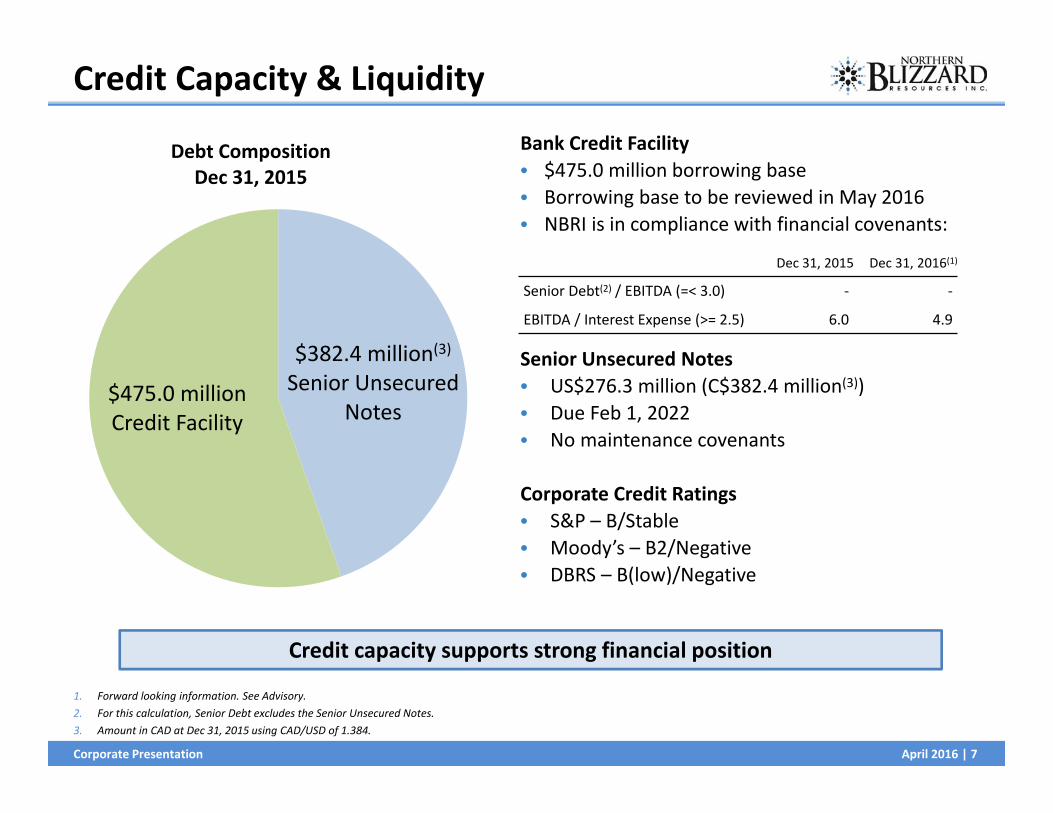
Credit Capacity & Liquidity
$382.4 million(3)Senior Unsecured
Notes$475.0 millionCredit Facility
Debt Composition Dec 31, 2015
1. Forward looking information. See Advisory. 2. For this calculation, Senior Debt excludes the Senior Unsecured Notes.3. Amount in CAD at Dec 31, 2015 using CAD/USD of 1.384.
Bank Credit Facility• $475.0 million borrowing base• Borrowing base to be reviewed in May 2016• NBRI is in compliance with financial covenants:
Senior Unsecured Notes• US$276.3 million (C$382.4 million(3))• Due Feb 1, 2022• No maintenance covenants
Corporate Credit Ratings• S&P – B/Stable• Moody’s – B2/Negative• DBRS – B(low)/Negative
Dec 31, 2015 Dec 31, 2016(1)
Senior Debt(2) / EBITDA (=< 3.0) ‐ ‐
EBITDA / Interest Expense (>= 2.5) 6.0 4.9
Credit capacity supports strong financial position
April 2016 | 8Corporate Presentation
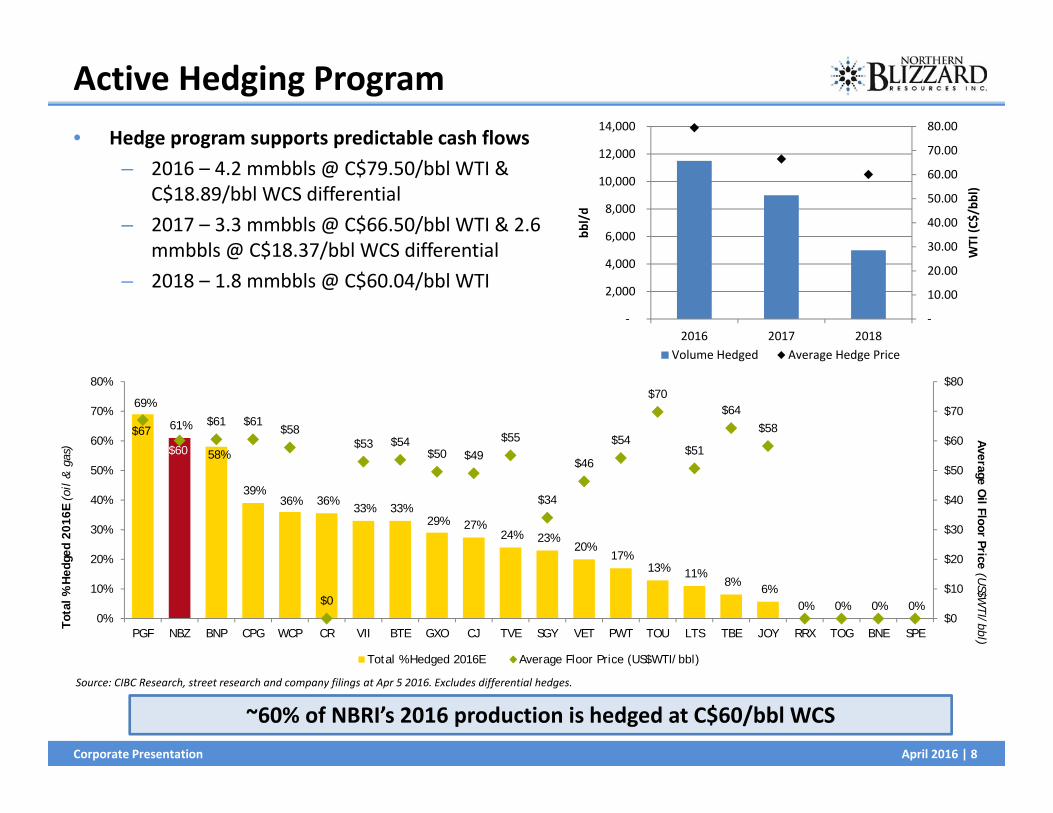
Active Hedging Program• Hedge program supports predictable cash flows
– 2016 – 4.2 mmbbls @ C$79.50/bbl WTI & C$18.89/bbl WCS differential
– 2017 – 3.3 mmbbls @ C$66.50/bbl WTI & 2.6 mmbbls @ C$18.37/bbl WCS differential
– 2018 – 1.8 mmbbls @ C$60.04/bbl WTI
Source: CIBC Research, street research and company filings at Apr 5 2016. Excludes differential hedges.
~60% of NBRI’s 2016 production is hedged at C$60/bbl WCS
‐
10.00
20.00
30.00
40.00
50.00
60.00
70.00
80.00
‐
2,000
4,000
6,000
8,000
10,000
12,000
14,000
2016 2017 2018
WTI (C
$/bb
l)
bbl/d
Volume Hedged Average Hedge Price
69%
61%
58%
39%36% 36%
33% 33%29% 27%
24% 23%20%
17%13% 11%
8%6%
0% 0% 0% 0%
$67
$60
$61 $61 $58
$0
$53 $54 $50 $49
$55
$34
$46
$54
$70
$51
$64 $58
$0
$10
$20
$30
$40
$50
$60
$70
$80
0%
10%
20%
30%
40%
50%
60%
70%
80%
PGF NBZ BNP CPG WCP CR VII BTE GXO CJ TVE SGY VET PWT TOU LTS TBE JOY RRX TOG BNE SPE
Average O
il Floor Price (US$W
TI/bbl)To
tal %
Hed
ged
2016
E (o
il &
gas
)
Total % Hedged 2016E Average Floor Price (US$WTI/bbl)

April 2016 | 9Corporate Presentation
Operating In A Low Oil Price Environment
• Optimize asset integrity– Manage decline rates – low decline rate requires less sustaining
capital– Committed to long life projects (i.e. polymer flood, SAGD)
• Rigorous cost controls– Operating costs of $16.72/boe in 2015, 21% lower than 2014– Capital cost improvements of 20 – 30% in 2015
• Disciplined capital allocation– Large inventory of low risk drilling locations (> 2,000) with strong
capital efficiencies– Capital allocation to projects that support long‐term value– Operate over 95% of production, which provides ability to control
virtually all of our capital expenditures
Optimize asset
integrity
Rigorous cost
controls
Disciplined capital
allocation
NBRI is well positioned to sustain the current low oil price environment

April 2016 | 10Corporate Presentation
Operating & Capital Cost Improvements• Operating cost improvements
– Operating costs of $16.72/boe (2015) are 21% lower than 2014
– NBRI continues to work to reduce production costs
• Capital cost improvements– Cactus Lake – 24% savings– Winter – 21% savings– Coleville – 30% savings
24% savings
21% savings
30% savings
Focus on cost saving measures has resulted in significant operating and capital cost improvements
‐
5.00
10.00
15.00
20.00
25.00
Ope
ratin
g Co
sts ($/bo
e)
April 2016 | 11Corporate Presentation
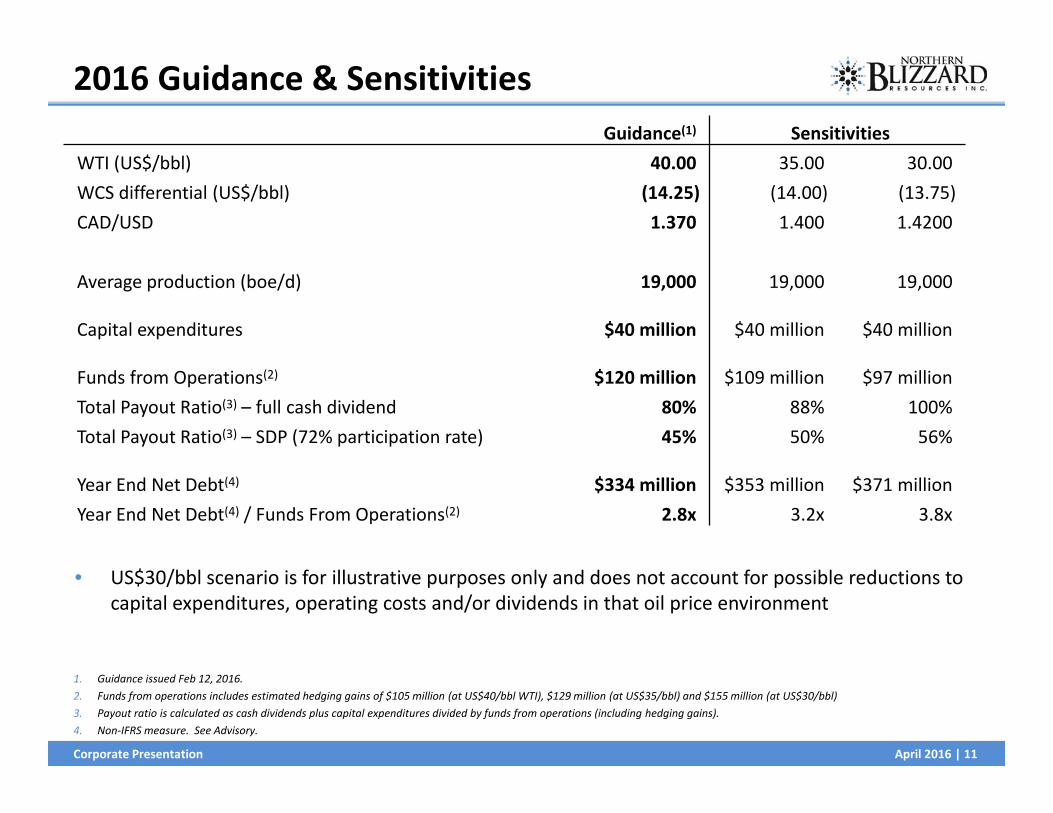
Guidance(1) SensitivitiesWTI (US$/bbl) 40.00 35.00 30.00WCS differential (US$/bbl) (14.25) (14.00) (13.75)CAD/USD 1.370 1.400 1.4200
Average production (boe/d) 19,000 19,000 19,000
Capital expenditures $40 million $40 million $40 million
Funds from Operations(2) $120 million $109 million $97 millionTotal Payout Ratio(3) – full cash dividend 80% 88% 100%Total Payout Ratio(3) – SDP (72% participation rate) 45% 50% 56%
Year End Net Debt(4) $334 million $353 million $371 millionYear End Net Debt(4) / Funds From Operations(2) 2.8x 3.2x 3.8x
2016 Guidance & Sensitivities
• US$30/bbl scenario is for illustrative purposes only and does not account for possible reductions to capital expenditures, operating costs and/or dividends in that oil price environment
1. Guidance issued Feb 12, 2016.2. Funds from operations includes estimated hedging gains of $105 million (at US$40/bbl WTI), $129 million (at US$35/bbl) and $155 million (at US$30/bbl)3. Payout ratio is calculated as cash dividends plus capital expenditures divided by funds from operations (including hedging gains).4. Non‐IFRS measure. See Advisory.

April 2016 | 12Corporate Presentation
Focus Assets – Cactus Lake, Winter & Coleville• DOIIP of 409 mmbbls(2)
– 13% recovered to date• Drilling inventory of 311 locations(2)
– 255 booked 2P(1), 56 unbooked– EUR of ~100 mboe per well(2)
• Upside from infill drilling, waterflood and polymer flood
1. Based on an independent reserve report effective Dec 31, 2015. 2. Internal estimates, gross.
Cactus Lake
Winter
Coleville
Currently ~60% of production with potential to exceed 20,000 boe/d in the next 5 – 6 years
• DOIIP of +600 mmbbls(2)
– < 8% recovered to date(2)
• Drilling inventory of +450 gross locations(2)
– 277 (net 201) 2P(1), +173 unbooked– EUR of ~53 mbbl per well(1)
• Upside from infill drilling
• 10,000 acres in proven Viking fairway• Drilling inventory of 311(2) locations
– 112 booked 2P(1), 199 unbooked(2)
– EUR of ~41 mboes per well(1)
• Upside from horizontal drilling

April 2016 | 13Corporate Presentation
0
20
40
60
80
100
120
140
160
$30 $35 $40 $45 $50 $55 $60 $65 $70 $75
Before Tax Rate of Return (%
)
WTI (US$/bbl)
Cactus Lake Waterflood w/o Facilities
Coleville Viking (Light Oil, crown royalties)
Winter Main w/o Facilities
Winter South Sec 27,34 &3
Winter South Sec 21&22 w/ Facility
Represents Industry’s Top Project Economics
1. Source: National Bank Financial as at Apr 6, 2016 2. Guidance issued Feb 12, 2016.
2016
WTI Strip Price(
1)
2016
Guidance(
2)
April 2016 | 14Corporate Presentation
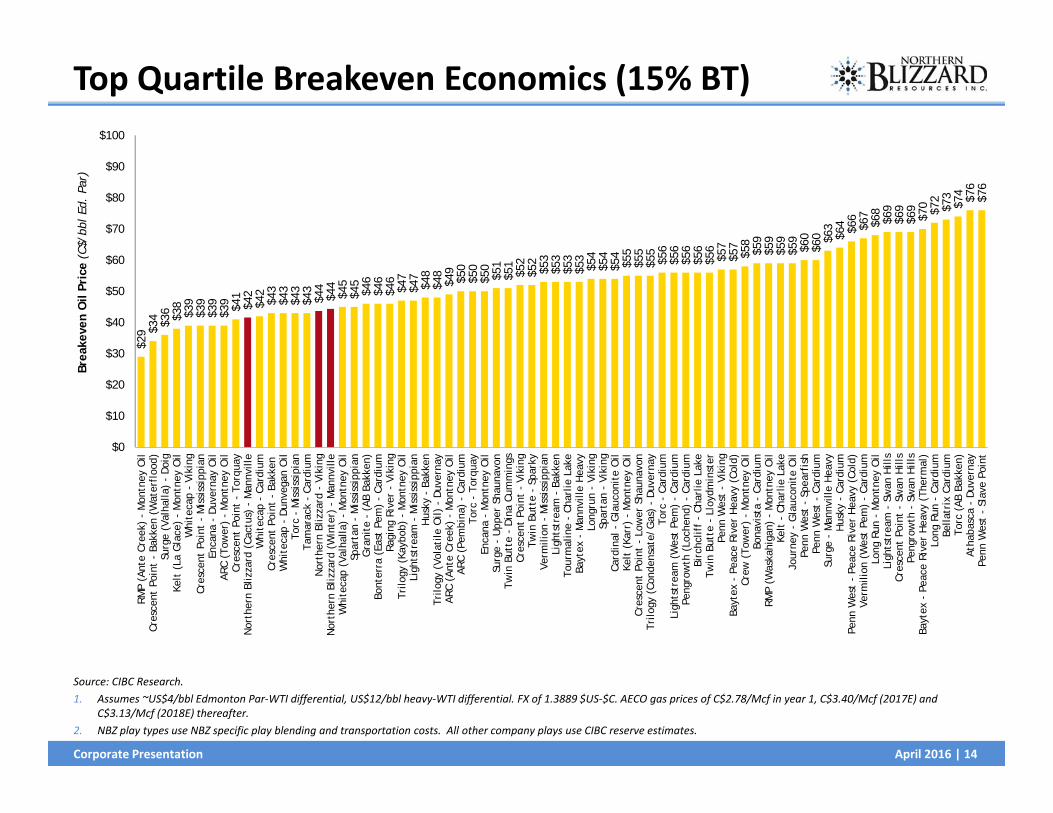
Top Quartile Breakeven Economics (15% BT)
Source: CIBC Research.1. Assumes ~US$4/bbl Edmonton Par‐WTI differential, US$12/bbl heavy‐WTI differential. FX of 1.3889 $US‐$C. AECO gas prices of C$2.78/Mcf in year 1, C$3.40/Mcf (2017E) and
C$3.13/Mcf (2018E) thereafter.2. NBZ play types use NBZ specific play blending and transportation costs. All other company plays use CIBC reserve estimates.
$29 $3
4 $36 $38
$39
$39
$39
$39 $41
$42
$42
$43
$43
$43
$43
$44
$44
$45
$45
$46
$46
$46
$47
$47
$48
$48
$49
$50
$50
$50
$51
$51
$52
$52
$53
$53
$53
$53
$54
$54
$54
$55
$55
$55
$56
$56
$56
$56
$56
$57
$57
$58
$59
$59
$59
$59
$60
$60 $6
3$6
4 $66
$67
$68
$69
$69
$69
$70 $72
$73
$74 $76
$76
$0
$10
$20
$30
$40
$50
$60
$70
$80
$90
$100RM
P (A
nte
Cree
k) -
Mon
tney
Oil
Cres
cent
Poi
nt -
Bak
ken
(Wat
erfl
ood)
Surg
e (V
alha
lla)
- D
oig
Kelt
(La
Gla
ce)
- M
ontn
ey O
ilW
hite
cap
- Vi
king
Cres
cent
Poi
nt -
Mis
siss
ippi
anEn
cana
- D
uver
nay
Oil
ARC
(Tow
er)
- M
ontn
ey O
ilCr
esce
nt P
oint
- T
orqu
ayN
orth
ern
Bliz
zard
(Ca
ctus
) -
Man
nvill
eW
hite
cap
- Ca
rdiu
mCr
esce
nt P
oint
- B
akke
nW
hite
cap
- D
unve
gan
Oil
Torc
- M
issi
ssip
ian
Tam
arac
k -
Card
ium
Nor
ther
n Bl
izza
rd -
Vik
ing
Nor
ther
n Bl
izza
rd (
Win
ter)
- M
annv
ille
Whi
teca
p (V
alha
lla)
- M
ontn
ey O
ilSp
arta
n -
Mis
siss
ippi
anG
rani
te -
(AB
Bak
ken)
Bont
erra
(Ea
st P
em)
- Ca
rdiu
mRa
ging
Riv
er -
Vik
ing
Trilo
gy (
Kayb
ob)
- M
ontn
ey O
ilLi
ghts
trea
m -
Mis
siss
ippi
anH
usky
- B
akke
nTr
ilogy
(Vo
lati
le O
il) -
Duv
erna
yAR
C (A
nte
Cree
k) -
Mon
tney
Oil
ARC
(Pem
bina
) -
Card
ium
Torc
- T
orqu
ayEn
cana
- M
ontn
ey O
ilSu
rge
- U
pper
Sha
unav
onTw
in B
utte
- D
ina
Cum
min
gsCr
esce
nt P
oint
- V
ikin
gTw
in B
utte
- S
park
yVe
rmili
on -
Mis
siss
ippi
anLi
ghts
trea
m -
Bak
ken
Tour
mal
ine
- Ch
arlie
Lak
eBa
ytex
- M
annv
ille
Hea
vyLo
ngru
n -
Viki
ngSp
arta
n -
Viki
ngCa
rdin
al -
Gla
ucon
ite
Oil
Kelt
(Ka
rr)
- M
ontn
ey O
ilCr
esce
nt P
oint
- L
ower
Sha
unav
onTr
ilogy
(Co
nden
sate
/Gas
) -
Duv
erna
yTo
rc -
Car
dium
Ligh
tstr
eam
(W
est
Pem
) -
Card
ium
Peng
row
th (
Loch
end)
- C
ardi
umBi
rchc
liff
- Ch
arlie
Lak
eTw
in B
utte
- L
loyd
min
ster
Penn
Wes
t -
Viki
ngBa
ytex
- P
eace
Riv
er H
eavy
(Co
ld)
Crew
(To
wer
) -
Mon
tney
Oil
Bona
vist
a -
Card
ium
RMP
(Was
kahi
gan)
- M
ontn
ey O
ilKe
lt -
Cha
rlie
Lak
eJo
urne
y -
Gla
ucon
ite
Oil
Penn
Wes
t -
Spea
rfis
hPe
nn W
est
- Ca
rdiu
mSu
rge
- M
annv
ille
Hea
vyH
usky
- C
ardi
umPe
nn W
est
- Pe
ace
Rive
r H
eavy
(Co
ld)
Verm
ilion
(W
est
Pem
) -
Card
ium
Long
Run
- M
ontn
ey O
ilLi
ghts
trea
m -
Sw
an H
ills
Cres
cent
Poi
nt -
Sw
an H
ills
Peng
row
th -
Sw
an H
ills
Bayt
ex -
Pea
ce R
iver
Hea
vy (
Ther
mal
)Lo
ng R
un -
Car
dium
Bella
trix
Car
dium
Torc
(AB
Bak
ken)
Atha
basc
a -
Duv
erna
yPe
nn W
est
- Sl
ave
Poin
t
Brea
keve
n O
il Pr
ice
(C$/
bbl
Ed.
Par)

April 2016 | 15Corporate Presentation
Cactus Lake

April 2016 | 16Corporate Presentation
Cactus Lake – Overview
• Play characteristics– 100% operator– NBRI’s largest field by production and reserves– Low viscosity, floodable heavy oil– Bakken and Lower Mannville (Rex)
commingled for production and injection• Exploitation strategy
– Repeatable vertical / directional drilling at 10 acre spacing
– Waterflood– Polymer flood
1. Management estimate as at Dec 31, 2015.2. Based on an independent reserve report effective Dec 31, 2015.3. Producing wells only.
HighlightsDOIIP(1) 409 mmbbls bblRecovered to date 13%2P Reserves(2) 52 million boeEst. 2016 production 7,897 boe/dWells drilled to Dec 31, 2015 380(3)
Drilling inventory 311 locations(>18% unbooked)
Economics 50% IRR at US$50/bbl WTI
SparkyDOIIP 16 mmbbl
Rex,BakkenDOIIP 393 mmbbl

April 2016 | 17Corporate Presentation
0
5
10
15
20
25
30
35
0 12 24 36 48 60 72 84 96 108 120
Calend
ar Day Oil Ra
te (b
bl/d)
Month
Infill Performance vs Type Curve
Gross ‐ TC (WF) Gross ‐ TC (PF) Phase 1
Phase 2A Phase 2B Phase 3A
Phase 3B Phase 4 Phase 5
Phase ID Drill Vintage Polymer Started Well Count
Phase 1 2012, 2013 2013 96
Phase 2A 2013 2014 18
Phase 2B 2012, 2013 2014 80
Phase 3A 2014 2015 35
Phase 3B 2014 Waterflood 41
Phase 4 2011, 2014 Waterflood 44
Phase 5 2015 Waterflood 17
Waterflood Type CurvePolymer flood Type Curve
Cactus Lake – Repeatable Development
0
200
400
600
800
1‐Dec‐15 1‐Mar‐16 1‐Jun‐16 1‐Sep‐16 1‐Dec‐16
Oil Ra
te (b
bl/d)
2015 Development Drills
Daily Rate Type Curve

April 2016 | 18Corporate Presentation
Cactus Lake – Opportunity Base• 352 Basal Mannville Bakken production wells drilled to date • 311 remaining inventory locations identified • Average DOIIP in remaining sections expected to be in line with developed sections to date• Infill production and reserves repeatability anticipated to be consistent with results to date• 2 successful step‐out wells drilled in 2015
352
194
61 56
311
0
50
100
150
200
250
300
350
400
Drilled toDate
PV‐UD PB‐UD Unbooked Inventory
Well Cou
nt
Basal Mannville Bakken – Drilling Inventory
NTD: update map; no white net pay
April 2016 | 19Corporate Presentation
0
5,000
10,000
15,000
20,000
25,000
30,000
35,000
40,000
45,000
50,000
2012…
2012…
2012…
2013…
2013…
2013…
2013…
2014…
2014…
2014…
2014…
2015…
2015…
2015…
2015…
2016…
Polymer In
jection Ra
te, b
bl/d
Cactus Lake Polymer InjectionRex/Bakken Sparky
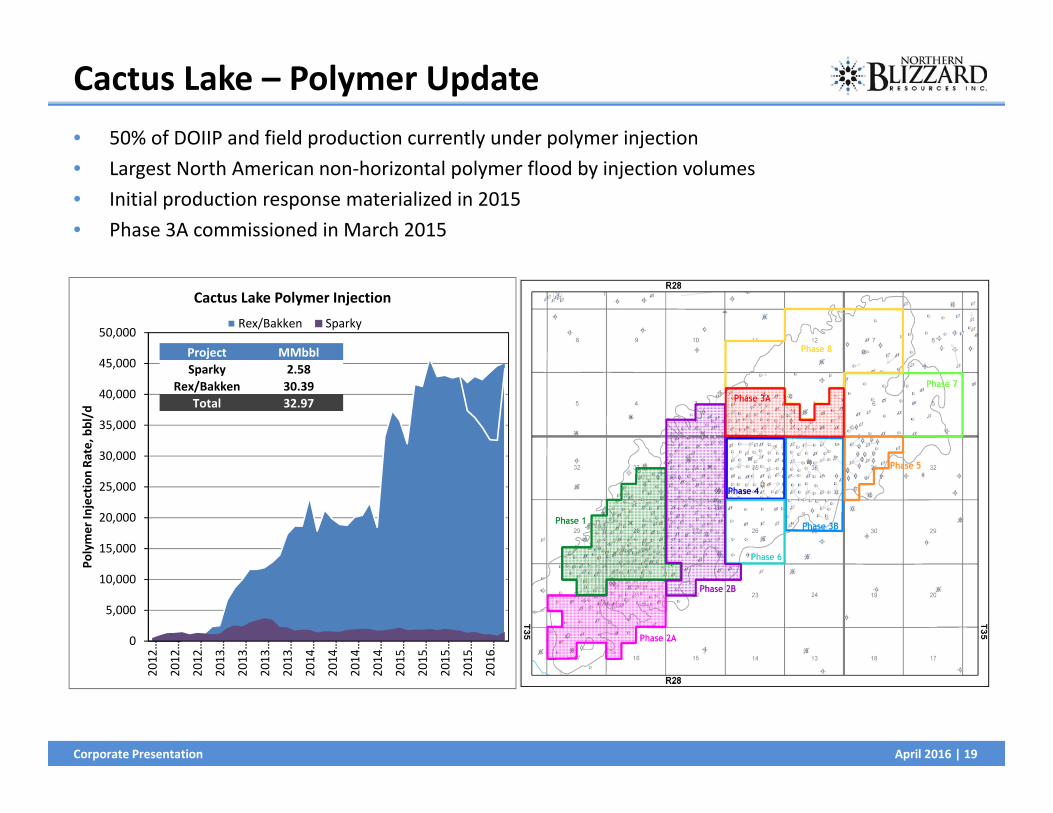
Cactus Lake – Polymer Update• 50% of DOIIP and field production currently under polymer injection• Largest North American non‐horizontal polymer flood by injection volumes• Initial production response materialized in 2015 • Phase 3A commissioned in March 2015
Injection Commencement:Sparky HZ: Q1 2012Phase 1: Q4/12, 2013Phase 2A: 2014Phase 2B: 2014Phase 3A: 2015/03
Sparky
Project MMbblSparky 2.58
Rex/Bakken 30.39Total 32.97

April 2016 | 20Corporate Presentation
0
5
10
15
20
25
30
0 10 20 30 40 50 60
WOR
Water ‐ Oil Ratio (WOR)
0
100
200
300
400
500
600
0 10 20 30 40 50 60
Water Rate (bbl/d)
Water Rate
0
5
10
15
20
25
30
0 10 20 30 40 50 60
Oil Ra
te (b
bl/d)
Oil Rate
Cactus Lake – Why Polymer Flood Works• Normalized comparison between polymer flood
(PF) and waterflood (WF) areas
Phase 2B Phase 4
Location (Section) N27, S34 35Flood Type Polymer Water
Infill Drill Timing 2012‐2013 2011Avg Net Pay (m) 8.5 7.5
Oil rates are comparable
Polymer flood has lower total fluid rates
Lower WOR demonstrates
improved sweep efficiency
Improved sweep efficiency of polymer flood providesopportunity to increase ultimate reserve recovery
PF WF

April 2016 | 21Corporate Presentation
0
1,000
2,000
3,000
4,000
5,000
6,000
7,000
8,000
9,000Jan‐00
Jul‐0
0
Jan‐01
Jul‐0
1
Jan‐02
Jul‐0
2
Jan‐03
Jul‐0
3
Jan‐04
Jul‐0
4
Jan‐05
Jul‐0
5
Jan‐06
Jul‐0
6
Jan‐07
Jul‐0
7
Jan‐08
Jul‐0
8
Jan‐09
Jul‐0
9
Jan‐10
Jul‐1
0
Jan‐11
Jul‐1
1
Jan‐12
Jul‐1
2
Jan‐13
Jul‐1
3
Jan‐14
Jul‐1
4
Jan‐15
Jul‐1
5
Jan‐16
(bbl/d)
Cactus Lake Area – Oil Production
20152014201320122011SparkyBase
Cactus Lake – Consistent Demonstrated Growth
Demonstrated production growth – 19% CAGRPolymer and waterflood focus providing low decline, stable production base

April 2016 | 22Corporate Presentation
Cactus Lake – Reduced Operating Costs, Strong NOI(1)
2015 Highlights:• 12% year over year production
growth• Polymer production response• Limited infill drilling • 32% reduction in operating costs• Strong free cash flow(2) generated
2016 Guidance:• $14.9 million capital expenditures
– 70% polymer powder• Flat production
– Polymer to offset decline• $11.21/boe operating costs
1. Net operating income (NOI) is revenue less royalties, operating costs and transportation2. Free cash flow is net operating income less capital expenditures
ProducersDrilled 53 120 103 81 19 0
‐
5.00
10.00
15.00
20.00
25.00
‐
2,000
4,000
6,000
8,000
10,000
2011 2012 2013 2014 2015 2016E
$/bo
e
boe/d
Average Daily Production and Operating Costs
Production Operating Cost
‐ 20 40 60 80
100 120 140
2011 2012 2013 2014 2015 2016E
$ million
Capital Expenditures and Net Operating Income
Capital Expenditures Net Operating Income

April 2016 | 23Corporate Presentation
Winter

April 2016 | 24Corporate Presentation
Winter – Overview
• Play characteristics– Oil over active water system– Exploitable through horizontal drilling– Repeatable infill drilling
1. Internal estimate, gross2. Based on an independent reserve report effective Dec 31, 2015.
DOIIP +600 mmbbls bbl(1)
Recovered to date < 8% gross estimate2P Reserves(2) 22 million boeEst. 2016 production +2,770 boe/dWells drilled to Mar 31, 2016192 gross
Drilling inventory +450 gross locations (>38% unbooked)
Economics +50% IRR at US$50/bbl WTI
Highlights
NBRI
CNRL
April 2016 | 25Corporate Presentation
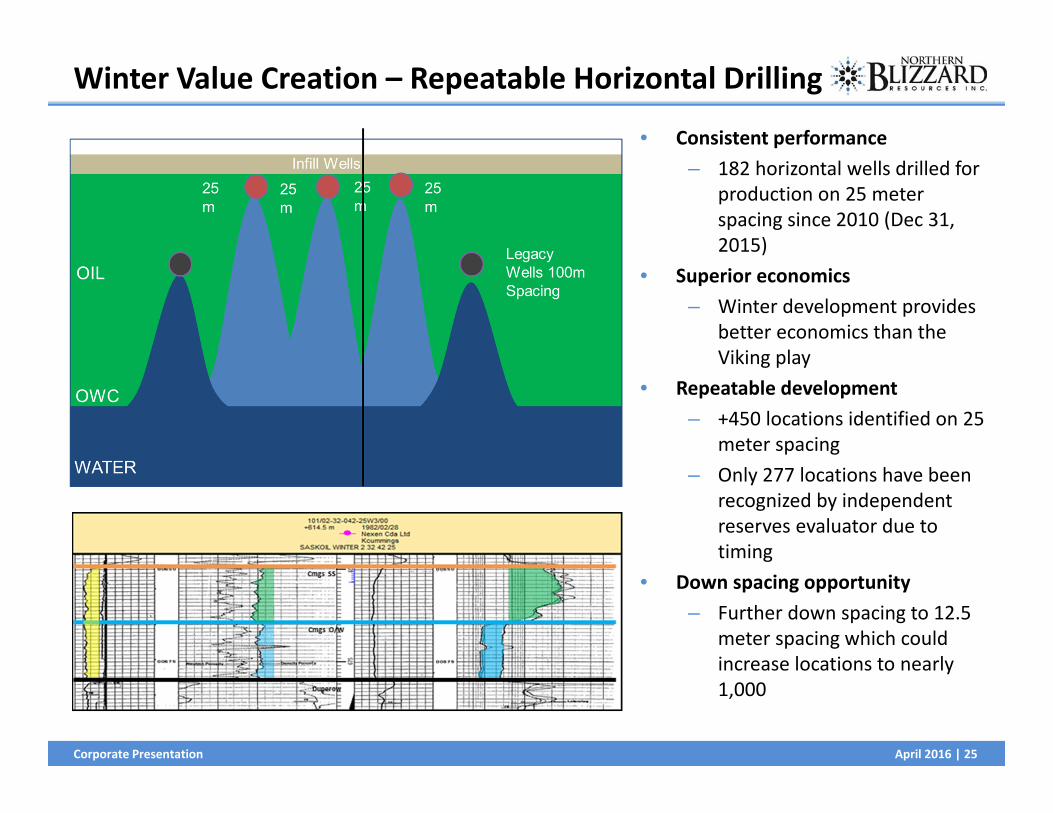
Winter Value Creation – Repeatable Horizontal Drilling
• Consistent performance– 182 horizontal wells drilled for
production on 25 meter spacing since 2010 (Dec 31, 2015)
• Superior economics– Winter development provides
better economics than the Viking play
• Repeatable development– +450 locations identified on 25
meter spacing– Only 277 locations have been
recognized by independent reserves evaluator due to timing
• Down spacing opportunity– Further down spacing to 12.5
meter spacing which could increase locations to nearly 1,000

April 2016 | 26Corporate Presentation
Winter – Reduced Operating Costs, Strong NOI(1)
2015 Highlights:• Operating costs continue to
decline• Flat year over year production
with minimal capital expenditures• Significant free cash flow(2)
generation in 2015• Drilled 10 net producers in 2015
2016 Guidance:• $5.0 million capital expenditures• 2,770 boe/d production• $17.24/boe operating cost
1. Net operating income (NOI) is revenue less operating costs, royalties and transportation2. Free cash flow is net operating income less capital expenditures
Net Producing Hz Wells Drilled 0 15 36 49 33 10 0
‐
5.00
10.00
15.00
20.00
25.00
‐
1,000
2,000
3,000
4,000
2010 2011 2012 2013 2014 2015 2016E
$/bo
e
boe/d
Average Daily Production and Operating Costs
Production Operating Cost
‐ 10 20 30 40 50 60 70
2010 2011 2012 2013 2014 2015 2016E
$ million
Capital Expenditures and Net Operating Income
Capital Expenditures Net Operating Income
April 2016 | 27Corporate Presentation
Coleville

April 2016 | 28Corporate Presentation
Coleville Viking – 10,000 Acres in Proven Fairway
Source: The Playbook: Ranking North America’s Oil & Gas Plays – Sixth Edition, September 2015, Scotiabank
Company Land
• Smiley and Whiteside are expected to provide average peak production rates of 60 boe/d and greater
• With capital reductions and strong netbacks a 44% BT IRR can be provided at US$50/bbl WTI price
Raging RiverWhitecapNovusTeineIshCrescent PointPenn WestOther Operators

April 2016 | 29Corporate Presentation
Coleville – Development Opportunity• One of the largest tight oil plays in
western Canada
• NBRI drilled 48 wells from Jan 2014 to Dec 2015
• ~650 boe/d estimated for 2016
• ~$9.50 per boe operating costs estimated for 2016
• Over $26.00 per boe field netback estimated for 2016
• Opportunity to develop +300 locations
• 112 low risk drilling locations recognized in independent reserves report
Source: The Playbook: Ranking North America’s Oil & Gas Plays – Sixth Edition, September 2015, Scotiabank
‐ 500
1,000 1,500 2,000 2,500 3,000
Jan '14 Jan '15 Jan '16 Jan '17 Jan '18 Jan '19 Jan '20
Prod
uctio
n (boe
/d)
Viking Oil ‐ NBRI Production Growth
Pre 2016 2016 2017 2018 2019 2020
April 2016 | 30Corporate Presentation
SAGD
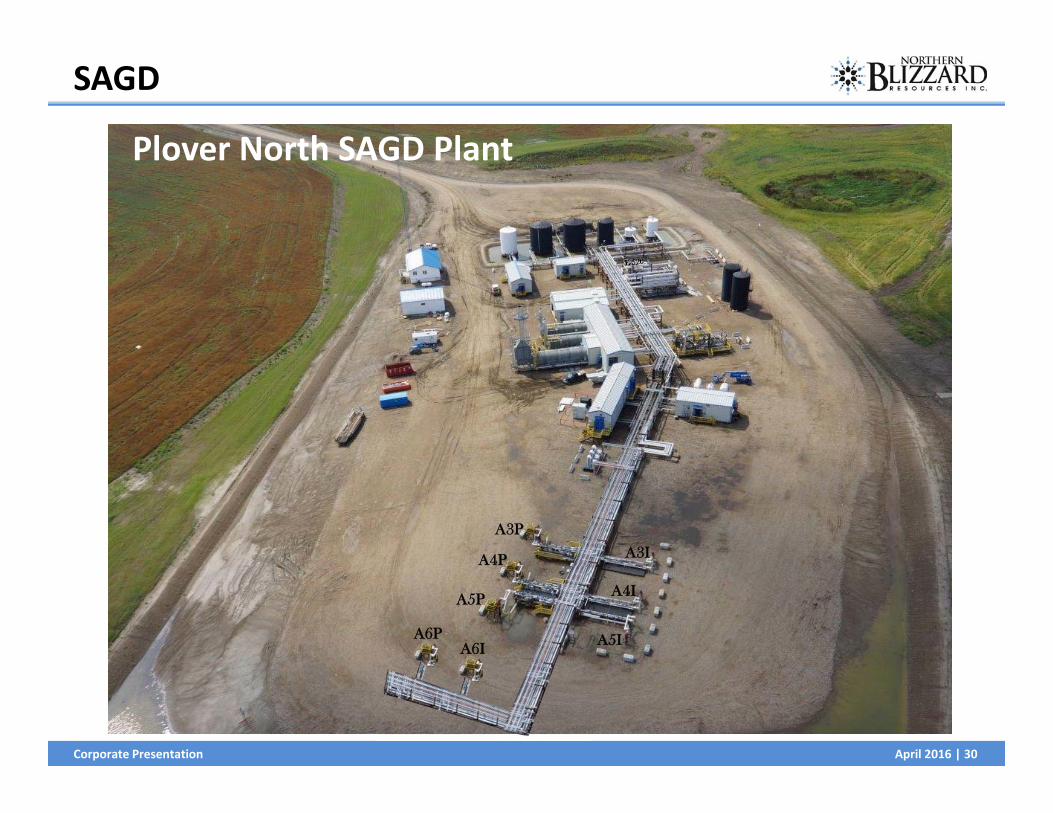
Plover North SAGD Plant
A3P
A4P
A5P A4I
A5I
A3I
A6PA6I
Plover North SAGD Plant

April 2016 | 31Corporate Presentation
SAGD Development – Repeatable Opportunities• Large oil in place• Technology‐driven recovery• Long life assets
• Huge upside potential• Significant advantages from existing
infrastructure
Est DOIIP – 176 mmbbls

April 2016 | 32Corporate Presentation
Plover North SAGD – Cumulative Steam and Oil
0
50,000
100,000
150,000
200,000
250,000
0 100,000 200,000 300,000 400,000 500,000 600,000 700,000
Cumulative Oil, bbl
Cumulative Steam, bbl
A3 A4 A5 A6
April 2016 | 33Corporate Presentation
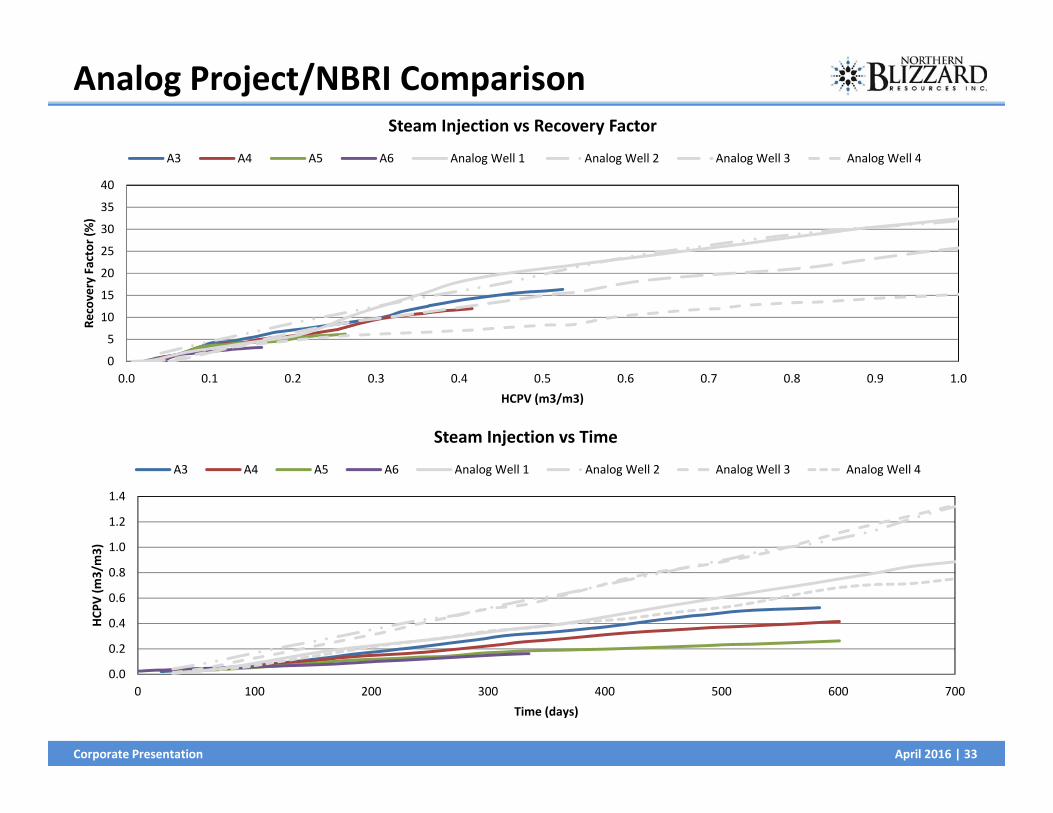
Analog Project/NBRI Comparison
0
5
10
15
20
25
30
35
40
0.0 0.1 0.2 0.3 0.4 0.5 0.6 0.7 0.8 0.9 1.0
Recovery Factor (%)
HCPV (m3/m3)
Steam Injection vs Recovery Factor
A3 A4 A5 A6 Analog Well 1 Analog Well 2 Analog Well 3 Analog Well 4
0.0
0.2
0.4
0.6
0.8
1.0
1.2
1.4
0 100 200 300 400 500 600 700
HCP
V (m
3/m3)
Time (days)
Steam Injection vs Time
A3 A4 A5 A6 Analog Well 1 Analog Well 2 Analog Well 3 Analog Well 4

April 2016 | 34Corporate Presentation
Saskatchewan SAGD – Well Performance vs. Steam Rate
1. Data sourced from Accumap and public company filings as at April 6, 2016.
0
100
200
300
400
500
600
0 200 400 600 800 1000 1200 1400 1600
2yr A
verage
Steam
Rate, sm3/d
2yr Average Oil Rate, bbls/d
NBRI Plover Lake Pad A
Baytex Kerrobert 08‐36
Baytex Kerrobert 10‐36
CNRL Senlac Pad 1
CNRL Senlac Pad 2
CNRL Senlac Pad 3
CNRL Senlac Pad 4
CNRL Senlac Pad 5
CNRL Senlac Pad 6
Husky Bolney Pad 33
Husky Bolney Pad 56
Husky Bolney Pad 06
Husky Bolney Pad 7S
Husky Bolney Pad 7N
Husky Celtic Pad 1
Husky Celtic Pad 2
Husky Celtic Pad 3
Husky Celtic Pad 4
Husky Celtic Pad 5
Husky Celtic Pad 6
Husky Celtic Pad 7
Husky Celtic Pad 8
Husky Paradise Hill Pad 1
Husky Pikes Peak Pad 1
Husky Pikes Peak South Pad 1
Husky Pikes Peak South Pad 2
Husky Pikes Peak South Pad 3
Husky Pikes Peak South Pad 4
Husky Pikes Peak South Pad 5
April 2016 | 35Corporate Presentation
Corporate InformationAUDITOR KPMG LLP
ENGINEERING CONSULTANTS Ryder Scott Company ‐ Canada
INVESTOR CONTACTS John Rooney, Chairman & CEOMichael Makinson, VP Finance & CFO
1900, 421 – 7 Avenue SW, Calgary, AB T2P 4K9(403) 930‐3000
www.northernblizzard.com