u.s. supply chain vulnerability analysis
TRANSCRIPT

Descartes Systems Group, Inc. | www.descartes.com | White Paper Title goes hereDescartes Systems Group, Inc. | www.descartes.com | U.S. Supply Chain Vulnerability Analysis
U.S. Supply Chain Vulnerability AnalysisWhat President Biden’s Supply Chain Review Executive Order Reveals

22Descartes Systems Group, Inc. | www.descartes.com | U.S. Supply Chain Vulnerability Analysis
Background
On February 24, 2021, President Biden issued the “Executive Order on America’s Supply Chains” which requires a review of potential vulnerabilities in the U.S. supply chains of four key industries to prevent future occurrences of shortages that have been painfully obvious during the coronavirus pandemic.
The Biden Administration’s focus was on strengthening the resiliency of U.S. supply chains and reducing the country’s dependence on certain nations or over-reliance on a single nation for selected commodities. The objective was to both maintain America’s competitive edge economically and strengthen its national security.
Using Descartes Datamyne™ research data, this white paper gives each industry a supply chain vulnerability score based on the current situation, examines existing weak points, and offers potential remedies in terms of identification of alternative sources of supply to minimize the risk of further supply disruptions.
The Four Key Industries Reviewed for Potential Vulnerabilities
SEMICONDUCTOR(Including Printed Circuits) Used in the manufacture of a variety of electronic devices from consumer goods, computers, mobile phones to automobiles and defense items.
LARGE-CAPACITY BATTERIES(Lithium Ion Batteries) For the production of rechargeable batteries commonly used for portable electronics, electric vehicles, and military and aerospace applications.
PHARMACEUTICALS(Including Vaccines and PPE)Covering medicines such as penicillin, antibiotics and insulin, plus associated items including vaccines and Personal Protection Equipment.
STRATEGIC MINERALS AND MATERIALS(Rare Earth Metals) Used to make everyday devices such as flat screens, computer memory, DVDs, cell phones, and fluorescent lights, all the way to advanced weaponry.

33Descartes Systems Group, Inc. | www.descartes.com | U.S. Supply Chain Vulnerability Analysis
Supply Chain Vulnerability Scores
The supply chain vulnerability score for U.S. supply chains by industry is based on a range of factors including general supply availability, countries of origin, demand side pressures, and geo-political concerns.
As the following pages of this white paper will elaborate in more detail on a per industry basis, the combination of low availability of inventory with reliance on few supplier nations results in the risk score tending higher, and vice-versa.
Semiconductor(Including Printed Circuits) High
Large-Capacity Batteries(Lithium Ion Batteries) High
Pharmaceuticals(Including Vaccines) Moderate to High
Strategic Minerals and Materials High
Personal Protective Equipment Low
Industry Supply Chain Vulnerability Score
44Descartes Systems Group, Inc. | www.descartes.com | U.S. Supply Chain Vulnerability Analysis
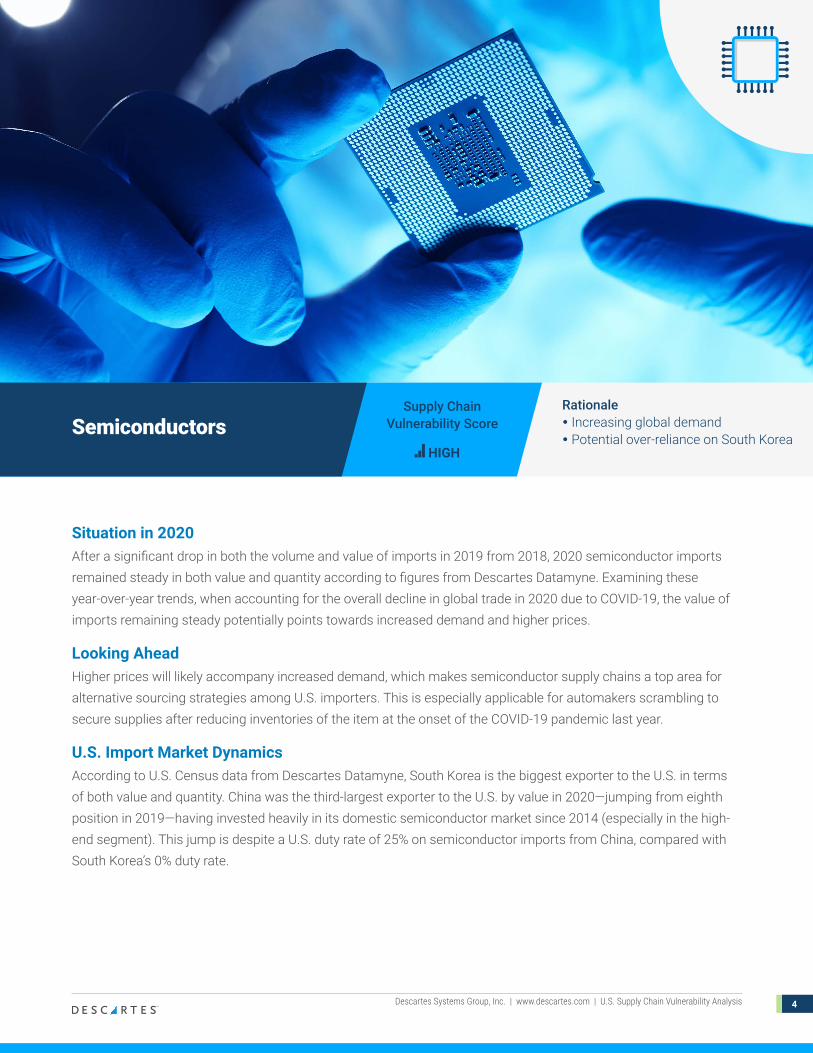
Situation in 2020After a significant drop in both the volume and value of imports in 2019 from 2018, 2020 semiconductor imports remained steady in both value and quantity according to figures from Descartes Datamyne. Examining these year-over-year trends, when accounting for the overall decline in global trade in 2020 due to COVID-19, the value of imports remaining steady potentially points towards increased demand and higher prices.
Looking AheadHigher prices will likely accompany increased demand, which makes semiconductor supply chains a top area for alternative sourcing strategies among U.S. importers. This is especially applicable for automakers scrambling to secure supplies after reducing inventories of the item at the onset of the COVID-19 pandemic last year.
U.S. Import Market DynamicsAccording to U.S. Census data from Descartes Datamyne, South Korea is the biggest exporter to the U.S. in terms of both value and quantity. China was the third-largest exporter to the U.S. by value in 2020—jumping from eighth position in 2019—having invested heavily in its domestic semiconductor market since 2014 (especially in the high-end segment). This jump is despite a U.S. duty rate of 25% on semiconductor imports from China, compared with South Korea’s 0% duty rate.
SemiconductorsSupply Chain
Vulnerability Score Rationale y Increasing global demand y Potential over-reliance on South Korea
HIGH

55Descartes Systems Group, Inc. | www.descartes.com | U.S. Supply Chain Vulnerability Analysis
Deeper Dive: Semiconductor Global TradeLooking at overall global trade, China is the world’s biggest consumer (importer) and producer (exporter) of semiconductors. This is due to its position as the final assembly capital of the world, as well as the country possessing huge domestic demand for electronics and computer goods. It does not, however, have the dominant share, making supply chain risk diversification somewhat less challenging.
Global Export Market For Semiconductors*
Census Data | CIF Value | HS 854150
RecommendationIn place of reshoring options, U.S. importers wanting to mitigate/spread supply chain risk over the long term might look to Southeast Asia as one new source of supply. Taiwan is another major supplier, but there are risks to U.S. importers here given long-running geopolitical tensions between Taipei and Beijing.
Country of Origin Value Year on Year change U.S. Duty Rate
South Korea $118,131,705 0.09% 0%
Taiwan $72,936,092 5.70% 0%
China $52,296,905 257.44% 25%
Malaysia $31,187,451 43.94% 0%
Singapore $18,969,960 -38.27% 0%
Total (of all supplier nations) $400,226,988 0.10%
Top Five Exporters to the U.S. (US Census, Total FOB Value, 2020)*
�������������40%
8% 8%
10%
15%
19%China
Thailand
Hong Kong
United States
Malaysia
Other
*All Data Obtained via U.S. Census through Descartes Datamyne

66Descartes Systems Group, Inc. | www.descartes.com | U.S. Supply Chain Vulnerability Analysis
Situation in 2020From 2018 through 2019, imports of printed circuit boards into the U.S. shrank in both value and quantity on a year-over-year basis, according to Descartes Datamyne research. In 2020, the decline in value bottomed out, but was met with an increase in volume, indicating a pricing shift in the value of these goods.
Looking AheadA rise in global demand for high-tech devices is likely to continue, resulting in higher prices and scarcer inventory–another category for alternative sourcing strategies.
U.S. Import Market DynamicsChina dominates exports of these commodities to the U.S. Taiwan and Japan are in distant second and third places. In 2020, export volumes from China to the U.S. rose about 20% while value fell 15%, despite the U.S. increasing duty rates from 10% to 25% in May 2019. This is an indication of deep discounting on the part of Chinese suppliers to maintain market share in the U.S.
Printed CircuitsSupply Chain
Vulnerability Score Rationale y Surging global demand y Potential over-reliance on China
HIGH

77Descartes Systems Group, Inc. | www.descartes.com | U.S. Supply Chain Vulnerability Analysis
�������������45%
4% 5%
6%
10%
30%China
United States
Germany
Mexico
Hong Kong
Other
Deeper Dive: Printed Circuits Global TradeChina is the world’s biggest consumer (importer) and producer (exporter) of printed circuit boards. This is due to China’s position as the final assembly capital of the world, as well as the country possessing huge domestic demand for electronics and computer goods.
RecommendationAmong importers worldwide, China has the dominant global market share of printed circuits, according to global trade data from Descartes Datamyne, because it has the necessary infrastructure, the skills and the labor force to support this manufacturing base. On the export side, China’s dominance is not as pronounced. From this perspective, Japan, Canada, South Korea and Mexico (all with 0% duty rates) could be part of a U.S. risk diversification strategy.
Country of Origin Value Year on Year change U.S. Duty Rate
China $655,202,599 -15.31% 25%
Taiwan $356,094,278 -2.59% 0%
Japan $177,798,072 31.47% 0%
Canada $104,061,116 -14.94% 0%
South Korea $99,101,838 8.71% 0%
Total (of all supplier nations) $1,746,364,214 -6.50%
Top Five Exporters to the U.S. (US$, FOB, 2020)*
Global Export Market For Printed Circuits*
Census Data | CIF Value | HS 580760
*All Data Obtained via U.S. Census through Descartes Datamyne

88Descartes Systems Group, Inc. | www.descartes.com | U.S. Supply Chain Vulnerability Analysis
Situation in 2020In 2020, imports of lithium ion batteries into the U.S. surged 31% in value and grew a slower 12% in quantity, according to Descartes Datamyne research. The figures point to supply not keeping up with demand.
Large Capacity Batteries (Lithium Ion)
HIGH
Supply Chain Vulnerability Score
Rationale y Surging global demand, especially
for electric vehicles y Potential over-reliance on China
1.50
1.40
1.30
1.20
1.10
.90
.80
.70
.60
Q1 Q2
2018 2019 2020
Q3 Q4
Billi
ons
($U.
S.)
U.S. Imports of Lithium Ion Batteries*
Census Data | Total FOB Value | HS
*All Data Obtained via U.S. Census through Descartes Datamyne

99Descartes Systems Group, Inc. | www.descartes.com | U.S. Supply Chain Vulnerability Analysis
Deeper Dive: Lithium Ion Batteries Global TradeChina is the world’s biggest consumer (importer) of lithium ion batteries while the U.S. is the largest producer (exporter).
The distinction to be made here is that China is the leading producer of electric vehicle batteries, (which is driving the boom in the EV category), while the U.S. is the leading producer of other lithium ion batteries, which China is a big importer of to use in the final assembly of other electronic products.
RecommendationWhile the U.S. works on formulating economic and policy measures, businesses can be proactive and examine alternative sourcing opportunities on the global market. For example, although China is the dominant exporter to the U.S., there are other countries supplying America with lithium ion batteries—some with lower import duties than China (10.9%), such as South Korea (0%), Japan (3.4%) and Germany (3.4%).
Country of Origin Value Year on Year change U.S. Duty Rate
China $2,055,712,456 12.24% 10.9%
South Korea $923,333,386 26.45% 0%
Japan $626,541,547 38.68% 3.4%
Germany $267,247,378 160.49% 3.4%
Taiwan $128,800,990 31.12% 3.4%
Total (of all supplier nations) $4,736,502,699 30.65%
Looking AheadTight supply combined with high demand, resulting in higher prices will likely continue in the foreseeable future. Supply chain risk diversification is critical for U.S. importers.
U.S. Import Market DynamicsChina is the dominant supplier of Lithium Ion batteries to the U.S., but South Korea is challenging this dominance by taking advantage of lower U.S. duty rates. Last year, South Korean shipments jumped more than 26% by value, and based on the same import data, volumes also rose sharply.
Top Five Exporters to the U.S. (US$, FOB, 2020)*
*All Data Obtained via U.S. Census through Descartes Datamyne

1010Descartes Systems Group, Inc. | www.descartes.com | U.S. Supply Chain Vulnerability Analysis
Situation in 2020With COVID-19, there was an expected increase in pharmaceutical imports but, while volumes rose by more than 20% over the course of 2020, the overall value remained steady with prices increasing by only 3%.
Looking AheadSimilar dynamics will likely be in play for the foreseeable future. With the normalizing of high-value shipments from Ireland, the total FOB value will likely increase somewhat.
U.S. Import Market DynamicsIreland and Switzerland are major suppliers to the U.S. of high-end pharmaceutical products, while China and Mexico dominate at the high-volume, low-cost end of the spectrum. There is healthy competition among overseas suppliers, while the U.S. is home to a vibrant pharmaceutical industry.
PharmaceuticalsSupply Chain
Vulnerability Score Rationale y Strong domestic pharmaceutical base y Healthy competition among
overseas suppliers LOW TO MODERATE
1111Descartes Systems Group, Inc. | www.descartes.com | U.S. Supply Chain Vulnerability Analysis
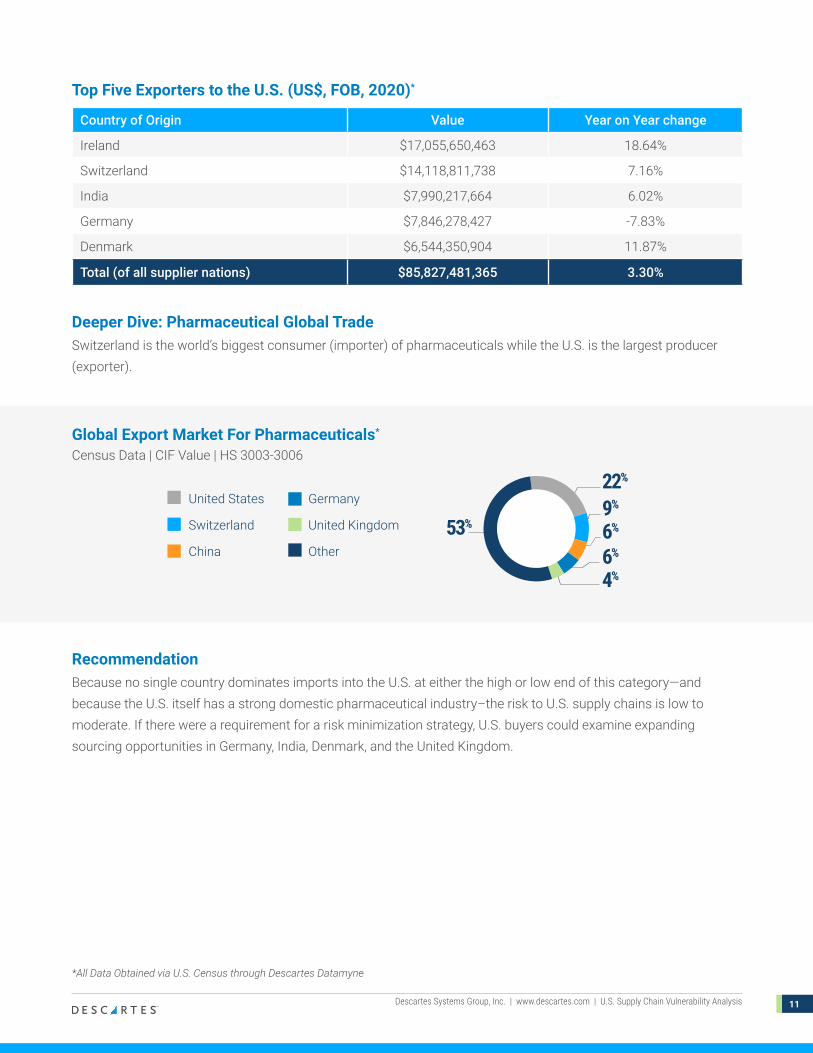
�������������53%
4%6%6%9%
22%
United States
Switzerland
China
Germany
United Kingdom
Other
Deeper Dive: Pharmaceutical Global TradeSwitzerland is the world’s biggest consumer (importer) of pharmaceuticals while the U.S. is the largest producer (exporter).
RecommendationBecause no single country dominates imports into the U.S. at either the high or low end of this category—and because the U.S. itself has a strong domestic pharmaceutical industry–the risk to U.S. supply chains is low to moderate. If there were a requirement for a risk minimization strategy, U.S. buyers could examine expanding sourcing opportunities in Germany, India, Denmark, and the United Kingdom.
Country of Origin Value Year on Year change
Ireland $17,055,650,463 18.64%
Switzerland $14,118,811,738 7.16%
India $7,990,217,664 6.02%
Germany $7,846,278,427 -7.83%
Denmark $6,544,350,904 11.87%
Total (of all supplier nations) $85,827,481,365 3.30%
Top Five Exporters to the U.S. (US$, FOB, 2020)*
Global Export Market For Pharmaceuticals*
Census Data | CIF Value | HS 3003-3006
*All Data Obtained via U.S. Census through Descartes Datamyne

1212Descartes Systems Group, Inc. | www.descartes.com | U.S. Supply Chain Vulnerability Analysis
Situation in 2020Imports into the U.S. of vaccines and their components rose 20% by value in 2020, and 8% by quantity, according to Descartes Datamyne research. Limited supplies were exacerbated by global initiatives to ramp up for large-scale COVID-19 vaccine production.
Looking AheadGiven supply constraints and increased demand, the trend for rising prices for U.S. imports in this category will likely continue throughout 2021, making this a key area for alternative supply sourcing.
U.S. Import Market DynamicsIreland is a major supplier to the U.S. of vaccines (typically more expensive, high-end offerings), but last year it was overtaken by Germany. Other big gainers were Belgium, Switzerland, and Japan. The trend is an indication of rising global demand.
VaccinesSupply Chain
Vulnerability Score Rationaley Intense global demandy Limited number of suppliers
HIGH
1313Descartes Systems Group, Inc. | www.descartes.com | U.S. Supply Chain Vulnerability Analysis
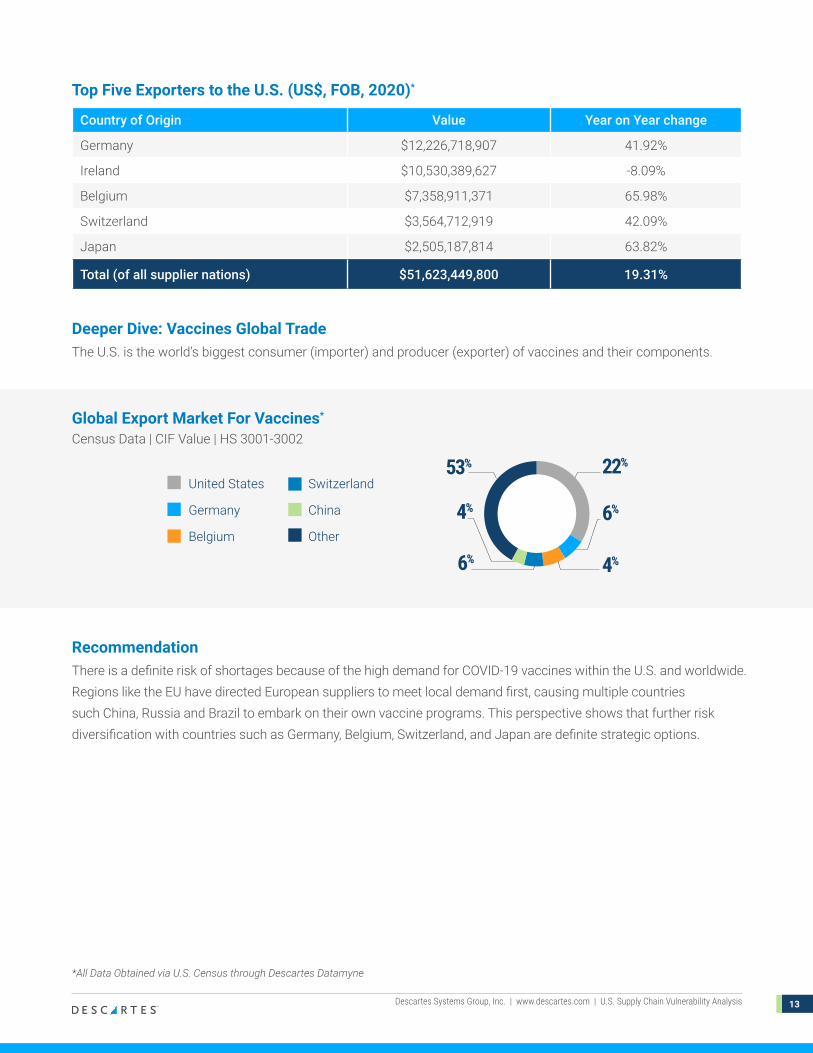
Deeper Dive: Vaccines Global TradeThe U.S. is the world’s biggest consumer (importer) and producer (exporter) of vaccines and their components.
RecommendationThere is a definite risk of shortages because of the high demand for COVID-19 vaccines within the U.S. and worldwide. Regions like the EU have directed European suppliers to meet local demand first, causing multiple countries such China, Russia and Brazil to embark on their own vaccine programs. This perspective shows that further risk diversification with countries such as Germany, Belgium, Switzerland, and Japan are definite strategic options.
Country of Origin Value Year on Year change
Germany $12,226,718,907 41.92%
Ireland $10,530,389,627 -8.09%
Belgium $7,358,911,371 65.98%
Switzerland $3,564,712,919 42.09%
Japan $2,505,187,814 63.82%
Total (of all supplier nations) $51,623,449,800 19.31%
Top Five Exporters to the U.S. (US$, FOB, 2020)*
�������������53%
4%
6% 4%
6%
22%
United States
Germany
Belgium
Switzerland
China
Other
Global Export Market For Vaccines*
Census Data | CIF Value | HS 3001-3002
*All Data Obtained via U.S. Census through Descartes Datamyne

1414Descartes Systems Group, Inc. | www.descartes.com | U.S. Supply Chain Vulnerability Analysis
Situation in 2020Due to COVID-19, imports of PPE leapt 60% in value and more than 100% in quantity last year, according to figures from Descartes Datamyne.
Personal Protective Equipment (PPE)
Supply Chain Vulnerability Score
Rationaley An abundance of overseas suppliersy An abundance of domestic suppliers
LOW
16,000
14,000
12,000
10,000
8,000
6,000
4,000
2,000
0
Q1 Q2
2018 2019 2020
Q3 Q4
mill
ions
($U.
S.)
U.S. Imports of PPE*
*All Data Obtained via U.S. Census through Descartes Datamyne

1515Descartes Systems Group, Inc. | www.descartes.com | U.S. Supply Chain Vulnerability Analysis
Deeper Dive: Personal Protective Equipment Global TradeChina is the world’s biggest consumer (importer) of PPE while the United States is the largest producer (exporter).
RecommendationThe risk of supply constraints in the U.S. is currently low because of strong domestic PPE production. To enhance preparedness for when demand could spike again in times of future crisis, a risk diversification strategy for U.S. importers could include expanding sourcing opportunities with nations, such as Canada, Ireland, Germany, and even Mexico and the Netherlands.
Country of Origin Value Year on Year change
China $20,968,579,901 178.76%
Mexico $5,953,950,498 6.73%
Germany $1,936,657,757 -10.89%
Canada $1,180,660,229 21.22%
Ireland $1,059,653,856 -20.73%
Total (of all supplier nations) $41,271,997,612 56.96%
Top Five Exporters to the U.S. (US$, FOB, 2020)*
59%
United States
China
Germany
Mexico
Netherlands
Other
5%
7%
5%
7%17%
�������������Global Export Market For PPE*
Census Data | CIF Value
*All Data Obtained via U.S. Census through Descartes Datamyne
Looking AheadThe supply side was caught off-guard in the initial stages of the COVID-19 pandemic, but it was able to very rapidly ramp-up production to ultimately be able to meet demand. For this year, the demand for PPE will likely return to levels that current supply and production should be able to meet.
U.S. Import Market DynamicsChina and Mexico are by far the biggest exporters of PPE to the U.S. by value and volume. But there is a long list of potential suppliers around the world and the U.S., itself, is a major producer in this category.
1616Descartes Systems Group, Inc. | www.descartes.com | U.S. Supply Chain Vulnerability Analysis
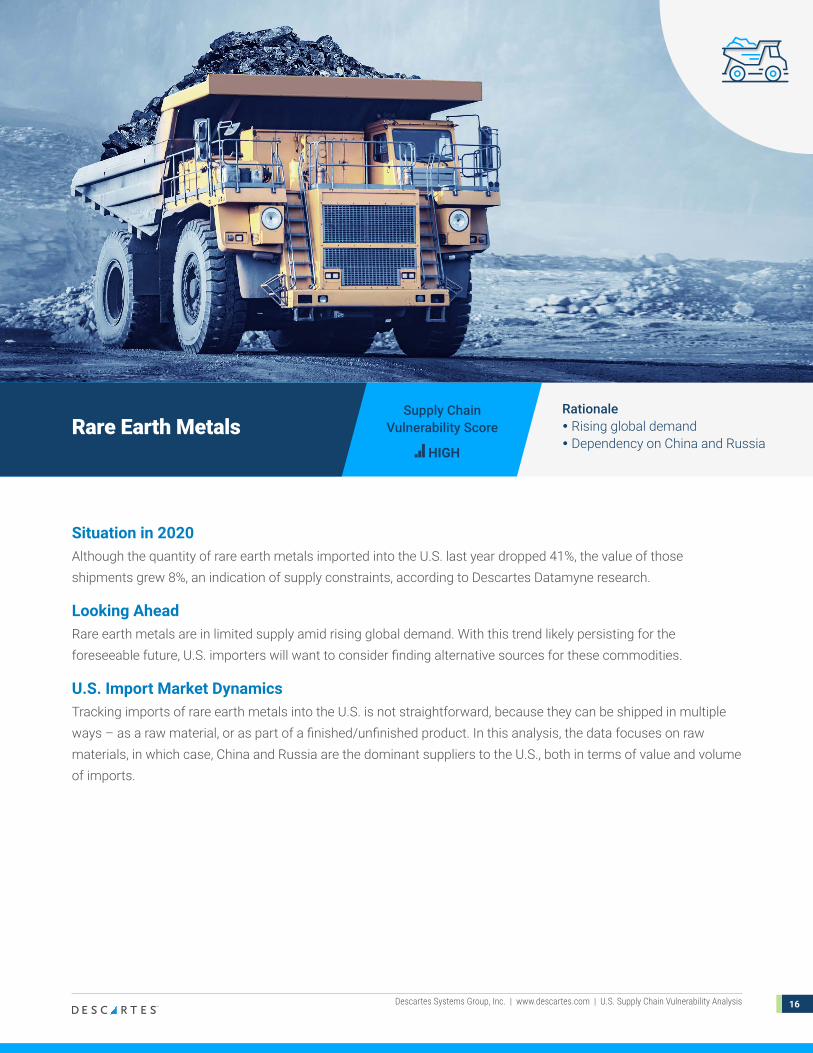
Situation in 2020Although the quantity of rare earth metals imported into the U.S. last year dropped 41%, the value of those shipments grew 8%, an indication of supply constraints, according to Descartes Datamyne research.
Looking AheadRare earth metals are in limited supply amid rising global demand. With this trend likely persisting for the foreseeable future, U.S. importers will want to consider finding alternative sources for these commodities.
U.S. Import Market DynamicsTracking imports of rare earth metals into the U.S. is not straightforward, because they can be shipped in multiple ways – as a raw material, or as part of a finished/unfinished product. In this analysis, the data focuses on raw materials, in which case, China and Russia are the dominant suppliers to the U.S., both in terms of value and volume of imports.
Rare Earth MetalsSupply Chain
Vulnerability Score Rationaley Rising global demandy Dependency on China and Russia
HIGH
1717Descartes Systems Group, Inc. | www.descartes.com | U.S. Supply Chain Vulnerability Analysis
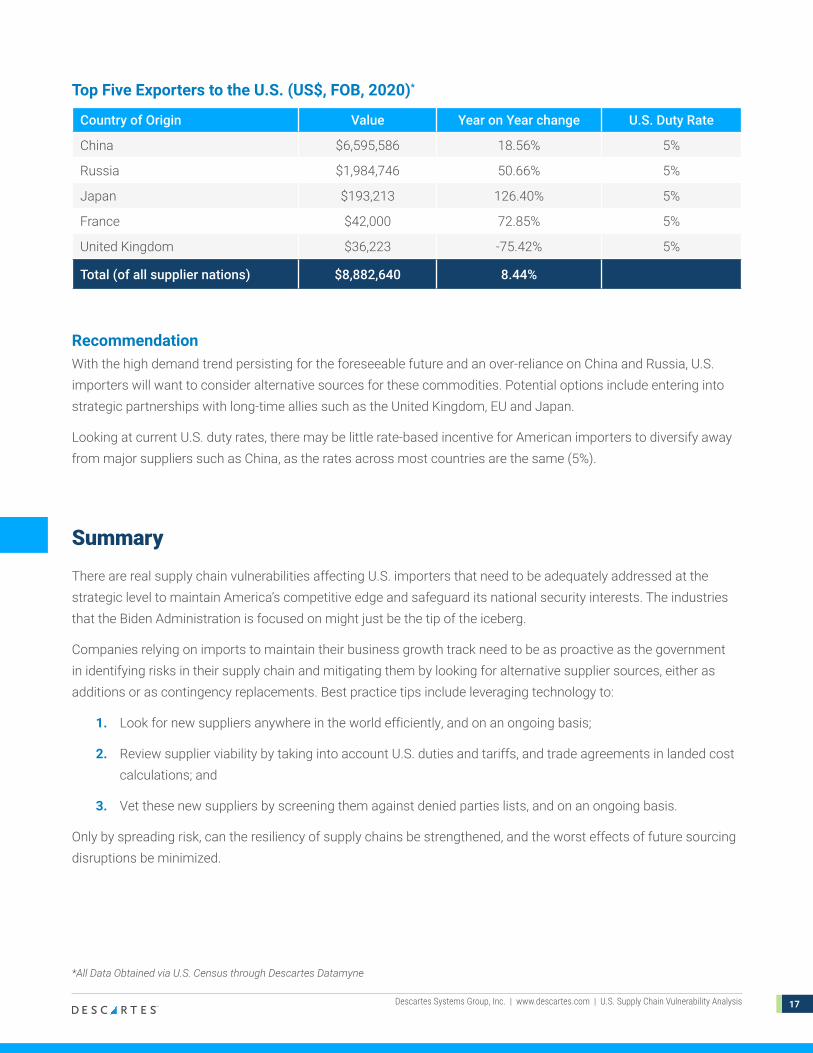
RecommendationWith the high demand trend persisting for the foreseeable future and an over-reliance on China and Russia, U.S. importers will want to consider alternative sources for these commodities. Potential options include entering into strategic partnerships with long-time allies such as the United Kingdom, EU and Japan.
Looking at current U.S. duty rates, there may be little rate-based incentive for American importers to diversify away from major suppliers such as China, as the rates across most countries are the same (5%).
Country of Origin Value Year on Year change U.S. Duty Rate
China $6,595,586 18.56% 5%
Russia $1,984,746 50.66% 5%
Japan $193,213 126.40% 5%
France $42,000 72.85% 5%
United Kingdom $36,223 -75.42% 5%
Total (of all supplier nations) $8,882,640 8.44%
Top Five Exporters to the U.S. (US$, FOB, 2020)*
Summary
There are real supply chain vulnerabilities affecting U.S. importers that need to be adequately addressed at the strategic level to maintain America’s competitive edge and safeguard its national security interests. The industries that the Biden Administration is focused on might just be the tip of the iceberg.
Companies relying on imports to maintain their business growth track need to be as proactive as the government in identifying risks in their supply chain and mitigating them by looking for alternative supplier sources, either as additions or as contingency replacements. Best practice tips include leveraging technology to:
1. Look for new suppliers anywhere in the world efficiently, and on an ongoing basis;
2. Review supplier viability by taking into account U.S. duties and tariffs, and trade agreements in landed cost calculations; and
3. Vet these new suppliers by screening them against denied parties lists, and on an ongoing basis.
Only by spreading risk, can the resiliency of supply chains be strengthened, and the worst effects of future sourcing disruptions be minimized.
*All Data Obtained via U.S. Census through Descartes Datamyne

Uniting the People & Technology That Move the World.The Descartes Systems Group Inc. | [email protected] | www.descartes.com | © All rights reserved
About Descartes Datamyne
With a comprehensive database of accurate, up-to-date import-export information, Descartes Datamyne delivers data for market research, sales insight, supply chain management, enhanced security and competitive strategy. The solution is powered by the world’s largest searchable trade database, covering the global commerce of 230 markets across 5 continents.
Manufacturers, shippers wholesalers, transport and logistics service providers, management consultants, legal practitioners, industry analysts and more use our exceptionally accurate and granular data to initiate growth strategies, explore new markets, benchmark performance, monitor commodity volumes and values, simplify trade data research, discover buyer seller relationships and refine sourcing strategies.
Discover more at www.datamyne.com.
About Descartes Systems Group
Descartes (Nasdaq:DSGX) (TSX:DSG) is the global leader in providing on-demand, software-as-a-service solutions focused on improving the productivity, performance and security of logistics-intensive businesses.
Customers use our modular, software-as-a-service solutions to route, schedule, track and measure delivery resources; plan, allocate and execute shipments; rate, audit and pay transportation invoices; access global trade data; file customs and security documents for imports and exports; and complete numerous other logistics processes by participating in the world’s largest, collaborative multimodal logistics community.
Our headquarters are in Waterloo, Ontario, Canada and we have offices and partners around the world.
Learn more at www.descartes.com and connect with us on LinkedIn and Twitter.