model of supply chain vulnerability for fresh producefaculty.nps.edu/camacken/docs/presentation...
TRANSCRIPT

Model of supply chain vulnerability for fresh produce
Cameron MacKenzie, Assistant Professor, Defense Resources Management Institute, Naval Postgraduate School
Aruna Apte, Associate Professor, Graduate School of Business and Public Policy, Naval Postgraduate School

Fresh produce contamination
2

Previous research
• Uniqueness of fresh produce supply chains (perishability of product, multitude of growers)
• Factors that influence fresh produce supply chain disruptions – Traceability, transparency, testability, time, trust, and training (Roth et
al., 2008) – Traceability, product type, communication, topological structure,
exposure to contamination (Apte, 2010)
• Disruption management models: actions taken during and after disruption
3
Roth, A. V., Tsay, A. A., Pullman, M. E., and Gray, J. V. (2008). Unraveling the food supply chain: Strategic insights from China and the 2007 recalls. Journal of Supply Chain Management, 44(1), 22-39. Apte, A. (2010). Supply chain networks for perishable and essential commodities: Design and vulnerabilities. Journal of Operations and Supply Chain Management, 3(2), 26-43.
What’s new with this research?
• Build a model that quantifies the effects of a contamination in fresh produce supply chain
• Translate qualitative factors that influence vulnerability into a mathematical model
• Quantify benefits of disruption management strategies for contamination of fresh produce
4
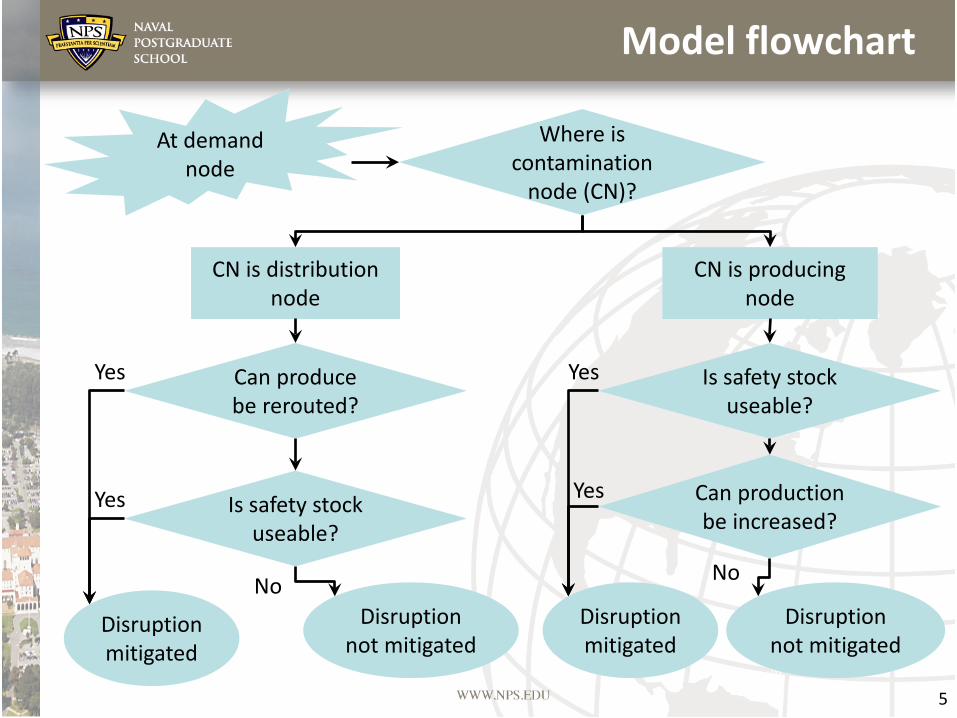
Model flowchart
5
At demand node
Where is contamination
node (CN)?
CN is distribution node
CN is producing node
Can produce be rerouted?
Is safety stock useable?
Is safety stock useable?
Can production be increased?
Disruption mitigated
Disruption not mitigated
Disruption mitigated
Disruption not mitigated
Yes
Yes
No
Yes
Yes
No
Measure of impact
• Lost sales compared to sales without contamination
• Sum of three components – While searching for source of contamination – While relying on safety stock – After safety stock depleted
6
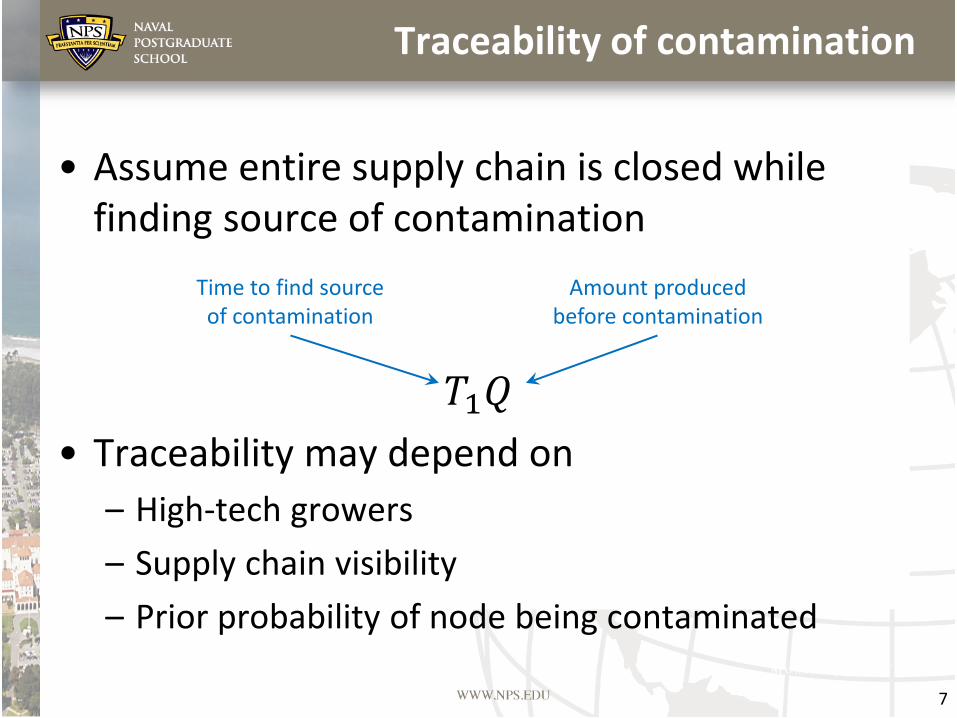
Traceability of contamination
• Assume entire supply chain is closed while finding source of contamination
𝑇𝑇1𝑄𝑄
• Traceability may depend on – High-tech growers – Supply chain visibility – Prior probability of node being contaminated
7
Time to find source of contamination
Amount produced before contamination

Demand after contamination
• Demand for product may drop because of contamination
• New demand after contamination 𝐷𝐷∗ • Depends on
– Essentialness of product – Communication to consumers – Trust level
8

Safety stock
Safety stock may be used to mitigate disruption
min 𝑡𝑡𝑠𝑠 − 𝑇𝑇1 +,𝑠𝑠
𝐷𝐷∗ − 𝑄𝑄∗,𝑇𝑇2 𝑄𝑄 − 𝐷𝐷∗
9
Time to find source of contamination
Time until safety stock perishes
Amount of safety stock
Amount delivered after contamination
Amount produced before contamination
Demand after contamination
Time until contaminated node reopens

After safety stock depleted
If contaminated node is distribution node
𝑇𝑇2 − min 𝑡𝑡𝑠𝑠 − 𝑇𝑇1 +,𝑠𝑠
𝐷𝐷∗ − 𝑄𝑄∗+𝑄𝑄 − 𝑄𝑄∗
10
Time to find source of contamination
Amount of safety stock
Amount produced before contamination
Time until safety stock perishes Amount delivered after contamination
Demand after contamination
Time until contaminated node reopens
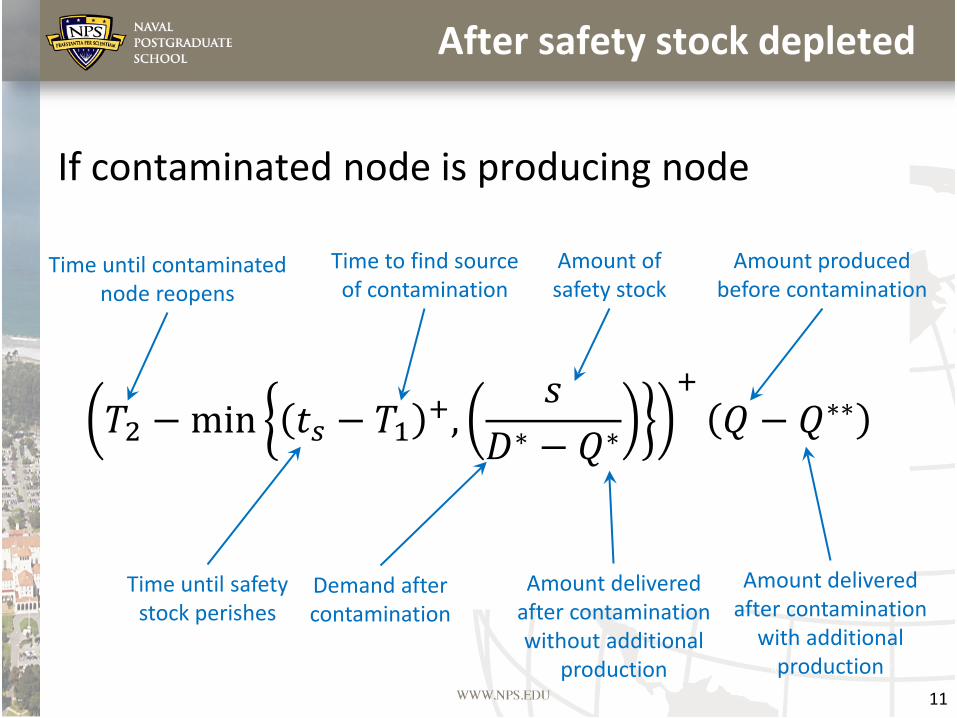
After safety stock depleted
If contaminated node is producing node
𝑇𝑇2 − min 𝑡𝑡𝑠𝑠 − 𝑇𝑇1 +,𝑠𝑠
𝐷𝐷∗ − 𝑄𝑄∗+𝑄𝑄 − 𝑄𝑄∗∗
11
Time to find source of contamination
Amount of safety stock
Amount produced before contamination
Time until safety stock perishes
Amount delivered after contamination without additional
production
Demand after contamination
Time until contaminated node reopens
Amount delivered after contamination
with additional production

Safety stock and demand
12
Contaminated node is distribution node
Contaminated node is producing node
𝑡𝑡𝑠𝑠 − 𝑇𝑇1 𝐷𝐷∗ − 𝑄𝑄∗ 𝑡𝑡𝑠𝑠 − 𝑇𝑇1 𝐷𝐷∗ − 𝑄𝑄∗
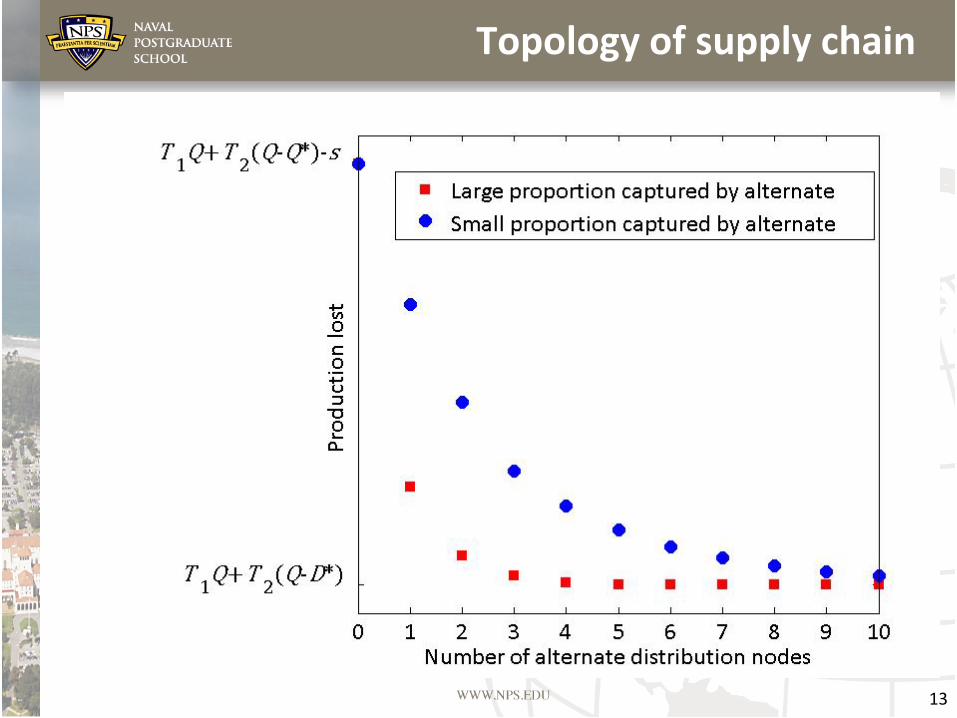
Topology of supply chain
13

Conclusions
• Model different elements in a supply chain that affect vulnerability – Traceability: length of time supply chain is closed – Communication and essentialness of product: demand
during disruption – Topology: ability of supply chain to reroute production
• Can help supply chain managers quantify benefits of different disruption management strategies – Optimal value of safety stock – Communication to keep demand high – Useful for risk management: cost and uncertainty
14 Email: [email protected]

Traceability and prior probability
15
Low-tech growers
High-tech growers