us restaurants 21 themes for 2021
TRANSCRIPT

US Restaurants21 Themes for 2021
Research Analysts
Lauren Silberman, CFA, CPA
+1 212 325 [email protected]
Douglas Eisman
+1 212 325 [email protected]
19 January 2021
Equity Research US
DISCLOSURE APPENDIX AT THE BACK OF THIS REPORT CONTAINS IMPORTANT DISCLOSURES, ANALYST CERTIFICATIONS, LEGAL ENTITY DISCLOSURE AND THE STATUS OF NON-US ANALYSTS. US Disclosure: Credit Suisse does and seeks to do business with companies covered in its research reports. As a result, investors should be aware that the Firm may have a conflict of interest that could affect the objectivity of this report. Investors should consider this report as only a single factor in making their investment decision.

2
Table of ContentsExecutive Summary
21 Themes for 20211. Restaurant Recovery Outlook2. Evolution of the Digital Ecosystem3. Loyalty/Rewards4. Restaurants of the Future5. Delivery6. Off-Premise in Casual Dining7. Ghost Kitchens8. Virtual Brands9. Drive-Thru & Drive-Up Curbside10. Franchisee Economics11. Breakfast Battle12. Chicken Wars13. Value & Innovation On the Menu14. Sustainability15. Plant-Based16. Labor17. Margin Outlook18. Portfolio Optimization19. Unit Growth20. M&A21. Brand Engagement
Company Summaries

3
Executive Summary

4
Coverage & Ratings11 Outperform, 1 Underperform, 5 Neutral
Source: Company data, FactSet, Credit Suisse estimates
Ticker Company CS RatingMarket Cap
($MM)
Current Price
1/15/21
CS Target
Price
Upside/
Downside
NTM
EV/EBITDANTM P/E CS Thesis
CMG Chipotle Outperform $39,218 $1,406 $1,700 20.9% 38.4x 64.8xHigh conviction in 10%+ top-line growth generating margin leverage with attractive flow-through. Strong SSS should support premium multiple, with opportunity for upside on better-
than-expected SSS, margin & unit growth.
PZZA Papa John's Outperform $3,102 $95 $110 16.5% 20.1x 42.1x
PZZA is shifting its narrative from turnaround to growth, noting pandemic-related tailwinds have accelerated the turnaround plan by a period of years and meaningfully improved the
financial positions of PZZA franchisees. We v iew PZZA as an underappreciated growth multi-year growth story with improved unit economics supporting a compelling development
opportunity. The increased growth outlook supports a valuation premium to history & restaurant peers.
DPZ Domino's Pizza Outperform $15,189 $375 $445 19.4% 21.8x 28.9x
DPZ is one of the best growth stories in restaurants, with high conviction in at least HSD top-line growth supporting global market share gains and among the best returns in the industry.
Third-party delivery concerns appear overblown, noting delivery is a core competency for DPZ, and we're not convinced 3Ps will be able to approach DPZ's execution, value or economics
anytime soon. US SSS outperformance & better-than-expected unit growth support upside to our base case.
DRI Darden Restaurants Outperform $16,595 $121 $141 17.5% 13.4x 23.2xBest-in-class casual dining operator, with industry-leading retention, well-capitalized balance sheet positioning it to invest & leveraging of scale to generate efficiencies support above-
average sales & margin performance. Expect outsized earnings growth in FY22 & return to HSD/LDD earnings algorithm in FY23.
TXRH Texas Roadhouse Outperform $5,682 $81 $90 11.6% 15.4x 30.6xStrong operational execution, compelling value and contribution from off-premise supports recovery trajectory, with favorable steak category dynamics & strong underlying business
supporting unit growth outlook. Market share gains support return to double-digit earnings algorithm in FY22 & premium valuation.
SBUX Starbucks Outperform $120,680 $102 $114 13.2% 22.1x 34.1x
SBUX is one of the highest quality growth companies in restaurants, with 8-10% revenue growth, margin expansion and benefit from repurchases supporting our ~16% EPS growth 3-
yr CAGR. US SSS leverage and strategic optionality (e.g., international licensing) support upside to our base case. A more focused growth strategy & enhanced capital structure support
premium valuation to history.
MCD McDonald's Outperform $157,665 $210 $230 12.0% 18.3x 25.1xWe're bullish on MCD's outlook, with traction against sales initiatives supporting upside to SSS and EPS near & long-term. Healthy global SSS, defensive characteristics, ongoing
transition to ~95% franchise-mix & increased digital focus should prov ide support to valuation.
QSRRestaurant Brands
InternationalOutperform $29,446 $63 $69 13.0% 17.8x 22.8x
We believe RBI’s focus on digital & drive-thru are the right areas of investment to drive SSS & enable broader strategies, RBI has demonstrated its ability to execute on unit growth, the
stock is trading at an absolute & relative discount in a sector trading at elevated levels, and RBI offers among the highest div idend yields in the space (3-3.5%), supporting our Outperform
rating
WEN Wendy's Neutral $4,661 $22 $25 16.9% 19.3x 30.0xWhile we like the WEN story and have been impressed with performance, we are cautious on incremental investments required for breakfast and international expansion, as well as the
impact of heightened competition in 2021. We're cautious on a meaningful acceleration in unit growth given recent challenges & lack of international infrastructure.
CAKE The Cheesecake Factory Neutral $1,803 $41 $44 6.7% 10.5x 27.1x
CAKE’s mall-based exposure remains an overhang on the stock and investor sentiment, especially amidst recent challenges accelerating changes in customer behavior and portfolio
optimization across retailers. We're cautious on the unit growth outlook given scarce site selection for Cheesecake Factory restaurants & execution risk for growth of recently acquired
concepts. At current valuation, we rate shares Neutral.
BLMN Bloomin' Brands Neutral $1,836 $21 $21 1.7% 8.1x 19.3xWe like BLMN's focus on off-premise & digital, supporting more resilient sales trends, though slower recovery of its upscale brands, international exposure and high leverage is likely to
weigh on valuation & sentiment.
YUM Yum! Brands Neutral $32,481 $107 $103 -1.6% 19.5x 26.5xSolid asset-light business with a strong unit growth outlook and diversified portfolio across brands and geographies. But greater v isibility into the return to the long-term 4% unit growth
algorithm is likely necessary to improve sentiment.
SHAK Shake Shack Neutral $3,890 $111 $102 -8.3% 57.6x
While we have confidence in the LT unit growth potential, SHAK faces outsized near-term risk from the impact of COVID-19 with its exposure to high-traffic, tourist areas, which will
weigh on margins. SHAK is diversifying its asset base with a range of new formats and additions to the existing system, positioning the company to increase its addressable market & long-
term unit potential. But at current valuation, we remain Neutral
JACK Jack in the Box Underperform $2,224 $100 $74 -24.1% 14.5x 17.5xWhile we've been impressed by JACK's performance over the last several quarters, greater conviction in the consistency of SSS and the unit growth strategy is necessary to close the
value gap to peers, increased investments are likely necessary to enhance the company's digital strategy and any signs of SSS deceleration will likely pressure shares.
US Restaurants Coverage
Ticker Company CS RatingMarket Cap
($MM)Current Price
CS Target
Price
Upside/
Downside
NTM
EV/EBITDANTM P/E CS Thesis
SYY Sysco Outperform $39,918 $76 $85 14.8% 16.3x 33.5xRecent challenges present a unique opportunity for the market share leader as customers seek suppliers they can trust will have the appropriate scale, capital and agility to meet needs in a
dynamic environment. SYY offers the best margin profile relative to peers and we expect SYY to continue to leverage its scale to achieve 5%+ EBIT margins over time.
PFGC Performance Food Group Outperform $6,711 $51 $56 9.4% 15.8x 35.7xPFGC is a compelling growth story well positioned to capture market share in a fragmented industry, with the company's lower independent restaurant mix and regional presence
supporting our confidence in the significant runway for growth on both the top & bottom lines, with sizable market share and margin opportunities supporting mid-teens EPS growth.
USFD US Foods Outperform $7,975 $36 $40 12.2% 13.4x 29.6xSales improvements among existing customers and the acquisition of new customers should support a full sales recapture over time, while an ongoing focus to increase private label mix &
effectively manage costs should contribute to operating margin expansion, supporting mid-teens EPS growth and helping to close the valuation gap to SYY.
Food Distribution

5
Restaurants Coverage Summary
Source: Company data, FactSet, Credit Suisse estimates
Current Mkt Ent. EV/EBITDA P/E Net Short
CS CS Price Cap Value 3-yr 3-yr Div. Debt/ Int. as %
Ticker Company Rating PT 1/15/21 ($BN) ($BN) Avg Avg Yield EBITDA of Float
Quick Service Restaurants
DPZ Domino's Pizza O $445 $375 $15.2 $18.5 21.8x 20.7x 28.9x 28.3x 0.8% 4.3x 3%
JACK Jack in the Box U $74 $100 $2.2 $3.5 14.5x 12.6x 17.5x 17.8x 0.4% 4.0x 10%
LOCO El Pollo Loco - - $20 $0.7 $0.8 15.9x 11.3x 24.3x 18.2x 0.0% 1.3x 12%
MCD McDonald's O $230 $210 $157.7 $190.9 18.3x 16.9x 25.1x 23.7x 2.4% 3.0x 1%
PZZA Papa John's International O $110 $95 $3.1 $3.7 20.1x 16.8x 42.1x 34.6x 1.0% 2.8x 13%
QSR Restaurant Brands International O $69 $63 $29.5 $40.4 17.8x 17.0x 22.8x 21.8x 3.3% 4.8x 2%
SBUX Starbucks Corporation O $114 $102 $120.7 $132.5 22.1x 16.9x 34.1x 26.8x 1.8% 1.8x 1%
WEN The Wendy's N $25 $22 $4.7 $7.0 19.3x 16.8x 30.0x 29.4x 1.4% 4.6x 4%
YUM Yum! Brands N $103 $107 $32.5 $42.6 19.5x 18.6x 26.5x 24.9x 1.7% 4.6x 2%
Average 18.8x 16.4x 27.9x 25.0x 3.5x
Fast Casual Restaurants
CMG Chipotle Mexican Grill O $1,700 $1,406 $39.2 $39.2 38.4x 27.0x 64.8x 50.4x 0.0% -0.8x 3%
NDLS Noodles & Company - - $9 $0.4 $0.4 15.7x 14.2x 33.5x 68.7x 0.0% 1.0x 5%
PBPB Potbelly Corporation - - $5 $0.1 $0.11 30.8x 18.8x 0.0% -1.1x 5%
SHAK Shake Shack N $102 $111 $3.9 $4.0 57.6x 29.7x 0.0% -2.4x 15%
WING Wingstop - - $145 $4.3 $4.8 53.0x 43.2x 102.1x 86.4x 0.4% 4.9x 8%
Average 41.2x 29.0x 66.8x 56.1x 0.3x
Casual Dining Restaurants
BJRI BJ's Restaurants - - $47 $1.0 $1.1 17.3x 11.0x 0.0% 0.5x 9%
BLMN Bloomin' Brands N $21 $21 $1.8 $2.9 8.1x 7.4x 19.3x 11.3x 3.8% 2.8x 16%
CAKE Cheesecake Factory N $44 $41 $1.8 $2.3 10.5x 9.3x 27.1x 0.5x 0.0% 2.2x 27%
CBRL Cracker Barrel Old Country Store - - $141 $3.3 $3.9 13.9x 11.0x 22.2x 17.9x 0.0% 1.6x 6%
CHUY Chuy's Holdings - - $33 $0.6 $0.6 12.8x 9.7x 30.9x 17.8x 0.0% -1.4x 7%
DIN Dine Brands Global - - $70 $1.1 $2.5 12.1x 11.4x 13.4x 12.1x 0.0% 5.7x 6%
DRI Darden Restaurants O $141 $121 $16.6 $16.1 13.4x 11.5x 23.2x 19.3x 1.1% 0.1x 3%
EAT Brinker International - - $59 $2.8 $3.8 9.7x 8.0x 17.3x 12.0x 0.0% 2.8x 11%
PLAY Dave & Buster's Entertainment - - $34 $1.6 $2.2 33.7x 13.7x 7.7x 0.0% 5.9x 24%
RRGB Red Robin Gourmet Burgers - - $25 $0.4 $0.6 17.0x 10.8x 17.2x 0.0% 2.8x 14%
RUTH Ruth's Hospitality Group - - $19 $0.6 $0.7 20.0x 12.7x 36.2x 22.0x 0.0% 0.9x 9%
TXRH Texas Roadhouse O $90 $81 $5.7 $5.5 15.4x 13.3x 30.6x 28.2x 0.0% -0.4x 6%
Average 15.3x 10.8x 24.5x 15.1x 1.9x
Food Distribution
SYY Sysco O $85 $76 $39.9 $47.0 16.3x 13.3x 33.5x 24.1x 2.3% 2.8x 1%
USFD US Foods O $40 $36 $8.0 $12.9 13.4x 10.2x 29.6x 17.4x 0.0% 4.4x 2%
PFGC Performance Food Group O $56 $51 $6.7 $9.0 15.8x 11.4x 35.7x 22.6x 0.0% 3.2x 2%
Average 15.2x 11.6x 32.9x 21.3x 3.4x
NTM NTM

6
Appetite for restaurantsPositive on near-term & long-term fundamentals
Near-term
Restaurant industry should benefit from reopening and increased consumer mobility, noting industry
participants have suggested the potential for heightened sales given pent-up demand for dining
Reduced competition supports unprecedented opportunity for market share gains among existing
restaurants
Improved margin outlook, as commentary from both publics & privates suggest improved margin
profiles in a post-COVID era
Long-term
Structural factors have supported food away from home stomach share gains over the last several
decades, such as an increase in women in the workforce, a shift in the generational timeline (people
are getting married, having children & buying homes later in life) and increased demand for
experiences over goods
Acceleration of digital strategies to drive value creation
– Opportunity for further market share gains as restaurants are better equipped to capture
customer data and incentivize behavior, including driving increased frequency and spend
– Opportunity to increase addressable markets with new formats
– Opportunity to improve margins through efficiency gains & productivity enhancements
7
Looking back on 2020Unprecedented challenges & actions
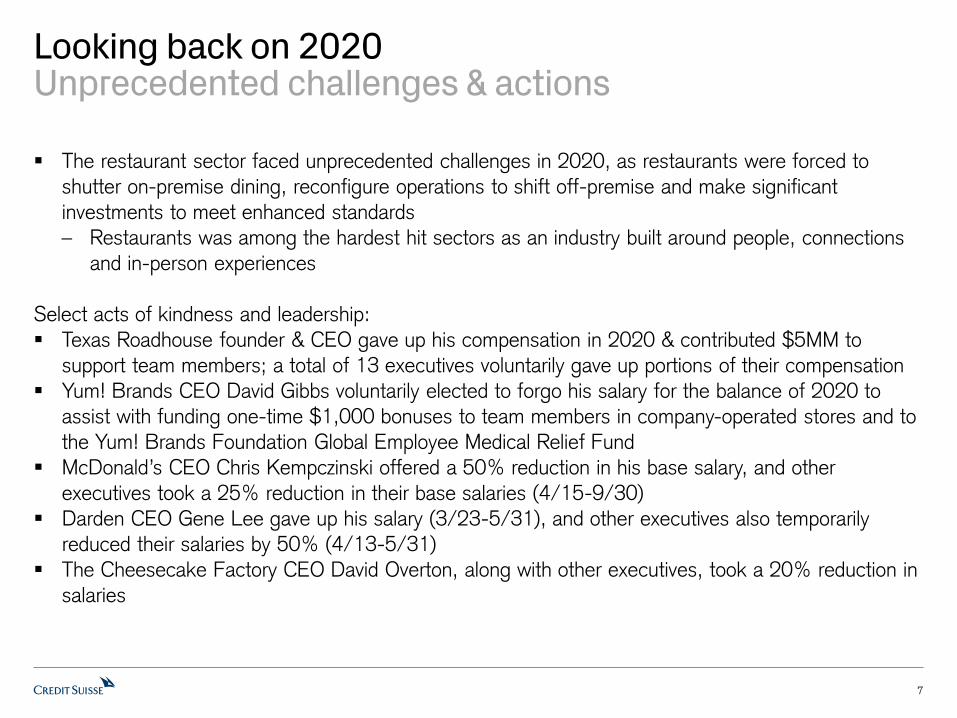
The restaurant sector faced unprecedented challenges in 2020, as restaurants were forced to
shutter on-premise dining, reconfigure operations to shift off-premise and make significant
investments to meet enhanced standards
– Restaurants was among the hardest hit sectors as an industry built around people, connections
and in-person experiences
Select acts of kindness and leadership:
Texas Roadhouse founder & CEO gave up his compensation in 2020 & contributed $5MM to
support team members; a total of 13 executives voluntarily gave up portions of their compensation
Yum! Brands CEO David Gibbs voluntarily elected to forgo his salary for the balance of 2020 to
assist with funding one-time $1,000 bonuses to team members in company-operated stores and to
the Yum! Brands Foundation Global Employee Medical Relief Fund
McDonald’s CEO Chris Kempczinski offered a 50% reduction in his base salary, and other
executives took a 25% reduction in their base salaries (4/15-9/30)
Darden CEO Gene Lee gave up his salary (3/23-5/31), and other executives also temporarily
reduced their salaries by 50% (4/13-5/31)
The Cheesecake Factory CEO David Overton, along with other executives, took a 20% reduction in
salaries

8
Looking back on 2020Unprecedented challenges & actions
Select enhanced pay & benefits: Starbucks paid employees an additional $3 per hour of service pay (end of March through May)
McDonald’s gave employees at corporate stores bonuses (May)
Yum! Brands gave its restaurant general managers at company-owned restaurants $1,000 bonuses
(end of March)
Shake Shack instituted a 10% premium pay policy (end of April through mid-August) and paid
hourly employees a holiday bonus of $250-400 (December)
Chipotle boosted hourly pay by 10% (mid-March through early June) and honored bonuses
Wendy’s offered free meals to team members, emergency paid sick leave, restaurant recognition
pay (10% increase in hourly pay in April) and protected general manager bonuses
Domino’s paid bonuses to eligible company-owned store and supply chain hourly team members
Papa John’s paid bonuses to eligible company-owned store and supply chain hourly team members
We also note franchisees across brands implemented their own assistance programs, including
premium pay and bonuses to employees
9
Looking back on 2020Unprecedented challenges & actions
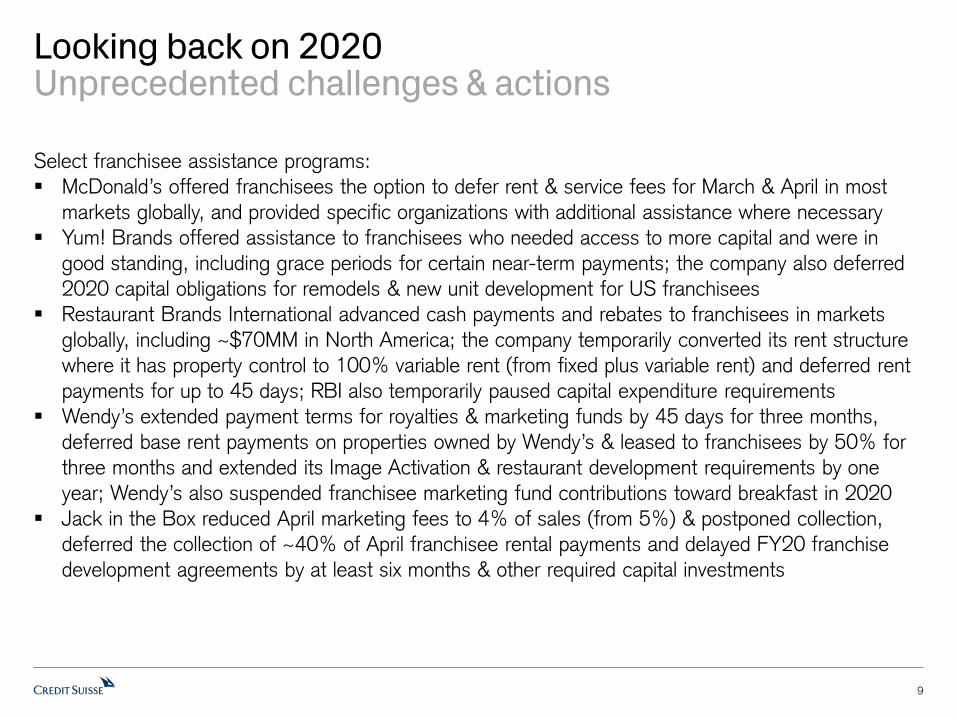
Select franchisee assistance programs:
McDonald’s offered franchisees the option to defer rent & service fees for March & April in most
markets globally, and provided specific organizations with additional assistance where necessary
Yum! Brands offered assistance to franchisees who needed access to more capital and were in
good standing, including grace periods for certain near-term payments; the company also deferred
2020 capital obligations for remodels & new unit development for US franchisees
Restaurant Brands International advanced cash payments and rebates to franchisees in markets
globally, including ~$70MM in North America; the company temporarily converted its rent structure
where it has property control to 100% variable rent (from fixed plus variable rent) and deferred rent
payments for up to 45 days; RBI also temporarily paused capital expenditure requirements
Wendy’s extended payment terms for royalties & marketing funds by 45 days for three months,
deferred base rent payments on properties owned by Wendy’s & leased to franchisees by 50% for
three months and extended its Image Activation & restaurant development requirements by one
year; Wendy’s also suspended franchisee marketing fund contributions toward breakfast in 2020
Jack in the Box reduced April marketing fees to 4% of sales (from 5%) & postponed collection,
deferred the collection of ~40% of April franchisee rental payments and delayed FY20 franchise
development agreements by at least six months & other required capital investments

10
Looking back on 2020Performance across our coverage varied
QSR/fast casual stocks outperformed the market, up 24% on average in 2020, with the global
QSR franchisors underperforming the group, while high-growth and company-owned business
models skewed to the US outperformed
– CMG was the best performing restaurant stock (+66%), followed by SHAK (+42%), DNKN
(+41%; note: DNKN was acquired by Inspire Brands), PZZA (+34.5%) and DPZ (+30.5%)
Casual dining companies underperformed in 2020, though TXRH outperformed the market and
peers (+39%)
The food distributors meaningfully underperformed, with all three stocks down for the year
Source: FactSet, Credit Suisse
-30%
-20%
-10%
0%
10%
20%
30%
40%
50%
60%
70%
QS
R
WE
N
YU
M
MC
D
JA
CK
SB
UX
DP
Z
PZ
ZA
DN
KN
SH
AK
CM
G
TX
RH
DR
I
CA
KE
BLM
N
PF
GC
SY
Y
US
FD
S&
P 5
00
QSR/Fast Casual Casual Dining Food Distribution
% R
etu
rn
11
Looking forward to 2021Tale of two halves, with uncertainty still on the menu
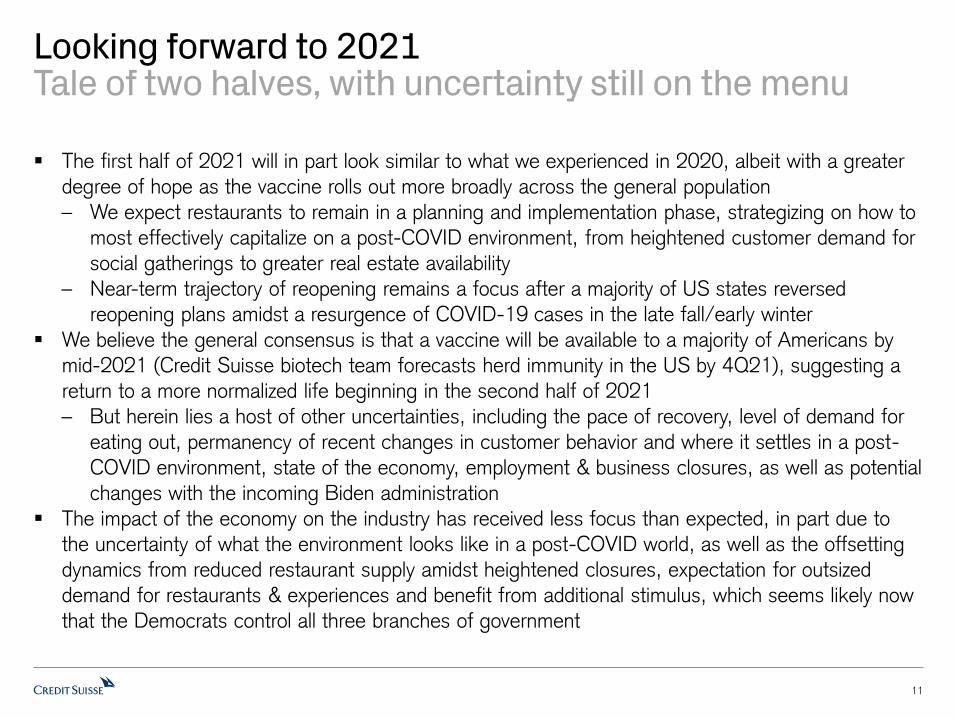
The first half of 2021 will in part look similar to what we experienced in 2020, albeit with a greater
degree of hope as the vaccine rolls out more broadly across the general population
– We expect restaurants to remain in a planning and implementation phase, strategizing on how to
most effectively capitalize on a post-COVID environment, from heightened customer demand for
social gatherings to greater real estate availability
– Near-term trajectory of reopening remains a focus after a majority of US states reversed
reopening plans amidst a resurgence of COVID-19 cases in the late fall/early winter
We believe the general consensus is that a vaccine will be available to a majority of Americans by
mid-2021 (Credit Suisse biotech team forecasts herd immunity in the US by 4Q21), suggesting a
return to a more normalized life beginning in the second half of 2021
– But herein lies a host of other uncertainties, including the pace of recovery, level of demand for
eating out, permanency of recent changes in customer behavior and where it settles in a post-
COVID environment, state of the economy, employment & business closures, as well as potential
changes with the incoming Biden administration
The impact of the economy on the industry has received less focus than expected, in part due to
the uncertainty of what the environment looks like in a post-COVID world, as well as the offsetting
dynamics from reduced restaurant supply amidst heightened closures, expectation for outsized
demand for restaurants & experiences and benefit from additional stimulus, which seems likely now
that the Democrats control all three branches of government

12
Looking forward to 2021Finding certainty in an uncertain environment
As industry participants and investors grapple with what the restaurant industry looks like in a post-
COVID world, we expect the industry to look largely similar to pre-COVID
– We do not expect any drastic, lasting changes to customer behavior or food stomach share shift
– We do expect an increased focus on digital ecosystems, personalization and enhancing
convenience – but this is more of an acceleration of trends, rather than any new trends
1) We believe relationships are best developed and enhanced in-person – technology is not yet at a
point where virtual interactions can substitute in-person experiences
2) We believe brand matters – customers are not necessarily loyal to a product, but rather loyal to a
brand; products and menu items can be commoditized over time, but experiences cannot be
replicated
– Brands like Starbucks, Chick-fil-A and Taco Bell have tribe-like followings – not necessarily
because of the food/drinks they are offering, but because they have curated experiences that
make their customers want to be part of the brand
Starbucks has consistently highlighted the importance of elevating the customer experience
by elevating its employee experience as the #1 driver of SSS
13
Looking forward to 2021Finding certainty in an uncertain environment
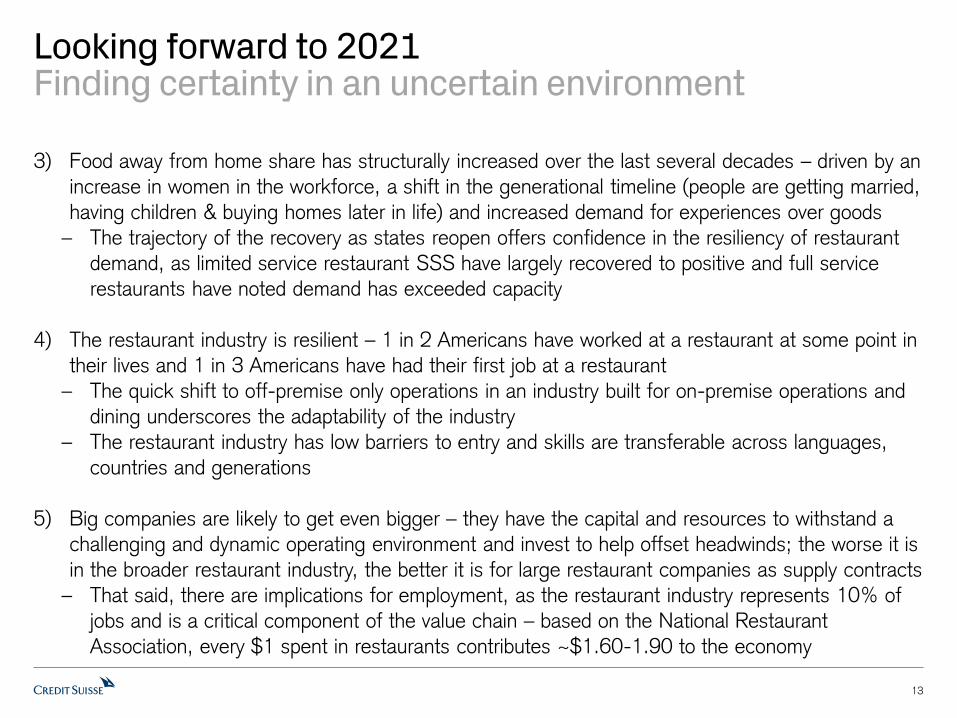
3) Food away from home share has structurally increased over the last several decades – driven by an
increase in women in the workforce, a shift in the generational timeline (people are getting married,
having children & buying homes later in life) and increased demand for experiences over goods
– The trajectory of the recovery as states reopen offers confidence in the resiliency of restaurant
demand, as limited service restaurant SSS have largely recovered to positive and full service
restaurants have noted demand has exceeded capacity
4) The restaurant industry is resilient – 1 in 2 Americans have worked at a restaurant at some point in
their lives and 1 in 3 Americans have had their first job at a restaurant
– The quick shift to off-premise only operations in an industry built for on-premise operations and
dining underscores the adaptability of the industry
– The restaurant industry has low barriers to entry and skills are transferable across languages,
countries and generations
5) Big companies are likely to get even bigger – they have the capital and resources to withstand a
challenging and dynamic operating environment and invest to help offset headwinds; the worse it is
in the broader restaurant industry, the better it is for large restaurant companies as supply contracts
– That said, there are implications for employment, as the restaurant industry represents 10% of
jobs and is a critical component of the value chain – based on the National Restaurant
Association, every $1 spent in restaurants contributes ~$1.60-1.90 to the economy

14
Looking forward to 2021Value Creation in Restaurants
We view technology as a key driver in the elements of value creation, unlocking opportunities to:
Leverage the box (increase in-store sales) – demand for convenience
– Unlock incremental sales through digital channels (mobile order & pay, delivery, loyalty, digital
drive-thru lanes, curbside pickup)
– Increase throughput & capacity
– Leverage customer data to incentivize behavior
Expand the global footprint – increase real estate site potential
– New formats increase addressable market
– Increase number of access points
Improve margins – generate leverage & cost saves
– Increased capacity/throughput to drive margin leverage (not constrained to three meals; reduce
processing time/speed of service)
– Cost savings (e.g., labor scheduling, inventory management, automate tasks)

15
Looking forward to 2021High Conviction Outperform
QSR & Fast Casual
Chipotle (CMG) - $1,700 Target Price
Leverage the box – implementing sales initiatives that resonate with consumers (digital, delivery,
menu innovation, marketing, operations)
Expand the global footprint – improving returns; expansion of new formats (Chipotlanes, digital-only)
Improve margins – SSS leverage and cost savings opportunities ($100K in AUVs = 100bps
restaurant margin)
Papa John’s (PZZA) - $110 Target Price
Leverage the box – implementing sales initiatives to maintain and grow sales (menu innovation,
marketing, operations, digital, delivery)
Expand the global footprint – improving returns following strong sales and in-store operational
enhancements; recruit well-capitalized franchisees into system (including refranchising opportunities)
Improve margins – SSS leverage, cost savings opportunities (corporate stores & supply chain) and
refranchising efforts

16
Looking forward to 2021High Conviction Outperform
Casual Dining
Darden (DRI) - $141 Target Price
Leverage the box – implementing sales initiatives that resonate with consumers (operations, menu
innovation, off-premise, value, marketing, digital)
Expand the global footprint – improving returns; opportunities in smaller markets
Improve margins – SSS leverage, productivity enhancements and cost savings opportunities
(simplification of menu, processes and procedures)
Food Distribution
Sysco (SYY) - $85 Target Price
Leverage multiple levers to drive organic case growth – improved restaurant traffic, acquisition of
new business and expansion of wallet share
Expand inorganic case growth – increased focus on M&A opportunities to supplement organic case
growth strategies, including expansion into new markets and categories (supporting growth of new
business and wallet share)
Improve margins – sales leverage and cost savings opportunities (already announced $350MM
structural cost savings in FY21, with more opportunities in FY22)

17
21 Themes for 2021
18
Restaurant Recovery Outlook

19
State of the industryAppetite for restaurants
The trajectory of the sales recovery has been better than initially feared as restaurants have proven
to be more resilient in an environment without dine-in as they have transitioned to off-premise
While a resurgence of virus cases has reversed reopening plans in many states, restaurants are
operationally better positioned than at the initial outbreak in mid-March and there appears to be
greater consumer trust in restaurants (as well as at-home fatigue)
Near-term, we believe trends are unlikely to meaningfully improve until states resume reopening
plans and weather is more favorable, though the rollout of several vaccines and expectations for
widespread availability by mid-2021 offer hope for a sustainable recovery (Credit Suisse biotech
team forecasts herd immunity in the US by 4Q21) – we expect 2022 AUVs to be above 2019
levels across our coverage
Over the near, medium and long-term, existing restaurants should benefit from a reduction in
industry supply – current forecasts suggest ~10-20% of restaurants have closed/will close
We expect the focus in 2021 will be on reemergence and how companies can capitalize on the
opportunities ahead with a reduction in industry supply and more favorable real estate environment
to accelerate market share gains
We view large chains as fundamentally better positioned than independents given their access to
resources & capital and more established off-premise & digital infrastructures, with a prolonged
reopening potentially leading to an even more favorable backdrop long-term

20
State of the industryTrajectory of recovery
Restaurant industry SSS have continued to improve across all segments since mid-March lows,
though the disparity in performance remains wide between limited service and full service restaurants
Restaurant SSS were down ~50% in April, improved to down 7-8% in September & October, though
began to reverse in November amidst more prohibitive on-premise dining restrictions and an increase
in COVID-19 cases; QSR SSS have remained strong, while full service trends decelerated exiting
2020
Source: Black Box, Bloomberg, MillerPulse, Credit Suisse
QSR SSS & Casual Dining SSS (MillerPulse)Restaurant Industry SSS (Black Box)
-90%
-80%
-70%
-60%
-50%
-40%
-30%
-20%
-10%
0%
10%
Jan-2
0
Feb-2
0
Mar-
20
Apr-
20
May-
20
Jun-2
0
Jul-2
0
Aug-2
0
Sep-2
0
Oct
-20
Nov-
20
Dec-
20
Rest
aura
nt
Indust
ry S
SS
QSR SSS Casual Dining SSS
-60%
-50%
-40%
-30%
-20%
-10%
0%
10%
Jan-2
0
Feb-2
0
Mar-
20
Apr-
20
May-
20
Jun-2
0
Jul-2
0
Aug-2
0
Sep-2
0
Oct
-20
Nov-
20
Dec-
20
Rest
aura
nt
Indust
ry S
SS
Traffic Average Check SSS

21
State of the industryTrajectory of recovery
Based on data from Technomic, US restaurant industry sales growth declined ~21% in 2020,
representing nearly ~$125BN, including ~$22BN from the limited service segment and ~$101BN
from the full service segment, or six years of restaurant sales growth (average ~4% per year)
Technomic estimates the restaurant industry will grow ~16% in 2021, gaining ~$73BN in sales,
including ~$20BN in limited service and ~$53BN in full service
Technomic estimates imply the restaurant industry will recapture ~91% of 2019 sales in 2021, with
limited service to recover ~99% of sales and full service to recover ~80-85% of sales
Source: Technomic, Credit Suisse
Restaurant Industry Sales GrowthRestaurant Industry Sales
-25%
-20%
-15%
-10%
-5%
0%
5%
10%
15%
20%
200
8
200
9
201
0
201
1
201
2
201
3
201
4
201
5
201
6
201
7
201
8
201
9
202
0
202
1
Sale
s G
row
th
$0
$100
$200
$300
$400
$500
$600
$700
200
7
200
8
2009
201
0
201
1
201
2
2013
201
4
201
5
201
6
201
7
201
8
201
9
202
0
202
1
Sale
s ($
BN
)
QSR Fast Casual Casual Dining Midscale Fine Dining

22
State of the industryTrajectory of recovery
Based on data from Technomic, limited service restaurant sales growth declined ~7.5% in 2020,
including QSR sales growth of down ~6.5% and fast casual sales growth of down 11-11.5%
Technomic estimates the limited service restaurant segment will grow ~7% in 2021, including QSR
sales growth of 6.5-7% and fast casual sales growth of 8.5-9%
Technomic estimates imply the limited service restaurant segment will generate ~$301BN of sales in
2021, recovering 99% of 2019 sales, with QSR sales to fully recover to ~$243BN and fast casual
sales to recover to ~$57.5BN, down ~3.5% from 2019 levels
Source: Technomic, Credit Suisse
2020/2021 Limited Service Restaurant Sales vs 2019 LevelsLimited Service Restaurant Sales
$303BN$281BN
$301BN
$0BN
$50BN
$100BN
$150BN
$200BN
$250BN
$300BN
$350BN
$400BN
2019 2020 2021
Sale
s ($
BN
)
QSR Fast Casual
-6.4%
-11.3%
-7.4%
-0.1%
-3.6%
-0.8%
-12%
-10%
-8%
-6%
-4%
-2%
0%
QSR Fast Casual Limited Service (Total)
2020/2
021 S
ale
s vs
2019 S
ale
s
2020 vs 2019 2021 vs 2019
Limited Service Restaurants

23
State of the industryTrajectory of recovery
Based on data from Technomic, full service restaurant sales growth declined ~37% in 2020,
including casual dining down ~32.5% and midscale/fine dining down ~48.5%
Technomic estimates the full service restaurant segment will grow ~31% in 2021, including casual
dining sales growth of 26.5% and midscale/fine dining growth of 45%
Technomic estimates imply the full service restaurant segment will generate ~$226BN of sales in
2021, recovering 80-85% of 2019 sales, with casual dining sales to recover to ~$168BN, down
~14.5% relative to 2019, and midscale/fine dining to recover to ~$58BN, down ~25% from 2019
Source: Technomic, Credit Suisse
2020/2021 Full Service Restaurant Sales vs 2019 LevelsFull Service Restaurant Sales
$275BN
$173BN
$226BN
$0BN
$50BN
$100BN
$150BN
$200BN
$250BN
$300BN
$350BN
$400BN
2019 2020 2021
Sale
s ($
BN
)
Casual Dining Midscale Fine Dining
-32.5%
-46.5%
-51.5%
-37.0%
-14.6%
-24.3%-26.6%
-17.6%
-60%
-50%
-40%
-30%
-20%
-10%
0%
Casual Dining Midscale Fine Dining Full Service (Total)
202
0/2
02
1 S
ale
s vs
201
9 S
ale
s
2020 vs 2019 2021 vs 2019
Full Service Restaurants
24
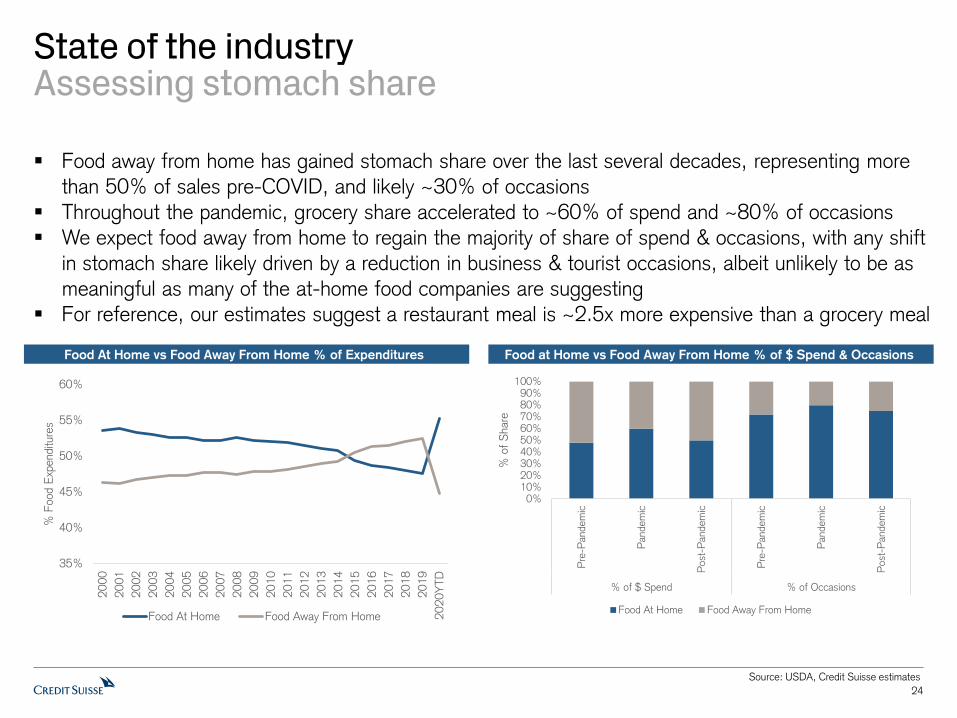
State of the industryAssessing stomach share
Food away from home has gained stomach share over the last several decades, representing more
than 50% of sales pre-COVID, and likely ~30% of occasions
Throughout the pandemic, grocery share accelerated to ~60% of spend and ~80% of occasions
We expect food away from home to regain the majority of share of spend & occasions, with any shift
in stomach share likely driven by a reduction in business & tourist occasions, albeit unlikely to be as
meaningful as many of the at-home food companies are suggesting
For reference, our estimates suggest a restaurant meal is ~2.5x more expensive than a grocery meal
Source: USDA, Credit Suisse estimates
Food at Home vs Food Away From Home % of $ Spend & OccasionsFood At Home vs Food Away From Home % of Expenditures
35%
40%
45%
50%
55%
60%
20
00
20
01
20
02
20
03
20
04
20
05
20
06
20
07
20
08
20
09
20
10
20
11
20
12
20
13
20
14
20
15
20
16
20
17
20
18
20
19
20
20Y
TD
% F
ood E
xpenditu
res
Food At Home Food Away From Home
0%10%20%30%40%50%60%70%80%90%
100%
Pre
-Pandem
ic
Pandem
ic
Post
-Pandem
ic
Pre
-Pandem
ic
Pandem
ic
Post
-Pandem
ic
% of $ Spend % of Occasions
% o
f S
hare
Food At Home Food Away From Home

25
State of the industryDimensionalizing trends
Segment: QSRs have outperformed full service restaurants given their channel mix (65-70% drive-thru historically & limited dine-in), value appeal and level of convenience
Channel: 1) dine-in: trends have been challenged given dine-in capacity restrictions; many limited service restaurants have been slow to reopen; 2) drive-thru: QSRs have benefitted with the channel
representing ~90% of sales, up from 65-70% historically, and prompting the rollout of curbside; 3)
digital: digital channels have increased in mix across all restaurants for both pickup & delivery
Daypart: Breakfast & late night have demonstrated the slowest recovery given a reduction in commuter traffic & social gatherings
Traffic/Average Check: Traffic has been down & average check has been up more significantly for QSRs as occasions shift to larger family meals; average check has been down for full service
restaurants given reduced beverage attachment associated with off-premise
Occasion: Restaurants have lost the single diner transaction at a higher rate given less commuter traffic, and a factor driving larger average checks as customers consolidate occasions and purchase
more family meals; the coffee/breakfast category has faced an outsized impact from the shift
Geography: Geography has been a differentiating factor for restaurant performance throughout the pandemic, as those with longer lockdowns and greater exposure to urban areas have experienced
more significant declines; the Northeast & California have been the weakest regions, while the
Southeast has consistently been the strongest region

26
Full service restaurants facing operational, financial & consumer challenges in new world
Full service restaurants have fared worse than limited service restaurants in an environment
requiring increased social distancing and increasing shift toward off-premise given:
1) Capacity restrictions and social distancing requirements limit throughput
2) Increasing shift toward off-premise channels, with many full service restaurants not positioned
for multi-channel business, leading to reduced throughput and potential changes in employee
pay (reduced % tipped workers)
3) Average checks/profitability impacted given a reduction in high-margin beverage/alcohol
attachment of off-premise (with off-premise to be a bigger part of the sales mix)
4) Incremental costs as restaurants invest to enhance safety protocols for team members and
customers, including personal protective equipment, increasing sanitization/cleaning, shift
toward more disposable tableware & menus
5) Increasing investments required for digital ecosystems, with expectation for acceleration in
cashless payment adoption, noting full service restaurants and independents in particular have
invested less in technology & digital ecosystems
6) To the extent restaurants closed temporarily, it takes time and resources to re-ramp and make
necessary modifications to operations and layouts

27
Finding the silver lining for casual diningAccelerated efforts to innovate
Casual dining represents 70%+ of full service restaurant sales, the largest subsegment, though still
relatively fragmented, with ~30%+ of sales operated by large chains, relative to 80%+ among
chains within limited service restaurants
While there are clearly challenges in casual dining as a result of COVID, we believe it has also been
a catalyst to drive much needed innovation given years of complacency and share loss to limited
service restaurants
– Off-premise – off-premise has been touted as a key initiative for casual dining chains in recent
years, and efforts have been accelerated to recover sales with a multi-channel approach
– Digital – digital innovation has been relatively limited, though such will likely be prioritized as
consumers accelerate digital adoption & seek out limited interaction, and restaurants are forced
to manage under heightened scrutiny & look for opportunities to capture occasions across
channels, with interaction outside of the restaurants’ four walls increasingly important
Greater off-premise mix also supports greater digital adoption (off-premise has higher mix of
digital than on-premise)
– Value-proposition – many casual dining chains skew toward middle income consumers with a
segment of consumers prioritizing value; given a challenging economic environment, value
proposition will be important

28
Fine dining faces most significant challengesHigh ticket, high alcohol, high business & travel exposure
Fine dining represents ~11% of full service restaurant sales, and the most fragmented subsegment,
with ~12% of sales operated by large chains, relative to 30%+ in midscale and casual dining
We view fine dining as most at risk from recent COVID-19 challenges given:
– High average ticket & most discretionary in restaurants – likely to face the most significant
headwinds in an economic downturn
– High alcohol mix – relative profitability of on-premise and off-premise checks more pronounced
– High business and traveler mix – there has been a significant reduction in discretionary spending
among corporates and reduction in travel (with uncertainty regarding timing of a recovery)
– Greater exposure to urban markets – fine dining restaurants tend to be concentrated in high
traffic urban regions
– Limited off-premise mix historically (if at all) – infrastructure, operations & food offerings are not
well suited for multi-channel approach
– Hospitality and experience key to value proposition – modifications to high-touch, personalized
experiences likely to weigh on relative value of occasion

29
Chains better positioned than independentsWell capitalized, trusted & established infrastructures
We believe large chains are better positioned than independents given:
– Most large chains have remained open throughout the pandemic, which has largely allowed them
to maintain their staff, and we expect them to be better positioned to ramp up operations as
traffic returns
– Greater access to resources and capital, noting large public chains enhanced their cash positions
through debt and equity raises to position them to weather the challenges
– More established off-premise infrastructures, as many large chains have made investments in
the back-of-house & front-of-house to enhance operations for off-premise and digital
transactions (e.g., to-go stations, enhanced layouts, online ordering platforms)
– More established digital ecosystems, including online ordering, investments in waitlist
management, investments in table top tablets, more favorable terms with third-party providers
– Greater negotiating power with suppliers, landlords and lenders
– Likely more explicit guidelines as chains share consistent operational procedures over a large
base of restaurants
– Greater concentration in QSR, fast casual & casual dining segments, which will fare better than
fine dining

30
Source: The National Restaurant Association, OpenTable, Independent Restaurant Coalition, Technomic, CNBC, The New York Times, Credit Suisse
COVID-19 to leave a lasting impact on the future of restaurant industry supply
Based on industry resources, commentary and estimates, we believe 10-20% of restaurants could
close permanently, including 25% of full service restaurants, as a result of headwinds from COVID-
19, though such could be even higher should the duration of social distancing guidelines, lingering
concerns of health/safety and negative economic impact be even worse
– The National Restaurant Association estimates 17% of restaurants have already closed (12/20)
– OpenTable has indicated 32% of independent full service restaurants in the US have closed, an
increase from an initial estimate of 25% (12/20)
– Technomic estimates ~11% of restaurants closed in 2020, including ~11% of full service
restaurants & ~7% of limited service restaurants (majority to come from independents) (11/20)
– The Independent Restaurant Coalition (IRC) suggested the possibility that 85% of independents
could close if not provided additional government funding (6/20)
– Founder and former Chairman & CEO of Starbucks Howard Schultz suggested 30%+ of
independents could close without additional government intervention (per CNBC 4/20)
Restaurateur David Chang communicated similar sentiment, suggesting government
intervention would be necessary and likely needed higher up the chain (real estate investors)
to help alleviate pressure, as well support for hospitality employees
Restaurateur Danny Meyer has discussed deep challenges facing the restaurant industry,
with rent and labor costs too high, employee wages too low and insufficient restaurant
margins, calling for a systemic change across the industry

31
Source: CNBC, Credit Suisse
A second wave of closuresOver the next 12-24 months
While estimates regarding the number of restaurants that will not reopen is grim, risk still exists for
the restaurants that are able to open
– Initial pent-up demand not sustainable, particularly as stimulus wears off, consumers spend
recent savings and the impact on the economy is better understood
– Ongoing uncertainty regarding the pace of recovery to prior sales levels, especially amidst
capacity constraints and a challenging economic environment
– Profitability of new transactions are lower
Off-premise – generally lower profitability than in-store given less beverage attachment,
incremental packaging costs and incremental delivery costs (if applicable)
On-premise – incremental costs associated with new safety standards (PPE including
sanitization, masks, gloves, disposable tableware & menus, etc.)
In a normal operating environment, 60% of restaurants fail within their first year and 80% of
restaurants close within five years, underscoring the challenges of the industry Pre-COVID, full service industry unit growth had been negative over the last two years amidst
significant cost pressures weighing on profitability despite a relatively strong consumer backdrop

32
Source: CNBC, Bureau of Labor Statistics, Credit Suisse
When one restaurant closes, another one opensRestaurant resiliency and low barriers to entry
The restaurant industry has low barriers to entry, with 67%+ of all restaurants independently owned
and operated (and 92% within the full service segment)
– With the rise of ghost kitchens & virtual brands, the barrier to entry and risk to entry are even
lower, with low cost, turnkey solutions available to test concepts and gauge demand
The restaurant industry is a critical component of the US economy, employing nearly 10% of the
American workforce
– 1 in 3 Americans have had their first job at a restaurant
– 1 in 2 Americans have worked at a restaurant at some point in their lives
Given the low barriers to entry and opportunity for ownership across people of all skill sets, the
restaurant industry has historically been very resilient
– Restaurant employment dropped by ~50% in April 2020, though the industry has brought back
~60% of the ~6.1MM jobs lost between February and April, recovering to down ~20% through
December 2020
That said, December marked the second sequential monthly decline in employment
While we do not expect all restaurants to survive, and industry supply consolidation should be
beneficial for the long-term health of the sector, we still expect to see new restaurants to open
going forward that will capitalize on consumer trends

33
Source: Credit Suisse estimates
Off-premise to remain at sustainably higher levelLimited service restaurants
We estimate drive-thru and digital channels now represent ~90% of QSR sales, up from 65-70%
pre-COVID and digital channels comprise ~50% of fast casual sales, up from ~20% pre-COVID
We expect drive-thru and digital sales to remain at a sustainably higher level, accelerating the shift
to off-premise that existed even pre-COVID, and noting digital channels are generally stickier given
the increased level of convenience
Drive-Thru
65-70%
Sales MixDrive-Thru
Mobile Order
Delivery Digital ~20%
Sales Mix
Digital
Pre-COVID Post-COVID Pre-COVID Post-COVID
QSR Fast Casual

34
Off-premise to remain at sustainably higher levelFull service restaurants
Off-Premise
10-15%
Dine-In
85-90%
Off-Premise
20-30%
Dine-In
70-80%
Even as restaurants have reopened dining rooms, off-premise sales have remained at elevated
levels, with off-premise sales volumes running ~1.5-3x pre-COVID levels as restaurants appear to
be maintaining ~50% of peak off-premise sales on average
We expect off-premise sales volumes to remain at a sustainably higher level going forward given
changes in customer behavior, enhanced execution and greater customer awareness
Pre-COVID Post-COVID
Casual Dining
Off-Premise Sales Maintained as Dine-in Opened
0% 20% 40% 60% 80% 100%
Texas Roadhouse (TXRH)
Outback (BLMN)
LongHorn (DRI)
Chuy's (CHUY)
Olive Garden (DRI)
Carrabba's (BLMN)
Red Robin (RRGB)
BJ's (BJRI)
Cheesecake Factory (CAKE)
% of Peak Off-Premise Sales
Source: Company data, Credit Suisse estimates

Post-COVID Return to Prior Sales Levels ($000s)
Scenario 1 Scenario 2 Scenario 3 Scenario 4
Off-Premise AWS $38.5 $28.8 $19.2 $9.6
% COVID Off-Premise 100% 75% 50% 25%
On-Premise AWS $38.5 $48.1 $57.7 $67.3
% Pre-COVID On-Premise 57% 71% 85% 99%
Post-COVID AWS Shift $29.2 $19.6 $10.0 $0.4
% of Total AWS 38.0% 25.5% 13.0% 0.5%
On-Premise Mix 50% 63% 75% 88%
Off-Premise Mix 50% 38% 25% 13%
35
Source: Company data, Credit Suisse estimates
Reduced capacity to weigh on near-term dine-in salesExpectations for gradual recovery to on-premise dining & increase in off-premise In our base case assumption, we expect full service restaurants will maintain 50% of peak
off-premise sales volumes generated when operating as off-premise only, which implies restaurants
will need to recover 85% of prior on-premise capacity to return to pre-COVID sales levels
– Implies off-premise mix increases to 25% from our assumed ~12% pre-COVID
Assuming restaurants sustainably retain 50% of off-premise sales volumes generated when operating as
off-premise only, 85% of prior on-premise capacity will need to recover to return to pre-COVID sales volumes
Assumptions
Pre-COVID ($000s)
Annualized AUV $4,000
Average Weekly Sales $76.9
On-Premise $67.7 88%
Off-Premise $9.2 12%
COVID Off-Premise Only ($000s)
Annualized AUV ($000s) $2,000
% Prior Year Sales Levels 50%
Average Weekly Sales $38.5
On-Premise $0.0 0%
Off-Premise $38.5 100%
36
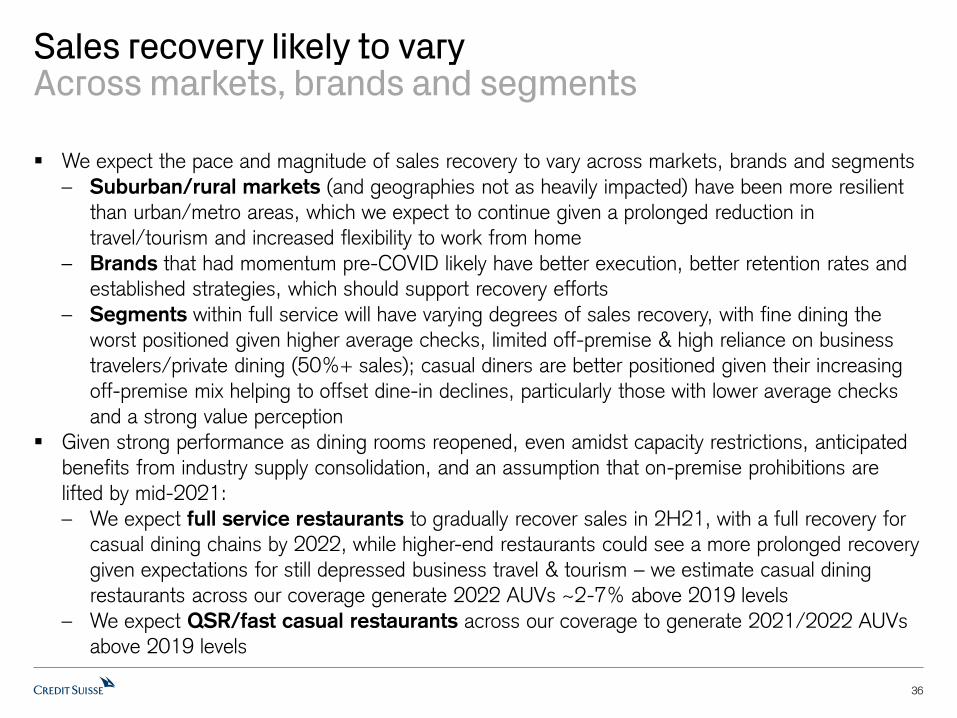
Sales recovery likely to varyAcross markets, brands and segments
We expect the pace and magnitude of sales recovery to vary across markets, brands and segments
– Suburban/rural markets (and geographies not as heavily impacted) have been more resilient than urban/metro areas, which we expect to continue given a prolonged reduction in
travel/tourism and increased flexibility to work from home
– Brands that had momentum pre-COVID likely have better execution, better retention rates and established strategies, which should support recovery efforts
– Segments within full service will have varying degrees of sales recovery, with fine dining the worst positioned given higher average checks, limited off-premise & high reliance on business
travelers/private dining (50%+ sales); casual diners are better positioned given their increasing
off-premise mix helping to offset dine-in declines, particularly those with lower average checks
and a strong value perception
Given strong performance as dining rooms reopened, even amidst capacity restrictions, anticipated
benefits from industry supply consolidation, and an assumption that on-premise prohibitions are
lifted by mid-2021:
– We expect full service restaurants to gradually recover sales in 2H21, with a full recovery for casual dining chains by 2022, while higher-end restaurants could see a more prolonged recovery
given expectations for still depressed business travel & tourism – we estimate casual dining
restaurants across our coverage generate 2022 AUVs ~2-7% above 2019 levels
– We expect QSR/fast casual restaurants across our coverage to generate 2021/2022 AUVs above 2019 levels

-30.0%
-25.0%
-20.0%
-15.0%
-10.0%
-5.0%
0.0%
5.0%
10.0%
15.0%
1Q
06
3Q
06
1Q
07
3Q
07
1Q
08
3Q
08
1Q
09
3Q
09
1Q
10
3Q
10
1Q
11
3Q
11
1Q
12
3Q
12
SS
S
Casual Dining Steakhouse (Casual Dining) Fine Dining
37
Source: Company data, Credit Suisse estimates
Dining during economic downturnsEconomic challenges likely to weigh on recovery
Full service restaurant sales are more of a consumer discretionary occasion, weighing on sales
trends during economic downturns – in 2008/2009, SSS across public full service restaurant
chains were negative for nine consecutive quarters, averaging down ~4% across 2.5 years and
down ~7% at the height of the recession from 4Q08-3Q09
– Higher-end full service restaurants performed even worse, while more value-oriented players,
family dining and bar & grill concepts appeared to be more resilient
Public Full Service Restaurant Industry SSSPublic Restaurant Industry SSS
-10.0%
-8.0%
-6.0%
-4.0%
-2.0%
0.0%
2.0%
4.0%
6.0%
8.0%
1Q
06
3Q
06
1Q
07
3Q
07
1Q
08
3Q
08
1Q
09
3Q
09
1Q
10
3Q
10
1Q
11
3Q
11
1Q
12
3Q
12
SS
S
FSR SSS LSR SSS
38
Source: Technomic, Credit Suisse estimates
Post-COVID OutlookBase Case Assumption
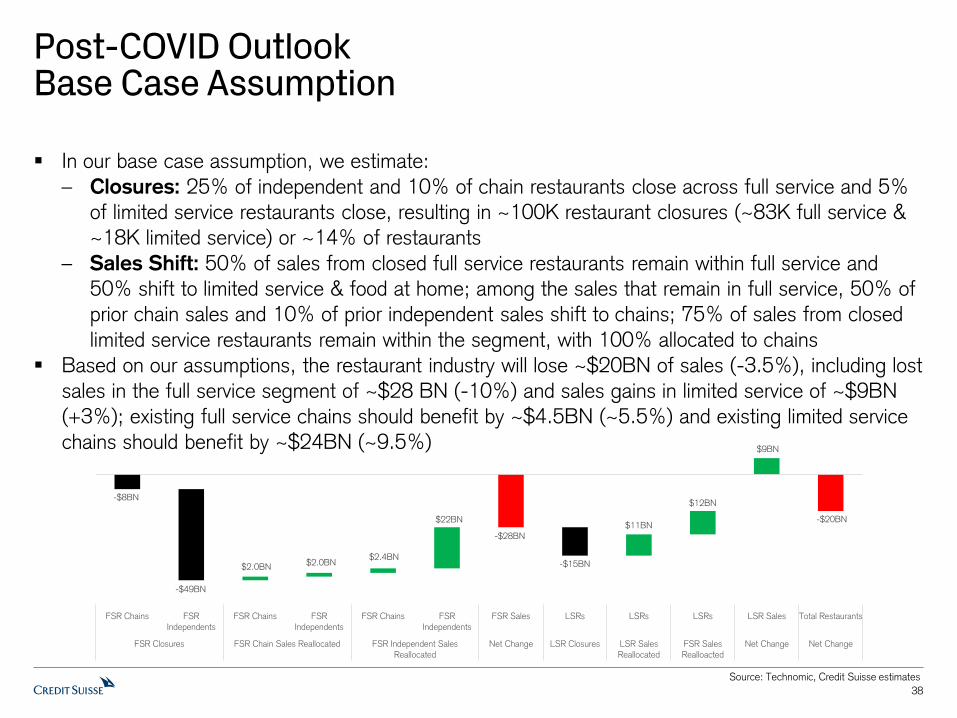
In our base case assumption, we estimate:
– Closures: 25% of independent and 10% of chain restaurants close across full service and 5% of limited service restaurants close, resulting in ~100K restaurant closures (~83K full service &
~18K limited service) or ~14% of restaurants
– Sales Shift: 50% of sales from closed full service restaurants remain within full service and 50% shift to limited service & food at home; among the sales that remain in full service, 50% of
prior chain sales and 10% of prior independent sales shift to chains; 75% of sales from closed
limited service restaurants remain within the segment, with 100% allocated to chains
Based on our assumptions, the restaurant industry will lose ~$20BN of sales (-3.5%), including lost
sales in the full service segment of ~$28 BN (-10%) and sales gains in limited service of ~$9BN
(+3%); existing full service chains should benefit by ~$4.5BN (~5.5%) and existing limited service
chains should benefit by ~$24BN (~9.5%)
-$8BN
$2.0BN$2.0BN
$2.4BN
$22BN
-$28BN
$9BN
-$20BN
-$49BN
-$15BN
$11BN
$12BN
FSR Chains FSR
Independents
FSR Chains FSR
Independents
FSR Chains FSR
Independents
FSR Sales LSRs LSRs LSRs LSR Sales Total Restaurants
FSR Closures FSR Chain Sales Reallocated FSR Independent Sales
Reallocated
Net Change LSR Closures LSR Sales
Reallocated
FSR Sales
Realloacted
Net Change Net Change

39
Post-COVID OutlookBlue Sky Scenario
In our blue sky scenario, we estimate:
– Closures: 15% of independent & 5% of chain restaurants close across full service and 5% of limited service restaurants close, resulting in ~67K restaurant closures (~50K full service &
~18K limited service) or ~10% of restaurants
– Sales Shift: 75% of sales from closed restaurants remain within the full service segment and 25% shift to limited service & food at home; among the sales that remain in the segment, 50%
of prior chain sales and 10% of prior independent sales shift to chains; 75% of sales from
closed limited service restaurants remain within the segment, with 100% allocated to chains
Based on our assumptions, the restaurant industry will lose ~$8BN of sales (-1.5%), including lost
sales in the full service segment of ~$8.3BN (-3%); existing full service chains should benefit by
~$3.7BN (~4.5%) and existing limited service chains should benefit by ~$15BN (~6%)
Source: Technomic, Credit Suisse estimates
-$4BN
-$29BN
$1.5BN$1.5BN
$2.2BN
$20BN
-$8BN
-$15BN
$11BN$4BN
-$0.1BN
-$8BN
FSR Chains FSR
Independents
FSR Chains FSR
Independents
FSR Chains FSR
Independents
FSR Sales LSRs LSRs LSRs LSR Sales Total Restaurants
FSR Closures FSR Chain Sales Reallocated FSR Independent Sales
Reallocated
Net Change LSR Closures LSR Sales
Reallocated
FSR Sales
Realloacted
Net Change Net Change

40
Post-COVID OutlookGrey Sky Scenario
In our grey sky scenario, we estimate:
– Closures: 35% of independent & 10% of chain restaurants close across full service and 25% of independent & 5% of chain restaurants across limited service, resulting in ~164K restaurant
closures (~115K full service & ~48K limited service) or ~23% of restaurants
– Sales Shift: 50% of sales from closed restaurants remain within the full service segment and 50% shift to limited service & food at home; among the sales that remain in the segment, 50%
of prior chain sales and 10% of prior independent sales shift to chains; 75% of sales from
closed limited service restaurants remain within the segment, with 100% allocated to chains
Based on our assumptions, the restaurant industry will lose ~$28BN of sales (-5%), including lost
sales in full service of ~$38BN (-14%) and sales gains in limited service of ~$10BN (+3.5%);
existing full service chains should benefit by ~$5.4BN (~7%) and existing limited service chains
should benefit by ~$35BN (~14%)
Source: Technomic, Credit Suisse estimates
-$8BN
-$38BN
-$28BN
-$68BN
$2.0BN $2.0BN $3.4BN
$31BN
-$26BN
$19BN
$17BN
$10BN
FSR Chains FSR
Independents
FSR Chains FSR
Independents
FSR Chains FSR
Independents
FSR Sales LSRs LSRs LSRs LSR Sales Total Restaurants
FSR Closures FSR Chain Sales Reallocated FSR Independent Sales
Reallocated
Net Change LSR Closures LSR Sales
Reallocated
FSR Sales
Realloacted
Net Change Net Change
41
Evolution of the Digital Ecosystem

42
Enhancing the digital ecosystemIntegrating technology across all facets of organization
While restaurants have increasingly invested in technological ecosystems, we believe there will be
an acceleration in the implementation of technology across all facets of the organization and the
end-to-end customer experience as restaurants seek to:
Leverage the box (increase in-store sales)
– Unlock incremental sales through digital channels (mobile order & pay, delivery, loyalty, digital
drive-thru lanes, curbside pickup)
– Increase throughput & capacity
– Leverage customer data to incentivize behavior
Expand the global footprint
– New formats increase addressable market
– Increase number of access points
Improve margins
– Increased capacity/throughput to drive margin leverage (not constrained to three meals; reduce
processing time/speed of service)
– Cost savings (e.g., labor scheduling, inventory management, automate tasks)
The second derivative of digitalFrom implementation to integration & execution
Companies across all restaurant segments have increased investments to expand digital
ecosystems, though efforts have largely been concentrated on customer facing initiatives (e.g.,
mobile order & pay and delivery), with less regard to execution or long-term implications
– Primary focus has been unlocking opportunities to leverage the box (increase in-store sales)
largely by enhancing apps to add mobile order & pay capabilities and partnering with third-party
delivery platforms
More recently, we have seen companies establishing holistic infrastructures and strategies that
permeate throughout the organization as the restaurant and technology worlds learn to coexist –
challenging given a historically antiquated industry with low profit margins
Going forward, we expect the focus will shift to what we view as the second derivative of digital
– integrating technology to unlock value across all facets of the business including: 1) customer
facing initiatives to strategically increase digital utilization, capture customer data and secure more
loyalty, and 2) back of house opportunities to enhance margins amidst increasing cost pressures
43

Leverage the box (increase in-store sales)Increase digital utilization
Digital utilization (mobile order & delivery) remains relatively limited across the industry (<10% of
sales), though companies are seeking greater digital adoption given benefits of customer data, a
stickier digital customer, higher average checks, higher frequency and more profitable orders
– While the majority of digital growth has been delivery more recently, we expect a greater focus
on pushing in-store digital adoption (primarily mobile order & pay), as digital pickup orders are
the most profitable transactions (reduces transaction time, less labor required, less wear & tear),
and companies capture valuable customer data
Increase awareness
Separate sections/signage for digital transactions, social media posts & limited time campaigns to
encourage digital downloads
Loyalty/rewards programs
Addition of loyalty/rewards programs as an incentive to accelerate mobile order adoption, noting
companies with the highest mobile order utilization have strong rewards platforms, offering
opportunities to capture data to incentivize behavior and increase customer loyalty
44

Leverage the box (increase in-store sales)Execution over implementation
Now that restaurants have added customer facing capabilities (digital app, mobile order & pay,
delivery), we believe the focus shifts to optimize digital channels within restaurants to enhance the
in-store and digital customer experience
Modify store layouts
Add separate sections dedicated to digital and out-of-restaurant orders to reduce friction
Employee operations
Assign employees dedicated to digital orders (especially during peak hours)
Invest in technology to provide tools for best execution (upgrade POS systems, digital scanners,
digitized labels, etc.)
Packaging & menu development
Invest in packaging better suited for longer travel times/more transportable & multiple handlers
Modify and reduce menu size availability for specific channels to limit complexity and optimize the
out-of-restaurant experience
45
Leverage the box (increase in-store sales)Integration of digital channels
We expect restaurants will look to upgrade digital assets for more seamless integration across all
digital channels
Integrate third-party delivery within broader ecosystems
Mitigate the “multiple-tablet” problem in what appears to be a non-exclusive world of delivery with
multiple partnerships, which should help improve accuracy and limit lost orders
Integrate delivery within apps
Limit the customer shift to third-party aggregators
Get access to customer data from delivery channels
Introduce and integrate AI
Leverage decision logic technology to learn about customers, gather data and use data to
incentivize behavior
46

47
Leverage the box (increase in-store sales)Contactless order & pay
We expect restaurants will look for opportunities to implement contactless end-to-end processes,
including digital menus, ordering solutions and payment solutions, to limit interaction and ease
transaction friction
Full service restaurants generally point to payment as a key point of friction, with digital payment
solutions an opportunity to enhance the end-to-end experience
Menus
QR codes to be scanned on tables for customers to access menus on phones
In-restaurant tablets with digitized menus
Ordering solutions
In-restaurant tablets and digital apps with features to access menus and order in-restaurant or
mobile order ahead (including opportunities for upsell and add-on)
Payment solutions
In-restaurant tablets and digital apps with features to pay at table and with order ahead
Digital order notifications
Implementation of web/app messaging and notification systems to allow guests to inform
restaurants when they arrive, and restaurants can inform guests when orders are ready for pickup

48
Leverage the box (increase in-store sales)Modify operations for off-premise mix shift
We expect off-premise sales volumes will remain elevated as execution improves, marketing around
off-premise increases and customer awareness of off-premise has grown
Restaurant layouts
Add separate sections in restaurant and kitchens dedicated to off-premise orders to reduce friction
– Reduce distance food travels from kitchen to customer to enhance wait & service times
Add separate drive-thru lanes & parking spots to facilitate off-premise operations & the multi-
channel experience
Employee operations
Assign employees dedicated to off-premise orders (especially during peak hours)
Invest in technology to provide tools for best execution (upgrade POS systems, digital scanners,
digitized labels, etc.)
Packaging and menu development
Invest in packaging better suited for longer travel times/more transportable and multiple handlers
Modify & reduce menu availability for specific channels to limit complexity & optimize the experience
Enhanced features/channel availability
Expand available channels to include mobile/web order & pay, curbside pickup, third-party delivery

49
Leverage the box (increase in-store sales)Enhance procedures to ease concerns & attract dine-in
We expect customers will be less willing to wait for tables in large crowds (and degree of use of
communal bars is uncertain), and assume they will also seek out restaurants they trust are enforcing
enhanced safety procedures for employees and customers
Reservations and table management notifications
Implementation of web/app reservation and notification systems to inform guests of table availability
and when they are ready (can also integrate access to menus, order & payment solutions, etc., for
end-to-end contactless experiences)
Contactless order & pay
Access to menus and expanded availability of contactless order & pay with in-restaurant tablets and
phones (scan QR code, use near-field communication (NPC), go to a URL, download/use app) to
limit person-to-person contact and shared surfaces (e.g., menus)
Enhanced safety procedures
Increased sanitization (cleaning products, masks, gloves, sanitary wipes), temperature checks,
employee questionnaires/certifications, disposable menus/tableware

50
Leverage the box (increase in-store sales)Build relationships outside of restaurants’ four walls
As restaurants increasingly invest in digital platforms and technology infrastructures, we expect
them to better leverage CRM tools and look to establish loyalty, engage with customers to increase
frequency and encourage the use of multiple channels (especially if more of the at-the-table
transaction occurs digitally)
Customer relationship management (CRM)
Enhance personalization through implementation of guest engagement platform, including direct
booking capabilities, personalized guest profiles, targeted promotions, etc.
Loyalty/rewards programs
Addition of loyalty/rewards programs as an incentive to accelerate digital adoption, with greater
utilization supporting more opportunities to capture customer data to be used for personalization &
segmentation to incentivize behavior & increase customer loyalty
Guest engagement platforms and loyalty programs could be even more powerful for companies with
multiple concepts and locations as restaurants seek to capture different customer occasions and
increase frequency/loyalty through personalization
Expand the global footprintNew and enhanced formats
We expect restaurants will design new formats to mitigate friction of multiple channels, encourage
higher digital utilization and take advantage of the increasing shift to off-premise channels
Digital-forward restaurants
Likely smaller stores in dense locations, with limited seating and primarily focused on off-premise
and leveraging digital channels
Delivery/carryout focused restaurants
Limited menus, smaller formats, reduced seating
Enhancements through remodels
Add elements to encourage greater digital utilization (e.g., kiosks, in-store pickup shelves, pickup
windows, mobile-only drive-thrus)
Modify back of house to limit friction, including considerations of secondary production lines and
split kitchens (if possible)
51

Expand the global footprintVirtual, host and ghost kitchens
We expect more restaurants will explore opportunities to increase in-store capacity, particularly if
there are reduced capacity requirements near-term, or explore the potential for turnkey solutions to
test new markets (particularly if the off-premise mix is expected to be high)
Virtual Kitchens/Brands
Offer opportunity to increase in-restaurant capacity as existing restaurant launches separate virtual
brand available only on third-party platforms, likely during off-peak times (potentially expand into
additional dayparts)
Host Kitchens
Offer opportunity to increase in-restaurant capacity as existing restaurant provides kitchen to be
used by external operator (available on third-party platforms) during off-peak times as an alternative
to ghost kitchen for external operator
Ghost Kitchens
Offer opportunity to increase the number of access points, enter new markets and mitigate
disruption from operating multiple channels (mobile order, delivery, catering) within restaurants
52

Improve marginsBack of house opportunities
We expect a much greater focus on unlocking back of house opportunities by integrating technology
to optimize operations and realize cost savings, moving beyond customer facing initiatives to reduce
non-value add tasks, simplify roles, reallocate resources and better leverage data across the system
Optimize resources & reduce administrative tasks
Implement labor deployment software, automated scheduling, inventory management tools, digitized
invoices, track food waste, predictive analytics
Equipment
Digitize elements of the transaction (e.g., labels, upgrade digital assets, third-party delivery
integration)
Decision logic technology
If kitchen slower, can suggest menu items that won’t compound the problem
53

Improve marginsVoice technology
We view voice as the next wave of technology, with customer facing applicability already in the
marketplace and capabilities being implemented for back of house operations, helping to offset
increasing workforce challenges and regulatory pressures unlikely to subside
Voice order taking
Implement voice technology at the drive-thru
– McDonald’s is already in test following its acquisition of AI platform, Apprente, with deployment a
key milestone in the future of voice – 1) train customers on mainstream applicability and 2)
accelerate advancements for other companies to follow
Implement technology to accept voice orders over the phone
Voice inventory management
Eliminate some of the manual work required by writing and keying in inventory checks
54

55
Improve marginsIntegrate technology to increase productivity
We expect a much greater focus on unlocking productivity opportunities by integrating technology
to optimize operations and realization of cost savings to reduce non-value add tasks, simplify roles,
reallocate resources and better leverage data across the system
Digital contactless order & pay capabilities
Digital contactless order & pay capabilities to reduce staff resources & potentially increase table turns
Optimize resources and reduce administrative tasks
Implement labor deployment software, automated scheduling, inventory management tools, digitized
invoices, track food waste, predictive analytics
Equipment
Digitize elements of transaction (e.g., labels, upgrade digital assets, third-party delivery integration)
Leverage equipment/robots to eliminate/reduce manual tasks
Decision logic technology
Predictive analytics (e.g., if kitchen slower, suggest menu items that won’t compound the problem)
Voice technology
Implement technology to accept phone voice orders & eliminate manual tasks (e.g., inventory)

Technology comes at a costCorporate Level
Technology is a perpetual cost restaurants must incur to maintain their digital ecosystems
– As customer expectations evolve and the industry faces increasing pressures, investing in
technology is critical to enhance four wall economics through top-line leverage and cost savings
Select companies are making big investments in outside firms as they seek to gain a competitive
advantage against peers (accelerate digital innovation, access to talent, etc.)
56
February 2018: $200MM in Grubhub
July 2018: Acquires license for CardFree to accelerate digital development
December 2018: Acquires QuikOrder for $77MM
February 2019: $25MM digital investment, including $15MM for Accenture partnership
March 2019: $100MM investment in Venture Fund that invests in food & retail startups
March 2019: $300MM to acquire Dynamic Yield startup & $5MM investment in Plexure
September 2019: Acquires Apprente voice tech startup; launches McD Tech Labs
March 2020: Acquires Heartstyles, a leadership development program

Technology comes at a costRestaurant Level
Infrastructure, Equipment & Software – Back of house/front of house technology and equipment, maintenance fees, support, etc. (annual & one time fees)
Technology/Digital Transaction Fees – Franchisees generally pay fees on every digital order
Credit Card Processing Fees – Digital orders generally transacted with credit/debit cards
Mobile offers and loyalty programs – Many restaurant companies offer mobile/online-specific deals to encourage utilization and loyalty programs, with restaurants incurring the cost of discounts
Delivery Fees – Incremental costs: 1) commission and delivery costs for third-party delivery (average ~15-30% of average ticket); 2) proprietary delivery infrastructure (if applicable)
Customer Level Delivery Fees – Customers pay higher prices for delivery through 1) delivery fees, 2) service fees
and 3) inflated menu prices
– Near-term, we expect customers will bear a disproportionate amount of the costs as: 1) third-
party aggregators are fighting for share and seem to be more willing to negotiate with
restaurants to accept lower rates, while shifting costs to customers through delivery & service
fees; 2) increased regulations on third-party fees in many jurisdictions limit what aggregators can
charge restaurants (for now, temporary); and 3) restaurants have flexibility in pricing menus on
third-party platforms, with most charging higher delivery menu prices relative to in-store
57

58
Inflection in digital trends and accelerating adoptionExpect increased investments and focus going forward
Customer facing technology is largely unsophisticated across full service, lagging behind upgrades
made by QSR & fast casual peers which have accelerated investments in technology in recent years
Going forward, we expect an increase in digital adoption and utilization for both off-premise and
on-premise transactions, driven by customer demand and changing restaurant operations
Sustainably higher off-premise sales mix to support increased digital utilization: – Greater awareness of digital ordering, with recent advertising focused on digital off-premise
availability
– Digital customers tend to be stickier (and do not revert back to less convenient phone/walk-in
ordering) and restaurants have captured more customer information they can use going forward
Expect increased digital adoption for on-premise: – Increased customer adoption for off-premise along maturity curve across the industry should
support an easier transition to on-premise dining
– Increased willingness from restaurants to explore and invest in technology given acceleration in
digital adoption across cohorts, supporting a better ROI
– Increased desire & acceptance of technology solutions among customers and employees to limit
interaction where possible
– Opportunities to leverage technology to generate cost efficiencies, especially given significant
margin pressures in recent years and uncertainty in the sales outlook
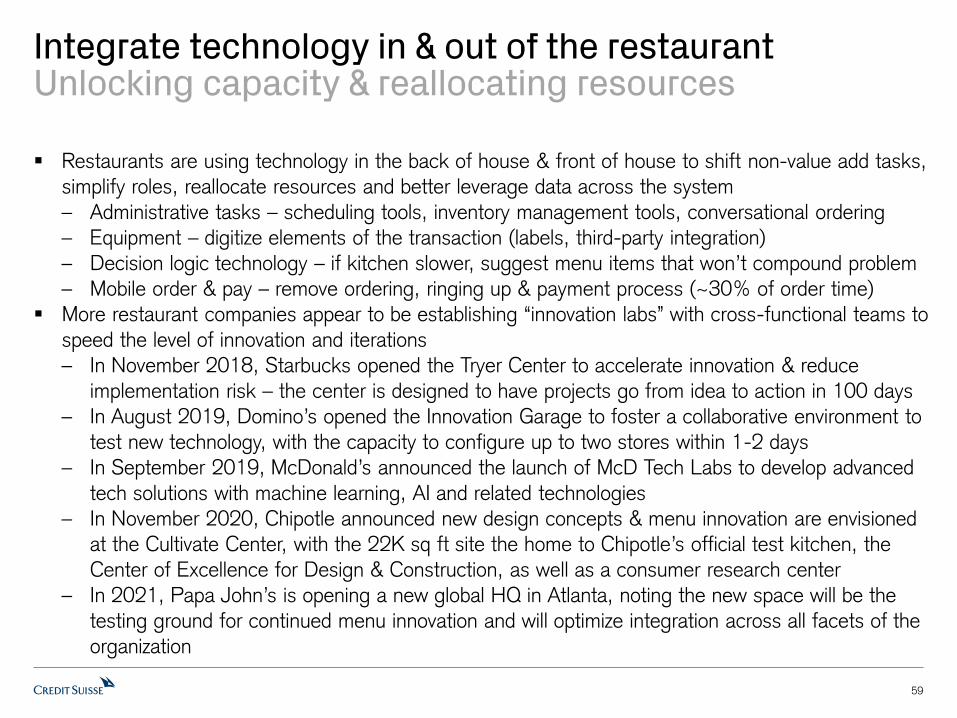
59
Integrate technology in & out of the restaurantUnlocking capacity & reallocating resources
Restaurants are using technology in the back of house & front of house to shift non-value add tasks,
simplify roles, reallocate resources and better leverage data across the system
– Administrative tasks – scheduling tools, inventory management tools, conversational ordering
– Equipment – digitize elements of the transaction (labels, third-party integration)
– Decision logic technology – if kitchen slower, suggest menu items that won’t compound problem
– Mobile order & pay – remove ordering, ringing up & payment process (~30% of order time)
More restaurant companies appear to be establishing “innovation labs” with cross-functional teams to
speed the level of innovation and iterations
– In November 2018, Starbucks opened the Tryer Center to accelerate innovation & reduce
implementation risk – the center is designed to have projects go from idea to action in 100 days
– In August 2019, Domino’s opened the Innovation Garage to foster a collaborative environment to
test new technology, with the capacity to configure up to two stores within 1-2 days
– In September 2019, McDonald’s announced the launch of McD Tech Labs to develop advanced
tech solutions with machine learning, AI and related technologies
– In November 2020, Chipotle announced new design concepts & menu innovation are envisioned
at the Cultivate Center, with the 22K sq ft site the home to Chipotle’s official test kitchen, the
Center of Excellence for Design & Construction, as well as a consumer research center
– In 2021, Papa John’s is opening a new global HQ in Atlanta, noting the new space will be the
testing ground for continued menu innovation and will optimize integration across all facets of the
organization

60
Loyalty/Rewards

61
Loyalty & rewards programs to enhance digital ecosystems
We view loyalty programs as an unlock to encourage greater digital utilization – attracting customers
to the digital ecosystem, with digital customers that tend to have greater frequency & higher spend,
and allowing restaurants to better manage operations and unlock throughput
– As more companies launch loyalty programs, it raises the bar for what customers expect
restaurants to offer – we have seen this with mobile ordering & delivery so far, with loyalty
seemingly the next digital initiative
Restaurants are looking to shift more orders to digital channels as digital orders: 1) have higher
average checks; 2) tend to be more profitable (lower in-store impact, eliminates ordering &
processing time); 3) can unlock capacity constraints and reduce/reallocate labor; and 4) collect data
on customers which can be utilized to inform decisions and incentivize behavior
– As mobile order & pay usage remains pretty low, and delivery is currently only available through
third-party platforms, restaurants need to find a way to get customers to use their proprietary
platforms to collect data, which is a key benefit of a loyalty program

62
The value of loyaltyIn a disloyal segment
Reviews on loyalty appear to be mixed across the restaurant space, with a few companies that have
leveraged loyalty programs as a foundation for the business (Starbucks, Domino’s), while others
have been more skeptical regarding incrementality with fear of sales dilution
Debates on the value of a loyalty program exist for both high frequency & low frequency occasions
– More bullish advocates indicate an opportunity to increase frequency & capture share
irrespective of frequency
We estimate Starbucks has the highest customer frequency of any large restaurant chain,
and its 10+ year loyalty program has driven the majority of US SSS in recent years
Domino’s has relatively limited frequency, with the average customer ordering 5-6x per year,
though the loyalty program has been a significant driver of growth since launching in 2015
– Bears note loyalty could dilute an existing occasion or increase sales without driving profitability
Tim Hortons launched its loyalty program in early 2019, which was dilutive to SSS before
modifications were made in 2020
Darden has suggested limited benefit from its loyalty program test, which has since been
canceled, though the company noted data from loyalty was richer than other channels
Our take: a loyalty program is only as powerful as the infrastructure supporting it, noting a loyalty program is a tool to capture and leverage customer data to incentivize behavior – and that can work
with both frequent and infrequent transactions if done effectively

63
What makes a successful loyalty program?Customer View
Simple – easy to join and easy to understand
– Domino’s has one of the simplest loyalty programs – buy 6 pizzas and get 1 pizza free – the program was designed to be simple, easy to understand and easy to join; the brand also has
among the largest and most successful digital platforms in restaurants
Awareness – prominently featured, effective marketing and train employees
– Feature rewards programs on websites & apps, run campaigns to encourage sign-up and
effectively train team members on the construct & value of the programs
Digital – encourage increased digital utilization
– Digital customers are stickier and digital transactions often receive the highest customer
satisfaction, likely because they provide a more seamless experience
– Restaurants with the most successful loyalty programs often have the highest digital utilization –
Starbucks, Domino’s, Panera, Chipotle
Exclusivity – offer exclusive rewards to the most loyal customers
– Chipotle launched Guac Mode in early 2020, offering customers that joined the loyalty program by 2/20 extra rewards in 2020; Chipotle also gives loyalty members early access to new product
launches, such as Carne Asada in September, as well as its Chipotle Goods merchandise lines
– Papa John’s has started to offer Papa Rewards members early access to new products, including the Double Cheeseburger Pizza in October & new Epic Stuffed Crust in December
– Dunkin’ offers DD Perks members early access to its limited-edition merchandise drops, which often sell out quickly

64
What makes a successful loyalty program?Restaurant View
The existence of a loyalty program alone is not sufficient to be an effective multi-year, profitable
growth driver – the value is in the ability to capture customer data to use for personalization and segmentation to incentivize behavior – as part of a larger omni-channel strategy
Loyalty programs also serve as promotions/discount tools, making it critical for companies to have
well established infrastructures to understand the impact of the program on sales & profitability –
driving traffic at the expense of average ticket is not what we would view as an effective program
Types of Loyalty Programs
Frequency-based – reward customers based on transactions (example: Domino’s)
Spend-based – reward customers based on $ spend (examples: Starbucks, Chipotle, Wendy’s)
Surprise & Delight – reward customers spontaneously (example: Panera)
Source: Domino’s app, Starbucks website, Company data, Credit Suisse estimates
Starbucks Domino’s
Spend-Based Rewards Program Frequency-Based Rewards Program
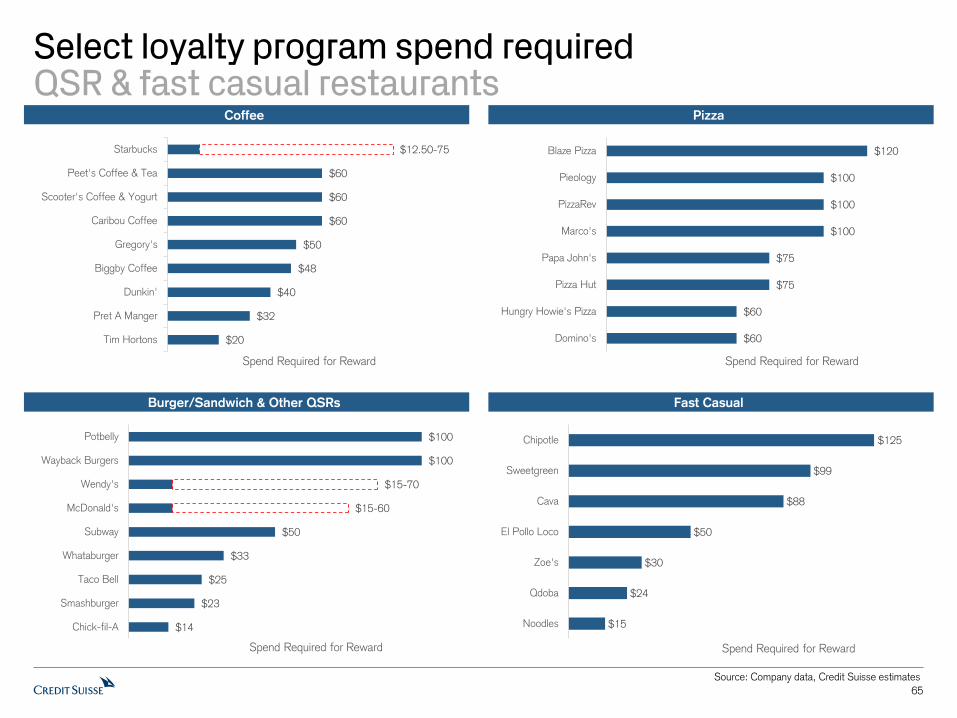
65
Source: Company data, Credit Suisse estimates
Select loyalty program spend requiredQSR & fast casual restaurants
Pizza
Fast Casual
Coffee
Burger/Sandwich & Other QSRs
$60
$60
$75
$75
$100
$100
$100
$120
Domino's
Hungry Howie's Pizza
Pizza Hut
Papa John's
Marco's
PizzaRev
Pieology
Blaze Pizza
Spend Required for Reward
$14
$23
$25
$33
$50
$15-60
$15-70
$100
$100
Chick-fil-A
Smashburger
Taco Bell
Whataburger
Subway
McDonald's
Wendy's
Wayback Burgers
Potbelly
Spend Required for Reward
$15
$24
$30
$50
$88
$99
$125
Noodles
Qdoba
Zoe's
El Pollo Loco
Cava
Sweetgreen
Chipotle
Spend Required for Reward
$20
$32
$40
$48
$50
$60
$60
$60
$12.50-75
Tim Hortons
Pret A Manger
Dunkin'
Biggby Coffee
Gregory's
Caribou Coffee
Scooter's Coffee & Yogurt
Peet's Coffee & Tea
Starbucks
Spend Required for Reward
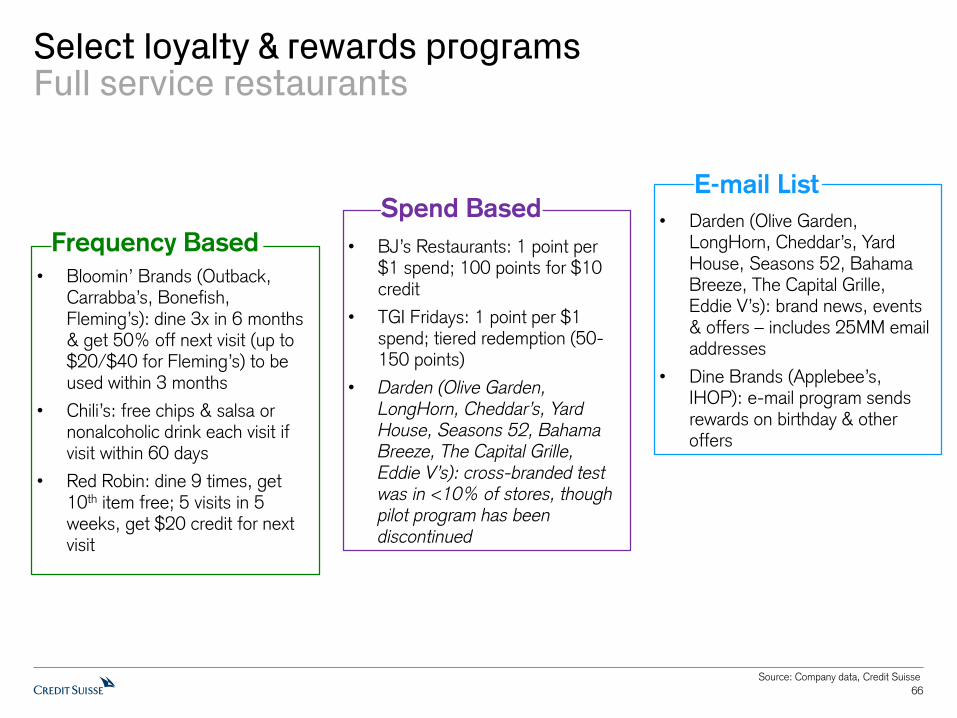
66
Source: Company data, Credit Suisse
Select loyalty & rewards programsFull service restaurants
• Darden (Olive Garden, LongHorn, Cheddar’s, Yard House, Seasons 52, Bahama Breeze, The Capital Grille, Eddie V’s): brand news, events & offers – includes 25MM email addresses
• Dine Brands (Applebee’s, IHOP): e-mail program sends rewards on birthday & other offers
E-mail List
• BJ’s Restaurants: 1 point per $1 spend; 100 points for $10 credit
• TGI Fridays: 1 point per $1 spend; tiered redemption (50-150 points)
• Darden (Olive Garden, LongHorn, Cheddar’s, Yard House, Seasons 52, Bahama Breeze, The Capital Grille, Eddie V’s): cross-branded test was in <10% of stores, though pilot program has been discontinued
Spend Based
• Bloomin’ Brands (Outback, Carrabba’s, Bonefish, Fleming’s): dine 3x in 6 months & get 50% off next visit (up to $20/$40 for Fleming’s) to be used within 3 months
• Chili’s: free chips & salsa or nonalcoholic drink each visit if visit within 60 days
• Red Robin: dine 9 times, get 10th item free; 5 visits in 5 weeks, get $20 credit for next visit
Frequency Based

Company HighlightStarbucks
Starbucks has ~19.5MM members (of ~75MM Starbucks customers) in the Starbucks Rewards
program representing ~47% of US company sales and a meaningful percentage of US SSS growth
– Starbucks Rewards members are “stickier” customers with greater frequency and spend
Best-in-class digital ecosystem with evolving capabilities, digital relationships with non-reward
members and strong personalized marketing
– Ability to leverage customer data to make strategic decisions and influence behavior is & will
remain the company’s competitive advantage
67
Source: Company data, Credit Suisse
Starbucks Rewards as % of US SalesStarbucks Rewards Members & Growth
The Starbucks Rewards program comprises ~19.5MM members with growth of 15%+ over the last five years
Starbucks Rewards members represent ~25% of Starbucks customers and an outsized 47% of US company sales
-10%
0%
10%
20%
30%
40%
50%
4
6
8
10
12
14
16
18
20
22
F1Q
14
F3Q
14
F1Q
15
F3Q
15
F1Q
16
F3Q
16
F1Q
17
F3Q
17
F1Q
18
F3Q
18
F1Q
19
F3Q
19
F1Q
20
F3Q
20
YO
Y %
Sta
rbuck
s R
ew
ard
s M
em
bers
(M
M)
Starbucks Rewards Members (MM) YOY %
20%
25%
30%
35%
40%
45%
50%
F1Q
14
F3Q
14
F1Q
15
F3Q
15
F1Q
16
F3Q
16
F1Q
17
F3Q
17
F1Q
18
F3Q
18
F1Q
19
F3Q
19
F1Q
20
F3Q
20
Sta
rbuck
s R
ew
ard
s as
% o
f S
ale
s

Company HighlightDomino’s
Domino’s competitive advantage is driven by how the company captures and leverages customer data
to inform strategic decisions (suggested sell, personalized marketing, new unit development, etc.)
– Digital makes up ~75% of Domino’s orders (Papa John’s ~70% & Pizza Hut ~60%)
Domino’s is the largest restaurant company that offers a frequency-based loyalty program
We estimate Domino’s has more than 30MM active rewards members, nearly 50MM members
enrolled for the loyalty program and at least 85MM total customers in its database, underscoring the
opportunity for continued meaningful contribution from Piece of the Pie Rewards going forward
68
Source: Company data, Credit Suisse estimates
Digital Sales MixDomino’s Rewards Members
0%
10%
20%
30%
40%
50%
60%
70%
80%
90%
100%
201
0
201
1
201
2
201
3
201
4
201
5
201
6
201
7
201
8
201
9
202
0
Dig
ital S
ale
s M
ix
0MM
5MM
10MM
15MM
20MM
25MM
30MM
35MM
40MM
45MM
50MM
2017 2018 2019 2020E
Dom
ino's
Rew
ard
s M
em
bers
Active Loyalty Members (ordered within 6 months) Enrolled Loyalty Members

Company HighlightChipotle
Chipotle has grown Chipotle Rewards to ~17MM members in ~18 months, and likely ~20MM
members by the end of 2020, one of the fastest growing loyalty program in the history of
restaurants, and underscoring the power of the brand
Loyalty is still in early innings of what should be a powerful multi-year growth driver, and we expect
the brand to leverage data to incentivize behavior on a broader scale in 2021 and going forward
Assuming loyalty grows to ~20MM members by 2020 & 23MM by 2021, we estimate just 1 more
visit per new & 0.5 more visits per existing loyalty customer could contribute ~3.5% to SSS in 2021
69
Source: Company data, Credit Suisse estimates
Chipotle Rewards SSS ContributionChipotle Rewards Members & Growth
3.05.0
7.08.5
11.5
15.017.0
20.0
23.0
26.0
29.0
0
5
10
15
20
25
30
35
1Q19 2Q19 3Q19 4Q19 1Q20 2Q20 3Q20 2020E 2021E 2022E 2023E
Chip
otle
Loya
lty M
em
bers
(M
M)
We expect Chipotle Rewards could approach ~20MM members by the
end of 2020, and grow ~3MM thereafter
2019 2020E 2021E 2022E
Chipotle Rewards Members (MM) 8.5 20.0 23.0 26.0
YOY Change in Members 11.5 3.0 3.0
YOY % 135% 15% 13%
Average Rewards Members (MM) 4.5 14.3 21.5 24.5
Chipotle AUV ($000s) $2,205 $2,211 $2,510 $2,642
Stores (End of Year) 2,622 2,760 2,960 3,170
YOY Change in Store Count 2,533 138 200 210
Average Stores 1,356 2,691 2,860 3,065
Loyalty Members/Store (End of Year) 3,242 7,246 7,770 8,202
YOY Change in New Members/Store 4,005 524 432
Avg. Loyalty Members/Store 5,295 7,517 7,993
YOY Change in Avg New Members/Store 5,295 2,222 476
Incremental Transactions/Member 1.0 1.0 1.0
Incremental Transactions/Existing Member 0.5 0.5
Avg. Transaction Size $13.00 $13.25 $13.50 $13.75
Incremental Sales/Store ($000s)
New Members $70 $30 $7
Existing Members $49 $53
Incremental Sales/Store ($000s) $70 $79 $60
Est. SSS Contribution 3.2% 3.6% 2.4%

0K
100K
200K
300K
400K
500K
600K
700K
800K
Jan
-19
Feb-1
9
Mar-
19
Apr-
19
May-
19
Jun-1
9
Jul-1
9
Aug-1
9
Sep-1
9
Oct
-19
Nov-
19
Dec-
19
Jan-2
0
Feb-2
0
Mar-
20
Apr-
20
May-
20
Jun-2
0
Jul-2
0
Aug-2
0
Sep-2
0
Oct
-20
Nov-
20
Dec-
20
App D
ow
nlo
ads
Company HighlightWendy’s
Wendy’s launched Wendy’s Rewards in July 2020, a spend-based loyalty program with tiered
redemption
Wendy’s has noted the loyalty program has contributed to an increase in app downloads and early
results are in-line with expectations, with the brand seeing higher average checks and frequency
Opportunities to increase awareness through compelling offers and as part of future marketing
messages should support continued growth of the program
70
Source: Sensor Tower, Wendy’s website, Credit Suisse
Wendy’s Loyalty ProgramWendy’s Digital App Downloads
Digital app downloads accelerated starting in July
2020 following the launch of the loyalty program

Company HighlightMcDonald’s
McDonald’s plans to roll out the MyMcDonald’s Rewards program in 2021 following a loyalty program
test in Phoenix in late 2020
The rewards program will be a spend-based program with tiered redemption (similar to Wendy’s
Rewards)
71
Source: McDonald’s website, Credit Suisse
McDonald’s is launching MyMcDonald’s Rewards in 2021, a spend-based loyalty program with tiered redemption
Customers earn 100 points for every $1 spent, and can redeem rewards after spending $15-60

72
Company HighlightBloomin’ Brands
Bloomin’ has the most sophisticated rewards program in casual dining, with Dine Rewards a
frequency-based program encompassing its four concepts (Outback, Carrabba’s, Bonefish, Fleming’s)
– Bloomin’ has noted rewards members visit 3.5x more than the average customer, spend more than
3x that of a non-member and are more likely to visit multiple concepts; visits across nearly all
frequency cohorts appear to increase as a result of the rewards program
– Program characteristics: dine three times in six months and earn 50% off next visit (up to
$20/$40 at Fleming’s) with rewards expiring after three months
Bloomin’ Dine Rewards Members vs Non-MembersDine Rewards Members (MM)
Source: Company data, Credit Suisse
1.5 1 $81
5.3
1.3
$269
Annual Visits Unique Concepts 12-Month Spend
Non-Members Dine Rewards
0.4
1.5 2.2
3.0 3.7
4.4 5.0
5.8 6.4
7.0 7.6
8.2
9.0 9.7
10.2
10MM+
0
2
4
6
8
10
12
2Q
16
3Q
16
4Q
16
1Q
17
2Q
17
3Q
17
4Q
17
1Q
18
2Q
18
3Q
18
4Q
18
1Q
19
2Q
19
3Q
19
4Q
19
1Q
20
Din
e R
ewar
ds M
embe
rs (
MM
)

73
Restaurants of the Future

New retail formats address changing consumer demands
Restaurants have been built for customers to order at the restaurant – as consumer behaviors and
expectations evolve, and more consumers look to order digitally, restaurants are adjusting the way
they do business – opening new store formats, modifying layouts and enhancing operations
– Unlocks opportunities to improve returns and additional unit growth opportunities
The most common (and easiest to implement across different concepts) changes we see are: 1) the
addition of separate in-store pickup shelves for mobile/delivery orders to reduce friction & increase
awareness of the availability of digital orders; and 2) assign employees exclusively to digital orders
(likely during peak hours & in concepts with high digital utilization)
We are also seeing restaurants explore new store formats and layouts, with modifications including:
1) smaller store formats with limited or no dine-in seating; 2) separate entrances for delivery
couriers; 3) changes to traditional production lines (e.g., stores with down-the-line in-store ordering
could shift digital orders to separate kitchen/area); 4) addition of pickup or walkup windows; and 5)
addition/expansion of drive-thru lanes, including those exclusively for digital orders
We have also seen full service restaurant concepts test new concepts with a more “fast casual”
positioning and tech-focused integration, likely targeting a younger demographic
74

Envisioning a future for full service restaurantsOpportunity for more stomach share
We believe full service restaurants could demonstrate the most meaningful transformation following
recent challenges and learnings as they have enhanced operations to better execute off-premise,
positioning many casual dining chains to better compete with their QSR and fast casual
counterparts that the segment has lost share to over the last several years
We can envision a world where casual dining chains design new restaurants with an off-premise
focus, including the potential for drive-thru additions, smaller formats and limited seating restaurants
– In many cases, casual dining companies are generating off-premise sales that rival AUVs at QSR
and fast casual restaurants
Olive Garden is generating off-premise sales of ~$30K per week, equivalent to $1.5-1.6MM
of sales annually, relatively in-line with AUVs at Burger King & Wendy’s
The Cheesecake Factory generated off-premise sales of $75K per week when operating off-
premise only, equivalent to ~$4MM of sales annually, exceeding AUVs at the majority of
QSR/fast casual restaurants (for reference, McDonald’s AUV ~$3MM, Chipotle ~$2.2MM)
– Darden has noted plans to build new restaurants and modify layouts among existing restaurants
to enhance the curbside experience, noting plans for dedicated parking spots closer to the
kitchen to reduce the distance the food moves and greater use of technology (such as the
recent Hello I’m Here messaging feature)
Darden suggested Olive Garden could be even quicker than QSR drive-thrus, with a goal for
an average pickup time of about one minute
75

Chipotle has led the industry with its digital-forward unit prototypes, with Chipotlane units to comprise
70% of the 2021 new unit class and ~60% of the 2020 new unit class, and to represent ~10% of
the portfolio by the end of 2021
– On average, Chipotlane units in the comp base have AUVs ~10% higher than traditional units and
a ~10% higher digital mix, and Chipotlane units in the 2020 new unit class have AUVs ~25%
higher than traditional units in the class and better margins
Chipotle recently opened its first digital-only unit, the Chipotle Digital Kitchen, which requires guests
to order ahead, with the company noting the new concept will allow the brand to enter more urban
areas that otherwise wouldn’t support a full size restaurant & provides flexibility with future locations
76
Source: Chipotle, Credit Suisse
Company HighlightChipotle
Restaurants with Chipotlanes (digital drive-up lane) are
generating better returns than traditional stores, with higher digital mixes, margins and overall sales
Chipotle is also adding new restaurant designs and improvements, including walk-up windows and better
placed in-store shelves to further enhance operations, reduce friction & increase convenience
Chipotle recently opened a digital-only restaurant that should allow the brand to
enter more urban areas and provides flexibility with future locations
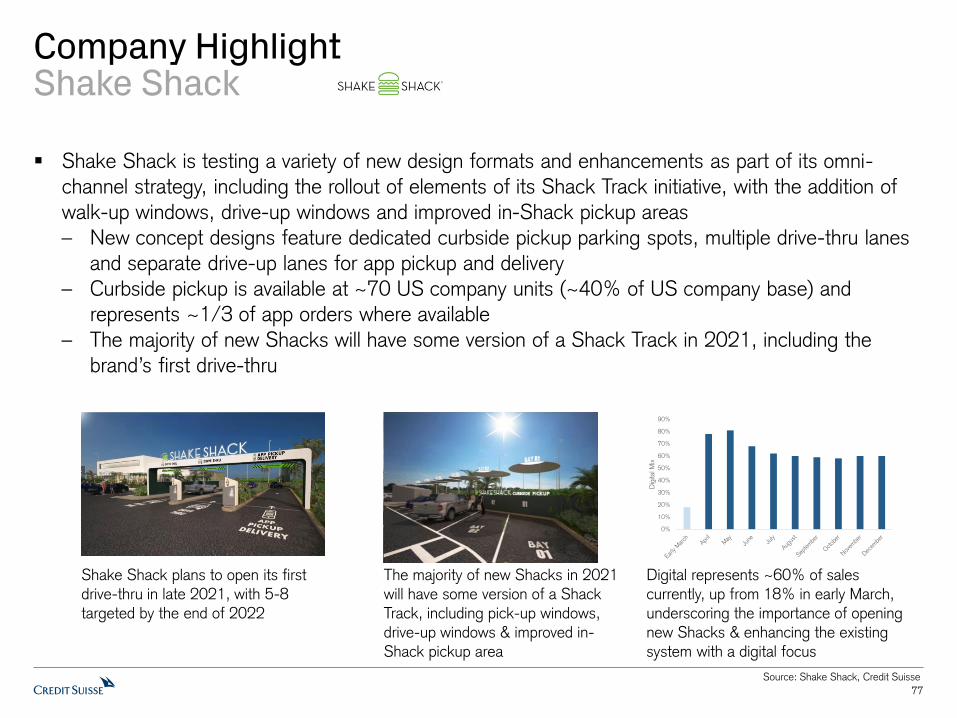
Shake Shack is testing a variety of new design formats and enhancements as part of its omni-
channel strategy, including the rollout of elements of its Shack Track initiative, with the addition of
walk-up windows, drive-up windows and improved in-Shack pickup areas
– New concept designs feature dedicated curbside pickup parking spots, multiple drive-thru lanes
and separate drive-up lanes for app pickup and delivery
– Curbside pickup is available at ~70 US company units (~40% of US company base) and
represents ~1/3 of app orders where available
– The majority of new Shacks will have some version of a Shack Track in 2021, including the
brand’s first drive-thru
77
Source: Shake Shack, Credit Suisse
Company HighlightShake Shack
Shake Shack plans to open its first drive-thru in late 2021, with 5-8
targeted by the end of 2022
The majority of new Shacks in 2021 will have some version of a Shack
Track, including pick-up windows, drive-up windows & improved in-Shack pickup area
Digital represents ~60% of sales currently, up from 18% in early March,
underscoring the importance of opening new Shacks & enhancing the existing system with a digital focus
0%
10%
20%
30%
40%
50%
60%
70%
80%
90%
Dig
ital M
ix

Starbucks is accelerating the rollout of Starbucks Pickup stores as it looks to reposition its asset
base with a combination of traditional café, drive-thru and digital-forward store formats (with digital-
forward store formats primarily in urban markets)
Starbucks expects its 15K+ US store portfolio to shift from 65% café/35% drive-thru currently to
16K+ US units with 55% café/40% drive-thru/5% pickup & new formats over the next three years
78
Source: Starbucks, Credit Suisse
Company HighlightStarbucks
The Starbucks Pickup store is smaller than Starbucks’ traditional
stores with limited seating and a focus on to-go orders
65% 55%
35%
40%
5%
FY20 FY23E
Café Drive-Thru Pickup/New Formats
Starbucks US Store Base (by format)
7864
115
160K 160K
980K
730K
2019 Future 2019 Future
# of Stores by Format (Midtown Manhattan) Population (Midtown Manhattan)
Café Pickup Population Daytime Population
Midtown Manhattan
US Store Base & Population
Starbucks expects its US portfolioto shift from 65% café/35% drive-
thru currently to 55% café/40% drive-thru/5% pickup & new formats over the next three years
For example, Starbucks is planning to optimize its Midtown Manhattan store base,
with nearly 20% of units to be pickup in the future, in part due to expectations for reduced commuter traffic
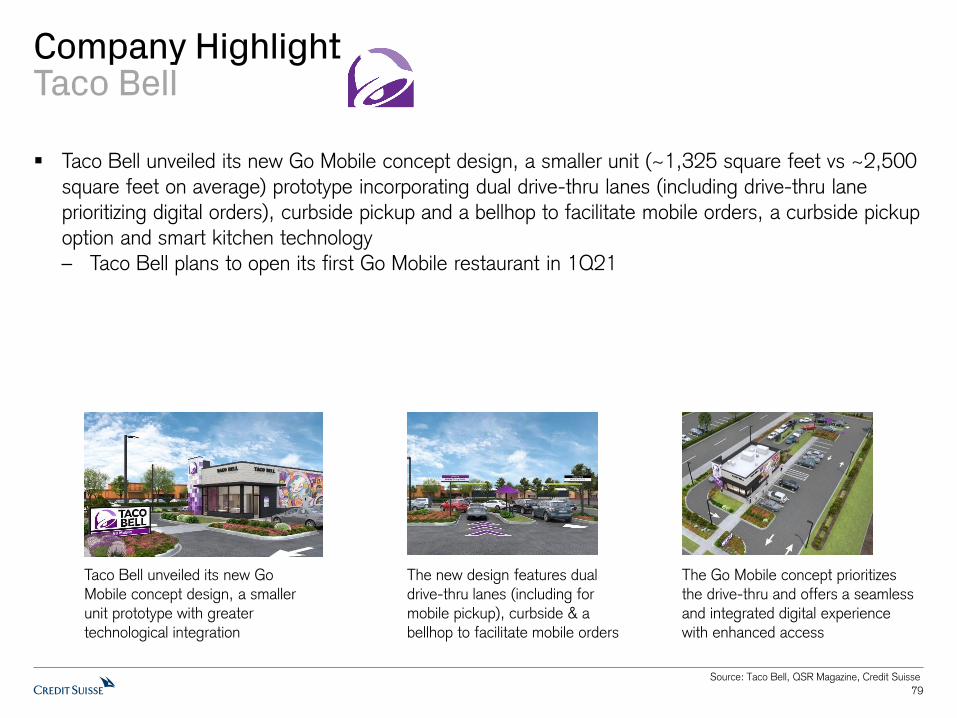
Taco Bell unveiled its new Go Mobile concept design, a smaller unit (~1,325 square feet vs ~2,500
square feet on average) prototype incorporating dual drive-thru lanes (including drive-thru lane
prioritizing digital orders), curbside pickup and a bellhop to facilitate mobile orders, a curbside pickup
option and smart kitchen technology
– Taco Bell plans to open its first Go Mobile restaurant in 1Q21
79
Source: Taco Bell, QSR Magazine, Credit Suisse
Company HighlightTaco Bell
The new design features dual drive-thru lanes (including for
mobile pickup), curbside & a bellhop to facilitate mobile orders
Taco Bell unveiled its new Go Mobile concept design, a smaller
unit prototype with greater technological integration
The Go Mobile concept prioritizes the drive-thru and offers a seamless
and integrated digital experience with enhanced access

KFC unveiled its Next Generation prototype that prioritizes digital integration, with modern visuals,
cubbies for digital orders, dedicated parking spots for off-premise orders and curbside delivery, self-
service kiosks, a drive-thru lane designed for mobile orders and a pickup entry for online orders
– The standard design features a smaller dining room and outdoor seating (the “Colonel’s Porch”),
with added options for off-premise
– One iteration of the new layout is an express store with no dining room
80
Source: KFC, QSR Magazine, Credit Suisse
Company HighlightKFC
KFC’s Next Generation prototype features a drive-thru lane designed
for mobile orders
Dedicated parking spots for off-premise orders, as well as a pickup
entry for online orders, creates amore seamless digital experience
The new prototype includes self-service kiosks, complementing drive-thru digital
access features

Sweetgreen unveiled designs for its first drive-thru location, set to open in Colorado in winter 2021
– The unit features dedicated parking spots with concierges for in-car ordering, a lane specifically
designed for digital pickup orders & a wayfinding feature that allows employees to easily find
guests to deliver orders
– The new concept design is part of the brand’s larger plan to expand into suburban markets
The new layout will likely be optimized for digital ordering, noting the brand already had 50%+ of
orders transacted through digital channels pre-COVID (though the elevated digital mix is likely in
part driven by the company’s concentration in urban markets)
81
Source: CNBC, NRN, QSR Magazine, Credit Suisse
Company HighlightSweetgreen
The new layout optimizes for digital ordering, which comprised 50%+ of
Sweetgreen’s transactions pre-COVID and grew 70%+ throughout the pandemic
The design also features exterior windows that enable drive-thru
customers to see the kitchen & food preparation area from their cars
The dedicated in-car ordering parking spots feature solar-
paneled overhangs and intercom boxes

Sonic released a new restaurant design, “Delight,” as part of a broader brand refresh that shifts
away from its traditional “2 Guys” marketing strategy
– The new prototype features drive-in docks for in-car ordering, a drive-thru and a covered outdoor
patio with string lights & lawn games
– The exterior is brightly-colored, and the interior features a new, more operationally-efficient
kitchen design
82
Source: Sonic, QSR Magazine, Credit Suisse
Company HighlightSonic
Sonic’s “Delight” concept features a brightly-lit, heavily-branded exterior
as part of a modernized brand identity
The new design also includes a covered patio to enhance the dine-in experience,
complementing enhancements made for its off-premise channel
One of the first “Delight” units features 18 drive-in docks for easy in-car
ordering that are wider than normal & are separate from the drive-thru lane
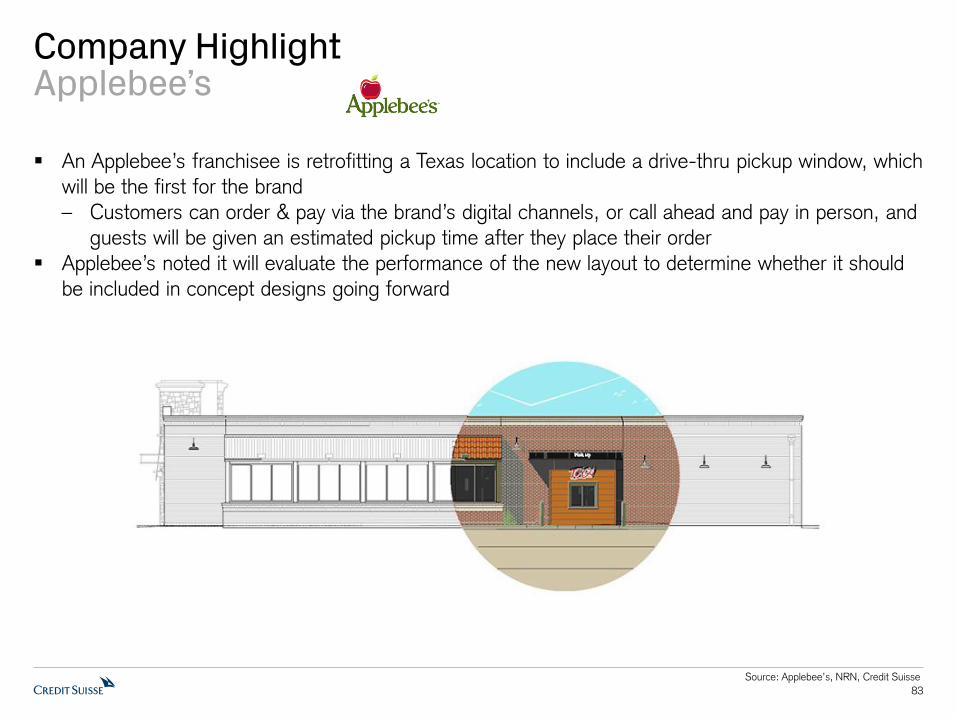
An Applebee’s franchisee is retrofitting a Texas location to include a drive-thru pickup window, which
will be the first for the brand
– Customers can order & pay via the brand’s digital channels, or call ahead and pay in person, and
guests will be given an estimated pickup time after they place their order
Applebee’s noted it will evaluate the performance of the new layout to determine whether it should
be included in concept designs going forward
83
Source: Applebee’s, NRN, Credit Suisse
Company HighlightApplebee’s

84
Delivery

Framing the US delivery marketDelivery continues to grow
85
Delivery represented ~$40BN of US restaurant sales in 2019, and increased to an estimated
~$70MM in 2020 as adoption among customers & restaurants accelerated throughout the
pandemic, though we would expect absolute delivery sales to decline in 2021 off of the 2020 peak,
albeit remain elevated relative to 2019
Off-premise ~$300BN
Total Restaurant Industry~$600BN
Delivery
~$70BN
Restaurant Industry ~$450BN
Restaurant Industry ~$600BN
2019 2020E
Off-Premise~$300BN
Delivery ~$40BN
Off-Premise~$330BN
Source: Euromonitor, Technomic, Credit Suisse estimates

US customers shift toward convenienceOff-premise continues to gain share
Off-premise sales growth has outpaced on-premise as customers shift toward more convenient
channels, a trend that accelerated in 2020 as off-premise represented ~70% of restaurant sales in
2020, relative to ~50% historically
– While off-premise sales mix will decrease going forward, we expect off-premise sales to remain
elevated from pre-COVID levels
Delivery is the fastest growing off-premise channel, which grew at an average of ~15% from 2017-
2019, and an estimated ~70% in 2020 (per Euromonitor)
86
Off-Premise Sales Channel CompositionOff-Premise & On-Premise Sales Composition
Source: Euromonitor, Credit Suisse estimates
20%
30%
40%
50%
60%
70%
80%
200
9
201
0
201
1
201
2
201
3
201
4
201
5
201
6
201
7
201
8
201
9
202
0E
202
1E
202
2E
202
3E
202
4E
% o
f R
est
aura
nt
Sale
s
Off-premise On-premise
0%
10%
20%
30%
40%
50%
60%
70%
80%
90%
100%
200
9
201
0
201
1
201
2
201
3
201
4
201
5
201
6
201
7
201
8
201
9
202
0E
202
1E
202
2E
202
3E
202
4E
% o
f O
ff-P
rem
ise S
ale
s
Delivery Drive-Thru Takeout
Top delivery considerations & outlookImplications for customers, restaurants & partners
Economics
– Current: high commission costs pressure margins & restaurants are increasingly shifting
incremental costs to customers
– Outlook: 1) higher delivery prices relative to in-store; and 2) costs to increasingly shift to the
customer (delivery fees, service fees, small order fees)
Data
– Current: limited access to customer data transacted through third-party platforms
– Outlook: increased focus on capturing customer data, with integration of delivery into digital apps
likely near-term; limited expectations for data sharing
Operations
– Current: omni-channel strategy increases restaurant complexity
– Outlook: restaurants to integrate with POS system, white-label delivery available directly through
app/website, modify layouts & explore alternative formats/solutions
Third-party platforms
– Current: restaurant customers are shifting to third-party customers
– Outlook: most restaurants to integrate delivery within direct digital channels and be available
through white-label & third-party delivery; partnerships with multiple aggregators (no exclusivity)
Quality
– Current: restaurants lose quality control with last mile & not all menus are conducive to delivery
– Outlook: we expect restaurants will simplify delivery menus & enhance packaging
87
Delivery pressures restaurant margins & profitabilityConvenience comes at a cost
Third-party commission and delivery costs of ~20-30% drive significant margin pressure and are a
source of concern among restaurant operators
– Commissions are customer acquisition costs to some extent, but they are perpetual, and the
convenience of offering delivery comes at a cost
While delivery transactions are generally not as accretive as in-store orders, delivery economics may
not be as bad as they seem at face value (in a normalized environment)
1) May not require incremental costs, making delivery orders more profitable assuming they are at
least partially incremental sales (e.g., unused labor capacity, rent & other fixed costs)
2) Operators may not offer same in-store deals/discounts
3) Generally higher average ticket and could be higher dollar profit, even if margins as a
percentage of sales are lower
That said, delivery is now substituting in-store transactions amidst recent challenges and the
overwhelming shift to off-premise, putting a spotlight on the margin dilutive nature of these
transactions
To address the added costs associated with delivery, restaurants (and third-party aggregators) are
increasingly shifting delivery costs to customers and improving profitability through a combination of
increased delivery menu prices, delivery fees, service fees and small order fees
88
Economics

Cost of convenienceDelivery increasingly expensive for customers
89
Source: Credit Suisse estimates
In-Store
Avg Check
Delivery
1.5x Avg
Check
Delivery
2x Avg Check
Delivery
1.5x Avg
Check
Delivery
2x Avg Check
Average Check $8.00 $12.00 $16.00 $12.00 $16.00
% Menu Price Adjustment 20% 20%
Adjusted Average Check $14.40 $19.20
Delivery Fee $1.99 $1.99 $1.99 $1.99
Service Fee 15.0% 15.0% 15.0% 15.0%
Small Order Fee (if appicable) $2.00 $2.00 $2.00 $2.00
Order Cost to Customer $8.00 $15.79 $20.39 $18.55 $24.07
Cost of Delivery - Customer Level
No Menu Price Adj. Menu Price Adj.
Restaurants are adjusting menu prices on platforms
to offset the cost of delivery
Restaurants and platforms are increasingly shifting
costs to the customer
Economics
Restaurants are increasingly raising delivery menu prices to shift the cost burden to customers and
offset incremental costs, with commentary from several restaurant companies suggesting limited
pushback from menu price increases
– Nearly every large restaurant chain has raised delivery menu prices on third-party platforms
and/or have added incremental service fees

Cost of convenienceIncreased menu prices, delivery fees & service fees
90
Source: Chipotle, DoorDash, Credit Suisse
Economics
Chipotle Delivery
(white-label through app)
Chipotle Order Ahead
(through app)
Chipotle Delivery
(through DoorDash)
Delivery menu prices are ~10-15% higher than order ahead
Delivery menu prices are ~10-15% higher than order ahead, and together with delivery & service fees, delivery prices are ~25% higher (add a $2 tip, and closer to ~45% higher)
Delivery menu prices on DoorDash are the same as white-label delivery through the Chipotle app, though delivery & service fees vary depending on the platform

Cost of offering increased accessHigher average checks & higher costs
91
Source: Credit Suisse estimates
Economics
Assume slightly higher packaging costs
Assume leverage from
partially fixed labor and operating costs
While delivery comes with incremental costs, delivery transactions generally have higher average
checks adding to profit dollars, though without incrementality, will be margin dilutive
– Delivery orders tend to generate average checks 1.5-2x the size of a traditional in-store order as
customers amortize the cost of delivery by ordering multiple meals or share costs with groups
Increased delivery menu prices should help offset at least some of the incremental costs of delivery
Assuming delivery occasions are at least partially incremental, delivery could be margin accretive
In-Store
Avg Check
Delivery
1.5x Avg
Check
Delivery
2x Avg Check
Delivery
1.5x Avg
Check
Delivery
2x Avg Check
Average Check $8.00 $12.00 $16.00 $12.00 $16.00
Food & Paper 28.5% 29.0% 29.0% 29.0% 29.0%
Labor 28.0% 18.7% 14.0% 14.0% 10.5%
Royalty 4.0% 4.0% 4.0% 4.0% 4.0%
Advertising 4.0% 4.0% 4.0% 4.0% 4.0%
Other Operating 12.0% 8.0% 6.0% 6.0% 4.5%
Rent 12.0% 12.0% 12.0% 12.0% 12.0%
Commission 0.0% 20.0% 20.0% 20.0% 20.0%
EBITDA per order 11.5% 4.3% 11.0% 11.0% 16.0%
EBITDA $ per order $0.92 $0.52 $1.76 $1.32 $2.56
Cost of Delivery - Restaurant Level
No Incrementality Assumes Incrementality
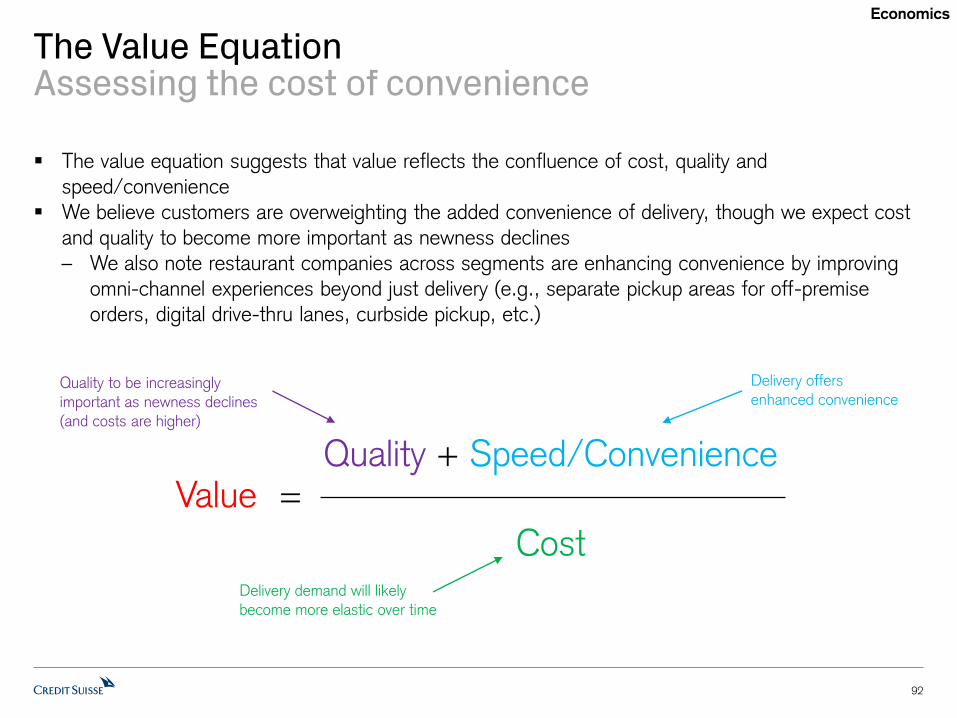
The Value EquationAssessing the cost of convenience
The value equation suggests that value reflects the confluence of cost, quality and
speed/convenience
We believe customers are overweighting the added convenience of delivery, though we expect cost
and quality to become more important as newness declines
– We also note restaurant companies across segments are enhancing convenience by improving
omni-channel experiences beyond just delivery (e.g., separate pickup areas for off-premise
orders, digital drive-thru lanes, curbside pickup, etc.)
92
Economics
ValueQuality + Speed/Convenience
Cost
=
Delivery offers enhanced convenience
Delivery demand will likely become more elastic over time
Quality to be increasingly important as newness declines
(and costs are higher)
Who owns the data?Restaurants vs third-party platforms
Third-party platforms own the customer data for transactions through their platforms – NOT the
restaurants, underscoring the importance for restaurants to integrate delivery through their
own branded websites/apps
Data is arguably the most important element of increased digital utilization (including delivery) to
better forecast demand, personalize offers, segment customers and influence behavior
Most significant risk: third-party platforms use the rich customer data to launch their own food
offerings based on demand & trends
– Increasing availability of turnkey solutions (virtual & ghost kitchens), reducing capital
requirements and barriers to entry
We expect restaurants will increasingly look to integrate delivery within their proprietary apps, and
leverage third-party delivery companies for their local logistics platforms to fulfill orders that originate
outside of marketplaces (and through restaurants’ direct digital channels)
– Restaurants would not share transaction-level details or customer data with third-party platforms,
mitigating the negative data element associated with third-party delivery partnerships
93
Data

Delivery channel adds operational complexityUnderscores need for an omni-channel strategy
The addition of new ordering channels increases restaurant complexity, adding friction to operations
and customer experiences
– Lack of POS integration creates inefficiencies
“Multiple tablet’ problem, as restaurants require multiple tablets to key in orders if lacking
POS integration, particularly challenging in what appears to be a non-exclusive world of
delivery with multiple partnerships
– Potentially leads to slower service times for in-store customers and poor experiences for digital
customers if there is lack of signage (in-store pickup) or poor delivered quality (delivery)
New digital channels require changes in both back & front of house layouts to address congestion,
capacity constraints and added complexity
– Execution: Restaurants are adding designated pickup areas for digital/delivery orders, modifying back of house and front of house layouts and considering digital/delivery channels in
future prototypes
– Integration: Restaurants are investing in IT infrastructures to integrate delivery within their POS systems, improving accuracy and limiting lost orders, to integrate delivery within their apps, and
to increase throughput/accuracy with more automation (e.g., digitize labels, labor scheduling,
automated inventory ordering, predictive analytics)
94
Operations

Enhancing omni-channel operationsExecution & integration
Execution
Addition of designated pickup areas in restaurants for out-of-restaurant orders to reduce friction
Modification of back of house and front of house layouts
Development of new prototypes with an omni-channel focus, including pickup/delivery focused
images with limited or no dine-in seating
Integration
Integrate delivery directly within POS systems to improve accuracy & limit lost orders, reduce order
entry errors and decrease labor costs
– Technology companies such as ItsaCheckmate & Chowly enable integration of various ordering
platforms directly into POS systems, noting many restaurant companies are establishing
relationships with multiple third-party aggregators
Integrate delivery in white-label app to increase control of end-to-end experience, pricing &
customer data, and build a more holistic understanding of the digital customer, with greater
opportunities to shift customers to more margin accretive channels
95
Operations
Adding delivery to white label appOffer access & control customer experience
Chipotle & Burger King are a couple of the only large restaurant chains to offer white-label delivery directly through its app, with the companies engaging DoorDash to fulfill delivery through its
local logistics platform
McDonald’s plans to add the ability to order delivery directly through the app in 2021
Shake Shack started testing delivery integration directly through its app in late 2020 in select restaurants in Miami, with plans for a broader rollout across the system in 1H21
Wendy’s & Chick-fil-A both offer a delivery option through their apps, but the apps subsequently redirect customers to choose a third-party platform to order from, rather than keeping customers
within the brands’ digital ecosystems
96
Operations

Will restaurants do self-delivery?In our view, no
As demonstrated by third-party delivery companies, there are significant economic and logistical
complexities associated with last mile delivery, and we do not believe most restaurants are equipped
to staff and execute delivery in a profitable manner
To operate a profitable delivery network, we believe density, volume of delivery drops and
consistency are key, thus better positioning third-party delivery platforms with greater access to
customers and restaurants
Domino’s has highlighted the challenges of operating a delivery network profitably, and as a
company with arguably the most sophisticated delivery infrastructures in restaurants, Domino’s
continues to pursue a strategy to limit the distance delivery drivers travel, noting delivery in itself is
unprofitable business (the money is in the food)
97
Operations

Opportunity cost of shifting customers to third-party platforms
98
Third-Party Delivery Platforms
As restaurants partner with third-party providers and encourage customers to order through the
platforms, they are also shifting their own customers
– Introduces customers to competitors on the platform
– Lose access to valuable customer data
– Platforms don’t necessarily have restaurants’ best interest in mind
Delivery provider is last customer touchpoint, and could have implications for quality of food
delivered and overall experience
Third-party platforms increased efforts to expand the suite of offerings to restaurants, further
entrenching themselves within restaurants – CRM platforms, app development, delivery analytics,
ghost kitchens, etc.
Third-party aggregators searching for loyaltyAdds to value proposition & risk to restaurants
99
Third-Party Delivery Platforms
Third-party aggregators appear to be increasing efforts on attracting customer loyalty to their
platforms, with commentary suggesting minimal customer loyalty across third-party platforms
Digital pickup: While aggregators have been primarily focused on delivery, they are expanding offerings to digital pick-up – the most profitable transaction to restaurants and likely to grow to a
meaningful mix of industry transactions over time
Loyalty: Select restaurants have partnered to offer their loyalty programs through aggregator platforms – we view loyalty programs as a key value incentive to attract customers to restaurants’
proprietary platforms – shifting that availability to aggregator platforms will likely reduce customers’
willingness to transact through branded platforms
Discounts/perks: Select restaurants are partnering with aggregators to offer discounts/perks for delivery – that might encourage trial, but retrial is unclear, especially as customers have access to a
large number of restaurants also offering discounts/perks – becoming a race to the bottom
Delivery subscriptions: Aggregators offer subscription services for delivery, in which customers pay a monthly fee for unlimited delivery orders – we see this as the greatest opportunity to attract
customer loyalty to the platform, but as we expect restaurants to increasingly integrate delivery
within their own apps (and charge a delivery fee), delivery through a restaurant’s branded app is
likely more expensive than ordering the restaurant through a third-party platform – allowing third-
party platforms to offer better value than the restaurant themselves

Evolution of third-party deliveryOffering delivery in & outside of the marketplace
Over the last several years, we have seen an evolution of the services provided by third-party
delivery companies
– Grubhub (2004) and Seamless (1999) started as aggregator platforms for online food ordering,
and later expanded to start offering delivery as a service to restaurants without their own
infrastructures (2015); DoorDash (2013), Uber Eats (2014) and Postmates (2011) were started
to provide on-demand delivery for transactions through their platforms
– Third-party delivery companies continue to expand services offered & channels served, including
white-label delivery solutions to fulfill delivery orders placed outside of their marketplaces
As restaurants upgrade their digital assets and data analytics capabilities, and look to build a more
holistic digital ecosystem and customer experience, we expect them to increasingly integrate
delivery within their proprietary apps, and leverage third-party delivery companies for fulfillment
– DoorDash operates DoorDash Drive, with select national partners including Chipotle, Wingstop &
Little Caesars
– Grubhub offers Delivery-as-a-Service, with select partners including KFC & Taco Bell
– Uber Eats offers a white-label delivery solution, with select partners including Shake Shack
(started testing in late 2020, with plans for nationwide rollout in early 2021) & Sweetgreen
– Postmates provides an on-demand delivery solution for businesses across different channels and
partners with Square as a delivery service provider for merchants that work with Square
100
Third-Party Delivery Platforms

A new take on exclusivityNon-exclusive third-party; exclusive white-label
Large chains initially started their delivery journeys through exclusive relationships with one third-
party partner to limit operational complexity and improve deal terms (lower commissions, better
marketing support)
More recently, large chains have shifted strategies away from exclusivity, expanding their delivery
networks to work with multiple third-party providers and have presence on multiple platforms as: 1)
restaurant technology has improved to better enable integration between restaurant POS systems
and third-party partners, 2) presence on multiple platforms appears to be relatively complementary
or at least incremental (different market leaders in different markets), and 3) chains have gained
more negotiating power amidst heightened competition among aggregators and better monetization
of the value they bring to the platforms
– The shift away from exclusivity accelerated during 2020 as demand for delivery accelerated
While exclusive presence on one third-party platform is likely in the past, restaurants are exclusively
partnering with one provider for their white-label delivery solutions
– While few large chains currently offer delivery directly through their digital channels, this will be a
more important area of focus as restaurants increasingly look to capture more customer data,
build holistic digital ecosystems and regain control of as much of the end-to-end customer
experience as possible
101
Third-Party Delivery Platforms
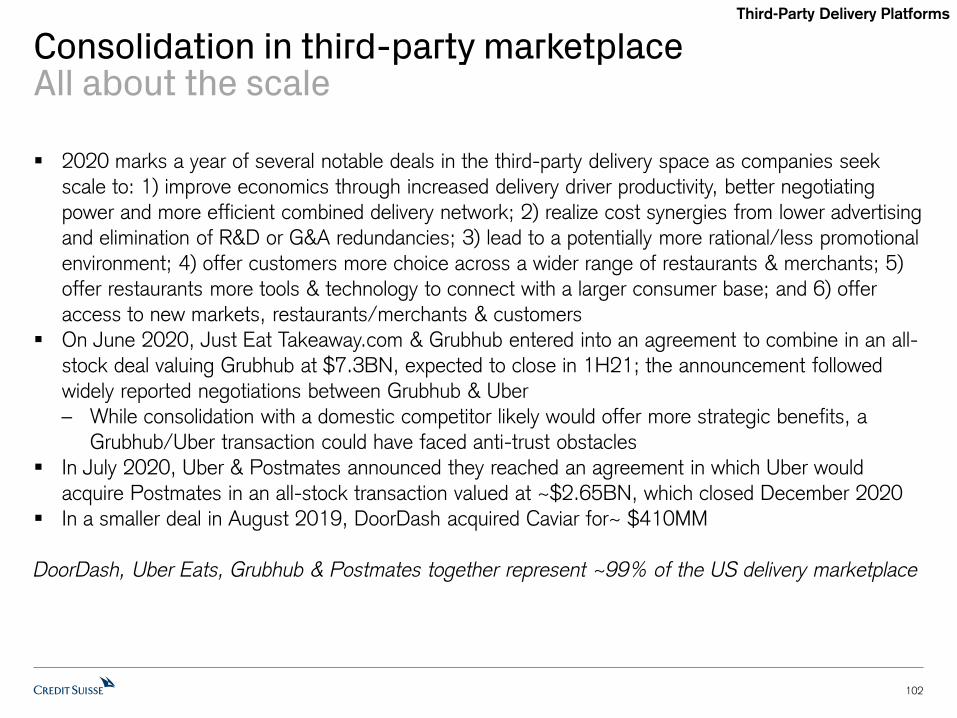
Consolidation in third-party marketplaceAll about the scale
102
Third-Party Delivery Platforms
2020 marks a year of several notable deals in the third-party delivery space as companies seek
scale to: 1) improve economics through increased delivery driver productivity, better negotiating
power and more efficient combined delivery network; 2) realize cost synergies from lower advertising
and elimination of R&D or G&A redundancies; 3) lead to a potentially more rational/less promotional
environment; 4) offer customers more choice across a wider range of restaurants & merchants; 5)
offer restaurants more tools & technology to connect with a larger consumer base; and 6) offer
access to new markets, restaurants/merchants & customers
On June 2020, Just Eat Takeaway.com & Grubhub entered into an agreement to combine in an all-
stock deal valuing Grubhub at $7.3BN, expected to close in 1H21; the announcement followed
widely reported negotiations between Grubhub & Uber
– While consolidation with a domestic competitor likely would offer more strategic benefits, a
Grubhub/Uber transaction could have faced anti-trust obstacles
In July 2020, Uber & Postmates announced they reached an agreement in which Uber would
acquire Postmates in an all-stock transaction valued at ~$2.65BN, which closed December 2020
In a smaller deal in August 2019, DoorDash acquired Caviar for~ $410MM
DoorDash, Uber Eats, Grubhub & Postmates together represent ~99% of the US delivery marketplace

Increased regulations around third-party deliveryShifting costs
103
Third-Party Delivery Platforms
Many cities, counties & states have enacted legislation for temporary delivery & commission fee
caps for third-party platforms to reduce the burden as more sales have shifted to expensive and
margin dilutive delivery channels
City/county officials argue that restaurants have limited negotiating power to lower fees and capping
the fees will help ease the financial burden in an environment where delivery may be one of only a
few options, compared to an incremental revenue stream prior to the pandemic
Third-party delivery companies have argued that fee caps would ultimately be a negative for
restaurants as third-party platforms would be forced to increase delivery & service fees charged to
customers, likely reducing demand and capital allocated for promotions, and could limit their abilities
to fund benefit programs for merchants, couriers and customers, as well as relief efforts
– DoorDash & Uber Eats raised fees for customers in California to help cover new benefits for
drivers under Proposition 22
– DoorDash has reportedly raised fees in nearly a dozen cities & counties to offset fee cap limits
While all fee caps instituted have been passed as temporary, we believe the passing of the
legislation suggests there could be greater oversight regarding regulations of fee caps in the future
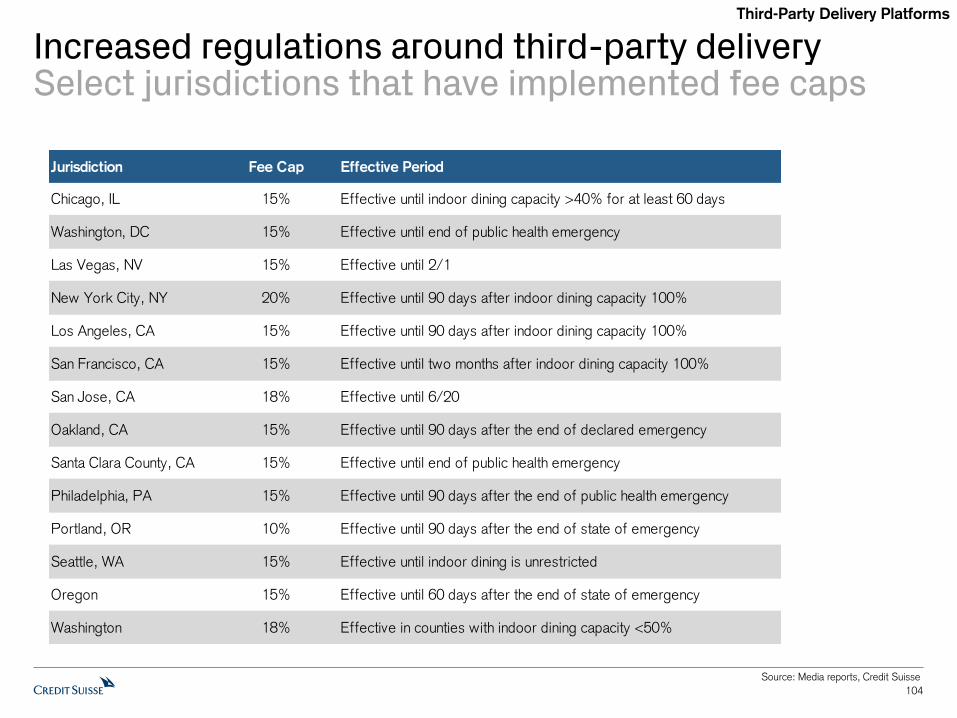
Increased regulations around third-party deliverySelect jurisdictions that have implemented fee caps
104
Source: Media reports, Credit Suisse
Third-Party Delivery Platforms
Jurisdiction Fee Cap Effective Period
Chicago, IL 15% Effective until indoor dining capacity >40% for at least 60 days
Washington, DC 15% Effective until end of public health emergency
Las Vegas, NV 15% Effective until 2/1
New York City, NY 20% Effective until 90 days after indoor dining capacity 100%
Los Angeles, CA 15% Effective until 90 days after indoor dining capacity 100%
San Francisco, CA 15% Effective until two months after indoor dining capacity 100%
San Jose, CA 18% Effective until 6/20
Oakland, CA 15% Effective until 90 days after the end of declared emergency
Santa Clara County, CA 15% Effective until end of public health emergency
Philadelphia, PA 15% Effective until 90 days after the end of public health emergency
Portland, OR 10% Effective until 90 days after the end of state of emergency
Seattle, WA 15% Effective until indoor dining is unrestricted
Oregon 15% Effective until 60 days after the end of state of emergency
Washington 18% Effective in counties with indoor dining capacity <50%

Quality control in deliveryNot all cuisines or menu items travel the same
105
Source: Credit Suisse
Quality
Certain cuisines may not travel well, which could impact the experience for the customer
– Restaurants are trimming menus that are available for delivery, often limiting what is available for
delivery to maximize quality of food delivered & reduce risk of spillage
Transport of food by third-party could have food safety implications
– Many restaurants have added adhesive seals to offer comfort in the safety of delivered orders
Companies are exploring different packaging for delivery to maintain the order’s integrity and
enhance the quality of food delivered (e.g., separate packaging for hot/cold items)
Shake Shack McDonald’s Dunkin’

Accounting for deliveryAgent vs principal; third-party vs white-label
Restaurants are accounting for delivery transactions in different ways depending on whether they
view themselves as the principal or agent and whether the delivery transaction is generated through
third-party aggregator platforms or brand channels
Third-party: Restaurants use third-party partnerships as a customer acquisition tool and to provide increased access to customers
– Revenue: gross food sales or net sales (gross food sales less commissions to third-party
partners) depending on assessment of agent vs principal arrangement
– Costs: commissions & fees paid to third-party platforms (if net sales, commissions are not
recognized on face of P&L); customers are also charged delivery & service fees, though these
costs are between the third-party platform & the customer
Commissions/fees are generally charged as a % of gross food sales
White-label: Restaurants use third-party logistics platforms to fulfill delivery demand generated through their own white-label channels (app, website)
– Revenue: gross food sales, delivery fees & service fees
– Costs: delivery fees paid to fulfill orders using third-party logistics platforms
Generally fixed fee per order
Self-delivery: Restaurants fulfill delivery through their own infrastructures– Revenue: gross food sales, delivery fees & service fees
– Costs: delivery costs incurred to fulfill order
106
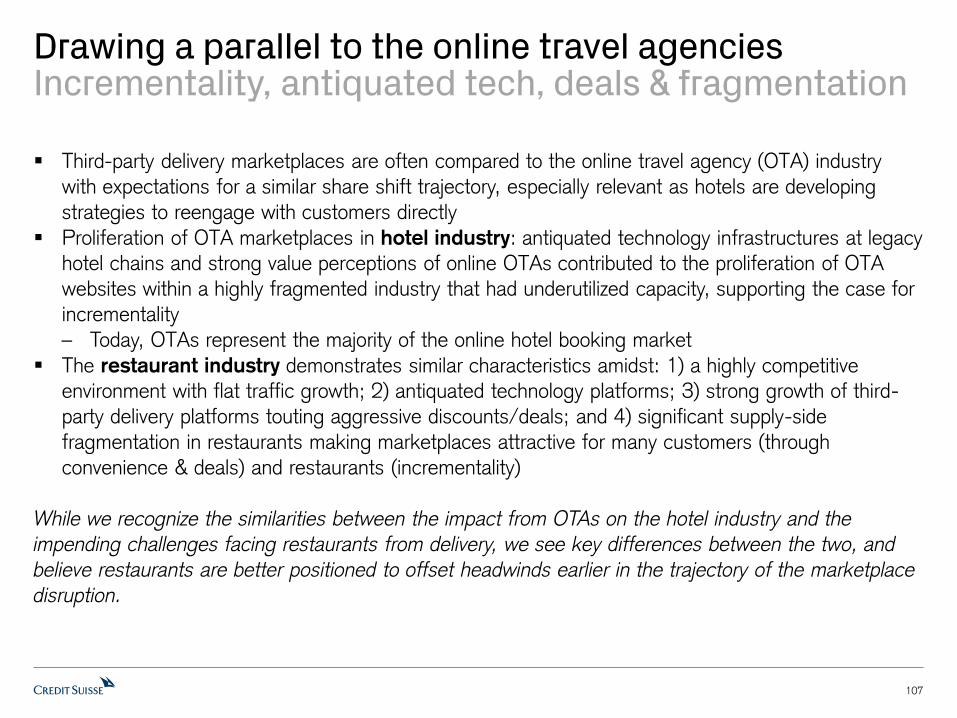
Drawing a parallel to the online travel agenciesIncrementality, antiquated tech, deals & fragmentation
107
Third-party delivery marketplaces are often compared to the online travel agency (OTA) industry
with expectations for a similar share shift trajectory, especially relevant as hotels are developing
strategies to reengage with customers directly
Proliferation of OTA marketplaces in hotel industry: antiquated technology infrastructures at legacy hotel chains and strong value perceptions of online OTAs contributed to the proliferation of OTA
websites within a highly fragmented industry that had underutilized capacity, supporting the case for
incrementality
– Today, OTAs represent the majority of the online hotel booking market
The restaurant industry demonstrates similar characteristics amidst: 1) a highly competitive environment with flat traffic growth; 2) antiquated technology platforms; 3) strong growth of third-
party delivery platforms touting aggressive discounts/deals; and 4) significant supply-side
fragmentation in restaurants making marketplaces attractive for many customers (through
convenience & deals) and restaurants (incrementality)
While we recognize the similarities between the impact from OTAs on the hotel industry and the
impending challenges facing restaurants from delivery, we see key differences between the two, and
believe restaurants are better positioned to offset headwinds earlier in the trajectory of the marketplace
disruption.

Drawing a parallel to the online travel agenciesAddressable market
108
Restaurants: The delivery (direct and third-party) channel is relatively nascent, representing ~5-7% of overall restaurant sales, which means third-party aggregators are seeking to gain share from
other delivery transactions (direct) or from other dining occasions (at home, drive-thru, takeout),
which requires a shift in consumption trends
OTAs: In contrast, OTAs look to capture share from the total addressable hotel industry, and do not require a shift in consumption
Even if third-party aggregators can capture the majority of delivery sales, we believe there is a limit to
overall delivery sales penetration, insulating the industry to some extent. We do recognize third-party
aggregators are entering the mobile order ahead channel, which would expand the potential
addressable market and add to share gains (albeit at a more favorable margin).

Drawing a parallel to the online travel agenciesValue
109
Restaurants: Delivery transactions come at a much higher cost relative to other restaurant channels, which we believe is a barrier to the overall penetration of delivery and aggregator market
share
– Attractive deals/discounts by aggregators over the last couple of years have encouraged
customer acquisition and deals/discounts offered by restaurants to encourage trial (likely with
the view of high incrementality) have supported the rapid growth of third-party delivery
– As third-party aggregators face increased competition and more pressure to improve profitability,
and incrementality of delivery to restaurants declines (from substitution & broader delivery
availability), we expect the perceived value from delivery declines, noting the full cost of delivery
without subsidies is generally quite expensive (inflated menu prices, service fee, delivery fee,
small order fee, etc.)
OTAs: In contrast, OTAs are able to offer similar pricing to direct hotel bookings (and potentially perceived as better value)
We view value as a key difference in the OTA and delivery marketplace, as the cost for delivery will be
notably higher than an in-restaurant (or mobile order) transaction, relative to the same cost when
booking through an OTA or directly through the hotel.

Drawing a parallel to the online travel agenciesTransaction frequency & ticket size
110
Transaction Frequency
Restaurants: Restaurant occasions are generally higher frequency than hotel stays (average McDonald’s consumer visits ~25x per year), supporting the case for direct engagement and ability
to convince customers of the value of real estate on their phones, rather than a marketplace
intermediary
– Higher transaction frequency also provides customers more comfort around pricing expectations
OTAs: In contrast, infrequent hotel guests may be less willing to digitally engage
Ticket Size
Restaurants: Lower cost occasions reduce the need for significant comparison among all available restaurants – both price and availability
OTAs: In contrast, OTAs offer the opportunity to compare prices across different hotels, likely more important with higher ticket purchases
Customers engage with restaurants more frequently than hotels, supporting an opportunity for
restaurants to leverage that advantage to communicate the value of digitally engaging with restaurants
directly, and limiting the need for significant price comparison.

Drawing a parallel to the online travel agenciesRestaurant positioning
111
Restaurants: We believe certain segments of the restaurant industry face greater risk than others based on their relative value and convenience
– QSRs likely face less risk to aggregators (and delivery overall) given lower tickets, more
favorable value, higher penetration, greater lunch mix and already enhanced convenience with
drive-thrus
– In contrast, fast casual and casual dining concepts have higher tickets and generally do not offer
drive-thrus, making delivery much more attractive given a new form of convenience
Casual dining chains likely face the greatest risk, as the overall cost of delivery could be at parity
with the in-dining experience (drinks, desserts, in-store tips), increasing the likelihood of greater
delivery sales mix over time
– That said, the in-person restaurant experience cannot be substituted with delivery, and we
believe there will be greater demand for on-premise dining following 2020 lockdowns
Drawing a parallel to the online travel agenciesThe go-forward
112
While we believe there is a limit to the impact of aggregators on the restaurant industry relative to
the OTA marketplace, largely driven by barriers of delivery penetration, third-party delivery
companies have been making efforts to expand their suite of offerings to restaurants and increase
integration in the businesses – which could increase the current addressable market and mirror
OTAs in a bigger way
– While we do not believe the restaurant industry outlook is parallel to that of the OTAs in the hotel
industry, aggregator expansion into mobile order and other booking avenues could be a risk
going forward
Delivery mix is likely limited, but we are very bullish on where digital ordering can go
That said, restaurants are still well positioned to capture their customers directly and offset some of
the marketplace risks: 1) we are still in early innings in the digital evolution; 2) restaurants can use
brand engagement to create more loyalty and increase touch points; 3) companies are building
infrastructures to develop capabilities to personalize marketing and incentivize behavior; 4)
restaurants can increase value offered through digital channels to capture real estate on customers’
phones; and 5) commentary from aggregators has suggested limited loyalty within the aggregator
landscape (suggesting restaurants are not “too late” to get their customers back)

113
Pizza segment vs third-party delivery playersBulls vs bears
Pressure from third-party delivery on the pizza segment has been a common source of debate as
investors question the magnitude of the impact for pizza concepts that have historically faced little
competitive intrusion in the delivery channel
While aggregators have been growing rapidly and gaining share over the last few years, growth
accelerated during the pandemic as the restaurant industry was forced to largely shift operations to
off-premise only, and third-party platforms acquired significant new customers & restaurants
Bulls on the pizza segment are optimistic that pizza has sufficient mind share for delivery, and expect consumers to recognize the difference in experience, quality and value; they also point out
continued challenges regarding the economics of third-party delivery and rising cost to customers
Bears on the pizza segment argue that the recent acceleration in restaurant and customer acquisition has heightened the competitive environment, accelerated customer adoption to third-
party delivery across cohorts and has improved the economics for third-party delivery companies as
they gain scale
– Many investors expect customers will have a preference to third-party aggregator platforms in
restaurants similar to what we have seen in other industries, with comparisons to streaming
services like Netflix & Spotify

114
Source: SensorTower, Credit Suisse estimates
Third-party delivery intensifies competition, but expect stabilization from here
Aggregators have gained relative market share through restaurant acquisition, customer acquisition,
geographical expansion and subsidized delivery costs over the last several years
Our working thesis has been as the market matures, expansion wanes & discounts decline, we
believe it will be more difficult for aggregators to take as much share
Even with the accelerated adoption of delivery in 2020, average monthly app downloads among the
largest aggregators in 2020 were down ~7% from 2019 (only DoorDash was up), and average
monthly downloads among the top three pizza chains were up ~9% in 2020 relative to 2019
Pizza App Monthly DownloadsDelivery App Monthly Downloads
0MM
1MM
2MM
3MM
4MM
5MM
6MM
7MM
8MM
9MM
10MM
Jan-1
8
Mar-
18
May-
18
Jul-1
8
Sep-1
8
Nov-
18
Jan-1
9
Mar-
19
May-
19
Jul-19
Sep-1
9
Nov-
19
Jan-2
0
Mar-
20
May-
20
Jul-2
0
Sep-2
0
Nov-
20
App D
ow
nlo
ads
DoorDash Uber Eats Grubhub Postmates
0.0MM
0.5MM
1.0MM
1.5MM
2.0MM
2.5MM
Jan
-18
Mar-
18
May-
18
Jul-1
8
Sep-1
8
Nov-
18
Jan-1
9
Mar-
19
May-
19
Jul-1
9
Sep-1
9
Nov-
19
Jan-2
0
Mar-
20
May-
20
Jul-2
0
Sep-2
0
Nov-
20
App D
ow
nlo
ads
Domino's Pizza Hut Papa John's

115
Pizza well positioned for value environmentBest bang for your buck
The pizza category is well positioned for a heightened value environment, as larger, family-oriented
orders remain popular and the relative gap between pizza delivery & QSR delivery will likely expand
– Delivery menu prices are inflated on third-party platforms across the industry
– Third-party aggregators continue to increase delivery & service fees
– QSRs often do not offer the same value deals through third-party delivery as they do in-store
Relative Value – Papa John’s Direct Order vs AggregatorFamily Meal Relative Value – Domino’s vs McDonald’s
Source: Grubhub, DoorDash, Domino’s, Papa John’s, Credit Suisse estimates

116
Off-Premise in Casual Dining
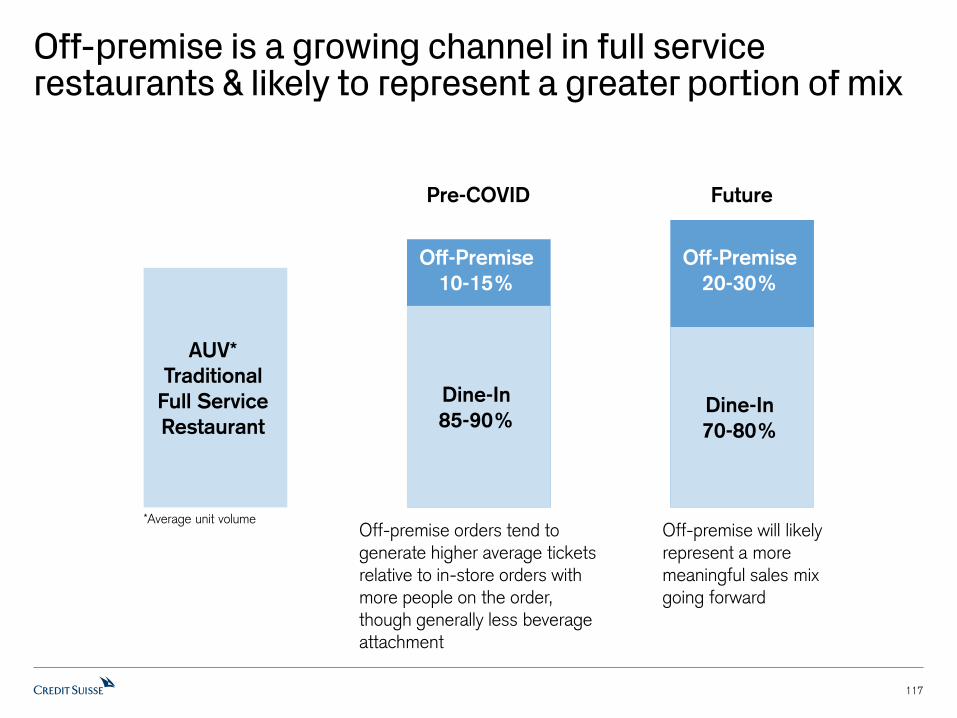
117
Off-premise is a growing channel in full service restaurants & likely to represent a greater portion of mix
AUV*
Traditional
Full Service
Restaurant
Off-Premise
10-15%
Dine-In
85-90%
Off-Premise
20-30%
Dine-In
70-80%
Off-premise orders tend to generate higher average tickets relative to in-store orders with more people on the order, though generally less beverage attachment
Off-premise will likely represent a more meaningful sales mix going forward
*Average unit volume
FuturePre-COVID

118
Source: Company data, NPD Crest, Credit Suisse estimates
Multi-channel approach to capture occasionsExpanding the addressable market
The casual dining occasion is much less frequent than what exists in limited service, with the
average American eating at casual dining restaurants 17x per year (out of 185 meals), and with
~4-8 restaurants in the average portfolio, frequency per guest averages ~2-4 times per year
The low frequency nature of the industry underscores the importance of expanding the addressable
market, with potentially less risk of cannibalization given the difference in the occasion
Select casual diners have also noted high levels of incrementality with a multi-channel approach,
while others have been more skeptical and cautious that sales will shift to less profitable channels
Outback Customer Annual VisitsRestaurant Meals & Snack Occasions Per Capita
1.6 1.51.9
6.7
0
1
2
3
4
5
6
7
8
Dine In Only Delivery Only To-Go Only Delivery & Any Other
Channel
Ann
ual
Visits
0
20
40
60
80
100
120
140
160
180
200
Breakfast Casual Dining Other Lunch/
Dinner/Snacks
Total Occasions
Ann
ual
Res
taur
ant
Occ
asio
ns P
er C
apita

119
Source: Company data, Credit Suisse estimates
Off-premise sales mix continues to increaseReflecting demand for convenience & better execution
Off-premise represented nearly 14% of sales for public full service restaurant chains at the end of
2019, up from ~8.5% three years ago
Over the last several years, we have seen an increasing focus on off-premise as restaurants seek to
build sales through additional channels and better compete with the convenience offered by limited
service restaurants that have been gaining share
– This trend was accelerated throughout 2020
Off-Premise Mix (4Q19)Off-Premise Mix
0.0%
2.0%
4.0%
6.0%
8.0%
10.0%
12.0%
14.0%
16.0%
2016 2017 2018 2019
Off
-Pre
mise
Mix
0.0% 5.0% 10.0% 15.0% 20.0% 25.0%
Carrabba's (BLMN)
Maggiano's (EAT)
Cheesecake Factory (CAKE)
Olive Garden (DRI)
Chili's (EAT)
Outback (BLMN)
Red Robin (RRGB)
Chuy's (CHUY)
Cracker Barrel (CBRL)
Applebee's (DIN)
BJ's (BJRI)
IHOP (DIN)
LongHorn (DRI)
Texas Roadhouse (TXRH)
Off-Premise Mix

120
Source: Company data, Credit Suisse estimates
Off-premise growth accelerated in recent monthsSupporting sustainable increase in off-premise channel
As restaurants shifted operations to off-premise only, off-premise sales volumes increased by 2-8x
pre-COVID levels, with public casual diners generating ~40-50% of prior year sales at peak off-
premise sales volumes & prior to dine-in reopens
As dining rooms reopen, restaurants appear to be maintaining ~50% of peak off-premise sales,
including Cheesecake at nearly 90% of peak off-premise, Olive Garden at ~60% & LongHorn 50%
Changes in customer behavior, enhanced execution & greater customer awareness support a
sustainable increase in off-premise sales volumes
Off-Premise Sales Maintained as Dine-in OpenedOff-Premise Average Weekly Sales (Pre-COVID & Current)
0% 20% 40% 60% 80% 100%
Texas Roadhouse (TXRH)
Outback (BLMN)
LongHorn (DRI)
Chuy's (CHUY)
Olive Garden (DRI)
Carrabba's (BLMN)
Red Robin (RRGB)
BJ's (BJRI)
Cheesecake Factory (CAKE)
% of Peak Off-Premise Sales
$0K $20K $40K $60K $80K
Texas Roadhouse (TXRH)
Outback (BLMN)
LongHorn (DRI)
Chuy's (CHUY)
Olive Garden (DRI)
Carrabba's (BLMN)
Red Robin (RRGB)
BJ's (BJRI)
Cheesecake Factory (CAKE)
Off-Premise Average Weekly Sales
Pre-COVID Off-Premise
Current Off-Premise

121
Source: Company data, Company websites, Credit Suisse
Off-premise = to-go + delivery + cateringNot all channels created equally
Off-premise comprises to-go, delivery and catering, with to-go generally the largest & most
established portion of off-premise, and delivery a more nascent (and controversial) channel
Off-premise average checks tend to be at-parity or slightly higher than dine-in transactions, with
more guests per transaction and higher appetizer & dessert attachment, offset by less beverage
(particularly alcohol) attachment
Off-Premise Channels by Concept
BJ's
(BJRI)
Outback
(BLMN)
Carrabba's
(BLMN)
Bonefish
Grill
(BLMN)
Fleming's
(BLMN)
Cheesecake
Factory
(CAKE)
North Italia
(CAKE)
Cracker
Barrel
(CBRL)
Chuy's
(CHUY)
Applebee's
(DIN)
IHOP
(DIN)
Olive
Garden
(DRI)
Longhorn
(DRI)
Cheddar's
(DRI)
Yard House
(DRI)
Seasons 52
(DRI)
Bahama
Breeze
(DRI)
The Capital
Grille (DRI)
Eddie V's
(DRI)
Chili's
(EAT)
Maggiano's
(EAT)
Red Robin
(RRGB)
Texas
Roadhouse
(TXRH)
To-Go
Delivery
(Small Order)
Catering

122
Source: Company data, Credit Suisse estimates
Reduced beverage attachment as headwindBeverages as most profitable menu category
Reduced beverage attachment is a meaningful headwind to the shift to off-premise (assuming
limited incrementality) and concepts with higher alcohol mixes face greater pressure
On average, the alcohol mix ranges from ~10-30% across full service restaurants, with mix
generally lower for value oriented concepts and more significant for higher-end restaurants
Beverages is the most profitable category on the menu, making it particularly important for those
with higher alcohol mixes to maintain margins
We believe alcohol margins are ~50-70%
Alcohol Mix by ConceptAlcohol Mix by Segment
0%
5%
10%
15%
20%
25%
30%
35%
Casual Dining
Steakhouse
Casual Dining Upscale Casual
Dining
Bar & Grill Fine Dining
Alc
ohol
M
ix
0% 5% 10% 15% 20% 25% 30% 35% 40%
Yard House (DRI)Eddie V's (DRI)
North Italia (CAKE)The Capital Grille (DRI)
Fleming's (BLMN)Seasons 52 (DRI)
Bahama Breeze (DRI)Bonefish (BLMN)
Buffalo Wild WingsBJ's (BJRI)
Chuy's (CHUY)Maggiano's (EAT)Applebee's (DIN)
Carrabba's (BLMN)Chili's (EAT)
Cheesecake Factory (CAKE)Texas Roadhouse (TXRH)
Longhorn (DRI)Outback (BLMN)Cheddar's (DRI)
Red Robin (RRGB)Olive Garden (DRI)
Alcohol Mix

123
Off-Premise ChannelTo-Go
To-go has comprised the majority of the off-premise channel and been a key driver of SSS in
recent years
– Accounting for to-go has likely weighed on reported traffic trends, as most restaurant
companies report off-premise orders as a single transaction, relative to in-store where traffic is
per person, inflating average check at the expense of traffic counts
Nearly every casual dining restaurant has offered to-go over the last several years given the
increasing consumer shift toward convenience and limited investment required (at a minimum,
restaurants can accept phone-in orders)
To-go orders are generally less profitable given less beverage (both alcohol & soft drinks)
attachment, though online to-go orders generate better profitability with less labor consumption
(decreased processing time) and higher average checks (higher incidence of appetizers & desserts)
– Restaurants have increasingly invested in digital infrastructures to encourage digital utilization of
off-premise orders, which we expect will be accelerated
124
Off-Premise ChannelLarger Order Catering
Catering is likely to be the smallest off-premise channel and only applicable for certain concepts
Catering often has a high degree of seasonality, skewing late in the calendar year during the holiday
time and mid-year with graduation celebrations
Catering seems to be primarily offered at Italian concepts and bar & grill concepts, which
conceptually seems appropriate given the shareability and affordability of menu offerings
– In contrast, customization in types of meat cuts and cook temperatures at steak concepts
makes it more difficult in a catering environment relative to pasta, salads and quesadillas
Since March, catering has been largely non-existent given lack of group gatherings, though we
would expect sales to return as occasions pick up over time
Throughout COVID, many restaurant chains that have traditionally not offered catering have
expanded menu offerings to include larger family meals given the shift in consumption patterns –
we believe this incremental offering could be maintained even post-COVID

125
Off-Premise ChannelDelivery
Efforts and approaches around small order delivery have been nascent and varied, as many large
chains have instead focused on more profitable off-premise channels
– The large casual dining chains tend to have greater presence in suburban/rural markets, which
have had less significant adoption of small order delivery than urban areas
– Some full service restaurants have built their own delivery infrastructures, while others have
partnered with third-party platforms
Darden offers large order delivery for Olive Garden with its own infrastructure, though Darden
has not formally established small order delivery partnerships across its brands
Bloomin’ Brands has in-house delivery at nearly all Outback & Carrabba’s restaurants and
offers delivery through DoorDash for Outback and third-party delivery through national
platforms for Carrabba’s & certain Bonefish restaurants
Cheesecake Factory offers delivery through an exclusive partnership with DoorDash
Brinker signed a multi-year exclusivity deal with DoorDash for Chili’s and Maggiano’s
Dine Brands offers delivery for Applebee’s and IHOP through multiple third-party platforms
Texas Roadhouse is not exploring third-party delivery
We believe most restaurants are not offering value deals through third-party delivery, somewhat
offsetting margin pressure from commission & delivery fees and less beverage attachment
Some full service restaurant companies are also developing virtual brands to complement their
existing restaurant operations and drive incremental sales through delivery

126
Ghost Kitchens
Ghost kitchens offer ways to expand into new markets & mitigate operational disruptions
Ghost/dark/cloud kitchens provide existing and new companies the opportunity to expand with
minimal upfront investment, lower operational costs, faster time to market, benefits from shared
services and opportunities to test new markets without significant risk
– New concepts without a physical presence could leverage a ghost kitchen to test markets
– Existing concepts could test demand in a market before opening a high cost freestanding store or use ghost kitchens to handle out-of-restaurant/digital channels (mobile order & pay, delivery,
catering) to help alleviate multi-channel disruption
Ghost kitchens usually provide standardized kitchen equipment and shared services, while
restaurant brands operating out of the kitchen facilities are generally responsible for customizable
equipment necessary for their operations and execution
As restaurants face challenges from operating multiple channels in restaurants designed for
traditional in-store orders, ghost kitchens could provide an alternative to modifying in-store
operations and layouts by taking over out-of-restaurant orders, particularly delivery (and potentially
catering), as presence in prime foot traffic locations is less important (i.e., can be within a few
blocks of high dense areas at more favorable real estate costs)
Ghost kitchens can also provide restaurants a way to increase access points, especially as they
seek to improve the quality of delivered food
127

Democratizing the restaurant industryNot so un-Amazonable
Currently ghost kitchens are positioned as complementary to the industry, but we view them as
potential competitors over time
We see cost as the key barrier to growing the delivery segment over time – in contrast, cost is not a
factor in the online travel agency world (often compared to delivery aggregator trajectory), as OTAs
offer the same (or even more favorable rates) than the alternative (direct booking)
– If aggregators can improve the cost structure of delivered meals (likely through ghost kitchens or
virtual brands), they quickly become more formidable competitors
Aggregators have the advantage of technology on their sides – these businesses are tech at
their cores, relative to restaurants which use technology as enablers for their primary food
businesses
We are already seeing aggregators partner with companies outside of the restaurant world
(e.g., supermarkets) to develop ghost kitchens and virtual brands for ready-to-eat meals
Aggregators have started to open ghost kitchens and are attracting established brands based on
known demand in select markets, suggesting the data exists and knowledge is growing – the
aggregators are supporting the businesses of the restaurants in their facilities – we envision a world
where ghost kitchens can support virtual brands based on the data captured and experiences
gained from current partner brands
128

Emerging ghost kitchen companies demonstrating solid growth as restaurants explore alternative formats
Kitchen United Mix operates commercial kitchen facilities to support multi-unit operators’ off-premise growth in new and existing markets, with pickup from KU and delivery options available
– KU offers physical space for rent, back of house labor and a technology platform to integrate
restaurants’ ordering platforms with delivery aggregators
– Customers can order from multiple restaurants operating within the facility, a competitive
advantage not available through aggregator platforms
– The company has identified opportunities to build out 400 Virtual Kitchen Centers & install 5,000
kitchens across the US;
Currently has four kitchen centers open and ~50 restaurants, with plans for 20 kitchen
centers and ~200 restaurants by the end of 2021
– KU fills a mix of local, regional and national providers within the same site, leveraging its data
analytics capabilities to curate the optimal mix of member brands that are synergistic and those
the company expects will have sufficient demand in the trade areas; member brands are also
launching virtual kitchens out of the space
– Restaurant partners can generate ~$6-7MM of volume on the high end, with mid-market brands
in new trade areas likely generating closer to ~$1MM of annualized volume
– In 2020, gross sales among restaurant partners were up 678%, and generated SSS of 377%;
KU revenue was up ~200%, with SSS ~100%
– Select restaurant chain partners include Chick-fil-A, Wendy’s, Panera & White Castle
129
Source: Kitchen United (per ICR conference), WSJ, Restaurant Business, TechCrunch, Credit Suisse

Emerging ghost kitchen companies demonstrating solid growth as restaurants explore alternative formats
REEF Technology operates REEF Neighborhood Kitchens, providing restaurants turnkey delivery solutions for the preparation, distribution and expansion of food concepts
– The kitchens are built on parking facilities as the company seeks to transform underutilized urban
spaces into delivery hubs
– REEF is looking to expand its presence to ~10,000 delivery hubs from 4,500+ currently
– REEF raised a $700MM funding round in November, led by Mubadala Capital & SoftBank, and
joining investments from Oaktree, UBS Asset Management and Target Global
– Select restaurant partners include Wendy’s, BurgerFi and Papa Murphy’s
CloudKitchens is a delivery-only ghost kitchen company supporting virtual brands and delivery channels of existing brands, led by Uber founder & former CEO Travis Kalanick
– CloudKitchens has reportedly acquired more than 40 properties across more than two dozen
cities over the past two years, which would make the company one of the largest ghost kitchen
networks in the US
Kitopi is a managed cloud kitchen platform that partners with restaurants to expand their delivery availability, handling all operational elements for orders placed through third-party delivery apps
– The ghost kitchen operator has presence in three countries, operates more than 30 kitchens and
has more than 120 restaurant partners, and is dually headquartered in NY & Dubai
– In February 2020, Kitopi raised $60MM to expand to 100+ global locations (from 30+) and
continue to develop its in-house suite of technology services for operators
– In March 2020, Kitopi launched its groceries vertical, Shop Kitopi, currently available in Dubai
130
Source: WSJ, Pitchbook, Company data, Credit Suisse
Emerging ghost kitchen companies demonstrating solid growth as restaurants explore alternative formats
DoorDash Kitchens operates a ghost kitchen facility in CA, offering customized kitchen space to
several operators with a focus on high-volume delivery areas for established brands
Zuul Kitchens operates delivery-only ghost kitchens that provide operational support to restaurants, recognizing kitchens have not been designed for delivery and burden traditional
operations
– In September, Zuul launched Zuul Market, a new service that delivers batch orders prepared at
its SoHo location to offices and apartment buildings in a single delivery drop
– Zuul raised a $9MM funding round in July 2020 to expand operations in NYC for a total of
$10.5MM raised to-date
– Zuul opened its first facility in NYC in September 2019
Franklin Junction, backed by private equity firm NRD Capital, provides host kitchen matching services, pairing restaurants that want to expand into new markets with restaurants that have
excess capacity
– The network is currently operating across ~35 US states with 500+ host kitchens and 20+
brand partners
Current brand partners include Ruby Tuesday, Nathan’s, Fuzzy’s Taco Shop, The Captain’s
Boil and Melt Shop
– The company recently launched a virtual concept, WingDepo, available exclusively through third-
party delivery partners, with plans to expand nationwide by early 2021
131
Source: Pitchbook, Credit Suisse

Large chains are leveraging ghost kitchens
Wendy’s opened its first ghost kitchen location in Toronto in November, in partnership with REEF– The company expects to open several ghost kitchen locations, highlighting the opportunity to
offer a new avenue for urban customers to access the brand
Cracker Barrel plans to convert one of its restaurants in Indianapolis into a catering-only kitchen to handle larger catering orders & some individual third-party delivery orders in 2021
Wingstop opened its first domestic ghost kitchen in June with a ~400 square foot unit in Dallas (relative to average unit ~1,750 square feet)
Red Lobster opened its first ghost kitchen location in Chicago in November, noting it enables the brand to efficiently expand its presence in urban markets
Nathan’s Famous: Nathan’s has utilized host & ghost kitchens to expand operations both domestically and abroad, partnering with Franklin Junction to broaden its reach in the US, Kitopi to
grow its presence in the Middle East and Reef Kitchens
Chick-fil-A has partnered with a few ghost kitchens, such as DoorDash Kitchens & Kitchen United
BurgerFi is partnering with Reef Kitchens through a licensing deal to expand its footprint in the US
Sweetgreen partners with several ghost kitchens, including CloudKitchens, Kitchen United & Zuul
132

133
Virtual Brands

Virtual brands could add to the competitive environmentIncreasing restaurant supply without a physical footprint
Virtual brands provide existing and new companies the opportunity to leverage existing capacity,
take advantage of demand, test new cuisines, menu items & dayparts and attract incremental
customers and occasions
– Offer the opportunity to increase in-restaurant capacity as existing restaurants launch separate
concepts available exclusively on third-party platforms
– Require minimal upfront investment and incremental operating costs
Third-party delivery companies are also using data to determine demand for specific cuisines in
select markets to partner with existing restaurants to launch virtual brands, with third-party delivery
companies completing the last mile and splitting profits with the restaurants
– We envision a world where ghost kitchens can support virtual brands based on the data captured
and experiences gained from current partner brands
134

Large chains are launching virtual conceptsTo complement existing restaurant brands
It’s Just Wings (Brinker International)
In partnership with DoorDash, Brinker launched It’s Just Wings, a chicken-wing virtual brandavailable across more than 1K Chili’s & Maggiano’s restaurants
It’s Just Wings is one of a few virtual concepts with its own website, underscoring the strategy to
build a brand for the long-term, noting Brinker expects to generate annualized sales of $150MM in
the first year, implying sales of ~$150K per restaurant with limited incremental investment
It’s Just Wings features a simplified menu with three varieties of wings and several sauces
Given the success of the brand, Brinker has suggested it is considering non-virtual options, as well
as the opportunity to expand its virtual brand portfolio with additional concepts
Tender Shack (Bloomin’ Brands)
Bloomin’ is testing Tender Shack, a virtual chicken brand, noting an opportunity to expand the
concept across its portfolio of restaurants
– Tender Shack offers a limited menu of chicken tenders, sandwiches and sauces
Neighborhood Wings by Applebee’s (Dine Brands)
Dine Brands launched Neighborhood Wings by Applebee’s in partnership with Grubhub, noting
wings are a top selling menu item at Applebee’s, and the new concept provides an opportunity for
incremental sales and for the brand to test new wings flavors
Unlike peers, the virtual concept features the Applebee’s brand in the name
135

Large chains are launching virtual conceptsTo complement existing restaurant brands
Pasqually’s Pizza & Wings (Chuck E. Cheese)
Chuck E. Cheese launched Pasqually’s Pizza & Wings, available on Grubhub, Uber Eats, DoorDash
and Postmates across its system, featuring a limited menu of pizza and wings/apps, with links to its
third-party partners to order
The Wing Experience & The Burger Experience (Smokey Bones)
Smokey Bones launched The Wing Experience, a virtual wing concept, and The Burger Experience,
a virtual burger concept, featuring the company’s top selling wings and burgers, as well as specific
items created for the virtual concepts
Wingville (Fazoli’s)
Fazoli’s launched a new wing concept, Wingville, to be available across the system by spring 2021
– Early tests showed a nearly 11% increase in sales and the brand is projecting an incremental
$2,500 per week per location
– The new equipment unlocks opportunities for additional menu items that the brand otherwise
had not been able to offer (fried mozzarella skewers, toasted ravioli, Pasta chips, Italian nachos)
The Burger Den & The Melt Down (Denny’s)
Denny’s is launching two delivery-only concepts, The Burger Den & The Melt Down, in February
across half of its ~1,500 units, noting favorable test results and high incrementality
136
Source: NRN, QSR Magazine

Franchising virtual brandsUncertain long-term value creation
Virtual Dining Concepts (VDC) is a company launched in early 2020 by Earl Enterprises, which
provides a turnkey solution for restaurants to launch and operate a virtual dining brand available
through the VDC platform
VDC is essentially a franchisor of a portfolio of virtual brands that operators can select from for their
restaurants, with each VDC concept including fully branded packaging, marketing support and
social media, and VDC having existing relationships with leading e-commerce platform Olo, as well
as with third-party delivery providers including DoorDash, Grubhub, Postmates and Uber Eats
VDC offers ~15 virtual concepts on its platform for operators to choose from across different
cuisines, with several launched in collaboration with celebrities & influencers, including MrBeast,
Mariah Carey, Tyga, Mario Lopez and Pauly D
VDC suggests restaurants will earn 30% profit on every dollar of sales generated through the virtual
brand, which we believe assumes no incremental equipment, labor or rent is required
VDC exemplifies the risk we see regarding virtual brands, ghost kitchens and third-party
partnerships – restaurant operators increase the value of the brands on the platform through
awareness and execution at no cost to VDC, gaining sales near-term, though there is no added
value to their core brands long-term and any kitchen facility (restaurant or not) can operate these
brands
137
Note: Virtual Dining Concepts is a subsidiary of Earl Enterprises, portfolio company operator of hospitality & restaurant brands including Brio Italian Grille, Bravo! Italian Kitchen, Planet Hollywood, Buca di Beppo, Bertucci’s, Earl of Sandwich & more.

Food distributors look to support virtual conceptsCapitalizing on the off-premise opportunity
In August 2020, US Foods launched US Foods Ghost Kitchens, a program designed to streamline
the process for operators to start a virtual concept, including technology to help identify menu
opportunities, dedicated marketing support and a detailed playbook to guide decision making
– Through its Ghost Kitchens program, US Foods suggests it could help launch a virtual brand
within three weeks at an average start-up cost of ~$5K and average profit margin of 35%+
In September 2020, Sysco announced the launch of Foodie Solutions, an innovative platform that
provides toolkits focused on strategies that capitalize on the increased demand for delivery and
alternative dining options
– The Virtual Kitchen Toolkit includes information on operating a virtual kitchen, noting they support
expansion efforts into new markets for traditional brick & mortar restaurants, could be the next
step for food truck operators to scale their brands and could be a low-cost option for an
emerging operator looking to enter foodservice and test a concept
138
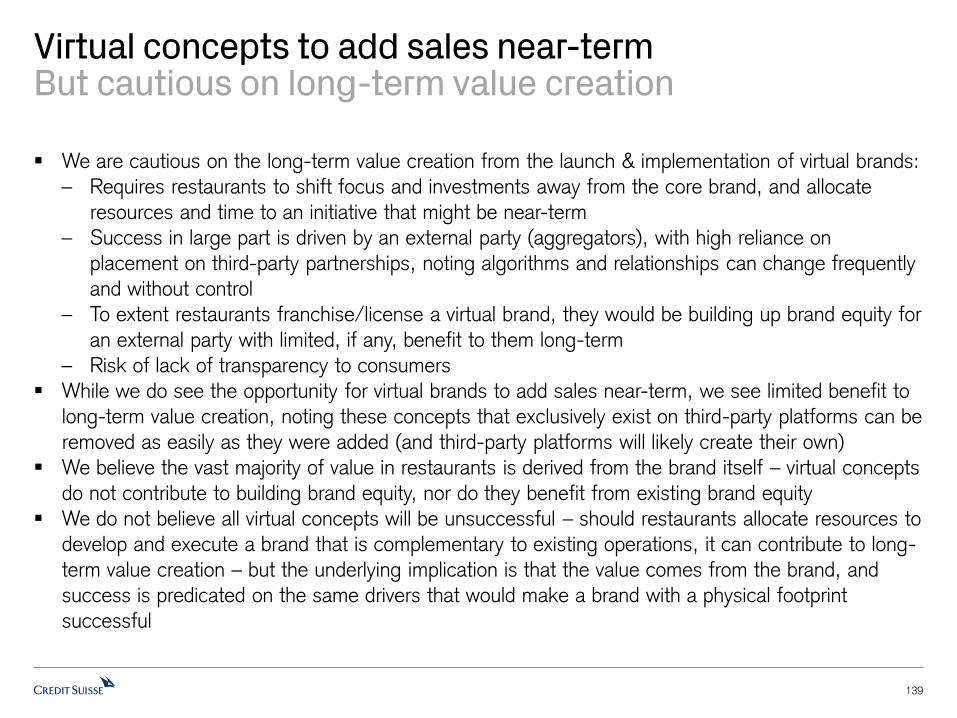
Virtual concepts to add sales near-termBut cautious on long-term value creation
We are cautious on the long-term value creation from the launch & implementation of virtual brands:
– Requires restaurants to shift focus and investments away from the core brand, and allocate
resources and time to an initiative that might be near-term
– Success in large part is driven by an external party (aggregators), with high reliance on
placement on third-party partnerships, noting algorithms and relationships can change frequently
and without control
– To extent restaurants franchise/license a virtual brand, they would be building up brand equity for
an external party with limited, if any, benefit to them long-term
– Risk of lack of transparency to consumers
While we do see the opportunity for virtual brands to add sales near-term, we see limited benefit to
long-term value creation, noting these concepts that exclusively exist on third-party platforms can be
removed as easily as they were added (and third-party platforms will likely create their own)
We believe the vast majority of value in restaurants is derived from the brand itself – virtual concepts
do not contribute to building brand equity, nor do they benefit from existing brand equity
We do not believe all virtual concepts will be unsuccessful – should restaurants allocate resources to
develop and execute a brand that is complementary to existing operations, it can contribute to long-
term value creation – but the underlying implication is that the value comes from the brand, and
success is predicated on the same drivers that would make a brand with a physical footprint
successful
139

140
Drive-Thru & Drive-Up Curbside

141
Every ~10 seconds saved at drive-thru = 1% in salesper former McDonald’s CEOs Jack Greenberg & Don Thompson and Wendy’s CEO Roland Smith
Drive-thru has historically represented 65-70% of sales for QSRs, making it a critical element to
unlock throughput gains, noting service times can have a meaningful impact on unit sales
– The drive-thru channel has performed well throughout the pandemic, now representing ~90% of
QSR sales, and will likely settle above pre-COVID levels even as the environment normalizes
Based on a study conducted by SeeLevel, on average, it took a drive-thru customer approximately
six minutes to wait & be serviced at the drive-thru in 2020, up ~30 seconds from 2019 and nearly
90 seconds from 2016
Change in Drive-Thru Time (Seconds)Drive-Thru Time (Seconds)
Source: SeeLevel, Credit Suisse
150
200
250
300
350
400
2016 2017 2018 2019 2020
Drive
-Thru
Tim
e (
Seco
nds)
Note: Drive-thru time represents wait times + service times.
0
10
20
30
40
50
60
70
80
90
100
2017 2018 2019 2020 Total
Change in D
rive
-Thru
Tim
e (
Seco
nds)

142
Drive-thru times have slowed across chainsAs menu & in-store complexity have increased
Increased menu complexity (larger menus, more customization) & the addition of digital channels are
creating a more challenging operational environment in an industry where turnover can be 100%+
Despite the implementation of simplification initiatives implemented over the last couple of years, we
have yet to see a meaningful inflection in drive-thru times
QSRs continue to make efforts to improve drive-thru service times through menu simplification and
technological integration, with implications on both the top & bottom lines
The increase in drive-thru mix throughout the pandemic has likely weighed on 2020 drive-thru times
Change in Drive-Thru Time (Seconds)Drive-Thru Time (Seconds) – 2020 and Change 2020 vs 2016
Source: SeeLevel, Credit Suisse
0
20
40
60
80
100
120
140
160
150
200
250
300
350
400
450
500
550
Chic
k-f
il-A
Arb
y's
Wendy'
s
Dunkin
'
McD
onald
's
Burg
er
Kin
g
Carl'
s Jr
Hard
ee's
Taco
Bell
KF
C
Change in D
rive
-Thru
Tim
e (
2016
-20
20
)
2020 D
rive
-Thru
Tim
e (
Seco
nds)
2020 Drive-Thru Time Change in Drive-Thru Time (2016-2020)
Note: Drive-thru time represents wait times + service times.
-50
0
50
100
150
200
Chic
k-f
il-A
Arb
y's
Wendy'
s
Dunkin
'
McD
onald
's
Burg
er
Kin
g
Carl'
s Jr
Har
dee's
Tac
o B
ell
KF
C
Change in
Drive
-Thru
Tim
e (
Seco
nds)
2017 2018 2019 2020 2016-2020

0%
10%
20%
30%
40%
50%
60%
70%
80%
90%
100%
McD
onald
's
Wendy'
s
Burg
er
Kin
g
KF
C
Tac
o B
ell
Jack
in t
he B
ox
Tim
Hort
ons
US
Dunkin
'
Tim
Hort
ons
Canada
Sta
rbuck
s
Drive
-Thru
Sto
rse a
s %
of
Ass
et
Base
143
Convenience is kingMajority of traditional QSR asset bases have drive-thrus
Drive-thrus offer increased access and convenience for customers, supporting AUVs that are ~20-
30% higher on average, noting the majority of QSR asset bases incorporate drive-thrus
– Many companies are adding additional drive-thru lanes for remodeled restaurants where possible
and new prototypes are being built to with multiple drive-thru lanes (note: there is generally an
option for a digital-focused drive-thru lane)
On average, drive-thru stores represent 95%+ of asset bases for traditional QSRs
Some restaurants have suggested potential for drive-thru only stores (e.g., Wendy’s, Jack in the Box)
Drive-Thru Stores as % of US Asset BaseDrive-Thru Sales Mix
Source: Company data, Credit Suisse estimates
Volume Increases ~20-30%
AUV*
Traditional
QSR
Drive-Thru
65-70%
Sales Mix
*Average unit volume

144
Speeding up the drive-thruSimplification & reducing complexity
Over the last couple of years, nearly every restaurant in our coverage has talked about efforts to
improve drive-thru times given the importance of a channel representing 65-70% of QSR sales
– Initiatives include: 1) remove low-volume menu items/platforms; 2) rationalize repetitive and slow
moving SKUs; 3) limit the available menus across channels & dayparts; 4) optimize in-restaurant
layouts & processes; and 5) shift non-value add or administrative tasks out of the restaurant
Traffic gains – greater throughput unlocks transactions at peak dayparts driving traffic improvement– But likely takes time to be realized by customers (takes a few times to realize faster drive-thru)
– We see drive-thru service times as critical to the breakfast daypart, noting breakfast tends to have
an outsized drive-thru sales mix relative to other dayparts
– Use of technology at drive-thru (e.g., digital menu boards, handheld POS) could also generate
higher average checks and throughput gains
Cost savings – menu and operational simplification should unlock labor and cost of goods savings (e.g., less labor required, less food waste, remove slow moving & more complex products)
We believe dynamics throughout the pandemic could be weighing on the flowthrough of productivity
gains as 9 in 10 occasions have been transacted at the drive-thru (where drive-thrus are available)
and order sizes have been meaningfully larger than normal
145
Select simplification initiatives across our coverageMenus, processes, layouts
McDonald’s – simplified its menu in mid-March, which has supported an improvement in drive-thru times (~25 seconds) and gross margins – most notably removed All Day Breakfast, which is unlikely
to come back in full across all markets; in recent years, McDonald’s has also removed its Signature
Crafted sandwich line, increased flexibility in breakfast offerings after 10:30AM and rolled out digital
menu boards across the US system
Taco Bell – simplified its menu by removing 25+ items in 2020; reduced the size and availability of its breakfast offerings; drive-thru times have improved 17 seconds year-over-year
Shake Shack – streamlined its menu in early 2020 to reduce complexity in response to the challenging operational environment, including the removal of some noncore items (e.g., Chicago
hotdog, concretes)
Wendy’s – continues to look for simplification opportunities – automate more tasks, remove lower volume menu items (i.e., chicken tenders were removed to bring on Made to Crave); enhance drive-
thru speed
Jack in the Box – indicated opportunities to rationalize SKUs (sauces, bread carriers, cheese), equipment and procedural changes; targeting a one minute reduction in drive-thru wait times
Dunkin’ – rolled out menu simplification initiative (removed ~10% of required items & 23 optional items) in 2017/2018, noting it drove a ~1% SSS drag and 100bps margin improvement; now
appears to innovate with “one off, one on” approach, with each new product replacing an existing one
146
Fast casual exploring drive-thrusDigital to enable increased convenience
While drive-thru is not a key attribute for fast casual asset bases, many are testing drive-thru
prototypes to enhance their competitive positioning as customers increasingly demand convenience
– This likely modifies unit growth strategies and could support an increase in addressable markets
as fast casuals expand into sites that might otherwise not have been suitable
Chipotle has expanded its strategy for Chipotlanes, the company’s digital drive-thru, noting ~10% of the portfolio will incorporate Chipotlanes by the end of 2021, and ~70% of new opens in 2021 will
be Chipotlane units
– Chipotlanes in the comp base have AUVs 10%+ higher than traditional stores in their unit class &
the 2020 Chipotlane unit class opened with AUVs 25% higher than non-Chipotlanes in the class
Shake Shack is opening its first drive-thru location in late 2021, and is targeting 5-8 drive-thrus by the end of 2022, noting the drive-thru model is “an important step towards increasing Shake Shack’s
addressable market opportunity”
Cava has a “Pickup by Car” option in several of its locations, which is effectively a digital drive-up window similar to Chipotlanes, with the company noting strong adoption from guests
Sweetgreen plans to open its first drive-thru in 2021 as part of a broader strategy to expand into suburban markets
Smashburger is exploring new prototypes, including a virtual drive-thru
BurgerFi recently opened its first drive-thru restaurant

147
Convenience with curbsideEnhancing access without the drive-thru
Restaurants across the industry are adding curbside options to increase access and convenience
where drive-thru is not available
– Curbside is generally a feature exclusively available for digital orders, supporting an increase in
digital utilization
We view curbside as most impactful for restaurants that do not offer drive-thru, increasing
convenience & access that otherwise is not available (generally fast casual & casual dining
restaurants)
Starbucks plans to roll out curbside to ~2,000 US stores by the end of FY21 (~20% of US company portfolio), which is likely targeted among the ~40% of stores in the portfolio that do not
have drive-thrus
Dunkin’ had a curbside option in ~1,500 stores by the end of 3Q (~15-20% of asset base), with the company noting non-drive-thru stores with curbside were significantly outperforming the rest of
non-drive-thru stores (drive-thru represents ~70% of asset base)
Shake Shack rolled out curbside to ~70 Shacks (~40% of US company asset base), which represent ~1/3 of app orders for restaurants with the option
Domino’s rolled out Carside Delivery and Pizza Hut launched curbside pickup across their US asset bases to enhance their carryout businesses
Texas Roadhouse & Darden both added & enhanced curbside pickup recently, noting Darden has indicated plans to add dedicated parking spots close to the kitchen to further improve service times

148
Franchisee Economics

Assessing the health of the franchisee systemSpotlight on franchise unit economics
Over the years, franchised systems have increasingly shifted to asset-light business models and
many franchise operators have gotten larger through refranchising efforts
– Company-owned store bases are often small and include the best units in the system, making
then less indicative of the underlying health of the franchise system
– Restaurant companies do not generally provide much disclosure regarding franchisee profitability
and data provided is often not comparable
Amidst challenges posed by pandemic-related headwinds, franchisee economics have been thrust
into the spotlight as business models for both franchisors and franchisees have been stressed and
the risks of highly levered franchisors have come to the forefront
Average unit volumes, payback periods, units per operator within the system & profitability can vary
widely by brand, with varying implications for growth and investment prospects
We look to assess the health of franchisee systems and unit level economics for the US franchisees
in our coverage by reviewing disclosures in Franchise Disclosure Documents (FDDs) and other
available industry data
Note: (1) Company-specific pages in this section are not necessarily comparable across brands, but
they are comparable over time; (2) industry-level pages in this section are comparable across
brands; (3) figures represent pre-COVID financials
149

Franchise unit economics
150
Franchisee EBITDAR (Pre G&A) Per Unit ($000s)
Average Payback Period (Years)
Restaurant AUV ($000s)
Franchisee EBITDA Per Unit ($000s) & EBITDA Margin
Source: Franchise Disclosure Documents, Restaurant Research Journal, Company data, Credit Suisse estimates
$0
$500
$1,000
$1,500
$2,000
$2,500
$3,000
$3,500
McD
onald
's
Wendy'
s
Tac
o B
ell
Popeye
s
Jack
in t
he B
ox
Burg
er
Kin
g
Dom
ino's
KF
C
Dunkin
'
Piz
za H
ut
Papa J
ohn's
AU
V (
$00
0s)
$0
$100
$200
$300
$400
$500
$600
$700
$800
McD
onald
's
Tac
o B
ell
Popeye
s
Wendy'
s
Jack
in t
he B
ox
Burg
er
Kin
g
Dunkin
'
KF
C
Dom
ino's
Piz
za H
ut
Papa J
ohn's
Fra
nch
isee E
BIT
DA
R P
er
Unit
(000
$)
EBITDA Rent G&A
4.0%
6.0%
8.0%
10.0%
12.0%
14.0%
16.0%
$0
$50
$100
$150
$200
$250
$300
$350
McD
onald
's
Taco
Bell
Popeye
s
Wendy'
s
Jack
in t
he B
ox
Burg
er
Kin
g
Dom
ino's
Dunkin
'
KF
C
Papa J
ohn's
Piz
za H
ut
EB
ITD
A a
s %
of
AU
V
Fra
nch
isee E
BiT
DA
P
er
Unit
(000
$)
EBITDA EBITDA as % of AUV
0.0
1.0
2.0
3.0
4.0
5.0
6.0
7.0
Dom
ino's
Papa J
ohn's
Piz
za H
ut
McD
onald
's
KF
C
Tac
o B
ell
Jack
in t
he B
ox
Dunkin
'
Wendy'
s
Popeye
s
Burg
er
Kin
g
Ave
rage P
ayb
ack
Perio
d (
Years
)

Size matters – bigger is not always betterComposition of franchise systems
Refranchising efforts and an inflow of private equity capital into restaurants has led to greater
franchisee consolidation
– Private equity companies likely require a large base of restaurants and a large development
agreement to be willing to enter the system to make it worth their while
Large franchise operators are generally more growth-minded, have greater access to capital &
resources and can benefit from scale, improving enterprise-wide economics
– But large franchisees also come with risk, as failure risk is concentrated with select operators,
there could be a power struggle between the franchisor and franchisee and large franchisees
tend to have higher leverage (growth capital)
While a system of small operators makes the franchisor less susceptible to risk of failure of any
single franchisee, a franchise system that is too fragmented is generally more challenging to grow,
as franchisees may not be willing or have the access to necessary capital
Recent developments exemplify the benefits and costs related to franchisee composition – Papa
John’s is seeking to refranchise company stores to well-capitalized operators (likely private equity) to
accelerate unit growth; Pizza Hut’s largest franchisee with ~1,225 units, NPC International, filed for
bankruptcy in July 2020, noting high levels of debt – NPC represented a meaningful 17% of the
US store base
151

0
10
20
30
40
50
60
Piz
za H
ut
Jack
in t
he B
ox
Tac
o B
ell
Wendy'
s
Burg
er
Kin
g
Dunkin
'
Popeye
s
Dom
ino's
McD
onald
's
KF
C
Papa J
ohn's
Tim
Hort
ons
Canada
Ave
rage #
Sto
res
Per
Fra
nch
isee
Size matters – bigger is not always betterComposition of franchise systems
Franchise operators across US brands in our coverage operate anywhere from 5-55 units on
average, with Papa John’s the most fragmented with an average of ~5 units per franchisee, and
Pizza Hut the least fragmented with ~55 units per franchisee (though averages could be misleading)
– The largest franchisee of each brand operates ~100 units (McDonald’s) to 1,000+ units (Pizza
Hut, Burger King), with large franchise organizations often operating multiple brands
Some systems limit the units that can be operated by a single entity to mitigate concentration risk –
Wendy’s franchisees can operate up to 400 units & Taco Bell limits organic growth to 225-250 units
152
# of Stores Operated by Largest Franchisee in System Average # Stores Per Franchisee
0
200
400
600
800
1,000
1,200
1,400
1,600
1,800
Piz
za H
ut
Wendy'
s
Burg
er
Kin
g
KF
C
Popeye
s
Jack
in t
he B
ox
Tac
o B
ell
Dunkin
'
Papa J
ohn's
Dom
ino's
McD
onald
's
Units
Primary Brand Other Brands
Source: Franchise Disclosure Documents, Company websites, Credit Suisse estimates

Source: Company data, Franchise Disclosure Documents, Restaurant Research Journal, Credit Suisse estimates
Franchisees benefitted from PPP loansSupporting 2020 unit economics
Average Loan per Franchisee ($000s)Average Loan per Store ($000s)
Despite 2020 challenges, the majority of franchisees were eligible for the Paycheck Protection
Program (PPP) through the CARES Act, which offered a forgivable loan amount equal to 2.5 months
of last year’s payroll, up to $10MM per company – a windfall for franchisees that in many cases,
could support FCF in excess of 2019 levels
Assuming an AUV of $1MM and ~30% labor rate, franchisees should have received ~$60K per
restaurant, likely qualifying up to 100-150 restaurants per system before reaching the $10MM max
We believe the majority of QSR franchisees were ineligible for the second round of PPP loans
153
$1,157
$1,849 $2,037
$1,992
$1,313
$717 $561
$382 $573
$3,068
$225
$0
$500
$1,000
$1,500
$2,000
$2,500
$3,000
$3,500
McD
onald
's
Wendy'
s
Tac
o B
ell
Jack
in t
he B
ox
Burg
er
Kin
g
Popeye
s
Dom
ino's
KF
C
Dunkin
'
Piz
za H
ut
Papa J
ohn's
Ave
rage L
oan p
er
Fra
nch
isee (
$0
00
s)$176
$101 $100 $95 $90 $88
$71 $69 $65 $55 $49
$0
$20
$40
$60
$80
$100
$120
$140
$160
$180
$200
McD
onald
's
Wendy'
s
Taco
Bell
Jack
in t
he B
ox
Burg
er
Kin
g
Popeye
s
Dom
ino's
KF
C
Dunkin
'
Piz
za H
ut
Papa J
ohn's
Ave
rage L
oan p
er
Sto
re (
$00
0s)

57
99 100 106 111 113
141 145 153
182
206
0
50
100
150
200
250
McD
onald
's
Wendy'
s
Taco
Bell
Jack
in t
he B
ox
Burg
er
Kin
g
Popeye
s
Dom
ino's
KF
C
Dunkin
'
Piz
za H
ut
Papa J
ohn's
Max
# S
tore
s P
er
Fra
nch
isee 51% 50%
47%45%
36%
26%
17%
3% 3% 1% 0%0%
10%
20%
30%
40%
50%
60%
Piz
za H
ut
Tac
o B
ell
Wendy'
s
Burg
er
Kin
g
KF
C
Popeye
s
Jack
in t
he B
ox
Dunkin
'
Dom
ino's
McD
onald
's
Papa J
ohn's
% U
S F
ranch
ise S
tore
Base
Source: Company data, Franchise Disclosure Documents, Restaurant Research Journal, Credit Suisse estimates
Size mattered with PPP loansLarge franchise operators likely maxed-out
% US Franchise Store Base That Likely Reached $10MM Max LoanMax # Stores Per Franchisee Before Reaching $10MM Loan Max
But averages could be misleading, as there are very large operators in some of these systems, with
many operating multiple chains – and they likely only received a portion of payroll needs given the
$10MM maximum loan cap – based on our review (including all brands operated by each
franchisee, as the loan applies to the overall enterprise), Pizza Hut, Taco Bell, Wendy’s, Burger
King, KFC & Popeyes have the greatest composition of their store bases run by large operators
We estimate ~40-50% of YUM, WEN & QSR US franchisees maxed-out on the $10MM loan,
while nearly all of PZZA, MCD, DPZ & Dunkin franchisees should have received the full loan
154

Snapshot of largest US franchise operators
155
Source: Franchise Times, Company data, Credit Suisse estimatesNote: Reflects pro forma Flynn Restaurant Group. Flynn Restaurant Group has agreed to acquire NPC International’s 925+ Pizza Hut units and approximately half of NPC’s ~393 Wendy’s units, with the deal expected to close by 2Q21.
Company Sales Units Brands
Flynn Restaurant Group ~$3.5BN ~2,350 Applebee's, Arby's, Taco Bell, Panera, Pizza Hut, Wendy's
Carrols Restaurant Group ~$1.5BN ~1,100 Burger King, Popeyes
Dhanani Group $1-1.5BN ~850 Burger King, Popeyes, La Madeleine
Sun Holdings ~$1BN ~550 Burger King, Popeyes, Arby's
MUY! Companies ~$1BN 750-800 Pizza Hut, Wendy's, Taco Bell
KBP Investments $900-950MM ~900 KFC, Taco Bell
Summit Restaurant Group $800MM ~450 IHOP, Applebee's, Sonny's
Covelli Enterprises $650-700MM 300-350 Panera, Dairy Queen, O'Charley's
Pacific Bells ~$650MM ~300 Taco Bell, Buffalo Wild Wings
GPS Hospitality $600-650MM ~500 Burger King, Pizza Hut, Popeyes
Yadav Enterprises ~$600MM 350-400 Jack in the Box, Denny's, TGI Fridays
Tacala ~$500MM 300-350 Taco Bell, KFC, Yum! Multi
Manna ~$500MM 250-300 Wendy's, Fazoli's, Golden Corral
K-Mac Enterprises $450-500MM ~300 Taco Bell, Golden Corral, Yum! Multi
Meritage Hospitality $450-500MM 300-350 Wendy's
WKS Restaurant Group $450-500MM ~250 Denny's, El Pollo Loco, Wendy's
Doherty Enterprises $450-500MM ~150 Applebee's, Panera, Quaker Steak & Lube
Ampex Brands $400-450MM 350-400 KFC, Pizza Hut, Long John Silver's
Sizz ling Platter $400-450MM ~400 Little Caesars, Wingstop, Dunkin'

Franchisee relationshipsAlignment is necessary for success
Success for a franchised system is predicated on franchisee relationships – franchisors and
franchisees need to build trust, develop good communication and establish goals that are well aligned
– Franchisors rely on franchisees to execute common strategies and invest to grow the business
When correspondence with management is unsuccessful, franchisees often leverage the media as a
last resort to progress their agenda – though this could lead to unintended consequences, escalating
the conflict, adding more distractions and potentially weighing on consumer sentiment
In recent years, we have seen several instances of franchisee friction, which is generally initiated
following sluggish SSS and/or increased cost pressures and investment requirements:
Subway
Subway franchisees have been facing years of weak sales and profits amidst a number of
management changes, a unit growth approach that has led to cannibalization across different
franchisees, media scandals and an overall strategy that has failed to be relevant
Franchisees have been pushing back on value promotions, noting the infamous $5 Footlong
promotion is largely unprofitable
– In June 2020, 75% of franchisees surveyed by the North American Association of Subway
Franchisees (NAASF) indicated they opposed a 2-for-$10 Footlong promotion planned for the
summer, noting the survey represented ~3,000 franchisees with ~11,000 restaurants,
suggesting at least ~1/3 of Subway restaurants were opposed to the promotion
156

Franchisee relationshipsAlignment is necessary for success
McDonald’s
The National Owners Association (NOA), an independent franchise association comprised of
McDonald’s franchisees, was formed in 2018 as an independent advocacy organization reportedly
representing 80%+ of McDonald’s US franchisees – the NOA is the first independent organization
of operators in the history of the McDonald’s business
– At that time, franchisees seemed to be unhappy with lackluster returns from the expensive
EOTF remodel program, a national value strategy that was weighing on margins and an
increasing control shift from local to national
– In response, McDonald’s improved the down time related to remodels, extended the timeline for
remodels and modified its national value program to increase local market flexibility
In December 2020, management informed franchisees of incremental charges for technology &
people and plans to remove a 30-year Happy Meal subsidy, resulting in friction as franchisees felt
there was a lack of communication, and suggesting they could be reluctant to push value in 2021
Jack in the Box
In 2018, the National Jack in the Box Franchisee Association (NFA), which represents ~95% of
franchisees, sued corporate and communicated a vote of “no confidence,” requesting the Board
replace the leadership team, citing lack of a strategy following several years of sluggish sales
– In December 2019, CEO Lenny Comma resigned from the company
– In November 2020, the NFA and Jack in the Box settled a nearly two year lawsuit
157
Franchisee relationshipsAlignment is necessary for success
Tim Hortons
In 2017, franchisees publicly discussed dissent with management amidst sluggish sales, margin
degradation, cost cuts and several management changes following the merger with Burger King at
the end of 2014
– RBI CEO, Daniel Schwartz, took over the reigns at Tim Hortons in 2017, and soon after
appointed Alex Macedo as President of Tim Hortons; Axel Schwan was promoted to President
of Tim Hortons two years later
Over the last two years, Tim Hortons has made a number of management changes in an effort to
improve franchisee relationships and performance – based on our conversations with franchisees, it
appears they are pleased with the additions, and management appears to have increased its
communication with franchisees
158

Franchise fees across brandsRoyalty & marketing fees
Franchise royalty fees average ~4-6% across our coverage, with McDonald’s & Wendy’s charging
~4%, and Pizza Hut & Dunkin’ at the high end at ~6%
– We also note several franchisors lease the land/building, earning an additional fee/spread, with
McDonald’s most notably the landlord for the majority of US franchisees, while Wendy’s, Jack in
the Box and Burger King also have large real estate portfolios
Franchise marketing fees average ~5% across our coverage, ranging from ~4-7%, with most
requiring national fund contributions, as well as local contributions (which appear to vary more)
159
Marketing Fee by BrandRoyalty Fee by Brand
Source: Company data, Franchise Disclosure Documents, Credit Suisse estimates
0.0%
1.0%
2.0%
3.0%
4.0%
5.0%
6.0%
7.0%
Piz
za H
ut
Dunkin
'
Tac
o B
ell
Dom
ino's
Popeye
s
Jack
in t
he B
ox
Papa J
ohn's
Burg
er
Kin
g
KF
C
Wendy'
s
McD
onald
's
Roya
lty F
ee
0.0%
1.0%
2.0%
3.0%
4.0%
5.0%
6.0%
7.0%
8.0%
9.0%
Piz
za H
ut
Dunkin
'
Taco
Bell
Dom
ino's
Popeye
s
Jack
in t
he B
ox
Papa J
ohn's
Burg
er
Kin
g
KF
C
Wendy'
s
McD
onald
's
Mark
etin
g F
ee
National Marketing Local Marketing
Note: Local Marketing fees vary by market.

Company HighlightMcDonald’s
Franchise EBITDA per Store ($000s)Franchise AUVs ($000s)
McDonald’s AUVs have increased by ~2-2.5% per year over the last nine years, though AUVs
accelerated more recently, with an increase of ~4% over the last three years (2017-2019)
We estimate the average McDonald’s restaurant generated ~$420K in EBITDA in 2019
We believe McDonald’s will generate peak AUVs and EBITDA in 2020, noting gross margins have
shown solid improvement in 2020 amidst menu streamlining and lobby closures, even with
incremental COVID-related costs; we also believe the vast majority of franchisees received PPP
loans, further bolstering profitability
160
$2,000
$2,200
$2,400
$2,600
$2,800
$3,000
$3,200
2010 2011 2012 2013 2014 2015 2016 2017 2018 2019
AU
Vs
($00
0s)
$300
$320
$340
$360
$380
$400
$420
$440
2010 2011 2012 2013 2014 2015 2016 2017 2018 2019
Fra
nch
isee E
BIT
DA
per
Sto
re (
$00
0s)
Source: Company data, Franchise Disclosure Documents, Credit Suisse estimates

Company HighlightDomino’s
Domino’s frequently highlights the strength of its franchisee relationships and the uniqueness of its
franchise base, with 95%+ of franchise owners having started in a Domino’s restaurant and the vast
majority solely dedicated to operating Domino’s restaurants
Over the years, the franchise base has become more consolidated, with the average franchisee
operating ~7 stores, compared to an average of ~4 stores 10+ years ago
In 2020, the average Domino’s store generated $158K+ in EBITDA and the average franchisee
generated $1MM+ of EBITDA at an enterprise level, noting consistent increases for 10+ years
161
EBITDA per Franchisee ($000s)Franchise EBITDA per Store ($000s)
$20
$40
$60
$80
$100
$120
$140
$160
$180
200
8
200
9
201
0
201
1
201
2
201
3
201
4
201
5
201
6
201
7
201
8
201
9
202
0E
Fra
nch
isee E
BIT
DA
per
Sto
re (
$00
0s)
$50
$250
$450
$650
$850
$1,050
$1,250
200
8
200
9
201
0
201
1
201
2
201
3
201
4
201
5
201
6
201
7
201
8
201
9
202
0E
EB
ITD
A p
er
Fra
nch
isee (
$00
0s)
Source: Company data, Franchise Disclosure Documents, Credit Suisse estimates

Company HighlightJack in the Box
Franchisee Operating Income by AUV ($000s)Franchisee Operating Income ($000s) & Margin %
Franchisee operating income and margins have decreased over the last couple of years amidst
ongoing cost pressures, noting 40%+ of Jack in the Box’s store base is concentrated in California,
which has among the highest wage costs in the country
As expected, the higher the AUV, the higher the operating income
– Units in CA appear to be the most profitable, as nearly 65% of units with AUVs of more than
$1.5MM are located in CA
– For contrast, 45% of units with AUVs <$1.25MM are located in TX (vs 14% in CA)
162
8.0%
8.5%
9.0%
9.5%
10.0%
10.5%
11.0%
11.5%
12.0%
$120
$130
$140
$150
$160
$170
$180
FY17 FY18 FY19
Opera
ting M
arg
in
Opera
ting Inco
me (
$00
0s)
Operating Income Operating Margin
0%
5%
10%
15%
20%
25%
30%
35%
($100)
($50)
$0
$50
$100
$150
$200
$250
$300
% o
f F
ranch
ise B
ase
Opera
ting Inco
me (
$00
0s)
AUVOperating Income % of Franchise Base
Source: Company data, Franchise Disclosure Documents, Credit Suisse estimates

Company HighlightPopeyes
Restaurant Profit ($000s) & Restaurant MarginFranchise AUVs ($000s)
Popeyes franchise AUVs increased by low double-digits in 2019 following the launch of the chicken
sandwich in 2H19, with further growth in 2020 as SSS have trended at ~20-30%
Profitability has also shown notable improvement, with franchisees generating their best year of
profit in 2019, and should show further increases in 2020
Improving new unit economics and positioning in a relevant chicken category should support an
increased appetite for unit growth, noting RBI has highlighted strong interest among franchisees
163
$1,000
$1,100
$1,200
$1,300
$1,400
$1,500
$1,600
$1,700
2013 2014 2015 2016 2017 2018 2019
AU
Vs
($000s)
20.0%
20.5%
21.0%
21.5%
22.0%
22.5%
23.0%
23.5%
$200
$220
$240
$260
$280
$300
$320
$340
$360
$380
2013 2014 2015 2016 2017 2018 2019
Rest
aura
nt
Marg
in
Rest
aura
nt
Pro
fit
($00
0s)
Restaurant Profit Restaurant Margin
Source: Company data, Franchise Disclosure Documents, Credit Suisse estimates

164
Breakfast Battle

Cracking the breakfast eggRecapturing the most important meal of the day
Breakfast has historically represented 20%+ of QSR daypart sales and likely an even greater
percentage of traffic given lower ticket transactions
Throughout the majority of 2020, the breakfast daypart faced significant challenges, with the
habitual nature of the occasion with generally high-traffic, lower-ticket transactions more susceptible
to outsized declines from reductions in commuter traffic and changes in customer behavior
While we recognize there are concerns that the breakfast daypart will be permanently impaired, we
believe fears are overblown, noting the high frequency nature of the occasion suggests challenges
are more a function of disruption to routine than a change in demand, and we would expect
customers to reestablish old habits into new routines as visibility into the future improves
Our confidence in the recovery of the breakfast daypart is supported by:
1) Ongoing daypart recovery & opportunities for increased marketing & traffic-driving initiatives
2) Underlying demand for breakfast
3) Decelerating growth of at home breakfast food & coffee sales
4) Expectation that the majority of the US workforce will return to offices (with increased flexibility)
165

Pre-COVID Breakfast StoryAttractive proposition, but not easy to penetrate
Despite strong breakfast traffic growth in the industry over the last several years, traditional QSRs
have not appeared to share in the gains – ~50% of McDonald’s traffic loss has been at breakfast
over the last five years, Burger King has failed to push its breakfast mix beyond 15% and Wendy’s
just recently entered the breakfast game in its fourth attempt at the daypart
Heightened competition from nontraditional players (C-stores) and growth of national coffee players
(Starbucks & Dunkin’), slower drive-thru times and a pullback in discounting/aggressive promotions
have likely been factors weighing on traditional QSR breakfast
Considerations for Breakfast:
– Habitual – the habitualness of breakfast makes it a blessing and a curse – creating loyalty in a
traditionally disloyal industry, but that also makes it difficult to change behaviors
– Local/Regional – breakfast is not “one size fits all” (South prefers biscuits, West prefers muffins)
– Location – with the majority of QSR sales at the drive-thru (skew even higher at breakfast),
location of stores are critical (McDonald’s selects A sites on right side of road)
– Coffee – primary driver of breakfast traffic is coffee (McDonald’s noted coffee as the primary
driver at breakfast; Burger King guests have indicated coffee is the main traffic driver &
credibility in coffee is necessary to drive breakfast gains)
– Hero Item – one hand, easy to eat product necessary (e.g., egg McMuffin)
166

Source: Technomic, FDDs, Restaurant Research Journal, Company data, Credit Suisse estimates
Considerations in the QSR breakfast landscapeBreakfast businesses range in size
US Breakfast Mix by ConceptUS Breakfast Sales by Concept
We estimate breakfast represents ~20% of sales or ~$35BN among 20 of the largest QSR chains
– Among the 30 largest QSR competitors, we believe half have substantial breakfast businesses
(range from ~5-60% of sales), while the other half don’t offer breakfast at a national level
McDonald’s generates the largest breakfast business in QSR (ex-coffee), with a ~25% sales mix
representing a ~$10BN sales layer, nearly the same size as the entire Burger King US system
– Compares to ~15% at Burger King (~$1.5BN), ~23% at Jack in the Box (~$800MM), ~8% at
Wendy’s ($750-800MM), 6-7% at Taco Bell ($700-750MM) & ~12% at Sonic (~$550MM)
167
$0.0
$2.0
$4.0
$6.0
$8.0
$10.0
$12.0
Sta
rbuck
s
McD
onald
's
Dunkin
'
Chic
k-f
il-A
Burg
er
Kin
g
Hard
ee's
Jack
in t
he B
ox
Wendy'
s
Tac
o B
ell
Sonic
Boja
ngle
s'
Carl'
s Jr.
Krisp
y K
rem
e
Dairy
Queen
Arb
y's
Bre
akfa
st S
ale
s ($
BN
)
0%
10%
20%
30%
40%
50%
60%
70%
Sta
rbuck
s
McD
onald
's
Dunkin
'
Chic
k-f
il-A
Burg
er
Kin
g
Har
dee's
Jack
in t
he B
ox
Wendy'
s
Tac
o B
ell
Sonic
Boja
ngle
s'
Carl'
s Jr.
Kris
py
Kre
me
Dairy
Queen
Arb
y's
Bre
akfa
st S
ale
s M
ix
Note: Wendy’s reflects estimated breakfast mix of ~8%.

Breakfast underperforms in 2020Though not all bad news
2020 was expected to be the year of the breakfast battle as Wendy’s March 2020 launch of
breakfast was a catalyst for the industry to prepare for intensified competition
– McDonald’s highlighted breakfast chatter had galvanized the system with plans to revitalize
breakfast with more aggressive value, improved drive-thru service and a refocus on beverages
As consumption patterns changed, favoring larger order sizes and fewer trips, breakfast experienced
outsized losses for a daypart heavily reliant on high-traffic, low-ticket occasions
Many companies reduced marketing allocated toward breakfast given lower expected returns, with
coffee companies shifting more focus to the afternoon and traditional QSRs to lunch/dinner, with
many across the space reducing hours because of low traffic in early morning hours
Companies’ morning strategies have varied widely since the onset of the pandemic, and we expect
learnings will contribute to breakfast strategies in 2021 and going forward
– McDonald’s continued its efforts at the drive-thru, streamlining its menu, including the elimination
of All Day Breakfast; breakfast SSS turned positive in September
– Taco Bell reduced operating hours, condensing the availability of its breakfast offerings or in
some cases, eliminating breakfast from the menu
– Wendy’s launched breakfast as planned in early March, though corporate invested ~$15MM in
2H20 (vs $50MM originally planned) & abated franchisee breakfast marketing fund contributions
– Dunkin’ reduced operating hours and launched new menu items appealing to the afternoon
– Starbucks closed more than 50% of its US company-operated store base at the height of the
pandemic
168
Resuming breakfast battle in 2021Heightened competition for loyalty & frequency
We expect competition to intensify in 2021 as restaurants look to recover lost traffic, sales & profit,
and the likely perception that they are competing for a smaller breakfast pie
In July 2020, Wendy’s launched a rewards program nationally, which we expect will lead others to
follow suit, noting McDonald’s has already announced plans to roll out loyalty in 2021
– We believe loyalty programs could enhance competitiveness of traditional QSRs at breakfast
given the strong contribution from loyalty to coffee players Starbucks & Dunkin’
Wendy’s plans to increase marketing dollars allocated toward breakfast, with franchisees to resume
marketing fund contributions for breakfast (Wendy’s abated marketing fund contributions in 2020 to
provide relief to franchisees) & corporate to contribute incremental advertising dollars
In September 2020, Starbucks launched Stars for Everyone, a tender agnostic program allowing
members to earn rewards irrespective of payment method, unlocking friction caused by requiring
customers to preload Starbucks cards
McDonald’s remains committed to the breakfast daypart, noting improved drive-thru service times
should help (higher drive-thru utilization during breakfast), as well as local value toward breakfast
and impactful innovation
Burger King has suggested an increased focus on breakfast in 2021, supported by a greater
allocation of marketing dollars and new menu innovation
Panera introduced an unlimited coffee subscription in February 2020 for $8.99/month as a way to
increase frequency at a compelling value to customers; the initial pilot of the subscription program
increased frequency by 200%+ and food attachment to 70% for subscribers
169

Ongoing breakfast recoveryFocus on reestablishing routines
Breakfast has faced outsized challenges throughout the pandemic given the habitual nature of the
daypart that is more reliant on high frequency, single-person transactions
That said, breakfast has recovered over the last several months, albeit at a slower pace than other
dayparts, with the morning transaction underperformance gap decreasing at the end of May and
into June as restrictions were lifted
170
Source: WSJ/NPD, Credit Suisse
QSR Morning vs Total TransactionsQSR Morning & Total Transactions
-20%
-15%
-10%
-5%
0%
5%
10%
2-F
eb
16-F
eb
1-M
ar
15-M
ar
29-M
ar
12-A
pr
26-A
pr
10-M
ay
24-M
ay
7-J
un
21-J
un
5-J
ul
19-J
ul
2-A
ug
16-A
ug
30-A
ug
13-S
ep
27-S
ep
11-O
ct
25-O
ct
Morn
ing v
s Tota
l Tra
nsa
ctio
ns
-60%
-50%
-40%
-30%
-20%
-10%
0%
10%
2-F
eb
16-F
eb
1-M
ar
15-M
ar
29-M
ar
12-A
pr
26-A
pr
10-M
ay
24-M
ay
7-J
un
21-J
un
5-J
ul
19-J
ul
2-A
ug
16-A
ug
30-A
ug
13-S
ep
27-S
ep
11-O
ct
25-O
ct
Tra
nsa
ctio
ns
Total Transactions Morning Transactions
Morning transactions meaningfully
underperformed from mid-March through June
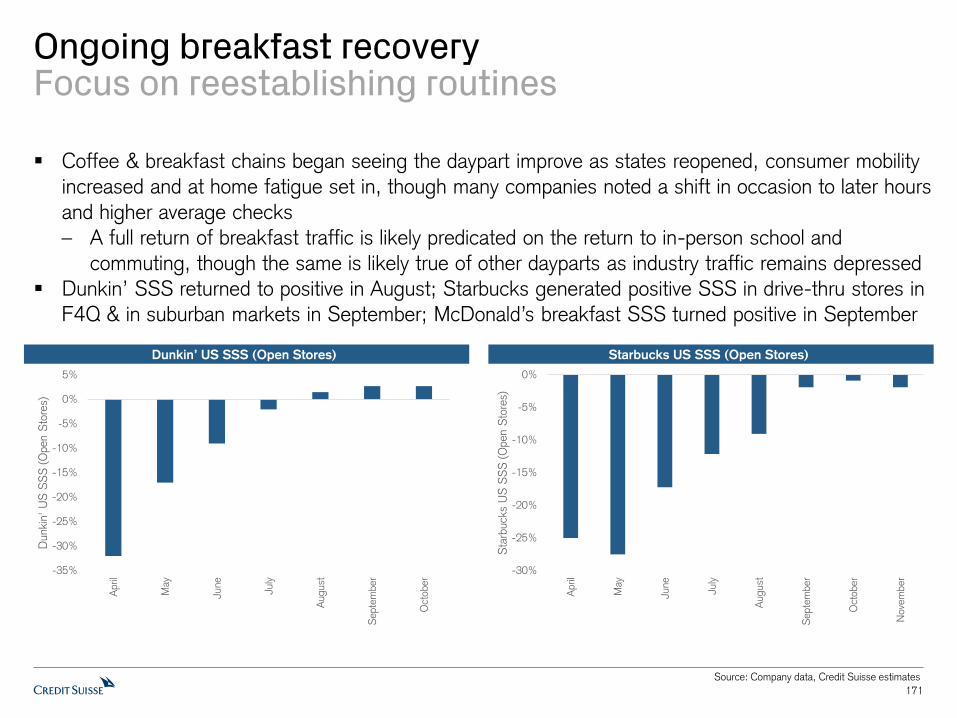
Ongoing breakfast recoveryFocus on reestablishing routines
Coffee & breakfast chains began seeing the daypart improve as states reopened, consumer mobility
increased and at home fatigue set in, though many companies noted a shift in occasion to later hours
and higher average checks
– A full return of breakfast traffic is likely predicated on the return to in-person school and
commuting, though the same is likely true of other dayparts as industry traffic remains depressed
Dunkin’ SSS returned to positive in August; Starbucks generated positive SSS in drive-thru stores in
F4Q & in suburban markets in September; McDonald’s breakfast SSS turned positive in September
171
Source: Company data, Credit Suisse estimates
Starbucks US SSS (Open Stores)Dunkin’ US SSS (Open Stores)
-35%
-30%
-25%
-20%
-15%
-10%
-5%
0%
5%
April
May
June
July
August
Septe
mber
Oct
ober
Dunkin
' U
S S
SS
(O
pen S
tore
s)
-30%
-25%
-20%
-15%
-10%
-5%
0%
April
May
June
July
August
Septe
mber
Oct
ober
Nove
mber
Sta
rbuck
s U
S S
SS
(O
pen S
tore
s)

Ongoing breakfast recoveryAsset base considerations
Performance of drive-thru stores has meaningfully outpaced non-drive thru stores supported by
increased demand for convenient access with limited interaction, as well as the impact from
consumers exiting urban markets in favor of suburban areas, likely leading to sales transfer outside of
metro regions
Dunkin’ drive-thru locations generated double-digit SSS in 3Q (~70% of Dunkin’s asset base has
drive-thrus), accelerating from positive mid-single-digit SSS in the last two weeks of 2Q
– Stores in newer markets with higher drive-thru penetration (~90% of stores in newer markets
have drive-thrus) have performed better, with Dunkin’ noting stores in the Midwest, Southwest &
West had double-digit SSS in 2Q & 3Q
– In contrast, stores in urban markets have been more challenged, with Dunkin’ noting it was
offering select financial assistance programs to franchisees in these networks
Starbucks drive-thru locations had positive SSS in F4Q and suburban locations turned positive in the
month of September (~60% of Starbucks’ asset base has drive-thrus)
– Stores in urban markets have been a drag on the system, with SBUX noting closed stores (~3%
of US company-operated base) in urban markets were a ~2% drag to SSS in F4Q
172
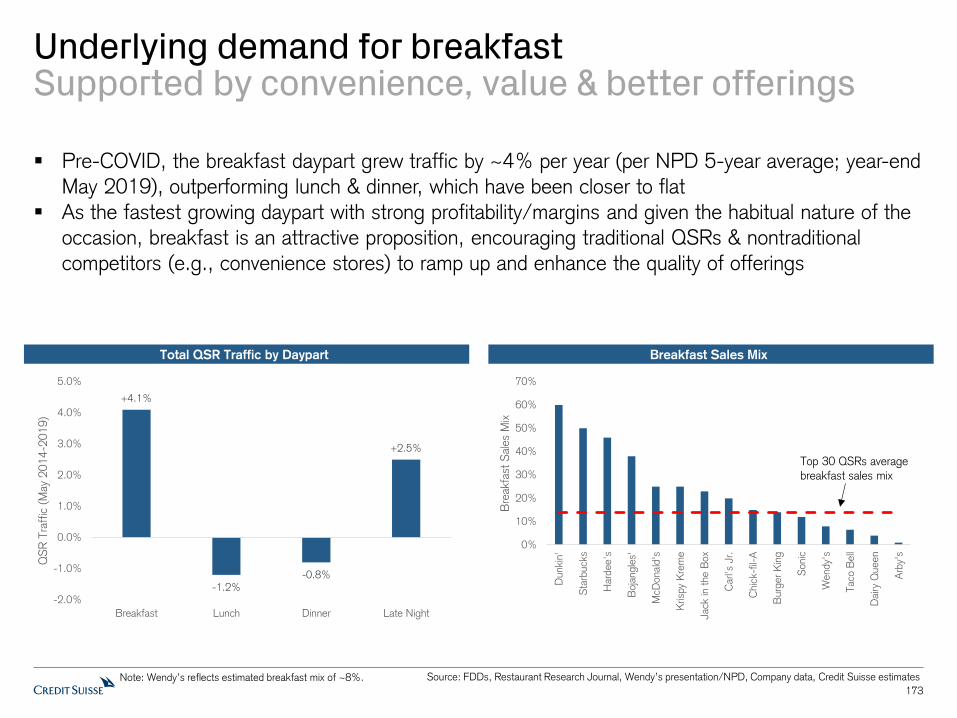
Underlying demand for breakfastSupported by convenience, value & better offerings
Pre-COVID, the breakfast daypart grew traffic by ~4% per year (per NPD 5-year average; year-end
May 2019), outperforming lunch & dinner, which have been closer to flat
As the fastest growing daypart with strong profitability/margins and given the habitual nature of the
occasion, breakfast is an attractive proposition, encouraging traditional QSRs & nontraditional
competitors (e.g., convenience stores) to ramp up and enhance the quality of offerings
173
Source: FDDs, Restaurant Research Journal, Wendy’s presentation/NPD, Company data, Credit Suisse estimates
Breakfast Sales MixTotal QSR Traffic by Daypart
+4.1%
-1.2%-0.8%
+2.5%
-2.0%
-1.0%
0.0%
1.0%
2.0%
3.0%
4.0%
5.0%
Breakfast Lunch Dinner Late Night
QS
R T
raff
ic (
May
201
4-2
019)
Note: Wendy’s reflects estimated breakfast mix of ~8%.
0%
10%
20%
30%
40%
50%
60%
70%
Dunkin
'
Sta
rbuck
s
Hard
ee's
Boja
ngle
s'
McD
onald
's
Kris
py
Kre
me
Jack
in t
he B
ox
Carl'
s Jr.
Chic
k-f
il-A
Burg
er
Kin
g
Sonic
Wendy'
s
Tac
o B
ell
Dairy
Queen
Arb
y's
Bre
akfa
st S
ale
s M
ix
Top 30 QSRs average
breakfast sales mix
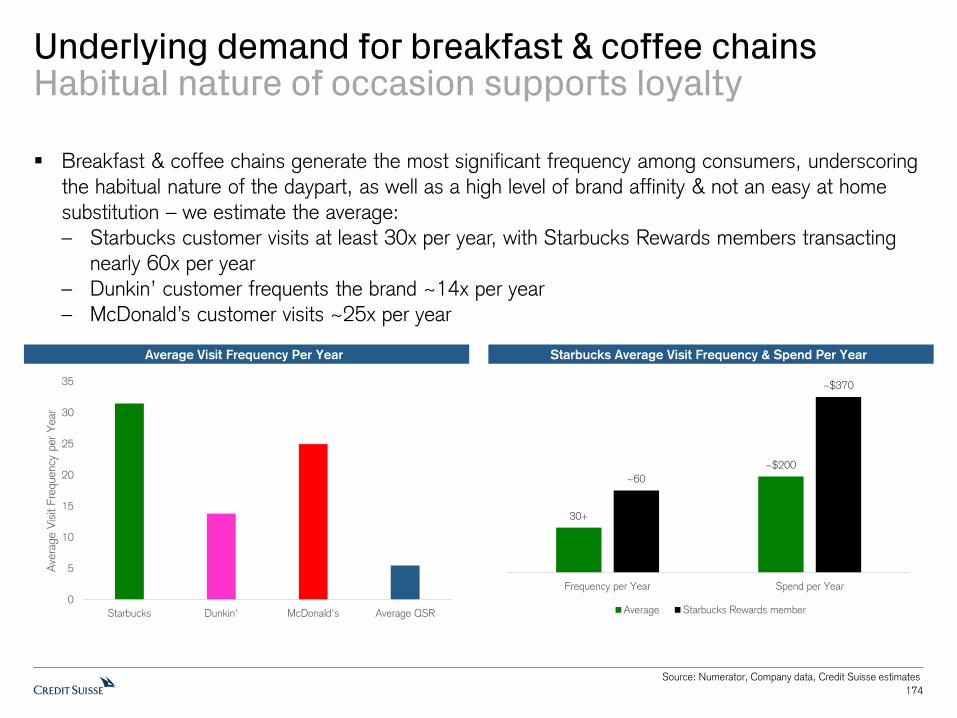
Underlying demand for breakfast & coffee chainsHabitual nature of occasion supports loyalty
Breakfast & coffee chains generate the most significant frequency among consumers, underscoring
the habitual nature of the daypart, as well as a high level of brand affinity & not an easy at home
substitution – we estimate the average:
– Starbucks customer visits at least 30x per year, with Starbucks Rewards members transacting
nearly 60x per year
– Dunkin’ customer frequents the brand ~14x per year
– McDonald’s customer visits ~25x per year
174
Source: Numerator, Company data, Credit Suisse estimates
Starbucks Average Visit Frequency & Spend Per YearAverage Visit Frequency Per Year
0
5
10
15
20
25
30
35
Starbucks Dunkin' McDonald's Average QSR
Ave
rage V
isit
Fre
quency
per
Year
30+
~$200
~60
~$370
Frequency per Year Spend per Year
Average Starbucks Rewards member
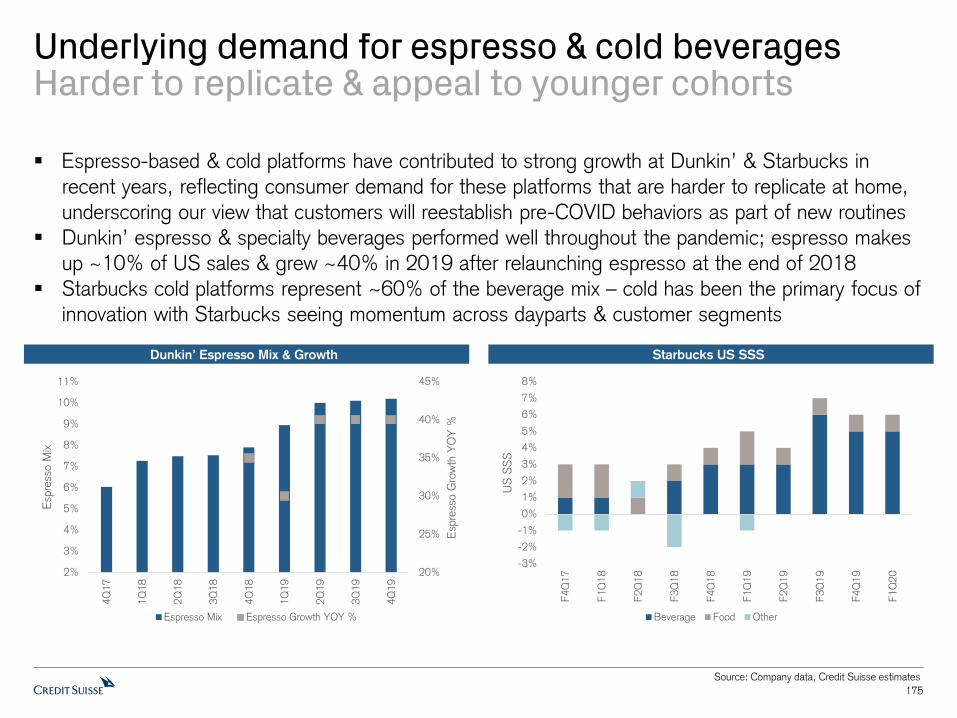
Underlying demand for espresso & cold beveragesHarder to replicate & appeal to younger cohorts
Espresso-based & cold platforms have contributed to strong growth at Dunkin’ & Starbucks in
recent years, reflecting consumer demand for these platforms that are harder to replicate at home,
underscoring our view that customers will reestablish pre-COVID behaviors as part of new routines
Dunkin’ espresso & specialty beverages performed well throughout the pandemic; espresso makes
up ~10% of US sales & grew ~40% in 2019 after relaunching espresso at the end of 2018
Starbucks cold platforms represent ~60% of the beverage mix – cold has been the primary focus of
innovation with Starbucks seeing momentum across dayparts & customer segments
175
Source: Company data, Credit Suisse estimates
Starbucks US SSSDunkin’ Espresso Mix & Growth
20%
25%
30%
35%
40%
45%
2%
3%
4%
5%
6%
7%
8%
9%
10%
11%
4Q
17
1Q
18
2Q
18
3Q
18
4Q
18
1Q
19
2Q
19
3Q
19
4Q
19
Esp
ress
o G
row
th Y
OY
%
Esp
ress
o M
ix
Espresso Mix Espresso Growth YOY %
-3%
-2%
-1%
0%
1%
2%
3%
4%
5%
6%
7%
8%
F4Q
17
F1Q
18
F2Q
18
F3Q
18
F4Q
18
F1Q
19
F2Q
19
F3Q
19
F4Q
19
F1Q
20
US
SS
S
Beverage Food Other

Underlying demand for coffeeIncreased consumption of specialty beverages
Based on US coffee consumption data from the National Coffee Association, daily coffee
consumption has been relatively stable over the last few years after stepping up in 2017 – 62% of
Americans reported drinking coffee within the past day of the 2020 survey, relative to 57% in 2015
But what Americans are consuming is changing, with increased consumption of espresso-based &
non-espresso based beverages (e.g., cold brew, nitro) instead of traditional coffee
Trends are more pronounced among younger cohorts, with 27.5% of respondents under 40
drinking espresso-based beverages within the prior day, 10pp higher than the oldest cohort at 17%
176
Source: National Coffee Association, Daily Coffee News, Credit Suisse
Americans Consuming Coffee Within the Past DayAmericans Consuming Coffee Within the Past Day
52%
54%
56%
58%
60%
62%
64%
66%
2015 2016 2017 2018 2019 2020
% R
esp
ondents
Americans consuming coffee within the past day
0%
10%
20%
30%
40%
50%
60%
70%
80%
Average Age 18-24 Age 25-39 Age 40-59 Age 60+
% R
esp
ondents
Americans consuming coffee within the past day
2016 2017

At home breakfast food growth deceleratingSignaling shift back to food away from home
While at home breakfast sales growth remains elevated, growth across categories has decelerated
from highs, with breakfast food sales growth averaging ~11% from March to December and ~7%
for the four weeks ended 12/26, relative to ~0.2% over the three years pre-COVID
– Continued breakfast growth deceleration would support our expectation for an ongoing shift back
to food away from home (albeit near-term, such could reverse temporarily)
177
Source: Nielsen, Credit Suisse estimates
At Home Breakfast Food Sales GrowthAt Home Breakfast Food Sales Growth
Note: Nielsen categories include: Cereal (Ready to Eat), Cereal (Hot), Yogurt, Jellies & Jams, Syrup, Breakfast Foods (Frozen) & Bread & Baked Goods (Fresh).
-5%
0%
5%
10%
15%
20%
25%
30%
1/2
7/1
8
3/2
4/1
8
5/1
9/1
8
7/1
4/1
8
9/8
/18
11/3
/18
12/2
9/1
8
2/2
3/1
9
4/2
0/1
9
6/1
5/1
9
8/1
0/1
9
10/5
/19
11/3
0/1
9
1/2
5/2
0
3/2
1/2
0
5/1
6/2
0
7/1
1/2
0
9/5
/20
10/3
1/2
0
12/2
6/2
0
YO
Y %
-5%
0%
5%
10%
15%
20%
25%
30%
12/2
8/1
9
1/2
5/2
0
2/2
2/2
0
3/2
1/2
0
4/1
8/2
0
5/1
6/2
0
6/1
3/2
0
7/1
1/2
0
8/8
/20
9/5
/20
10/3
/20
10/3
1/2
0
11/2
8/2
0
12/2
6/2
0
YO
Y %
Cereal (Ready to Eat) Cereal (Hot)Yogurt Jellies & JamsSyrup Breakfast Foods (Frozen)Bread & Baked Goods (Fresh)
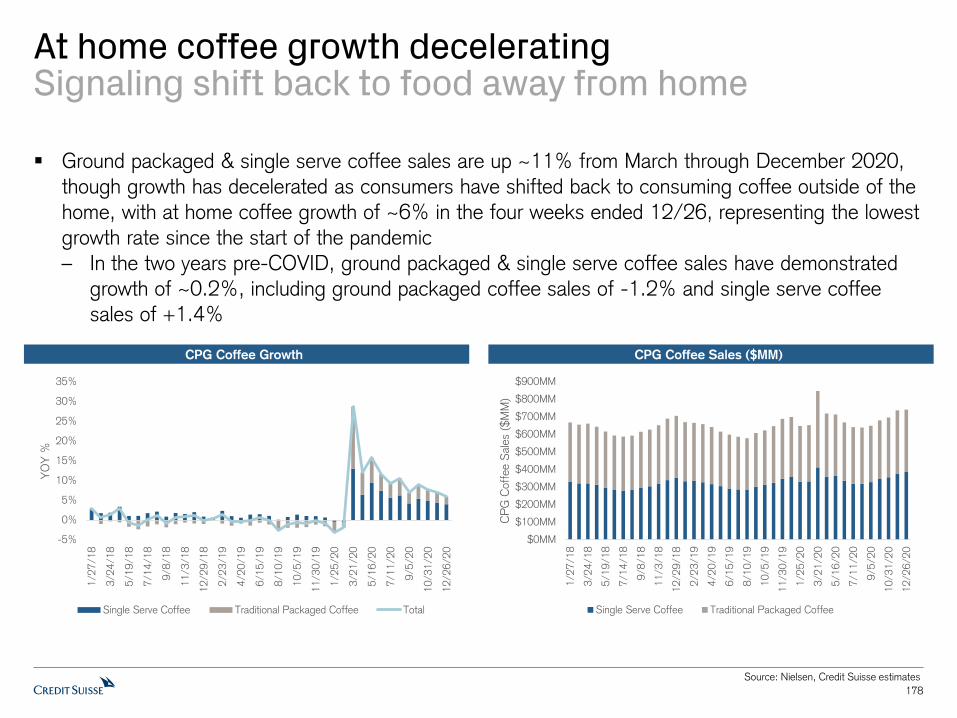
At home coffee growth deceleratingSignaling shift back to food away from home
Ground packaged & single serve coffee sales are up ~11% from March through December 2020,
though growth has decelerated as consumers have shifted back to consuming coffee outside of the
home, with at home coffee growth of ~6% in the four weeks ended 12/26, representing the lowest
growth rate since the start of the pandemic
– In the two years pre-COVID, ground packaged & single serve coffee sales have demonstrated
growth of ~0.2%, including ground packaged coffee sales of -1.2% and single serve coffee
sales of +1.4%
178
Source: Nielsen, Credit Suisse estimates
CPG Coffee Sales ($MM)CPG Coffee Growth
-5%
0%
5%
10%
15%
20%
25%
30%
35%
1/2
7/1
8
3/2
4/1
8
5/1
9/1
8
7/1
4/1
8
9/8
/18
11/3
/18
12/2
9/1
8
2/2
3/1
9
4/2
0/1
9
6/1
5/1
9
8/1
0/1
9
10/5
/19
11/3
0/1
9
1/2
5/2
0
3/2
1/2
0
5/1
6/2
0
7/1
1/2
0
9/5
/20
10/3
1/2
0
12/2
6/2
0
YO
Y %
Single Serve Coffee Traditional Packaged Coffee Total
$0MM
$100MM
$200MM
$300MM
$400MM
$500MM
$600MM
$700MM
$800MM
$900MM
1/2
7/1
8
3/2
4/1
8
5/1
9/1
8
7/1
4/1
8
9/8
/18
11/3
/18
12/2
9/1
8
2/2
3/1
9
4/2
0/1
9
6/1
5/1
9
8/1
0/1
9
10/5
/19
11/3
0/1
9
1/2
5/2
0
3/2
1/2
0
5/1
6/2
0
7/1
1/2
0
9/5
/20
10/3
1/2
0
12/2
6/2
0
CP
G C
off
ee S
ale
s ($
MM
)
Single Serve Coffee Traditional Packaged Coffee

Expect to return to office with more flexibilityImplication for urban markets elusive
The reduction in commuting has had an outsized effect on breakfast given the habitual nature of the
daypart, though we are optimistic that people will return to work on-site, albeit with increased
flexibility, supporting our view that the breakfast daypart is not structurally impaired
Confidence in our view is supported by commentary from companies and surveys conducted
suggesting productivity could be waning, employees want to return to offices and a full work from
home schedule could have negative implications for job satisfaction and culture
We believe the implication for urban markets is more elusive, as an increase in flexibility to work
from home will likely have a negative effect on consumer traffic in metro areas, though the benefit
from sales shift to suburban markets could at least partially offset headwinds
– Darden has noted stronger performance of its high end brands in suburban markets as
occasions shift from urban into suburban regions; Starbucks has also noted similar dynamics
Starbucks is repositioning its portfolio to close underperforming stores in metro markets, and open
smaller, digital-forward pickup stores to complement the asset base – as an example, Starbucks
has indicated it will maintain 79 stores in Midtown Manhattan in the future, though the composition
will change to include 64 café and 15 pickup formats, from 78 café and 1 pickup location in 2019 –
this includes the assumption that the Midtown population will remain at 160K people and the
daytime population will decrease by ~25% to 730K people (from 980K in 2019)
– Notably, Starbucks expects to sustain the same number of stores in Midtown Manhattan, which
could suggest Starbucks expects Manhattan occasions eventually approaches normal levels,
though with less daily commuter traffic amidst increased work flexibility
179

Source: Bureau of Labor Statistics, Credit Suisse estimates
Working from home is not for everyone & not everydayReturn to office with greater flexibility
Work From Home ShiftWork From Home by Income
Based on data from the Bureau of Labor Statistics, pre-COVID, ~45% of US workers were in
occupations where working from home is technologically feasible, of which ~20-25% actually
worked from home, implying ~11% of US workers worked from home to some degree
While enhanced working from home flexibility will be more permanent post-pandemic, such is
concentrated in specific industries where it is feasible
We assume ~50% of employees that transitioned to remote work during the pandemic will continue
to do so to some degree, translating ~to ~28% of the US workforce going at least partially remote
180
0%
10%
20%
30%
40%
50%
60%
70%
80%
Low Income Middle Income High Income
% R
em
ote
Work
by
Inco
me C
ohort
Pre-Pandemic Pandemic Post-Pandemic
0%
10%
20%
30%
40%
50%
60%
70%
80%
90%
100%
Pre-Pandemic Pandemic Post-Pandemic
% o
f U
S W
ork
froce
Remote Work Office Work

Demand to return to work on-siteFostering culture, relationships & productivity
While several large Silicon Valley companies were early to announce plans for prolonged work from
home flexibility, they have also invested billions into campuses intended to enhance creativity, attract
& retain employees, build teamwork and improve the workplace environment
Working remotely also has potential risks & consequences, including reduced creativity, impact on
culture, security implications, mental health impacts, job satisfaction, efficacy of training & more
– Facebook noted ~50% of employees could work remotely over the next 5-10 years, but an internal survey showed 50%+ of employees wanted to return to the office ASAP, and the
company signed a lease for 730K additional square feet of office space in NYC in August
– Amazon announced plans in August to expand across six urban cities, adding 3,500 corporate jobs & 900K square feet of office space, and expects most to eventually return to offices
– Snap CEO Evan Spiegel reportedly expressed concern that some employees found working from home miserable & the concept of knowledge workers working from home indefinitely is
dystopian
– Morgan Stanley CEO James Gorman said a vast majority of employees for a vast majority of their time will continue to work in offices
– Goldman Sachs Chairman & CEO David Solomon has highlighted the importance of culture & benefits from being and working together; President & COO John Waldron has expressed
concerns of decay of productivity over time and plans to invest in culture & development
– Blackstone Chairman & CEO Steve Schwarzman highlighted the importance of being together physically to train new people and reinforce Blackstone’s culture
181
Source: CNBC, WSJ, Credit Suisse

Source: PwC, Credit Suisse
Employees want flexibilityBut they also want to return to work
Employer: Expectations for Working RemotelyEmployee: Frequency of Working Remotely
PwC conducted a survey from 5/29-6/4 among 120 US company executives across three sectors
and 1,200 US officer workers across a range of industries to assess the outlook for the remote
work/office environment
The survey indicates employees are seeking greater flexibility than pre-COVID-19 but want to return
to the office for at least part of the work experience, and employers do not appear to be planning
for structural change to a fully remote workforce
68% of employees said they still want to work from the office at least once per week
182
57%
17%
16%
25%
9%
26%
18%
32%
0% 20% 40% 60% 80% 100%
Before
After
Less than 1 day per week 1-2 days per week 3-4 days per week 5 days per week
How often did you work remotely before COVID-19?
How often would you like to once COVID-19 is no longer a concern?
36%
2%
11%
25%
21%
34%
39%
77%
55%
Pre-COVID-19
During COVID-19
After COVID-19
What % of your office employees do you anticipate will work remotely at least one day a week? (US executives)
Few (0-29% of employees) Many (30-59% of employees) Most (60-100% of employees)

Source: PwC, Credit Suisse
Companies are expanding office spaceSuggesting expectations for a return to office
Employee: Reasons to Return to OfficeEmployer: Office Need Expectations
70% of US executives surveyed by PwC anticipate total office space needs in three years will at
least be the same as current needs, with 51% expecting they will need more office space
Employees also have desire to return to offices, largely for collaboration with teams, as 50% of
employees surveyed indicated the #1 reason they go to work is to collaborate with teams & the #1
reason for being unproductive while working at home is difficulty collaborating with team members
Both employers & employees appear to recognize the value of an in-person team environment
183
3%
12%
15%
19%
26%
16%
9%
Reduce 25%+
Reduce 16-25%
Reduce 5-15%
Stay about the same
Increase 5-15%
Increase 16-25%
Increase 25%+
How do you anticipate your total office space needs will be different three years from now? (executives)
50%
39%
Collaborate with other
team members
Difficulty collaborating
with team members
Why did you work in the office before COVID-19 (#1 reason)? (office workers)
What reasons are you unproductive while working remotely (#1 reason)? (office workers)

184
Chicken Wars
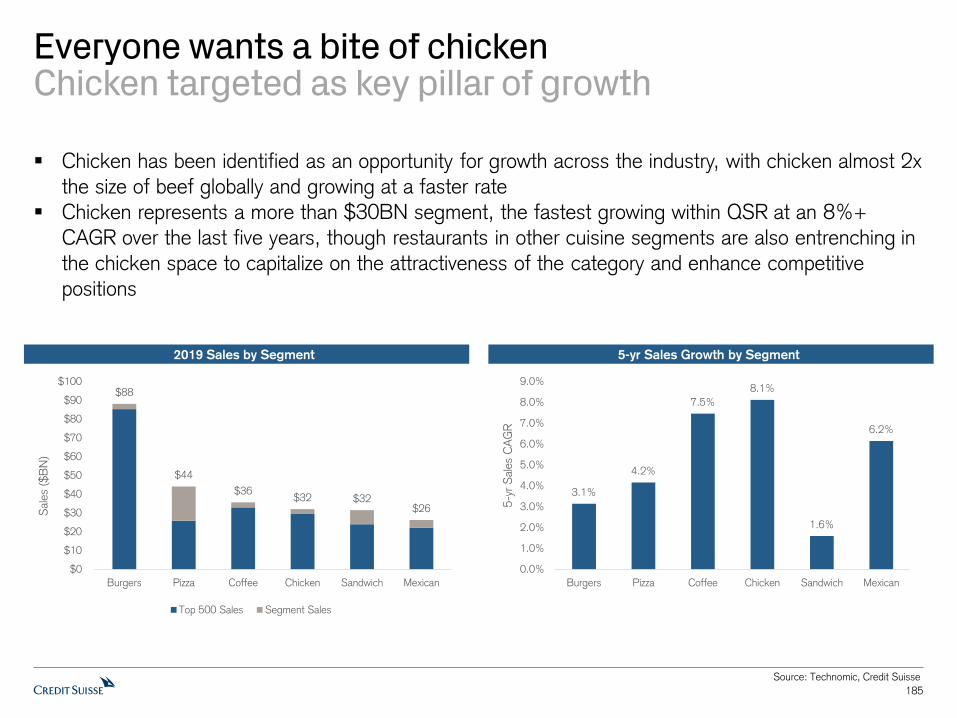
Source: Technomic, Credit Suisse
Everyone wants a bite of chickenChicken targeted as key pillar of growth
5-yr Sales Growth by Segment2019 Sales by Segment
Chicken has been identified as an opportunity for growth across the industry, with chicken almost 2x
the size of beef globally and growing at a faster rate
Chicken represents a more than $30BN segment, the fastest growing within QSR at an 8%+
CAGR over the last five years, though restaurants in other cuisine segments are also entrenching in
the chicken space to capitalize on the attractiveness of the category and enhance competitive
positions
185
3.1%
4.2%
7.5%
8.1%
1.6%
6.2%
0.0%
1.0%
2.0%
3.0%
4.0%
5.0%
6.0%
7.0%
8.0%
9.0%
Burgers Pizza Coffee Chicken Sandwich Mexican
5-y
r S
ale
s C
AG
R
$88
$44
$36$32 $32
$26
$0
$10
$20
$30
$40
$50
$60
$70
$80
$90
$100
Burgers Pizza Coffee Chicken Sandwich Mexican
Sale
s ($
BN
)
Top 500 Sales Segment Sales

Source: Technomic, Company data, Credit Suisse
Chicken segment relatively small by unitsBut growth to intensify competition
Chick-fil-A, Chicken, Burger & McDonald’s 5-yr Sales CAGR2019 Units by Segment
For every 1 chicken restaurant, there are 2.5 burger restaurants, though we expect burger chains to
face increasing competition as chicken expands at a faster rate, with McDonald’s (largest burger
chain) noting Chick-fil-A (largest chicken chain) tends to open units where there is an existing
McDonald’s
– Chicken has grown at 2.5-3x the rate of the burger segment over the last five years
– Chick-fil-A generates AUVs of ~$5-5.5MM, nearly double McDonald’s ~$3MM AUVs, and has
grown at an ~11% CAGR over the last five years, 4x that of McDonald’s
186
32.8K
22.1K
32.8K26.2K
11.4K 10.4K
38.2K
29.8K
44.3K
27.6K
13.6K 15.5K
63.0K 62.1K
48.8K
39.7K
25.8K
19.4K
Sandwich Pizza Burgers Coffee Mexican Chicken
Small Chains &
Independents
Top 500 Chains
Top 5 Chains
10.9%
8.1%
3.1%2.7%
0.0%
2.0%
4.0%
6.0%
8.0%
10.0%
12.0%
Chick-fil-A Chicken Burger McDonald's
5-y
r S
ale
s C
AG
R

Chicken wars aren’t overCompetition heats up
In August 2019, Popeyes launched a new chicken sandwich, with the combination of a high quality
new product & viral social media response contributing to unprecedented demand, representing a
catalyst to accelerate Popeyes growth trajectory & improve its competitive positioning
The viral “twitter war” between Popeyes and a few other restaurant concepts offered valuable
lessons to the QSR industry – 1) the power of relevant new product innovation to attract incremental
customers and occasions, and 2) the power of social media and creative marketing to support new
product news and overall brand engagement
McDonald’s is rolling out a new Crispy Chicken Sandwich in February 2021, a menu item
franchisees have been highly requesting amidst the growth of the chicken category
– The sandwich will be pre-breaded to limit operational complexity
KFC is rolling out a new Crispy Chicken Sandwich, available in select markets starting in early
January, and across the US system by the end of February
Burger King is currently testing a new hand-breaded Crispy Chicken Sandwich in select markets,
which will reportedly roll out across the system by May
– Burger King is uniquely well positioned given its relationship & franchisee overlap with Popeyes
Wendy’s rolled out a new Classic Chicken Sandwich in October 2020
Jack in the Box rolled out a new Cluck Sandwich in mid-December 2020
Zaxby’s is planning to roll out a new chicken sandwich in early 2021
187

We like our chicken……hot & spicy
The spotlight was on spicy chicken in 2020 (most debuted in late summer as 2020 innovation was
delayed), building on 2019’s chicken sandwich, with both to be key areas of focus in 2021
– Spicy chicken is often an extension of existing chicken products, limiting added operational
complexity
– We expect companies will target menu innovation that is on-trend/relevant as they look to
reaccelerate traffic, building on extensions of existing platforms or products to limit operational
complexity or adding new menu items that they expect will be incremental to sales & profit
188
August 2020: Jack in the Box brought back Spicy Chicken Strips to the menu permanently after being introduced in April 2019
August 2020: Wendy’s launched a new Spicy Crispy Chicken Sandwich, building on its spicy platform
September 2020: Shake Shack brought back Hot Chick’n and expanded on its hot platform with the addition of
Hot Chick’n Bites & Hot Spicy Fries, available at Hot, Extra Hot & Fire heat levels – Shake Shack noted the spicy version of its Chick’n Shack sandwich was “one of the most requested menu items to date”
September 2020: McDonald’s introduced Spicy Chicken McNuggets & Might Hot Sauce, marking the first time the brand introduced a new flavor of its Classic McNuggets in the US – we expect McDonald’s to bring back Spicy McNuggets in 2021
September 2020: Popeyes brought back its Spicy Ghost Pepper Wings
September 2020: Chick-fil-A announced the test of a new Honey Pepper Pimento Chicken Sandwich

The muse of innovationSo many ways to sell chicken
Restaurants across the industry are leveraging chicken in creative ways as they look to build on
successes of the chicken category in recent years & throughout the pandemic
Chicken Sandwich
McDonald’s is launching its much-anticipated Crispy Chicken Sandwich in the US in February, KFC
is rolling out the KFC Chicken Sandwich, which will be available across the US system by the end of
February, and Burger King is reportedly introducing a new Crispy Chicken Sandwich by May
We also note Wendy’s launched its new Classic Chicken Sandwich in October & Spicy Crispy
Chicken Sandwich in August and Jack In the Box rolled out a new sandwich in December
Chicken Wings
New wing competition is emerging with the launch of virtual concepts by large chains, including It’s
Just Wings (Brinker), Neighborhood Wings by Applebee’s (Dine Brands), The Wing Experience
(Smokey Bones) & Wingville (Fazoli’s), as Wingstop has demonstrated the appeal of wing delivery
with impressive SSS throughout the pandemic (2Q/3Q SSS 32%/25%)
Domino’s upgraded its wings platform in July 2020, complementing its delivery prowess
Plant-Based Chicken
KFC & Beyond Meat continued their partnership with an expanded test of Beyond Fried Chicken in
July 2020 in select stores in CA, which was preceded by an initial one-day debut in August 2019 in
Atlanta and expanded test in February 2020 in Nashville & Charlotte
El Pollo Loco rolled out plant-based Chickenless Pollo nationwide in March 2020
Jack in the Box tested the Unchicken sandwich in select markets in partnership with Tyson
189

Company HighlightMcDonald’s
McDonald’s is launching its highly anticipated Crispy Chicken Sandwich in February 2021 in three
versions (crispy, spicy, deluxe) following a test at the end of 2019 in select markets
– The chicken sandwich is a product highly requested by franchisees given the strong performance
of chicken & chicken sandwiches in recent years and pressure from Chick-fil-A and Popeyes
Learning from the viral success of Popeyes’ launch, a changing content consumption landscape and
increased efforts to reach a younger consumer, McDonald’s has notably improved its social media
and marketing strategy in 2020, which we expect will bode well for the chicken sandwich launch
190
Source: Company data, Credit Suisse estimates
Illustrative Example of Chicken Sandwich SSS LiftIllustrative Example of Chicken Sandwich SSS Lift
McDonald's US AUV ($000s) $3,000
Daily Chicken Sandwiches Sold 100
Price/Sandwich $3.99
Daily Chicken Sandwich Sales $399
Prior Buttermilk Crispy Chicken Sandwiches Sold 50
Price/Sandwich $5.00
Daily Buttermlik Crispy Chicken Sandwich Sales $250
Annualized Chicken Sandwich Sales ($000s) $143.6
% Incremental 50%
Less: Lost Prior Chicken Sandwich Sales ($000s) $90.0
Incremental Sales $53.6
% Sales Lift 1.8%
Chicken Sandwich as % of Sales 4.7%
Base Case
McDonald's US AUV ($000s) $3,000
Daily Chicken Sandwiches Sold 150
Price/Sandwich $3.99
Daily Chicken Sandwich Sales $599
Prior Buttermilk Crispy Chicken Sandwiches Sold 50
Price/Sandwich $5.00
Daily Buttermlik Crispy Chicken Sandwich Sales $250
Annualized Chicken Sandwich Sales ($000s) $215.5
% Incremental 50%
Less: Lost Prior Chicken Sandwich Sales ($000s) $90.0
Incremental Sales $125.5
% Sales Lift 4.2%
Chicken Sandwich as % of Sales 6.9%
Blue Sky
191
Value & Innovation on the Menu

192
Prudency & creativity on the menuBalancing value & innovation
We expect companies will be prudent in their approaches to both value and menu innovation amidst
challenging (and sometimes conflicting) dynamics
– Restaurants are looking to build back traffic, though many are also facing economic headwinds
from sales declines throughout 2020 and incremental costs associated with COVID-related relief
(e.g., PPE, sick leave) as well as fees associated with technology (e.g., more digital partners;
higher delivery mixes); many have also streamlined menus to reduce complexity
– Consumers are likely facing a more challenging economic environment in 2021 amidst
heightened business closures and increased unemployment
Restaurants will likely offer everyday value as appropriate, as well as pursue strategies with
differentiation across dayparts and channels, addressing value through targeted offers at specific
dayparts or only available through specific channels
As many companies have pursued simplification initiatives over the last few years and throughout
2020 (e.g., McDonald’s, Taco Bell, Olive Garden, Shake Shack, etc.), we expect restaurants will be
prudent in adding new ingredients, equipment and processes to limit operational complexity

Unemployment RateQSR Promotional Composition – Value
Source: Bureau of Labor Statistics, Credit Suisse
193
Value as core to menu strategyChallenging consumer environment
As the restaurant industry seeks to regain share loss to food at home and reaccelerate depressed
traffic, and amidst a challenging consumer environment with unemployment at nearly 7%, we
expect an increased focus on value in 2021
The gap between food at home & food away from home has narrowed, making grocery relatively
less attractive, and following several years of a heightened food at home/food away from home CPI
inflation gap of ~250bps over the last five years
Unemployment RateFAH/FAFH CPI Gap
-6.0%
-5.0%
-4.0%
-3.0%
-2.0%
-1.0%
0.0%
1.0%
2.0%
3.0%
Jan-1
5
May-
15
Sep-1
5
Jan-1
6
May-
16
Sep-1
6
Jan-1
7
May-
17
Sep-1
7
Jan-1
8
May-
18
Sep-1
8
Jan-1
9
May-
19
Sep-1
9
Jan-2
0
May-
20
Sep-2
0
FA
H/F
AF
H C
PI G
ap
3.0%
4.0%
5.0%
6.0%
7.0%
8.0%
9.0%
10.0%
11.0%
12.0%
13.0%
14.0%
15.0%
16.0%
Jan-1
5
May-
15
Sep-1
5
Jan-1
6
May-
16
Sep-1
6
Jan-1
7
May-
17
Sep-1
7
Jan-1
8
May-
18
Sep-1
8
Jan-1
9
May-
19
Sep-1
9
Jan-2
0
May-
20
Sep-2
0
Unem
plo
yment
Rate
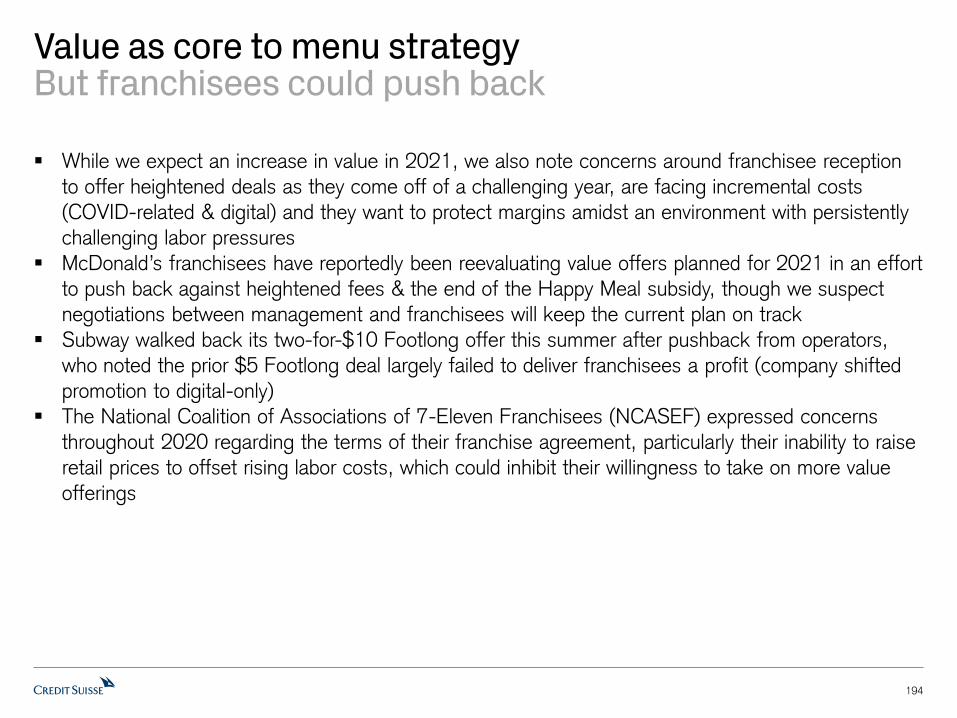
194
Value as core to menu strategyBut franchisees could push back
While we expect an increase in value in 2021, we also note concerns around franchisee reception
to offer heightened deals as they come off of a challenging year, are facing incremental costs
(COVID-related & digital) and they want to protect margins amidst an environment with persistently
challenging labor pressures
McDonald’s franchisees have reportedly been reevaluating value offers planned for 2021 in an effort
to push back against heightened fees & the end of the Happy Meal subsidy, though we suspect
negotiations between management and franchisees will keep the current plan on track
Subway walked back its two-for-$10 Footlong offer this summer after pushback from operators,
who noted the prior $5 Footlong deal largely failed to deliver franchisees a profit (company shifted
promotion to digital-only)
The National Coalition of Associations of 7-Eleven Franchisees (NCASEF) expressed concerns
throughout 2020 regarding the terms of their franchise agreement, particularly their inability to raise
retail prices to offset rising labor costs, which could inhibit their willingness to take on more value
offerings

195
Value as core to menu strategyEveryday value
We believe everyday value is important to effectively communicate value propositions and build
brand equity among consumers
Burger King launched the $1 Your Way menu in late December, offering four items priced at $1
each, including a classic Bacon Cheeseburger, Chicken Jr. sandwich, Value Fries and a Value Soft
Drink
McDonald’s offers the $1 $2 $3 Dollar Menu (D123), giving franchisees flexibility regarding the
items offered at each price point, while maintaining a national and cohesive value menu
– McDonald’s has also been offering periodic promotions through its digital app, including its
recent Throwback Deals
Wendy’s continues to promote its 4 for $4 Menu, and often modifies the items available on the
value menu to generate new news and encourage trial
Domino’s maintains a strong value proposition, with brand equity around its longstanding $5.99 mix
& match deal, as well as its $7.99 carryout deal
KFC offers $20 & $30 Fill Up bucket deals, capitalizing on the shift in occasion to larger family
meals
Taco Bell features a Cravings Value Menu & $5 Cravings Boxes

196
Value as core to menu strategyValue across channels
We expect companies to differentiate value offers across channels to incentivize behaviors in the
most accretive ways
– Restaurants can offer deals exclusively through the mobile app to encourage customers to
increase digital utilization
– Restaurants often exclude delivery from value offers or provide different delivery value offers to
maximize profitability of this channel and avoid unnecessary sales dilution, limiting deals to pickup
& drive-thru transactions (e.g., bundle offers)
We expect companies with more sophisticated analytical and personalization capabilities can do
one-to-one marketing for specific customer cohorts to encourage behavior across different channels
(e.g., if customer only uses delivery, can send offer for mobile order & pay)
– Restaurants will likely look to shift delivery transactions to more margin accretive channels like
pickup (the most margin accretive) and drive-thru
Source: Company data, Credit Suisse
McDonald’s Jack in the Box Burger KingWendy’s
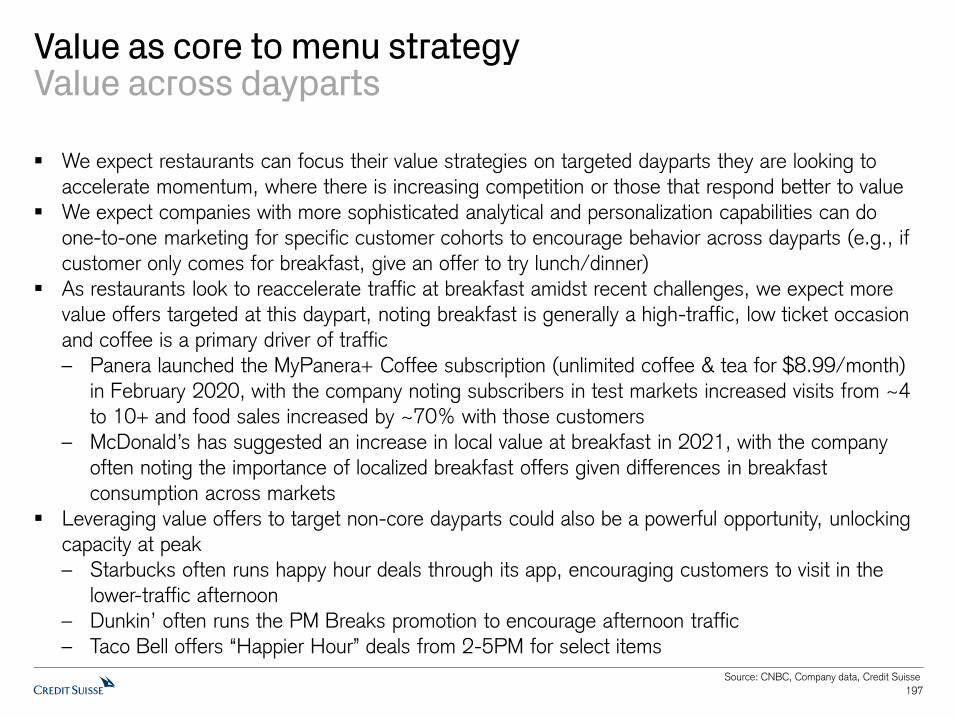
197
Value as core to menu strategyValue across dayparts
We expect restaurants can focus their value strategies on targeted dayparts they are looking to
accelerate momentum, where there is increasing competition or those that respond better to value
We expect companies with more sophisticated analytical and personalization capabilities can do
one-to-one marketing for specific customer cohorts to encourage behavior across dayparts (e.g., if
customer only comes for breakfast, give an offer to try lunch/dinner)
As restaurants look to reaccelerate traffic at breakfast amidst recent challenges, we expect more
value offers targeted at this daypart, noting breakfast is generally a high-traffic, low ticket occasion
and coffee is a primary driver of traffic
– Panera launched the MyPanera+ Coffee subscription (unlimited coffee & tea for $8.99/month)
in February 2020, with the company noting subscribers in test markets increased visits from ~4
to 10+ and food sales increased by ~70% with those customers
– McDonald’s has suggested an increase in local value at breakfast in 2021, with the company
often noting the importance of localized breakfast offers given differences in breakfast
consumption across markets
Leveraging value offers to target non-core dayparts could also be a powerful opportunity, unlocking
capacity at peak
– Starbucks often runs happy hour deals through its app, encouraging customers to visit in the
lower-traffic afternoon
– Dunkin’ often runs the PM Breaks promotion to encourage afternoon traffic
– Taco Bell offers “Happier Hour” deals from 2-5PM for select items
Source: CNBC, Company data, Credit Suisse
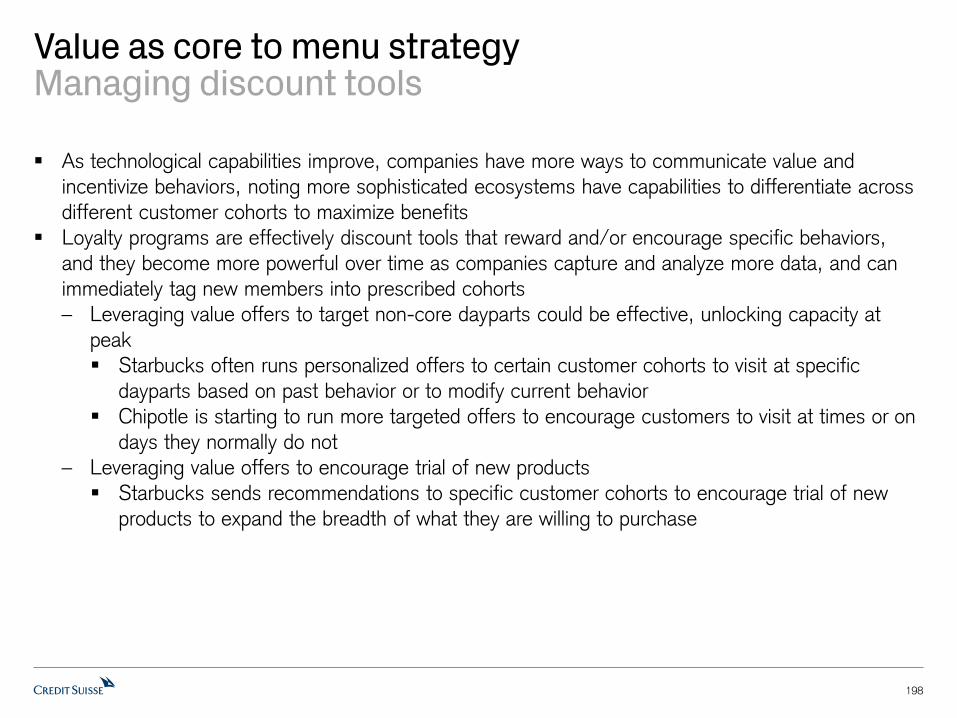
198
Value as core to menu strategyManaging discount tools
As technological capabilities improve, companies have more ways to communicate value and
incentivize behaviors, noting more sophisticated ecosystems have capabilities to differentiate across
different customer cohorts to maximize benefits
Loyalty programs are effectively discount tools that reward and/or encourage specific behaviors,
and they become more powerful over time as companies capture and analyze more data, and can
immediately tag new members into prescribed cohorts
– Leveraging value offers to target non-core dayparts could be effective, unlocking capacity at
peak
Starbucks often runs personalized offers to certain customer cohorts to visit at specific
dayparts based on past behavior or to modify current behavior
Chipotle is starting to run more targeted offers to encourage customers to visit at times or on
days they normally do not
– Leveraging value offers to encourage trial of new products
Starbucks sends recommendations to specific customer cohorts to encourage trial of new
products to expand the breadth of what they are willing to purchase

199
Innovation while limiting complexityMenu development across channels
We expect there could be different approaches to menu development across channels as digital
utilization increases and restaurants enhance layouts to optimize their omni-channel strategies
– Restaurants could limit the breadth of menus available for delivery in an attempt to maximize the
quality of food delivered to the end consumer
Chipotle does not deliver fountain drinks
– Restaurants could develop menu items/platforms exclusively available through digital channels
Chipotle is expected to roll out quesadillas exclusively available through digital channels to
limit disruption to its primary “down-the-line” production line
Taco Bell offers select items exclusively through digital channels, such as the Quesarito
Several brands have launched virtual brands that are only available on third-party delivery
platforms
– It’s Just Wings (Brinker), Tender Shack (Bloomin’ Brands), Neighborhood Wings by
Applebee’s (Dine Brands)
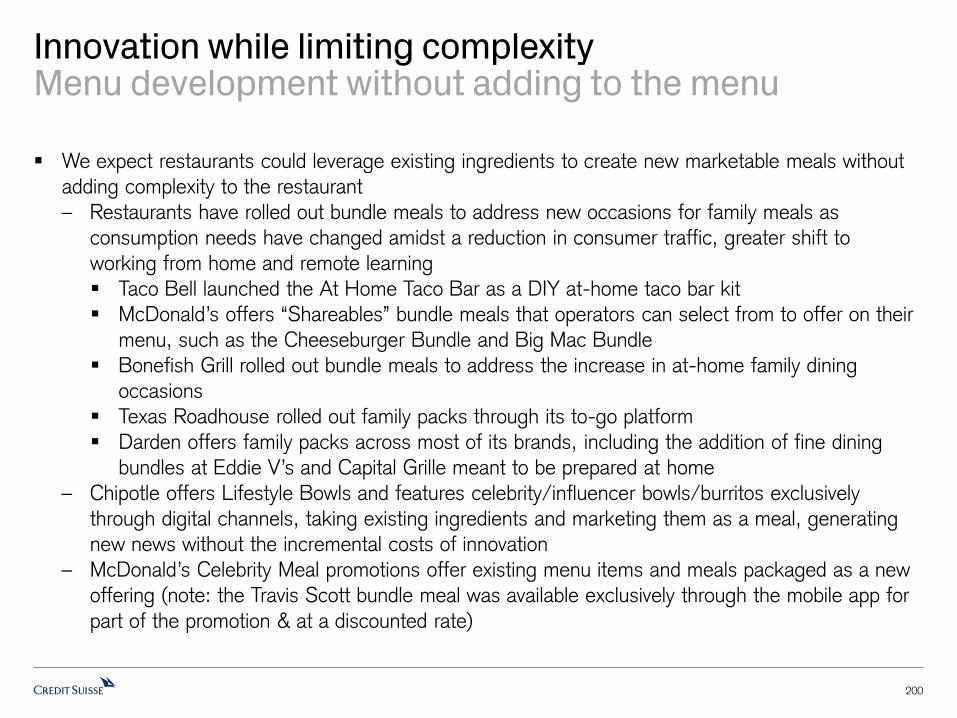
200
Innovation while limiting complexityMenu development without adding to the menu
We expect restaurants could leverage existing ingredients to create new marketable meals without
adding complexity to the restaurant
– Restaurants have rolled out bundle meals to address new occasions for family meals as
consumption needs have changed amidst a reduction in consumer traffic, greater shift to
working from home and remote learning
Taco Bell launched the At Home Taco Bar as a DIY at-home taco bar kit
McDonald’s offers “Shareables” bundle meals that operators can select from to offer on their
menu, such as the Cheeseburger Bundle and Big Mac Bundle
Bonefish Grill rolled out bundle meals to address the increase in at-home family dining
occasions
Texas Roadhouse rolled out family packs through its to-go platform
Darden offers family packs across most of its brands, including the addition of fine dining
bundles at Eddie V’s and Capital Grille meant to be prepared at home
– Chipotle offers Lifestyle Bowls and features celebrity/influencer bowls/burritos exclusively
through digital channels, taking existing ingredients and marketing them as a meal, generating
new news without the incremental costs of innovation
– McDonald’s Celebrity Meal promotions offer existing menu items and meals packaged as a new
offering (note: the Travis Scott bundle meal was available exclusively through the mobile app for
part of the promotion & at a discounted rate)
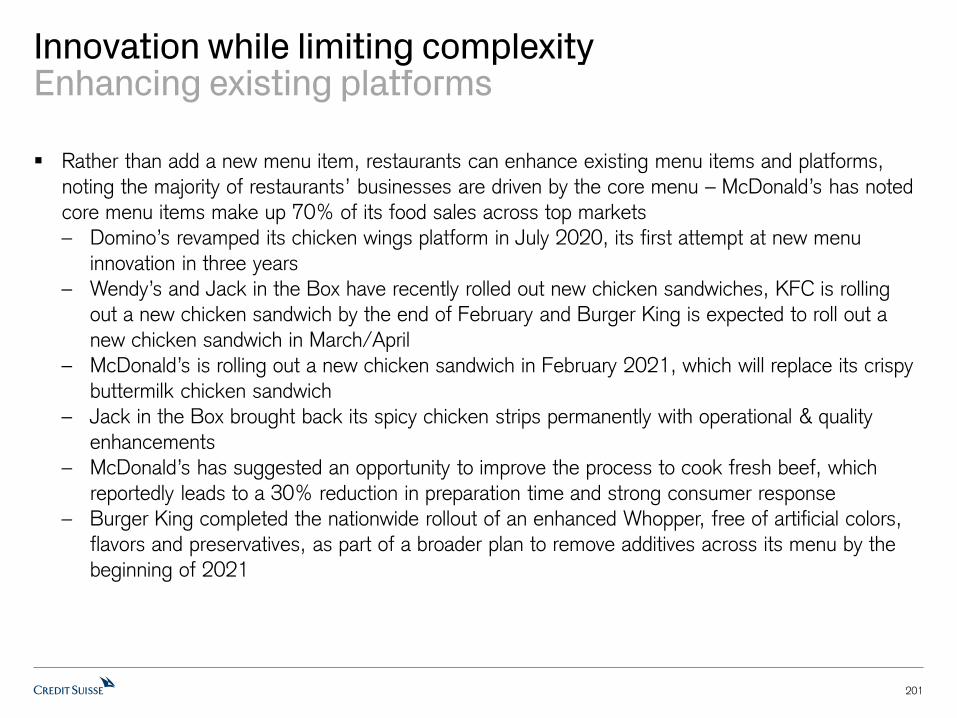
201
Innovation while limiting complexityEnhancing existing platforms
Rather than add a new menu item, restaurants can enhance existing menu items and platforms,
noting the majority of restaurants’ businesses are driven by the core menu – McDonald’s has noted
core menu items make up 70% of its food sales across top markets
– Domino’s revamped its chicken wings platform in July 2020, its first attempt at new menu
innovation in three years
– Wendy’s and Jack in the Box have recently rolled out new chicken sandwiches, KFC is rolling
out a new chicken sandwich by the end of February and Burger King is expected to roll out a
new chicken sandwich in March/April
– McDonald’s is rolling out a new chicken sandwich in February 2021, which will replace its crispy
buttermilk chicken sandwich
– Jack in the Box brought back its spicy chicken strips permanently with operational & quality
enhancements
– McDonald’s has suggested an opportunity to improve the process to cook fresh beef, which
reportedly leads to a 30% reduction in preparation time and strong consumer response
– Burger King completed the nationwide rollout of an enhanced Whopper, free of artificial colors,
flavors and preservatives, as part of a broader plan to remove additives across its menu by the
beginning of 2021

202
Innovation while limiting complexityAdding other ways to play
Restaurants have been creative in adding additional opportunities to address occasions, including
bundle meals not necessarily available at the restaurant, the sale of grocery items as an additional
revenue stream and virtual concepts to capitalize on the growing delivery opportunity without
impacting the core menu
– Shake Shack offers an 8-pack Shackburger kit through Goldbelly that ships throughout the
country
– Texas Roadhouse expanded its to-go platform with the sale of ready-to-grill steaks & pork for
customers to cook at home and has launched the Texas Roadhouse Butcher Shop, expanding
the availability of ready-to-grill steaks which can now be delivered frozen across the country
(includes a shaker of its signature steak seasoning)
– Darden’s fine dining brands, Eddie V’s & Capital Grille, offer family packs with uncooked steaks
that include instructions on how to prepare them as well as prepared sides to be reheated
– Panera and Subway now offer grocery items for delivery and pickup
– Jimmy John’s began selling fresh-baked bread during the height of the pandemic in March

203
Looking for impactful menu innovationAddressing relevant consumer trends
We expect new menu innovation will be focused on addressing relevant consumer trends and
tastes, whether that be enhancing existing menu items, adding extensions to existing platforms or
introducing new menu items and platforms to improve competitive positioning
Chicken appears to be growing at an outsized rate, with McDonald’s highlighting chicken as a key
focus for the company (chicken is nearly 2x the size of beef globally) and impressive strength of
chicken brands like Chick-fil-A and Popeyes in recent years
Restaurants appear to be adding more better-for-you items and platforms to increase their breadth
of consumers and occasions, such as plant-based items & menu options compliant with lifestyle
diets
– Starbucks has highlighted an increased focus on plant-based platforms, including the
introduction of plant-based protein breakfast sandwiches, expansion of plant-based dairy
options, as well as new menu products featuring plant-based dairy
– Chipotle rolled out cauliflower rice in early January 2021, and introduced new variations of its
Lifestyle Bowls, compliant with most major lifestyle diets
– Shake Shack is testing a new veggie burger in select markets
– Dunkin’ recently launched a new Southwest Veggie Power Breakfast Sandwich with
MorningStar Farm’s Black Bean Patty
– Subway launched Protein Bowls in late December
– Pollo Loco now has lower calorie & carb versions of its Pollo Fit Bowls
– Taco Bell is partnering with Beyond Meat to test a new plant-based protein menu item

204
Sustainability
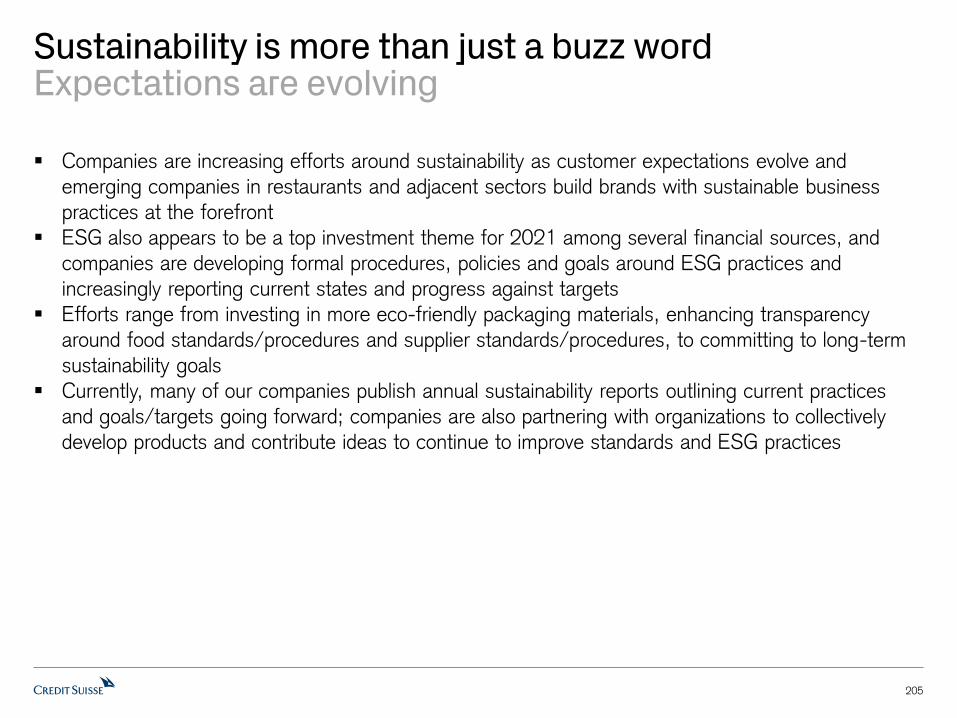
Sustainability is more than just a buzz wordExpectations are evolving
Companies are increasing efforts around sustainability as customer expectations evolve and
emerging companies in restaurants and adjacent sectors build brands with sustainable business
practices at the forefront
ESG also appears to be a top investment theme for 2021 among several financial sources, and
companies are developing formal procedures, policies and goals around ESG practices and
increasingly reporting current states and progress against targets
Efforts range from investing in more eco-friendly packaging materials, enhancing transparency
around food standards/procedures and supplier standards/procedures, to committing to long-term
sustainability goals
Currently, many of our companies publish annual sustainability reports outlining current practices
and goals/targets going forward; companies are also partnering with organizations to collectively
develop products and contribute ideas to continue to improve standards and ESG practices
205

SustainabilitySourcing
Sourcing is often associated with sustainability, as it aligns with the increasing consumer demand for
greater transparency
We believe more sustainable ingredient sourcing (antibiotic free, more humane supply chains, etc.)
will become table stakes, and all brands will be held to higher standards as expectations evolve,
making it necessary for brands to invest in their infrastructures and supply chains near-term (goals
are generally long-term in nature)
– Starbucks has stated goals of sourcing 100% of its coffee and tea ethically (99%+ in FY19)
– McDonald’s set a goal to source a portion of beef from suppliers participating in sustainability
programs aligned with the Global Roundtable of Sustainable Beef Principles and Criteria in 10 of
its top beef sourcing countries globally by the end of 2020
– Taco Bell has committed to reduce antibiotics in its N.A. beef supply chain by 25% by 2025
– Burger King is aiming for its US menu to be 100% free of colors, flavors & preservatives from
artificial sources by early 2021 (from 85% in September)
– Jack in the Box has a goal to source 100% cage-free eggs by 2025 (from 77% in September)
Many fast casual brands have differentiated their offerings and gained loyal followings by committing
to sustainably sourced ingredients and supply chains
– Chipotle was an early leader in using sustainability as a brand differentiator, with a commitment
to its “Food with Integrity” philosophy
– Shake Shack has garnered strong brand affinity with its mission to “Stand for Something Good,”
which permeates across its ingredients, hiring practices and community involvement
206
Restaurants

SustainabilitySourcing
Consumer expectations for sustainably & ethically sourced products flow through the supply chain,
and distributors have joined restaurant brands in establishing guardrails for procurement practices
Sysco has established responsible guidelines surrounding four key commodities, committing to:
– Beef: pilot at least two projects by 2022 that will result in positive impacts on its supply chain
– Paper: source all Sysco Brand paper towels, napkins, bath & facial tissues from Forest
Stewardship Council or Sustainable Forestry certified sources or equivalent standards by 2025
– Soy: implement sustainability criteria into future Sysco Brand commodity soybean oil events by
2025 & identify opportunities to decrease the environmental impact of soybean production
– Coffee: source 75% of Sysco Brand Coffee from certified sources by 2025
– Seafood: source 100% of its top 15 wild-caught Sysco Portico Brand seafood species groups
from certified sources, improve the traceability of certain seafood products and prohibit the sale
of endangered species for seafood products globally by 2025
– Sysco is also targeting a transition to 100% cage-free eggs by 2026 (from 17% currently)
US Foods holds its products to a Serve Good standard, with guidelines surrounding agricultural
practices, sustainable seafood, animal care, responsible disposables & waste reduction
Performance Food Group seals products grown within 250 miles of customers’ local warehouses as
Qualified Grown Local and aims to source 100% cage free eggs by 2026
207
Food Distributors

SustainabilityPackaging
Packaging is another consumer facing sustainability initiative, and can also be used as a marketing
message to communicate companies’ commitments to sustainable practices
– Increasingly important as more occasions have shifted off-premise
McDonald’s & Starbucks partnered with Closed Loop Partners as part of the NextGen Consortium
(Wendy’s & Yum! Brands also joined), aiming to address single-use packaging waste globally
Starbucks has a goal to develop 100% compostable & recyclable hot cups by 2022
McDonald’s, Burger King & Tim Hortons announced partnerships with TerraCycle’s circular
packaging service, Loop, to pilot reusable containers in select markets beginning in 2021
Starbucks’ recyclable, strawless lids are the new standard for iced beverages in the US & Canada, a
step toward its commitment to eliminate 1BN plastic straws per year globally
Dunkin’ began testing biodegradable straws in the US in September, made with PHA, and achieved
its goal to replace polystyrene cups
McDonald’s has committed to source 100% of guest packaging from renewable, recyclable or
certified sources by 2025 and recycle 100% of guest packaging by 2025
Tim Hortons established several packaging initiatives including new napkins made with recycled fiber,
fully recyclable paper-based wrappers for sandwiches & bagels and the elimination of double-cupping
Chipotle has set a goal to reduce the amount of plastic in its cutlery by 20% by the end of 2020, and
is open to exploring plastic alternatives
Domino’s launched a new feature on recycling.dominos.com, allowing customers the ability to look
up their zip code for their neighborhood’s status on pizza box recycling
208
Restaurants

SustainabilityPackaging
Sysco has set a 2030 goal to ensure all plastic material for packages and consumables comes from
fossil-free sources or recycled fossil raw material
Sysco launched the EarthPlus brand, offering branded recyclable food packaging made from corn
meant to support sustainability goals
US Foods maintains responsible disposable policies as part of its Serve Good platform, with 260+
products classified as either responsibly sourced or compostable as verified by a third party
209
Food Distributors

SustainabilityPlant-Based Products
Plant-based protein has seen notable growth over the last 12-24 months, positioned as a more
environmentally-friendly alternative relative to traditional meat products
Despite differing views regarding the health benefits of plant-based meat offerings in the market, we
believe the perception of a more sustainable offering has helped drive the growing trend
Beyond Meat and Impossible Foods have released studies comparing plant-based burgers to
traditional beef burgers, highlighting meaningfully lower environmental impacts
210
Source: Beyond Meat, Impossible Foods, University of Michigan, Credit Suisse estimates
Impossible Burger vs US Beef Burger Environmental ImpactBeyond Burger vs US Beef Burger Environmental Impact
0%
10%
20%
30%
40%
50%
60%
70%
80%
90%
100%
Greenhouse Gas
Emissions
Energy Use Characterized
Land Use
Characterized
Water Use
% R
educ
tion
in E
nviro
nmen
tal
Impa
ct
Beyond Burger Beef Burger
0%
10%
20%
30%
40%
50%
60%
70%
80%
90%
100%
Greenhouse Gas
Emissions
Aquatic
Pollutants
Land Occupation Water
Consumption
% R
educ
tion
in E
nviro
nmen
tal
Impa
ct
Impossible Burger Beef Burger~90% reduction in greenhouse
gas emissions necessary for
production

SustainabilityPlant-Based Products
Sysco launched Sysco Simply brand in FY19, emphasizing vegan, vegetarian, flexitarian & plant-
based protein products, with products including Sysco Simply branded plant-based protein, sprouted
grain breads and vegan cornettos
– Sysco also offers manufacturer brands, such as Beyond Meat and Impossible Foods
In November 2020, PFGC announced the launch of its Green Origin brand, a proprietary line of
plant-based protein products made exclusively by Greenleaf Foods, SPC (owner of plant-based
brands Lightlife and Field Roast)
US Foods offers several plant-based protein products through its proprietary brands Molly’s Kitchen
(plant-based burger patty, meatless crumbles, meatless breaded boneless wings) and higher-quality
Chef’s Line (black bean burger, 3-grain veggie burger)
211
Food Distributors

SustainabilityEnergy
212
Many companies are implementing policies and developing partnerships in support of more
sustainable energy sources and are incorporating energy-friendly practices in new concept designs
Starbucks is leading the retail sector in sustainable energy sourcing as the top purchaser of
renewable electricity and set a multi-decade aspiration to be a resource-positive company
– As part of its 2030 goals, Starbucks is targeting a 50% reduction in carbon emissions in direct
operations & its supply chain (as well as a 50% reduction in waste sent to landfills & 50% of
water withdrawal to be conserved or replenished)
– In June, Starbucks agreed to purchase a three-project renewable energy portfolio from LevelTen
Energy that will power more than 3,000 stores in the US with renewable energy by 2021
– Starbucks is working to source 100% renewable energy globally in its stores & supply chain
McDonald’s has also increased its investments in renewable energy
– In December, McDonald’s announced two power purchase agreements (PPA) with Apex Clean
Energy to reduce carbon emissions
– In July, McDonald’s opened a new restaurant at Disney World in Florida that will serve as its
global flagship for learnings to reduce energy & water use, with the eco-friendly design featuring
solar panels, and creating enough energy to cover all of its annual energy needs on a net basis
Chipotle plans to increase the amount of renewable energy it sources and fully measure & report its
Scope 3 emissions by 2025
Restaurants
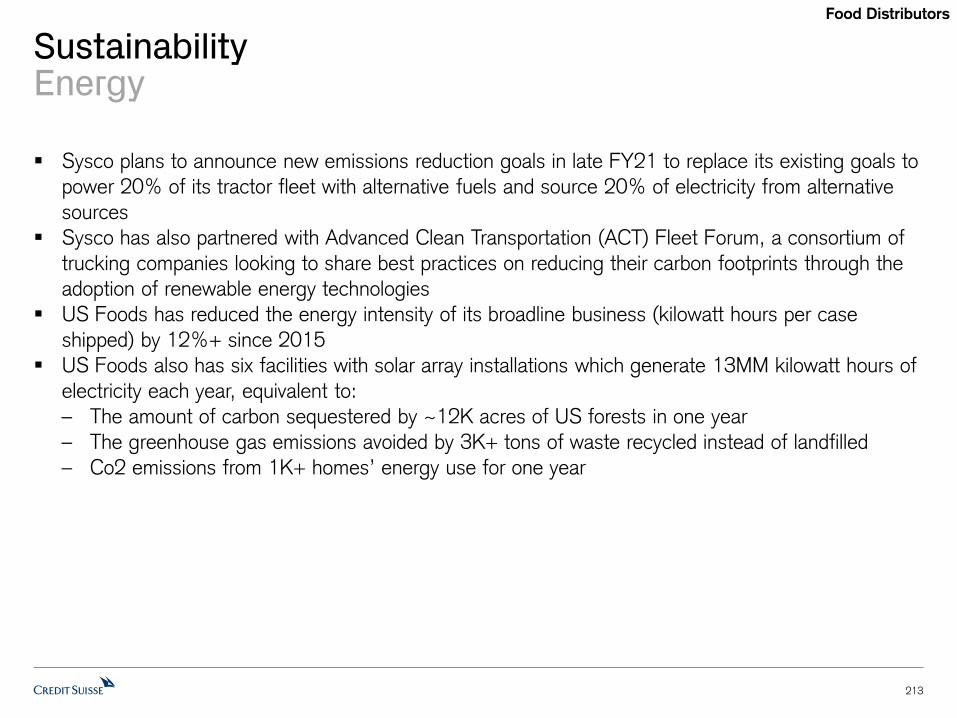
SustainabilityEnergy
213
Sysco plans to announce new emissions reduction goals in late FY21 to replace its existing goals to
power 20% of its tractor fleet with alternative fuels and source 20% of electricity from alternative
sources
Sysco has also partnered with Advanced Clean Transportation (ACT) Fleet Forum, a consortium of
trucking companies looking to share best practices on reducing their carbon footprints through the
adoption of renewable energy technologies
US Foods has reduced the energy intensity of its broadline business (kilowatt hours per case
shipped) by 12%+ since 2015
US Foods also has six facilities with solar array installations which generate 13MM kilowatt hours of
electricity each year, equivalent to:
– The amount of carbon sequestered by ~12K acres of US forests in one year
– The greenhouse gas emissions avoided by 3K+ tons of waste recycled instead of landfilled
– Co2 emissions from 1K+ homes’ energy use for one year
Food Distributors

SustainabilityWaste
According to ReFED, US restaurants generate 11.4BN tons of food waste annually, costing
restaurants $25BN+ (full-service $16BN, limited-service $9BN+)
– Implementing sustainability measures can drive cost savings, with the study noting better
inventory management & tracking/analyzing waste as the most accretive (research from the
study suggests every $1 invested in food waste reduction can = $8 of savings)
– As margins continue to be pressured from higher labor costs, less benign commodities & added
tech investments, restaurants will need to look for ways to find savings elsewhere in the P&L
Emerging startup companies are offering tech-driven solutions to analyze, reduce food waste and
ease the process of donating (Rubicon Global, Recycle Track Systems, Copia, Foodr)
214
Restaurants
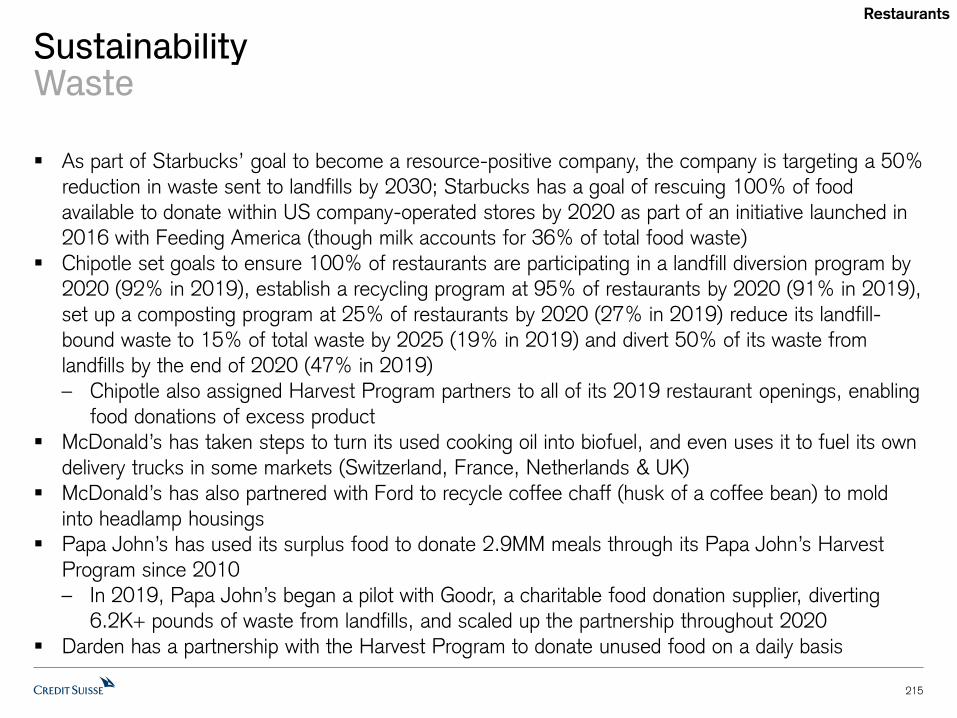
SustainabilityWaste
As part of Starbucks’ goal to become a resource-positive company, the company is targeting a 50%
reduction in waste sent to landfills by 2030; Starbucks has a goal of rescuing 100% of food
available to donate within US company-operated stores by 2020 as part of an initiative launched in
2016 with Feeding America (though milk accounts for 36% of total food waste)
Chipotle set goals to ensure 100% of restaurants are participating in a landfill diversion program by
2020 (92% in 2019), establish a recycling program at 95% of restaurants by 2020 (91% in 2019),
set up a composting program at 25% of restaurants by 2020 (27% in 2019) reduce its landfill-
bound waste to 15% of total waste by 2025 (19% in 2019) and divert 50% of its waste from
landfills by the end of 2020 (47% in 2019)
– Chipotle also assigned Harvest Program partners to all of its 2019 restaurant openings, enabling
food donations of excess product
McDonald’s has taken steps to turn its used cooking oil into biofuel, and even uses it to fuel its own
delivery trucks in some markets (Switzerland, France, Netherlands & UK)
McDonald’s has also partnered with Ford to recycle coffee chaff (husk of a coffee bean) to mold
into headlamp housings
Papa John’s has used its surplus food to donate 2.9MM meals through its Papa John’s Harvest
Program since 2010
– In 2019, Papa John’s began a pilot with Goodr, a charitable food donation supplier, diverting
6.2K+ pounds of waste from landfills, and scaled up the partnership throughout 2020
Darden has a partnership with the Harvest Program to donate unused food on a daily basis
215
Restaurants

SustainabilityWaste
Sysco has a 2025 goal to divert 90% of waste, including food, from landfills (in FY20, diversion
rate was 69% and in FY18, diversion rate was 65%)
US Food Group’s Serve Good products must meet strict packaging standards that are designed to
reduce waste and help minimize the company’s ecological footprint, with each Serve Good product
required to come with a claim of responsible sourcing or contribution to waste reduction
Performance Food Group has partnered with Feeding America and community foodbanks to reduce
food-related waste
216
Food Distributors

SustainabilityTransportation
In October, Sysco announced a test of an all-electric Freightliner truck set to run through January
2021, with data collected from local & regional trips out of a San Francisco terminal to help inform
future vehicle designs
– Sysco also participates in the Freightliner Electric Vehicle Council, working to identify & address
inhibitors to large-scale adoption of commercial battery electric vehicles
US Foods has reduced gallons of fuel used per case by ~11% since 2015 and miles driven by
~10MM since 2017 through technology solutions that provide drivers with real-time traffic data,
adoption of more efficient tires & lighter-weight oil to improve fuel economy and the integration of
new compressed natural gas vehicles into the fleet
– Compressed natural gas trucks emit 21-29% fewer greenhouse gas emissions than comparable
gas or diesel fuel vehicles
217
Food Distributors
218
Plant-Based

Expect more plant-based options in 2021Building on consumer trends & sustainability
We expect restaurants to increasingly focus on offering plant-based alternatives across the menu as
they explore ways to capitalize on consumer lifestyle trends and greater sustainability practices
– This expands beyond plant-based animal protein substitutes, with expectations for more
vegetable-forward items and non-dairy alternatives
– We expect restaurants to continue to expand their portfolios of plant-based products, though
strategies will differ depending on relative brand positioning and customer demographics
We don’t see “new-age” plant-based protein as impactful in 2021 and going forward as it was in
2019 amidst early tests, excitement with the Beyond Meat May 2019 IPO and increasing supply of
plant-based options; we also don’t expect all companies will look to offer plant-based meat
substitutes in 2021 as 1) restaurants prioritize other initiatives (e.g., chicken sandwiches, breakfast,
technology) and 2) currently available products may not align with restaurants’ menus (e.g., GMOs,
too much processing)
– Our conversations with QSR restaurant operators suggest stronger demand for plant-based
options in urban markets, so strategies could also differ across different markets
219

Plant-based protein gains momentum across channelsGame changer vs table stakes
Plant-based products are making their way onto menus and into grocery aisles at scale as more
consumers explore lifestyle diets and companies look to expand their breadth of customers and
occasions
While the “new-age” plant-based protein largely began in the grocery aisle (Beyond Meat), the trend
has expanded to restaurants looking to resonate with new customer segments & occasions
220
Impossible Foods Grocery OutletsBeyond Meat Foodservice Outlets
0
5,000
10,000
15,000
20,000
25,000
30,000
35,000
40,000
45,000
4Q18 1Q19 2Q19 3Q19 4Q19 1Q20 2Q20 3Q20
Beyo
nd M
eat
Foodse
rvic
e O
utle
ts
0
2,000
4,000
6,000
8,000
10,000
12,000
14,000
16,000
Marc
h
April
May
June
July
August
Septe
mber
Oct
ober
Nove
mber
Dece
mber
Imposs
ible
Foods
Gro
cery
Outle
ts
Source: Company data, Credit Suisse estimates
Note: Reflects US & Canada foodservice outlets from 4Q18-4Q19 and US foodservice outlets only from 1Q20-3Q20.

Commoditization of plant-based proteinSupply reflecting expectations for long-term trend
Plant-based protein is not a new phenomenon – veggie-based patties have existed for years – but
rather emerging companies like Beyond Meat and Impossible Foods elevated the game with “new-
age” plant-based protein, expanding their reach to consumers looking for a high quality substitute
for meat, rather than just appealing to consumers looking for an alternative to animal-based protein
– This has led to an increase in the addressable market for plant-based proteins, prompting
incumbents to develop products meant to appeal to meat eaters
Over the last couple of years, two of the largest producers of plant-based protein products that
mimic meat, Beyond Meat & Impossible Foods, have demonstrated tremendous growth and
attracted consumer mindshare
– Many restaurant companies have partnered with Beyond & Impossible, leveraging their brand
names to attract incremental consumers and consumer trust
As restaurants increasingly view plant-based protein as a long-term trend, and not just a short-term
fad, we expect they will also be increasingly open to exploring partnerships with suppliers and not
just leverage the brand names of Beyond & Impossible
221
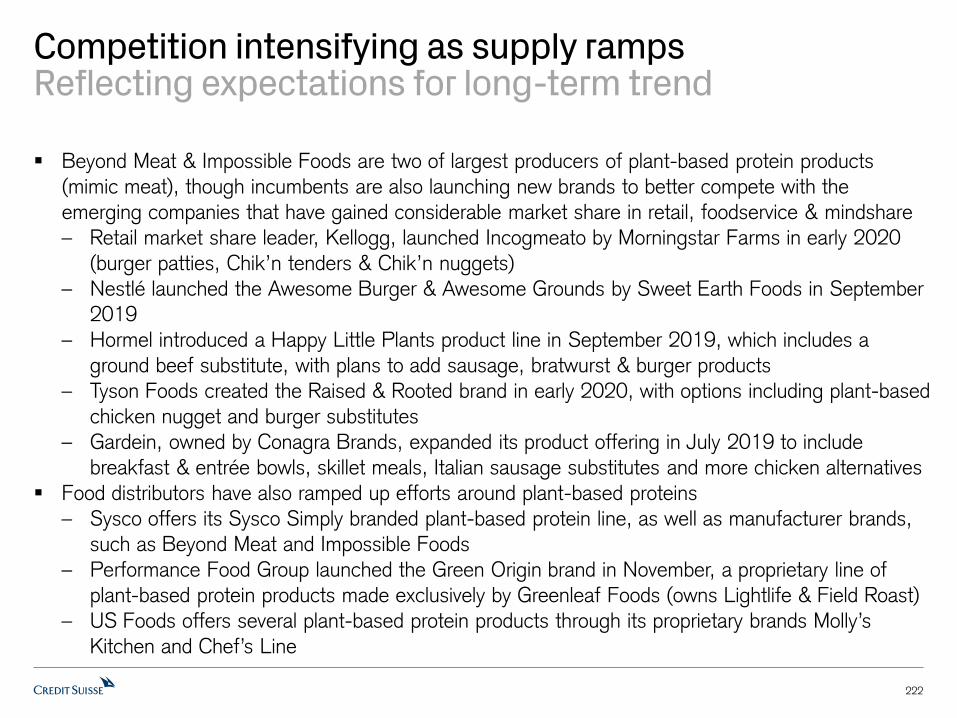
Competition intensifying as supply rampsReflecting expectations for long-term trend
Beyond Meat & Impossible Foods are two of largest producers of plant-based protein products
(mimic meat), though incumbents are also launching new brands to better compete with the
emerging companies that have gained considerable market share in retail, foodservice & mindshare
– Retail market share leader, Kellogg, launched Incogmeato by Morningstar Farms in early 2020
(burger patties, Chik’n tenders & Chik’n nuggets)
– Nestlé launched the Awesome Burger & Awesome Grounds by Sweet Earth Foods in September
2019
– Hormel introduced a Happy Little Plants product line in September 2019, which includes a
ground beef substitute, with plans to add sausage, bratwurst & burger products
– Tyson Foods created the Raised & Rooted brand in early 2020, with options including plant-based
chicken nugget and burger substitutes
– Gardein, owned by Conagra Brands, expanded its product offering in July 2019 to include
breakfast & entrée bowls, skillet meals, Italian sausage substitutes and more chicken alternatives
Food distributors have also ramped up efforts around plant-based proteins
– Sysco offers its Sysco Simply branded plant-based protein line, as well as manufacturer brands,
such as Beyond Meat and Impossible Foods
– Performance Food Group launched the Green Origin brand in November, a proprietary line of
plant-based protein products made exclusively by Greenleaf Foods (owns Lightlife & Field Roast)
– US Foods offers several plant-based protein products through its proprietary brands Molly’s
Kitchen and Chef’s Line
222

Plant-based protein2021 considerations
Incrementality – likely to decrease given:
– Reduced Exclusivity – as more restaurants offer the products, the incremental benefit from
launching plant-based protein on the menu could be lower
– Substitution – plant-based protein to take market share from traditional proteins, making it less
incremental over time
– Increased supply in all channels – more competitors among existing large scale distributors in
retail channels, with repeat purchases the focus
Leveraging brand name – unclear whether plant-based innovation contribution is as impactful
without the brand names (Beyond & Impossible)
Costs – likely to decrease as new suppliers enter the market
Launch of other plant-based products (chicken, fish) – opportunity unclear (KFC has conducted a
few tests of Beyond Fried Chicken and appears to have plans to launch more broadly; though
perceptions of benefits to health/environment potentially lower)
Drivers of plant-based protein demand – health; environment
223

Increasing presence of plant-based protein in restaurantsExpanding breadth of consumers & occasions
Many large QSRs have tested, launched or discussed the addition of plant-based protein on menus
– Burger King was an early adopter with plant-based protein with the launch of the Impossible Whopper in August 2019, noting meaningful sales contribution and new customers & occasions
– Dunkin’ was among the first brands to introduce plant-based sausage in the breakfast segment with the rollout of the Beyond Sausage Sandwich in November 2019; Dunkin’ noted outsized
adoption among younger cohorts, females and on the coast, and has generated high
attachment, trial and repeat purchase
– McDonald’s recently unveiled a new McPlant platform, though has not indicated near-term plans for a launch of plant-based protein products; the company previously ran a six-month trial
of the P.L.T. (stands for Plant, Lettuce, Tomato) burger in partnership with Beyond, though the
test was ended in April 2020, with no obvious plans for a larger partnership
– Starbucks introduced the Impossible Breakfast Sandwich in the US in June 2020
– Tim Hortons launched Beyond Meat Sausage & Burgers in Canada, though they were removed from the menu following lackluster results
– Jack in the Box offered its Unchicken sandwich at select locations from 10/15-12/12 featuring Tyson’s Raised & Rooted brand
– KFC has conducted a few tests with Beyond Meat, including in Southern California in July 2020, in Nashville and Charlotte in February 2020 and in a one-day test in Atlanta in August 2019
– Pizza Hut, Carl’s Jr., Hardee’s, A&W, Del Taco, Subway and others have also launched plant-based menu items
224
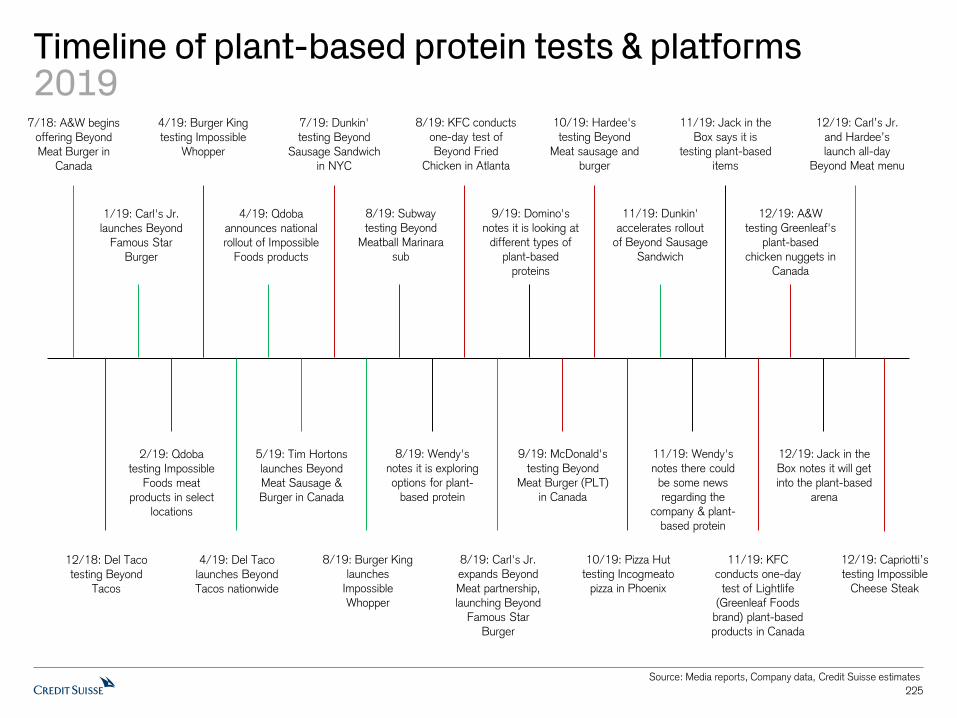
Timeline of plant-based protein tests & platforms2019
225
Source: Media reports, Company data, Credit Suisse estimates
7/18: A&W begins
offering Beyond Meat Burger in
Canada
1/19: Carl's Jr. launches Beyond
Famous Star Burger
2/19: Qdoba testing Impossible
Foods meat products in select
locations
4/19: Burger King
testing Impossible Whopper
4/19: Del Taco launches Beyond
Tacos nationwide
4/19: Qdoba announces national
rollout of Impossible Foods products
5/19: Tim Hortons launches Beyond Meat Sausage & Burger in Canada
7/19: Dunkin'
testing Beyond Sausage Sandwich
in NYC
8/19: Burger King
launches Impossible Whopper
8/19: Subway
testing Beyond Meatball Marinara
sub
8/19: Wendy's notes it is exploring
options for plant-based protein
8/19: KFC conducts one-day test of Beyond Fried
Chicken in Atlanta
8/19: Carl's Jr.
expands Beyond Meat partnership, launching Beyond
Famous Star Burger
9/19: Domino's
notes it is looking at different types of
plant-based proteins
9/19: McDonald's testing Beyond
Meat Burger (PLT) in Canada
10/19: Pizza Hut
testing Incogmeato pizza in Phoenix
10/19: Hardee's testing Beyond
Meat sausage and
burger
11/19: Dunkin'
accelerates rollout of Beyond Sausage
Sandwich
11/19: Wendy's notes there could
be some news regarding the
company & plant-
based protein
11/19: Jack in the Box says it is
testing plant-based
items
11/19: KFC
conducts one-day test of Lightlife
(Greenleaf Foods
brand) plant-based products in Canada
12/19: A&W
testing Greenleaf's plant-based
chicken nuggets in Canada
12/19: Jack in the Box notes it will get
into the plant-based arena
12/19: Carl’s Jr. and Hardee’s launch all-day
Beyond Meat menu
12/19: Capriotti’s
testing Impossible Cheese Steak
12/18: Del Taco testing Beyond
Tacos

Timeline of plant-based protein tests & platforms2020
226
Source: Media reports, Company data, Credit Suisse estimates
2/20: KFC tests Beyond Fried Chicken
6/20: Yum China
introduces Beyond Burgers across the
portfolio
4/20: McDonald's ends test of Beyond
Meat Burger (PLT) in Canada
7/20: KFC tests Beyond
Meat chicken nuggets
8/20: KFC adds Lightlife (Greenleaf
Foods brand) plant-based chicken
sandwich to menu in
Canada
6/20: Burger King launches Impossible
Breakfast Sandwiches nationwide
3/20: El Pollo Loco launches its own
plant-based chicken alternative products
8/20: Dunkin' rolls
out oat milk across US
1/20: Ruby Tuesday launches plant-based
Sweet Earth Awesome Burger
4/20: KFC tests
plant-based chicken nuggets in China
7/20: Starbucks launches Impossible
Breakfast Sandwich in
US
9/20: Starbucks adds oat milk and almond
milk beverages to its menu in seven
markets across Asia
1/20: McDonald's expands test of
Beyond Meat Burger
(PLT) in Canada
2/20: Wendy's launches plant-based "The Plantiful" burger
in Canada
9/20: TGI Fridays adds several Beyond
Meat plant-based protein menu items
10/20: Jack in the Box tests Raised &
Rooted plant-based Unchicken sandwich
9/20: Papa Murphy's launches new plant-
based pepperoni-style topping in partnership
with Hormel Foods
4/20: Starbucks debuts Beyond Meat
products in China
10/20: Starbucks tests Plant Powered
Breakfast Sandwich at one location in Washington
11/20: McDonald's unveils its plant-based
platform, McPlant
11/20: Pizza Hut launches Beyond
Meat pizzas
1/21: Dunkin’ launches Southwest
Veggie Power
Breakfast Sandwich in partnership with
MorningStar
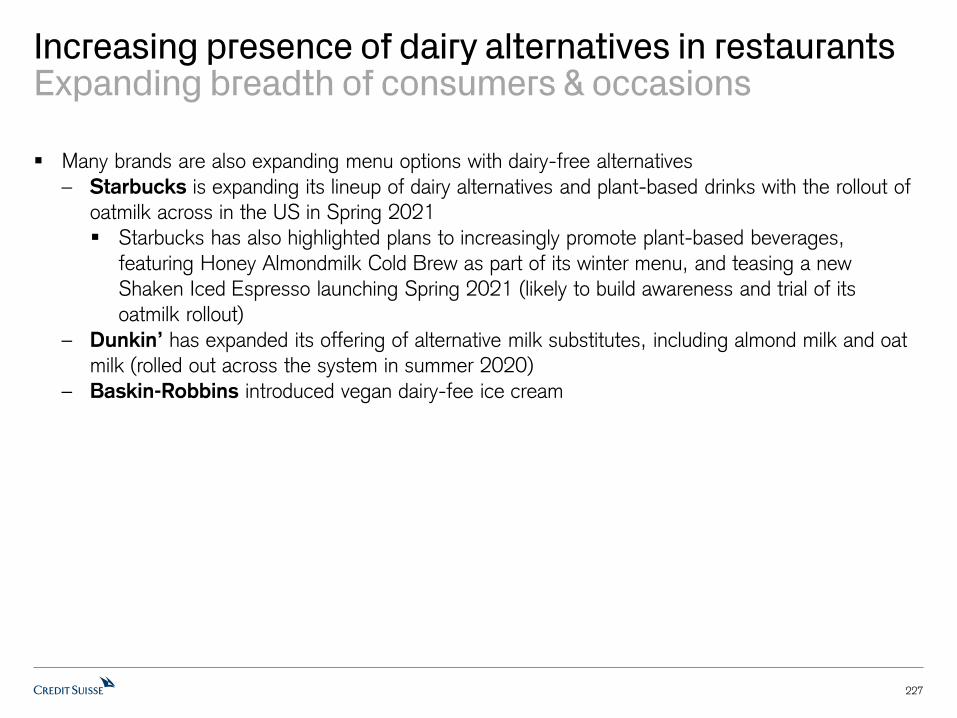
Increasing presence of dairy alternatives in restaurantsExpanding breadth of consumers & occasions
Many brands are also expanding menu options with dairy-free alternatives
– Starbucks is expanding its lineup of dairy alternatives and plant-based drinks with the rollout of oatmilk across in the US in Spring 2021
Starbucks has also highlighted plans to increasingly promote plant-based beverages,
featuring Honey Almondmilk Cold Brew as part of its winter menu, and teasing a new
Shaken Iced Espresso launching Spring 2021 (likely to build awareness and trial of its
oatmilk rollout)
– Dunkin’ has expanded its offering of alternative milk substitutes, including almond milk and oat milk (rolled out across the system in summer 2020)
– Baskin-Robbins introduced vegan dairy-fee ice cream
227

Other ways to play with plantsConsistent with brand positioning
We expect companies will pursue other plant-forward initiatives that align with brand positioning
Chipotle
In early January, Chipotle rolled out cauliflower rice nationwide as an alternative to rice, noting one in
three new menu requests has been cauliflower rice
We note the brand has previously indicated it has no intentions to add plant-based meat
alternatives, suggesting current products are too processed
Shake Shack
Shake Shack is currently testing an iteration of a veggie burger in ~30 restaurants, featuring real
vegetables in a patty developed by Shake Shack
The brand has previously indicated it has no plans to add Beyond or Impossible to its menu in the
near future
Taco Bell
Taco Bell continues to focus on featuring its existing vegetarian menu options, which represent
nearly 10% of the menu, including the return of potatoes to the menu in March
Taco Bell recently announced it is partnering with Beyond Meat to create an innovative new plant-
based protein that it will test in the next year
228

229
Labor
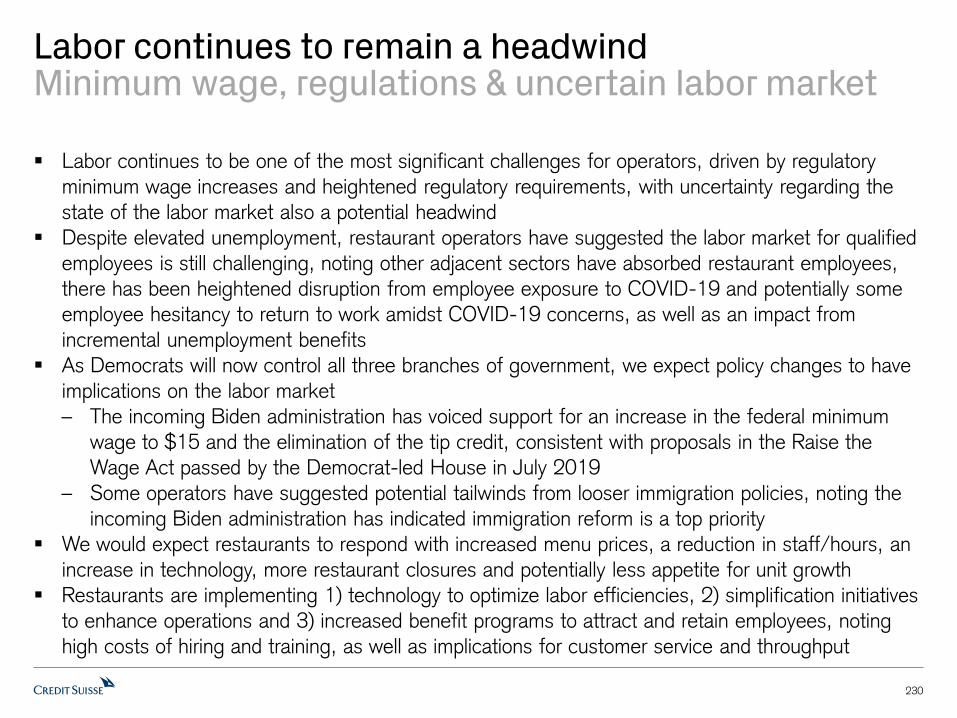
Labor continues to remain a headwindMinimum wage, regulations & uncertain labor market
Labor continues to be one of the most significant challenges for operators, driven by regulatory
minimum wage increases and heightened regulatory requirements, with uncertainty regarding the
state of the labor market also a potential headwind
Despite elevated unemployment, restaurant operators have suggested the labor market for qualified
employees is still challenging, noting other adjacent sectors have absorbed restaurant employees,
there has been heightened disruption from employee exposure to COVID-19 and potentially some
employee hesitancy to return to work amidst COVID-19 concerns, as well as an impact from
incremental unemployment benefits
As Democrats will now control all three branches of government, we expect policy changes to have
implications on the labor market
– The incoming Biden administration has voiced support for an increase in the federal minimum
wage to $15 and the elimination of the tip credit, consistent with proposals in the Raise the
Wage Act passed by the Democrat-led House in July 2019
– Some operators have suggested potential tailwinds from looser immigration policies, noting the
incoming Biden administration has indicated immigration reform is a top priority
We would expect restaurants to respond with increased menu prices, a reduction in staff/hours, an
increase in technology, more restaurant closures and potentially less appetite for unit growth
Restaurants are implementing 1) technology to optimize labor efficiencies, 2) simplification initiatives
to enhance operations and 3) increased benefit programs to attract and retain employees, noting
high costs of hiring and training, as well as implications for customer service and throughput
230

Minimum WageContinues to add pressure to margins
26 states have planned minimum wage increases for 2021, relative to 26 states in 2020, 23 in
2019 and 21 in 2018
– We estimate the average minimum wage (not population weighted) will increase ~3.5% in 2021
following 4%+ in 2020, 3%+ in 2019 and ~2.5% in 2018
An increasing number of cities & states have also enacted or have plans to increase minimum
wages to $15 per hour over time, more than double the federal minimum wage ($7.25), which is in
addition to advocates for a federal increase to $15 per hour
231
Source: Economic Policy Institute, Bureau of Labor Statistics, Credit Suisse estimates
Average Minimum Wage & YOY %# States/Districts – Minimum Wage Increases
0.0%
0.5%
1.0%
1.5%
2.0%
2.5%
3.0%
3.5%
4.0%
4.5%
$7.80
$8.00
$8.20
$8.40
$8.60
$8.80
$9.00
$9.20
$9.40
$9.60
$9.80
$10.00
2017 2018 2019 2020 2021
YO
Y %
Ave
rage M
inim
um
Wage
Average Minimum Wage YOY %
2221
23
26 26
10
12
14
16
18
20
22
24
26
28
2017 2018 2019 2020 2021
# S
tate
/Dis
tric
ts -
Min
Wage Incr
ease
s

Minimum WageCompanies facing most pressure
Companies with higher company ownership mixes will face more direct pressure on margins &
flowthrough
– But all companies are affected given impact on franchisee profitability, sentiment and unit growth
232
Source: Economic Policy Institute, Bureau of Labor Statistics, Company data, Credit Suisse estimates
2020 vs 2021 Weighted Average Minimum by State Exposure2021 Weighted Average Minimum by State Exposure & Franchise %
0%
2%
4%
6%
8%
10%
12%
14%
JACK SHAK SBUX CMG MCD DPZ QSR YUM WEN PZZA
Weig
hte
d A
vg M
in W
age Y
OY
%
2020 2021
JACK
SHAK
SBUXCMG
MCDQSR
DPZ
YUM
WENPZZA
$8.60
$9.10
$9.60
$10.10
$10.60
$11.10
$11.60
0% 20% 40% 60% 80% 100%
202
1 W
eig
hte
d A
vg M
in W
age b
y S
tate
% Franchised
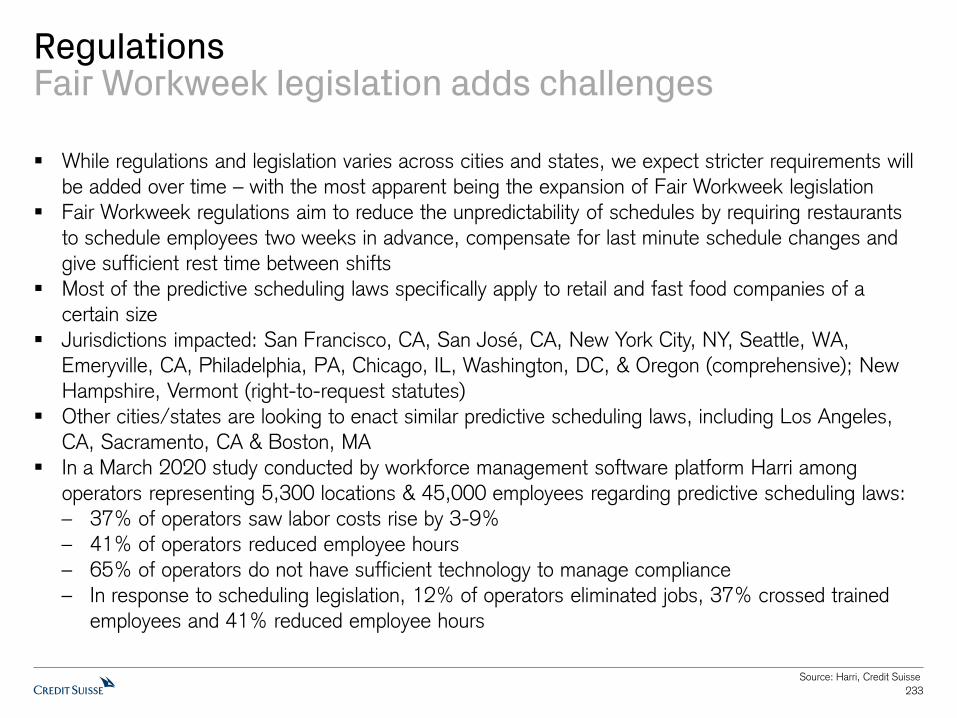
RegulationsFair Workweek legislation adds challenges
While regulations and legislation varies across cities and states, we expect stricter requirements will
be added over time – with the most apparent being the expansion of Fair Workweek legislation
Fair Workweek regulations aim to reduce the unpredictability of schedules by requiring restaurants
to schedule employees two weeks in advance, compensate for last minute schedule changes and
give sufficient rest time between shifts
Most of the predictive scheduling laws specifically apply to retail and fast food companies of a
certain size
Jurisdictions impacted: San Francisco, CA, San José, CA, New York City, NY, Seattle, WA,
Emeryville, CA, Philadelphia, PA, Chicago, IL, Washington, DC, & Oregon (comprehensive); New
Hampshire, Vermont (right-to-request statutes)
Other cities/states are looking to enact similar predictive scheduling laws, including Los Angeles,
CA, Sacramento, CA & Boston, MA
In a March 2020 study conducted by workforce management software platform Harri among
operators representing 5,300 locations & 45,000 employees regarding predictive scheduling laws:
– 37% of operators saw labor costs rise by 3-9%
– 41% of operators reduced employee hours
– 65% of operators do not have sufficient technology to manage compliance
– In response to scheduling legislation, 12% of operators eliminated jobs, 37% crossed trained
employees and 41% reduced employee hours
233
Source: Harri, Credit Suisse

Marching to a $15 minimum wageThe fight continues
A $15 minimum wage remains at the forefront of economic debates, noting the Democratic-led
House passed the Raise the Wage Act in July 2019 to increase the minimum wage to $15 and the
incoming Biden administration has voiced support regarding raising the minimum wage to $15
(which was included as part of the proposed $1.9TN “American Rescue Plan”)
Eight states have passed laws to increase their statutory minimum wages to $15/hour over time,
including more traditionally progressive states like New York & California, Democratic-leaning
Illinois, New Jersey, Massachusetts, Maryland & Connecticut, and a politically split Florida
– In November 2020, Florida passed an amendment to the state minimum wage to increase it to
$15/hour by 2026
A $15 federal minimum wage would more than double the current $7.25 minimum wage, noting 30
states have state minimum wages above the current federal level, while 20 have state minimum
wages (or have not adopted a state minimum wage) equivalent to the federal minimum wage
The Fight for $15 movement attracted widespread attention in 2012 in response to a strike by QSR
employees in NYC advocating for higher wages, better working conditions & the right to form a
union without retaliation from management, and has since been followed by many other strikes
across the country
234

The Good: Fight for $15Improving living wage
The Fight for $15 is a progressive movement advocating for lawmakers to increase the federal
minimum wage to $15/hour, and has garnered greater support from the Democratic party, noting
the Raise the Wage Act was passed in 2019, which would gradually raise the wage to $15/hour
Proponents of the increase highlight an increase in wages would help stimulate the economy as
workers have additional income to spend and improve pay inequality
Based on a 2019 analysis by the Economic Policy Institute (EPI), the gradual increase in the federal
minimum wage to $15/hour would:
– Increase pay for nearly 40MM workers, more than 25% of the US workforce, including 2/3 of
the working poor in America
– Increase pay by an average of $3,000 per year per worker
– Generate $120BN in higher wages for workers
235
Source: Economic Policy Institute, Credit Suisse

Opponents: Fight for $15Costs outweigh the benefits
Opponents argue that the costs outweigh the benefits, noting the increase in minimum wage would
lead to a reduction in employee hours to offset the costs & slowdown in job growth
Those against the increase also argue that the minimum wage hike would disproportionately weigh
on small & midsize businesses operating at lower margins, and thus would require an increase in
prices that could impact their competitive positioning relative to larger companies operating with
better economies of scale and better pricing power
A 2019 analysis by the Congressional Budget Office (CBO) assessing the impact of a $10, $12 or
$15 federal minimum wage communicated uncertainty regarding the impact, noting earnings for
most low-wage workers would increase, though others would lose their jobs as a result
Critics point to the “one size fits all” approach as an inappropriate policy given differences in the cost
of living across the US and ability for businesses to afford the increases
The National Restaurant Association has voiced opposition to the Raise the Wage Act, noting
“mandating a $15 per hour starting wage across the country fails to recognize the simple economic
reality that not all communities are the same. What might be right for California or New York would
have stifling impacts to restaurants and other small businesses in areas where workers do not face
the cost of living they do in major cities”
236
Source: Congressional Budget Office, National Restaurant Association, Credit Suisse

Closing the gap to a $15 minimum wageBig implications
237
% Increase – 2021 State Minimum Wage to $15/hour2021 State Minimum Wage
Source: Economic Policy Institute, Bureau of Labor Statistics, Credit Suisse estimates
3
6
12
9
20
22%
9%
15% 18%
35%
0%
5%
10%
15%
20%
25%
30%
35%
40%
0
5
10
15
20
25
0-1
0%
10-2
5%
25-5
0%
50-1
00%
100
%+
0-1
0%
10-2
5%
25-5
0%
50-1
00%
100
%+
# of States % of Restaurants
% o
f R
est
aura
nts
# o
f S
tate
s
% Increase - 2021 State Minimum Wage to $15/hour
In 2021, 30 states (representing ~65% of restaurants) will have minimum wages above the federal
level, and 20 states have state minimum wages (or have not adopted a state minimum wage)
equivalent to the federal $7.25
To close the gap to $15/hour, 41 states representing nearly 70% of restaurants would experience
minimum wage increases of at least 25%, with 15% of restaurants to see an increase of 25-50%,
18% to see an increase of 50-100% and 35% of restaurants to see an increase of 100%+
20
30
35%
65%
0%
10%
20%
30%
40%
50%
60%
70%
0
5
10
15
20
25
30
35
$7.25 Minimum
Wage
State Miminum
Wage Above
Federal
$7.25 Minimum
Wage
State Miminum
Wage Above
Federal
# of States % of Restaurants
% o
f R
est
aura
nts
# o
f S
tate
s
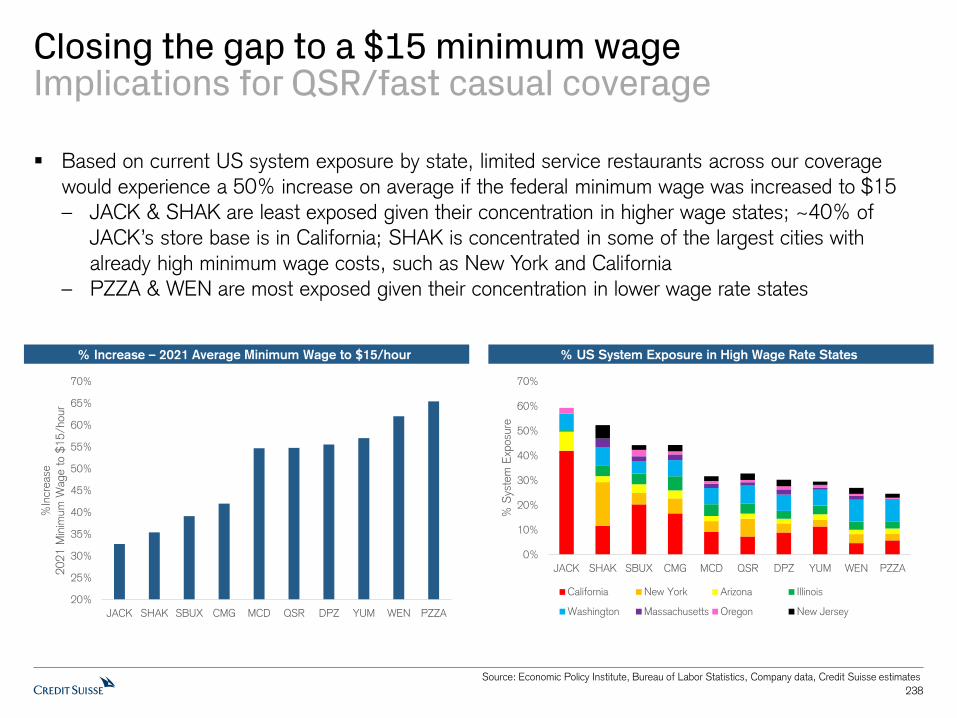
Closing the gap to a $15 minimum wageImplications for QSR/fast casual coverage
238
% US System Exposure in High Wage Rate States% Increase – 2021 Average Minimum Wage to $15/hour
Source: Economic Policy Institute, Bureau of Labor Statistics, Company data, Credit Suisse estimates
Based on current US system exposure by state, limited service restaurants across our coverage
would experience a 50% increase on average if the federal minimum wage was increased to $15
– JACK & SHAK are least exposed given their concentration in higher wage states; ~40% of
JACK’s store base is in California; SHAK is concentrated in some of the largest cities with
already high minimum wage costs, such as New York and California
– PZZA & WEN are most exposed given their concentration in lower wage rate states
20%
25%
30%
35%
40%
45%
50%
55%
60%
65%
70%
JACK SHAK SBUX CMG MCD QSR DPZ YUM WEN PZZA
%In
crease
20
21
Min
imum
Wage t
o $
15
/hour
0%
10%
20%
30%
40%
50%
60%
70%
JACK SHAK SBUX CMG MCD QSR DPZ YUM WEN PZZA
% S
yste
m E
xposu
re
California New York Arizona Illinois
Washington Massachusetts Oregon New Jersey

Eliminating the tip creditUnlikely to gain support from restaurant stakeholders
The incoming Biden administration has voiced support regarding the elimination of the tip credit,
which allows full service restaurants to pay a sub minimum wage to employees that earn tips,
provided that they earn at least minimum wage
– As part of the Raise the Wage Act, tipped minimum wage would gradually increase over several
years until it reached the minimum wage for non-tipped employees
Darden has suggested the elimination of the tip credit is attempting to solve a problem that doesn’t
exist, as neither guest nor tipped employee would benefit from the change, noting all tipped
employees are making at least the minimum wage, if not even higher
– For reference, the average Olive Garden server makes $16-17 per hour & Capital Grille
employee makes over $40 per hour
The National Restaurant Association has voiced opposition to the elimination of the tip credit, noting
“the tip credit allows tipped-employees to earn far more than the minimum wage, while helping to
reduce labor costs for restaurants and others that operate on thin profit margins”
While the Economic Policy Institute released a study suggesting one in six restaurant workers live
below the official poverty line and are more likely to be poor, others suggest inherent flaws in this
type of data/analysis, suspecting employees may not declare all tips and restaurants might pay off
the books
239
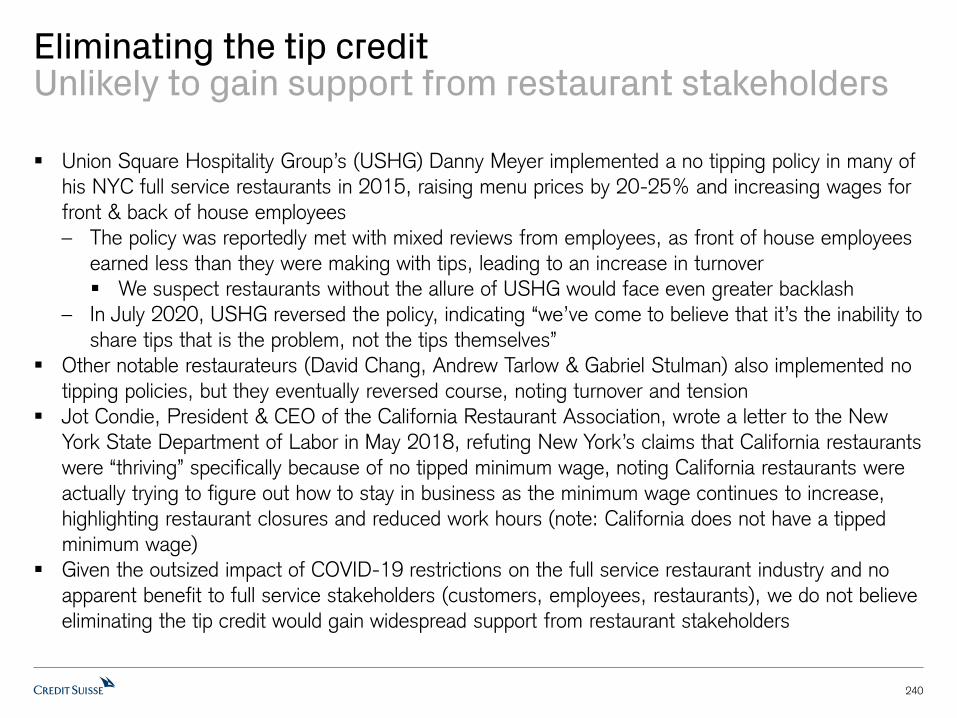
Eliminating the tip creditUnlikely to gain support from restaurant stakeholders
Union Square Hospitality Group’s (USHG) Danny Meyer implemented a no tipping policy in many of
his NYC full service restaurants in 2015, raising menu prices by 20-25% and increasing wages for
front & back of house employees
– The policy was reportedly met with mixed reviews from employees, as front of house employees
earned less than they were making with tips, leading to an increase in turnover
We suspect restaurants without the allure of USHG would face even greater backlash
– In July 2020, USHG reversed the policy, indicating “we’ve come to believe that it’s the inability to
share tips that is the problem, not the tips themselves”
Other notable restaurateurs (David Chang, Andrew Tarlow & Gabriel Stulman) also implemented no
tipping policies, but they eventually reversed course, noting turnover and tension
Jot Condie, President & CEO of the California Restaurant Association, wrote a letter to the New
York State Department of Labor in May 2018, refuting New York’s claims that California restaurants
were “thriving” specifically because of no tipped minimum wage, noting California restaurants were
actually trying to figure out how to stay in business as the minimum wage continues to increase,
highlighting restaurant closures and reduced work hours (note: California does not have a tipped
minimum wage)
Given the outsized impact of COVID-19 restrictions on the full service restaurant industry and no
apparent benefit to full service stakeholders (customers, employees, restaurants), we do not believe
eliminating the tip credit would gain widespread support from restaurant stakeholders
240
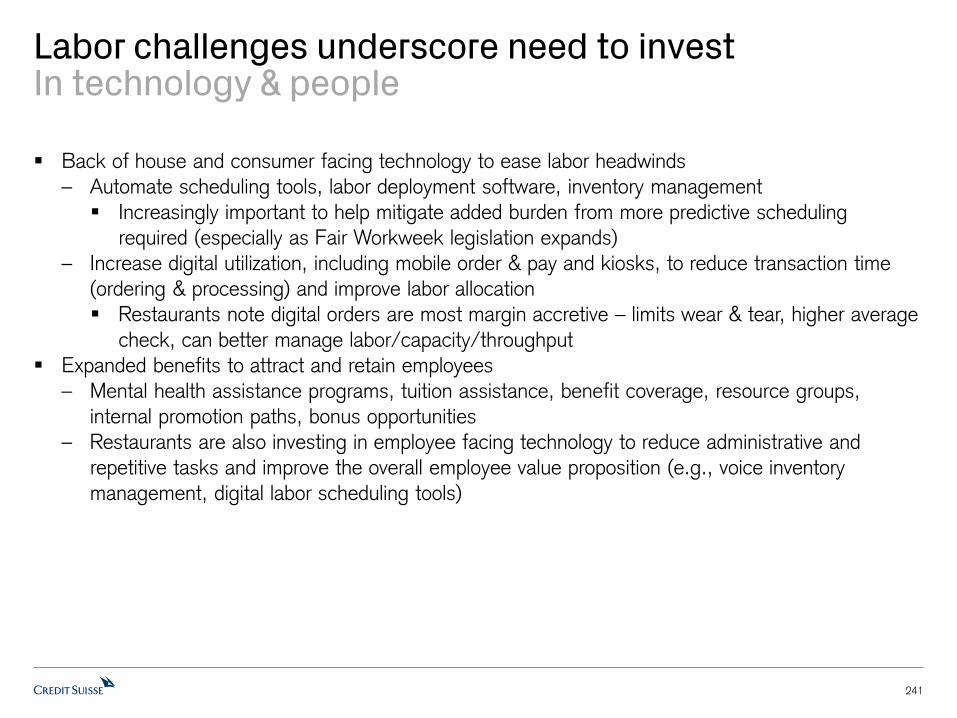
Labor challenges underscore need to investIn technology & people
Back of house and consumer facing technology to ease labor headwinds
– Automate scheduling tools, labor deployment software, inventory management
Increasingly important to help mitigate added burden from more predictive scheduling
required (especially as Fair Workweek legislation expands)
– Increase digital utilization, including mobile order & pay and kiosks, to reduce transaction time
(ordering & processing) and improve labor allocation
Restaurants note digital orders are most margin accretive – limits wear & tear, higher average
check, can better manage labor/capacity/throughput
Expanded benefits to attract and retain employees
– Mental health assistance programs, tuition assistance, benefit coverage, resource groups,
internal promotion paths, bonus opportunities
– Restaurants are also investing in employee facing technology to reduce administrative and
repetitive tasks and improve the overall employee value proposition (e.g., voice inventory
management, digital labor scheduling tools)
241

Labor challenges underscore need to investSelect examples of companies investing
Starbucks
People (already offers among the best benefits for its partners in the industry) – increased wages for
hourly employees by at least 10% in mid-December, one of the most significant investments in its
partners in the company’s history; offers full tuition for Arizona State University’s online program (to
participate, employees must work a minimum of 20 hours/week & eligible day one of employment)
Technology – as part of the Deep Brew initiative, the company is leveraging artificial intelligence to
optimize labor scheduling and inventory management
Chipotle
People – began testing unlimited paid time off for select employees in March & enhanced its Paid
Parental Leave program to provide 12 weeks of paid leave for birth moms & four weeks for new
dads; enhanced Debt-Free Degrees program, which covers 100% of tuition costs up front, to
include Paul Quinn College, one of the oldest Historically Black Colleges & Universities in the
country; offers tuition assistance (hourly crew members eligible after one year and salaried & hourly
managers eligible day one of employment)
Technology – digital ordering channels reduce labor required; added digital elements to secondary
production lines to enhance productivity
242

Labor challenges underscore need to investSelect examples of companies investing
Domino’s
Technology – rolled out GPS driver tracker technology, which generates in-store labor efficiencies
and better manages delivery drivers (drivers can stay in vehicle when returning for another delivery
order); implementation of smart make-line tools
McDonald’s
People – enhanced its Archways to Opportunity program, an educational initiative for employees, to
include an Archways to Careers app designed to help employees develop & explore future career
opportunities (whether at McDonald’s or elsewhere); in 2018, committed to increase funding for the
tuition program by $150MM over five years (eligible after 90 days of employment)
Technology – acquired Apprente for voice technology, which should offer labor savings through use
of AI and reduced labor required at the drive-thru
Yum! Brands
People – Taco Bell offers tuition discounts through Guild Education & tuition assistance; Pizza Hut
offers tuition assistance and discounts (after 60 days of service); KFC offers the REACH
Educational Grant Program to hourly employees (after six months of service); YUM acquired
Heartstyles, a leadership development platform; YUM committed to invest $100MM over five years
by establishing the Unlocking Opportunity Initiative, with a focus on equity & inclusion, education
and entrepreneurship
243

244
Margin Outlook

Reassessing spending needsIdentifying efficiencies & investment opportunities
245
Unprecedented challenges have presented unprecedented opportunities for companies to reassess
their spending needs and investment priorities
– Companies have identified cost savings opportunities through reorganizations, portfolio
optimization (e.g., closures of underperforming stores), enhanced productivity, menu
simplification, reductions in marketing spend, reduced travel & other areas of the business
– Companies have also reassessed go forward strategies, noting greater investment in technology
as companies recognize the importance of holistic technological infrastructures to expand
competitive moats
We also believe scale is becoming increasingly important as companies ramp up digital investments
Darden, The Cheesecake Factory & Bloomin’ Brands have all identified cost savings opportunities
with expectations for sustainably higher margins going forward
McDonald’s, Yum! Brands & Wendy’s have suggested incremental digital investments are likely as
they build out technology and data analytics teams
Heavily franchised QSRs generally operate at the highest level of efficiencies as they are naturally
less capital intensive, while casual dining companies generally have higher G&A metrics as they are
primarily company-operated business models, are smaller than QSR peers (less scale) and are
larger boxes more susceptible to wear and tear given a higher dine-in mix

0.0%
5.0%
10.0%
15.0%
20.0%
25.0%
30.0%
JACK CMG DPZ QSR PZZA SHAK YUM MCD WEN
Rest
auara
nt
Marg
in
FY19 Actual FY20E FY21E FY22E FY23E
Mixed margin outlook for QSR/fast casual companiesLean models & investment opportunities
Following refranchising and cost savings efforts enacted over the last several years, most heavily
franchised QSRs are already running lean business models, with sales leverage likely the primary
driver of future margin improvement, especially with incremental investments in technology
Consensus models restaurant margin improvement relative to FY19 levels for CMG, PZZA, MCD &
WEN, and restaurant margin contraction for SHAK, JACK, YUM, DPZ & QSR
Consensus models 500-600bps of operating margin improvement for CMG & PZZA, ~350bps for
WEN, 100-200bps for QSR, DPZ, SBUX & MCD and contraction for YUM, SHAK & JACK vs FY19
246
Source: Consensus Metrix, Company data, Credit Suisse estimates
Operating MarginsRestaurant Margins
Limited Service Restaurants
-20.0%
-10.0%
0.0%
10.0%
20.0%
30.0%
40.0%
50.0%
MCD QSR YUM JACK WEN DPZ SBUX CMG PZZA SHAK
Opera
ting M
arg
in
FY19 Actual FY20E FY21E FY22E FY23E

Casual dining companies suggest improved marginsDriven by efficiencies & productivity gains
Casual diners have indicated efficiencies & productivity gains achieved throughout the pandemic
should support sustainably higher margins post-COVID, largely through labor and G&A – consensus
models margin improvement for DRI, TXRH & BLMN, & lower margins for CAKE in FY23 vs FY19
DRI expects its run rate margins to improve by ~150bps and has noted it can achieve pre-COVID
EBITDA at ~90% of prior sales levels (consensus models ~170bps of improvement by FY23)
CAKE has noted it can return to pre-COVID margins at 90-95% of prior sales and expects run rate
margins to be sustainably higher going forward (consensus models margins down relative to FY19)
247
Source: Consensus Metrix, Company data, Credit Suisse estimates
Operating MarginsRestaurant Margins
Full Service Restaurants
21.7%
17.3% 15.7%
14.7%
22.6%
17.7%
15.4% 15.0%
0.0%
5.0%
10.0%
15.0%
20.0%
25.0%
DRI TXRH CAKE BLMN
Rest
auara
nt
Marg
in
FY19 Actual FY20E FY21E FY22E FY23E
10.0%
7.7%
5.2% 4.8%
11.7%
8.8%
4.9% 5.5%
-6.0%
-4.0%
-2.0%
0.0%
2.0%
4.0%
6.0%
8.0%
10.0%
12.0%
14.0%
DRI TXRH CAKE BLMN
Opera
ting M
arg
in
FY19 Actual FY20E FY21E FY22E FY23E

19.0%
17.8%
12.7%
19.1%
17.6%
12.0%
10.0%
11.0%
12.0%
13.0%
14.0%
15.0%
16.0%
17.0%
18.0%
19.0%
20.0%
SYY USFD PFGC
Gro
ss M
arg
in
FY19 Actual FY20E FY21E FY22E FY23E
4.5%
3.4%
1.8%
4.9%
3.6%
1.9%
0.0%
1.0%
2.0%
3.0%
4.0%
5.0%
6.0%
SYY USFD PFGC
Opera
ting M
arg
in
FY19 Actual FY20E FY21E FY22E FY23E
Food distributors expect improved margin outlookDriven by efficiencies & productivity gains
SYY, USFD and PFGC have all indicated expectations for improved margin outlooks in a post-
COVID environment, largely driven by efficiencies and productivity gains within G&A
– All three have suggested gross margins are largely stable by customer, though enterprise gross
margins could be impacted temporarily as a result of customer mix shift
SYY identified $350MM of cost savings in FY21, with the majority to flow to the bottom line, noting
additional cost savings opportunities in FY22
USFD identified $180MM of fixed cost savings, with the majority to flow to the bottom line
248
Source: Consensus Metrix, Company data, Credit Suisse estimates
Operating MarginsGross Margins
Food Distributors
G&A Benchmarking Analysis
249
What’s in G&A? General & administrative expense is typically comprised of expenses that support the development and operations of restaurants but fall outside of the restaurants’ four walls. These
include: executive compensation and benefits, regional management compensation, travel costs, IT
systems, legal and professional fees, corporate office expense and other related corporate costs.
Some companies include advertising & marketing expenses in some cases ("selling" expense in
SG&A), though the allocation of these costs vary by company
Benchmarking methodology & metrics: We calculated two comparative metrics: G&A per average store and G&A as a % of system sales. Each company’s G&A (last fiscal year) has been
adjusted for non-recurring items & marketing/advertising expenses (if applicable). Our analysis also
takes into account varying levels of franchise ownership across the industry (franchise models are
naturally less capital intensive)
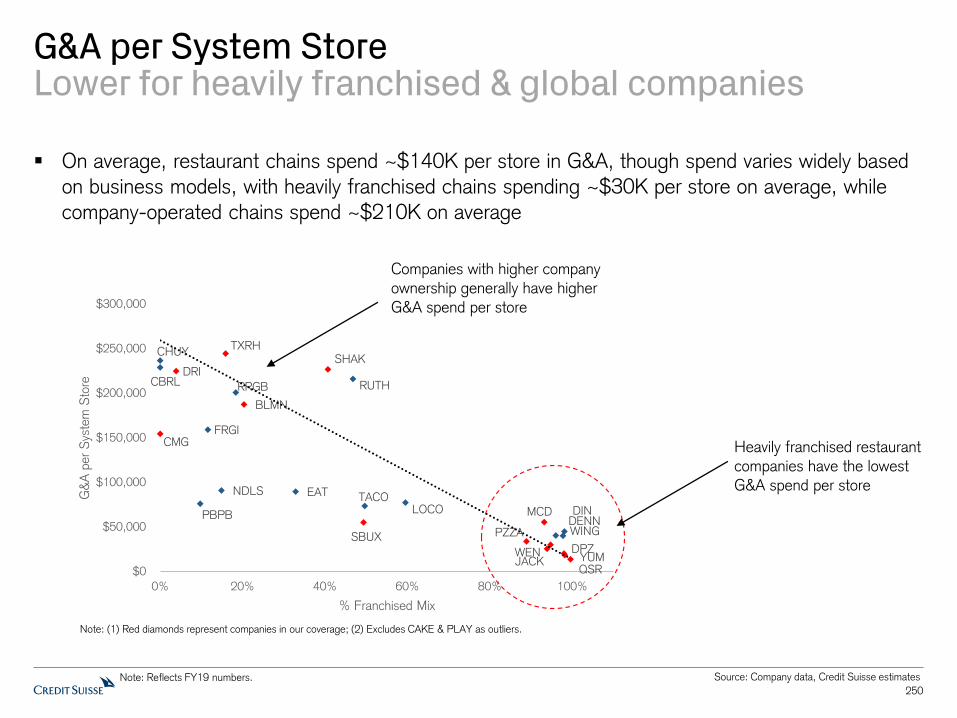
DENNDIN
EAT
BLMN
RRGB RUTHDRI
CBRL
CHUYTXRH
QSRYUM
DPZJACKWEN
PZZA WINGSBUX
MCD
TACO
PBPB LOCO
NDLS
CMGFRGI
SHAK
$0
$50,000
$100,000
$150,000
$200,000
$250,000
$300,000
0% 20% 40% 60% 80% 100%
G&
A p
er
Sys
tem
Sto
re
% Franchised Mix
G&A per System StoreLower for heavily franchised & global companies
250
Source: Company data, Credit Suisse estimates
On average, restaurant chains spend ~$140K per store in G&A, though spend varies widely based
on business models, with heavily franchised chains spending ~$30K per store on average, while
company-operated chains spend ~$210K on average
Heavily franchised restaurant companies have the lowest G&A spend per store
Note: (1) Red diamonds represent companies in our coverage; (2) Excludes CAKE & PLAY as outliers.
Companies with higher company ownership generally have higher G&A spend per store
Note: Reflects FY19 numbers.

DENN DIN
EAT
BLMN
RRGB
RUTH
DRICBRL
CHUY
TXRH
BJRI
CAKE
PLAY
QSR
YUM
DPZ
JACKWEN
PZZA
WINGSBUX
MCD
TACO
PBPB
LOCO
NDLS
CMG
FRGI SHAK
0.0%
1.0%
2.0%
3.0%
4.0%
5.0%
6.0%
7.0%
8.0%
9.0%
0% 20% 40% 60% 80% 100%
G&
A a
s %
of
Sys
tem
Sale
s
% Franchised Mix
G&A as a % of System SalesLower for heavily franchised & global companies
251
Source: Company data, Credit Suisse estimates
On average, restaurant chains spend ~4.5% of system sales on G&A, though spend varies widely
based on business models, with heavily franchised chains spending ~2.5% of system sales on
average and company-operated chains spend ~6% on average
Note: Red diamonds represent companies in our coverage.
Heavily franchised restaurant companies have the lowest G&A as a percentage of system sales
Companies with higher company ownership generally have higher G&A as a % of system sales
Note: Reflects FY19 numbers.

G&A BenchmarkingQSR & Fast Casual Restaurants
252
Source: Company data, Credit Suisse estimates
G&A as % of System Sales
G&A per System Store
G&A as % of System Sales
G&A per System Store
0.0%
1.0%
2.0%
3.0%
4.0%
5.0%
6.0%
7.0%
8.0%
9.0%
PB
PB
ND
LS
FR
GI
CM
G
SH
AK
TA
CO
PZ
ZA
SB
UX
LO
CO
WIN
G
DP
Z
MC
D
WE
N
YU
M
JA
CK
QS
R
G&
A a
s %
of
Sys
tem
Sale
s
$0K
$50K
$100K
$150K
$200K
$250K
SH
AK
FR
GI
CM
G
ND
LS
LO
CO
PB
PB
TA
CO
MC
D
SB
UX
WIN
G
PZ
ZA
WE
N
JA
CK
DP
Z
YU
M
QS
R
G&
A p
er
Sys
tem
Sto
re
Company G&A as % of System Sales
Potbelly (PBPB) 8.0%
Noodles (NDLS) 7.8%
Fiesta Restaurant Group (FRGI) 7.5%
Chipotle (CMG) 7.3%
Shake Shack (SHAK) 7.0%
Del Taco (TACO) 5.1%
Papa John's (PZZA) 5.0%
Starbucks (SBUX) 4.4%
El Pollo Loco (LOCO) 4.2%
Wingstop (WING) 3.7%
Domino's (DPZ) 2.4%
McDonald's (MCD) 2.1%
Wendy's (WEN) 1.9%
Yum! Brands 1.7%
Jack in the Box (JACK) 1.6%
Restaurant Brands International (QSR) 1.1%
Company G&A per System Store
Shake Shack (SHAK) $226,749
Fiesta Restaurant Group (FRGI) $159,162
Chipotle (CMG) $154,526
Noodles (NDLS) $90,910
El Pollo Loco (LOCO) $77,303
Potbelly (PBPB) $76,160
Del Taco (TACO) $73,619
McDonald's (MCD) $55,508
Starbucks (SBUX) $55,093
Wingstop (WING) $40,191
Papa John's (PZZA) $33,687
Wendy's (WEN) $29,911
Jack in the Box (JACK) $25,572
Domino's (DPZ) $20,222
Yum! Brands $18,278
Restaurant Brands International (QSR) $13,623
Note: Reflects FY19 numbers.

G&A BenchmarkingCasual Dining Restaurants
253
Source: Company data, Credit Suisse estimates
G&A as % of System Sales
G&A per System Store
G&A as % of System Sales
G&A per System Store
0.0%
1.0%
2.0%
3.0%
4.0%
5.0%
6.0%
7.0%
8.0%
RR
GB
CA
KE
BLM
N
CH
UY
BJR
I
PL
AY
CB
RL
DR
I
TX
RH
RU
TH
EA
T
DE
NN
DIN
G&
A a
s %
of
Sys
tem
Sale
s
$0K
$100K
$200K
$300K
$400K
$500K
$600K
CA
KE
PL
AY
BJR
I
TX
RH
CH
UY
CB
RL
DR
I
RU
TH
RR
GB
BLM
N
EA
T
DIN
DE
NN
G&
A p
er
Sys
tem
Sto
re
Company G&A as % of System Sales
Red Robin (RRGB) 7.1%
The Cheesecake Factory (CAKE) 6.5%
Bloomin' Brands (BLMN) 5.6%
Chuy's (CHUY) 5.6%
BJ's Restaurants (BJRI) 5.4%
Dave & Buster's (PLAY) 5.1%
Cracker Barrel (CBRL) 5.0%
Darden (DRI) 4.8%
Texas Roadhouse (TXRH) 4.6%
Ruth's Hospitality (RUTH) 4.2%
Brinker International (EAT) 3.9%
Denny's (DENN) 2.3%
Dine Brands (DIN) 2.2%
Company G&A per System Store
The Cheesecake Factory (CAKE) $548,592
Dave & Buster's (PLAY) $510,801
BJ's Restaurants (BJRI) $300,673
Texas Roadhouse (TXRH) $244,499
Chuy's (CHUY) $236,810
Cracker Barrel (CBRL) $229,124
Darden (DRI) $224,778
Ruth's Hospitality (RUTH) $216,237
Red Robin (RRGB) $200,860
Bloomin' Brands (BLMN) $187,398
Brinker International (EAT) $89,657
Dine Brands (DIN) $44,877
Denny's (DENN) $40,527
Note: Reflects FY19 numbers.

254
Portfolio Optimization

Improving the health of the systemProactive closures
Restaurants are using recent challenges as an opportunity to clean up their portfolios with limited
investor pushback, closing stores that were likely unprofitable even before the pandemic
– McDonald’s announced plans to close 200 US stores in 2020, with over half to be lower volume Walmart locations, and 325 US stores in 2021, the majority of which are lower volume
Walmart stores
– Starbucks plans to accelerate the closure of ~500 US and ~300 Canadian company-operated stores, primarily in dense metro markets, a strategy the company was already pursuing given the
highest cost of operating in urban markets
– Restaurant Brands International announced a heightened level of closures in 2020 (“closing several hundred more restaurants than in a typical year”) globally in an effort to improve the
profitability of franchisees & the system, with the 2020 global restaurant count to be similar to
2019 (relative to 1,300+ net opens in 2017-2019)
– Yum! Brands announced a heightened level of closures in 2020 (and likely 2021), particularly related to Pizza Hut, with expectations to have a 2020 global restaurant count similar to 2019
(relative to an average of 1,500-2,000 net opens in 2017-2019)
– Domino’s noted international markets are reassessing their portfolios, acknowledging the potential for additional closures following the closure of ~105 unprofitable stores in India
255

Improving the health of the systemProactive closures
Restaurants are using recent challenges as an opportunity to clean up their portfolios with limited
investor pushback, closing stores that were likely unprofitable even before the pandemic
– Dunkin’ Brands announced plans to close ~800 lower volume US locations in 2020 (including ~450 Speedway units) and an additional 350 international locations across its Dunkin’ and
Baskin-Robbins brands in 2H20
– Dine Brands indicated it was evaluating underperforming domestic IHOP locations, with plans to close up to 100 restaurants through mid-2021, noting these were weaker stores even prior to
the pandemic
– Potbelly announced plans to permanently close 25-30 locations, noting the cumulative TTM EBITDA pre-pandemic was negative, and thus the closures would be profit dollar and margin
accretive
256

Building for future trendsNew prototypes
Restaurants are reevaluating new prototypes and modifications to their existing restaurants, as well
as accelerating prior strategies, to best position the system to enhance new unit economics and
capitalize on consumer trends toward convenience, personalization & an omni-channel experience
– Starbucks is accelerating the transformation of its US store portfolio to increase convenience-led formats with the expansion of Starbucks Pickup stores in dense markets and convenience-
led enhancements such as curbside, drive-thru and walkup windows in suburban areas
– Chipotle expects ~70% of its 2021 new unit class to be Chipotlane units (with ~10% of the asset base to include Chipotlanes by the end of 2021), noting better sales, margins & returns,
and is also testing additional digital-only prototypes with limited dining rooms better suited for
urban markets
Chipotle has highlighted new prototypes have supported an increase in its total unit count
potential in the US to ~6,000 units (2,700+ currently)
– Shake Shack is accelerating its digital strategy with the “Shack Track” platform, which includes the incorporation of drive-up windows, curbside pickup and walk-up windows in new & existing
restaurants to ease the digital ordering & pickup experience; Shake Shack is opening its first
drive-thru in 2021, with plans for 5-8 by the end of 2022
Shake Shack has highlighted that new formats are supporting an increase in the addressable
market potential (current long-term target 450 US company-operated restaurants)
257

Building for future trendsNew prototypes
Restaurants are reevaluating new prototypes and modifications to their existing restaurants, as well
as accelerating prior strategies, to best position the system to enhance new unit economics and
capitalize on consumer trends toward convenience, personalization & an omni-channel experience
– Yum! Brands has unveiled new restaurant prototypes prioritizing the digital experience, including Taco Bell’s new “Go Mobile” concept (smaller unit incorporating dual drive-thru lanes, curbside
pickup & bellhop to facilitate mobile orders), KFC’s next generation prototype (cubbies for digital
orders, self-service kiosks, dedicated parking spots for off-premise orders, drive-thru lane for
mobile orders) & plans to open more Habit units with drive-thrus
– Restaurant Brands International is accelerating the rollout of digital menu boards to Burger King & Tim Hortons restaurants, introduced the Burger King of the Future prototype (curbside
delivery, pick up lockers, multiple drive-thru lanes, suspended kitchen & dining room) and
unveiled an elevated new Popeyes restaurant design
– Jack in the Box has alluded to designs of new restaurant prototypes to accelerate its unit growth strategy and improve new unit economics, which we expect will be smaller in size and
incorporate elements to facilitate digital orders
258

Not too big, not too small, just rightFranchisee composition
With the spotlight on franchisee economics amidst recent challenges, we believe companies will
look to assess the composition of their franchise bases to balance the benefit of larger franchisees
with scale, greater access to capital and generally a growth-minded outlook, with the risk of
concentrating the system, noting large franchisees generally take on greater leverage to support
their growth
– NPC International, the largest Pizza Hut & Wendy’s franchisee, filed for bankruptcy in July 2020
While NPC received a stalking horse bid from Flynn Restaurant Group to acquire substantially
all of its ~1,300 restaurants, Wendy’s noted concerns as it only allows any one franchisee to
operate up to 400 restaurants and does not allow competing restaurants in the same portfolio
(Flynn Restaurant Group operates Applebee’s, Panera, Taco Bell and Arby’s restaurants) –
the organizations have since agreed that Flynn will acquire approximately half of NPC’s
Wendy’s units, with the other half to be acquired by existing franchisees
Several restaurants prohibit their franchisees from operating additional concepts and/or concepts
that could be considered direct competitors to ensure focus and limit conflicts of interest, as well as
limit the number of restaurants they can own/operate
– For example, Wendy’s prohibits franchisees from operating competing brands and limits
franchisees to operating up to 400 restaurants and Taco Bell generally limits organic unit growth
of up to 225-250 restaurants per franchisee
– Other franchisees, such as Domino’s and McDonald’s, often restrict franchisees from operating
other businesses and competing brands
259
260
Unit Growth

261
Capitalizing on unit growth opportunitiesOutlook for more attractive real estate market
Since the beginning of the pandemic, many restaurant companies have indicated expectations for
more attractive real estate opportunities given heightened restaurant & retail closures
– But commentary suggests there has been limited changes in price thus far as landlords & tenants
continue to work through price discovery in an uncertain environment, and while there is
availability of real estate, companies have similarly highlighted A sites are still very competitive
Retail vacancy has increased to ~5% (from ~4-4.5% pre-COVID), though average rent has been
fairly flat
3Q20 Average Retail RentRetail Vacancy
Source: JLL, Credit Suisse
-0.8%
-0.6%
-0.4%
-0.2%
0.0%
0.2%
0.4%
0.6%
0.8%
1.0%
General
Retail
Neighborhood
Center
Mall Power
Center
Strip
Center
Other
3Q
20 A
vera
ge R
ent
YO
Y %
% of Retail
Square Footage53% 26% 8% 7% 6% 1%
4.1%
4.2%
4.3%
4.4%
4.5%
4.6%
4.7%
4.8%
4.9%
5.0%
5.1%
1Q19 2Q19 3Q19 4Q19 3Q20
Reta
il V
aca
ncy

262
US restaurant growth has moderated in recent years, with large chains gaining share
Restaurant industry growth has averaged ~0.5% over the last 15 years (pre-COVID), with limited
service restaurants (QSR & fast casual) outpacing full service restaurants and overall growth
decelerating; Technomic estimates unit growth declined ~11% in 2020, including down ~7.5%
among limited service restaurants and down ~15% among full service restaurants
Large chains are gaining share (primarily limited service), with the largest 500 restaurant chains
(representing 33% of total units) exhibiting unit growth of ~2% over the last 15 years, though growth
has decelerated, with 2019’s unit growth of 0.4% the lowest in 15 years
Top 500 Restaurants Unit GrowthRestaurant Industry Unit Growth
Source: Technomic, Company data, Credit Suisse estimates
25%
26%
27%
28%
29%
30%
31%
32%
33%
0.0%
0.5%
1.0%
1.5%
2.0%
2.5%
3.0%
3.5%
4.0%
4.5%
5.0%
200
4
200
5
200
6
200
7
200
8
200
9
201
0
201
1
201
2
201
3
201
4
201
5
201
6
201
7
201
8
201
9
Top
500 a
s %
of
Indu
stry
Uni
ts
Top
500 C
hain
s U
nit
Gro
wth
Top 500 Chains Unit Growth Top 500 as % of Industry Units
-3.0%
-2.0%
-1.0%
0.0%
1.0%
2.0%
3.0%
4.0%
20
04
20
05
20
06
20
07
20
08
20
09
20
10
20
11
20
12
20
13
20
14
20
15
20
16
20
17
20
18
20
19
Res
taur
ant
Indu
stry
Uni
t G
row
th
Total Restaurants Limited Service Restaurants Full Service Restaurants

263
Limited service restaurants have demonstrated decelerating unit growth
Limited service restaurant unit growth has averaged ~1.2% over the last 15 years, though unit
growth decelerated to half the rate over the last two years (2018 & 2019) and an estimated down
~7.5% in 2020 (per Technomic)
Large chains (~57% of limited service units) have demonstrated stronger unit growth trends,
averaging ~1.9% over the last 15 years, though unit growth has also decelerated over the last
couple of years to ~0.7%
Limited Service Unit GrowthLimited Service Unit Growth
Source: Technomic, Credit Suisse estimates
Limited Service Restaurants
-3.0%
-2.0%
-1.0%
0.0%
1.0%
2.0%
3.0%
4.0%
200
4
200
5
200
6
200
7
200
8
200
9
201
0
201
1
201
2
201
3
201
4
201
5
201
6
201
7
201
8
201
9
Lim
ited S
erv
ice U
nit
Gro
wth
Large Chains Independents
-8.0%
-6.0%
-4.0%
-2.0%
0.0%
2.0%
4.0%
200
4
200
5
200
6
200
7
200
8
200
9
201
0
2011
201
2
201
3
201
4
201
5
201
6
201
7
201
8
2019
202
0E
Lim
ited S
erv
ice U
nit
Gro
wth

264
Mixed unit growth across cuisine segmentsSmaller categories outpacing penetrated segments
The cuisine segments that are the smallest by units are outpacing unit growth among the cuisine
segments that have the largest number of units, and thus are the most significantly penetrated
– The coffee, Mexican and chicken cuisine segments are growing units at twice the rate of the
larger sandwich, pizza and burger segments
In the larger, more penetrated segments, the leaders have been net unit closers, including Subway,
Pizza Hut (largest by units) & McDonald’s, while chains in smaller segments are opening units at a
faster rate than their respective segments, including Starbucks, Taco Bell and Chick-fil-A
5-year Unit CAGR2019 Units by Segment
Source: Technomic, Credit Suisse estimates
Limited Service Restaurants
0K
10K
20K
30K
40K
50K
60K
70K
Sandwich Pizza Burgers Coffee Mexican Chicken
Units
-1.0%
-0.5%
0.0%
0.5%
1.0%
1.5%
2.0%
2.5%
3.0%
3.5%
4.0%
Sandwich Pizza Burgers Coffee Mexican Chicken
5-y
r U
nit
CA
GR
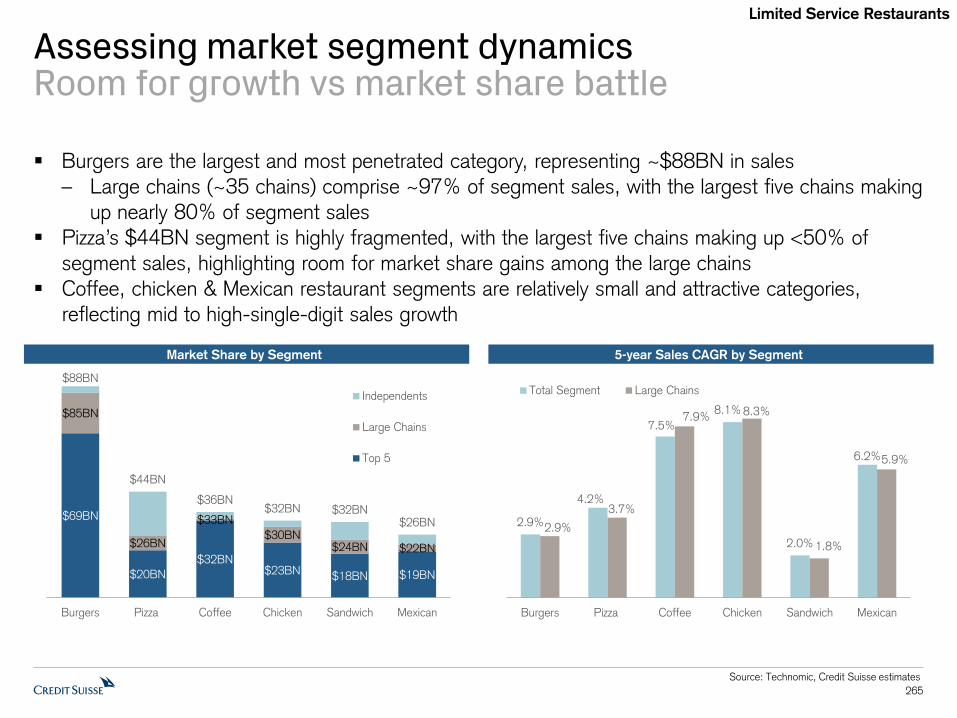
265
Assessing market segment dynamicsRoom for growth vs market share battle
Burgers are the largest and most penetrated category, representing ~$88BN in sales
– Large chains (~35 chains) comprise ~97% of segment sales, with the largest five chains making
up nearly 80% of segment sales
Pizza’s $44BN segment is highly fragmented, with the largest five chains making up <50% of
segment sales, highlighting room for market share gains among the large chains
Coffee, chicken & Mexican restaurant segments are relatively small and attractive categories,
reflecting mid to high-single-digit sales growth
5-year Sales CAGR by SegmentMarket Share by Segment
Source: Technomic, Credit Suisse estimates
Limited Service Restaurants
2.9%
4.2%
7.5%
8.1%
2.0%
6.2%
2.9%
3.7%
7.9% 8.3%
1.8%
5.9%
Burgers Pizza Coffee Chicken Sandwich Mexican
Total Segment Large Chains
$69BN
$20BN
$32BN$23BN $18BN $19BN
$85BN
$26BN
$33BN
$30BN$24BN $22BN
$88BN
$44BN
$36BN$32BN $32BN
$26BN
Burgers Pizza Coffee Chicken Sandwich Mexican
Independents
Large Chains
Top 5

266
Unit growth highest among less penetrated segmentsCoffee, Mexican & Chicken
The burger segment has nearly 49K units, with ~90% of units concentrated with the larger chains
– The burger segment is already very penetrated and concentrated, making unit growth likely more
difficult than other cuisine segments
The pizza segment is one of the largest by units with ~62K outlets & the most fragmented, though
unit growth has been relatively low – expansion appears to be largely a market share battle
Coffee, Mexican restaurants and chicken segments are the smallest by units and growing the fastest
5-year Unit CAGR by SegmentUnits by Segment
Source: Technomic, Credit Suisse estimates
Limited Service Restaurants
32.8K
22.1K
32.8K26.2K
11.4K 10.4K
38.2K
29.8K
44.3K
27.6K
13.6K 15.5K
63.0K 62.1K
48.8K
39.7K
25.8K
19.4K
Sandwich Pizza Burgers Coffee Mexican Chicken
Independents
Large Chains
Top 5
-0.3%
0.5%0.7%
3.6%
2.1%
2.8%
-0.6%
1.2%0.8%
4.5%
3.3% 3.2%
Sandwich Pizza Burgers Coffee Mexican Chicken
Total Segment Large Chains
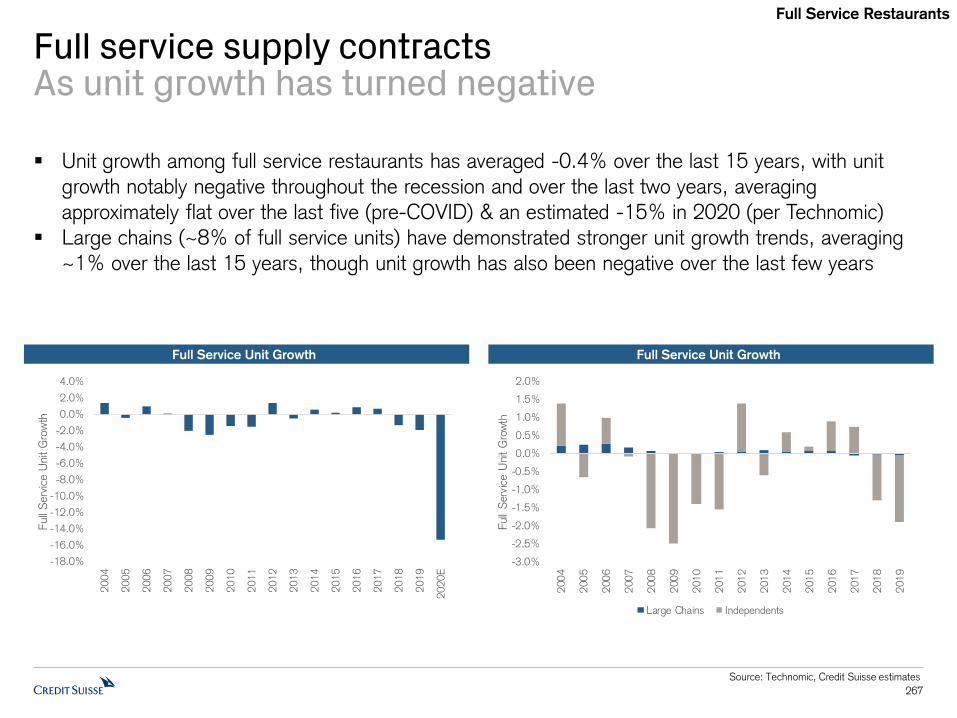
267
Full service supply contractsAs unit growth has turned negative
Unit growth among full service restaurants has averaged -0.4% over the last 15 years, with unit
growth notably negative throughout the recession and over the last two years, averaging
approximately flat over the last five (pre-COVID) & an estimated -15% in 2020 (per Technomic)
Large chains (~8% of full service units) have demonstrated stronger unit growth trends, averaging
~1% over the last 15 years, though unit growth has also been negative over the last few years
Full Service Unit GrowthFull Service Unit Growth
Source: Technomic, Credit Suisse estimates
-3.0%
-2.5%
-2.0%
-1.5%
-1.0%
-0.5%
0.0%
0.5%
1.0%
1.5%
2.0%
200
4
200
5
200
6
200
7
200
8
200
9
201
0
201
1
201
2
201
3
201
4
201
5
201
6
201
7
201
8
201
9
Ful
l S
ervi
ce U
nit
Gro
wth
Large Chains Independents
Full Service Restaurants
-18.0%
-16.0%
-14.0%
-12.0%
-10.0%
-8.0%
-6.0%
-4.0%
-2.0%
0.0%
2.0%
4.0%
200
4
200
5
200
6
200
7
200
8
200
9
201
0
201
1
201
2
201
3
201
4
201
5
201
6
201
7
201
8
201
9
202
0E
Full
Serv
ice U
nit
Gro
wth

268
Unit growth largely negative across cuisine segmentsLikely suggesting saturation & heightened competition
Unit growth has been flat to negative across nearly every cuisine over the last five years, suggesting
all cuisine segments have been facing saturation and increasing competition from high quality limited
service restaurants offering a compelling value proposition (particularly for varied menu)
Steak is one of the smallest cuisine segments in full service and demonstrating the strongest unit
growth trends, likely driven by less saturation and less competition given the nature of the category
and difficulty replicating the cuisine outside of full service dining
5-yr Unit CAGR2019 Units by Segment
Source: Technomic, Credit Suisse estimates
-3.0%
-2.5%
-2.0%
-1.5%
-1.0%
-0.5%
0.0%
0.5%
1.0%
Steak Asian Sports
Bar
Mexican Family
Style
Varied
Menu
Italian/
Pizza
Seafood
5-y
r U
nit
CAG
R
7K 1K 9K 1K 3K 3K 3K 1K
97K
51K 34K
32K 29K 27K8K 8K
105K
52K
43K
32K 32K 30K
11K 9K
0K
20K
40K
60K
80K
100K
120K
Varied
Menu
Asian Family
Style
Mexican Italian/
Pizza
Sports
Bar
Steak Seafood
2019 U
nits
Large Chains Independents
Full Service Restaurants

269
Large chains not immune to segment challengesThough large chain sales growth largely outpaces independents In 2019, seven of eight cuisine categories demonstrated positive sales growth, though only one
(steak) cuisine category exhibited positive unit growth
The top chain gained or maintained market share in six of the eight cuisine categories, though large
chains largely underperformed the categories
In 2019, unit growth was positive in only one cuisine category (steak), led by the top chain, and large
steak chains outpaced the total steak category; all other cuisines demonstrated negative unit growth,
with just Italian/Pizza showing some signs of positive unit growth from the top chain (Olive Garden)
2019 Unit Growth – Top Chain, Large Chains & Subsegment by Cuisine2019 Sales Growth – Top Chain, Large Chains & Subsegment by Cuisine
Source: Technomic, Credit Suisse estimates
-6%
-4%
-2%
0%
2%
4%
6%
8%
10%
12%
Ste
ak
Italia
n/P
izza
Mexi
can
Asia
n
Seafo
od
Varied M
enu
Fam
ily S
tyle
Sport
s B
ar
2019 S
ales
G
row
th
Top Chain Large Chains Total Segment
-4%
-3%
-2%
-1%
0%
1%
2%
3%
4%
5%
Ste
ak
Italia
n/P
izza
Mexi
can
Asia
n
Seafo
od
Varied M
enu
Fam
ily S
tyle
Sport
s B
ar
2019 U
nit
Gro
wth
Top Chain Large Chains Total Segment
Full Service Restaurants
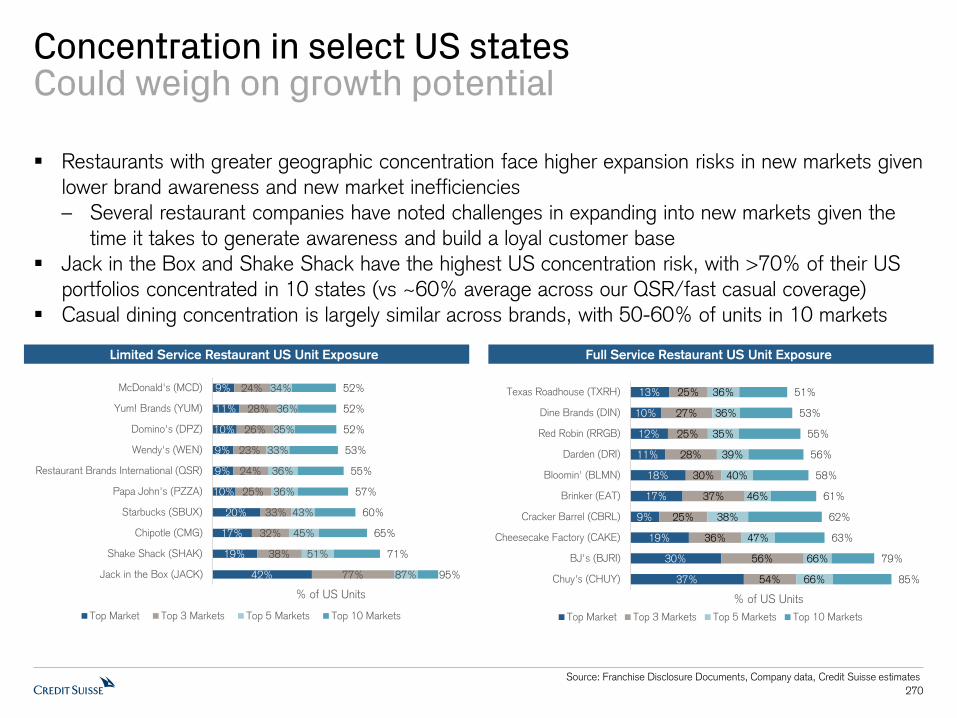
270
Concentration in select US statesCould weigh on growth potential
Restaurants with greater geographic concentration face higher expansion risks in new markets given
lower brand awareness and new market inefficiencies
– Several restaurant companies have noted challenges in expanding into new markets given the
time it takes to generate awareness and build a loyal customer base
Jack in the Box and Shake Shack have the highest US concentration risk, with >70% of their US
portfolios concentrated in 10 states (vs ~60% average across our QSR/fast casual coverage)
Casual dining concentration is largely similar across brands, with 50-60% of units in 10 markets
Source: Franchise Disclosure Documents, Company data, Credit Suisse estimates
Full Service Restaurant US Unit ExposureLimited Service Restaurant US Unit Exposure
37%
30%
19%
9%
17%
18%
11%
12%
10%
13%
54%
56%
36%
25%
37%
30%
28%
25%
27%
25%
66%
66%
47%
38%
46%
40%
39%
35%
36%
36%
85%
79%
63%
62%
61%
58%
56%
55%
53%
51%
Chuy's (CHUY)
BJ's (BJRI)
Cheesecake Factory (CAKE)
Cracker Barrel (CBRL)
Brinker (EAT)
Bloomin' (BLMN)
Darden (DRI)
Red Robin (RRGB)
Dine Brands (DIN)
Texas Roadhouse (TXRH)
% of US Units
Top Market Top 3 Markets Top 5 Markets Top 10 Markets
42%
19%
17%
20%
10%
9%
9%
10%
11%
9%
77%
38%
32%
33%
25%
24%
23%
26%
28%
24%
87%
51%
45%
43%
36%
36%
33%
35%
36%
34%
95%
71%
65%
60%
57%
55%
53%
52%
52%
52%
Jack in the Box (JACK)
Shake Shack (SHAK)
Chipotle (CMG)
Starbucks (SBUX)
Papa John's (PZZA)
Restaurant Brands International (QSR)
Wendy's (WEN)
Domino's (DPZ)
Yum! Brands (YUM)
McDonald's (MCD)
% of US Units
Top Market Top 3 Markets Top 5 Markets Top 10 Markets

271
Lack of international presenceCould weigh on growth potential
Many large global QSRs have significant international exposure and are generating the majority of
their unit growth in international markets
Casual dining companies have limited international exposure; units in international markets are
generally operated by franchisees (vs US company operated) with minimal sales & profit contribution
Jack in the Box, Chipotle & most casual dining companies have almost zero international presence
McDonald’s, Domino’s, Yum! Brands, Restaurant Brands International & Starbucks have 50%+ of
units in international markets, with international a meaningful contributor to the unit growth algorithm
Source: Company data, Credit Suisse estimates
International as % of System Units – Full Service RestaurantsInternational as % of System Units – Limited Service Restaurants
22%
17%
8%
7%
5%
3%
2%
0%
0%
0%
Brinker (EAT)
Bloomin' (BLMN)
Cheesecake Factory (CAKE)
Dine Brands (DIN)
Texas Roadhouse (TXRH)
Red Robin (RRGB)
Darden (DRI)
Cracker Barrel (CBRL)
BJ's (BJRI)
Chuy's (CHUY)
International as % of Units
64%
64%
64%
61%
52%
39%
33%
14%
1%
0%
McDonald's (MCD)
Yum! Brands (YUM)
Domino's (DPZ)
Restaurant Brands International (QSR)
Starbucks (SBUX)
Papa John's (PZZA)
Shake Shack (SHAK)
Wendy's (WEN)
Chipotle (CMG)
Jack in the Box (JACK)
International as % of Units

272
Consensus expects QSR/fast casual global unit growth to ramp up in 2021
Consensus expectations imply limited service unit growth across our coverage of ~1% in FY20, with
an acceleration in FY21 and return to prior unit growth levels of 4%+ in FY22
Estimates imply unit growth remains below historical levels over the next two years among the fastest
growing chains (SBUX, YUM, QSR, DPZ), while unit growth accelerates for chains that have
demonstrated a slower pace of growth in recent years (MCD, WEN, JACK, PZZA)
Consensus Unit Growth Expectations – Limited Service RestaurantsConsensus Unit Growth Expectations – Limited Service Restaurants
Source: Consensus Metrix, Company data, Credit Suisse
Limited Service Restaurants
0.0%
0.5%
1.0%
1.5%
2.0%
2.5%
3.0%
3.5%
4.0%
4.5%
5.0%
FY17 FY18 FY19 FY20E FY21E FY22E
Unit
Gro
wth
-10%
0%
10%
20%
30%
40%
50%
SHAK CMG DPZ SBUX QSR PZZA YUM MCD WEN JACK
Conse
nsu
s U
nit
Gro
wth
FY20E FY21E FY22E
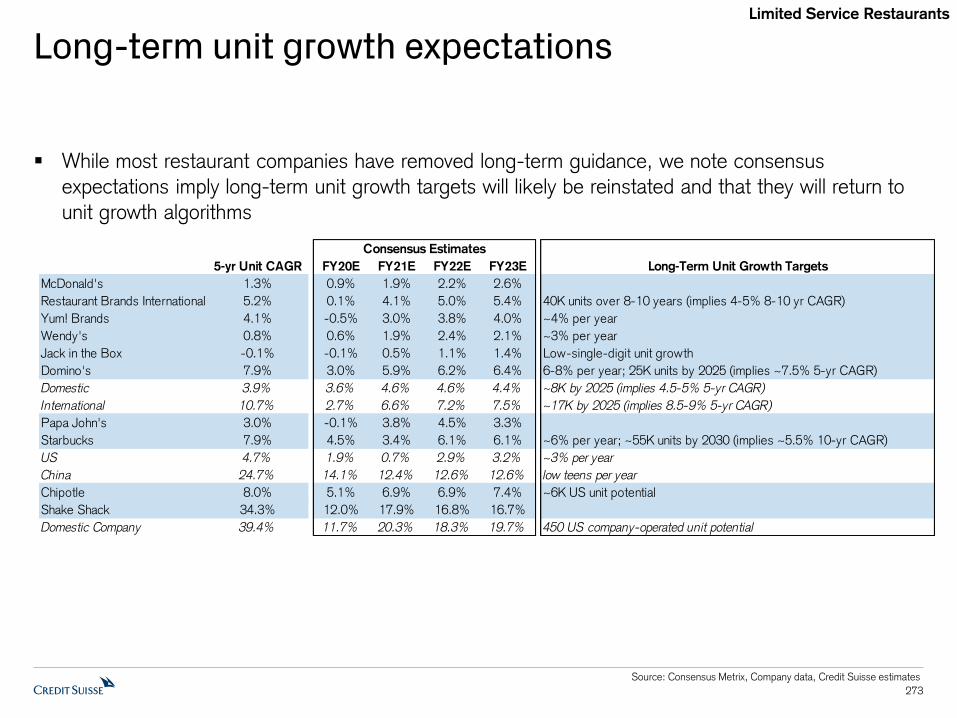
273
Long-term unit growth expectations
While most restaurant companies have removed long-term guidance, we note consensus
expectations imply long-term unit growth targets will likely be reinstated and that they will return to
unit growth algorithms
Source: Consensus Metrix, Company data, Credit Suisse estimates
5-yr Unit CAGR FY20E FY21E FY22E FY23E Long-Term Unit Growth Targets
McDonald's 1.3% 0.9% 1.9% 2.2% 2.6%
Restaurant Brands International 5.2% 0.1% 4.1% 5.0% 5.4% 40K units over 8-10 years (implies 4-5% 8-10 yr CAGR)
Yum! Brands 4.1% -0.5% 3.0% 3.8% 4.0% ~4% per year
Wendy's 0.8% 0.6% 1.9% 2.4% 2.1% ~3% per year
Jack in the Box -0.1% -0.1% 0.5% 1.1% 1.4% Low-single-digit unit growth
Domino's 7.9% 3.0% 5.9% 6.2% 6.4% 6-8% per year; 25K units by 2025 (implies ~7.5% 5-yr CAGR)
Domestic 3.9% 3.6% 4.6% 4.6% 4.4% ~8K by 2025 (implies 4.5-5% 5-yr CAGR)
International 10.7% 2.7% 6.6% 7.2% 7.5% ~17K by 2025 (implies 8.5-9% 5-yr CAGR)
Papa John's 3.0% -0.1% 3.8% 4.5% 3.3%
Starbucks 7.9% 4.5% 3.4% 6.1% 6.1% ~6% per year; ~55K units by 2030 (implies ~5.5% 10-yr CAGR)
US 4.7% 1.9% 0.7% 2.9% 3.2% ~3% per year
China 24.7% 14.1% 12.4% 12.6% 12.6% low teens per year
Chipotle 8.0% 5.1% 6.9% 6.9% 7.4% ~6K US unit potential
Shake Shack 34.3% 12.0% 17.9% 16.8% 16.7%
Domestic Company 39.4% 11.7% 20.3% 18.3% 19.7% 450 US company-operated unit potential
Consensus Estimates
Limited Service Restaurants
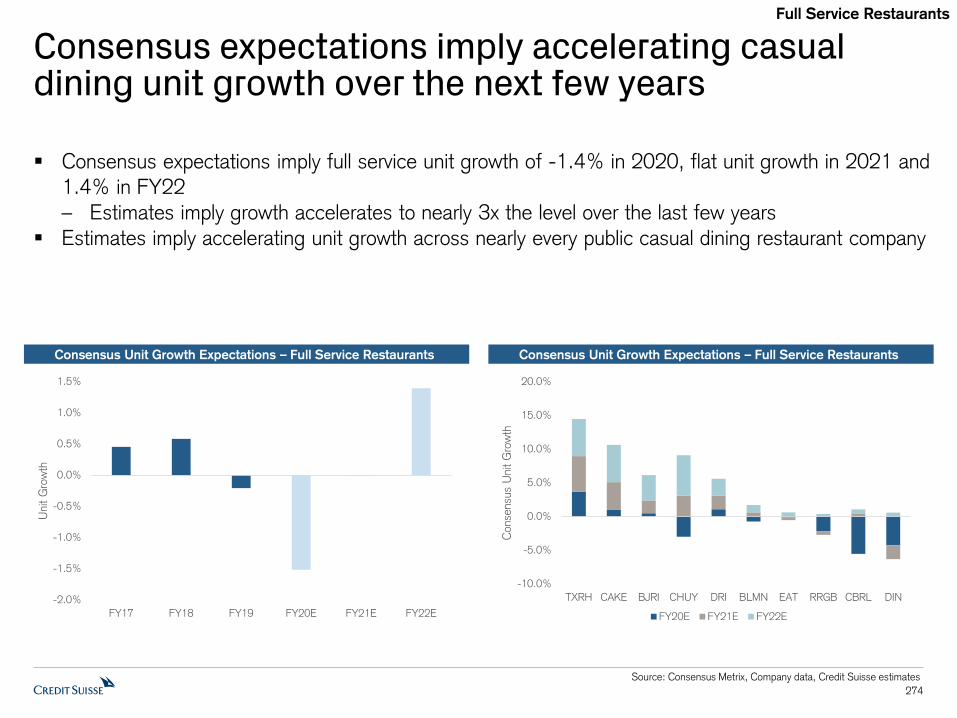
274
Consensus expectations imply accelerating casual dining unit growth over the next few years
Consensus expectations imply full service unit growth of -1.4% in 2020, flat unit growth in 2021 and
1.4% in FY22
– Estimates imply growth accelerates to nearly 3x the level over the last few years
Estimates imply accelerating unit growth across nearly every public casual dining restaurant company
Consensus Unit Growth Expectations – Full Service RestaurantsConsensus Unit Growth Expectations – Full Service Restaurants
Source: Consensus Metrix, Company data, Credit Suisse estimates
Full Service Restaurants
-2.0%
-1.5%
-1.0%
-0.5%
0.0%
0.5%
1.0%
1.5%
FY17 FY18 FY19 FY20E FY21E FY22E
Unit
Gro
wth
-10.0%
-5.0%
0.0%
5.0%
10.0%
15.0%
20.0%
TXRH CAKE BJRI CHUY DRI BLMN EAT RRGB CBRL DIN
Conse
nsu
s U
nit
Gro
wth
FY20E FY21E FY22E

275
Long-term unit growth expectations
Several restaurant companies have set long-term unit growth targets implying growth in-line or
accelerating from recent history
Source: Consensus Metrix, Company data, Credit Suisse estimates
Full Service Restaurants
5-yr Unit CAGR FY20E FY21E FY22E FY23E Long-Term Unit Growth Targets
Darden 1.8% 1.1% 2.1% 2.5% 2.7% 2-3% revenue contribution per year
Olive Garden 0.7% 0.2% 1.3% 1.3% 1.3%
LongHorn 2.1% 1.6% 2.3% 2.6% 2.6%
Bloomin' -0.5% -0.7% 0.6% 1.1% 0.9%
Outback US -0.8% -2.5% -0.1% 0.1% -0.6%
Carrabba's -1.5% -2.2% -0.9% 0.0% -1.4%
Brinker 0.6% -0.1% -0.4% 0.6% 0.9% ~1% per year
Chili's 0.5% -0.1% -0.4% 0.6% 0.9% 12-15 units per year
Maggiano's 2.9% 0.0% 0.0% 1.9% 0.0% ~4 units per year
Dine Brands -0.2% -4.3% -2.0% 0.6%
Applebee's -2.2% -4.4% -2.7% -0.4%
IHOP 2.4% -4.2% -1.3% 2.0%
The Cheesecake Factory 3.2% 1.0% 4.1% 5.5% 6.5% ~6-7% per year
Cheesecake Factory 3.1% 0.0% 1.0% 1.4% 1.9% ~3% per year
Texas Roadhouse 6.7% 3.7% 5.3% 5.5% 5.7% 25-30 per year; 700-800+ potential US Texas Roadhouse units
Cracker Barrel 1.1% -5.5% 0.5% 0.6% 0.7%
BJ's 5.9% 0.5% 1.9% 3.8% 3.6%
Chuy's 11.1% -3.0% 3.1% 6.0% 7.5% 20%+ per year
Red Robin 1.6% -2.2% -0.6% 0.4% 0.2%
Consensus Estimates

276
M&A
Active restaurant deal spaceM&A in public & private markets
The restaurants deal space has been active over the last couple of years:
– Well-funded firms have recognized the synergies owning multiple brands and a larger base of
restaurants
– Access to cheap capital
– Greater consolidation among franchisees
– Increase in shareholder activism
– Potentially a safe-haven for long-term capital with restaurants largely insulated from seismic
changes in retail and restaurants is a well understood/easy to forecast growth sector
There has also been an increase in investments in restaurant technology platforms supported by
evolving consumer expectations, changes in adjacent sectors and necessary investments to unlock
efficiencies amidst a challenging backdrop with cost pressures unlikely to subside
Drivers of restaurant M&A:
– Expand market share
– Enter new markets & channels
– Build scale
– Diversify revenue streams
– Access to talent
– Vertical integration
277
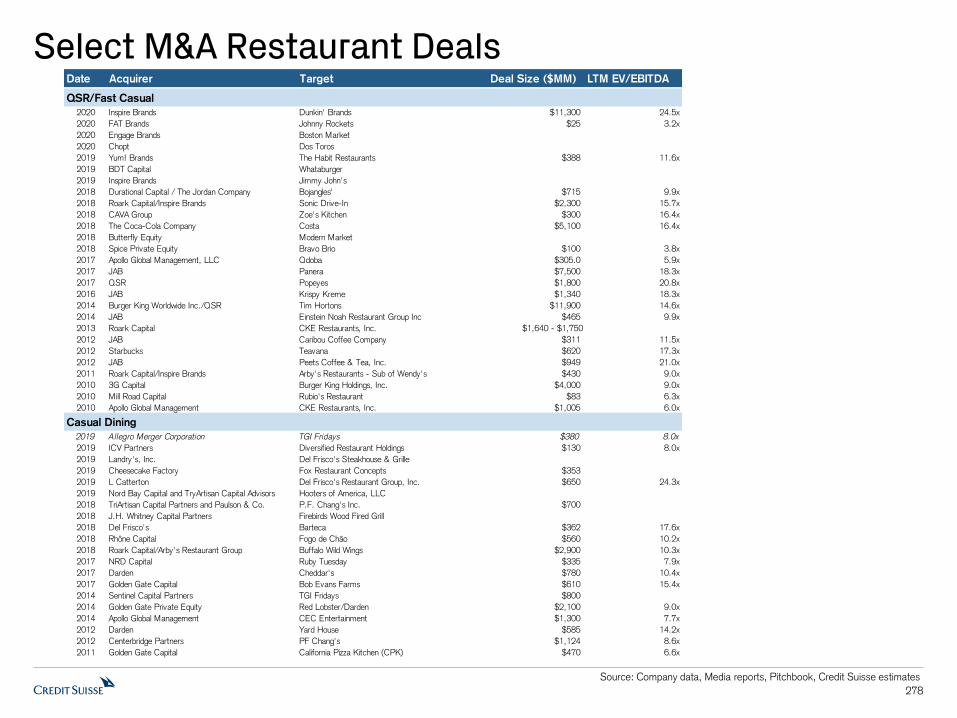
Select M&A Restaurant Deals
278
Source: Company data, Media reports, Pitchbook, Credit Suisse estimates
Date Acquirer Target Deal Size ($MM) LTM EV/EBITDA
QSR/Fast Casual
2020 Inspire Brands Dunkin' Brands $11,300 24.5x
2020 FAT Brands Johnny Rockets $25 3.2x
2020 Engage Brands Boston Market
2020 Chopt Dos Toros
2019 Yum! Brands The Habit Restaurants $388 11.6x
2019 BDT Capital Whataburger
2019 Inspire Brands Jimmy John's
2018 Durational Capital / The Jordan Company Bojangles' $715 9.9x
2018 Roark Capital/Inspire Brands Sonic Drive-In $2,300 15.7x
2018 CAVA Group Zoe's Kitchen $300 16.4x
2018 The Coca-Cola Company Costa $5,100 16.4x
2018 Butterfly Equity Modern Market
2018 Spice Private Equity Bravo Brio $100 3.8x
2017 Apollo Global Management, LLC Qdoba $305.0 5.9x
2017 JAB Panera $7,500 18.3x
2017 QSR Popeyes $1,800 20.8x
2016 JAB Krispy Kreme $1,340 18.3x
2014 Burger King Worldwide Inc./QSR Tim Hortons $11,900 14.6x
2014 JAB Einstein Noah Restaurant Group Inc $465 9.9x
2013 Roark Capital CKE Restaurants, Inc. $1,640 - $1,750
2012 JAB Caribou Coffee Company $311 11.5x
2012 Starbucks Teavana $620 17.3x
2012 JAB Peets Coffee & Tea, Inc. $949 21.0x
2011 Roark Capital/Inspire Brands Arby's Restaurants - Sub of Wendy's $430 9.0x
2010 3G Capital Burger King Holdings, Inc. $4,000 9.0x
2010 Mill Road Capital Rubio's Restaurant $83 6.3x
2010 Apollo Global Management CKE Restaurants, Inc. $1,005 6.0x
Casual Dining
2019 Allegro Merger Corporation TGI Fridays $380 8.0x
2019 ICV Partners Diversified Restaurant Holdings $130 8.0x
2019 Landry's, Inc. Del Frisco's Steakhouse & Grille
2019 Cheesecake Factory Fox Restaurant Concepts $353
2019 L Catterton Del Frisco's Restaurant Group, Inc. $650 24.3x
2019 Nord Bay Capital and TryArtisan Capital Advisors Hooters of America, LLC
2018 TriArtisan Capital Partners and Paulson & Co. P.F. Chang's Inc. $700
2018 J.H. Whitney Capital Partners Firebirds Wood Fired Grill
2018 Del Frisco's Barteca $362 17.6x
2018 Rhône Capital Fogo de Chão $560 10.2x
2018 Roark Capital/Arby's Restaurant Group Buffalo Wild Wings $2,900 10.3x
2017 NRD Capital Ruby Tuesday $335 7.9x
2017 Darden Cheddar's $780 10.4x
2017 Golden Gate Capital Bob Evans Farms $610 15.4x
2014 Sentinel Capital Partners TGI Fridays $800
2014 Golden Gate Private Equity Red Lobster/Darden $2,100 9.0x
2014 Apollo Global Management CEC Entertainment $1,300 7.7x
2012 Darden Yard House $585 14.2x
2012 Centerbridge Partners PF Chang's $1,124 8.6x
2011 Golden Gate Capital California Pizza Kitchen (CPK) $470 6.6x

Select 2020 Restaurant Bankruptcies
279
Source: Technomic, Credit Suisse
Chain Parent Company 2019 Sales 2019 Units
QSR/Fast CasualRubio's Mill Road Capital LP $232MM 197
Le Pain Quotidien PQ New York $192MM 94
Cosi Cosi Inc. $60MM 55
By Chloe ESquared Hospitality $38MM 14
Twisted Root Burger Co. TRB Franchising, LLC $36MM 17
Garbanzo Mediterranean Fresh Garbanzo Fresh Mediterranean Franchising LLC $23MM 26
Vapiano Vapiano International LLC $18MM 6
Casual Dining
Ruby Tuesday NRD Capital Management $731MM 451
California Pizza Kitchen Golden Gate Capital $621MM 199
Logan's Roadhouse CraftWorks Holdings LLC $496MM 204
Chuck E. Cheese's CEC Entertainment Inc. $382MM 537
Krystal Company Fortress Investment Group $344MM 318
Village Inn American Blue-Ribbon Holdings LLC $313MM 183
Bar Louie Sun Capital Partners Inc. $284MM 128
Old Chicago Pizza & Taproom CraftWorks Holdings LLC $276MM 109
Sizzler Sizzler USA Acquisitions Inc. $259MM 122
Brio Tuscan Grille FoodFirst Global Restaurants $217MM 57
Souplantation & Sweet Tomatoes Garden Fresh Restaurants $212MM 97
Friendly’s Sun Capital Partners $210MM 160
Houlihan's Houlihan's Restaurants Inc. $143MM 45
Bravo! Cucina Italiana FoodFirst Global Restaurants $122MM 44
Granite City Food & Brewery Granite City Food & Brewery Ltd. $102MM 25
Rock Bottom Restaurant & Brewery CraftWorks Holdings LLC $98MM 25
Gordon Biersch Brewery Restaurant CraftWorks Holdings LLC $93MM 31
Il Mulino Il Mulino USA, LLC $91MM 16
K&W Cafeterias K&W Cafeterias, Inc. $86MM 28
TooJay's Original Gourmet Deli TooJay's Management Corporation $81MM 30
HopCat BarFly Ventures $67MM 17
Peter Piper Pizza CEC Entertainment Inc. $65MM 101
Bakers Square American Blue-Ribbon Holdings LLC $63MM 31
Fig & Olive $62MM 9
Matchbox Matchbox Food Group $42MM 13
Blue Star Donuts Blue Star Donuts LLC $9MM 11
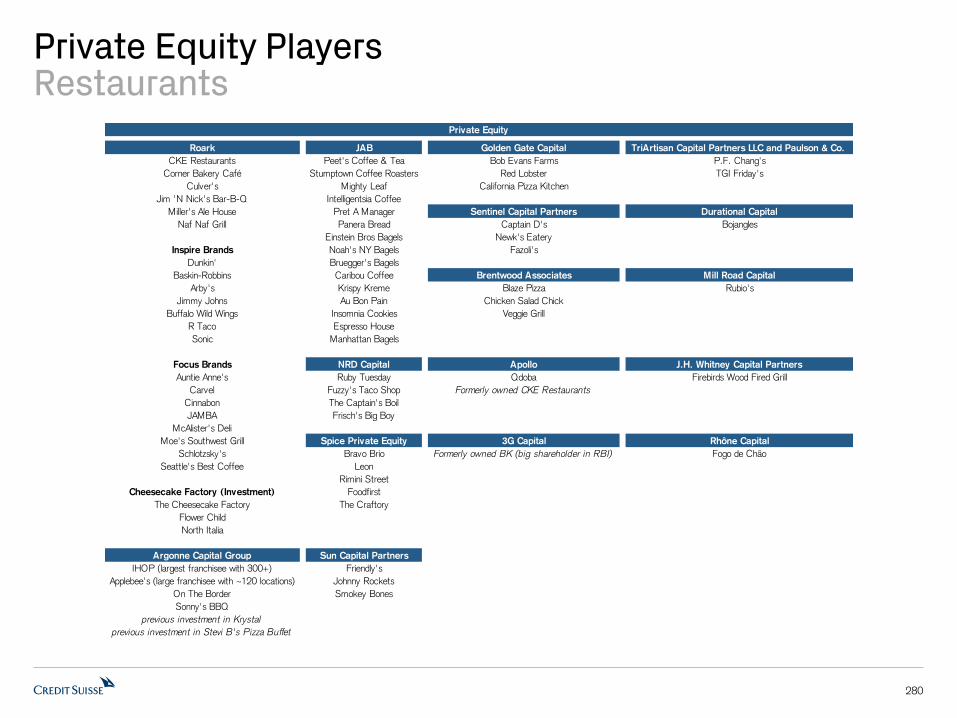
Private Equity PlayersRestaurants
280
Roark JAB Golden Gate Capital TriArtisan Capital Partners LLC and Paulson & Co.
CKE Restaurants Peet's Coffee & Tea Bob Evans Farms P.F. Chang's
Corner Bakery Café Stumptown Coffee Roasters Red Lobster TGI Friday's
Culver's Mighty Leaf California Pizza Kitchen
Jim 'N Nick's Bar-B-Q Intelligentsia Coffee
Miller's Ale House Pret A Manager Sentinel Capital Partners Durational Capital
Naf Naf Grill Panera Bread Captain D's Bojangles
Einstein Bros Bagels Newk's Eatery
Inspire Brands Noah's NY Bagels Fazoli's
Dunkin' Bruegger's Bagels
Baskin-Robbins Caribou Coffee Brentwood Associates Mill Road Capital
Arby's Krispy Kreme Blaze Pizza Rubio's
Jimmy Johns Au Bon Pain Chicken Salad Chick
Buffalo Wild Wings Insomnia Cookies Veggie Grill
R Taco Espresso House
Sonic Manhattan Bagels
Focus Brands NRD Capital Apollo J.H. Whitney Capital Partners
Auntie Anne's Ruby Tuesday Qdoba Firebirds Wood Fired Grill
Carvel Fuzzy's Taco Shop Formerly owned CKE Restaurants
Cinnabon The Captain's Boil
JAMBA Frisch's Big Boy
McAlister's Deli
Moe's Southwest Grill Spice Private Equity 3G Capital Rhône Capital
Schlotzsky's Bravo Brio Formerly owned BK (big shareholder in RBI) Fogo de Chão
Seattle's Best Coffee Leon
Rimini Street
Cheesecake Factory (Investment) Foodfirst
The Cheesecake Factory The Craftory
Flower Child
North Italia
Argonne Capital Group Sun Capital Partners
IHOP (largest franchisee with 300+) Friendly's
Applebee's (large franchisee with ~120 locations) Johnny Rockets
On The Border Smokey Bones
Sonny's BBQ
previous investment in Krystal
previous investment in Stevi B's Pizza Buffet
Private Equity

Synergies from technology as factor supportive of increased deal activity
We believe technology is an increasingly important strategic rationale in M&A transactions
– Restaurants can generate synergies across a larger base as they build infrastructures with
analytics capabilities to leverage data to influence behavior and optimize operations
– Multi-concept restaurant groups appear to be restructuring and reprioritizing resources to build a
common architecture at the corporate level that has a last mile unique adaptation across each
brand in the portfolio
McDonald’s, Restaurant Brands International, Yum! Brands & others have reallocated
resources at the corporate level to most efficiently & effectively develop digital assets
Inspire Brands acquired Dunkin’ Brands, citing the addition of Dunkin’s 15MM loyalty
program members as a key benefit of the transaction
281

Restaurant portfolios to support scaleStrengthening consolidated infrastructures
Scale is becoming increasingly important as:
– Restaurants recognize the need to invest in holistic technological ecosystems and the benefit of
digital strategies is derived from their abilities to effectively capture and leverage customer data
to inform strategic decisions
– Companies with strong development infrastructures offer smaller brands unmatched access to
well-capitalized global franchisees and expertise in franchising, purchasing & other capabilities
In March 2020, Yum! Brands closed the acquisition of The Habit Restaurants, noting the brand’s
huge runway for growth and new access to YUM’s unmatched scale and strengths in franchising,
purchasing and brand-building
In December 2020, Inspire Brands completed the acquisition of Dunkin’ Brands, noting Dunkin’
would strengthen Inspire through their scaled international platform and robust consumer packaged
goods licensing infrastructure, as well as add more than 15MM loyalty members for a total of 25MM
loyalty members across the combined portfolio
In December 2020, Centre Lane Partners, parent company of Saladworks, acquired Garbanzo
Mediterranean Fresh & Frutta Bowls to form a new holding company, Woworks, noting the benefits
of scale and shared resources
282

Franchisee consolidationLeverage scale with growth mindset
Over the last several years, we have seen an uptick in franchisee consolidation as franchisors seek
out well-capitalized franchisees with a growth mindset and an ability to make necessary investments
and franchisees benefit from greater scale
Recent challenges with large franchisee groups have put a spotlight on potential risks of franchisee
consolidation, as large franchisees tend to have higher levels of leverage
– NPC International, the largest franchisee in the US, filed for bankruptcy in July 2020 with
$900MM of debt on its books
In November 2020, NPC International entered into a stalking horse purchasing agreement
with Flynn Restaurant Group, and in January 2021, NPC, Flynn Restaurant Group and
Wendy’s entered into an agreement in which Flynn would purchase NPC’s 925+ Pizza Hut
units and about half of NPC’s ~393 Wendy’s restaurants, combining the two largest
franchisees in the US for a restaurant portfolio of 2,350+ restaurants
Flynn Restaurant Group initially agreed to acquire all of NPC’s Pizza Hut and Wendy’s
restaurants, though Wendy’s appeared to be reluctant of the acquisition, citing caution
regarding having franchisees that are too large as a risk to the system (as well as potential
conflicts operating competing brands)
– Franchisees were eligible to receive PPP loans in the first stimulus package up to $10MM, and
based on relative AUVs and labor margins, such would cover systems as large as ~100-150
units on average
For franchisees above ~100-150 units, they were only eligible to receive a portion of needs
283

Increasing popularity of SPACsBlank check companies boom
We have seen an increasing prevalence of special purpose acquisition corporations (SPAC) across
the market amidst a high level of available capital and an appetite for new growth companies
– SPAC mergers offer an alternative to a traditional IPO, in which SPACs raise money from
investors in an IPO with an intention to later find a business to acquire, generally within a two-
year period, and reflect high confidence in the sponsor & management
In October 2020, Tastemaker Acquisition Corp. filed an S-1 seeking to raise up to $230MM, and
an intention to acquire companies with an expected enterprise-level value of $400MM to $1BN;
management includes co-CEOs David Pace (Chairman at Red Robin) & Andrew Pforzheimer (co-
founder & former CEO of Barcelona & Bartaco brands), President Greg Golkin (managing partner at
Kitchen Fund) & CFO Chris Bradley (managing director of Mistral Equity Partners, PE firm that
owns El Pollo Loco & Jamba)
In August 2020, Fast Acquisition Corp. filed an S-1 seeking to raise up to $230MM, and an
intention to acquire companies with an expected enterprise-level value of at least $600MM;
management includes co-CEOs Sandy Beall (founder of Ruby Tuesday) & Doug Jacob (co-founder
of Toro, co-founded hybrid venture fund & branding agency &vest) and Chairman Kevin Reddy
(former Chairman & CEO of Noodles, Chairman of &pizza and Qdoba)
In August 2020, Starboard Value Acquisition Corp. filed an S-1 seeking to raise $300MM;
management includes Chairman Jeff Smith (CEO & CIO of Starboard Value LP, Chairman of Papa
John’s) & CEO MJ McNulty and an experienced bench of industry advisors
284

Potential M&A TargetPapa John’s (PZZA)
PZZA has been discussed as a potential acquisition target for years, and at a market cap of ~$3BN
& debt/preferred stock of ~$450MM, a deal would likely be attainable for a large number of buyers
– In July 2018, media reports suggested Wendy’s and Papa John’s had been in preliminary deal
talks regarding a potential merger; in September 2018, media reports suggested PZZA was
soliciting bids for a potential buyout; in January 2019, media reports suggested Restaurant
Brands International could purchase the pizza chain
Potential Scenarios include:
Restaurant Brands International – complementary fit (pizza segment, heavily franchised, global
presence); RBI could leverage PZZA’s digital infrastructure and has experience with integrating
brands & operating distribution centers; PZZA could benefit from scale and international network
Yum! Brands – Papa John’s has significant overlap with Pizza Hut, so not an obvious complement to
YUM’s portfolio; PZZA’s franchised mix is below YUM’s target & PZZA operates distribution centers
Wendy’s – media reports (July 2018) suggested WEN & PZZA were in preliminary talks regarding a
merger, but talks cooled
Roark Capital/Inspire Brands – seeking to grow its portfolio of restaurant brands & PZZA could be
complementary with limited overlap to existing brands; small market cap aligns with current portfolio
John Schnatter – founder and former CEO; previous reports indicated Schnatter was seeking to
partner with PE firms as a takeover (has reduced his stake to <5% from ~30%)
Private Equity – Given PZZA’s relatively small market cap, makes deal attainable for a number of
well capitalized buyers
285
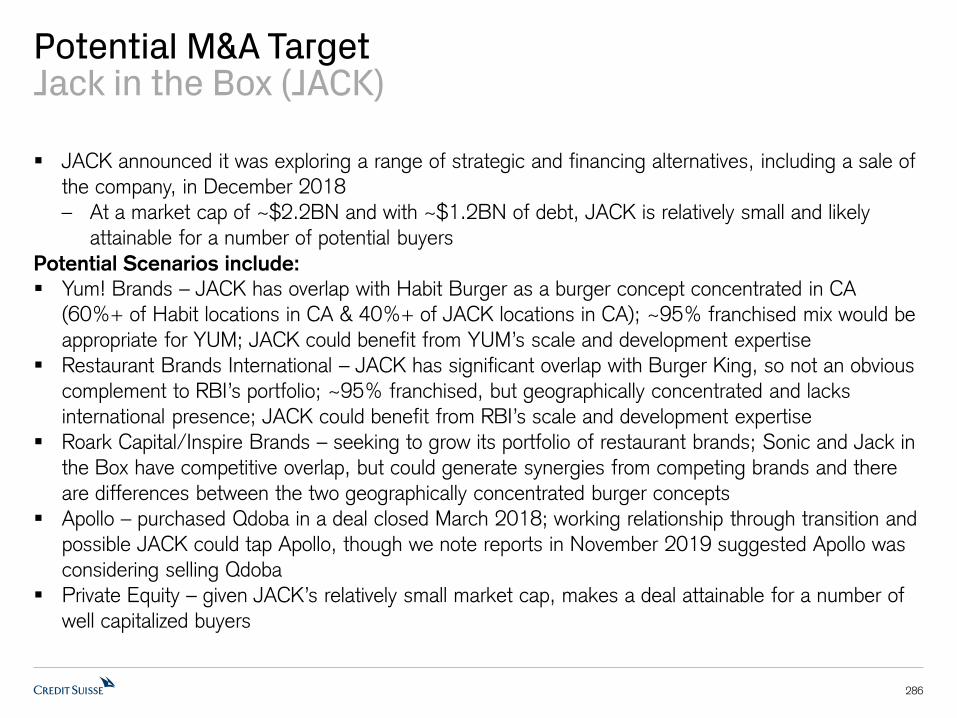
Potential M&A TargetJack in the Box (JACK)
JACK announced it was exploring a range of strategic and financing alternatives, including a sale of
the company, in December 2018
– At a market cap of ~$2.2BN and with ~$1.2BN of debt, JACK is relatively small and likely
attainable for a number of potential buyers
Potential Scenarios include:
Yum! Brands – JACK has overlap with Habit Burger as a burger concept concentrated in CA
(60%+ of Habit locations in CA & 40%+ of JACK locations in CA); ~95% franchised mix would be
appropriate for YUM; JACK could benefit from YUM’s scale and development expertise
Restaurant Brands International – JACK has significant overlap with Burger King, so not an obvious
complement to RBI’s portfolio; ~95% franchised, but geographically concentrated and lacks
international presence; JACK could benefit from RBI’s scale and development expertise
Roark Capital/Inspire Brands – seeking to grow its portfolio of restaurant brands; Sonic and Jack in
the Box have competitive overlap, but could generate synergies from competing brands and there
are differences between the two geographically concentrated burger concepts
Apollo – purchased Qdoba in a deal closed March 2018; working relationship through transition and
possible JACK could tap Apollo, though we note reports in November 2019 suggested Apollo was
considering selling Qdoba
Private Equity – given JACK’s relatively small market cap, makes a deal attainable for a number of
well capitalized buyers
286

Potential M&A TargetShake Shack (SHAK)
At a ~$3.9BN market cap, SHAK is relatively small & attainable for a number of potential buyers,
noting SHAK would benefit from the scale of a larger portfolio company; significant growth
potential, high brand affinity and global presence makes it attractive for growth-minded investors
Potential Scenarios include:
Roark Capital/Inspire Brands – seeking to grow its portfolio of restaurant brands; some competitive
overlap in the burger category with Sonic and CKE Restaurants, but could generate synergies from
competing brands and there are differences among geographical exposure and positioning
Private Equity – SHAK’s relatively small market cap makes a deal attainable for a number of well
capitalized buyers, and its strong growth outlook makes it an attractive target
Restaurant Brands International – some competitive overlap with Burger King, so not an obvious
complement to RBI’s portfolio, though positioning differs; SHAK’s primarily company-operated
growth strategy is unlikely to be a strategic fit for the nearly 100% franchised RBI; SHAK could
benefit from RBI’s scale and development expertise
Yum! Brands – significant competitive overlap with the recently acquired The Habit Burger; SHAK’s
primarily company-operated growth strategy is unlikely to be a strategic fit for the nearly 100%
franchised YUM (note: YUM planning to refranchise Habit); SHAK could benefit from YUM’s scale
and development expertise
287
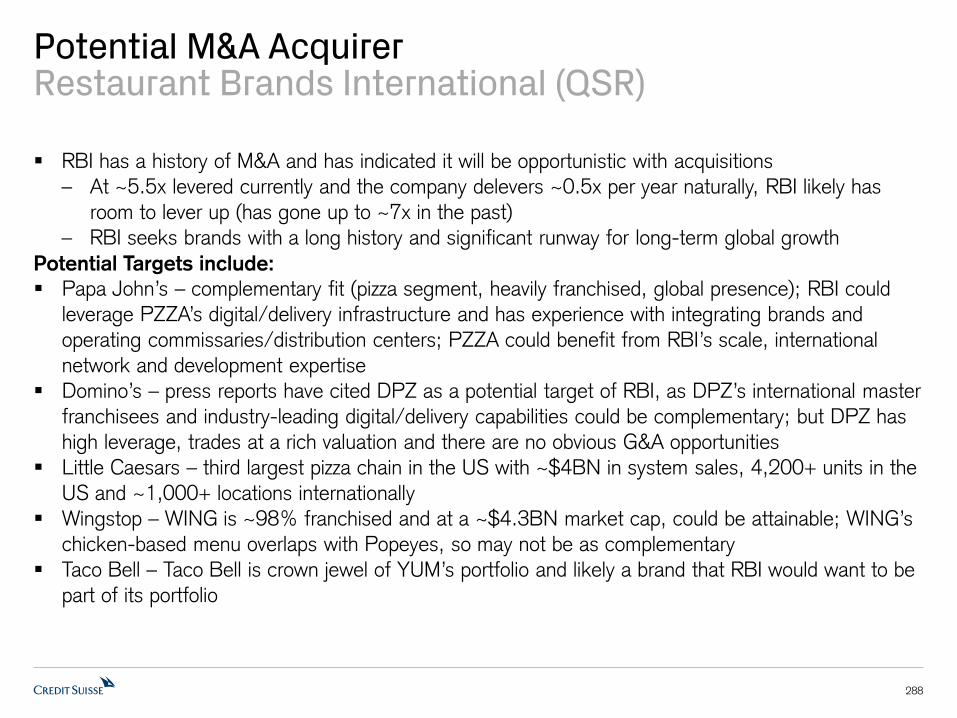
Potential M&A AcquirerRestaurant Brands International (QSR)
RBI has a history of M&A and has indicated it will be opportunistic with acquisitions
– At ~5.5x levered currently and the company delevers ~0.5x per year naturally, RBI likely has
room to lever up (has gone up to ~7x in the past)
– RBI seeks brands with a long history and significant runway for long-term global growth
Potential Targets include:
Papa John’s – complementary fit (pizza segment, heavily franchised, global presence); RBI could
leverage PZZA’s digital/delivery infrastructure and has experience with integrating brands and
operating commissaries/distribution centers; PZZA could benefit from RBI’s scale, international
network and development expertise
Domino’s – press reports have cited DPZ as a potential target of RBI, as DPZ’s international master
franchisees and industry-leading digital/delivery capabilities could be complementary; but DPZ has
high leverage, trades at a rich valuation and there are no obvious G&A opportunities
Little Caesars – third largest pizza chain in the US with ~$4BN in system sales, 4,200+ units in the
US and ~1,000+ locations internationally
Wingstop – WING is ~98% franchised and at a ~$4.3BN market cap, could be attainable; WING’s
chicken-based menu overlaps with Popeyes, so may not be as complementary
Taco Bell – Taco Bell is crown jewel of YUM’s portfolio and likely a brand that RBI would want to be
part of its portfolio
288
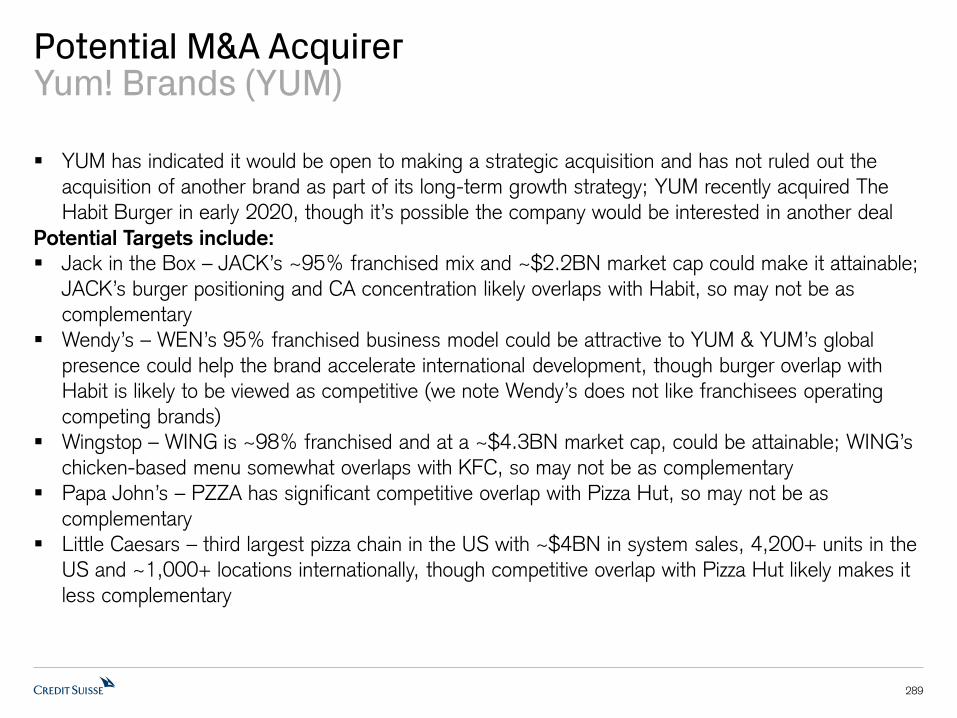
Potential M&A AcquirerYum! Brands (YUM)
YUM has indicated it would be open to making a strategic acquisition and has not ruled out the
acquisition of another brand as part of its long-term growth strategy; YUM recently acquired The
Habit Burger in early 2020, though it’s possible the company would be interested in another deal
Potential Targets include:
Jack in the Box – JACK’s ~95% franchised mix and ~$2.2BN market cap could make it attainable;
JACK’s burger positioning and CA concentration likely overlaps with Habit, so may not be as
complementary
Wendy’s – WEN’s 95% franchised business model could be attractive to YUM & YUM’s global
presence could help the brand accelerate international development, though burger overlap with
Habit is likely to be viewed as competitive (we note Wendy’s does not like franchisees operating
competing brands)
Wingstop – WING is ~98% franchised and at a ~$4.3BN market cap, could be attainable; WING’s
chicken-based menu somewhat overlaps with KFC, so may not be as complementary
Papa John’s – PZZA has significant competitive overlap with Pizza Hut, so may not be as
complementary
Little Caesars – third largest pizza chain in the US with ~$4BN in system sales, 4,200+ units in the
US and ~1,000+ locations internationally, though competitive overlap with Pizza Hut likely makes it
less complementary
289

Food distributors use M&A as opportunity for growthExpand scale, access, geographies & customers
The foodservice industry is highly fragmented, with ~15,000 suppliers, and customers that maintain
diversified supply chains
The foodservice industry appears to be well positioned for consolidation, with benefits of scale
contributing to better pricing power and cross-selling opportunities
Over the last 12-18 months, PFGC & USFD have made significant acquisitions that have
contributed meaningfully to case growth and SYY has suggested M&A will be a bigger part of the
strategy going forward
– That said, we note valuations could be difficult to ascertain in the current environment, weighing
on visibility regarding appropriate valuations, which could impede motivations for deals
– We also note food distributors have highlighted strong organic market share opportunities in the
current environment and they may not be as active in the deal space
290

Select M&A Food Distributor Deals
291
Source: Company data, Media reports, Pitchbook, Credit Suisse estimates
Date Acquirer TargetEV
($MM)
EV/Sales
(LTM)
EV/EBITDA
(LTM)
EBITDA
Margin
Mar-20 US Foods Smart Foodserv ice $970 0.88x 11.4x 7.7%
Dec-19 PFGC Reinhart $1,700 0.28x 10.6x 2.6%
Apr-19 PFGC Eby-Brown
Jul-18 US Foods SGA $1,800 0.56x 12.5x 3.8%
Feb-16 Sysco Brakes $3,100 0.62x 12.0x 5.6%
Dec-13 Sysco US Foods $8,200 0.37x 9.9x 3.8%
Jan-08 The Blackstone Group/Wellspring Performance Food Group $1,340 0.21x 10.9x 2.0%
Jun-07 Bain Capital Brakes Bros $1,300 0.78x 12.0x 6.5%
Jun-07 The Blackstone Group Vistar $400 0.14x 8.8x 1.6%
May-07 Allianz Capital Partners Selecta Group $754 1.44x 8.3x 17.3%
May-07 CD&R and KKR US Foodserv ice $7,100 0.40x 15.1x 2.4%
Jan-07 GS, T.H. Lee, CCMP, JPM, Warburg Aramark $8,500 0.74x 9.2x 8.1%
Apr-06 Macquerie-led Consortium Compass Group $3,280 1.00x 10.9x 9.3%
Feb-05 Chiquita Brands International Fresh Express (Performance Foods) $453 1.00x 11.3x 9.1%
Nov-04 Terra Firma Capital Partners AutobahnTank & Rast GmbH $1,425 5.34x 8.5x 62.8%
May-04 Charterhouse Capital Partners Autobar Ltd $962 0.44x NA NA
Jun-02 Del Monte Certain Heinz Businesses $2,795 1.55x NA NA
Jun-02 Clayton, Dubilier & Rice Brake Bros $571 0.41x 8.1x 5.1%
Dec-01 Compass Group PLC Seiyo Food Systems Inc $644 0.66x NA NA
Sep-01 Ahold Alliant Exchange $2,200 0.33x 12.6x 2.6%
Apr-01 Sodexho Alliance SA Sogeres (Albert Abela Corp) $475 0.68x NA NA
Feb-01 Compass Group Plc (UK) Selecta Group $752 1.56x 9.2x 17.0%
Feb-01 Compass Group Plc (UK) Morrison Management Specialists $624 1.32x 17.9x 7.4%
Jan-01 Sodexho Alliance Sodexho Marriott Serv ices $1,761 0.39x 6.3x 6.2%
Aug-00 Ahold PYA Monarch $1,570 0.56x 14.2x 3.9%
Mar-00 Ahold US Foodserv ice $3,621 0.55x 12.6x 4.4%
Sep-99 Supervalu Richfood Holdings $1,524 0.40x 7.3x 5.5%
Sep-99 Advent Elior $1,050 0.65x 7.7x 8.4%
Jul-99 Autogrill Host Marriott Serv ices $966 0.70x 7.7x 9.1%
Apr-99 Sair Group Dobbs Int. Serv ices $780 0.91x 7.7x 11.8%
Jun-97 JP Foodserv ice Rykoff-Sexton $1,436 0.41x 11.2x 2.8%
May-97 AmeriServe Food Distribution PepsiCo Food Systems $830 0.24x NA NA
Feb-97 InvestCorp Welcome Break $765 1.43x 13.4x 10.7%

Potential M&A TargetsLargest private distributors (small deals also likely)
292
Company Primary Segment 2019 Sales ($MM)
Unfi Specialty Distribution Services Retail-Focused $21,837
C&S Wholesale Grocers Inc. Retail-Focused $17,800
Core-Mark Holding Company Inc. Retail-Focused $15,114
Wakefern Food Corp. Retail-Focused $13,600
Gordon Food Service Inc. Broadline $11,000
Associated Wholesale Grocers Retail-Focused $9,666
Restaurant Depot Cash & Carry $9,615
Martin-Brower Co. LLC, The Systems $8,840
Dot Foods Inc. Specialty $8,200
Bunz l Distribution North America Inc. Retail-Focused $7,025
Golden State Foods Corporation Systems $6,830
KeHE Distributors, LLC Retail-Focused $5,015
Ben E. Keith Foods Broadline $4,057
SpartanNash Food Distribution Retail-Focused $3,983
Shamrock Foods Co. Broadline $3,900
H.T. Hackney Retail-Focused $3,860
Imperial Dade Supplies/Equipment $3,040
Cheney Bros. Inc. Broadline $2,623
Imperial Trading Company Retail-Focused $2,525
Bozzuto's Inc. Retail-Focused $2,175
Source: Technomic, Credit Suisse

293
Brand Engagement

More than just a restaurantEnhancing engagement
As more transactions move out of the restaurants’ four walls, alternative service providers pose risk
of democratization, methods of content consumption change and customers have access to more
options than ever before, brand engagement becomes increasingly important
– Restaurants are tasked with creating a more personalized experience for customers and
expanding the traditional definition of a lifestyle brand
– Voice technology poses an added layer of threat, as we envision a day where we can order
saying “Alexa, order me a burger,” potentially shifting power to the service providers to select the
restaurants (or through ghost kitchens)
Brands across sectors are using social media as a platform to develop brand personalities to
effectively resonate with customers, enhancing connections outside of in-store transactions – we
see this as the most efficient and applicable way to increase brand engagement
Brands also are using their customers as ambassadors through limited-time merchandise launches,
including Dunkin’s periodic drops through its pop-up shop and Chipotle’s online shop that donates
proceeds to organizations helping to make farming & fashion more sustainable
– Merchandise on both sites often sell out, underscoring the power of these brands and customers
that want to be part of their “tribes”
294
More than just a restaurantCommunity engagement
Restaurant companies are making investments in their employees and communities as a way to give
back, improve retention and meet customer demands for greater contribution
McDonald’s launched the #HereforRMHC challenge, agreeing to donate $100 in the name of each customer that posted to social media by 12/31 making a Ronald McDonald House Charities
heart symbol as part of a $100MM five-year commitment
Starbucks has committed $100MM to create the Starbucks Community Resilience Fund, which will focus on advancing racial equity & environmental resilience, and to open 100 Community Stores
by 2025 targeting economically distressed communities
Chipotle partnered with The Farmlink Project, setting a goal to donate 10MM meals to food banks during the 2020 holiday season by engaging its supply network, employee & guests to contribute
and allowing customers to round up bills with its real change feature
Yum! Brands established the Unlocking Opportunity Initiative, committing $100MM over five years to fight inequality, with a focus on equity & inclusion, education and entrepreneurship
Domino’s announced a commitment to raise $100MM over 10 years for St. Jude Children’s Research Hospital, the largest contribution in St. Jude’s history
Wendy’s runs promotions to benefit the Dave Thomas Foundation for Adoption (DTFA), including its annual Frosty Key Tag program and partnership with Coca-Cola & Dr Pepper to raise funds and
awareness to support youth adoption efforts
Panda Express pledged $20MM to establish the Panda Cares Center of Hope to support the Children’s Hospital Los Angeles
295
The value of the brandTrust takes years to build & seconds to break
Near-term, we believe virtual brands could be a compelling initiative to drive incremental sales
volume, especially in an environment with limited on-premise dining capacity and heightened delivery
demand – but we believe it is near-term in nature
– We also see risk in the lack of transparency offered by virtual brands as they are often listed
without referencing the source concept and most have no public website or listing outside of the
third-party platforms
Long-term, we believe directing investments and focus toward core brands with a physical presence
will create more value, allowing restaurants to establish relationships with customers agnostic of
channel
– Creating a curated delivery-only menu could serve the same purpose of a virtual brand while also
building customer awareness and loyalty
– We do not see long-term staying power for most virtual brands, as they can disappear as easily
as they were created and are too heavily reliant on marketplace platforms or a feed search
– That said, we don’t dismiss the possibility for restaurants to successfully build an all-digital brand
with zero retail presence and appeal to younger cohorts as we have seen in adjacent sectors,
though we note the inherent reliance on third-party platforms is a challenge
Should restaurants allocate resources to develop and execute a brand that is complementary
to existing operations, it can contribute to long-term value creation – but the underlying
implication is that the value comes from the brand, and success is predicated on the same
drivers that would make a brand with a physical footprint successful
296

Brand building effortsSocial media as a strategy, not just a tool
Social media offers a cost effective opportunity to engage with customers, communicate brand
messaging/value, build loyalty and solicit organic feedback and demand
Some brands are using social media as a platform to develop brand personalities to effectively
resonate with customers, enhancing connections outside of in-store transactions – we see this as
the most efficient and applicable way to increase brand engagement
Brands with less effective social media strategies often have limited engagement and/or the social
media platforms are used as a public customer service tool, which could actually be a negative for
the brand as prospective customers see comments are largely negative feedback on specific orders
297
Source: Instagram, Credit Suisse
Chipotle social media posts are primarily brand building in
nature, and customers often engage with the brand in a
positive manner
Domino’s social media posts are nearly entirely food
pictures and comments, with comments generally
customer complaints*note: the level of engagement is also lower,
with fewer comments than
Chipotle despite having ~70% more followers

Company HighlightChipotle
Chipotle’s marketing strategy has a clear brand building component, as the company has developed
an engaging, humorous personality targeted at younger consumers
– The brand’s social media team frequently responds to customer comments, and customer
comments often reference the social media team by name
Chipotle collaborates with social media influencers and celebrities that are organic Chipotle fans
across different channels to reach a wide addressable audience
– Chipotle appeared to send press boxes (or large press bags) to influencers with the launch of its
Holiday Goods winter merchandise collection in December 2020
– Chipotle teamed up with digital-star David Dobrik in 2019, the first celebrity to have his order, the
Dobrik Burrito, featured as an official menu item, and the company has since collaborated with a
variety of sports stars and influencers
In August 2020, Chipotle teamed up with Tony Hawk to offer his go-to Chipotle order, with the
launch culminated in a two-hour live stream from Chipotle’s Twitch page
In December 2020, Chipotle added a Miley Cyrus-inspired “Guac is extra but so is Miley
burrito” to its app/website, with the organic collaboration established after Chipotle posted a
TikTok video agreeing to create a Miley Cyrus burrito if she commented (which she did)
In January 2021, Chipotle partnered with Shawn Mendes to launch “Wonder Grants”
supporting young innovators in sustainability; Chipotle is featuring the Shawn Mendes Bowl
through its app/website, with $1 for every bowl purchased to be donated to The Shawn
Mendes Foundation, the first time the brand has launched a philanthropic entrée on the menu
298

Company HighlightWendy’s
Wendy’s has one of the strongest and more relaxed social media strategies in restaurants, often by
mocking other brands, humorously responding to customers (which incites greater brand
engagement) and posting memes curated to Wendy’s; it appears the brand has given its social
media team significant freedom, allowing the brand to quickly respond to other brands and engage
with followers
As a result, the brand generates a higher level of engagement than many of its burger peers
299
Source: Twitter, Instagram, Company data, Credit Suisse
7.6MM
4.7MM
3.7MM
1.0MM
0.3MM
McDonald's Wendy's Burger King Sonic Jack in the Box
Twitter Instagram
13,835
5,852
7,346
3,526
2,240
McDonald's Wendy's Burger King Sonic Jack in the Box
Wendy’s Twitter Twitter & Instagram Followers US Units (2019)
Wendy’s executes a strong social media strategy, with a clear brand personality and strong engagement among customers
Wendy’s punches above its weight class on social media, with its Twitter following nearly in-line with McDonald’s
This is particularly clear when looking at the company’s US units, with less than 50% of the units of the McDonald’s US system and ~80% of the units of
the Burger King US system
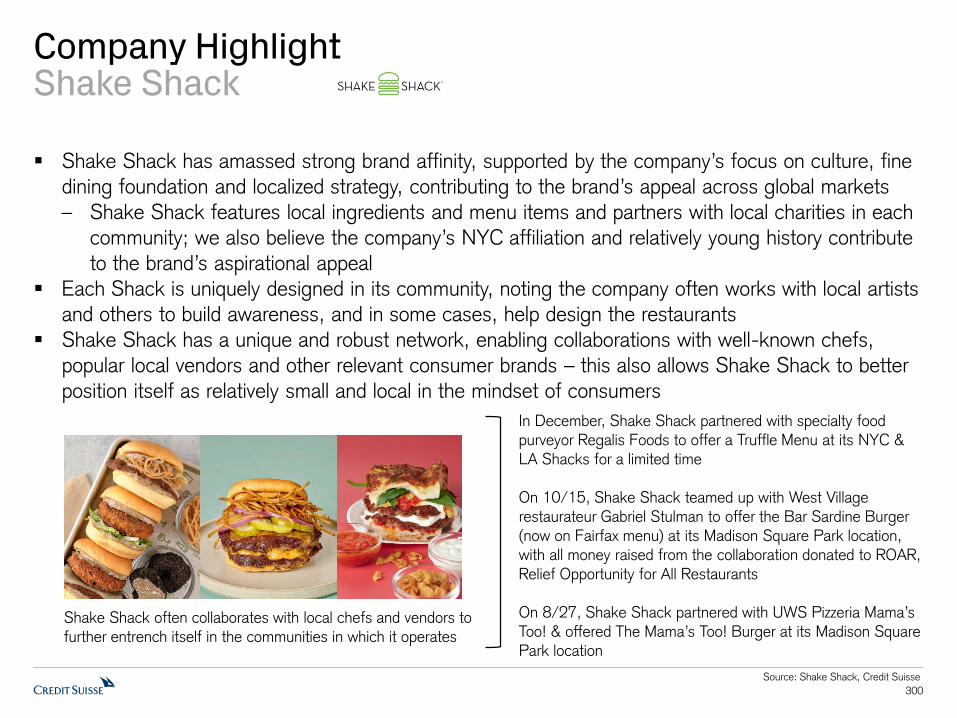
Shake Shack has amassed strong brand affinity, supported by the company’s focus on culture, fine
dining foundation and localized strategy, contributing to the brand’s appeal across global markets
– Shake Shack features local ingredients and menu items and partners with local charities in each
community; we also believe the company’s NYC affiliation and relatively young history contribute
to the brand’s aspirational appeal
Each Shack is uniquely designed in its community, noting the company often works with local artists
and others to build awareness, and in some cases, help design the restaurants
Shake Shack has a unique and robust network, enabling collaborations with well-known chefs,
popular local vendors and other relevant consumer brands – this also allows Shake Shack to better
position itself as relatively small and local in the mindset of consumers
300
Source: Shake Shack, Credit Suisse
Company HighlightShake Shack
Shake Shack often collaborates with local chefs and vendors to further entrench itself in the communities in which it operates
In December, Shake Shack partnered with specialty food purveyor Regalis Foods to offer a Truffle Menu at its NYC & LA Shacks for a limited time
On 10/15, Shake Shack teamed up with West Village
restaurateur Gabriel Stulman to offer the Bar Sardine Burger (now on Fairfax menu) at its Madison Square Park location, with all money raised from the collaboration donated to ROAR, Relief Opportunity for All Restaurants
On 8/27, Shake Shack partnered with UWS Pizzeria Mama’s
Too! & offered The Mama’s Too! Burger at its Madison Square Park location

301
Company Summaries

302
Source: Company data, Credit Suisse estimates
Bloomin’ Brands (BLMN)Neutral, $21 TPExecutive Summary Key Charts
• Credit Suisse View: We have been impressed with the resiliency of sales at BLMN, supported by strong execution against a multi-channel and omni-channel strategy. The company has exuded confidence in its ability to maintain productivity gains and efficiencies realized, supporting sustainably higher enterprise margins as the environment
normalizes. Sentiment on the name has been more cautious given the company’s high leverage, exposure to Brazil and less consistent performance pre-COVID. We like BLMN’s focus on off-premise and digital, with greater confidence in the health of the portfolio and balance sheet, as well as its ability to sustainably improve margins, is likely needed to further improve sentiment and lead us to be more constructive on shares.
• Off-Premise to Help Offset Losses: Investments in the off-premise and digital infrastructure over the last several years has well positioned BLMN to take advantage of the
accelerated customer adoption to off-premise. Our sales recovery estimates embed expectations for Outback & Carrabba’s to recover ~95% of FY19 AUVs in FY21 and up ~2-3% in FY22 relative to FY19.
Units by Brand
Revenue by Brand
0
200
400
600
800
1,000
1,200
1,400
1,600
2015 2016 2017 2018 2019
Uni
ts
Outback US Carrabba's Bonefish
Outback Brazil Fleming's Other International
$0
$500
$1,000
$1,500
$2,000
$2,500
$3,000
$3,500
$4,000
$4,500
$5,000
2015 2016 2017 2018 2019
Rev
enue
($
MM
)
Outback US Carrabba's Bonefish
Outback Brazil Fleming's Other International
Current Price $21.46NTM EV/EBITDA 8.1xNTM P/E 19.3x52-wk Range $4.83-$23.46
1/15/2021

303
Source: Consensus Metrix, Company data, Credit Suisse estimates
Bloomin’ Brands (BLMN)Neutral, $21 TPValuation & Risks Valuation History• Our $21 TP is based on:
— P/E of ~11x our NTM EPS in 12 months
— EV/EBITDA of ~6x (~9x including operating leases) our NTM EBITDA in 12 months
• BLMN’s 5-year average multiples: ~12.5-13x NTM P/E &
~7x NTM EV/EBITDA
• Key risks: consumer spending, COVID-19 pandemic, inflation, competition
5-yr Historical P/E
5-yr Historical EV/EBITDA
Credit Suisse Estimates vs Consensus2019 1Q20 2Q20 3Q20 4Q20E 2020E 2021E 2022E
Outback US SSS 2.0% -9.5% -32.9% -10.4% -5.0% -13.0% 13.1% 7.1%
Consensus -8.0% -15.0% 15.5% 4.4%
Global Units 1,473 1,472 1,460 1,464 1,464 1,464 1,468 1,474
YOY % -1.0% -0.6% -0.5% -0.5% -0.6% -0.6% 0.3% 0.4%
Consensus 1,473 1,462 1,462 1,471 1,487
YOY % -0.7% -0.7% 0.6% 1.1%
Revenue ($MM) $4,139 $1,008 $578 $771 $903 $3,262 $3,825 $4,094
YOY % 0.3% -10.6% -43.4% -20.3% -11.6% -21.2% 17.3% 7.0%
Consensus ($MM) $4,139 $883 $3,241 $3,789 $3,969
YOY % 0.3% -13.6% -21.7% 16.9% 4.8%
Operating Margin 4.8% 2.7% -13.7% -1.3% 2.4% -1.2% 4.5% 5.6%
Consensus 2.3% -1.3% 4.3% 5.4%
EPS $1.54 $0.14 ($0.74) ($0.12) $0.07 ($0.65) $1.21 $1.89
YOY % 3.1% 55.8%
Consensus $1.54 $0.05 ($0.67) $1.08 $1.73
YOY % 60.2%
0.0x
5.0x
10.0x
15.0x
20.0x
25.0x
30.0x
35.0x
Jan-16 Jan-17 Jan-18 Jan-19 Jan-20 Jan-21
P/E
NTM P/E 5-yr Avg +1 Std Dev -1 Std Dev
0.0x
2.0x
4.0x
6.0x
8.0x
10.0x
12.0x
14.0x
Jan-16 Jan-17 Jan-18 Jan-19 Jan-20 Jan-21
EV/E
BIT
DA
NTM EV/EBITDA 5-yr Avg +1 Std Dev -1 Std Dev
Current Price $21.46NTM EV/EBITDA 8.1xNTM P/E 19.3x52-wk Range $4.83-$23.46
1/15/2021

304
Source: Company data, Credit Suisse estimates
The Cheesecake Factory (CAKE)Neutral, $44 TPExecutive Summary Key Charts
• Credit Suisse View: CAKE has demonstrated better-than-expected resilience, with strong off-premise execution (maintaining ~90% of off-premise sales even as restaurants reopen indoor dining), benefit from outdoor dining and overall high demand among consumers. CAKE is confident in its ability to achieve a run rate restaurant margin at or above pre-COVID levels with annualized AUVs of 90-95%. CAKE expects to return to its 6-7% unit
growth algorithm in 2022, though we are cautious on unit growth given scarce site selection for Cheesecake Factory restaurants & execution risk for new concepts. CAKE’s mall-based exposure remains an overhang on the stock.
• Sales Recovery: We view CAKE as one of the best positioned casual diners in the shift to off-premise given its broad menu, demonstrated ability to execute complex operations & profitability largely at parity with on-premise
given the higher incidence of desserts. Our sales recovery estimates embed expectations for CAKE to recover ~95% of 2019 AUVs in 2021 and AUVs to be up ~2% in 2022 vs 2019, assuming CAKE regains ~95% of prior on-
premise & ~70% of peak off-premise sales in 2022.• Return to Earnings Power: AUV recovery is the primary
driver of margin expansion, with likely opportunity for productivity gains to support the return to CAKE’s long-term 11-12% EPS growth algorithm. We model FY22 earnings power approximately in-line with FY19.
Units by Brand
Revenue by Segment
0
50
100
150
200
250
300
350
2015 2016 2017 2018 2019
Uni
ts
Cheesecake Factory Grand Lux, RockSugar & Social Monk
North Italia Fox Restaurant Concepts
$0
$500
$1,000
$1,500
$2,000
$2,500
$3,000
2015 2016 2017 2018 2019
Rev
enue
($
MM
)
Restaurant Sales Bakery Sales Other Company Sales North Italia FRC
Current Price $41.22NTM EV/EBITDA 10.5xNTM P/E 27.1x52-wk Range $15.10-$42.25
1/15/2021

305
Source: Consensus Metrix, Company data, Credit Suisse estimates
The Cheesecake Factory (CAKE)Neutral, $44 TPValuation & Risks Valuation History• Our $44 TP is based on:
— P/E of ~17x our NTM EPS in 12 months
— EV/EBITDA of ~10x (~10.5x including operating leases) our NTM EBITDA in 12 months
• CAKE’s 5-year average multiples: 17.5-18x NTM P/E & ~9x
NTM EV/EBITDA
• Key risks: consumer spending, COVID-19 pandemic, inflation, competition, mall exposure
5-yr Historical P/E
5-yr Historical EV/EBITDA
Credit Suisse Estimates vs Consensus
0.0x
2.0x
4.0x
6.0x
8.0x
10.0x
12.0x
14.0x
16.0x
18.0x
20.0x
Jan-16 Jan-17 Jan-18 Jan-19 Jan-20 Jan-21
EV/E
BIT
DA
NTM EV/EBITDA 5-yr Avg +1 Std Dev -1 Std Dev
Current Price $41.22NTM EV/EBITDA 10.5xNTM P/E 27.1x52-wk Range $15.10-$42.25
1/15/2021
0.0x
5.0x
10.0x
15.0x
20.0x
25.0x
30.0x
Jan-16 Jan-17 Jan-18 Jan-19 Jan-20 Jan-21
P/E
NTM P/E 5-yr Avg +1 Std Dev -1 Std Dev
2019 1Q20 2Q20 3Q20 4Q20E 2020E 2021E 2022E
Cheesecake SSS 0.8% -12.9% -56.9% -23.3% -8.6% -20.7% 38.3% 7.3%
Consensus -11.7% -25.8% 35.2% 6.2%
Company Units 292 294 294 294 294 294 305 318
YOY % 34.6% 24.6% 3.5% 2.1% 0.7% 0.7% 3.7% 4.3%
Consensus 292 295 295 307 324
YOY % 1.0% 1.0% 4.1% 5.5%
Revenue ($MM) $2,483 $615 $296 $518 $622 $2,051 $2,652 $3,001
YOY % 6.4% 2.6% -50.9% -11.7% -10.3% -17.4% 29.3% 13.1%
Consensus ($MM) $2,483 $611 $2,040 $2,650 $2,929
YOY % #VALUE! -12.0% -17.8% 29.9% 10.5%
Operating Margin 5.2% 0.3% -23.5% -3.9% 1.4% -3.9% 3.5% 5.2%
Consensus 1.0% -4.0% 3.6% 4.9%
EPS $2.61 $0.04 ($0.87) ($0.33) $0.10 ($1.11) $1.44 $2.59
YOY % 4.3% 79.6%
Consensus $2.61 $0.07 ($1.08) $1.45 $2.24
YOY % 54.5%

306
Source: Company data, Credit Suisse estimates
Chipotle Mexican Grill (CMG)Outperform, $1,700 TPExecutive Summary Key Charts
• Credit Suisse View: CMG has returned to a narrative of growth rather than recovery, with on-trend initiatives that
well position the company to appeal to its target base and outperform peers. Contributions from traffic and average check growth should support mid-single-digit SSS long-
term and generate margin leverage to support an EPS CAGR of at least 25-30% through 2024.
• Confidence in Top-Line Performance: Key drivers of top-line outperformance: 1) digital & delivery initiatives, with CMG well positioned with a younger consumer base, transportable food, and best-in-class operations; 2) new menu innovation; 3) strong social media and marketing strategy; and 4) customer data analytics. Improving new-
unit productivity and new restaurant formats (Chipotlane, digital-only) support an increasing addressable market, with
expectations for mid to high-single-digit unit growth.• Power of the Economic Model: CMG is the only publicly
traded restaurant company in quick serve/fast casual with a 100% company-owned model, offering meaningful upside to numbers ($100K AUV = 100bps restaurant margin). We
are optimistic CMG can return to its long-term AUV/margin framework, with the potential to exceed prior peak AUVs & restaurant margins. New unit returns are already among the
best in restaurants (50-60%) and should continue to improve as AUVs & margins increase, and with the expansion of digital-forward prototypes.
Units & Unit Growth
Revenue & Revenue Growth
-20%
-15%
-10%
-5%
0%
5%
10%
15%
20%
25%
30%
$1,500
$2,000
$2,500
$3,000
$3,500
$4,000
$4,500
$5,000
$5,500
$6,000
20
09
20
10
20
11
20
12
20
13
20
14
20
15
20
16
20
17
20
18
20
19
YO
Y G
row
th %
Rev
enue
($
MM
)
Revenue YOY Growth %
2%
4%
6%
8%
10%
12%
14%
16%
500
1,000
1,500
2,000
2,500
3,000
20
09
20
10
20
11
20
12
20
13
20
14
20
15
20
16
20
17
20
18
20
19
YO
Y G
row
th %
Uni
ts
Units YOY Growth %
Current Price $1,405.74NTM EV/EBITDA 38.4xNTM P/E 64.8x52-wk Range $465.21-$1426.30
1/15/2021
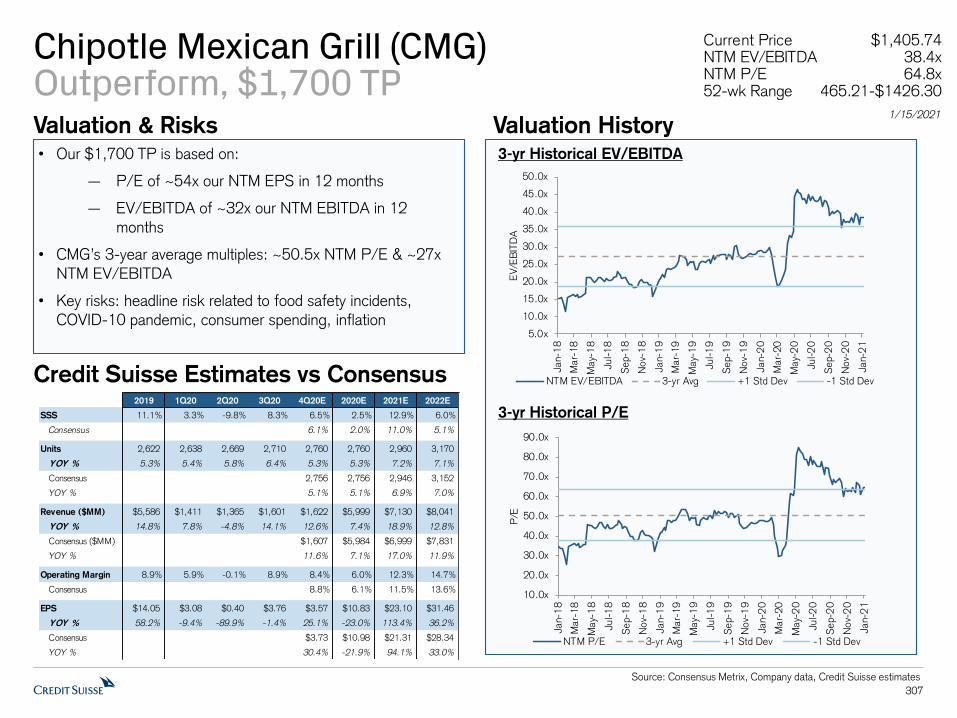
307
Source: Consensus Metrix, Company data, Credit Suisse estimates
Chipotle Mexican Grill (CMG)Outperform, $1,700 TPValuation & Risks Valuation History• Our $1,700 TP is based on:
— P/E of ~54x our NTM EPS in 12 months
— EV/EBITDA of ~32x our NTM EBITDA in 12 months
• CMG’s 3-year average multiples: ~50.5x NTM P/E & ~27x NTM EV/EBITDA
• Key risks: headline risk related to food safety incidents, COVID-10 pandemic, consumer spending, inflation
3-yr Historical EV/EBITDA
3-yr Historical P/E
Credit Suisse Estimates vs Consensus
5.0x
10.0x
15.0x
20.0x
25.0x
30.0x
35.0x
40.0x
45.0x
50.0x
Jan-
18
Mar-
18
May-
18
Jul-1
8
Sep-
18
Nov-
18
Jan-
19
Mar-
19
May-
19
Jul-1
9
Sep-
19
Nov-
19
Jan-
20
Mar-
20
May-
20
Jul-2
0
Sep-
20
Nov-
20
Jan-
21
EV/E
BIT
DA
NTM EV/EBITDA 3-yr Avg +1 Std Dev -1 Std Dev
10.0x
20.0x
30.0x
40.0x
50.0x
60.0x
70.0x
80.0x
90.0x
Jan-
18
Mar-
18
May-
18
Jul-1
8
Sep-
18
Nov-
18
Jan-
19
Mar-
19
May-
19
Jul-1
9
Sep-
19
Nov-
19
Jan-
20
Mar-
20
May-
20
Jul-2
0
Sep-
20
Nov-
20
Jan-
21
P/E
NTM P/E 3-yr Avg +1 Std Dev -1 Std Dev
Current Price $1,405.74NTM EV/EBITDA 38.4xNTM P/E 64.8x52-wk Range $465.21-$1426.30
1/15/2021
2019 1Q20 2Q20 3Q20 4Q20E 2020E 2021E 2022E
SSS 11.1% 3.3% -9.8% 8.3% 6.5% 2.5% 12.9% 6.0%
Consensus 6.1% 2.0% 11.0% 5.1%
Units 2,622 2,638 2,669 2,710 2,760 2,760 2,960 3,170
YOY % 5.3% 5.4% 5.8% 6.4% 5.3% 5.3% 7.2% 7.1%
Consensus ####### 2,756 2,756 2,946 3,152
YOY % 5.1% 5.1% 6.9% 7.0%
Revenue ($MM) $5,586 $1,411 $1,365 $1,601 $1,622 $5,999 $7,130 $8,041
YOY % 14.8% 7.8% -4.8% 14.1% 12.6% 7.4% 18.9% 12.8%
Consensus ($MM) ####### $1,607 $5,984 $6,999 $7,831
YOY % 11.6% 7.1% 17.0% 11.9%
Operating Margin 8.9% 5.9% -0.1% 8.9% 8.4% 6.0% 12.3% 14.7%
Consensus 8.9% 8.8% 6.1% 11.5% 13.6%
EPS $14.05 $3.08 $0.40 $3.76 $3.57 $10.83 $23.10 $31.46
YOY % 58.2% -9.4% -89.9% -1.4% 25.1% -23.0% 113.4% 36.2%
Consensus 1406.0% $3.73 $10.98 $21.31 $28.34
YOY % 30.4% -21.9% 94.1% 33.0%
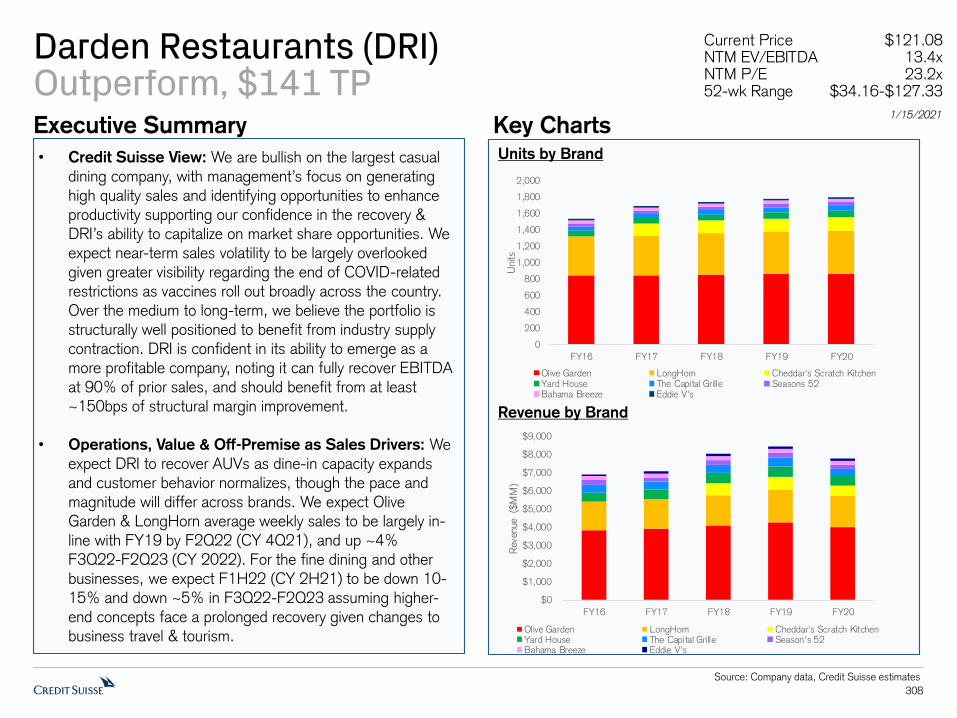
308
Source: Company data, Credit Suisse estimates
Darden Restaurants (DRI)Outperform, $141 TPExecutive Summary Key Charts
• Credit Suisse View: We are bullish on the largest casual dining company, with management’s focus on generating high quality sales and identifying opportunities to enhance productivity supporting our confidence in the recovery & DRI’s ability to capitalize on market share opportunities. We expect near-term sales volatility to be largely overlooked given greater visibility regarding the end of COVID-related restrictions as vaccines roll out broadly across the country.
Over the medium to long-term, we believe the portfolio is structurally well positioned to benefit from industry supply contraction. DRI is confident in its ability to emerge as a more profitable company, noting it can fully recover EBITDA at 90% of prior sales, and should benefit from at least ~150bps of structural margin improvement.
• Operations, Value & Off-Premise as Sales Drivers: We
expect DRI to recover AUVs as dine-in capacity expands and customer behavior normalizes, though the pace and magnitude will differ across brands. We expect Olive Garden & LongHorn average weekly sales to be largely in-
line with FY19 by F2Q22 (CY 4Q21), and up ~4% F3Q22-F2Q23 (CY 2022). For the fine dining and other businesses, we expect F1H22 (CY 2H21) to be down 10-15% and down ~5% in F3Q22-F2Q23 assuming higher-end concepts face a prolonged recovery given changes to business travel & tourism.
Units by Brand
Revenue by Brand
0
200
400
600
800
1,000
1,200
1,400
1,600
1,800
2,000
FY16 FY17 FY18 FY19 FY20
Uni
ts
Olive Garden LongHorn Cheddar's Scratch KitchenYard House The Capital Grille Seasons 52Bahama Breeze Eddie V's
$0
$1,000
$2,000
$3,000
$4,000
$5,000
$6,000
$7,000
$8,000
$9,000
FY16 FY17 FY18 FY19 FY20
Rev
enue
($
MM
)
Olive Garden LongHorn Cheddar's Scratch KitchenYard House The Capital Grille Season's 52Bahama Breeze Eddie V's
Current Price $121.08NTM EV/EBITDA 13.4xNTM P/E 23.2x52-wk Range $34.16-$127.33
1/15/2021

309
Source: Consensus Metrix, Company data, Credit Suisse estimates
Darden Restaurants (DRI)Outperform, $141 TPValuation & Risks Valuation History• Our $141 TP is based on:
— P/E of ~19x our NTM EPS in 12 months
— EV/EBITDA of ~12x our NTM EBITDA in 12 months
• DRI’s 5-year average multiples: ~18.5x NTM P/E & ~10.5x
NTM EV/EBITDA
• Key risks: consumer spending, COVID-19 pandemic, inflation, competition
5-yr Historical P/E
5-yr Historical EV/EBITDA
Credit Suisse Estimates vs Consensus2020 1Q21 2Q21 3Q21E 4Q21E 2021E 2022E 2023E
Olive Garden SSS -8.6% -28.2% -19.9% -31.0% 50.0% -3.8% 30.6% 4.1%
Consensus -32.5% 42.3% -10.0% 28.6% 4.9%
DRI SSS -11.0% -29.0% -20.6% -29.8% 76.1% 4.0% 29.1% 4.3%
Consensus -32.4% 63.0% -5.3% 28.5% 5.4%
Company Units 1,804 1,807 1,818 1,826 1,840 1,840 1,880 1,924
YOY % 1.1% 0.8% 1.1% 0.8% 2.0% 2.0% 2.2% 2.3%
Consensus 1,804 1,828 1,841 1,841 1,887 1,938
YOY % 0.9% 2.1% 2.1% 2.5% 2.7%
Revenue ($MM) $7,807 $1,527 $1,657 $1,651 $2,011 $6,846 $8,909 $9,481
YOY % -8.3% -28.4% -19.4% -29.6% 58.4% -12.3% 30.1% 6.4%
Consensus ($MM) $7,807 $1,585 $1,952 $6,721 $8,773 $9,513
YOY % -32.4% 53.7% -13.9% 30.5% 8.4%
Operating Margin 5.6% 6.4% 7.3% 6.8% 10.7% 8.0% 11.8% 12.3%
Consensus 7.0% 10.1% 7.8% 11.3% 11.7%
EPS $3.17 $0.56 $0.74 $0.66 $1.38 $3.34 $6.86 $7.76
YOY % -45.5% -59.5% -34.1% -65.0% -211.0% 5.4% 105.3% 13.2%
Consensus $3.13 $0.66 $1.25 $3.22 $6.39 $7.39
YOY % -65.3% -200.8% 2.9% 98.4% 15.6%
5.0x
10.0x
15.0x
20.0x
25.0x
30.0x
35.0x
Jan-16 Jan-17 Jan-18 Jan-19 Jan-20 Jan-21
P/E
NTM P/E 5-yr Avg +1 Std Dev -1 Std Dev
4.0x
6.0x
8.0x
10.0x
12.0x
14.0x
16.0x
Jan-16 Jan-17 Jan-18 Jan-19 Jan-20 Jan-21
EV/E
BIT
DA
NTM EV/EBITDA 5-yr Avg +1 Std Dev -1 Std Dev
Current Price $121.08NTM EV/EBITDA 13.4xNTM P/E 23.2x52-wk Range $34.16-$127.33
1/15/2021

310
Source: Company data, Credit Suisse estimates
Domino’s Pizza (DPZ)Outperform, $445 TPExecutive Summary Key Charts
• Credit Suisse View: DPZ is one of the best growth stories in restaurants, with ~7.5% revenue growth, margin expansion
& repurchases driving a double-digit EPS CAGR. • US Outperformance: We are optimistic in DPZ’s ability to
retain sales following 2020’s outsized growth, noting the
company has historically experienced high levels of growth, has gained new customers in 2020 and will look to
reaccelerate carryout. DPZ is the only large chain with a frequency-based loyalty program, offers consistent value messaging, and operates an industry-leading digital ecosystem supporting best-in-class execution. DPZ also has a unique franchisee base, which we view as a competitive advantage, with 95%+ of US franchisees starting as an
hourly employee. Unit economics are very compelling, with an average EBITDA per store of ~$158K, average EBITDA per
franchisee of $1MM+, and a payback period of <3 years.• Delivery Debate: We believe the expansion of third-party
delivery throughout 2020 will accelerate the timeline for rationalization as restaurants inflate delivery menu prices & 3Ps increase fees amidst heightened regulations, consumers
demand better quality as newness declines and companies look to convert delivery customers to more accretive channels. Delivery is a core competency for DPZ developed
over decades, and we are unconvinced 3Ps will be able to approach DPZ’s execution levels, value or economics anytime soon.
Revenue Composition
Unit Composition
0%
10%
20%
30%
40%
50%
60%
70%
80%
90%
100%
20
09
20
10
20
11
20
12
20
13
20
14
20
15
20
16
20
17
20
18
20
19
Rev
enue
C
ompo
sitio
n
US Stores International Franchise Supply Chain
0
2,000
4,000
6,000
8,000
10,000
12,000
14,000
16,000
18,000
20
09
20
10
20
11
20
12
20
13
20
14
20
15
20
16
20
17
20
18
20
19
Uni
t C
ompo
sitio
n
US Company US Franchise International Franchise
Current Price $375.23NTM EV/EBITDA 21.8xNTM P/E 28.9x52-wk Range $270.75-$433.78
1/15/2021
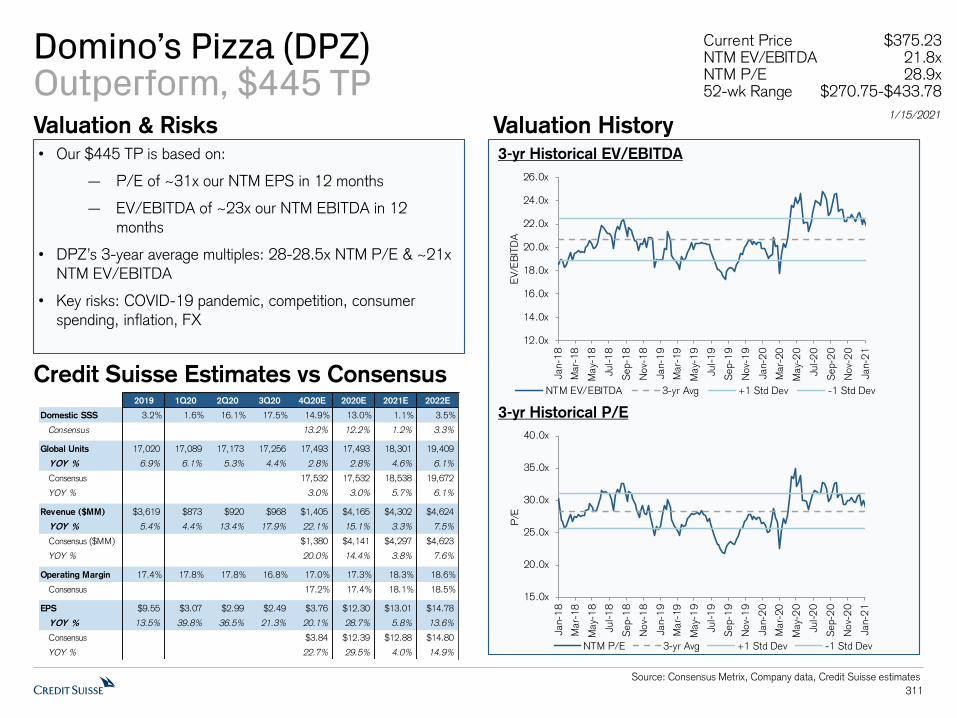
311
Source: Consensus Metrix, Company data, Credit Suisse estimates
Domino’s Pizza (DPZ)Outperform, $445 TPValuation & Risks Valuation History• Our $445 TP is based on:
— P/E of ~31x our NTM EPS in 12 months
— EV/EBITDA of ~23x our NTM EBITDA in 12 months
• DPZ’s 3-year average multiples: 28-28.5x NTM P/E & ~21x NTM EV/EBITDA
• Key risks: COVID-19 pandemic, competition, consumer spending, inflation, FX
3-yr Historical EV/EBITDA
3-yr Historical P/E
Credit Suisse Estimates vs Consensus
12.0x
14.0x
16.0x
18.0x
20.0x
22.0x
24.0x
26.0x
Jan-
18
Mar-
18
May-
18
Jul-1
8
Sep-
18
Nov-
18
Jan-
19
Mar-
19
May-
19
Jul-1
9
Sep-
19
Nov-
19
Jan-
20
Mar-
20
May-
20
Jul-2
0
Sep-
20
Nov-
20
Jan-
21
EV/E
BIT
DA
NTM EV/EBITDA 3-yr Avg +1 Std Dev -1 Std Dev
15.0x
20.0x
25.0x
30.0x
35.0x
40.0x
Jan-
18
Mar-
18
May-
18
Jul-1
8
Sep-
18
Nov-
18
Jan-
19
Mar-
19
May-
19
Jul-1
9
Sep-
19
Nov-
19
Jan-
20
Mar-
20
May-
20
Jul-2
0
Sep-
20
Nov-
20
Jan-
21
P/E
NTM P/E 3-yr Avg +1 Std Dev -1 Std Dev
Current Price $375.23NTM EV/EBITDA 21.8xNTM P/E 28.9x52-wk Range $270.75-$433.78
1/15/2021
2019 1Q20 2Q20 3Q20 4Q20E 2020E 2021E 2022E
Domestic SSS 3.2% 1.6% 16.1% 17.5% 14.9% 13.0% 1.1% 3.5%
Consensus 13.2% 12.2% 1.2% 3.3%
Global Units 17,020 17,089 17,173 17,256 17,493 17,493 18,301 19,409
YOY % 6.9% 6.1% 5.3% 4.4% 2.8% 2.8% 4.6% 6.1%
Consensus 17,020 17,532 17,532 18,538 19,672
YOY % 3.0% 3.0% 5.7% 6.1%
Revenue ($MM) $3,619 $873 $920 $968 $1,405 $4,165 $4,302 $4,624
YOY % 5.4% 4.4% 13.4% 17.9% 22.1% 15.1% 3.3% 7.5%
Consensus ($MM) $3,619 $1,380 $4,141 $4,297 $4,623
YOY % 20.0% 14.4% 3.8% 7.6%
Operating Margin 17.4% 17.8% 17.8% 16.8% 17.0% 17.3% 18.3% 18.6%
Consensus 17.2% 17.4% 18.1% 18.5%
EPS $9.55 $3.07 $2.99 $2.49 $3.76 $12.30 $13.01 $14.78
YOY % 13.5% 39.8% 36.5% 21.3% 20.1% 28.7% 5.8% 13.6%
Consensus $9.57 $3.84 $12.39 $12.88 $14.80
YOY % 22.7% 29.5% 4.0% 14.9%
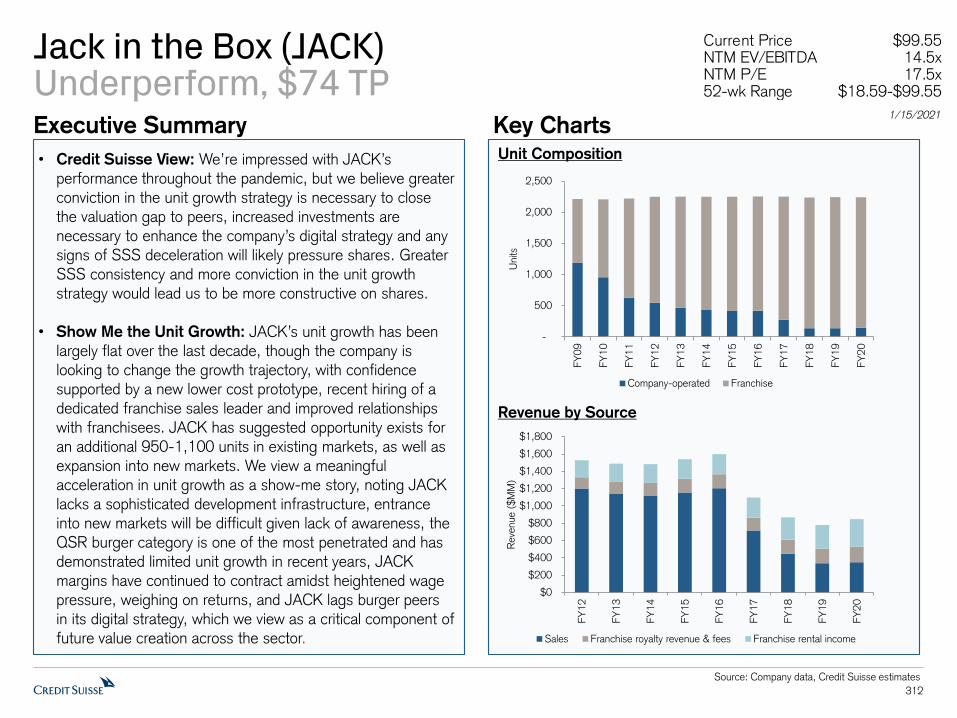
312
Source: Company data, Credit Suisse estimates
Jack in the Box (JACK)Underperform, $74 TPExecutive Summary Key Charts
• Credit Suisse View: We’re impressed with JACK’s performance throughout the pandemic, but we believe greater conviction in the unit growth strategy is necessary to close the valuation gap to peers, increased investments are
necessary to enhance the company’s digital strategy and any
signs of SSS deceleration will likely pressure shares. Greater SSS consistency and more conviction in the unit growth strategy would lead us to be more constructive on shares.
• Show Me the Unit Growth: JACK’s unit growth has been largely flat over the last decade, though the company is looking to change the growth trajectory, with confidence supported by a new lower cost prototype, recent hiring of a dedicated franchise sales leader and improved relationships
with franchisees. JACK has suggested opportunity exists for an additional 950-1,100 units in existing markets, as well as expansion into new markets. We view a meaningful
acceleration in unit growth as a show-me story, noting JACK lacks a sophisticated development infrastructure, entrance
into new markets will be difficult given lack of awareness, the QSR burger category is one of the most penetrated and has demonstrated limited unit growth in recent years, JACK margins have continued to contract amidst heightened wage pressure, weighing on returns, and JACK lags burger peers in its digital strategy, which we view as a critical component of
future value creation across the sector.
Unit Composition
Revenue by Source
-
500
1,000
1,500
2,000
2,500
FY
09
FY
10
FY
11
FY
12
FY
13
FY
14
FY
15
FY
16
FY
17
FY
18
FY
19
FY
20
Units
Company-operated Franchise
$0
$200
$400
$600
$800
$1,000
$1,200
$1,400
$1,600
$1,800
FY
12
FY
13
FY
14
FY
15
FY
16
FY
17
FY
18
FY
19
FY
20
Reve
nue (
$M
M)
Sales Franchise royalty revenue & fees Franchise rental income
Current Price $99.55NTM EV/EBITDA 14.5xNTM P/E 17.5x52-wk Range $18.59-$99.55
1/15/2021
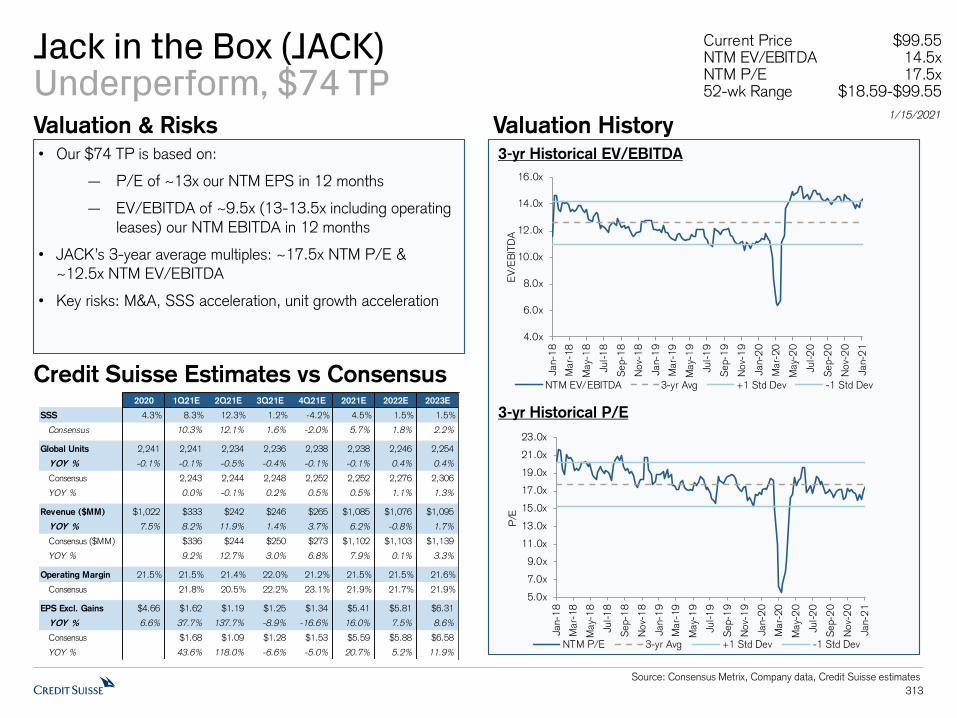
313
Source: Consensus Metrix, Company data, Credit Suisse estimates
Jack in the Box (JACK)Underperform, $74 TPValuation & Risks Valuation History• Our $74 TP is based on:
— P/E of ~13x our NTM EPS in 12 months
— EV/EBITDA of ~9.5x (13-13.5x including operating leases) our NTM EBITDA in 12 months
• JACK’s 3-year average multiples: ~17.5x NTM P/E & ~12.5x NTM EV/EBITDA
• Key risks: M&A, SSS acceleration, unit growth acceleration
3-yr Historical EV/EBITDA
3-yr Historical P/E
Credit Suisse Estimates vs Consensus
Current Price $99.55NTM EV/EBITDA 14.5xNTM P/E 17.5x52-wk Range $18.59-$99.55
1/15/2021
4.0x
6.0x
8.0x
10.0x
12.0x
14.0x
16.0x
Jan-
18
Mar-
18
May-
18
Jul-1
8
Sep-
18
Nov-
18
Jan-
19
Mar-
19
May-
19
Jul-1
9
Sep-
19
Nov-
19
Jan-
20
Mar-
20
May-
20
Jul-2
0
Sep-
20
Nov-
20
Jan-
21
EV/E
BIT
DA
NTM EV/EBITDA 3-yr Avg +1 Std Dev -1 Std Dev
5.0x
7.0x
9.0x
11.0x
13.0x
15.0x
17.0x
19.0x
21.0x
23.0x
Jan-
18
Mar-
18
May-
18
Jul-1
8
Sep-
18
Nov-
18
Jan-
19
Mar-
19
May-
19
Jul-1
9
Sep-
19
Nov-
19
Jan-
20
Mar-
20
May-
20
Jul-2
0
Sep-
20
Nov-
20
Jan-
21
P/E
NTM P/E 3-yr Avg +1 Std Dev -1 Std Dev
2020 1Q21E 2Q21E 3Q21E 4Q21E 2021E 2022E 2023E
SSS 4.3% 8.3% 12.3% 1.2% -4.2% 4.5% 1.5% 1.5%
Consensus 10.3% 12.1% 1.6% -2.0% 5.7% 1.8% 2.2%
Global Units 2,241 2,241 2,234 2,236 2,238 2,238 2,246 2,254
YOY % -0.1% -0.1% -0.5% -0.4% -0.1% -0.1% 0.4% 0.4%
Consensus 2,241 2,243 2,244 2,248 2,252 2,252 2,276 2,306
YOY % 0.0% -0.1% 0.2% 0.5% 0.5% 1.1% 1.3%
Revenue ($MM) $1,022 $333 $242 $246 $265 $1,085 $1,076 $1,095
YOY % 7.5% 8.2% 11.9% 1.4% 3.7% 6.2% -0.8% 1.7%
Consensus ($MM) $1,022 $336 $244 $250 $273 $1,102 $1,103 $1,139
YOY % 9.2% 12.7% 3.0% 6.8% 7.9% 0.1% 3.3%
Operating Margin 21.5% 21.5% 21.4% 22.0% 21.2% 21.5% 21.5% 21.6%
Consensus 21.8% 20.5% 22.2% 23.1% 21.9% 21.7% 21.9%
EPS Excl. Gains $4.66 $1.62 $1.19 $1.25 $1.34 $5.41 $5.81 $6.31
YOY % 6.6% 37.7% 137.7% -8.9% -16.6% 16.0% 7.5% 8.6%
Consensus $4.63 $1.68 $1.09 $1.28 $1.53 $5.59 $5.88 $6.58
YOY % 43.6% 118.0% -6.6% -5.0% 20.7% 5.2% 11.9%

314
Source: Company data, Credit Suisse estimates
McDonald’s (MCD)Outperform, $230 TPExecutive Summary Key Charts• Credit Suisse View: Recent asset and technology
investments support a more modernized MCD, and we believe the company is effectively expanding its competitive moat relative to peers. SSS represent the greatest source of upside to shares, with MCD’s slate of on-trend
sales initiatives supporting outperformance. Healthy SSS,
defensive characteristics & transition to ~95% franchised support the current premium valuation. We believe MCD is well positioned to gain share globally given brand strength, operational execution, value leadership and a healthy
franchisee base, with better leveraging of its tech infrastructure to expand the competitive moat.
• US Sales Outperformance to Continue: We believe enhancements to the core menu, culturally relevant marketing & more relaxed social media strategy, better
leveraging of its unmatched scale to develop a more sophisticated digital ecosystem and faster drive-thru service times for the best-in-class operator is a winning strategy
that supports continued market share gains & better profitability. We expect the rollout of the highly anticipated
chicken sandwich in early 2021 & launch of MyMcDonald’s Rewards in 2021 will be meaningful drivers of SSS.
• Digital Supports Future Gains: MCD’s tech investments
suggest a long-term strategy to develop an integrated digital infrastructure. With the acquisition of Dynamic Yield, MCD has unlocked access to innovative tech & talent,
customer data, & incremental revenue channels over time.
Unit Composition
System Sales by Segment
$0
$20,000
$40,000
$60,000
$80,000
$100,000
$120,000
20
10
20
11
20
12
20
13
20
14
20
15
20
16
20
17
20
18
20
19
Sys
tem
Sal
es (
$M
M)
US International Lead Markets
High Growth Markets Foundational Markets & Corporate
International Operated Markets International Developmental Licensed Markets
-
5,000
10,000
15,000
20,000
25,000
30,000
35,000
40,000
45,000
20
10
20
11
20
12
20
13
20
14
20
15
20
16
20
17
20
18
20
19
Uni
ts
US International Lead Markets
High Growth Markets Foundational Markets & Corporate
International Operated Markets International Developmental Licensed Markets
Current Price $209.91NTM EV/EBITDA 18.3xNTM P/E 25.1x52-wk Range $137.10-$229.64
1/15/2021

315
Source: Consensus Metrix, Company data, Credit Suisse estimates
McDonald’s (MCD)Outperform, $230 TPValuation & Risks Valuation History• Our $230 TP is based on:
— P/E of ~25.5x our NTM EPS in 12 months
— EV/EBITDA of ~17x our NTM EBITDA in 12 months
• MCD’s 3-year average multiples: 23.5-24x NTM P/E & ~17x NTM EV/EBITDA
• Key risks: competition, consumer spending, COVID-19 pandemic
3-yr Historical EV/EBITDA
3-yr Historical P/E
Credit Suisse Estimates vs Consensus
Current Price $209.91NTM EV/EBITDA 18.3xNTM P/E 25.1x52-wk Range $137.10-$229.64
1/15/2021
2019 1Q20 2Q20 3Q20 4Q20E 2020E 2021E 2022E
US SSS 5.0% 0.1% -8.7% 4.6% 5.5% 0.7% 7.5% 3.0%
Consensus 5.1% 0.3% 6.7% 3.2%
Global Units 38,695 38,984 39,020 39,096 38,991 38,991 39,591 40,586
YOY % 2.2% 2.7% 2.4% 2.1% 0.8% 0.8% 1.5% 2.5%
Consensus 38,695 39,044 39,044 39,760 40,652
YOY % 0.9% 0.9% 1.8% 2.2%
Revenue ($MM) $21,285 $4,714 $3,762 $5,418 $5,441 $19,335 $22,148 $22,971
YOY % 1.2% -6.2% -30.5% -1.5% 1.7% -9.2% 14.5% 3.7%
Consensus ($MM) $21,077 $5,384 $19,269 $21,995 $23,114
YOY % 0.6% -8.6% 14.2% 5.1%
Operating Margin 43.0% 35.9% 25.9% 44.1% 39.7% 37.3% 43.0% 43.8%
Consensus 38.8% 37.1% 42.6% 43.3%
EPS $7.86 $1.47 $0.66 $2.22 $1.86 $6.21 $8.45 $9.15
YOY % -0.5% -14.4% -67.9% 4.4% -5.7% -21.0% 36.1% 8.3%
Consensus $7.84 $1.79 $6.14 $8.31 $9.05
YOY % -9.1% -21.7% 35.3% 8.9%
10.0x
15.0x
20.0x
25.0x
30.0x
35.0x
Jan-
18
Mar-
18
May-
18
Jul-1
8
Sep-
18
Nov-
18
Jan-
19
Mar-
19
May-
19
Jul-1
9
Sep-
19
Nov-
19
Jan-
20
Mar-
20
May-
20
Jul-2
0
Sep-
20
Nov-
20
Jan-
21
P/E
NTM P/E 3-yr Avg +1 Std Dev -1 Std Dev
10.0x
12.0x
14.0x
16.0x
18.0x
20.0x
22.0x
Jan-
18
Mar-
18
May-
18
Jul-1
8
Sep-
18
Nov-
18
Jan-
19
Mar-
19
May-
19
Jul-1
9
Sep-
19
Nov-
19
Jan-
20
Mar-
20
May-
20
Jul-2
0
Sep-
20
Nov-
20
Jan-
21
EV/E
BIT
DA
NTM EV/EBITDA 3-yr Avg +1 Std Dev -1 Std Dev
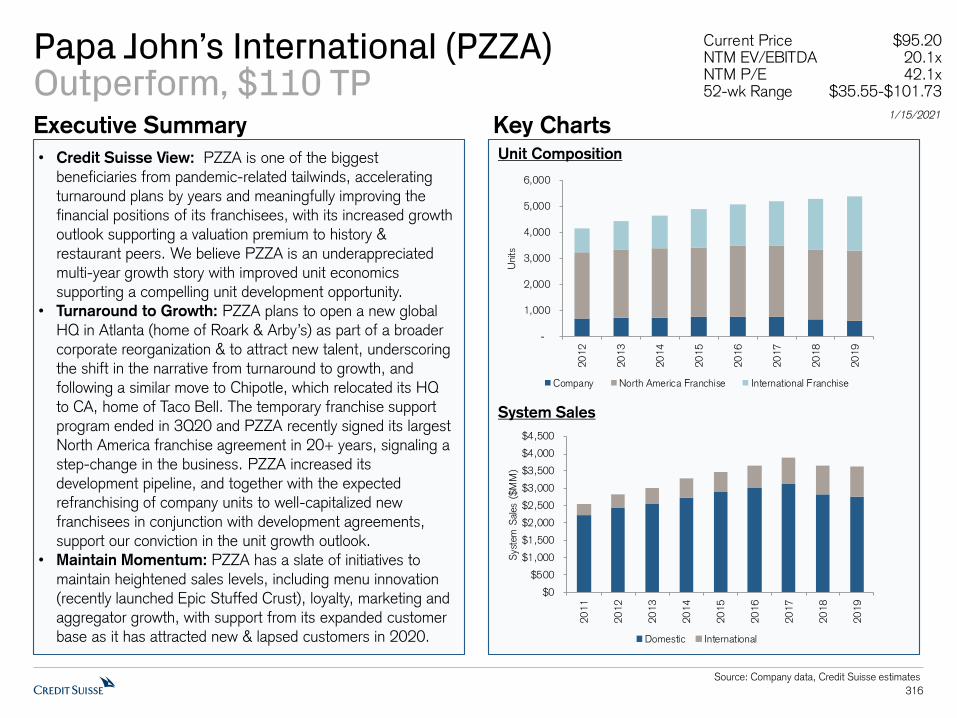
316
Source: Company data, Credit Suisse estimates
Papa John’s International (PZZA)Outperform, $110 TPExecutive Summary Key Charts
• Credit Suisse View: PZZA is one of the biggest beneficiaries from pandemic-related tailwinds, accelerating
turnaround plans by years and meaningfully improving the financial positions of its franchisees, with its increased growth outlook supporting a valuation premium to history &
restaurant peers. We believe PZZA is an underappreciated multi-year growth story with improved unit economics
supporting a compelling unit development opportunity. • Turnaround to Growth: PZZA plans to open a new global
HQ in Atlanta (home of Roark & Arby’s) as part of a broader corporate reorganization & to attract new talent, underscoring the shift in the narrative from turnaround to growth, and following a similar move to Chipotle, which relocated its HQ
to CA, home of Taco Bell. The temporary franchise support program ended in 3Q20 and PZZA recently signed its largest
North America franchise agreement in 20+ years, signaling a step-change in the business. PZZA increased its
development pipeline, and together with the expected refranchising of company units to well-capitalized new franchisees in conjunction with development agreements,
support our conviction in the unit growth outlook.• Maintain Momentum: PZZA has a slate of initiatives to
maintain heightened sales levels, including menu innovation
(recently launched Epic Stuffed Crust), loyalty, marketing and aggregator growth, with support from its expanded customer base as it has attracted new & lapsed customers in 2020.
Unit Composition
System Sales
$0
$500
$1,000
$1,500
$2,000
$2,500
$3,000
$3,500
$4,000
$4,500
20
11
20
12
20
13
20
14
20
15
20
16
20
17
20
18
20
19
Sys
tem
Sal
es (
$M
M)
Domestic International
-
1,000
2,000
3,000
4,000
5,000
6,000
20
12
20
13
20
14
20
15
20
16
20
17
20
18
20
19
Uni
ts
Company North America Franchise International Franchise
Current Price $95.20NTM EV/EBITDA 20.1xNTM P/E 42.1x52-wk Range $35.55-$101.73
1/15/2021

317
Source: Consensus Metrix, Company data, Credit Suisse estimates
Papa John’s International (PZZA)Outperform, $110 TPValuation & Risks Valuation History• Our $110 TP is based on:
— EV/EBITDA of ~19x our NTM EBITDA in 12 months
— P/E of ~41x our NTM EPS in 12 months
• PZZA’s 3-year average multiples: ~17x NTM EV/EBITDA & ~35x NTM P/E
• Key risks: consumer sentiment challenges, closures, COVID-19 pandemic, competition
5-yr Historical EV/EBITDA
5-yr Historical P/E
Credit Suisse Estimates vs Consensus
8.0x
10.0x
12.0x
14.0x
16.0x
18.0x
20.0x
22.0x
24.0x
26.0x
Jan-16 Jan-17 Jan-18 Jan-19 Jan-20 Jan-21
EV/E
BIT
DA
NTM EV/EBITDA 5-yr Avg +1 Std Dev -1 Std Dev
Current Price $95.20NTM EV/EBITDA 20.1xNTM P/E 42.1x52-wk Range $35.55-$101.73
1/15/2021
2019 1Q20 2Q20 3Q20 4Q20E 2020E 2021E 2022E
North America SSS -2.2% 5.3% 28.0% 23.8% 13.1% 18.1% 1.3% 2.5%
Consensus 13.2% 17.7% 1.6% 3.5%
Global Units 5,395 5,378 5,347 5,360 5,385 5,385 5,563 5,782
YOY % 1.7% 0.8% 0.0% 0.3% -0.2% -0.2% 3.3% 3.9%
Consensus 5,395 5,388 5,388 5,593 5,845
YOY % -0.1% -0.1% 3.8% 4.5%
Revenue ($MM) $1,619 $410 $461 $473 $471 $1,814 $1,892 $1,965
YOY % -2.5% 2.9% 15.3% 17.1% 12.8% 12.0% 4.3% 3.9%
Consensus ($MM) $1,619 $465 $1,809 $1,879 $1,970
YOY % 11.4% 11.7% 3.9% 4.9%
Operating Margin 2.1% 3.8% 6.6% 5.2% 6.9% 5.7% 7.8% 8.1%
Consensus 6.2% 5.5% 7.1% 7.6%
EPS $0.03 $0.15 $0.48 $0.35 $0.53 $1.51 $2.50 $2.73
YOY % -95.6% -19.2% 201.2% -597.6% -314.4% 4466.6% 65.4% 9.2%
Consensus $0.03 $0.44 $1.43 $2.20 $2.58
YOY % -276.0% 4666.7% 53.8% 17.3%
10.0x
15.0x
20.0x
25.0x
30.0x
35.0x
40.0x
45.0x
50.0x
55.0x
60.0x
Jan-16 Jan-17 Jan-18 Jan-19 Jan-20 Jan-21
P/E
NTM P/E 5-yr Avg +1 Std Dev -1 Std Dev
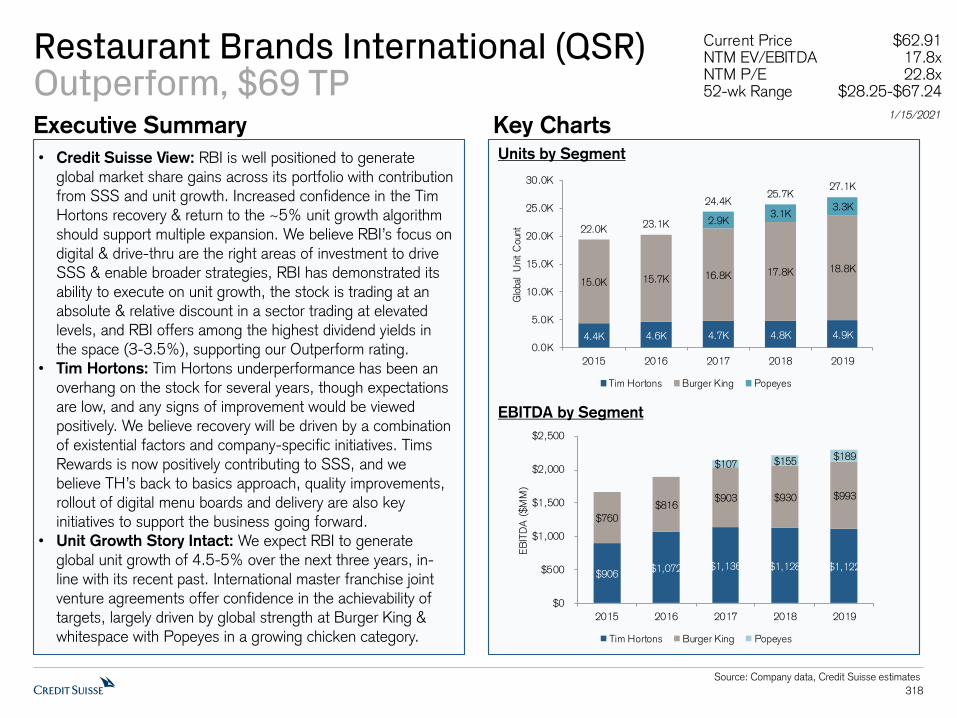
318
Source: Company data, Credit Suisse estimates
Restaurant Brands International (QSR)Outperform, $69 TPExecutive Summary Key Charts
• Credit Suisse View: RBI is well positioned to generate global market share gains across its portfolio with contribution
from SSS and unit growth. Increased confidence in the Tim Hortons recovery & return to the ~5% unit growth algorithm should support multiple expansion. We believe RBI’s focus on
digital & drive-thru are the right areas of investment to drive SSS & enable broader strategies, RBI has demonstrated its
ability to execute on unit growth, the stock is trading at an absolute & relative discount in a sector trading at elevated levels, and RBI offers among the highest dividend yields in the space (3-3.5%), supporting our Outperform rating.
• Tim Hortons: Tim Hortons underperformance has been an overhang on the stock for several years, though expectations
are low, and any signs of improvement would be viewed positively. We believe recovery will be driven by a combination
of existential factors and company-specific initiatives. Tims Rewards is now positively contributing to SSS, and we
believe TH’s back to basics approach, quality improvements,rollout of digital menu boards and delivery are also key initiatives to support the business going forward.
• Unit Growth Story Intact: We expect RBI to generate global unit growth of 4.5-5% over the next three years, in-line with its recent past. International master franchise joint
venture agreements offer confidence in the achievability of targets, largely driven by global strength at Burger King & whitespace with Popeyes in a growing chicken category.
Units by Segment
EBITDA by Segment
$906 $1,072 $1,136 $1,128 $1,122
$760
$816 $903 $930 $993
$107 $155 $189
$0
$500
$1,000
$1,500
$2,000
$2,500
2015 2016 2017 2018 2019
EB
ITD
A (
$M
M)
Tim Hortons Burger King Popeyes
4.4K 4.6K 4.7K 4.8K 4.9K
15.0K 15.7K 16.8K 17.8K 18.8K
2.9K3.1K
3.3K
22.0K23.1K
24.4K25.7K
27.1K
0.0K
5.0K
10.0K
15.0K
20.0K
25.0K
30.0K
2015 2016 2017 2018 2019
Glo
bal
Uni
t C
ount
Tim Hortons Burger King Popeyes
Current Price $62.91NTM EV/EBITDA 17.8xNTM P/E 22.8x52-wk Range $28.25-$67.24
1/15/2021

319
Source: Consensus Metrix, Company data, Credit Suisse estimates
Restaurant Brands International (QSR)Outperform, $69 TPValuation & Risks Valuation History• Our $69 TP is based on:
— EV/EBITDA of ~16.5x (~17x including operating leases) our NTM EBITDA in 12 months
— P/E of ~21x our NTM EPS in 12 months
• QSR’s 3-year average multiples: ~17x NTM EV/EBITDA & ~22x NTM P/E
• Key risks: COVID-19 pandemic, competition, consumer spending, FX
3-yr Historical EV/EBITDA
3-yr Historical P/E
Credit Suisse Estimates vs Consensus
Current Price $62.91NTM EV/EBITDA 17.8xNTM P/E 22.8x52-wk Range $28.25-$67.24
1/15/2021
2019 1Q20 2Q20 3Q20 4Q20E 2020E 2021E 2022E
BK Global SSS 3.4% -3.7% -13.4% -7.0% -3.0% -6.4% 9.6% 2.2%
Consensus -2.9% -6.7% 8.6% 2.9%
TH Global SSS -1.5% -10.3% -29.3% -12.5% -11.5% -15.1% 14.6% 1.8%
Consensus -10.5% -15.6% 13.0% 3.0%
PLK Global SSS 13.6% 26.2% 24.8% 17.4% 1.7% 17.0% 3.5% 2.0%
Consensus -3.6% 16.0% 3.4% 2.8%
Global Units 27,086 27,112 27,059 27,027 27,082 27,082 28,202 29,587
YOY % 5.2% 5.0% 3.9% 2.7% 0.0% 0.0% 4.1% 4.9%
Consensus 27,086 27,095 27,095 28,207 29,610
YOY % 0.0% 0.0% 4.1% 5.0%
Revenue ($MM) $5,603 $1,225 $1,048 $1,337 $1,381 $4,991 $5,846 $6,113
YOY % 4.6% -3.2% -25.1% -8.3% -6.6% -10.9% 17.1% 4.6%
Consensus ($MM) $5,603 $1,360 $4,972 $5,624 $5,940
YOY % -8.0% -11.3% 13.1% 5.6%
Operating Margin 37.1% 31.5% 28.3% 37.6% 37.0% 34.0% 37.5% 38.2%
Consensus 37.0% 34.0% 36.8% 37.7%
EPS $2.72 $0.48 $0.33 $0.68 $0.69 $2.19 $3.00 $3.25
YOY % 3.5% -11.4% -53.5% -5.0% -7.4% -19.6% 37.2% 8.3%
Consensus $2.72 $0.67 $2.15 $2.79 $3.09
YOY % -10.7% -21.0% 29.8% 10.8%
8.0x
10.0x
12.0x
14.0x
16.0x
18.0x
20.0x
22.0x
24.0x
26.0x
28.0x
Jan-
18
Mar-
18
May-
18
Jul-1
8
Sep-
18
Nov-
18
Jan-
19
Mar-
19
May-
19
Jul-1
9
Sep-
19
Nov-
19
Jan-
20
Mar-
20
May-
20
Jul-2
0
Sep-
20
Nov-
20
Jan-
21
P/E
NTM P/E 3-yr Avg +1 Std Dev -1 Std Dev
9.0x
11.0x
13.0x
15.0x
17.0x
19.0x
21.0x
Jan-
18
Mar-
18
May-
18
Jul-1
8
Sep-
18
Nov-
18
Jan-
19
Mar-
19
May-
19
Jul-1
9
Sep-
19
Nov-
19
Jan-
20
Mar-
20
May-
20
Jul-2
0
Sep-
20
Nov-
20
Jan-
21
EV/E
BIT
DA
NTM EV/EBITDA 3-yr Avg +1 Std Dev -1 Std Dev

320
Source: Company data, Credit Suisse estimates
Shake Shack (SHAK)Neutral, $102 TPExecutive Summary Key Charts
• Credit Suisse View: SHAK is facing an outsized near-term risk from the impact of COVID-19 with its exposure to high-
traffic, tourist areas, and a foundation built on community gathering, though this is largely overlooked by long-term investors. SHAK’s new formats & accelerated digital adoption
well position SHAK to increase its addressable market long-term, though at current valuation, we remain Neutral.
• Unit Growth Outlook: SHAK is diversifying its asset base with a range of new formats and additions to the existing system, positioning the company to increase its addressable market and long-term unit potential (current stated goal of 450 company-operated units). SHAK plans to open 35-40company-operated and 15-20 licensed units in 2021, and
45-50 company-operated and 20-25 licensed units in 2022. The majority of new units will feature a Shack Track element,
including curbside pickup, an enhanced interior pickup model, and exterior walk-up or a drive-up window, with SHAK on
track to open its first drive-thru in 2021, and 5-8 slated to open by 2022.
• Margin Outlook Difficult: We expect restaurant margins to
remain below historical levels over the next few years,following ~650bps of margin contract from 2015-2019. Margin recovery is in part predicated by sales recovery. We
see longer-term opportunities for some margin expansion with SSS leverage, higher prices (particularlyy in delivery channel), favorable new unit mix and contribution from digital.
Unit Composition
System Sales Composition
-
50
100
150
200
250
300
20
10
20
11
20
12
20
13
20
14
20
15
20
16
20
17
20
18
20
19
Uni
ts
Domestic Company-Operated Domestic Licensed International Licensed
$0
$100
$200
$300
$400
$500
$600
$700
$800
$900
$1,000
2014 2015 2016 2017 2018 2019
Sys
tem
Sal
es (
$M
M)
Domestic Company Domestic & International License
Current Price $111.26NTM EV/EBITDA 57.6xNTM P/E 466.0x52-wk Range $32.51-$114.65
1/15/2021

321
Source: Consensus Metrix, Company data, Credit Suisse estimates
Shake Shack (SHAK)Neutral, $102 TPValuation & Risks Valuation History• Our $102 TP is based on:
— EV/EBITDA of ~34x (~37x including operating leases) our NTM EBITDA in 12 months
— DCF implies ~500 company-operated units by FY26
• SHAKs 3-year average NTM EV/EBITDA multiple: ~30x (range from 17x-51.5x)
• Key risks: unit growth/productivity, consumer spending,
COVID-19 pandemic
3-yr Historical EV/EBITDA
3-yr Historical P/E
Credit Suisse Estimates vs Consensus2019 1Q20 2Q20 3Q20 4Q20E 2020E 2021E 2022E
SSS 1.3% -12.8% -49.0% -31.7% -17.4% -27.8% 35.5% 10.3%
Consensus -19.7% -28.2% 27.7% 7.1%
Global Units 275 287 292 298 311 311 367 438
YOY % 88.1% 88.4% 88.6% 88.8% 89.3% 89.3% 89.9% 90.6%
Consensus 275 308 308 363 425
YOY % 12.0% 12.0% 17.9% 17.1%
Revenue ($MM) $595 $143 $92 $130 $158 $523 $748 $947
YOY % 29.4% 8.0% -39.9% -17.3% 4.0% -12.1% 43.1% 26.5%
Consensus ($MM) $595 $153 $519 $729 $901
YOY % 1.3% -12.7% 40.5% 23.6%
Operating Margin 4.7% -0.5% -26.2% -5.1% -5.0% -7.5% 2.1% 4.2%
Consensus -5.1% -7.6% 1.4% 3.6%
EPS $0.72 $0.02 ($0.45) ($0.11) ($0.13) ($0.68) $0.31 $0.70
YOY % 0.8% -84.0% 129.5%
Consensus $0.72 ($0.14) ($0.68) $0.18 $0.59
YOY % 227.8%
8.0x
18.0x
28.0x
38.0x
48.0x
58.0x
68.0x
Jan-1
8
Mar-
18
May-
18
Jul-1
8
Sep-1
8
Nov-
18
Jan-1
9
Mar-
19
May-
19
Jul-1
9
Sep-1
9
Nov-
19
Jan-2
0
Mar-
20
May-
20
Jul-2
0
Sep-2
0
Nov-
20
Jan-2
1
EV/E
BIT
DA
NTM EV/EBITDA 3-yr Avg +1 Std Dev -1 Std Dev
Current Price $111.26NTM EV/EBITDA 57.6xNTM P/E 466.0x52-wk Range $32.51-$114.65
1/15/2021
0.0x
100.0x
200.0x
300.0x
400.0x
500.0x
600.0x
700.0x
Jan-1
8
Mar-
18
May-
18
Jul-1
8
Sep-1
8
Nov-
18
Jan-1
9
Mar-
19
May-
19
Jul-1
9
Sep-1
9
Nov-
19
Jan-2
0
Mar-
20
May-
20
Jul-2
0
Sep-2
0
Nov-
20
Jan-2
1
P/E
NTM P/E 3-yr Avg +1 Std Dev -1 Std Dev

322
Source: Company data, Credit Suisse estimates
Starbucks (SBUX)Outperform, $114 TPExecutive Summary Key Charts
• Credit Suisse View: SBUX is one of the highest quality growth companies in restaurants, with 8-10% revenue growth, margin expansion (operating margin guide 18-19%)
and benefit from repurchases supporting our ~16% EPS growth 3-yr CAGR. SBUX’s more focused growth strategy
(“growth at scale” agenda) and enhanced capital structure support a valuation premium to its history.
• US Business As Primary Focus: SBUX’s long-term
outlook for US SSS of 4-5% is supported by initiativesfocused on digital, beverage innovation (focus on cold) and operations, and enabled by SBUX’s industry-leading digital ecosystem. We believe SBUX has among the most frequent
customer bases in restaurants, supported by the habitual nature of coffee & strong brand affinity. ~25% of SBUX’s 75MM customers are 90-day active rewards members, underscoring the significant opportunity to grow the
membership base from ~19.5MM at the end of 2020.• EPS Growth Story Intact: Guidance for FY22 growth of
>20% and long-term growth of 10-12% (starting in FY23) appears achievable, and likely conservative, with SBUX well positioned to return to beat and raises. Greater sales leverage
in Americas (~65% operating profit) and strategic optionality (e.g., international licensing) represent the greatest sources of upside. SBUX is currently guiding to long-term US &
global SSS of 4-5%, unit growth of ~6%, an operating margin of 18-19% and EPS growth of 10-12%.
Revenue by Segment
Units by Segment
$0
$5,000
$10,000
$15,000
$20,000
$25,000
$30,000
$35,000
FY10 FY11 FY12 FY13 FY14 FY15 FY16 FY17 FY18 FY19 FY20
Reve
nue (
$M
M)
Americas International Channel Development Corporate & Other
0
5,000
10,000
15,000
20,000
25,000
30,000
35,000
FY10 FY11 FY12 FY13 FY14 FY15 FY16 FY17 FY18 FY19 FY20
Units
Americas International Corporate & Other
Current Price $102.33NTM EV/EBITDA 22.1xNTM P/E 34.1x52-wk Range $56.33-$106.98
1/15/2021
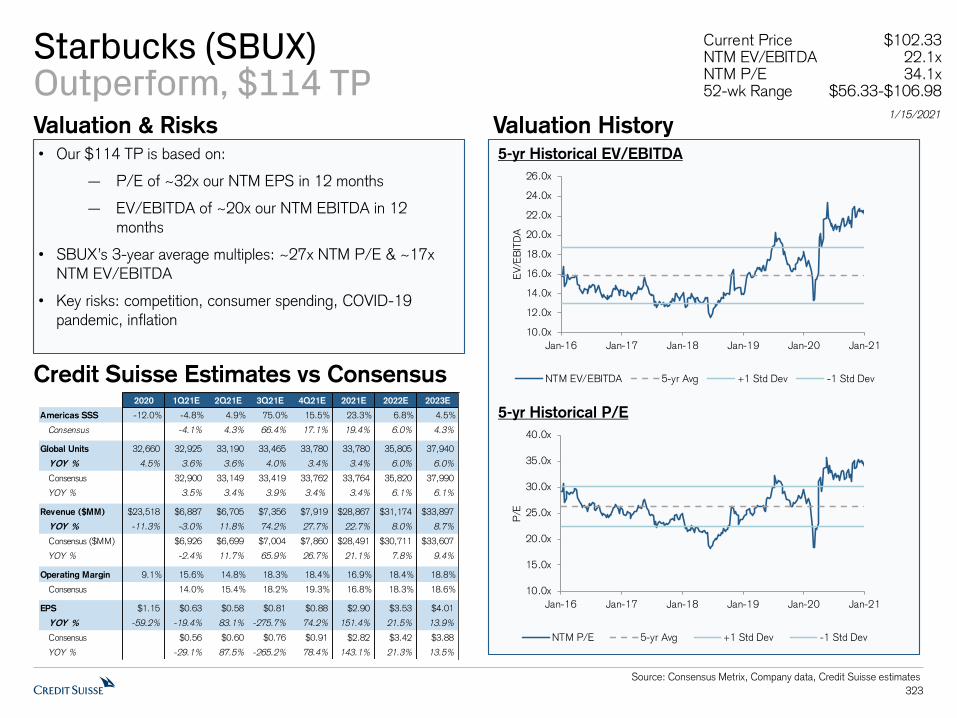
323
Source: Consensus Metrix, Company data, Credit Suisse estimates
Starbucks (SBUX)Outperform, $114 TPValuation & Risks Valuation History• Our $114 TP is based on:
— P/E of ~32x our NTM EPS in 12 months
— EV/EBITDA of ~20x our NTM EBITDA in 12 months
• SBUX’s 3-year average multiples: ~27x NTM P/E & ~17x NTM EV/EBITDA
• Key risks: competition, consumer spending, COVID-19 pandemic, inflation
5-yr Historical EV/EBITDA
5-yr Historical P/E
Credit Suisse Estimates vs Consensus
Current Price $102.33NTM EV/EBITDA 22.1xNTM P/E 34.1x52-wk Range $56.33-$106.98
1/15/2021
10.0x
12.0x
14.0x
16.0x
18.0x
20.0x
22.0x
24.0x
26.0x
Jan-16 Jan-17 Jan-18 Jan-19 Jan-20 Jan-21
EV/E
BIT
DA
NTM EV/EBITDA 5-yr Avg +1 Std Dev -1 Std Dev
10.0x
15.0x
20.0x
25.0x
30.0x
35.0x
40.0x
Jan-16 Jan-17 Jan-18 Jan-19 Jan-20 Jan-21
P/E
NTM P/E 5-yr Avg +1 Std Dev -1 Std Dev
2020 1Q21E 2Q21E 3Q21E 4Q21E 2021E 2022E 2023E
Americas SSS -12.0% -4.8% 4.9% 75.0% 15.5% 23.3% 6.8% 4.5%
Consensus -4.1% 4.3% 66.4% 17.1% 19.4% 6.0% 4.3%
Global Units 32,660 32,925 33,190 33,465 33,780 33,780 35,805 37,940
YOY % 4.5% 3.6% 3.6% 4.0% 3.4% 3.4% 6.0% 6.0%
Consensus 32,660 32,900 33,149 33,419 33,762 33,764 35,820 37,990
YOY % 3.5% 3.4% 3.9% 3.4% 3.4% 6.1% 6.1%
Revenue ($MM) $23,518 $6,887 $6,705 $7,356 $7,919 $28,867 $31,174 $33,897
YOY % -11.3% -3.0% 11.8% 74.2% 27.7% 22.7% 8.0% 8.7%
Consensus ($MM) $23,518 $6,926 $6,699 $7,004 $7,860 $28,491 $30,711 $33,607
YOY % -2.4% 11.7% 65.9% 26.7% 21.1% 7.8% 9.4%
Operating Margin 9.1% 15.6% 14.8% 18.3% 18.4% 16.9% 18.4% 18.8%
Consensus 14.0% 15.4% 18.2% 19.3% 16.8% 18.3% 18.6%
EPS $1.15 $0.63 $0.58 $0.81 $0.88 $2.90 $3.53 $4.01
YOY % -59.2% -19.4% 83.1% -275.7% 74.2% 151.4% 21.5% 13.9%
Consensus $1.16 $0.56 $0.60 $0.76 $0.91 $2.82 $3.42 $3.88
YOY % -29.1% 87.5% -265.2% 78.4% 143.1% 21.3% 13.5%

324
Source: Company data, Credit Suisse estimates
Texas Roadhouse (TXRH)Outperform, $90 TPExecutive Summary Key Charts
• Credit Suisse View: Strong operational execution, a compelling value proposition and contribution from off-premise gives us confidence in the sales recovery trajectory. Attractive steakhouse category dynamics, structural casual dining tailwinds & a strong balance sheet well position the company to invest for future market share gains. We expect TXRH to generate revenue & earnings in FY21 above FY19 levels, and a return to its double-digit earnings
algorithm starting in FY22.• Confidence in Sales Recovery: TXRH is one of the
few restaurant companies that has demonstrated consistently positive SSS and traffic over the last five years, outperforming the casual dining industry by an average of ~500bps. Underlying brand strength, and benefits from the company’s concentration in more resilient suburban markets, loyal customer base and booth seating to increase
yields amidst social distancing, gives us confidence in the recovery of on-premise sales. Increased customer awareness & enhanced execution support our expectation for sustainably higher off-premise sales volumes.
• Attractive Unit Growth Potential: Favorable steak category dynamics well position TXRH for continued growth, and supportive of the long-term unit growth target of at least 700-800 domestic Roadhouse restaurants, with recent entrance into smaller markets potentially supporting an even higher long-term unit growth opportunity.
Units & Unit Growth
Revenue
3.5%
4.0%
4.5%
5.0%
5.5%
6.0%
6.5%
7.0%
7.5%
300
350
400
450
500
550
600
650
2015 2016 2017 2018 2019
Uni
t G
row
th
Uni
ts
Units Unit Growth
$0
$500
$1,000
$1,500
$2,000
$2,500
$3,000
2015 2016 2017 2018 2019
Rev
enue
($
MM
)
Current Price $80.62NTM EV/EBITDA 15.4xNTM P/E 30.6x52-wk Range $30.41-$81.91
1/15/2021

325
Source: Consensus Metrix, Company data, Credit Suisse estimates
Texas Roadhouse (TXRH)Outperform, $90 TPValuation & Risks Valuation History• Our $90 TP is based on:
— P/E of ~25x our NTM EPS in 12 months
— EV/EBITDA of ~14x (~15x including operating leases)our NTM EBITDA in 12 months
• TXRH’s 5-year average multiples: ~26.5x NTM P/E & ~12.5x
NTM EV/EBITDA
• Key risks: consumer spending, COVID-19 pandemic, inflation, competition
5-yr Historical P/E
5-yr Historical EV/EBITDA
Credit Suisse Estimates vs Consensus2019 1Q20 2Q20 3Q20 4Q20E 2020E 2021E 2022E
Company SSS 4.7% -8.4% -32.8% -6.3% -3.1% -11.2% 22.0% 7.9%
Consensus -1.5% -12.1% 18.7% 5.9%
Company Units 514 519 521 526 534 534 564 594
YOY % 4.7% 4.8% 4.6% 4.8% 3.9% 3.9% 5.6% 5.3%
Consensus 514 533 533 561 593
YOY % 3.7% 3.7% 5.3% 5.7%
Revenue ($MM) $2,756 $653 $476 $631 $670 $2,430 $3,002 $3,378
YOY % 12.2% -5.5% -30.9% -3.0% -7.6% -11.8% 23.5% 12.5%
Consensus ($MM) $2,756 $686 $2,446 $2,973 $3,279
YOY % -5.4% -11.2% 21.5% 10.3%
Operating Margin 7.7% 2.4% -9.9% 5.5% 6.8% 2.0% 7.8% 8.8%
Consensus 6.5% 2.0% 7.5% 8.5%
EPS $2.46 $0.23 ($0.48) $0.42 $0.55 $0.72 $2.85 $3.60
YOY % 12.0% -67.1% -176.9% -19.9% -10.1% -70.9% 296.4% 26.7%
Consensus $2.46 $0.51 $0.68 $2.61 $3.32
YOY % -16.4% -72.4% 283.8% 27.2%
4.0x
6.0x
8.0x
10.0x
12.0x
14.0x
16.0x
18.0x
20.0x
22.0x
24.0x
Jan-16 Jan-17 Jan-18 Jan-19 Jan-20 Jan-21
EV/E
BIT
DA
NTM EV/EBITDA 5-yr Avg +1 Std Dev -1 Std Dev
0.0x
10.0x
20.0x
30.0x
40.0x
50.0x
60.0x
70.0x
80.0x
90.0x
Jan-16 Jan-17 Jan-18 Jan-19 Jan-20 Jan-21
P/E
NTM P/E 5-yr Avg +1 Std Dev -1 Std Dev
Current Price $80.62NTM EV/EBITDA 15.4xNTM P/E 30.6x52-wk Range $30.41-$81.91
1/15/2021

326
Source: Company data, Credit Suisse estimates
The Wendy’s Company (WEN)Neutral, $25 TPExecutive Summary Key Charts
• Credit Suisse View: Following WEN’s transformation over
the last several years, its business model reflects an improved and more consistent FCF profile. WEN noted opportunities to expand company margins post-COVID following productivity gains & efficiencies in 2020. While we like the WEN story
and have been impressed with performance, we are cautious
on incremental investments required for breakfast, digital and international expansion, as well as the impact of heightened competition in 2021. We believe we could be underappreciating the contribution from digital initiatives as WEN recently strengthened its digital bench with the hiring of
former Domino’s Chief Information Officer, Kevin Vasconi.
• Solid Outlook, but Heavy Competition: WEN’s historical
focus on traffic-driving initiatives and prudent approach to pricing has supported positive and consistent SSS growth
averaging ~2% over the last five years. Digital mix increased to 6%+ exiting 3Q and into 4Q, with the recent launch of its loyalty program representing an additional lever to drive digital
growth, though such is still in early innings. WEN rolled out its new Classic Chicken Sandwich in late October, noting the new product could be meaningful for the brand that was part of the trio that started the Chicken Wars last year. WEN is also planning to increase its contribution to breakfast marketing in 2021.
Revenue Composition
Unit Composition
$0
$200
$400
$600
$800
$1,000
$1,200
$1,400
$1,600
2017 2018 2019
Rev
enue
($
MM
)
Wendy's US Wendy's International Global Real Estate & Development
-
1,000
2,000
3,000
4,000
5,000
6,000
7,000
8,000
2011 2012 2013 2014 2015 2016 2017 2018 2019
Uni
ts
US Franchise US Company International
Current Price $21.65NTM EV/EBITDA 19.3xNTM P/E 30.0x52-wk Range $7.47-$24.71
1/15/2021

327
Source: Consensus Metrix, Company data, Credit Suisse estimates
The Wendy’s Company (WEN)Neutral, $25 TPValuation & Risks Valuation History• Our $25 TP is based on:
— EV/EBITDA of ~16x (~18.5x including operating leases) our NTM EBITDA in 12 months
— P/E of ~29.5x our NTM EPS in 12 months
• WEN’s 3-year average multiples: ~17x NTM EV/EBITDA & ~29.5x NTM P/E
• Key risks: competition, consumer spending, COVID-19 pandemic, breakfast execution
3-yr Historical EV/EBITDA
3-yr Historical P/E
Credit Suisse Estimates vs Consensus
10.0x
12.0x
14.0x
16.0x
18.0x
20.0x
22.0x
24.0x
Jan-
18
Mar-
18
May-
18
Jul-1
8
Sep-
18
Nov-
18
Jan-
19
Mar-
19
May-
19
Jul-1
9
Sep-
19
Nov-
19
Jan-
20
Mar-
20
May-
20
Jul-2
0
Sep-
20
Nov-
20
Jan-
21
EV/E
BIT
DA
NTM EV/EBITDA 3-yr Avg +1 Std Dev -1 Std Dev
Current Price $21.65NTM EV/EBITDA 19.3xNTM P/E 30.0x52-wk Range $7.47-$24.71
1/15/2021
2019 1Q20 2Q20 3Q20 4Q20E 2020E 2021E 2022E
US SSS 2.9% 0.0% -4.4% 7.0% 6.6% 2.6% 6.6% 1.8%
Consensus 6.3% 2.3% 5.8% 2.4%
Global Units 6,788 6,805 6,806 6,814 6,825 6,825 6,926 7,080
YOY % 1.1% 1.4% 1.3% 1.1% 0.5% 0.5% 1.5% 2.2%
Consensus 6,788 6,830 6,830 6,958 7,122
YOY % 0.6% 0.6% 1.9% 2.4%
Revenue ($MM) $1,709 $405 $402 $452 $477 $1,737 $1,784 $1,831
YOY % 7.5% -0.9% -7.6% 3.3% 11.7% 1.6% 2.7% 2.6%
Consensus ($MM) $1,709 $476 $1,735 $1,792 $1,857
YOY % 11.4% 1.5% 3.3% 3.6%
Operating Margin 16.4% 14.4% 15.6% 19.0% 17.4% 16.7% 17.9% 19.2%
Consensus 17.1% 16.6% 17.8% 18.9%
EPS $0.59 $0.09 $0.12 $0.19 $0.18 $0.58 $0.74 $0.88
YOY % 0.8% -36.1% -34.7% 0.8% 127.5% -2.3% 28.3% 18.3%
Consensus $0.59 $0.18 $0.57 $0.71 $0.84
YOY % 125.0% -3.4% 24.6% 18.3%
10.0x
15.0x
20.0x
25.0x
30.0x
35.0x
40.0x
45.0x
Jan-
18
Mar-
18
May-
18
Jul-1
8
Sep-
18
Nov-
18
Jan-
19
Mar-
19
May-
19
Jul-1
9
Sep-
19
Nov-
19
Jan-
20
Mar-
20
May-
20
Jul-2
0
Sep-
20
Nov-
20
Jan-
21
P/E
NTM P/E 3-yr Avg +1 Std Dev -1 Std Dev

328
Source: Company data, Credit Suisse estimates
Yum! Brands (YUM)Neutral, $103 TPExecutive Summary Key Charts
• Credit Suisse View: YUM’s ~98% franchise business model, diversified global portfolio and low operating leverage
support high visibility into ongoing low-teens earnings growth in a normalized environment. Greater visibility into the timing of a return to the unit growth algorithm is likely necessary to
improve sentiment on the diversified global growth story and further expand its valuation premium to peers.
• Unit growth to represent majority of top line: We expect YUM to return to a normalized growth algorithm in 2022, and model ~6% system sales growth, with ~4% contribution from unit growth and 2-2.5% from SSS. Development agreements tied to refranchising deals, accelerating growth in China, Taco Bell US franchisee appetite for growth and management
development expertise support our expectations for a return to the company’s ~4% long-term unit growth target.
• Shifting from defensive to offensive: As sales start to recover, markets stabilize and uncertainty declines, the
strategy is shifting from defensive to offensive as YUM assesses opportunities to capitalize on attractive real estate amidst what is expected to be heightened consolidation over
the next 6-12 months. YUM’s franchisee base is more consolidated than peers, and larger franchisees tend to have greater access to capital and more growth-focused strategies
(though they often carry greater leverage as a result). YUM has also made investments in its data analytics capabilities to better identify opportunities for new unit growth.
Unit Growth
System Sales Growth
2.7%
3.9%
5.4%
6.8%
0.0%
1.0%
2.0%
3.0%
4.0%
5.0%
6.0%
7.0%
2016 2017 2018 2019
Sys
tem
Sal
es G
row
th
KFC Pizza Hut Taco Bell
Current Price $106.62NTM EV/EBITDA 19.5xNTM P/E 26.5x52-wk Range $56.52-$109.78
1/15/2021
3.6%
3.1%2.9%
3.3%
3.9%4.3%
0.0%
1.0%
2.0%
3.0%
4.0%
5.0%
2014 2015 2016 2017 2018 2019
Glo
bal N
et
Unit
Gro
wth
KFC Pizza Hut Taco Bell Habit

329
Source: Consensus Metrix, Company data, Credit Suisse estimates
Yum! Brands (YUM)Neutral, $103 TPValuation & Risks Valuation History• Our $103 TP is based on:
— EV/EBITDA of ~18x our NTM EBITDA in 12 months
— P/E of ~23.5x our NTM EPS in 12 months
• YUM’s 3-year average multiples: ~18.5x NTM EV/EBITDA & ~25x NTM P/E
• Key risks: COVID-19 pandemic, competition, consumer spending, FX
3-yr Historical EV/EBITDA
3-yr Historical P/E
Credit Suisse Estimates vs Consensus
Current Price $106.62NTM EV/EBITDA 19.5xNTM P/E 26.5x52-wk Range $56.52-$109.78
1/15/2021
2019 1Q20 2Q20 3Q20 4Q20E 2020E 2021E 2022E
KFC SSS 4.2% -8.0% -21.0% -4.0% 0.0% -7.2% 11.8% 2.5%
Consensus -1.5% -8.4% 11.9% 2.9%
Pizza Hut SSS -0.1% -11.0% -9.0% -3.0% 0.0% -5.4% 5.6% 1.0%
Consensus 0.3% -5.5% 6.5% 1.7%
Taco Bell SSS 4.7% 1.0% -8.0% 3.0% 4.0% 0.5% 6.5% 3.0%
Consensus 3.2% -0.2% 5.9% 2.9%
Global Units 50,170 50,511 50,393 50,126 50,129 50,129 51,041 52,978
YOY % 4.3% 4.2% 3.3% 2.0% -0.1% -0.1% 1.8% 3.8%
Consensus 50,170 50,148 50,148 51,612 53,571
YOY % 0.0% 0.0% 2.9% 3.8%
Revenue ($MM) $5,597 $1,263 $1,198 $1,448 $1,780 $5,689 $6,310 $6,636
YOY % -1.6% 0.7% -8.5% 8.1% 5.1% 1.6% 10.9% 5.2%
Consensus ($MM) $5,597 $1,716 $5,625 $6,261 $6,688
YOY % 1.3% 0.5% 11.3% 6.8%
Operating Margin 34.7% 31.3% 29.5% 34.9% 30.0% 31.4% 32.3% 32.8%
Consensus 30.1% 31.5% 32.4% 32.8%
EPS $3.56 $0.64 $0.82 $1.01 $1.07 $3.54 $4.11 $4.54
YOY % 12.3% -22.8% -11.7% 25.9% 7.5% -0.4% 15.9% 10.6%
Consensus $315.00 $1.01 $3.48 $4.00 $4.51
YOY % -99.7% -98.9% 14.9% 12.8%
10.0x
12.0x
14.0x
16.0x
18.0x
20.0x
22.0x
Jan-
18
Mar-
18
May-
18
Jul-1
8
Sep-
18
Nov-
18
Jan-
19
Mar-
19
May-
19
Jul-1
9
Sep-
19
Nov-
19
Jan-
20
Mar-
20
May-
20
Jul-2
0
Sep-
20
Nov-
20
Jan-
21
EV/E
BIT
DA
NTM EV/EBITDA 3-yr Avg +1 Std Dev -1 Std Dev
10.0x
15.0x
20.0x
25.0x
30.0x
35.0x
Jan-
18
Mar-
18
May-
18
Jul-1
8
Sep-
18
Nov-
18
Jan-
19
Mar-
19
May-
19
Jul-1
9
Sep-
19
Nov-
19
Jan-
20
Mar-
20
May-
20
Jul-2
0
Sep-
20
Nov-
20
Jan-
21
P/E
NTM P/E 3-yr Avg +1 Std Dev -1 Std Dev

330
Source: Company data, Credit Suisse estimates
Performance Food Group (PFGC)Outperform, $56 TPExecutive Summary Key Charts
• Credit Suisse View: We view PFGC as a compelling growth story well positioned to capture market share in a fragmented
industry. We believe recent challenges offer larger distributors the opportunities to capture new business as restaurants seek suppliers they can trust will have the appropriate scale,
capital and agility to meet needs, as well as accelerate growth of private label offerings. We expect PFGC to deliver
outsized growth in FY22 as it laps ongoing recovery in FY21, and return to its double-digit earnings algorithm in FY22.
• Vistar to recover long-term: While the legacy Vistar segment will likely experience a prolonged period of depressed sales, it is a differentiated asset for PFGC, and PFGC has proven its ability to diversify into new customer
channels, giving us confidence in its ongoing recovery. • Independent restaurants as a key unlock: Independents
represent ~24% of PFGC’s business, with PFGC’s low independent sales and regional presence supporting our
confidence in the significant runway for growth. We believe acquisition of new independent restaurant customers is the most meaningful opportunity for growth, and we estimate it
has relationships with ~25-30% of independents, supporting an ample addressable market even with heightened industry closures. Outsized growth among the most profitable
customer segment should also contribute to margin expansion, driven by dynamic pricing to optimize profitability and increased penetration of private brand offerings.
Total Case Growth
Operating Margin
0.0%
0.2%
0.4%
0.6%
0.8%
1.0%
1.2%
1.4%
1.6%
1.8%
2.0%
FY16 FY17 FY18 FY19 FY20
Opera
ting M
arg
in
0%
1%
2%
3%
4%
5%
6%
7%
8%
FY16 FY17 FY18 FY19 FY20
Tota
l C
ase
Gro
wth
Current Price $51.18NTM EV/EBITDA 15.8xNTM P/E 35.7x52-wk Range $11.42-$53.99
1/15/2021

331
Source: Consensus Metrix, Company data, Credit Suisse estimates
Performance Food Group (PFGC)Outperform, $56 TPValuation & Risks Valuation History• Our $56 TP is based on:
— EV/EBITDA of ~11.5x our NTM EBITDA in 12 months
— P/E of ~22x our NTM EPS in 12 months
• PFGC’s 3-year average multiples: ~11.5x NTM EV/EBITDA & ~21x NTM P/E
• Key risks: COVID-19 pandemic, competition, consumer spending, cost inflation
Credit Suisse Estimates vs Consensus
3-yr Historical EV/EBITDA
3-yr Historical P/E
2.0x
7.0x
12.0x
17.0x
22.0x
27.0x
32.0x
37.0x
42.0x
47.0x
Jan-
18
Mar-
18
May-
18
Jul-1
8
Sep-
18
Nov-
18
Jan-
19
Mar-
19
May-
19
Jul-1
9
Sep-
19
Nov-
19
Jan-
20
Mar-
20
May-
20
Jul-2
0
Sep-
20
Nov-
20
Jan-
21
P/E
NTM P/E 3-yr Avg +1 Std Dev -1 Std Dev
2.0x
4.0x
6.0x
8.0x
10.0x
12.0x
14.0x
16.0x
18.0x
20.0x
22.0x
Jan-
18
Mar-
18
May-
18
Jul-1
8
Sep-
18
Nov-
18
Jan-
19
Mar-
19
May-
19
Jul-1
9
Sep-
19
Nov-
19
Jan-
20
Mar-
20
May-
20
Jul-2
0
Sep-
20
Nov-
20
Jan-
21
EV/E
BIT
DA
NTM EV/EBITDA 3-yr Avg +1 Std Dev -1 Std Dev
Current Price $51.18NTM EV/EBITDA 15.8xNTM P/E 35.7x52-wk Range $11.42-$53.99
1/15/2021
2020 1Q21 2Q21E 3Q21E 4Q21E 2021E 2022E 2023E
Total Case Growth 7.6% 8.9% 17.1% 0.1% 22.6% 12.4% 11.5% 5.1%
Consensus 7.0% 7.0% 7.0% 7.0% 7.0% 7.0%
Organic Case Growth -10.0% -17.5% -7.9% -0.6% 21.9% -0.6% 10.7% 4.4%
Consensus -12.3% -3.9% 31.2% -1.0% 9.2% 4.3%
Revenue ($MM) $25,086 $7,047 $6,980 $7,082 $7,566 $28,674 $31,780 $33,738
YOY % 27.1% 12.9% 15.0% 1.2% 31.0% 14.3% 10.8% 6.2%
Consensus $25,086 $6,907 $7,022 $7,570 $28,546 $31,095 $32,750
YOY % 13.8% 0.3% 31.1% 13.8% 8.9% 5.3%
Gross Margin 11.5% 11.7% 11.7% 11.5% 12.0% 11.7% 12.0% 12.0%
Consensus ($MM) 11.8% 11.7% 11.8% 11.7% 11.9% 12.0%
Operating Margin 0.9% 1.2% 1.0% 0.9% 1.2% 1.1% 1.8% 2.0%
Consensus 1.3% 1.2% 1.4% 1.3% 1.7% 1.9%
EBITDA $406 $135 $126 $120 $153 $534 $791 $896
YOY % -14.7% 5.9% -12.0% -8.6% 3922.9% 31.6% 48.2% 13.4%
Consensus $406 $142 $140 $166 $583 $759 $838
YOY % -0.4% 6.4% 4268.2% 43.8% 30.2% 10.3%
EPS $0.70 $0.25 $0.18 $0.14 $0.28 $0.85 $2.28 $2.77
YOY % -67.1% -56.1% -69.0% -75.9% -132.6% 21.4% 168.2% 21.5%
Consensus $0.70 $0.29 $0.26 $0.40 $1.20 $2.16 $2.57
YOY % -50.0% -55.2% -146.5% 71.4% 80.0% 19.0%
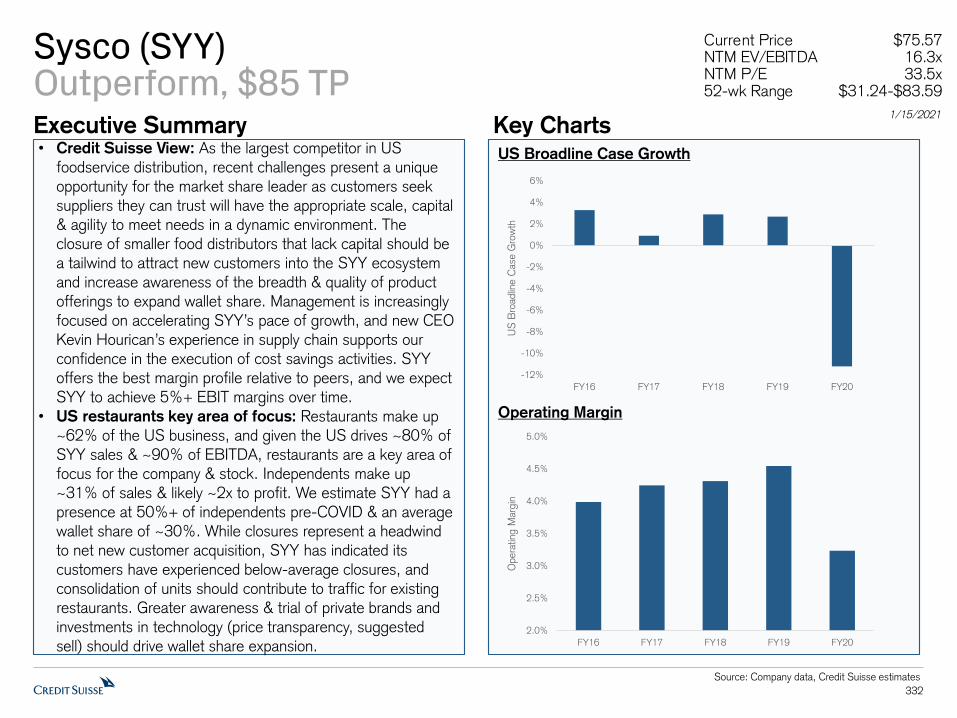
332
Source: Company data, Credit Suisse estimates
Sysco (SYY)Outperform, $85 TPExecutive Summary Key Charts• Credit Suisse View: As the largest competitor in US
foodservice distribution, recent challenges present a unique opportunity for the market share leader as customers seek suppliers they can trust will have the appropriate scale, capital & agility to meet needs in a dynamic environment. The
closure of smaller food distributors that lack capital should be
a tailwind to attract new customers into the SYY ecosystem and increase awareness of the breadth & quality of product offerings to expand wallet share. Management is increasingly focused on accelerating SYY’s pace of growth, and new CEO
Kevin Hourican’s experience in supply chain supports our confidence in the execution of cost savings activities. SYY offers the best margin profile relative to peers, and we expect SYY to achieve 5%+ EBIT margins over time.
• US restaurants key area of focus: Restaurants make up
~62% of the US business, and given the US drives ~80% of SYY sales & ~90% of EBITDA, restaurants are a key area of focus for the company & stock. Independents make up
~31% of sales & likely ~2x to profit. We estimate SYY had a presence at 50%+ of independents pre-COVID & an average
wallet share of ~30%. While closures represent a headwind to net new customer acquisition, SYY has indicated its customers have experienced below-average closures, and
consolidation of units should contribute to traffic for existing restaurants. Greater awareness & trial of private brands and investments in technology (price transparency, suggested
sell) should drive wallet share expansion.
US Broadline Case Growth
Operating Margin
-12%
-10%
-8%
-6%
-4%
-2%
0%
2%
4%
6%
FY16 FY17 FY18 FY19 FY20
US
Bro
adlin
e C
ase
Gro
wth
2.0%
2.5%
3.0%
3.5%
4.0%
4.5%
5.0%
FY16 FY17 FY18 FY19 FY20
Opera
ting M
arg
in
Current Price $75.57NTM EV/EBITDA 16.3xNTM P/E 33.5x52-wk Range $31.24-$83.59
1/15/2021
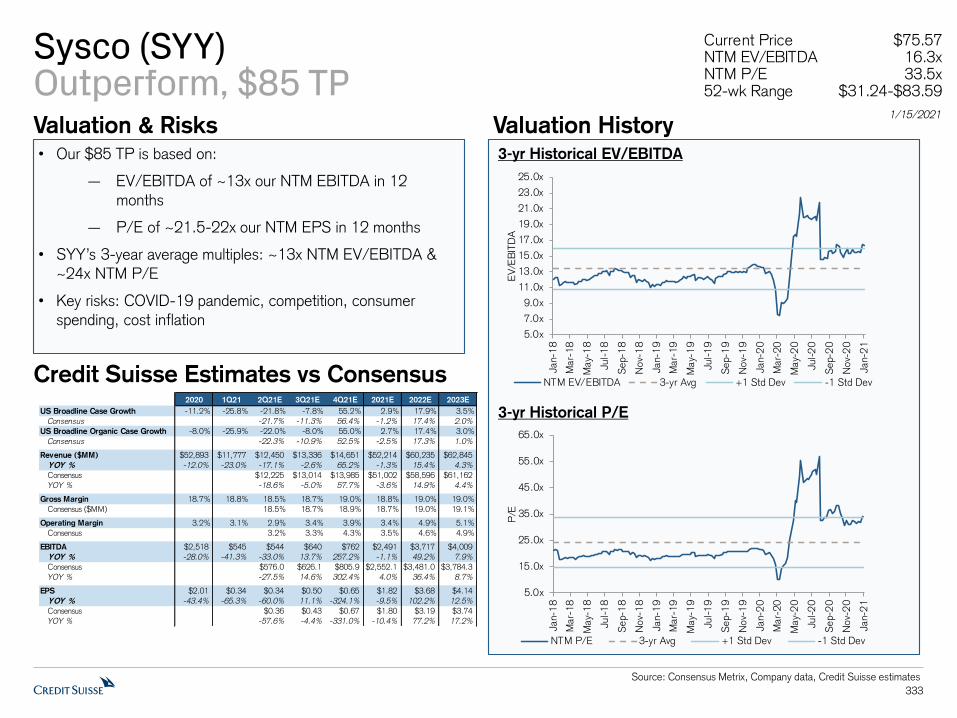
333
Source: Consensus Metrix, Company data, Credit Suisse estimates
Sysco (SYY)Outperform, $85 TPValuation & Risks Valuation History• Our $85 TP is based on:
— EV/EBITDA of ~13x our NTM EBITDA in 12 months
— P/E of ~21.5-22x our NTM EPS in 12 months
• SYY’s 3-year average multiples: ~13x NTM EV/EBITDA & ~24x NTM P/E
• Key risks: COVID-19 pandemic, competition, consumer spending, cost inflation
Credit Suisse Estimates vs Consensus
3-yr Historical EV/EBITDA
3-yr Historical P/E
5.0x
7.0x
9.0x
11.0x
13.0x
15.0x
17.0x
19.0x
21.0x
23.0x
25.0x
Jan-
18
Mar-
18
May-
18
Jul-1
8
Sep-
18
Nov-
18
Jan-
19
Mar-
19
May-
19
Jul-1
9
Sep-
19
Nov-
19
Jan-
20
Mar-
20
May-
20
Jul-2
0
Sep-
20
Nov-
20
Jan-
21
EV/E
BIT
DA
NTM EV/EBITDA 3-yr Avg +1 Std Dev -1 Std Dev
5.0x
15.0x
25.0x
35.0x
45.0x
55.0x
65.0x
Jan-
18
Mar-
18
May-
18
Jul-1
8
Sep-
18
Nov-
18
Jan-
19
Mar-
19
May-
19
Jul-1
9
Sep-
19
Nov-
19
Jan-
20
Mar-
20
May-
20
Jul-2
0
Sep-
20
Nov-
20
Jan-
21
P/E
NTM P/E 3-yr Avg +1 Std Dev -1 Std Dev
Current Price $75.57NTM EV/EBITDA 16.3xNTM P/E 33.5x52-wk Range $31.24-$83.59
1/15/2021
2020 1Q21 2Q21E 3Q21E 4Q21E 2021E 2022E 2023E
US Broadline Case Growth -11.2% -25.8% -21.8% -7.8% 55.2% 2.9% 17.9% 3.5%
Consensus -21.7% -11.3% 56.4% -1.2% 17.4% 2.0%
US Broadline Organic Case Growth -8.0% -25.9% -22.0% -8.0% 55.0% 2.7% 17.4% 3.0%
Consensus -22.3% -10.9% 52.5% -2.5% 17.3% 1.0%
Revenue ($MM) $52,893 $11,777 $12,450 $13,336 $14,651 $52,214 $60,235 $62,845
YOY % -12.0% -23.0% -17.1% -2.6% 65.2% -1.3% 15.4% 4.3%
Consensus $52,893 $12,225 $13,014 $13,985 $51,002 $58,596 $61,162
YOY % -18.6% -5.0% 57.7% -3.6% 14.9% 4.4%
Gross Margin 18.7% 18.8% 18.5% 18.7% 19.0% 18.8% 19.0% 19.0%
Consensus ($MM) 18.5% 18.7% 18.9% 18.7% 19.0% 19.1%
Operating Margin 3.2% 3.1% 2.9% 3.4% 3.9% 3.4% 4.9% 5.1%
Consensus 3.2% 3.3% 4.3% 3.5% 4.6% 4.9%
EBITDA $2,518 $545 $544 $640 $762 $2,491 $3,717 $4,009
YOY % -28.0% -41.3% -33.0% 13.7% 257.2% -1.1% 49.2% 7.9%
Consensus $2,453.8 $576.0 $626.1 $805.9 $2,552.1 $3,481.0 $3,784.3
YOY % -27.5% 14.6% 302.4% 4.0% 36.4% 8.7%
EPS $2.01 $0.34 $0.34 $0.50 $0.65 $1.82 $3.68 $4.14
YOY % -43.4% -65.3% -60.0% 11.1% -324.1% -9.5% 102.2% 12.5%
Consensus $2.01 $0.36 $0.43 $0.67 $1.80 $3.19 $3.74
YOY % -57.6% -4.4% -331.0% -10.4% 77.2% 17.2%

334
Source: Company data, Credit Suisse estimates
US Foods (USFD)Outperform, $40 TPExecutive Summary Key Charts• Credit Suisse View: While USFD’s recovery will likely lag its
closest peers given its higher concentration of independent restaurants & hospitality, we see ample opportunity for USFD to capture new customers in a fragmented industry & benefit from the recovery of its existing customers, noting the
restaurant industry has historically been very resilient. We
expect sales improvements among existing customers and the acquisition of new customers to support a full sales recapture over time, while an ongoing focus to effectively manage costs suggest margin recovery will likely come ahead
of a full sales recovery.
• Independent restaurant growth to drive top & bottom
lines: Independent restaurants represent ~33% of USFD’s sales mix and an estimated ~60% of its EBITDA, with outsized profitability driven by higher sales of private label
offerings (~2x profit relative to manufacturer products) and the nature of non-contract accounts allowing for dynamic pricing to maximize profitability. USFD has leveraged
technology more than others, which is increasingly important as digital adoption accelerates. Over the last three years,
independent case growth averaged 5.5%, outpacing total case growth of 2.1%, & the largest spread relative to peers, supporting our confidence in USFD’s ability to grow market
share with independents as the environment normalizes. Growth among independents and private brand cases will be the primary contributors to narrow the margin gap (and
valuation gap) to SYY.
Case Growth
Operating Margin
0.0%
0.5%
1.0%
1.5%
2.0%
2.5%
3.0%
3.5%
4.0%
2015 2016 2017 2018 2019
Opera
ting M
arg
in
-2.0%
-1.0%
0.0%
1.0%
2.0%
3.0%
4.0%
5.0%
FY15 FY16 FY17 FY18 FY19
Tota
l Case
Gro
wth
Current Price $35.66NTM EV/EBITDA 13.4xNTM P/E 29.6x52-wk Range $9.72-$41.79
1/15/2021

335
Source: Consensus Metrix, Company data, Credit Suisse estimates
US Foods (USFD)Outperform, $40 TPValuation & Risks Valuation History• Our $40 TP is based on:
— EV/EBITDA of ~10x our NTM EBITDA in 12 months
— P/E of ~15.5x our NTM EPS in 12 months
• USFD’s 3-year average multiples: ~10x NTM EV/EBITDA & ~16.5x NTM P/E
• Key risks: COVID-19 pandemic, competition, consumer spending, cost inflation
Credit Suisse Estimates vs Consensus
3-yr Historical EV/EBITDA
3-yr Historical P/E
2.0x
4.0x
6.0x
8.0x
10.0x
12.0x
14.0x
16.0x
18.0x
Jan-
18
Mar-
18
May-
18
Jul-1
8
Sep-
18
Nov-
18
Jan-
19
Mar-
19
May-
19
Jul-1
9
Sep-
19
Nov-
19
Jan-
20
Mar-
20
May-
20
Jul-2
0
Sep-
20
Nov-
20
Jan-
21
EV/E
BIT
DA
NTM EV/EBITDA 3-yr Avg +1 Std Dev -1 Std Dev
Current Price $35.66NTM EV/EBITDA 13.4xNTM P/E 29.6x52-wk Range $9.72-$41.79
1/15/2021
2.0x
7.0x
12.0x
17.0x
22.0x
27.0x
32.0x
Jan-
18
Mar-
18
May-
18
Jul-1
8
Sep-
18
Nov-
18
Jan-
19
Mar-
19
May-
19
Jul-1
9
Sep-
19
Nov-
19
Jan-
20
Mar-
20
May-
20
Jul-2
0
Sep-
20
Nov-
20
Jan-
21
P/E
NTM P/E 3-yr Avg +1 Std Dev -1 Std Dev
2019 1Q20 2Q20 3Q20 4Q20E 2020E 2021E 2022E
Total Case Growth 4.6% 3.4% -28.0% -8.9% -14.5% -12.0% 16.4% 8.1%
Consensus -13.1% -11.5% 15.5% 7.0%
Organic Case Growth 1.1% -7.3% -40.2% -22.2% -19.0% -22.2% 15.0% 7.6%
Consensus -16.8% -21.6% 14.4% 7.2%
Revenue ($MM) $25,939 $6,339 $4,560 $5,848 $6,345 $23,092 $26,274 $28,846
YOY % 7.3% 5.1% -29.2% -10.5% -8.5% -11.0% 13.8% 9.8%
Consensus $25,939 $6,215 $22,962 $26,459 $28,655
YOY % -10.4% -11.5% 15.2% 8.3%
Gross Margin 17.8% 16.6% 16.0% 16.7% 17.0% 16.6% 17.3% 17.5%
Consensus ($MM) 17.8% 16.8% 16.6% 17.1% 17.2%
Operating Margin 3.4% 1.4% -0.1% 2.0% 1.8% 1.4% 2.8% 3.8%
Consensus 3.4% 2.1% 1.5% 2.9% 3.3%
EBITDA $1,194 $177 $88 $209 $203 $677 $1,106 $1,449
YOY % 8.2% -23.7% -72.5% -31.9% -39.3% -43.3% 63.3% 31.0%
Consensus ####### $225 $699 $1,118 $1,308
YOY % -33.0% -41.5% 60.1% 17.0%
EPS $2.39 $0.15 ($0.25) $0.15 $0.15 $0.20 $1.55 $2.59
YOY % 13.8% -64.1% -77.7% -77.7% -91.5% 663.1% 67.6%
Consensus $2.38 $0.21 $0.26 $1.57 $2.23
YOY % -68.2% -89.1% 503.8% 42.0%

Valuation, Methodology and Risks
Target Price and Rating Valuation Methodology and Risks: (12 months) for Bloomin' Brands (BLMN.OQ)
Method: Our $21 target price and Neutral rating is based on ~11x our NTM EPS in 12 months, implying ~6x our NTM EBITDA in 12 months, a discount to its 5-year averages given uncertainty in the outlook, high Brazil exposure and high leverage.
Risk: Key risks to our $21 target price and Neutral rating include: consumer spending, health epidemic, food & labor cost inflation and competition. Restaurant occasions are consumer discretionary purchases, and a challenging economic environment, as well as the potential for prolonged changes in consumer behavior could weigh on sales recovery efforts. The impact of a health epidemic could result in reduced consumer mobility, government mandates that limit dining room capacity or prohibit on-premise dining. Heightened food & labor cost inflation would weigh on margins. BLMN operates in a highly competitive restaurant environment.
Target Price and Rating Valuation Methodology and Risks: (12 months) for Chipotle Mexican Grill, Inc. (CMG.N)
Method: Our $1,700 target price and Outperform rating is based on ~32x our NTM EBITDA in 12 months & ~54x our NTM EPS in 12 months.
Risk: Key risks to our Outperform rating $1,700 price target include: food safety headlines, competition and food safety. Chipotle's headline risk is still elevated as multiple food safety incidents have emerged over the last few years, with brand perceptions which are likely still sensitive. In recent years, there has been an emergence of smaller competitors delivering on attributes that have differentiated Chipotle for many years, offering high quality food at reasonable prices, many of which are similarly mission-driven and locally sourced.
Target Price and Rating Valuation Methodology and Risks: (12 months) for Darden Restaurants (DRI.N)
Method: Our $141 target price and Outperform rating is based on ~19x our NTM EPS in 12 months, implying ~12x our NTM EBITDA in 12 months.
Risk: Key risks to our $141 target price and Outperform rating include: consumer spending, health epidemic, food and labor cost inflation and competition. Restaurant occasions are consumer discretionary purchases, and a challenging economic environment, as well as the potential for prolonged changes in consumer behavior could weigh on sales recovery efforts. The impact of a health epidemic could result in reduced consumer mobility, government mandates that limit dining room capacity or prohibit on-premise dining. Heightened food and labor cost inflation would weigh on margins. DRI operates in a highly competitive restaurant environment
Target Price and Rating Valuation Methodology and Risks: (12 months) for Domino’s Pizza Inc. (DPZ.N)
Method: Our $445 target price and Outperform rating is based on ~31x our NTM EPS in 12 months, implying an EV/EBITDA of ~23x our NTM EBITDA in 12 months.
Risk: Key risks to our $445 target price and Outperform rating include: competition and economic factors. Increasing competitive pressure could weigh on market gains globally. DPZ could experience reduced product demand, longer payment cycles, slow adoption of new technologies and increased price competition if there is an economic downturn or deterioration in economic conditions.
Target Price and Rating Valuation Methodology and Risks: (12 months) for Jack in the Box Inc. (JACK.OQ)
Method: Our $74 target price and Underperform rating for JACK are based on ~9.5x our next 12 months EBITDA in 12 months. JACK's shares trade at a discount to heavily franchised peers given higher operating leverage, lower growth prospects and geographic concentration. Despite the transition to a more heavily franchised business model and divesture of Qdoba, there has been limited multiple expansion. We believe risk to long-term targets could weigh on the multiple. We rate JACK Underperform as we expect it to appreciate less than its peers.
Risk: Risks to our $74 target price and Underperform rating for JACK are M&A, accelerating SSS, competition, changing customer preferences, economic exposure, commodity exposure, labor market, cybersecurity and activist stockholders.
Target Price and Rating Valuation Methodology and Risks: (12 months) for Just Eat Takeaway (JETJ.L)
Method: We value Just Eat Takeaway using a DCF in line with the majority of our European Media coverage. Our methodology uses explicit forecasts out to 2029, beyond which we assume growth in perpetuity of +3%, in line with what we use for other leading internet players under our coverage. We use a WACC of 9.55% derived from a cost of equity of 10.4% (ERP of 8.4%, RFR of 0.35%, beta of 1.2) and a cost of debt of 2%. We assume a capital structure of 90% equity and 10% debt. This yields a target price of 12,100p. Our SOTP valuation framework also supports our TP. Owing to the significant upside potential implied by our target price we rate the shares Outperform.
Risk: Risks to our Outperform rating and 12,100p target price include: Competition, whether from direct competitors or delivery-only providers as well as also uncertainty around the level and duration of investment in Delivery Logistics. We would also flag cyclicality, brand risk, cyber security, restaurant pushback to price rises, technological change (e.g. drones/robots) and shifting consumer preferences. The potential acuqisition of Grubhub brings about operational and execution risk.
Target Price and Rating Valuation Methodology and Risks: (12 months) for McDonald’s Corporation (MCD.N)
Method: Our $230 target price and Outperform rating is based on ~17x our NTM EBITDA in 12 months, implying a P/E of ~25.5x our NTM EPS in 12 months.
Risk: Key risks to our $230 price target price and Outperform rating for MCD include: competition, US macro environment and FX volatility. MCD operates in a highly competitive restaurant environment. Increased product and price competition could adversely affect revenue and profits
Decreases in consumer discretionary spending or decline in consumer food-away-from-home spending could negatively impact financial results. MCD is exposed to foreign currency volatility in all of its international markets, which could adversely affect MCD’s business, results of operations, financial conditions and cash flow.
Target Price and Rating Valuation Methodology and Risks: (12 months) for Papa John’s International, Inc. (PZZA.OQ)
Method: Our $110 target price and Outperform rating is based on ~19.5x our NTM EBITDA in 12 months.
Risk: Key risks to our $110 target price and Outperform rating include: competition; consumer sentiment; selloff from block sale. Competition and company-specific challenges could continue to weigh on sales and profitability.
Target Price and Rating Valuation Methodology and Risks: (12 months) for Performance Food Group Company (PFGC.N)
Method: Our $56 target price and Outperform rating is based on ~11.5x our NTM EBITDA in 12 months, in-line with its three-year average.
Risk: Risks to our $56 target price and Outperform rating for Performance Food Group include an extended period of the COVID-19 pandemic in the US that prolongs closures of food-away-from-home channels, notably restaurants, offices, and theaters, greater-than-anticipated pressures on supply chain, intensified competition, and deterioration in the macro environment and consumer spending.
Target Price and Rating Valuation Methodology and Risks: (12 months) for Restaurant Brands International Inc (QSR.N)
Method: Our $69 target price and Outperform rating are based on ~16.5x our NTM EBITDA in 12 months, implying a P/E multiple of ~21x our NTM EPS in 12 months.
Risk: Key risks to our $69 target price and Outperform rating include: competition and economic conditions. QSR operates in a highly competitive industry. If QSR is unable to maintain its competitive position, it could experience lower product demand, downward pricing pressure, lower margins, decreased market share, reduced franchisee profitability and difficulty attracting qualified franchisees. Unfavorable economic pressures could reduce sales, profitability and operating results for QSR and its franchisees.
Target Price and Rating Valuation Methodology and Risks: (12 months) for Shake Shack (SHAK.N)
Method: Our $102 target price and Neutral rating is based on ~34x our NTM EBITDA in 12 months given near-term uncertainty and limited visibility into a return to normalized sales levels and resumption of new unit growth. Our $102 target price is supported by our DCF model, which implies SHAK reaches ~700 company and ~300 licensed units over the next 10 years.
Risk: Key risks to our $102 target price and Neutral rating include: US macro environment, net unit productivity and success in new markets. SHAK’s average restaurant sales could decline during economic downturns or periods of uncertainty caused by higher unemployment, increased taxes, lower home prices or other economic factors. New stores could be less successful or achieve lower restaurant margins. SHAK might be required to make additional investments in new markets and new markets may differ in terms of consumer taste, discretionary income and competitive conditions.
Target Price and Rating Valuation Methodology and Risks: (12 months) for Shakey's Pizza Asia Ventures, Inc. (PIZZA.PS)
Method: We derive our P9.8/share share target price for Shakey's Pizza Asia Ventures, Inc. using a weighted average cost of capital of 8.4% and a long-term nominal growth rate of 4%. This assumes a cost of equity of 12.7% and a cost of debt of 4%. Fair valuation of puts it at a forward P/E (price-to-earnings) of 20x. Our OUTPERFORM rating for PIZZA reflects our positive view on the fundamentals of consumption growth in the Philippines and execution ability of the company.
Risk: Risks to our P9.8/share target price and OUTPERFORM rating for PIZZA include downward EPS revisions and lower-than-expected ROIC. Downside risks to our view include price increases in imported raw materials, such as cheese and chicken, and short supply of locally-sourced raw materials. Other risks include tough competition and execution risk on store expansion strategy.
Target Price and Rating Valuation Methodology and Risks: (12 months) for Starbucks Corporation (SBUX.OQ)
Method: Our $114 target price and Outperform rating are based on ~32x our NTM EPS in 12 months, implying an EV/EBITDA multiple of ~20x our NTM EBITDA in 12 months.
Risk: Key risks to our $114 target price and Outperform rating include: competition, food safety, health epidemics and fluctuations in the value of foreign currencies. SBUX operates in a highly competitive restaurant environment. Food safety events, whether or not involving SBUX, could result in negative publicity, may reduce demand for Starbucks’ food, and could result in a decrease in guest traffic and sales. Fluctuations in the value of foreign currencies where SBUX operates or sources its products could adversely affect its revenues and profits.
Target Price and Rating Valuation Methodology and Risks: (12 months) for Sysco Corporation (SYY.N)
Method: Our $85 target price and Outperform rating are based on ~13x our NTM EBITDA in 12 months, implying ~21.5x our NTM EPS in 12 months.
Risk: Risks to our $85 target price and Outperform rating include an extended period of the COVID-19 pandemic in the US that prolongs closures of food-away-from-home channels, greater-than-anticipated pressures on supply chain, and deterioration in the macro environment and consumer spending.

Target Price and Rating Valuation Methodology and Risks: (12 months) for Texas Roadhouse (TXRH.OQ)
Method: Our $90 target price and Outperform rating is based on ~25x our NTM EPS in 12 months, implying ~14x our NTM EBITDA in 12 months.
Risk: Key risks to our $90 target price and Outperform rating include: consumer spending, health epidemic, food & labor cost inflation and competition. Restaurant occasions are consumer discretionary purchases, and a challenging economic environment, as well as the potential for prolonged changes in consumer behavior could weigh on sales recovery efforts. The impact of a health epidemic could result in reduced consumer mobility, government mandates that limit dining room capacity or prohibit on-premise dining. Heightened food & labor cost inflation would weigh on margins. TXRH operates in a highly competitive restaurant environment.
Target Price and Rating Valuation Methodology and Risks: (12 months) for The Cheesecake Factory (CAKE.OQ)
Method: Our $44 target price and Neutral rating is based on ~17x our NTM EPS in 12 months & ~10x our NTM EBITDA in 12 months, a discount to its 5-year averages given uncertainty in the outlook.
Risk: Key risks to our $44 target price and Neutral rating include: consumer spending, health epidemic, food & labor cost inflation, competition and mall exposure. A challenging economic environment & potential for changes in consumer behavior could weigh on sales recovery efforts. The impact of a health epidemic could result in reduced consumer mobility or mandates that limit dining room capacity/ prohibit on-premise dining. Heightened food & labor cost inflation would weigh on margins. CAKE operates in a highly competitive restaurant environment. ~80% of CAKE’s stores are located at/near malls, and traffic could be negatively impacted.
Target Price and Rating Valuation Methodology and Risks: (12 months) for The Wendy’s Company (WEN.OQ)
Method: Our $25 target price and Neutral rating for WEN are based on ~16x our estimated next 12 months EBITDA in 12 months. We rate WEN Neutral as we expect it to perform inline with its peers.
Risk: Risks to our $25 target price and Neutral rating for WEN are competition and consumer spending. WEN operates in a highly competitive restaurant environment. Increased product and price competition could adversely affect revenue and profits. The QSR industry is often affected by changes in consumer tastes and consumer discretionary spending. Decreases in consumer discretionary spending or decline in consumer food-away-from-home spending could negatively impact revenues, results of operations, business and financial condition.
Target Price and Rating Valuation Methodology and Risks: (12 months) for US Foods Holding Corp. (USFD.N)
Method: Our $40 target price and Outperform rating are based on ~10x our NTM EBITDA in 12 months, implying ~15.5x our NTM EPS in 12 months, in-line with three-year average multiples.
Risk: Risks to our Outperform rating and $40 target price include an extended period of the COVID-19 pandemic in the US, greater-than-anticipated operating expense deleverage and pressures on supply chain, missteps in integration efforts, and deterioration in the macro environment and consumer spending in the post-COVID recovery.
Target Price and Rating Valuation Methodology and Risks: (12 months) for Yum! Brands, Inc. (YUM.N)
Method: Our $103 target price and Neutral rating are based on ~18x our NTM EBITDA in 12 months, implying a P/E multiple of ~23.5x our NTM EPS in 12 months.
Risk: Risks to our $103 target price and Neutral rating for YUM are competition, consumer spending and FX volatility. YUM operates in a highly competitive restaurant environment. Increased product and price competition could adversely affect revenue and profits. Due to YUM’s international exposure, its financial results could be adversely impacted by foreign currency volatility. Decreases in consumer discretionary spending or decline in consumer food-away-from-home spending could negatively impact revenues, results of operations, business and financial condition.
Companies Mentioned (Price as of 18-Jan-2021)
BJs Restaurants (BJRI.OQ, $46.91) Bloomin' Brands (BLMN.OQ, $21.46, NEUTRAL[V], TP $21.0) Brinker International Inc. (EAT.N, $59.18) Carrols Restaura (TAST.OQ, $6.88) Chipotle Mexican Grill, Inc. (CMG.N, $1405.74, OUTPERFORM, TP $1700.0) Chuys (CHUY.OQ, $33.17) Cracker Barrel (CBRL.OQ, $141.06) Darden Restaurants (DRI.N, $121.08, OUTPERFORM, TP $141.0) Dave & Buster’s (PLAY.OQ, $33.66) Dine Brands (DIN.N, $70.48) Domino’s Pizza Inc. (DPZ.N, $375.23, OUTPERFORM, TP $445.0) DoorDash (DASH.N, $187.15) El Pollo Loco (LOCO.OQ, $19.6) Jack in the Box Inc. (JACK.OQ, $99.55, UNDERPERFORM, TP $74.0) Just Eat Takeaway (JETJ.L, 7814.0p) McDonald’s Corporation (MCD.N, $209.91, OUTPERFORM, TP $230.0) Noodles & Company (NDLS.OQ, $8.82) Papa John’s International, Inc. (PZZA.OQ, $95.2, OUTPERFORM, TP $110.0) Performance Food Group Company (PFGC.N, $51.18, OUTPERFORM[V], TP $56.0) Potbelly (PBPB.OQ, $4.9) Red Robin Gourmt (RRGB.OQ, $24.89) Restaurant Brands International Inc (QSR.N, $62.91, OUTPERFORM, TP $69.0) Ruths (RUTH.OQ, $18.82) Shake Shack (SHAK.N, $111.26, NEUTRAL[V], TP $102.0) Shakey's Pizza Asia Ventures, Inc. (PIZZA.PS, P7.56) Starbucks Corporation (SBUX.OQ, $102.33, OUTPERFORM, TP $114.0) Sysco Corporation (SYY.N, $75.57, OUTPERFORM, TP $85.0) Texas Roadhouse (TXRH.OQ, $80.62, OUTPERFORM, TP $90.0) The Cheesecake Factory (CAKE.OQ, $41.22, NEUTRAL[V], TP $44.0) The Wendy’s Company (WEN.OQ, $21.65, NEUTRAL, TP $25.0) US Foods Holding Corp. (USFD.N, $35.66, OUTPERFORM[V], TP $40.0) Uber (UBER.N, $55.52) Wingstop (WING.OQ, $144.95) Yum! Brands, Inc. (YUM.N, $106.62, NEUTRAL, TP $103.0)
Disclosure Appendix
Analyst Certification
The analysts identified in this report each certify, with respect to the companies or securities that the individual analyzes, that (1) the views expressed in this report accurately reflect his or her personal views about all of the subject companies and securities and (2) no part of his or her compensation was, is or will be directly or indirectly related to the specific recommendations or views expressed in this report.
3-Year Price and Rating History for Bloomin' Brands (BLMN.OQ)
BLMN.OQ Closing Price Target Price
Date (US$) (US$) Rating
23-Jan-18 21.83 20.00 N
23-Feb-18 24.11 23.00
14-Mar-18 23.62 NC
09-Jul-20 9.69 12.00 N *
25-Oct-20 16.26 17.00
* Asterisk signifies initiation or assumption of coverage.
Effective July 3, 2016, NC denotes termination of coverage.
N EU T RA L
N O T CO V ERED

3-Year Price and Rating History for Chipotle Mexican Grill, Inc. (CMG.N)
CMG.N Closing Price Target Price
Date (US$) (US$) Rating
23-Jan-18 328.71 330.00 N
07-Feb-18 272.21 275.00
19-Feb-18 305.63 290.00
14-Mar-18 319.66 NC
25-Jun-19 733.22 870.00 O *
24-Jul-19 777.96 880.00
23-Oct-19 788.19 930.00
05-Feb-20 854.01 1010.00
13-Apr-20 744.08 900.00
22-Apr-20 882.26 940.00
09-Jul-20 1115.58 1150.00
23-Jul-20 1121.03 1250.00
16-Oct-20 1339.68 1500.00
* Asterisk signifies initiation or assumption of coverage.
Effective July 3, 2016, NC denotes termination of coverage.
N EU T RA L
N O T CO V ERED
O U T PERFO RM
3-Year Price and Rating History for Darden Restaurants (DRI.N)
DRI.N Closing Price Target Price
Date (US$) (US$) Rating
14-Mar-18 94.21 NC
09-Jul-20 71.34 95.00 O *
25-Sep-20 97.17 112.00
21-Dec-20 116.92 136.00
* Asterisk signifies initiation or assumption of coverage.
Effective July 3, 2016, NC denotes termination of coverage.
N O T CO V ERED
O U T PERFO RM
3-Year Price and Rating History for Domino’s Pizza Inc. (DPZ.N)
DPZ.N Closing Price Target Price
Date (US$) (US$) Rating
23-Jan-18 219.57 235.00 O
21-Feb-18 230.53 245.00
14-Mar-18 226.66 NC
25-Jun-19 277.14 320.00 O *
16-Jul-19 246.54 300.00
21-Feb-20 371.96 390.00
31-Mar-20 324.07 380.00
23-Apr-20 369.64 400.00
03-Jun-20 390.14 415.00
17-Jul-20 390.22 445.00
* Asterisk signifies initiation or assumption of coverage.
Effective July 3, 2016, NC denotes termination of coverage.
O U T PERFO RM
N O T CO V ERED
3-Year Price and Rating History for Jack in the Box Inc. (JACK.OQ)
JACK.OQ Closing Price Target Price
Date (US$) (US$) Rating
25-Jun-19 80.34 75.00 U *
08-Aug-19 86.97 78.00
13-Apr-20 43.29 45.00
14-May-20 65.47 54.00
09-Jul-20 74.37 55.00
07-Aug-20 82.04 64.00
20-Nov-20 91.24 74.00
* Asterisk signifies initiation or assumption of coverage. UN D ERPERFO RM
3-Year Price and Rating History for McDonald’s Corporation (MCD.N)
MCD.N Closing Price Target Price
Date (US$) (US$) Rating
23-Jan-18 176.81 191.00 O
06-Mar-18 151.20 175.00
14-Mar-18 158.24 NC
25-Jun-19 205.71 230.00 O *
29-Jul-19 214.98 236.00
23-Oct-19 199.21 230.00
13-Apr-20 180.12 200.00
17-Jun-20 190.79 210.00
29-Jul-20 196.21 214.00
10-Nov-20 213.32 230.00
* Asterisk signifies initiation or assumption of coverage.
Effective July 3, 2016, NC denotes termination of coverage.
O U T PERFO RM
N O T CO V ERED
3-Year Price and Rating History for Papa John’s International, Inc. (PZZA.OQ)
PZZA.OQ Closing Price Target Price
Date (US$) (US$) Rating
25-Jun-19 42.80 45.00 N *
05-Sep-19 49.44 56.00 O
07-Nov-19 62.58 66.00
27-Feb-20 58.18 71.00
06-May-20 76.90 84.00
01-Jun-20 79.64 90.00
07-Aug-20 98.11 110.00
* Asterisk signifies initiation or assumption of coverage. N EU T RA L
O U T PERFO RM
3-Year Price and Rating History for Performance Food Group Company (PFGC.N)
PFGC.N Closing Price Target Price
Date (US$) (US$) Rating
17-Apr-18 31.20 36.00 O *
09-May-18 35.70 39.00
06-Feb-19 37.88 42.00
01-Jul-19 39.70 R
31-Dec-19 51.48 NR
06-Jan-20 52.36 58.00 O
05-Feb-20 52.60 60.00
31-Mar-20 24.72 46.00
15-Apr-20 24.00 R
16-Apr-20 21.85 46.00 O
20-Apr-20 24.13 39.00
05-Aug-20 30.96 39.00 *
21-Sep-20 35.01 47.00
05-Nov-20 37.50 49.00
* Asterisk signifies initiation or assumption of coverage.
O U T PERFO RM
REST RICT ED
N O T RA T ED
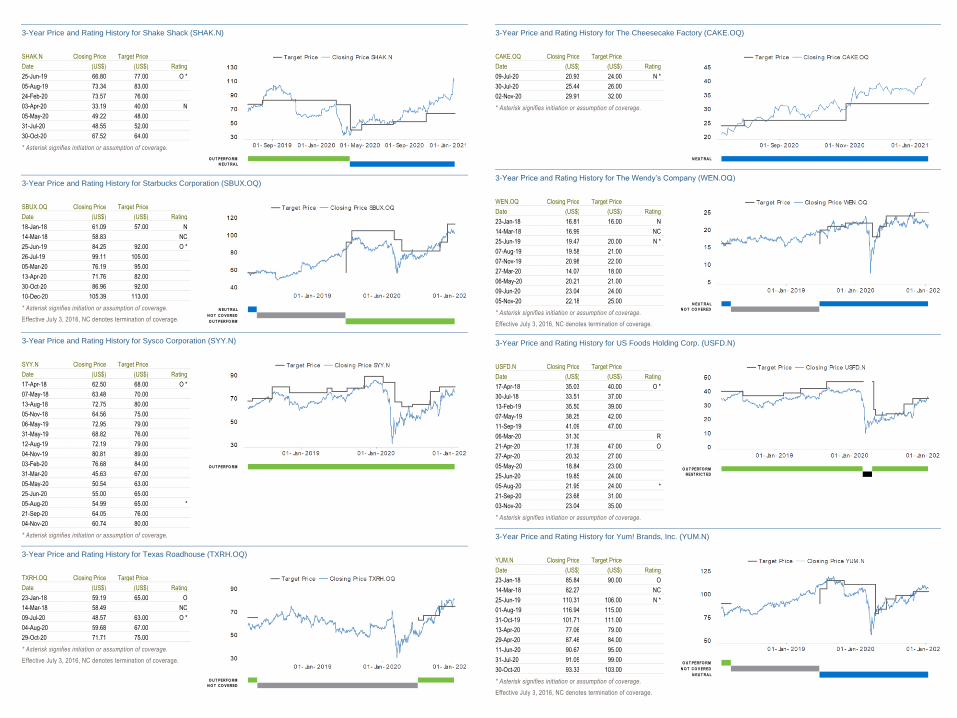
3-Year Price and Rating History for Shake Shack (SHAK.N)
SHAK.N Closing Price Target Price
Date (US$) (US$) Rating
25-Jun-19 66.80 77.00 O *
05-Aug-19 73.34 83.00
24-Feb-20 73.57 76.00
03-Apr-20 33.19 40.00 N
05-May-20 49.22 48.00
31-Jul-20 48.55 52.00
30-Oct-20 67.52 64.00
* Asterisk signifies initiation or assumption of coverage. O U T PERFO RM
N EU T RA L
3-Year Price and Rating History for Starbucks Corporation (SBUX.OQ)
SBUX.OQ Closing Price Target Price
Date (US$) (US$) Rating
18-Jan-18 61.09 57.00 N
14-Mar-18 58.83 NC
25-Jun-19 84.25 92.00 O *
26-Jul-19 99.11 105.00
05-Mar-20 76.19 95.00
13-Apr-20 71.76 82.00
30-Oct-20 86.96 92.00
10-Dec-20 105.39 113.00
* Asterisk signifies initiation or assumption of coverage.
Effective July 3, 2016, NC denotes termination of coverage.
N EU T RA L
N O T CO V ERED
O U T PERFO RM
3-Year Price and Rating History for Sysco Corporation (SYY.N)
SYY.N Closing Price Target Price
Date (US$) (US$) Rating
17-Apr-18 62.50 68.00 O *
07-May-18 63.48 70.00
13-Aug-18 72.75 80.00
05-Nov-18 64.56 75.00
06-May-19 72.95 79.00
31-May-19 68.82 76.00
12-Aug-19 72.19 79.00
04-Nov-19 80.81 89.00
03-Feb-20 76.68 84.00
31-Mar-20 45.63 67.00
05-May-20 50.54 63.00
25-Jun-20 55.00 65.00
05-Aug-20 54.99 65.00 *
21-Sep-20 64.05 76.00
04-Nov-20 60.74 80.00
* Asterisk signifies initiation or assumption of coverage.
O UT PERFO RM
3-Year Price and Rating History for Texas Roadhouse (TXRH.OQ)
TXRH.OQ Closing Price Target Price
Date (US$) (US$) Rating
23-Jan-18 59.19 65.00 O
14-Mar-18 58.49 NC
09-Jul-20 48.57 63.00 O *
04-Aug-20 59.68 67.00
29-Oct-20 71.71 75.00
* Asterisk signifies initiation or assumption of coverage.
Effective July 3, 2016, NC denotes termination of coverage.
O U T PERFO RM
N O T CO V ERED
3-Year Price and Rating History for The Cheesecake Factory (CAKE.OQ)
CAKE.OQ Closing Price Target Price
Date (US$) (US$) Rating
09-Jul-20 20.93 24.00 N *
30-Jul-20 25.44 26.00
02-Nov-20 29.91 32.00
* Asterisk signifies initiation or assumption of coverage.
N EUT RAL
3-Year Price and Rating History for The Wendy’s Company (WEN.OQ)
WEN.OQ Closing Price Target Price
Date (US$) (US$) Rating
23-Jan-18 16.81 16.00 N
14-Mar-18 16.99 NC
25-Jun-19 19.47 20.00 N *
07-Aug-19 19.58 21.00
07-Nov-19 20.98 22.00
27-Mar-20 14.07 18.00
06-May-20 20.21 21.00
09-Jun-20 23.04 24.00
05-Nov-20 22.18 25.00
* Asterisk signifies initiation or assumption of coverage.
Effective July 3, 2016, NC denotes termination of coverage.
N EU T RA L
N O T CO V ERED
3-Year Price and Rating History for US Foods Holding Corp. (USFD.N)
USFD.N Closing Price Target Price
Date (US$) (US$) Rating
17-Apr-18 35.03 40.00 O *
30-Jul-18 33.51 37.00
13-Feb-19 35.50 39.00
07-May-19 38.25 42.00
11-Sep-19 41.09 47.00
06-Mar-20 31.30 R
21-Apr-20 17.39 47.00 O
27-Apr-20 20.32 27.00
05-May-20 18.84 23.00
25-Jun-20 19.85 24.00
05-Aug-20 21.95 24.00 *
21-Sep-20 23.68 31.00
03-Nov-20 23.04 35.00
* Asterisk signifies initiation or assumption of coverage.
O U T PERFO RM
REST RICT ED
3-Year Price and Rating History for Yum! Brands, Inc. (YUM.N)
YUM.N Closing Price Target Price
Date (US$) (US$) Rating
23-Jan-18 85.84 90.00 O
14-Mar-18 82.27 NC
25-Jun-19 110.31 106.00 N *
01-Aug-19 116.94 115.00
31-Oct-19 101.71 111.00
13-Apr-20 77.06 79.00
29-Apr-20 87.46 84.00
11-Jun-20 90.67 95.00
31-Jul-20 91.05 99.00
30-Oct-20 93.33 103.00
* Asterisk signifies initiation or assumption of coverage.
Effective July 3, 2016, NC denotes termination of coverage.
O U T PERFO RM
N O T CO V ERED
N EU T RA L

As of December 10, 2012 Analysts’ stock rating are defined as follows:
Outperform (O) : The stock’s total return is expected to outperform the relevant benchmark* over the next 12 months.
Neutral (N) : The stock’s total return is expected to be in line with the relevant benchmark* over the next 12 months.
Underperform (U) : The stock’s total return is expected to underperform the relevant benchmark* over the next 12 months.
*Relevant benchmark by region: As of 10th December 2012, Japanese ratings are based on a stock’s total return relative to the analyst's coverage universe which consists of all companies covered by the analyst within the relevant sector, with Outperforms representing the most attractiv e, Neutrals the less attractive, and Underperforms the least attractive investment opportunities. As of 2nd October 2012, U.S. and Canadian as well as European (excluding Turkey) ratings are based on a stock’s total return relative to the analyst's coverage universe which consists of all companies covered by the analyst withi n the relevant sector, with Outperforms representing the most attractive, Neutrals the less attractive, and Underperforms the least attractive investment opportunities. For Latin America, Turkey and Asia (excluding Japan and Australia), stock ratings are based on a stock’s total return relative to the averag e total return of the relevant country or regional benchmark (India - S&P BSE Sensex Index); prior to 2nd October 2012 U.S. and Canadian ratings were based on (1) a stock’s absolute total return potential to its current share price and (2) the relative attractiveness of a stock’s total return potential within an analyst’s coverage universe. For Australian and New Zealand stocks, the expected total return (ETR) calculation includes 12-month rolling dividend yield. An Outperform rating is assigned where an ETR is greater than or equal to 7.5%; Underperform where an ETR less than or equal to 5%. A Neutral may be assigned where the ETR is between -5% and 15%. The overlapping rating range allows analysts to assign a rating that puts ETR in the context of associated risks. Prior to 18 May 2015, ETR ranges for Outperform and Underperform ratings did not overlap with Neutral thresholds be tween 15% and 7.5%, which was in operation from 7 July 2011.
Restricted (R) : In certain circumstances, Credit Suisse policy and/or applicable law and regulations preclude certain types of communications, including an investment recommendation, during the course of Credit Suisse's engagement in an investment banking transaction and in certain other circumstances.
Not Rated (NR) : Credit Suisse Equity Research does not have an investment rating or view on the stock or any other securities related to the company at this time.
Not Covered (NC) : Credit Suisse Equity Research does not provide ongoing coverage of the company or offer an investment rating or investment view on the equity security of the company or related products.
Volatility Indicator [V] : A stock is defined as volatile if the stock price has moved up or down by 20% or more in a month in at least 8 of the past 24 months or the analyst expects significant volatility going forward.
Analysts’ sector weightings are distinct from analysts’ stock ratings and are based on the analyst’s expectations for the fundamentals and/or valuation of the sector* relative to the group’s historic fundamentals and/or valuation:
Overweight : The analyst’s expectation for the sector’s fundamentals and/or valuation is favorable over the next 12 months.
Market Weight : The analyst’s expectation for the sector’s fundamentals and/or valuation is neutral over the next 12 months.
Underweight : The analyst’s expectation for the sector’s fundamentals and/or valuation is cautious over the next 12 months.
*An analyst’s coverage sector consists of all compan ies covered by the analyst within the relevant sector. An analyst may cover multiple sectors.
Credit Suisse's distribution of stock ratings (and banking clients) is:
Global Ratings Distribution
Rating Versus universe (%) Of which banking clients (%)
Outperform/Buy* 52% (33% banking clients)
Neutral/Hold* 35% (26% banking clients)
Underperform/Sell* 11% (22% banking clients)
Restricted 1%
Please click here to view the MAR quarterly recommendations and investment services report for fundamental research recommendations.
*For purposes of the NYSE and FINRA ratings distribution disclosure requirements, our stock ratings of Outperform, Neutral, a nd Underperform most closely correspond to Buy, Hold, and Sell, respectively; however, the meanings are not the same, as our stock ratings are determined on a relati ve basis. (Please refer to definitions above.) An investor's decision to buy or sell a security should be based on investment objectives, current holdings, and other individual factors.
Important Global Disclosures
Credit Suisse’s research reports are made available to clients through our proprietary research portal on CS PLUS. Credit Suisse research products may also be made available through third-party vendors or alternate electronic means as a convenience. Certain research products are only made available through CS PLUS. The services provided by Credit Suisse’s analysts to clients may depend on a specific client’s preferences regarding the frequency and manner of receiving communications, the client’s risk profile and investment, the size and scope of the overall client relationship with the Firm, as well as legal and regulatory constraints. To access all of Credit Suisse’s research that you are entitled to receive in the most timely manner, please contact your sales representative or go to https://plus.credit-suisse.com .
Credit Suisse’s policy is to update research reports as it deems appropriate, based on developments with the subject company, the sector or the market that may have a material impact on the research views or opinions stated herein.
Credit Suisse's policy is only to publish investment research that is impartial, independent, clear, fair and not misleading. For more detail please refer to Credit Suisse's Policies for Managing Conflicts of Interest in connection with Investment Research: https://www.credit-suisse.com/sites/disclaimers-ib/en/managing-conflicts.html .
Any information relating to the tax status of financial instruments discussed herein is not intended to provide tax advice or to be used by anyone to provide tax advice. Investors are urged to seek tax advice based on their particular circumstances from an independent tax professional.
Credit Suisse has decided not to enter into business relationships with companies that Credit Suisse has determined to be involved in the development, manufacture, or acquisition of anti-personnel mines and cluster munitions. For Credit Suisse's position on the issue, please see https://www.credit-suisse.com/media/assets/corporate/docs/about-us/responsibility/banking/policy-summaries-en.pdf .
The analyst(s) responsible for preparing this research report received compensation that is based upon various factors including Credit Suisse's total revenues, a portion of which are generated by Credit Suisse's investment banking activities
Please refer to the firm's disclosure website at https://rave.credit-suisse.com/disclosures/view/selectArchive for the definitions of abbreviations typically used in the target price method and risk sections.
See the Companies Mentioned section for full company names
Credit Suisse currently has, or had within the past 12 months, the following as investment banking client(s): PFGC.N, QSR.N, SBUX.OQ, PIZZA.PS
Credit Suisse provided investment banking services to the subject company (PFGC.N, QSR.N, SBUX.OQ, PIZZA.PS) within the past 12 months.
Within the last 12 months, Credit Suisse has received compensation for non-investment banking services or products from the following issuer(s): PFGC.N
Credit Suisse has managed or co-managed a public offering of securities for the subject company (PFGC.N, PIZZA.PS) within the past 12 months.
Within the past 12 months, Credit Suisse has received compensation for investment banking services from the following issuer(s): PFGC.N, SBUX.OQ
Credit Suisse expects to receive or intends to seek investment banking related compensation from the subject company (YUM.N, DPZ.N, PFGC.N, QSR.N, JETJ.L) within the next 3 months.
Credit Suisse currently has, or had within the past 12 months, the following issuer(s) as client(s), and the services provided were non-investment-banking, securities-related: PFGC.N
Credit Suisse or a member of the Credit Suisse Group is a market maker or liquidity provider in the securities of the following subject issuer(s): BLMN.OQ, CMG.N, DRI.N, DPZ.N, JACK.OQ, JETJ.L, MCD.N, PZZA.OQ, PFGC.N, QSR.N, SHAK.N, PIZZA.PS, SBUX.OQ, SYY.N, TXRH.OQ, CAKE.OQ, WEN.OQ, USFD.N, YUM.N
A member of the Credit Suisse Group is party to an agreement with, or may have provided services set out in sections A and B of Annex I of Directive 2014/65/EU of the European Parliament and Council ("MiFID Services") to, the subject issuer (PFGC.N, QSR.N, SBUX.OQ, PIZZA.PS) within the past 12 months.
As of the date of this report, Credit Suisse beneficially own 1% or more of a class of common equity securities of (JETJ.L).
For date and time of production, dissemination and history of recommendation for the subject company(ies) featured in this report, disseminated within the past 12 months, please refer to the link: https://rave.credit-suisse.com/disclosures/view/report?i=582382&v=5a1ad1lc969ibmd6j6b37hups .
Important Regional Disclosures
Singapore recipients should contact Credit Suisse AG, Singapore Branch for any matters arising from, or in connection with, this research report.
The analyst(s) involved in the preparation of this report may participate in events hosted by the subject company, including site visits. Credit Suisse does not accept or permit analysts to accept payment or reimbursement for travel expenses associated with these events.
For Credit Suisse Securities (Canada), Inc.'s policies and procedures regarding the dissemination of equity research, please visit https://www.credit-suisse.com/sites/disclaimers-ib/en/canada-research-policy.html.
Investors should note that income from such securities and other financial instruments, if any, may fluctuate and that price or value of such securities and instruments may rise or fall and, in some cases, investors may lose their entire principal investment.
To the extent any Credit Suisse equity research analyst employed by Credit Suisse International (a "UK Analyst") has interactions with a Spanish domiciled client of Credit Suisse AG or its affiliates, such UK Analyst will be acting for and on behalf of CSSSV, with respect only to the provision of equity research services to Spanish domiciled clients of Credit Suisse AG or its affiliates.
Pursuant to CVM Instruction No. 598/2018, of May 3, 2018, the author(s) of the report hereby certify(ies) that the views expressed in this report solely and exclusively reflect the personal opinions of the author(s) and have been prepared independently, including with respect to Credit Suisse. Part of the author(s)´s compensation is based on various factors, including the total revenues of Credit Suisse, but no part of the compensation has been, is, or will be related to the specific recommendations or views expressed in this report. In addition, Credit Suisse declares that: Credit Suisse has provided, and/or may in the future provide investment banking, brokerage, asset management, commercial banking and other financial services to the subject company/companies or its affiliates, for which they have received or may receive customary fees and commissions, and which constituted or may constitute relevant financial or commercial interests in relation to the subject company/companies or the subject securities.
This research report is authored by:
Credit Suisse Securities (USA) LLC .............................................................................................................................................. Lauren Silberman
Important disclosures regarding companies that are the subject of this report are available by calling +1 (877) 291-2683. The same important disclosures, with the exception of valuation methodology and risk discussions, are also available on Credit Suisse’s disclosure website at https://rave.credit-suisse.com/disclosures . For valuation methodology and risks associated with any recommendation, price target, or rating referenced in this report, please refer to the disclosures section of the most recent report regarding the subject company.
This report is produced by subsidiaries and affiliates of Credit Suisse operating under its Global Markets Division. For more information on our structure, please use the following link: https://www.credit-suisse.com/who-we-are This report may contain material that is not directed to, or intended for distribution to or use by, any person or entity who is a citizen or resident of or located in any locality, state, country or other jurisdiction where such distribution, publication, availability or use would be contrary to law or regulation or which would subject Credit Suisse or its affiliates ("CS") to any registration or licensing requirement within such jurisdiction. All material presented in this report, unless specifically indicated otherwise, is under copyright to CS. None of the material, nor its content, nor any copy of it, may be altered in any way, transmitted to, copied or distributed to any other party, without the prior express written permission of CS. All trademarks, service marks and logos used in this report are trademarks or service marks or registered trademarks or service marks of CS or its affiliates.The information, tools and material presented in this report are provided to you for information purposes only and are not to be used or considered as an offer or the solicitation of an offer to sell or to buy or subscribe for securities or other financial instruments. CS may not have taken any steps to ensure that the securities referred to in this report are suitable for any particular investor. CS will not treat recipients of this report as its customers by virtue of their receiving this report. The investments and services contained or referred to in this report may not be suitable for you and it is recommended that you consult an independent investment advisor if you are in doubt about such investments or investment services. Nothing in this report constitutes investment, legal, accounting or tax advice, or a representation that any investment or strategy is suitable or appropriate to your individual circumstances, or otherwise constitutes a personal recommendation to you. Please note in particular that the bases and levels of taxation may change. Information and opinions presented in this report have been obtained or derived from sources believed by CS to be reliable, but CS makes no representation as to their accuracy or completeness. CS accepts no liability for loss arising from the use of the material presented in this report, except that this exclusion of liability does not apply to the extent that such liability arises under specific statutes or regulations applicable to CS. This report is not to be relied upon in substitution for the exercise of independent judgment. CS may have issued, and may in the future issue, other communications that are inconsistent with, and reach different conclusions from, the information presented in this report. Those communications reflect the different assumptions, views and analytical methods of the analysts who prepared them and CS is under no obligation to ensure that such other communications are brought to the attention of any recipient of this report. Some investments referred to in this report will be offered solely by a single entity and in the case of some investments solely by CS, or an associate of CS or CS may be the only market maker in such investments. Past performance should not be taken as an indication or guarantee of future performance, and no representation or warranty, express or implied, is made regarding future performance. Information, opinions and estimates contained in this report reflect a judgment at its original date of publication by CS and are subject to change without notice. The price, value of and income from any of the securities or financial instruments mentioned in this report can fall as well as rise. The value of securities and financial instruments is subject to exchange rate fluctuation that may have a positive or adverse effect on the price or income of such securities or financial instruments. Investors in securities such as ADR's, the values of which are influenced by currency volatility, effectively assume this risk. Structured securities are complex instruments, typically involve a high degree of risk and are intended for sale only to sophisticated investors who are capable of understanding and assuming the risks involved. The market value of any structured security may be affected by changes in economic, financial and political factors (including, but not limited to, spot and forward interest and exchange rates), time to maturity, market conditions and volatility, and the credit quality of any issuer or reference issuer. Any investor interested in purchasing a structured product should conduct their own investigation and analysis of the product and consult with their own professional advisers as to the risks involved in making such a purchase. Some investments discussed in this report may have a high level of volatility. High volatility investments may experience sudden and large falls in their value causing losses when that investment is realised. Those losses may equal your original investment. Indeed, in the case of some investments the potential losses may exceed the amount of initial investment and, in such circumstances, you may be required to pay more money to support those losses. Income yields from investments may fluctuate and, in consequence, initial capital paid to make the investment may be used as part of that income yield. Some investments may not be readily realisable and it may be difficult to sell or realise those investments, similarly it may prove difficult for you to obtain reliable information about the value, or risks, to which such an investment is exposed. This report may provide the addresses of, or contain hyperlinks to, websites. Except to the extent to which the report refers to website material of CS, CS has not reviewed any such site and takes no responsibility for the content contained therein. Such address or hyperlink (including addresses or hyperlinks to CS's own website material) is provided solely for your convenience and information and the content of any such website does not in any way form part of this document. Accessing such website or following such link through this report or CS's website shall be at your own risk.
This report is issued and distributed in European Union (except Germany and Spain): by Credit Suisse Securities (Europe) Limited, One Cabot Square, London E14 4QJ, England, which is authorised by the Prudential Regulation Authority and regulated by the Financial Conduct Authority and the Prudential Regulation Authority; Spain: Credit Suisse Securities, Sociedad de Valores, S.A. (“CSSSV”) regulated by the Comision Nacional del Mercado de Valores; Germany: Credit Suisse (Deutschland) Aktiengesellschaft regulated by the Bundesanstalt fuer Finanzdienstleistungsaufsicht ("BaFin"). United States: Credit Suisse Securities (USA) LLC; Canada: Credit Suisse Securities (Canada), Inc.; Switzerland: Credit Suisse AG; Brazil: Banco de Investimentos Credit Suisse (Brasil) S.A or its affiliates; Mexico: Banco Credit Suisse (México), S.A., Institución de Banca Múltiple, Grupo Financiero Credit Suisse (México) and Casa de Bolsa Credit Suisse (México), S.A. de C.V., Grupo Financiero Credit Suisse (México) ("Credit Suisse Mexico"). This document has been prepared for information purposes only and is exclusively distributed in Mexico to Institutional Investors. Credit Suisse Mexico is not responsible for any onward distribution of this report to non-institutional investors by any third party. The authors of this report have not received payment or compensation from any entity or company other than from the relevant Credit Suisse Group company employing them; Japan: by Credit Suisse Securities (Japan) Limited, Financial Instruments Firm, Director-General of Kanto Local Finance Bureau ( Kinsho) No. 66, a member of Japan Securities Dealers Association, The Financial Futures Association of Japan, Japan Investment Advisers Association, Type II Financial Instruments Firms Association; Hong Kong: Credit Suisse (Hong Kong) Limited; Australia: Credit Suisse Equities (Australia) Limited; Thailand: Credit Suisse Securities (Thailand) Limited, regulated by the Office of the Securities and Exchange Commission, Thailand, having registered address at 990 Abdulrahim Place, 27th Floor, Unit 2701, Rama IV Road, Silom, Bangrak, Bangkok10500, Thailand, Tel. +66 2614 6000; Malaysia: Credit Suisse Securities (Malaysia) Sdn Bhd; Singapore: Credit Suisse AG, Singapore Branch; India: Credit Suisse Securities (India) Private Limited (CIN no.U67120MH1996PTC104392) regulated by the Securities and Exchange Board of India as Research Analyst (registration no. INH 000001030) and as Stock Broker (registration no. INZ000248233), having registered address at 9th Floor, Ceejay House, Dr.A.B. Road, Worli, Mumbai - 18, India, T- +91-22 6777 3777; South Korea: Credit Suisse Securities
(Europe) Limited, Seoul Branch; Taiwan: Credit Suisse AG Taipei Securities Branch; Indonesia: PT Credit Suisse Sekuritas Indonesia; Philippines:Credit Suisse Securities (Philippines ) Inc., and elsewhere in the world by the relevant authorised affiliate of the above. Additional Regional Disclaimers Australia: Credit Suisse Securities (Europe) Limited ("CSSEL") and Credit Suisse International ("CSI") are authorised by the Prudential Regulation Authority and regulated by the Financial Conduct Authority ("FCA") and the Prudential Regulation Authority under UK laws, which differ from Australian Laws. CSSEL and CSI do not hold an Australian Financial Services Licence ("AFSL") and are exempt from the requirement to hold an AFSL under the Corporations Act (Cth) 2001 ("Corporations Act") in respect of the financial services provided to Australian wholesale clients (within the meaning of section 761G of the Corporations Act) (hereinafter referred to as “Financial Services”). This material is not for distribution to retail clients and is directed exclusively at Credit Suisse's professional clients and eligible counterparties as defined by the FCA, and wholesale clients as defined under section 761G of the Corporations Act. Credit Suisse (Hong Kong) Limited ("CSHK") is licensed and regulated by the Securities and Futures Commission of Hong Kong under the laws of Hong Kong, which differ from Australian laws. CSHKL does not hold an AFSL and is exempt from the requirement to hold an AFSL under the Corporations Act in respect of providing Financial Services. Investment banking services in the United States are provided by Credit Suisse Securities (USA) LLC, an affiliate of Credit Suisse Group. CSSU is regulated by the United States Securities and Exchange Commission under United States laws, which differ from Australian laws. CSSU does not hold an AFSL and is exempt from the requirement to hold an AFSL under the Corporations Act in respect of providing Financial Services. Credit Suisse Asset Management LLC (CSAM) is authorised by the Securities and Exchange Commission under US laws, which differ from Australian laws. CSAM does not hold an AFSL and is exempt from the requirement to hold an AFSL under the Corporations Act in respect of providing Financial Services. This material is provided solely to Institutional Accounts (as defined in the FINRA rules) who are Eligible Contract Participants (as defined in the US Commodity Exchange Act). Credit Suisse Equities (Australia) Limited (ABN 35 068 232 708) ("CSEAL") is an AFSL holder in Australia (AFSL 237237). Malaysia: Research provided to residents of Malaysia is authorised by the Head of Research for Credit Suisse Securities (Malaysia) Sdn Bhd, to whom they should direct any queries on +603 2723 2020. Singapore: This report has been prepared and issued for distribution in Singapore to institutional investors, accredited investors and expert investors (each as defined under the Financial Advisers Regulations) only, and is also distributed by Credit Suisse AG, Singapore Branch to overseas investors (as defined under the Financial Advisers Regulations). Credit Suisse AG, Singapore Branch may distribute reports produced by its foreign entities or affiliates pursuant to an arrangement under Regulation 32C of the Financial Advisers Regulations. Singapore recipients should contact Credit Suisse AG, Singapore Branch at +65-6212-2000 for matters arising from, or in connection with, this report. By virtue of your status as an institutional investor, accredited investor, expert investor or overseas investor, Credit Suisse AG, Singapore Branch is exempted from complying with certain compliance requirements under the Financial Advisers Act, Chapter 110 of Singapore (the “FAA”), the Financial Advisers Regulations and the relevant Notices and Guidelines issued thereunder, in respect of any financial advisory service which Credit Suisse AG, Singapore Branch may provide to you. EU: This report has been produced by subsidiaries and affiliates of Credit Suisse operating under its Global Markets Division In jurisdictions where CS is not already registered or licensed to trade in securities, transactions will only be effected in accordance with applicable securities legislation, which will vary from jurisdiction to jurisdiction and may require that the trade be made in accordance with applicable exemptions from registration or licensing requirements. This material is issued and distributed in the U.S. by CSSU, a member of NYSE, FINRA, SIPC and the NFA, and CSSU accepts responsibility for its contents. Clients should contact analysts and execute transactions through a Credit Suisse subsidiary or affiliate in their home jurisdiction unless governing law permits otherwise. CS may provide various services to US municipal entities or obligated persons ("municipalities"), including suggesting individual transactions or trades and entering into such transactions. Any services CS provides to municipalities are not viewed as "advice" within the meaning of Section 975 of the Dodd-Frank Wall Street Reform and Consumer Protection Act. CS is providing any such services and related information solely on an arm's length basis and not as an advisor or fiduciary to the municipality. In connection with the provision of the any such services, there is no agreement, direct or indirect, between any municipality (including the officials,management, employees or agents thereof) and CS for CS to provide advice to the municipality. Municipalities should consult with their financial, accounting and legal advisors regarding any such services provided by CS. In addition, CS is not acting for direct or indirect compensation to solicit the municipality on behalf of an unaffiliated broker, dealer, municipal securities dealer, municipal advisor, or investment adviser for the purpose of obtaining or retaining an engagement by the municipality for or in connection with Municipal Financial Products, the issuance of municipal securities, or of an investment adviser to provide investment advisory services to or on behalf of the municipality. If this report is being distributed by a financial institution other than Credit Suisse AG, or its affiliates, that financial institution is solely responsible for distribution. Clients of that institution should contact that institution to effect a transaction in the securities mentioned in this report or require further information. This report does not constitute investment advice by Credit Suisse to the clients of the distributing financial institution, and neither Credit Suisse AG, its affiliates, and their respective officers, directors and employees accept any liability whatsoever for any direct or consequential loss arising from their use of this report or its content. No information or communication provided herein or otherwise is intended to be, or should be construed as, a recommendation within the meaning of the US Department of Labor’s final regulation defining "investment advice" for purposes of the Employee Retirement Income Security Act of 1974, as amended and Section 4975 of the Internal Revenue Code of 1986, as amended, and the information provided herein is intended to be general information, and should not be construed as, providing investment advice (impartial or otherwise). Copyright © 2021 CREDIT SUISSE AG and/or its affiliates. All rights reserved. When you purchase non-listed Japanese fixed income securities (Japanese government bonds, Japanese municipal bonds, Japanese government guaranteed bonds, Japanese corporate bonds) from CS as a seller, you will be requested to pay the purchase price only.