u.s. office market trends: q4 2013
TRANSCRIPT

United States
Office Review
Q4 2013
2014 will be the year of a diversifying and expanding office recovery

… Landlord confidence continues to grow; for the 12th consecutive
quarter, asking rents increased and decreased concessions
nationally. Further, when examining tenant leverage ahead
across markets, less than 10 percent of geographies JLL tracks
will be categorized as tenant-favorable in 2015.

Leasing activity • Q4 posted 61.4 million square feet of leasing activity.
• Leasing levels down 6.1 percent from Q3 2013.
• Annual 2013 leasing levels up 6.5 percent from 2012
Absorption
• Absorption levels increase with 15th consecutive quarter of occupancy growth.
• Absorption gains totaled 13.2 million square feet in the quarter and overall in 2013 nearly reached 40.0
million square feet, the highest volume in the recovery so far.
• Throughout the year, New York, Houston, Dallas, the Bay Area and Seattle were the largest contributors to
absorption nationally.
Vacancy
• Vacancy dropped 20 basis points to a recovery low of 16.6 percent during the quarter and dropped from
17.0 percent last year..
• CBD vacancy fell below 14.0 to 13.9 percent and in the suburbs, vacancy levels closed the year at 18.2
percent.
Rents
• Tenants have far less leverage across urbanized, core markets, especially in Trophy and Class A buildings.
• Rents have now increased in 12 of the past 13 quarters.
• Class A rent growth continues to trump Class B rent movement across the board.
• Rents growing over four times faster in CBDs than suburbs.
• Concessions continue to erode and are now at 2008 levels nationally.
Construction • Construction starts no longer dominated by specific geographies.
• Most markets will not see new deliveries enter the market until 2015, presenting challenges for large
tenants, especially in CBDs.
Ending 2013, growth no longer concentrated as strongly
in specific regions or industry niche markets
3
Source: Jones Lang LaSalle Research

Consistent number of markets posting quarterly increases
in leasing activity (45.8 percent of markets)
4
0%
10%
20%
30%
40%
50%
60%
70%
80%
90%
100%
2011 2012 2013
Up Neutral Down
Source: Jones Lang LaSalle Research

Leasing activity totaled 61.4 million square feet, down 6.1
percent from Q3
5
0
10,000,000
20,000,000
30,000,000
40,000,000
50,000,000
60,000,000
70,000,000
80,000,000
90,000,000
2007 2008 2009 2010 2011 2012 2013
Leas
ing
activ
ity (
s.f.)
26-quarter trailing average
Source: Jones Lang LaSalle Research

Q4 2013 posted leasing activity 14.0 percent higher than
Q4 2012
6
0 10,000,000 20,000,000 30,000,000 40,000,000 50,000,000 60,000,000 70,000,000 80,000,000 90,000,000
Q4 2007
Q4 2008
Q4 2009
Q4 2010
Q4 2011
Q4 2012
Q4 2013
Leasing activity (s.f.)
Source: Jones Lang LaSalle Research

Annual leasing activity 6.5 percent higher in 2013 than in
2012, but third-highest during recovery
7
0
50,000,000
100,000,000
150,000,000
200,000,000
250,000,000
300,000,000
2007 2008 2009 2010 2011 2012 2013
Leas
ing
activ
ity (
s.f.)
Source: Jones Lang LaSalle Research

A wide range of geographies leasing fastest relative
to supply
8
0.0%
0.5%
1.0%
1.5%
2.0%
2.5%
3.0%
New York San Francisco San FranciscoPeninsula
Minneapolis Boston Silicon Valley Fairfield County St. Louis
Leas
ing
activ
ity a
s pe
rcen
tage
of i
nven
tory
Source: Jones Lang LaSalle Research

Q4 marks 15th consecutive quarter of positive net
absorption, highest since 2007
9
-1.0%
-0.5%
0.0%
0.5%
1.0%
1.5%
2008 2009 2010 2011 2012 2013
Qua
rterly
net
abs
orpt
ion
(as
% o
f inv
ento
ry) 15-year trailing quarterly average
Source: Jones Lang LaSalle Research

-4.0%
-3.0%
-2.0%
-1.0%
0.0%
1.0%
2.0%
3.0%
4.0%
5.0%
1999 2000 2001 2002 2003 2004 2005 2006 2007 2008 2009 2010 2011 2012 2013
Net absorption as a percent of inventory
2013 annual net absorption reaches 1.1 percent of
inventory, surpasses 15-year average
15-year trailing annual average
10
Source: Jones Lang LaSalle Research

-10,000,000
0
10,000,000
20,000,000
30,000,000
40,000,000
50,000,000
2010 2011 2012 2013
YTD
ne
t ab
sorp
tion
(s.f.
)
Class A (CBD) Class A (suburban) Class B (CBD)
Class B (suburban) Class C (CBD) Class C (suburban)
Source: Jones Lang LaSalle Research
Suburban Class A space comprises the majority of
absorption, with Class B presence growing
11

Geographic spread of the recovery and growth in New
York make 2013 the most balanced year of the recovery
12
2010
2011
2012
11.1%
21.6%
22.3%
18.6%
26.4%
2013
NYC and DC
Tech markets
Energy markets
Sunbelt
All other markets
2010: New York and DC comprise 70.0 percent of
absorption.
2011: Tech and energy emerge, comprising 52.5
percent of absorption; New York and DC fall to 5.1
percent.
2012: Sunbelt markets grow to over one-third of
absorption, but tech and energy remain dominant
(58.2 percent of 2012 absorption); New York and
DC both post negative annual absorption.
2013: No sector or region contributes more than
one quarter of annual absorption, all others
contribute 26.4 percent.
Source: Jones Lang LaSalle Research

Energy, tech and Sunbelt markets all posting above-
average absorption; energy and tech remain ahead
13
0.0%
0.5%
1.0%
1.5%
2.0%
2.5%
3.0%
3.5%
YT
D n
et a
bsor
ptio
n (%
of s
tock
)
Energy markets Tech markets Sunbelt markets
U.S. average
Source: Jones Lang LaSalle Research

New York’s strong Q4 performance makes East Coast
largest contributor for the first time since Q2 2011
14
-100%
-80%
-60%
-40%
-20%
0%
20%
40%
60%
80%
100%
2010 2011 2012 2013
Sha
re o
f qua
rterly
abs
orpt
ion
(%)
East Coast Central West Coast
Source: Jones Lang LaSalle Research

15
Although a tiny portion of inventory, Atlanta and
Florida contributing disproportionately to recovery
-10,000,000
-5,000,000
0
5,000,000
10,000,000
15,000,000
20,000,000
2010 2011 2012 2013
Ne
t ab
sorp
tion
(s.f.
)
Atlanta Florida Rest of East Coast
7.4% 22.9% 1,261.6% 63.3%

$28
$29
$30
$31
$32
$33
$34
$35
$36
-0.6%
-0.4%
-0.2%
0.0%
0.2%
0.4%
0.6%
0.8%
2010 2011 2012 2013
Cla
ss A
ave
rage
ask
ing
rent
($ p
.s.f.
)
Cla
ss B
YT
D n
et a
bsor
ptio
n (a
s %
of s
tock
)
Class B net absorption Class A rent
Source: Jones Lang LaSalle Research
Class B absorption has risen in line with Class A rents
as tenants seek affordable space options…
16

…but Class A remains the leader in absorption since 2011
Trophy & Class A net
absorption
83.4 m.s.f.
2011-2013
Class B and C net
absorption
18.4 m.s.f.
2011-2013
17
Source: Jones Lang LaSalle Research

…with 80.9 of Q4 absorption being Class A space
Source: Jones Lang LaSalle
18
133.5%
93.9%
74.5% 76.3%
295.2%
98.5%
82.0% 78.3%
45.2%
73.4%63.5%
80.9%
0%
50%
100%
150%
200%
250%
300%
350%
2011 2012 2013
Cla
ss A
sha
re o
f qua
rterly
abs
orpt
ion
Source: Jones Lang LaSalle Research

Even in large block-deprived CBDs, Class A space
responsible for nearly all absorption…
19
166.2%
90.4% 88.8%
80.8%
100.0%106.1%
74.8%
0.0%
88.1% 86.5%
49.6%
92.0%
0%
20%
40%
60%
80%
100%
120%
140%
160%
180%
2011 2012 2013
Cla
ss A
sha
re o
f qua
rterly
abs
orpt
ion
Source: Jones Lang LaSalle Research

116.9%
97.9%
62.3%
75.1%
167.8%
102.5%
84.3% 85.3%
43.2%
73.4% 72.8% 70.3%
0%
20%
40%
60%
80%
100%
120%
140%
160%
180%
2011 2012 2013
Cla
ss A
sha
re o
f qua
rterly
abs
orpt
ion
…while the percentage has slowly fallen in the suburbs
20
Source: Jones Lang LaSalle Research

Driving the B market of late? Creative space in
tech hubs
-0.7%-0.5%
1.9%
1.0%
5.4%
0.3%
4.9%
3.4%
3.0%
2.1% 2.0%
0.7%
-2.0%
-1.0%
0.0%
1.0%
2.0%
3.0%
4.0%
5.0%
6.0%
Austin Portland Detroit San Francisco Seattle Oakland-East Bay
CB
D y
ear-
end
net a
bsor
ptio
n (%
of s
tock
)
Class A Class B
21
Source: Jones Lang LaSalle Research

of absorbed space in 2013
has been Class A
per square foot difference
between Class A and B space…
the rate at which Class A rates are
growing compared to Class B
difference between Class A and
Class B total vacancy
Overall, Class A continues to trump commodity
according to most indicators
22
Source: Jones Lang LaSalle Research

Total vacancy still falling very slowly, but levels now
the lowest since before 2009
10%
11%
12%
13%
14%
15%
16%
17%
18%
19%
20%
Q1
20
09
Q2
20
09
Q3
20
09
Q4
20
09
Q1
20
10
Q2
20
10
Q3
20
10
Q4
20
10
Q1
20
11
Q2
20
11
Q3
20
11
Q4
20
11
Q1
20
12
Q2
20
12
Q3
20
12
Q4
20
12
Q1
20
13
Q2
20
13
Q3
20
13
Q4
20
10
16.6%
23
Source: Jones Lang LaSalle Research

Still, vacancy levels remain near historical highs
6%
8%
10%
12%
14%
16%
18%
20%
19
90
19
91
19
92
19
93
19
94
19
95
19
96
19
97
19
98
19
99
20
00
20
01
20
02
20
03
20
04
20
05
20
06
20
07
20
08
20
09
20
10
20
11
20
12
20
13
16.6%
24
Source: Jones Lang LaSalle Research

10%
12%
14%
16%
18%
20%
22%
2010 2011 2012 2013
Tot
al va
canc
y (%
)
Class A (CBD) Class A (suburban) Class B (CBD) Class B (suburban) Class C (CBD) Class C (suburban)
B
A
C
Source: Jones Lang LaSalle Research
Total vacancy down across building classes and
geographies, but with significant variance
25

Office growth being driven by atypical tenant
industries
Industry Employment base Most affected office markets to date State Government Contracting California, Illinois, New Jersey
Federal Government Contracting Washington, DC
Media-print Contracting LA, NYC
Finance / banking Contracting NYC, Charlotte, Chicago, Palm Beach, Pittsburgh
Law firms Contracting (Rightsizing) Washington, DC, NYC, SF, Atlanta, LA
Consulting Contracting (Rightsizing) NYC, Chicago, Washington, DC
Accounting Contracting (Rightsizing) Chicago, NYC, LA
Telecom Stable NJ, Dallas, Atlanta
Retail / consumer goods Stable NYC, Atlanta, Los Angeles
Education Growing Everywhere
Media digital and TV Growing Atlanta, NYC, LA, Philadelphia, Washington, DC
Green energy / clean technology Growing Pittsburgh, Silicon Valley, Denver
Real estate (Residential) Growing Southern CA, Nevada, AZ, FL, GA, Carolinas
Technology Growing Silicon Valley, San Francisco, Austin, Seattle, Portland, Midtown South NYC, Cambridge, MA
Natural Gas / Oil Energy Growing Denver, Houston, Dallas, Pittsburgh
Biotech / pharmaceutical Growing San Francisco, San Diego, NJ/Phil, Boston, RDU
26
Source: Jones Lang LaSalle Research

27
Demographics and technology are driving productivity
and utilization and the next evolution of office space
use
15%
Space reduction
by U.S. law firms
and financial
services relocating
72%
Of global CREs plan
to aggressively
increase density in
next 3 years
150
SF/employee
average target
density, down from
225 in 2009
50%
Of the U.S.
workforce was
baby boomers in
2010. Gen Y will
be 50% by 2020
Source: Jones Lang LaSalle Research

28
And as a result, law firms are shifting
Source: Jones Lang LaSalle Research
15.2% Giveback by law firm
across the U.S. when
relocating
20.5% Giveback by law firm
across the top 7 U.S. markets
when relocating
24.7% Giveback by law firm
across DC when
relocating
• Going digital
• Elimination of law libraries
• One-sized fits all office
• Higher administrative ratios
• Migration to glass boxes
• Migration to long and lean
• Migration to smaller floorplates
29
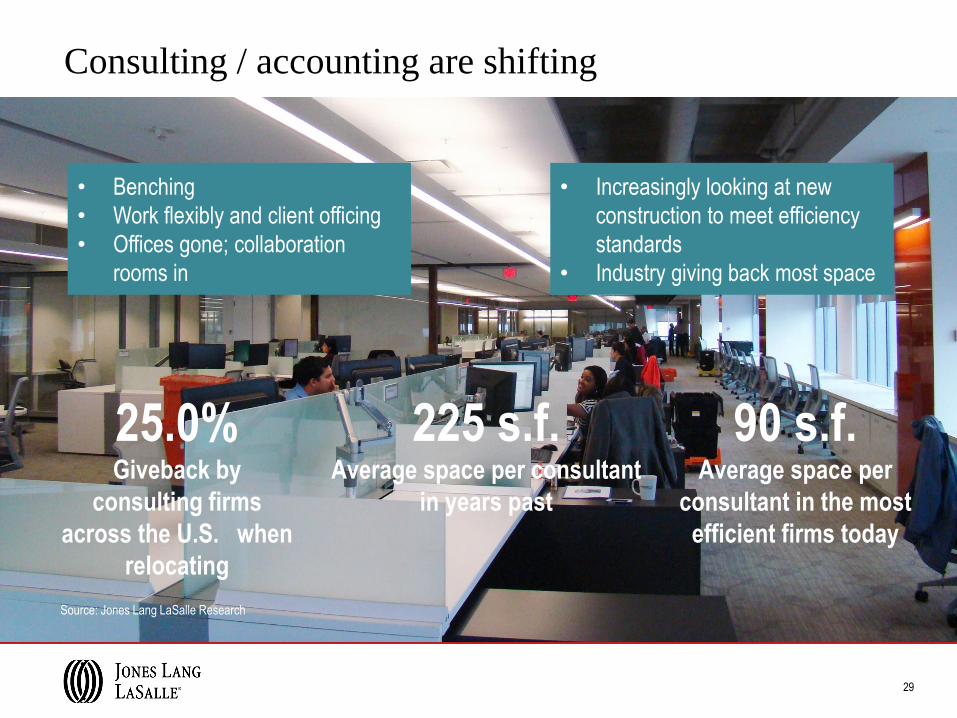
Consulting / accounting are shifting
Source: Jones Lang LaSalle Research
25.0% Giveback by
consulting firms
across the U.S. when
relocating
225 s.f. Average space per consultant
in years past
90 s.f. Average space per
consultant in the most
efficient firms today
• Benching
• Work flexibly and client officing
• Offices gone; collaboration
rooms in
• Increasingly looking at new
construction to meet efficiency
standards
• Industry giving back most space

30
Technology companies are shifting
Source: Jones Lang LaSalle Research
17.4% Percent increase in
high tech service jobs
since 2009
14.2% Vacancy rate in core tech
markets, compared to
16.8% nationwide
11.2% Growth in core tech
market rents in 2013
• Benching is standard
• Less personal space, more
shared and amenity space
• “Open Hangar” design preferred
• Migration to Class B+ with
character
• Space viewed as core to culture
• Remote work is waning

31
Banks are shifting
Source: Jones Lang LaSalle Research
86% Percent of banking
transactions that no
longer need a teller
66% Percent of surveyed
banks planning to
reduce their RE
footprint
• Regulation and cost pressures
forcing portfolio consolidation
• Offices shrinking
• Business units competing
• Branch reductions common
• Increasing importance of back
office (2nd / 3rd –tier markets)
• Remote working increasing
10.1% Giveback by average
bank across the U.S.
when renewing (with
headcount flat)

32
Even the federal government is shifting
Source: GSA.gov, Jones Lang LaSalle Research
• Telecommuting
• Benching
• Collocations
• Minimal funds to implement
• Consolidations in low cost
buildings/submarkets
• Migration to off-center locations
• Disposition of underutilized assets.
170 s.f. Target utilization rate
per employee for
federally leased space
$1.7 billion Amount spent annually by
GSA for properties deemed
underutilized
15.9% Average giveback by
GSA across Metro DC
when relocating in FY
2013

After a slowdown earlier in the year, faster office-using
employment growth pushes down vacancy
15.5%
16.0%
16.5%
17.0%
17.5%
18.0%
18.5%
19.0%
26,500
27,000
27,500
28,000
28,500
29,000
29,50020
11
2012
2013
Tota
l vac
ancy
Offi
ce-u
sing
em
plo
yees
(tho
usan
ds)
Office-using employment Total vacancy
33
Source: Jones Lang LaSalle Research

5%
7%
9%
11%
13%
15%
17%
19%
21%
23%
25%
Tot
al va
canc
y (%
)CBD vacancy drops 30 basis points to 13.9 percent;
suburban down 10 basis points to 18.2 percent
34
Source: Jones Lang LaSalle Research

0
10,000,000
20,000,000
30,000,000
40,000,000
50,000,000
60,000,000
70,000,000
80,000,000
90,000,000
100,000,000
Q2 20
07
Q3 20
08
Q4 20
08
Q1 20
09
Q2 20
09
Q3 20
09
Q4 20
09
Q1 20
10
Q2 20
10
Q3 20
10
Q4 20
10
Q1 20
11
Q2 20
11
Q3 20
11
Q4 20
11
Q1 20
12
Q2 20
12
Q3 20
12
Q4 20
12
Q1 20
13
Q2 20
13
Q3 20
13
Q4 20
13
Sub
leas
e sp
ace
(s.f.
)
Sublease space falls once again to 54.4 million square
feet, nearing recovery low
35
Source: Jones Lang LaSalle Research

36
-6.0%
-4.0%
-2.0%
0.0%
2.0%
4.0%
6.0%
Q2
2007
Q3
2007
Q4
2007
Q1
2008
Q2
2008
Q3
2008
Q4
2008
Q1
2009
Q2
2009
Q3
2009
Q4
2009
Q1
2010
Q2
2010
Q3
2010
Q4
2010
Q1
2011
Q2
2011
Q3
2011
Q4
2011
Q1
2012
Q2
2012
Q3
2012
Q4
2012
Q1
2013
Q2
2013
Q3
2013
Q4
2013
Qua
rter
ly p
erce
nt c
hang
e
Marketed rents increase 0.4 percent during the quarter,
registering their 12th straight quarter of increases
Source: Jones Lang LaSalle Research

$10
$15
$20
$25
$30
$35
$40
$45
$50
2010 2011 2012 2013
Aver
age
aski
ng re
nt (
$ p.
s.f.)
Class A (CBD) Class A (suburban) Class B (CBD) Class B (suburban) Class C (CBD) Class C (suburban)
A
B C
Source: Jones Lang LaSalle Research
Rental growth fastest in CBD Class A (+15.3 percent)
and suburban Class C (+7.3 percent) space
37

Peaking
phase
Falling
phase
Rising
phase
Bottoming
phase
U.S. office market moves farther along the clock as
more markets shift into landlord-favorable territory
Miami, San Diego
Austin
Dallas
Cleveland, Cincinnati,
Minneapolis, Oakland-East Bay,
Philadelphia, Portland, San Antonio
Houston, San Francisco
Tampa, United States
Charlotte, Detroit, Fairfield County, Milwaukee,
Sacramento, St. Louis, Westchester County
Orlando, West Palm Beach
Fort Lauderdale, Jacksonville
Washington, DC
Baltimore, New Jersey
Chicago, Columbus, Hampton Roads,
Phoenix, Raleigh-Durham
Atlanta, Indianapolis, Los Angeles,
New York, Richmond
Seattle-Bellevue
San Francisco Peninsula, Silicon Valley
Denver
Boston, Orange County
Pittsburgh
Source: Jones Lang LaSalle Research
38

Peaking
phase
Falling
phase
Rising
phase
Bottoming
phase
Faster rent growth and declining vacancy in CBDs
contributing to faster movement along clock
Miami
Austin, Houston
Charlotte, Dallas, Jacksonville, Milwaukee,
Raleigh-Durham, San Antonio
Atlanta, Tampa, United States CBD
Cleveland, Cincinnati, Detroit, Los Angeles,
Minneapolis, White Plains CBD
Greenwich CBD, Indianapolis
Midtown (New York),
Portland, Stamford CBD Baltimore, Orlando, Phoenix,
West Palm Beach
Chicago, Columbus, Downtown
(New York), Fort Lauderdale,
Richmond, San Diego. Washington, DC
Midtown South (New York)
San Francisco
Seattle-Bellevue
Pittsburgh, San Jose CBD
Denver
Oakland-East Bay
Boston, Philadelphia
Sacramento
St. Louis
Source: Jones Lang LaSalle Research
39

Peaking
phase
Falling
phase
Rising
phase
Bottoming
phase
Suburban markets still struggling with elevated
vacancy, with more submarkets tenant-friendly
Miami, Central and Northern New
Jersey, Northern Virginia
Austin, Pittsburgh
Dallas, Houston, San Francisco
Atlanta, Cleveland, Cincinnati, Milwaukee,
Minneapolis, Oakland- East Bay,
Sacramento, San Antonio, St. Louis
Indianapolis, Orange County, Tampa
Chicago, Columbus, Detroit, Fairfield
County, Hampton Roads, Portland
(East, Vancouver), Westchester County
Orlando, West Palm Beach
Northern Delaware, Raleigh-Durham,
Suburban Maryland
Fort Lauderdale
Baltimore, Boston, Lehigh Valley, Philadelphia,
San Diego, United States Suburbs
Charlotte
Seattle-Bellevue
Silicon Valley
Denver, Richmond
Los Angeles, Portland (Westside) Southern New Jersey
Cambridge
San Francisco Peninsula
Jacksonville
Source: Jones Lang LaSalle Research
40

Since 2010, quarterly rent growth more volatile in
CBD than suburbs, but faster on average
-3.5%
-2.5%
-1.5%
-0.5%
0.5%
1.5%
2.5%
3.5%
Q3 2010 Q4 2010 Q1 2011 Q2 2011 Q3 2011 Q4 2011 Q1 2012 Q2 2012 Q3 2012 Q4 2012 Q1 2013 Q2 2013 Q3 2013 Q4 2013
Qua
rterly
rent
cha
nge
(%)
CBD rent growth Suburban rent growth
CBD average:
1.1%
Suburban
average: 0.0%
41
Source: Jones Lang LaSalle Research

Slightly faster rental growth in suburbs results in rent
gap narrowing by $0.12 in Q4
$20
$22
$24
$26
$28
$30
$32
$34
$36
$38
$40
2010 2011 2012 2013
CBD Suburbs
$11.36
$15.48
42
Source: Jones Lang LaSalle Research

Similar rental growth rates resulted in the Class A
premium falling slightly for the second time in 2013
$3.00
$3.20
$3.40
$3.60
$3.80
$4.00
$4.20
$4.40
$4.60
$4.80
$5.00
2010 2011 2012 2013
Diff
eren
ce b
etw
een
Cla
ss A
and
ove
rall
rent
s
43
Source: Jones Lang LaSalle Research

3.5
4.1
5.1
6.16.2
5.7 5.55.3
$22.00
$23.00
$24.00
$25.00
$26.00
$27.00
$28.00
$29.00
$30.00
$31.00
0
1
2
3
4
5
6
7
2006 2007 2008 2009 2010 2011 2012 2013
Average rent abatement (months) Average tenant improvement allowanceMonths $ PSF
Concessions wobbling near end of 2013, but overall
decline in TI allowances and free months vs. 2012
44
Source: Jones Lang LaSalle Research

As vacancy falls, so does leverage for tenants and tenant
build-out allowances from landlords
15.5%
16.0%
16.5%
17.0%
17.5%
18.0%
18.5%
19.0%
$25
$26
$27
$28
$29
$30
$31
2009 2010 2011 2012 2013
Tot
al va
canc
y
Ave
rage
TI p
acka
ge
Average TI package Total vacancy
45
Source: Jones Lang LaSalle Research

0
20,000,000
40,000,000
60,000,000
80,000,000
100,000,000
120,000,000
140,000,000
2000 2001 2002 2003 2004 2005 2006 2007 2008 2009 2010 2011 2012 2013
New supply coming to market slowly increasing, but
still well below historic norms
Com
plet
ions
(s.
f.)
Historical average
amount of completions
(s.f.) per year
46
Source: Jones Lang LaSalle Research

0%
10%
20%
30%
40%
50%
60%
70%
80%
90%
100%
2010 2011 2012 2013
Und
er c
onst
ruct
ion
(s.f.
)
Class A (CBD) Class A (suburban) Class B (CBD) Class B (suburban) Class C (CBD) Class C (suburban)
Source: Jones Lang LaSalle Research
The majority of new construction is now in suburbs
rather than CBDs
47

0
20,000,000
40,000,000
60,000,000
80,000,000
100,000,000
120,000,000
140,000,000
160,000,000
2000 2001 2002 2003 2004 2005 2006 2007 2008 2009 2010 2011 2012 2013
Deliveries in Q4 bring overall construction volumes
down slightly, but geographic spread increasing
Und
er c
onst
ruct
ion
(s.f.
)
Spec construction underway
in many markets, including:
Atlanta
Charlotte
Dallas
Houston
New York
Northern Virginia
Seattle
San Francisco
Silicon Valley
Washington, DC
48
Source: Jones Lang LaSalle Research

0
5,000,000
10,000,000
15,000,000
20,000,000
25,000,000
2010 2011 2012 2013
YTD
com
plet
ions
(s.f.
)
Class A (CBD) Class A (suburban)
Class B (CBD) Class B (suburban)
Class C (CBD) Class C (suburban)
Source: Jones Lang LaSalle Research
The vast majority of new completions are Class A, with
an increasing share in the suburbs
49

27.7 percent of markets reporting an increase in
construction starts…
50
0%
10%
20%
30%
40%
50%
60%
70%
80%
90%
100%
2011 2012 2013
Up Neutral Down
Source: Jones Lang LaSalle Research

…and no specific region was home to a majority of
starts
802,500
645,000
465,001
423,331
360,000 358,934
321,000 309,500 300,425
231,733 220,000
168,220
126,652
49,099
0
100,000
200,000
300,000
400,000
500,000
600,000
700,000
800,000
900,000
Con
stru
ctio
n st
arts
(s.f.
)
51
Source: Jones Lang LaSalle Research

Into 2014 and 2015, the spreading and enhancement of growth
nationally across industries and geographies highly benefits diversified
economies like Dallas, Chicago, Los Angeles, Philadelphia, Atlanta,
Phoenix, among others.
…

>> Access our complete report on the current state of the U.S. market
©2014 Jones Lang LaSalle IP,
Inc. All rights reserved. All
information contained herein is
from sources deemed reliable;
however, no representation or
warranty is made to the
accuracy thereof.