u.s. & new mexico data maps · the poverty rate is the ra˜o of the number of people (in a...
TRANSCRIPT

U.S. & NEW MEXICO DATA MAPS
Section 2A
This section provides information and statistics across a range of demographic, health, and socioeconomic indicators. U.S. maps are broken out by state, and New Mexico maps are presented at county-level. A text box on the bottom right of each table provides information important for correct interpretation of the table. In many tables, details will not add exactly to the totals and subtotals shown because of rounding.
U.S. & NEW MEXICO DATA

#Page Map Name Numerator Denominator Descrip�on
12 U.S. Resident Popula�on by State as of July 2018 Number or residents N/A13 Resident Popula�on by County as of July 2018 Number or residents N/A
14 Resident Popula�on as a Percentage of Total by County as of July 2018 Resident Popula�on in County Resident Popula�on in State
15Na�ve American Resident Popula�on by County as of July 2018
Number or residents who are Na�ve American N/A
16Children (0-4 Years) Resident Popula�on by County as of July 2018
Number or residents who are children (0-4) years N/A
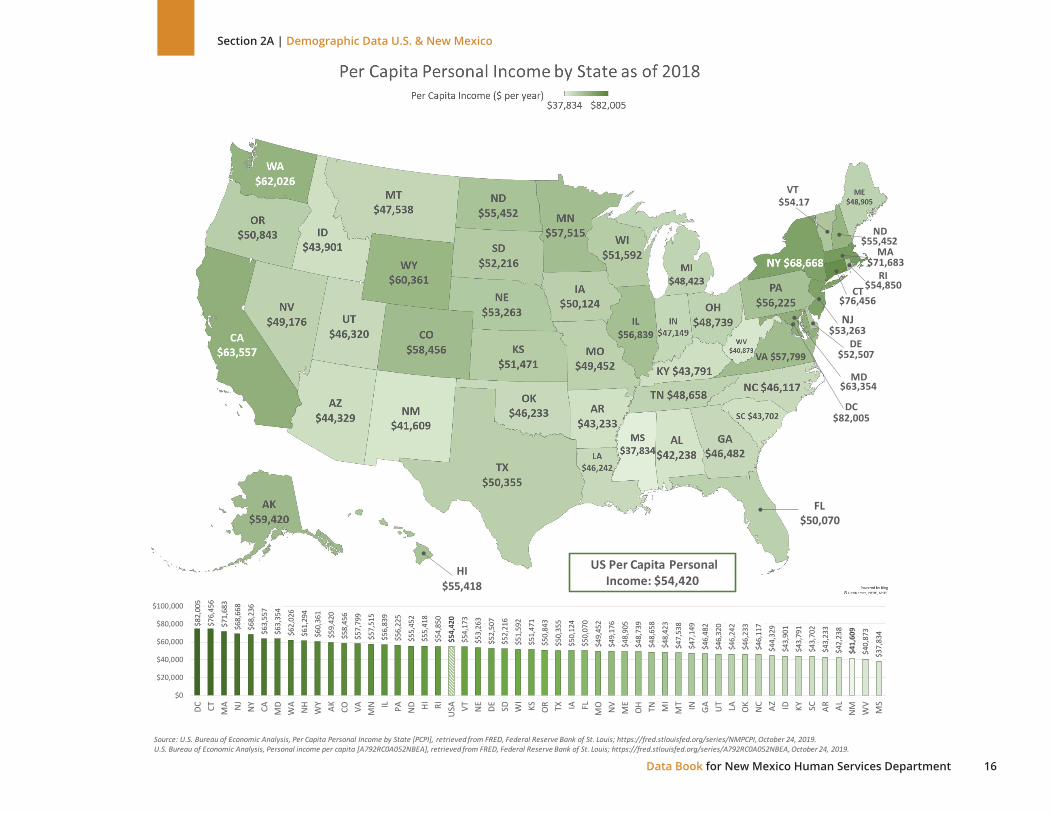
17 Per Capita Personal Income by State as of 2018 Personal Income in State Resident Popula�on in State
18 Per Capita Personal Income by County as of 2018 Personal Income in County Resident Popula�on in County
19 Percent Change in Per Capita Personal Income by County 2017-2018 N/A N/A
20 Real Median Household Income by State as of 2018 N/A N/A
21 Median Household Income by County as of 2017 N/A N/A
22 Living Wage: Single Adult, No Children as of 2018 Living Wage: Single Adult, No Children N/A
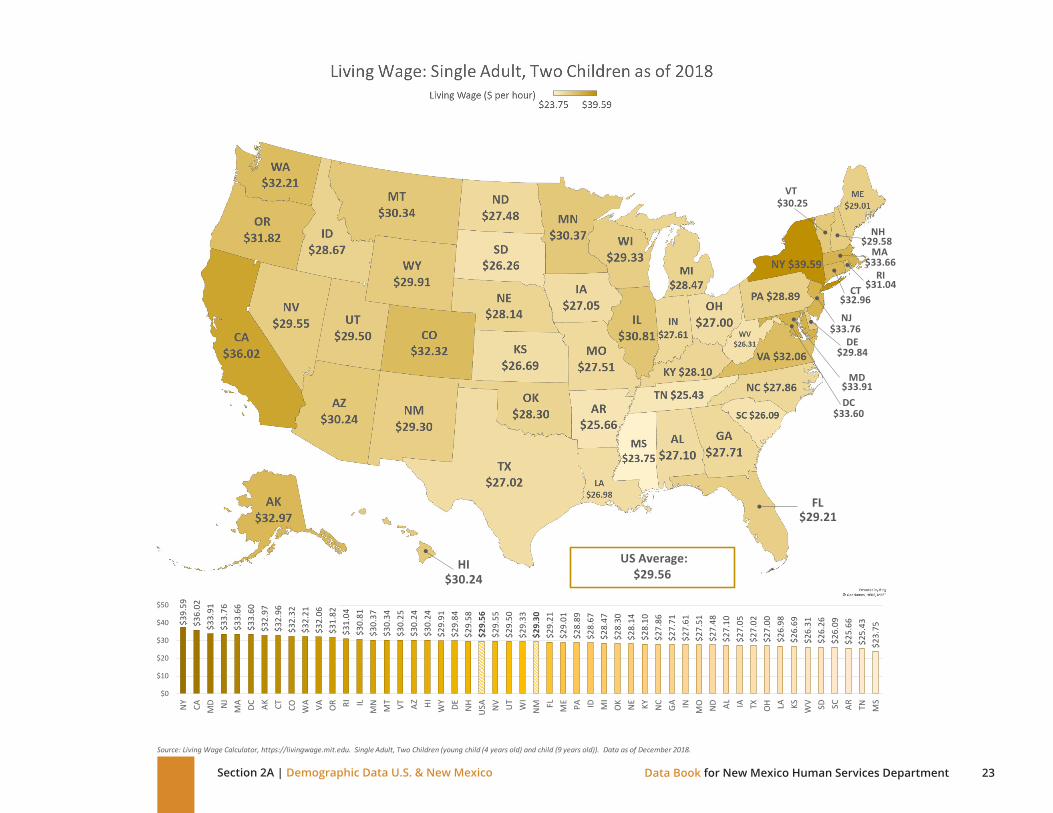
23 Living Wage: Single Adult, No Children as of 2018 Living Wage: Single Adult, No Children N/A24 Living Wage: Single Adult, Two Children as of 2018 Living Wage: Single Adult, Two Children N/A
25 Living Wage: Single Adult, Two Children as of 2018 Living Wage: Single Adult, Two Children N/A
26 Living Wage: Two Adults, Two Children as of 2018 Living Wage: Two Adults, Two Children N/A
27 Living Wage: Two Adults, Two Children as of 2018 Living Wage: Two Adults, Two Children N/A
28Single Parent Household with Children as a Percentage of Households with Children by State as of 2017
Number of Single Parent Households with Children in State Number of Households with Children in State
29Single Parent Households with Children as a Percentage of Households with Children by County as of 2017
Number of Single Parent Households with Children in County Number of Households with Children in County
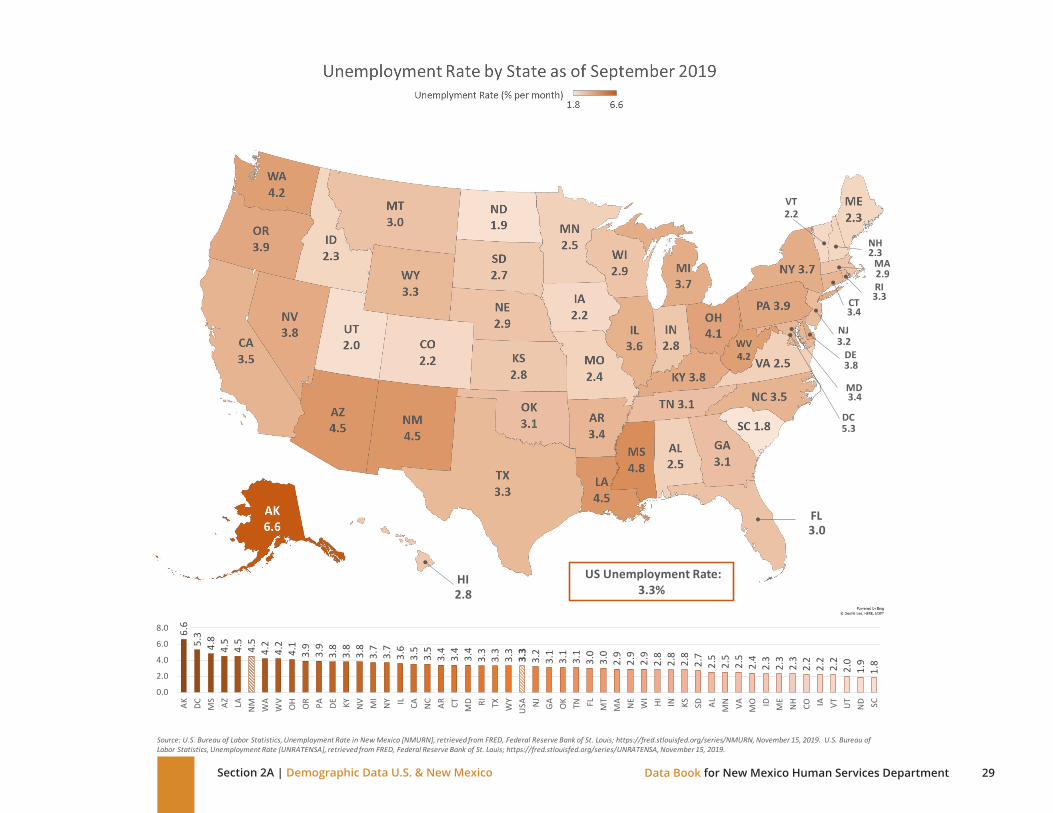
30 Unemployment Rate by State as of September 2019 Number of Unemployed Persons in State Labor Force in State
31 Unemployment Rate by County as of September 2019 Number of Unemployed Persons in County Labor Force in County
32 Poverty Rate by State as of 2017 Number of Persons Living Below the Poverty Level in State Resident Popula�on in State
33 Poverty Rate by County as of 2017Number of Persons Living Below the Poverty Level in County Resident Popula�on in County
34 Poverty Rate of Minors (Under 18 Years) by State as of 2017Number of Minors (Under 18 Years) Living Below the Poverty Level in State
Resident Popula�on of Minors (Under 18 Years) in State
35Poverty Rate of Minors (Under 18 Years) by County as of 2017
Number of Minors (Under 18 Years) Living Below the Poverty Level in County
Resident Popula�on of Minors (Under 18 Years) in County
36Children (0-4 Years) Living in Poverty in New Mexico as of 2017
Number of Children (0-4 Years) Living Below the Poverty Level N/A
37 Poverty Rate of Children (0-4 Years) by County as of 2017Number of Children (0-4 Years) Living Below the Poverty Level in County
Resident Popula�on of Children (0-4 Years) in County
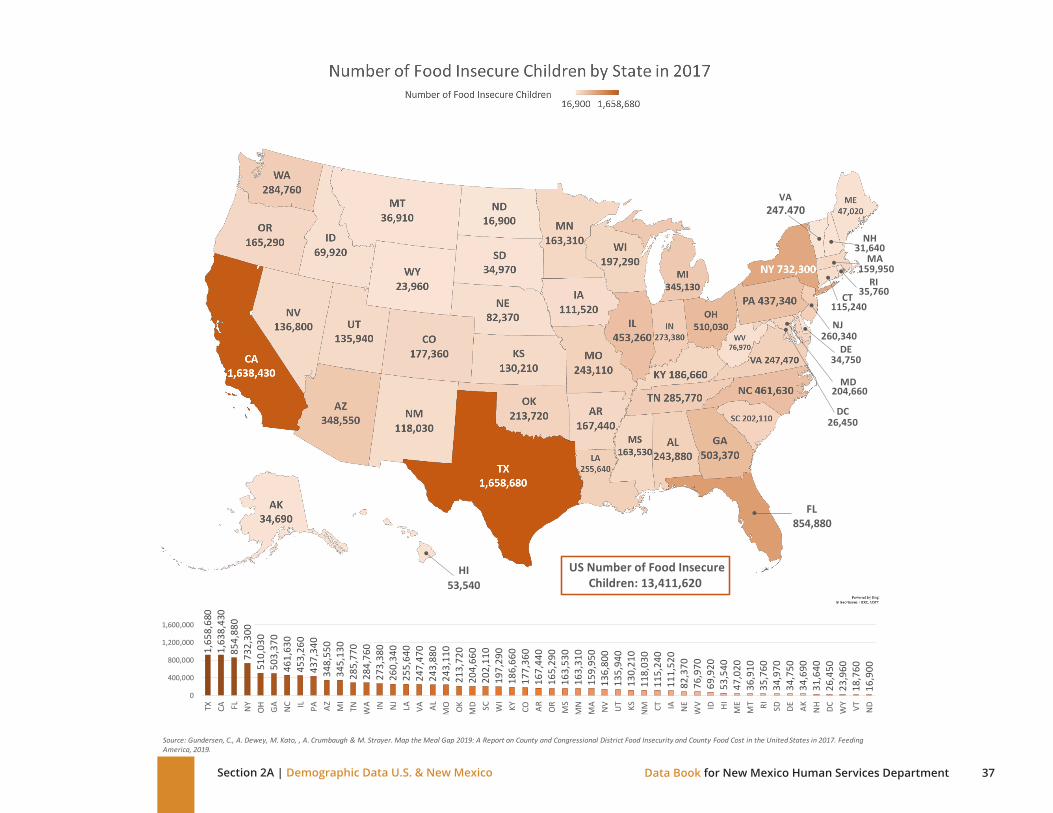
38 Number of Food Insecure Children by State in 2017 Number of children who are food insecure N/A
39 Number of Food Insecure Children by County as of 2017 Number of children who are food insecure N/A
40 Child Food Insecurity Rate by State as of 2017 Number of Food Insecure Children in State Resident Popula�on of Children in State
41 Child Food Insecurity Rate by County as of 2017 Number of Food Insecure Children in County Resident Popula�on of Children in County
42 Drug Overdose Deaths by County, 2016-2018 Number of Drug Overdose Deaths 100,000 Persons
43 Suicide Deaths by County, 2013-2017 Number of Deaths by Suicide 100,000 Persons
Demographic Data U.S. and New Mexico
Income that people get from wages and salaries, Social Security and other government benefits, dividends and interest, business ownership, and other sources. These sta�s�cs can offer clues to Americans' financial health and future consumer spending. Per capita personal income is total personal income divided by the number of residents in a specific geographic area.
The real median income splits the income distribu�on into two halves – half the households earn less than the median and half the households earn more. The median is not affected by extreme highs and lows in reported incomes.
Living wage is an alterna�ve measure of basic needs, drawing upon geographically specific expenditure data related to an individual's/family’s likely minimum food, childcare, health insurance, housing, transporta�on, and other basic necessi�es (clothing, personal care items) costs. Lliving wage draws on these cost elements and the rough effects of income and payroll taxes to determine the minimum employment earnings necessary to meet basic needs while also maintaining self-sufficiency.
The unemployment rate represents the number of unemployed people as a percentage of the labor force (the labor force is the sum of the employed and unemployed who are seeking employment). I does not include those not seeking employment.
The poverty rate is the ra�o of the number of people (in a given age group) whose income falls below the poverty line; taken as half the median household income of the total popula�on.
U.S. Department of Agriculture defines food insecurity as a lack of consistent access to enough food for an ac�ve, healthy life.
Section 2A | Demographic Data U.S. & New Mexico
10Data Book for New Mexico Human Services Department
Provide information and statistics across a range of demographic, health, and socioeconomic indicators for the U.S. and New Mexico. U.S. maps are broken out by state and New Mexico maps are presented at county-level. A text box on the bottom right of each table provides information important for correct interpretation of the table.
EXPLANATION OF KEY TERMS FOR MAPS

39,5
57.0
28,7
01.8
21,2
99.3
19,5
42.2
12,8
07.1
12,7
41.1
11,6
89.4
10,5
19.5
10,3
83.6
9,99
5.9
8,90
8.5
8,51
7.7
7,53
5.6
7,17
1.6
6,90
2.1
6,77
0.0
6,69
1.9
6,12
6.5
6,04
2.7
5,81
3.6
5,69
5.6
5,61
1.2
5,08
4.1
4,88
7.9
4,66
0.0
4,46
8.4
4,19
0.7
3,94
3.1
3,57
2.7
3,16
1.1
3,15
6.1
3,03
4.4
3,01
3.8
2,98
6.5
2,91
1.5
2,09
5.4
1,92
9.3
1,80
5.8
1,75
4.2
1,42
0.5
1,35
6.5
1,33
8.4
1,06
2.3
1,05
7.3
967.
288
2.2
760.
173
7.4
702.
562
6.3
577.
7
0.0
10,000.0
20,000.0
30,000.0
40,000.0
CA TX FL NY PA IL OH GA NC MI
NJ
VA WA AZ MA TN IN MO
MD WI
CO MN SC AL LA KY OR OK CT UT IA NV AR MS KS N
M NE
WV ID HI
NH
ME
MT RI DE SD ND AK DC VT WY
Source: U.S. Census Bureau, Population Division, Annual Estimates of the Resident Population: April 1, 2010 to July 1, 2018. Retreived from US Census Amercian Fact Finder; https://factfinder.census.gov/faces/nav/jsf/pages/community_facts.xhtml, November 18, 2019.
HI1,420.5
VT626.3
NH1,356.5
MA6,902.1
RI1,057.3CT
3,572.7
NJ8,908.5
MD6,042.7
DC702.5
DE967.2
FL21,299.3
US Resident Population:327,167,434
11Data Book for New Mexico Human Services DepartmentSection 2A | Demographic Data U.S. & New Mexico

6551,7813,5784,1184,2404,3414,5068,25310,96812,11015,59116,73518,74319,10119,55623,96326,74627,34627,59132,83539,00649,43757,90064,68966,78169,61172,29076,456
125,043145,179150,056
217,522678,701
0 250,000 500,000 750,000
HARDINGDE BACACATRON
UNIONHIDALGO
GUADALUPEMORAQUAY
SIERRACOLFAX
TORRANCESOCORRO
ROOSEVELTLOS ALAMOS
LINCOLNLUNA
CIBOLAGRANT
SAN MIGUELTAOS
RIO ARRIBACURRY
EDDYCHAVESOTERO
LEAMCKINLEYVALENCIASAN JUAN
SANDOVALSANTA FE
DOÑA ANABERNALILLO
New Mexico Resident Population: 2,095,428
Source: U.S. Census Bureau, Population Division, Annual Estimates of the Resident Population: April 1, 2010 to July 1, 2018. Retreived from US Census Amercian Fact Finder; https://factfinder.census.gov/faces/nav/jsf/pages/community_facts.xhtml, November 17, 2019.
Los Alamos19,101
Section 2A | Demographic Data U.S. & New Mexico
12Data Book for New Mexico Human Services Department

0.030.090.170.200.200.210.220.390.520.580.740.800.890.910.931.11.31.31.31.61.92.42.83.13.23.33.53.6
6.06.97.2
10.432.4
0.0 10.0 20.0 30.0
HARDINGDE BACACATRON
UNIONHIDALGO
GUADALUPEMORAQUAY
SIERRACOLFAX
TORRANCESOCORRO
ROOSEVELTLOS ALAMOS
LINCOLNLUNA
CIBOLAGRANT
SAN MIGUELTAOS
RIO ARRIBACURRY
EDDYCHAVESOTERO
LEAMCKINLEYVALENCIASAN JUAN
SANDOVALSANTA FE
DOÑA ANABERNALILLO
New Mexico Resident Population: 2,095,428
Source: U.S. Census Bureau, Population Division, Annual Estimates of the Resident Population: April 1, 2010 to July 1, 2018. Retreived from US Census Amercian Fact Finder; https://factfinder.census.gov/faces/nav/jsf/pages/community_facts.xhtml, November 17, 2019.
Los Alamos0.91
13Data Book for New Mexico Human Services DepartmentSection 2A | Demographic Data U.S. & New Mexico

1436551351361401482232483293394125516556848418831,0381,3901,3921,4882,4432,4634,7405,2215,6766,3027,528
11,71520,325
42,07951,393
57,254
0 20,000 40,000 60,000 80,000
HARDINGDE BACAHIDALGO
MORACATRON
UNIONGUADALUPE
QUAYLOS ALAMOS
SIERRACOLFAX
ROOSEVELTLUNA
TORRANCEGRANT
LINCOLNSAN MIGUEL
CURRYEDDY
LEACHAVES
SOCORROTAOS
VALENCIADOÑA ANA
OTEROSANTA FE
RIO ARRIBACIBOLA
SANDOVALBERNALILLO
SAN JUANMCKINLEY
New Mexico Native Amercian Population: 228,276
Source: U.S. Census Bureau, Population Estimates Program (PEP), Population and Housing Unit Estimates; U.S. Census Bureau, American Community Survey (ACS). Vintage 2018 Population Estimates Program. Estimates are not comparable to other geographic levels due to methodology differences that may exist between different data sources. Retrieved from https://www.census.gov/quickfacts, December 20, 2019
Los Alamos248
Section 2A | Demographic Data U.S. & New Mexico
14Data Book for New Mexico Human Services Department

25861101932072122674195525827789159621,0081,2921,3251,4351,4481,6901,8142,4183,9864,2654,2764,3394,5825,1695,4346,4497,9918,328
13,94437,745
0 20,000 40,000
HARDINGDE BACACATRON
UNIONMORA
GUADALUPEHIDALGO
QUAYSIERRACOLFAX
TORRANCELINCOLN
SOCORROLOS ALAMOS
SANDOVALROOSEVELT
GRANTTAOS
CIBOLALUNA
RIO ARRIBACURRY
EDDYCHAVES
VALENCIAOTERO
MCKINLEYLEA
SANTA FESAN JUAN
SAN MIGUELDOÑA ANA
BERNALILLO
New Mexico Population of Children (0-4 Years): 124,246
Source: U.S. Census Bureau (2018). Population, Population Change, and Estimated Components of Population Change: April 1, 2010 to July 1, 2018 (NST-EST2018-01). Retrieved from https://www2.census.gov/programs-surveys/popest/tables/2010-2018/state/totals/, January 2, 2020.
Los Alamos1,008
15Data Book for New Mexico Human Services DepartmentSection 2A | Demographic Data U.S. & New Mexico
$82,
005
$76,
456
$71,
683
$68,
668
$68,
236
$63,
557
$63,
354
$62,
026
$61,
294
$60,
361
$59,
420
$58,
456
$57,
799
$57,
515
$56,
839
$56,
225
$55,
452
$55,
418
$54,
850
$54,
420
$54,
173
$53,
263
$52,
507
$52,
216
$51,
592
$51,
471
$50,
843
$50,
355
$50,
124
$50,
070
$49,
452
$49,
176
$48,
905
$48,
739
$48,
658
$48,
423
$47,
538
$47,
149
$46,
482
$46,
320
$46,
242
$46,
233
$46,
117
$44,
329
$43,
901
$43,
791
$43,
702
$43,
233
$42,
238
$41,
609
$40,
873
$37,
834
$0
$20,000
$40,000
$60,000
$80,000
$100,000
DC CT MA NJ
NY CA MD
WA
NH
WY AK CO VA MN IL PA ND HI RI
USA VT N
E DE SD WI
KS OR TX IA FL
MO NV
ME
OH TN MI
MT IN GA UT LA OK
NC AZ ID KY SC AR AL N
M WV
MS
Source: U.S. Bureau of Economic Analysis, Per Capita Personal Income by State [PCPI], retrieved from FRED, Federal Reserve Bank of St. Louis; https://fred.stlouisfed.org/series/NMPCPI, October 24, 2019.U.S. Bureau of Economic Analysis, Personal income per capita [A792RC0A052NBEA], retrieved from FRED, Federal Reserve Bank of St. Louis; https://fred.stlouisfed.org/series/A792RC0A052NBEA, October 24, 2019.
HI$55,418
VT$54,17
ND$55,452
MA$71,683
RI$54,850CT
$76,456
NJ$53,263
MD$63,354
DC$82,005
DE$52,507
FL$50,070
US Per Capita Personal Income: $54,420
Section 2A | Demographic Data U.S. & New Mexico
16Data Book for New Mexico Human Services Department

New Mexico Per Capita Personal Income: $41,609
Los Alamos$70,600
$27,771$28,130$30,245$31,140$32,010$32,620$32,994$33,424$34,579$34,582$34,636$34,699$35,453$35,534$36,570$38,223$38,455$38,716$38,984$39,446$39,634$39,826$40,322$41,026$41,547$41,555$41,609$41,793$44,057$44,161$44,437
$54,122$58,510
$70,600
$0 $40,000 $80,000
MCKINLEYCIBOLA
TORRANCELUNA
CATRONUNION
GUADALUPEVALENCIA
SAN MIGUELRIO ARRIBA
OTEROSOCORROSAN JUAN
MORADOÑA ANA
QUAYTAOS
HARDINGSIERRA
ROOSEVELTDE BACA
COLFAXCHAVESGRANT
SANDOVALHIDALGO
NEW MEXICOLINCOLN
BERNALILLOCURRY
LEAEDDY
SANTA FELOS ALAMOS
Source: U.S. Bureau of Economic Analysis, Local Area Personal Income, 2018 Per Capita Personal Income. Retrieved from U.S. Bureau of Economic Analysis https://www.bea.gov/data/income-saving/personal-income-county-metro-and-other-areas, November 16, 2019.
17Data Book for New Mexico Human Services DepartmentSection 2A | Demographic Data U.S. & New Mexico

Percent Change New Mexico PerCapita Personal Income: 5.3%
Los Alamos4.1
-0.40.3
1.51.6
2.63.13.83.94.04.14.14.14.14.14.24.24.34.54.54.64.74.95.15.15.35.45.55.85.96.16.67.3
13.516.4
-1.0 14.0
ROOSEVELTUNIONSIERRACURRY
DE BACACOLFAXCIBOLAOTERO
TORRANCECATRON
DOÑA ANALOS ALAMOS
SANDOVALVALENCIA
LUNAQUAY
MCKINLEYMORA
RIO ARRIBABERNALILLOGUADALUPESAN MIGUEL
HARDINGTAOS
NEW MEXICOLINCOLN
SAN JUANCHAVES
SANTA FESOCORROHIDALGO
GRANTEDDY
LEA
Source: U.S. Bureau of Economic Analysis, Local Area Personal Income, 2017-2018 Per Capita Personal Income. Retrieved from U.S. Bureau of Economic Analysis https://www.bea.gov/data/income-saving/personal-income-county-metro-and-other-areas, November 16, 2019.
Section 2A | Demographic Data U.S. & New Mexico
18Data Book for New Mexico Human Services Department

$86,
345
$86,
223
$85,
750
$81,
346
$80,
108
$79,
726
$77,
151
$77,
067
$74,
176
$73,
034
$72,
812
$71,
817
$70,
489
$70,
145
$70,
066
$69,
165
$68,
734
$68,
718
$67,
575
$67,
274
$66,
505
$65,
012
$64,
524
$63,
938
$63,
179
$62,
629
$62,
539
$62,
283
$62,
266
$61,
864
$61,
726
$61,
633
$60,
449
$59,
892
$59,
785
$59,
463
$58,
728
$58,
663
$57,
679
$57,
444
$56,
060
$55,
821
$54,
644
$54,
555
$54,
434
$53,
369
$50,
573
$49,
973
$49,
936
$49,
781
$48,
283
$42,
781
$0
$20,000
$40,000
$60,000
$80,000
$100,000
MA
MD DC NH HI
WA VA UT NJ
CO CT MN CA IL VT OR AK IA NE
NY
ND DE PA KS
USA W
IW
Y AZ RI NV
MO
OH MI
IN TX SD ID ME
MT SC TN GA FL KY OK
NC
WV LA AL AR N
M MS
Source: U.S. Census Bureau, Estimate of Median Household Income by State (MEHOINUSA672N), as of 2018. Retrieved from FRED, Federal Reserve Bank of St. Louis; https://fred.stlouisfed.org/series/MEHOINUSNMA672N, October 24, 2019. Retrieved from FRED, Federal Reserve Bank of St. Louis; https://fred.stlouisfed.org/series/MEHOINUSNMA672N, October 24, 2019.
HI$80,108
VT$70,06
NH$81,346
MA$86,345
RI$62,266CT
$72,812
NJ$74,176
MD$86,223
DC$85,750
DE$65,012
FL$54,644
Real Median Household Income: $63,179
19Data Book for New Mexico Human Services DepartmentSection 2A | Demographic Data U.S. & New Mexico

New Mexico Median Household Income: $47,086
Los Alamos$118,380
$29,600$30,356$30,621$31,746$31,915$33,095$33,205$33,557$33,671$34,458$34,880$34,980$35,441$36,886$36,977$37,753$37,767$38,562$38,627$39,372$40,684$43,338$43,341$43,590$46,155$46,977$47,086$47,141$51,091$52,358$52,932
$56,937$58,639
$118,380
$20,000 $60,000 $100,000
QUAYSIERRA
LUNAMCKINLEY
GUADALUPEDE BACA
SAN MIGUELHIDALGO
MORACATRON
SOCORROTAOS
HARDINGTORRANCE
RIO ARRIBACIBOLA
ROOSEVELTDOÑA ANA
UNIONCOLFAXGRANTOTERO
CHAVESCURRY
VALENCIASAN JUAN
NEW MEXICOLINCOLN
BERNALILLOLEA
EDDYSANDOVAL
SANTA FELOS ALAMOS
Source: U.S. Census Bureau, Small Area Income and Poverty Estimates (SAIPE) Program, 2017 Poverty and Median Household Income Estimates - Counties, States, and National; Median Household Income. Retrieved from US Census; https://www.census.gov/data/datasets/2017/demo/saipe/2017-state-and-county.html, October 7, 2019.
Section 2A | Demographic Data U.S. & New Mexico
20Data Book for New Mexico Human Services Department

$17.
76$1
5.73
$15.
09$1
5.08
$14.
61$1
4.17
$13.
96$1
3.92
$13.
30$1
3.19
$13.
13$1
3.12
$12.
89$1
2.77
$12.
68$1
2.57
$12.
46$1
2.35
$12.
29$1
2.17
$12.
16$1
1.91
$11.
87$1
1.79
$11.
68$1
1.58
$11.
55$1
1.48
$11.
45$1
1.41
$11.
38$1
1.33
$11.
29$1
1.28
$11.
26$1
1.25
$11.
14$1
1.12
$11.
10$1
1.07
$11.
04$1
1.04
$11.
02$1
0.96
$10.
95$1
0.89
$10.
84$1
0.82
$10.
78$1
0.75
$10.
62$1
0.38
$0
$10
$20
$30
DC HI
NY
MD CA VA MA NJ
WA
CO CT OR AK IL DE VT GA RI NH FL
USA M
EM
N NC AZ UT SC TX PA WI
MT AL MI
LA NV
NM
MO ND
WY IN ID MS
NE KS OK IA
WV KY OH TN AR SD
Source: Living Wage Calculator, https://livingwage.mit.edu. Single Adult, No Children. Data as of December 2018.
HI$15.73
VT$12.57
NH$12.29
MA$13.96
RI$12.35CT
$13.13
NJ$13.92
MD$15.08
DC$17.76
DE$12.68
FL$12.17
US Average:$12.16
21Data Book for New Mexico Human Services DepartmentSection 2A | Demographic Data U.S. & New Mexico
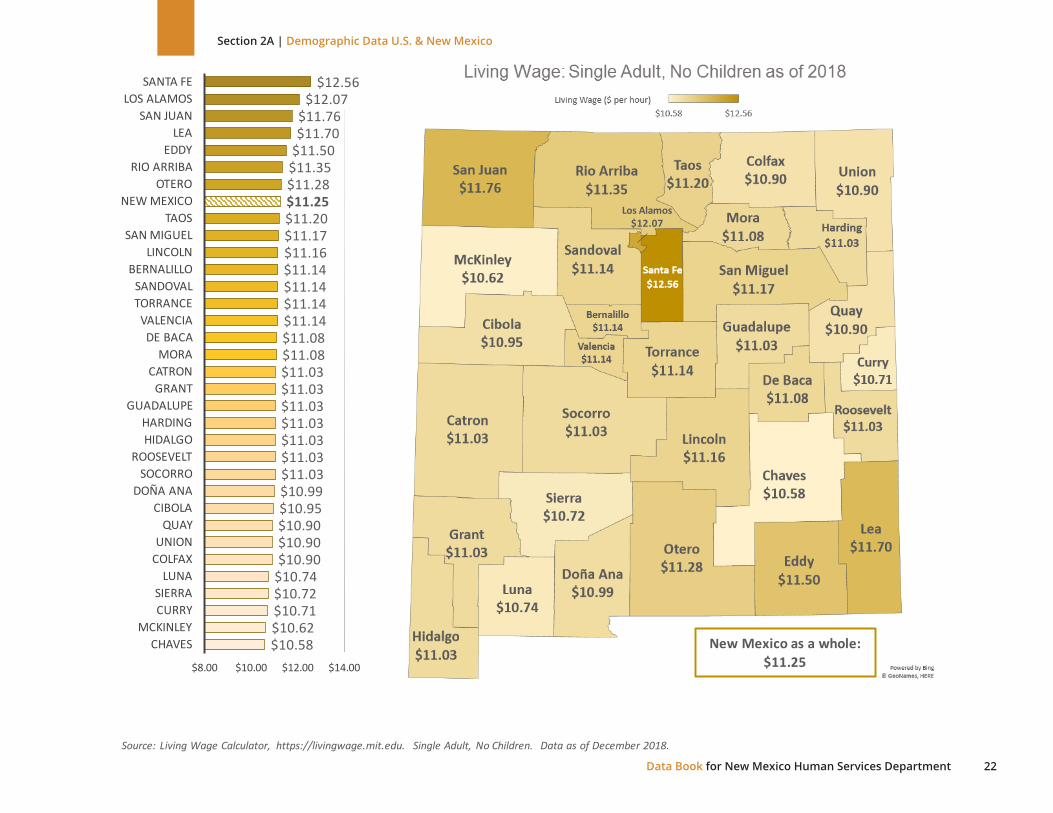
New Mexico as a whole: $11.25
$10.58$10.62$10.71$10.72$10.74$10.90$10.90$10.90$10.95$10.99$11.03$11.03$11.03$11.03$11.03$11.03$11.03$11.08$11.08$11.14$11.14$11.14$11.14$11.16$11.17$11.20$11.25$11.28$11.35$11.50$11.70$11.76
$12.07$12.56
$8.00 $10.00 $12.00 $14.00
CHAVESMCKINLEY
CURRYSIERRA
LUNACOLFAXUNION
QUAYCIBOLA
DOÑA ANASOCORRO
ROOSEVELTHIDALGOHARDING
GUADALUPEGRANT
CATRONMORA
DE BACAVALENCIA
TORRANCESANDOVAL
BERNALILLOLINCOLN
SAN MIGUELTAOS
NEW MEXICOOTERO
RIO ARRIBAEDDY
LEASAN JUAN
LOS ALAMOSSANTA FE
Los Alamos$12.07
Source: Living Wage Calculator, https://livingwage.mit.edu. Single Adult, No Children. Data as of December 2018.
Section 2A | Demographic Data U.S. & New Mexico
22Data Book for New Mexico Human Services Department
$39.
59$3
6.02
$33.
91$3
3.76
$33.
66$3
3.60
$32.
97$3
2.96
$32.
32$3
2.21
$32.
06$3
1.82
$31.
04$3
0.81
$30.
37$3
0.34
$30.
25$3
0.24
$30.
24$2
9.91
$29.
84$2
9.58
$29.
56$2
9.55
$29.
50$2
9.33
$29.
30$2
9.21
$29.
01$2
8.89
$28.
67$2
8.47
$28.
30$2
8.14
$28.
10$2
7.86
$27.
71$2
7.61
$27.
51$2
7.48
$27.
10$2
7.05
$27.
02$2
7.00
$26.
98$2
6.69
$26.
31$2
6.26
$26.
09$2
5.66
$25.
43$2
3.75
$0
$10
$20
$30
$40
$50
NY CA MD NJ
MA DC AK CT CO WA VA OR RI IL
MN
MT VT AZ HI
WY
DE NH
USA N
V UT
WI
NM FL ME PA ID MI
OK NE KY NC
GA IN MO ND AL IA TX OH LA KS WV SD SC AR TN MS
Source: Living Wage Calculator, https://livingwage.mit.edu. Single Adult, Two Children (young child (4 years old) and child (9 years old)). Data as of December 2018.
HI$30.24
VT$30.25
NH$29.58
MA$33.66
RI$31.04CT
$32.96
NJ$33.76
MD$33.91DC
$33.60
DE$29.84
FL$29.21
US Average:$29.56
23Data Book for New Mexico Human Services DepartmentSection 2A | Demographic Data U.S. & New Mexico

New Mexico as a whole: $29.30
$28.48$28.48$28.48$28.48$28.48$28.48$28.48$28.48$28.48$28.48$28.48$28.48$28.48$28.48$28.48$28.55$28.55$28.55$28.65$28.76$28.84$28.85$28.96$29.09$29.19$29.28$29.30
$29.63$29.63$29.63$29.63$29.67
$30.51$30.62
$26.00 $28.00 $30.00 $32.00
CATRONCIBOLACOLFAXGRANT
GUADALUPEHARDINGHIDALGO
LUNAMCKINLEY
OTEROQUAY
RIO ARRIBASIERRA
SOCORROUNION
DE BACAMORA
ROOSEVELTSAN MIGUEL
CHAVESCURRY
DOÑA ANASAN JUAN
TAOSLEA
EDDYNEW MEXICO
BERNALILLOSANDOVALTORRANCE
VALENCIALINCOLN
SANTA FELOS ALAMOS
Los Alamos$30.62
Source: Living Wage Calculator, https://livingwage.mit.edu. Single Adult, Two Children (young child (4 years old) and child (9 years old)). Data as of December 2018.
Section 2A | Demographic Data U.S. & New Mexico
24Data Book for New Mexico Human Services Department

$32.
39$3
1.75
$30.
68$2
9.53
$28.
90$2
8.49
$27.
83$2
7.77
$27.
70$2
7.63
$27.
61$2
7.34
$26.
94$2
6.79
$26.
57$2
6.21
$26.
13$2
6.10
$25.
86$2
5.79
$25.
70$2
5.60
$25.
50$2
5.49
$25.
48$2
5.25
$25.
25$2
5.25
$25.
16$2
5.07
$25.
01$2
4.94
$24.
93$2
4.80
$24.
75$2
4.54
$24.
47$2
4.37
$24.
30$2
4.25
$24.
25$2
4.24
$24.
20$2
4.12
$24.
03$2
3.92
$23.
92$2
3.73
$23.
63$2
3.61
$23.
28$2
3.20
$0$5
$10$15$20$25$30$35
HI
DC CA MD NY NJ
VA CO CT WA
MA
OR AK DE IL VT FL MN
USA AZ M
TG
AN
H RI ID ME
MO
NM UT
NV TX LA SC NC NE
WI
KS OK IA MS
WY PA MI
ND IN AL KY AR SD OH TN WV
Source: Living Wage Calculator, https://livingwage.mit.edu. Two Adults (only one working), Two Children (young child (4 years old) and child (9 years old). Data as of December 2018.
HI$32.39
VT$26.21
NH$25.50
MA$27.61
RI$25.49CT
$27.70
NJ$28.49
MD$29.53
DC$31.75
DE$26.79
FL$26.13
US Average:$25.86
25Data Book for New Mexico Human Services DepartmentSection 2A | Demographic Data U.S. & New Mexico

New Mexico as a whole: $25.25
$24.43$24.43$24.43$24.43$24.43$24.43$24.43$24.43$24.43$24.43$24.43$24.43$24.43$24.43$24.43$24.50$24.50$24.50$24.61$24.71$24.79$24.80$24.91$25.04$25.14$25.23$25.25
$25.59$25.59$25.59$25.59$25.63
$26.46$26.57
$22.00 $24.00 $26.00 $28.00
CATRONCIBOLACOLFAXGRANT
GUADALUPEHARDINGHIDALGO
LUNAMCKINLEY
OTEROQUAY
RIO ARRIBASIERRA
SOCORROUNION
DE BACAMORA
ROOSEVELTSAN MIGUEL
CHAVESCURRY
DOÑA ANASAN JUAN
TAOSLEA
EDDYNEW MEXICO
BERNALILLOSANDOVALTORRANCE
VALENCIALINCOLN
SANTA FELOS ALAMOS
Los Alamos$26.57
Source: Living Wage Calculator, https://livingwage.mit.edu. Two Adults (only one working), Two Children (young child (4 years old) and child (9 years old). Data as of December 2018.
Section 2A | Demographic Data U.S. & New Mexico
26Data Book for New Mexico Human Services Department

47.0
43.6
42.9
42.5
41.4
38.9
37.6
37.4
36.6
36.2
36.1
35.8
35.7
35.4
34.3
34.1
33.5
33.3
33.2
32.9
32.6
32.6
32.5
32.5
32.2
32.2
32.0
31.9
31.8
31.7
31.7
31.7
31.6
31.3
31.1
31.1
30.9
30.5
29.8
29.7
29.7
29.1
29.1
28.8
28.3
26.7
26.4
26.1
26.0
24.9
24.1
18.5
0.0
10.0
20.0
30.0
40.0
50.0
60.0
DC MS
NM SC LA AL GA AZ AK AR NC DE FL ME
NY MI
VA VT MD
OH TN U
SA OK
OR IL
MA
WV KY PA MO NV TX NH WI
CA WA IN CT RI HI
MN CO SD IA NJ
KS WY
MT ID ND NE
UT
Source: U.S. Census Bureau, Single-parent Households with Children as a Percentage of Households with Children, Annual, as of 2017. Retrieved from FRED, Federal Reserve Bank of St. Louis; https://fred.stlouisfed.org/release/tables?rid=412&eid=358576; https://fred.stlouisfed.org/series/S1101SPHOUSE001001, November 18, 2019. State values are county averages.
HI29.7
VT33.3
NH31.6
MA32.2RI
29.8CT30.5
NJ28.3
MD33.2
DC47.0
DE35.8
FL35.7
US Average:32.6%
27Data Book for New Mexico Human Services DepartmentSection 2A | Demographic Data U.S. & New Mexico

Source: U.S. Census Bureau, Single-parent Households with Children as a Percentage of Households with Children by County, NM [S1101SPHOUSE035001] as of 2017. Retrieved from FRED, Federal Reserve Bank of St. Louis; https://fred.stlouisfed.org/series/S1101SPHOUSE035001, October 7, 2019.
22.727.628.231.331.832.233.033.134.535.835.836.836.836.838.239.740.741.642.442.842.9
47.747.750.851.551.952.353.753.954.556.4
61.162.0
68.8
0.0 20.0 40.0 60.0 80.0
LINCOLNDE BACAHIDALGO
MORALEA
SANDOVALLOS ALAMOS
OTEROROOSEVELT
LUNAVALENCIA
DOÑA ANAEDDY
TORRANCECURRY
SAN JUANBERNALILLO
SANTA FECHAVESUNION
NEW MEXICOGRANT
MCKINLEYSIERRA
CATRONTAOS
HARDINGRIO ARRIBA
SOCORROCOLFAXCIBOLA
SAN MIGUELQUAY
GUADALUPE
New Mexico Average: 42.9%
Los Alamos33.0
Section 2A | Demographic Data U.S. & New Mexico
28Data Book for New Mexico Human Services Department
6.6
5.3
4.8
4.5
4.5
4.5
4.2
4.2
4.1
3.9
3.9
3.8
3.8
3.8
3.7
3.7
3.6
3.5
3.5
3.4
3.4
3.4
3.3
3.3
3.3
3.3
3.2
3.1
3.1
3.1
3.0
3.0
2.9
2.9
2.9
2.8
2.8
2.8
2.7
2.5
2.5
2.5
2.4
2.3
2.3
2.3
2.2
2.2
2.2
2.0
1.9
1.8
0.0
2.0
4.0
6.0
8.0
AK DC MS AZ LA N
M WA
WV
OH OR PA DE KY NV MI
NY IL CA NC AR CT MD RI TX WY
USA N
JG
A OK TN FL MT
MA NE
WI
HI
IN KS SD AL MN VA MO ID ME
NH CO IA VT UT
ND SC
Source: U.S. Bureau of Labor Statistics, Unemployment Rate in New Mexico [NMURN], retrieved from FRED, Federal Reserve Bank of St. Louis; https://fred.stlouisfed.org/series/NMURN, November 15, 2019. U.S. Bureau of Labor Statistics, Unemployment Rate [UNRATENSA], retrieved from FRED, Federal Reserve Bank of St. Louis; https://fred.stlouisfed.org/series/UNRATENSA, November 15, 2019.
HI2.8
VT2.2
NH2.3
MA2.9RI3.3CT
3.4
NJ3.2
MD3.4
DC5.3
DE3.8
FL3.0
US Unemployment Rate:3.3%
29Data Book for New Mexico Human Services DepartmentSection 2A | Demographic Data U.S. & New Mexico

2.93.03.0
3.63.73.84.14.24.24.24.44.44.44.54.54.64.74.74.74.84.95.05.05.05.25.35.55.55.65.66.06.2
6.78.1
0.0 2.0 4.0 6.0 8.0 10.0
LOS ALAMOSEDDY
UNIONLEA
SANTA FEDE BACA
CURRYBERNALILLO
HIDALGOLINCOLN
GUADALUPEOTERO
ROOSEVELTGRANT
NEW MEXICOSANDOVAL
CHAVESQUAY
RIO ARRIBACOLFAX
HARDINGCATRON
DOÑA ANAMORA
VALENCIASAN JUAN
SAN MIGUELTAOS
SIERRASOCORRO
CIBOLATORRANCEMCKINLEY
LUNA
New Mexico Unemployment Rate: 4.5%
Source: U.S. Bureau of Labor Statistics, Local Area Unemployment Statistics as of September 2019 (Preliminary), Not Seasonally Adjusted series. Retrieved from Bureau of Labor Statistics; https://data.bls.gov/pdq/SurveyOutputServlet, November 16, 2019.
Los Alamos2.9
Section 2A | Demographic Data U.S. & New Mexico
30Data Book for New Mexico Human Services Department
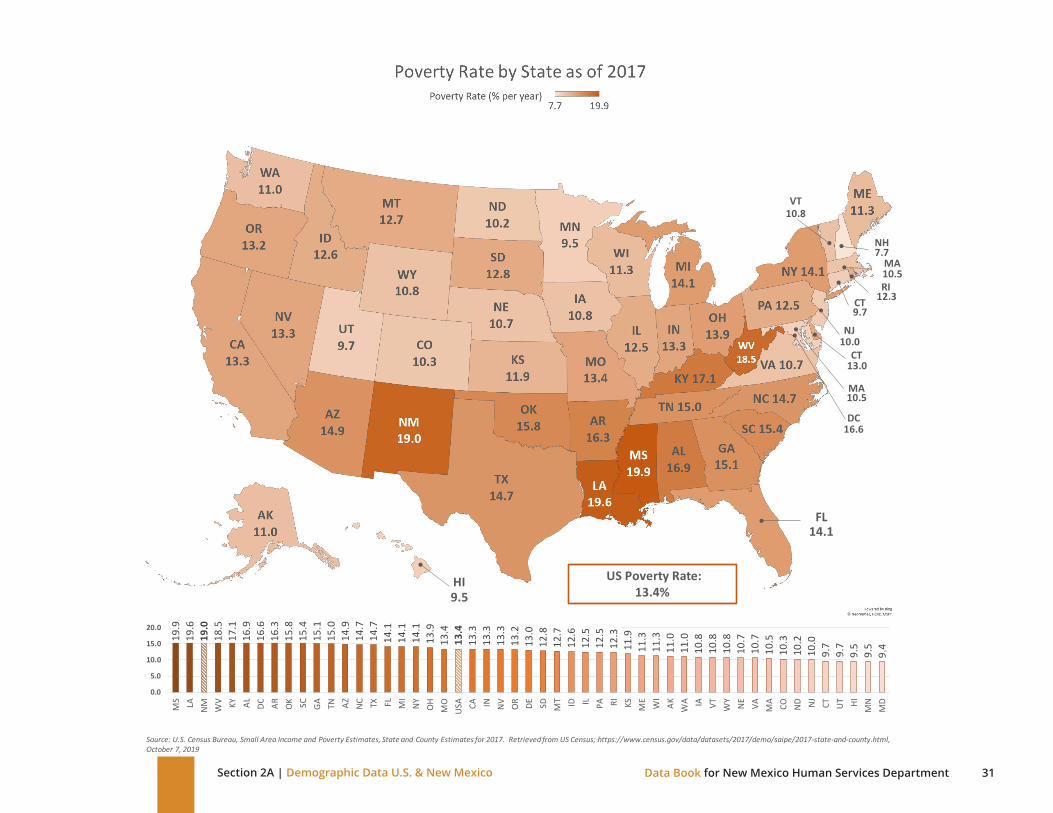
19.9
19.6
19.0
18.5
17.1
16.9
16.6
16.3
15.8
15.4
15.1
15.0
14.9
14.7
14.7
14.1
14.1
14.1
13.9
13.4
13.4
13.3
13.3
13.3
13.2
13.0
12.8
12.7
12.6
12.5
12.5
12.3
11.9
11.3
11.3
11.0
11.0
10.8
10.8
10.8
10.7
10.7
10.5
10.3
10.2
10.0
9.7
9.7
9.5
9.5
9.4
0.0
5.0
10.0
15.0
20.0
MS LA N
M WV KY AL DC AR OK SC GA TN AZ NC TX FL MI
NY
OH
MO
USA CA IN N
VO
R DE SD MT ID IL PA RI KS ME
WI
AK WA IA VT WY
NE
VA MA CO ND NJ
CT UT HI
MN
MD
Source: U.S. Census Bureau, Small Area Income and Poverty Estimates, State and County Estimates for 2017. Retrieved from US Census; https://www.census.gov/data/datasets/2017/demo/saipe/2017-state-and-county.html, October 7, 2019
HI9.5
VT10.8
NH7.7
MA10.5RI
12.3CT9.7
NJ10.0
MA10.5
DC16.6
CT13.0
FL14.1
US Poverty Rate:13.4%
31Data Book for New Mexico Human Services DepartmentSection 2A | Demographic Data U.S. & New Mexico

New Mexico Poverty Rate: 19.0%
3.712.2
14.615.115.315.816.116.917.517.618.518.918.919.019.820.321.222.022.622.622.823.123.924.825.726.326.626.728.328.328.929.230.1
37.8
0.0 10.0 20.0 30.0 40.0
LOS ALAMOSSANTA FE
BERNALILLOHARDINGSAN JUAN
LINCOLNLEA
EDDYVALENCIA
UNIONOTERO
CHAVESCURRY
NEW MEXICOCOLFAXGRANT
CATRONDE BACA
GUADALUPEMORA
TAOSSAN MIGUEL
QUAYHIDALGO
ROOSEVELTDOÑA ANA
SIERRATORRANCE
LUNASOCORRO
RIO ARRIBASANDOVAL
CIBOLAMCKINLEY
Source: U.S. Census Bureau, Small Area Income and Poverty Estimates (SAIPE) Program, 2017 Poverty and Median Household Income Estimates - Counties, States, and National; Poverty Percent, All Ages. Retrieved from US Census; https://www.census.gov/data/datasets/2017/demo/saipe/2017-state-and-county.html, October 7, 2019.
Los Alamos3.7
Section 2A | Demographic Data U.S. & New Mexico
32Data Book for New Mexico Human Services Department
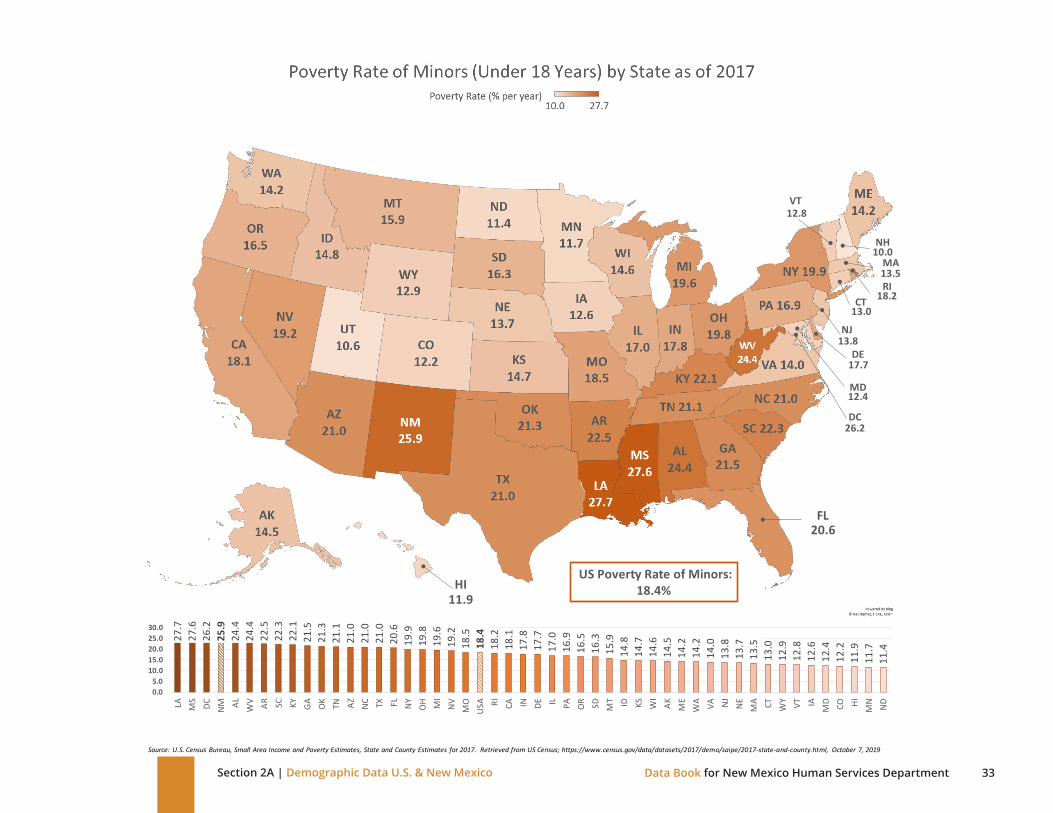
27.7
27.6
26.2
25.9
24.4
24.4
22.5
22.3
22.1
21.5
21.3
21.1
21.0
21.0
21.0
20.6
19.9
19.8
19.6
19.2
18.5
18.4
18.2
18.1
17.8
17.7
17.0
16.9
16.5
16.3
15.9
14.8
14.7
14.6
14.5
14.2
14.2
14.0
13.8
13.7
13.5
13.0
12.9
12.8
12.6
12.4
12.2
11.9
11.7
11.4
0.05.0
10.015.020.025.030.0
LA MS
DC NM AL WV AR SC KY GA OK TN AZ NC TX FL NY
OH MI
NV
MO
USA RI CA IN DE IL PA O
R SD MT ID KS WI
AK ME
WA VA NJ
NE
MA CT WY VT IA
MD CO HI
MN ND
Source: U.S. Census Bureau, Small Area Income and Poverty Estimates, State and County Estimates for 2017. Retrieved from US Census; https://www.census.gov/data/datasets/2017/demo/saipe/2017-state-and-county.html, October 7, 2019
HI11.9
VT12.8
NH10.0
MA13.5RI
18.2CT13.0
NJ13.8
MD12.4
DC26.2
DE17.7
FL20.6
US Poverty Rate of Minors:18.4%
33Data Book for New Mexico Human Services DepartmentSection 2A | Demographic Data U.S. & New Mexico
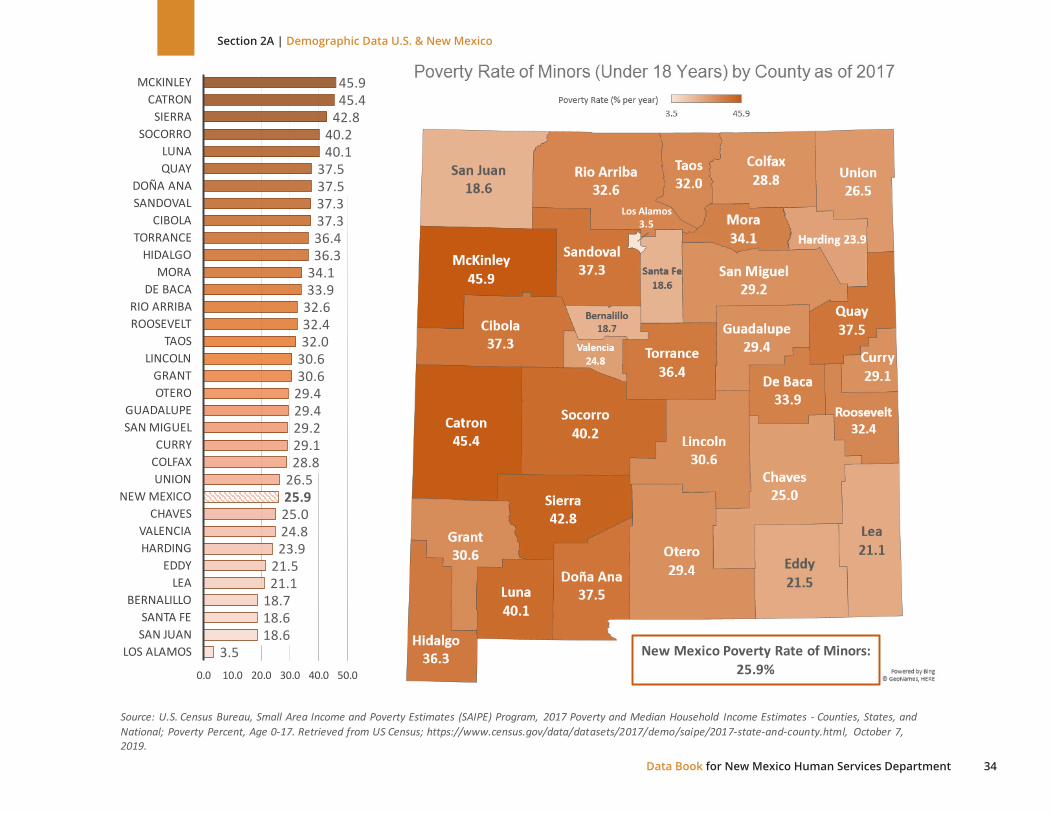
New Mexico Poverty Rate of Minors: 25.9%
3.518.618.618.7
21.121.5
23.924.825.025.926.528.829.129.229.429.430.630.632.032.432.633.934.136.336.437.337.337.537.5
40.140.2
42.845.445.9
0.0 10.0 20.0 30.0 40.0 50.0
LOS ALAMOSSAN JUANSANTA FE
BERNALILLOLEA
EDDYHARDINGVALENCIA
CHAVESNEW MEXICO
UNIONCOLFAXCURRY
SAN MIGUELGUADALUPE
OTEROGRANT
LINCOLNTAOS
ROOSEVELTRIO ARRIBA
DE BACAMORA
HIDALGOTORRANCE
CIBOLASANDOVALDOÑA ANA
QUAYLUNA
SOCORROSIERRA
CATRONMCKINLEY
Source: U.S. Census Bureau, Small Area Income and Poverty Estimates (SAIPE) Program, 2017 Poverty and Median Household Income Estimates - Counties, States, and National; Poverty Percent, Age 0-17. Retrieved from US Census; https://www.census.gov/data/datasets/2017/demo/saipe/2017-state-and-county.html, October 7, 2019.
Los Alamos3.5
Section 2A | Demographic Data U.S. & New Mexico
34Data Book for New Mexico Human Services Department
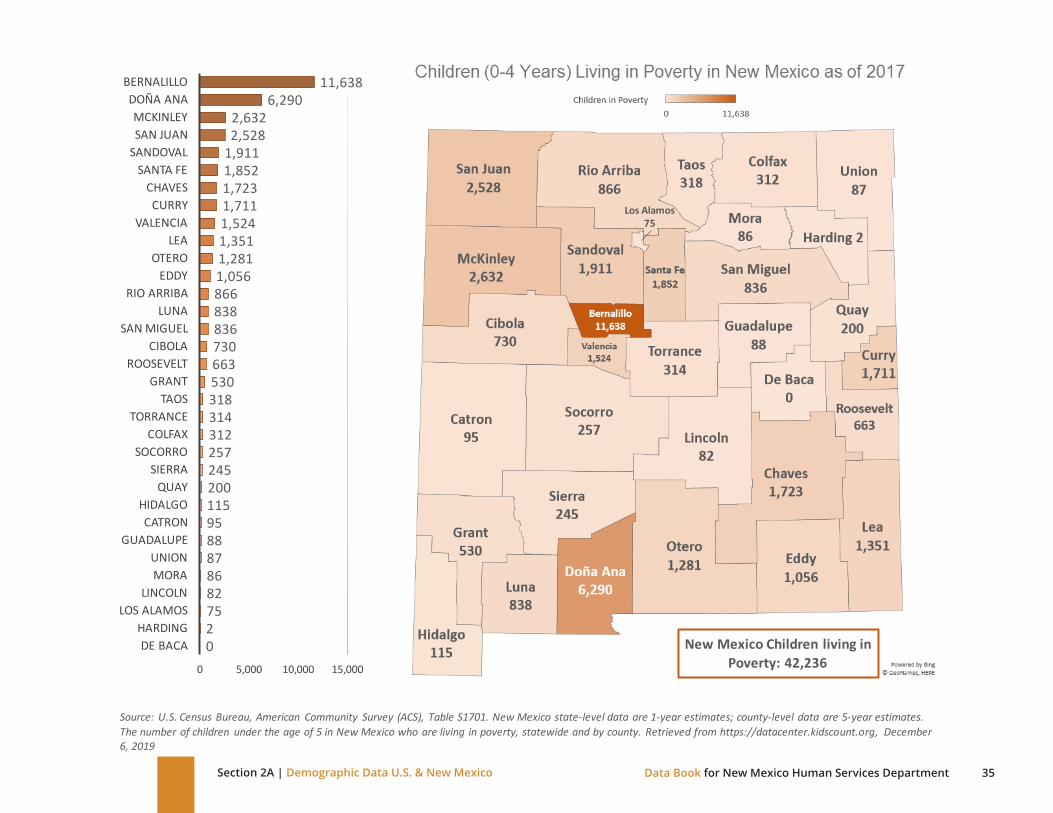
New Mexico Children living in Poverty: 42,236
027582868788951152002452573123143185306637308368388661,0561,2811,3511,5241,7111,7231,8521,9112,5282,632
6,29011,638
0 5,000 10,000 15,000
DE BACAHARDING
LOS ALAMOSLINCOLN
MORAUNION
GUADALUPECATRON
HIDALGOQUAY
SIERRASOCORRO
COLFAXTORRANCE
TAOSGRANT
ROOSEVELTCIBOLA
SAN MIGUELLUNA
RIO ARRIBAEDDY
OTEROLEA
VALENCIACURRY
CHAVESSANTA FE
SANDOVALSAN JUANMCKINLEY
DOÑA ANABERNALILLO
Source: U.S. Census Bureau, American Community Survey (ACS), Table S1701. New Mexico state-level data are 1-year estimates; county-level data are 5-year estimates. The number of children under the age of 5 in New Mexico who are living in poverty, statewide and by county. Retrieved from https://datacenter.kidscount.org, December 6, 2019
Los Alamos75
35Data Book for New Mexico Human Services DepartmentSection 2A | Demographic Data U.S. & New Mexico
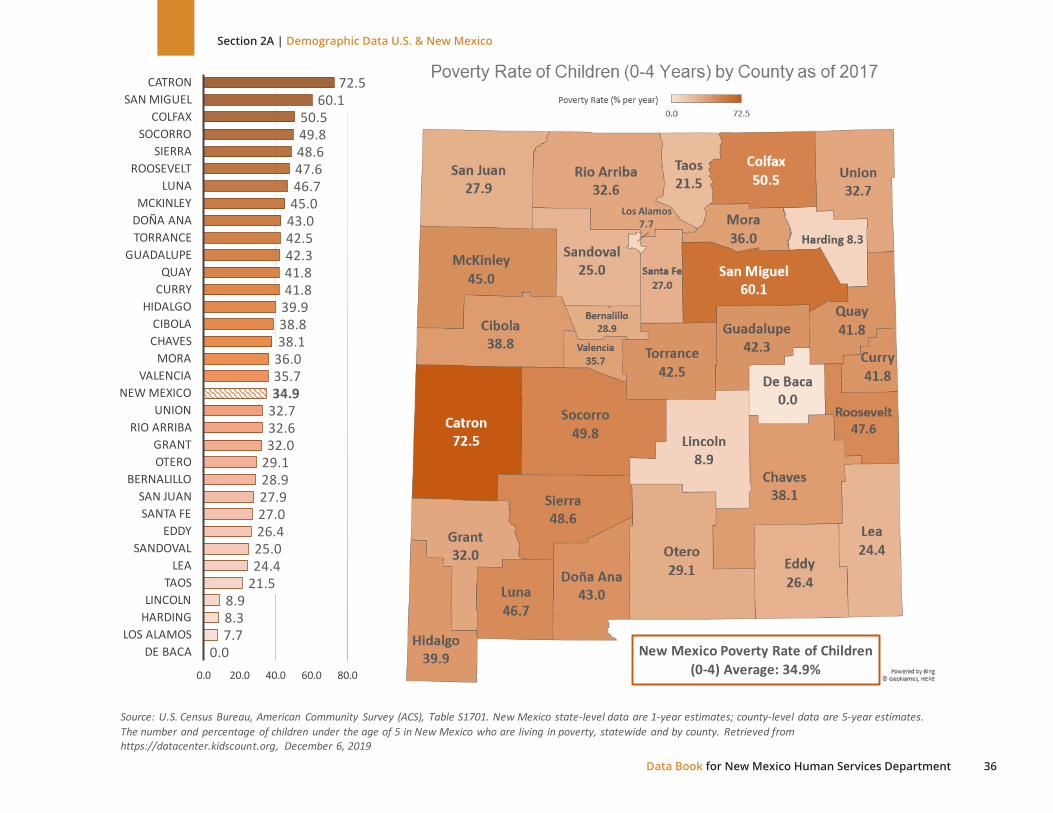
New Mexico Poverty Rate of Children (0-4) Average: 34.9%
0.07.78.38.9
21.524.425.026.427.027.928.929.132.032.632.734.935.736.038.138.839.941.841.842.342.543.045.046.747.648.649.850.5
60.172.5
0.0 20.0 40.0 60.0 80.0
DE BACALOS ALAMOS
HARDINGLINCOLN
TAOSLEA
SANDOVALEDDY
SANTA FESAN JUAN
BERNALILLOOTEROGRANT
RIO ARRIBAUNION
NEW MEXICOVALENCIA
MORACHAVESCIBOLA
HIDALGOCURRYQUAY
GUADALUPETORRANCEDOÑA ANAMCKINLEY
LUNAROOSEVELT
SIERRASOCORRO
COLFAXSAN MIGUEL
CATRON
Source: U.S. Census Bureau, American Community Survey (ACS), Table S1701. New Mexico state-level data are 1-year estimates; county-level data are 5-year estimates. The number and percentage of children under the age of 5 in New Mexico who are living in poverty, statewide and by county. Retrieved from https://datacenter.kidscount.org, December 6, 2019
Los Alamos7.7
Section 2A | Demographic Data U.S. & New Mexico
36Data Book for New Mexico Human Services Department
1,65
8,68
01,
638,
430
854,
880
732,
300
510,
030
503,
370
461,
630
453,
260
437,
340
348,
550
345,
130
285,
770
284,
760
273,
380
260,
340
255,
640
247,
470
243,
880
243,
110
213,
720
204,
660
202,
110
197,
290
186,
660
177,
360
167,
440
165,
290
163,
530
163,
310
159,
950
136,
800
135,
940
130,
210
118,
030
115,
240
111,
520
82,3
7076
,970
69,9
2053
,540
47,0
2036
,910
35,7
6034
,970
34,7
5034
,690
31,6
4026
,450
23,9
6018
,760
16,9
00
0
400,000
800,000
1,200,000
1,600,000
TX CA FL NY
OH GA NC IL PA AZ MI
TN WA IN NJ
LA VA AL MO OK
MD SC WI
KY CO AR OR
MS
MN
MA
NV UT KS N
M CT IA NE
WV ID HI
ME
MT RI SD DE AK NH DC WY VT ND
Source: Gundersen, C., A. Dewey, M. Kato, , A. Crumbaugh & M. Strayer. Map the Meal Gap 2019: A Report on County and Congressional District Food Insecurity and County Food Cost in the United States in 2017. Feeding America, 2019.
HI53,540
VA247,470
NH31,640
MA159,950
RI35,760CT
115,240
NJ260,340
MD204,660
DC26,450
DE34,750
FL854,880
US Number of Food Insecure Children: 13,411,620
37Data Book for New Mexico Human Services DepartmentSection 2A | Demographic Data U.S. & New Mexico

New Mexico Number of FoodInsecure Children: 121,480
301001501702002002705105106107107708801,0601,2701,4901,5401,5401,9802,1502,3303,1703,3904,0004,3604,4604,6105,9107,2407,410
9,38014,700
34,380
0 10,000 20,000 30,000 40,000
HARDINGDE BACACATRON
GUADALUPEMORAUNION
HIDALGOQUAY
SIERRACOLFAX
LOS ALAMOSLINCOLN
TORRANCESOCORRO
ROOSEVELTGRANT
SAN MIGUELTAOS
CIBOLALUNA
RIO ARRIBAEDDY
CURRYOTERO
CHAVESVALENCIA
LEASANTA FE
MCKINLEYSANDOVALSAN JUAN
DOÑA ANABERNALILLO
Source: Gundersen, C., A. Dewey, M. Kato, , A. Crumbaugh & M. Strayer. Map the Meal Gap 2019: A Report on County and Congressional District Food Insecurity and County Food Cost in the United States in 2017. Feeding America, 2019.
Los Alamos710
Section 2A | Demographic Data U.S. & New Mexico
38Data Book for New Mexico Human Services Department

24.1
23.6
23.0
22.9
22.5
22.3
22.2
21.3
21.2
20.6
20.4
20.1
20.0
20.0
19.6
18.9
18.9
18.7
18.5
18.4
18.3
18.3
18.1
17.7
17.6
17.5
17.5
17.4
17.4
17.4
17.3
17.3
17.0
16.4
16.4
16.1
15.9
15.9
15.8
15.7
15.5
15.4
15.3
15.2
14.7
14.0
13.2
13.2
12.6
12.3
11.7
9.8
0.05.0
10.015.020.025.030.0
NM AR LA MS TX AL OK AZ DC WV FL NC
GA
NV
OH OR TN AK ME KY KS SC CA U
SA NY HI
MO IN NE
WY RI
WA DE PA SD MT MI
VT ID IL CT WI IA
MD UT
CO NJ
VA MN
NH
MA
ND
Source: Gundersen, C., A. Dewey, M. Kato, , A. Crumbaugh & M. Strayer. Map the Meal Gap 2019: A Report on County and Congressional District Food Insecurity and County Food Cost in the United States in 2017. Feeding America, 2019.
HI17.5
VT15.9
NH12.3
MA11.7RI
17.3CT15.5
NJ13.2
MD15.2
DC21.2
DE17.0
FL20.4
US Child Food Insecurity Rate: 17.7%
39Data Book for New Mexico Human Services DepartmentSection 2A | Demographic Data U.S. & New Mexico

New Mexico Child Food Insecurity Rate: 24.4%
17.120.620.820.921.221.422.022.022.523.124.124.224.424.624.724.925.025.125.925.925.926.626.626.727.127.127.127.227.827.828.4
30.433.433.5
0.0 10.0 20.0 30.0 40.0
LOS ALAMOSGUADALUPE
DE BACASANTA FE
EDDYLINCOLN
LEASANDOVAL
BERNALILLOUNION
VALENCIAMORA
NEW MEXICOCHAVES
RIO ARRIBATAOS
GRANTCURRY
COLFAXHIDALGO
OTEROSAN JUANSOCORRO
ROOSEVELTDOÑA ANA
QUAYSAN MIGUEL
TORRANCEHARDING
SIERRACATRONCIBOLA
LUNAMCKINLEY
Source: Gundersen, C., A. Dewey, M. Kato, , A. Crumbaugh & M. Strayer. Map the Meal Gap 2019: A Report on County and Congressional District Food Insecurity and County Food Cost in the United States in 2017. Feeding America, 2019.
Los Alamos17.1
Section 2A | Demographic Data U.S. & New Mexico
40Data Book for New Mexico Human Services Department
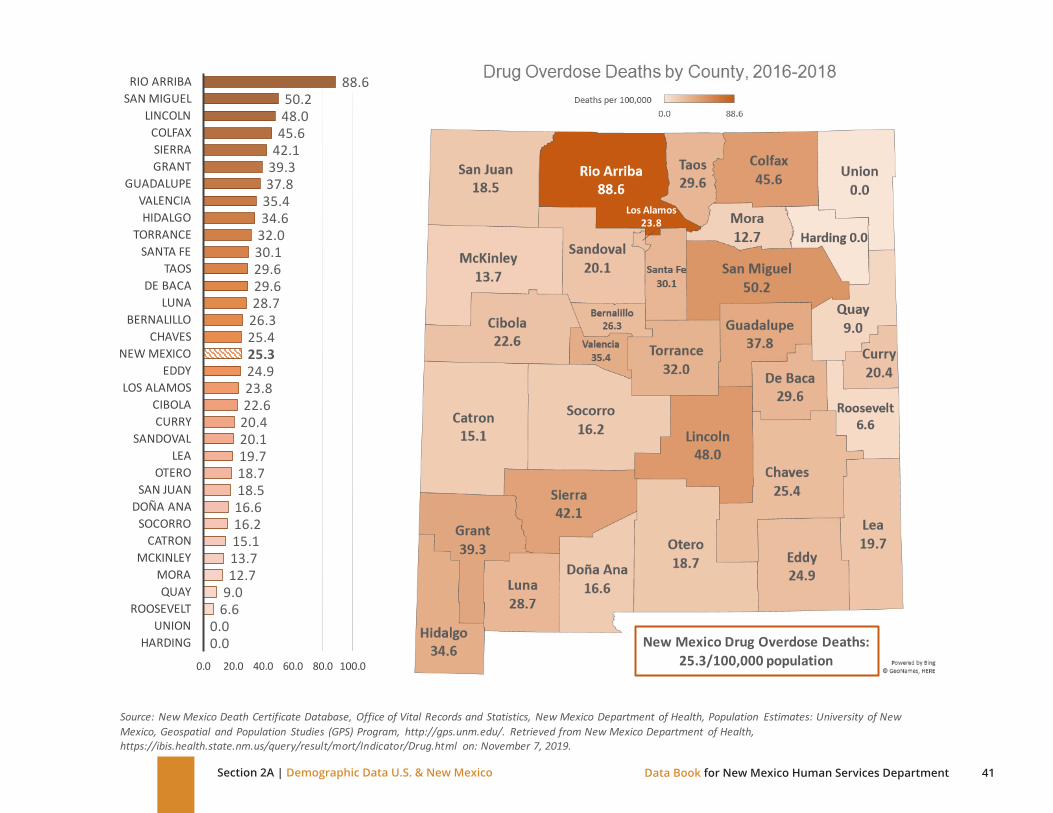
New Mexico Drug Overdose Deaths: 25.3/100,000 population
0.00.0
6.69.012.713.715.116.216.618.518.719.720.120.422.623.824.925.325.426.328.729.629.630.132.034.635.437.839.342.145.648.050.2
88.6
0.0 20.0 40.0 60.0 80.0 100.0
HARDINGUNION
ROOSEVELTQUAY
MORAMCKINLEY
CATRONSOCORRO
DOÑA ANASAN JUAN
OTEROLEA
SANDOVALCURRY
CIBOLALOS ALAMOS
EDDYNEW MEXICO
CHAVESBERNALILLO
LUNADE BACA
TAOSSANTA FE
TORRANCEHIDALGO
VALENCIAGUADALUPE
GRANTSIERRACOLFAX
LINCOLNSAN MIGUELRIO ARRIBA
Source: New Mexico Death Certificate Database, Office of Vital Records and Statistics, New Mexico Department of Health, Population Estimates: University of New Mexico, Geospatial and Population Studies (GPS) Program, http://gps.unm.edu/. Retrieved from New Mexico Department of Health, https://ibis.health.state.nm.us/query/result/mort/Indicator/Drug.html on: November 7, 2019.
Los Alamos23.8
41Data Book for New Mexico Human Services DepartmentSection 2A | Demographic Data U.S. & New Mexico
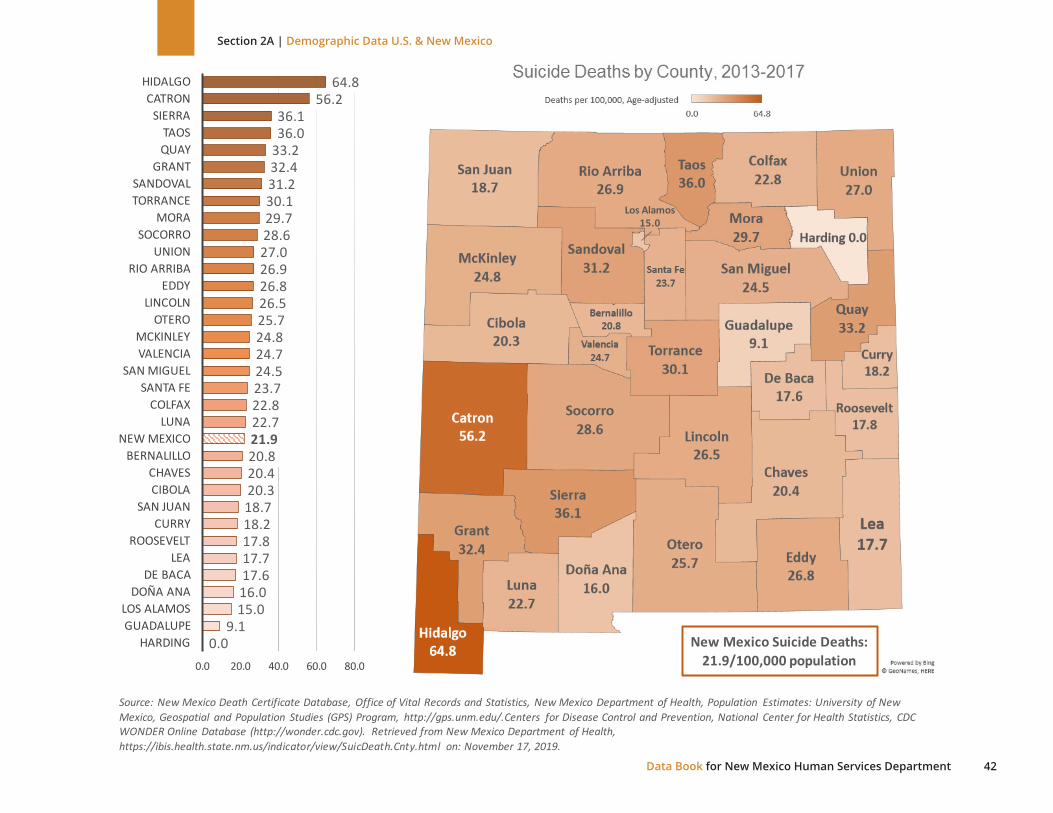
New Mexico Suicide Deaths: 21.9/100,000 population
0.09.1
15.016.017.617.717.818.218.720.320.420.821.922.722.823.724.524.724.825.726.526.826.927.028.629.730.131.232.433.236.036.1
56.264.8
0.0 20.0 40.0 60.0 80.0
HARDINGGUADALUPELOS ALAMOS
DOÑA ANADE BACA
LEAROOSEVELT
CURRYSAN JUAN
CIBOLACHAVES
BERNALILLONEW MEXICO
LUNACOLFAX
SANTA FESAN MIGUEL
VALENCIAMCKINLEY
OTEROLINCOLN
EDDYRIO ARRIBA
UNIONSOCORRO
MORATORRANCESANDOVAL
GRANTQUAYTAOS
SIERRACATRON
HIDALGO
Source: New Mexico Death Certificate Database, Office of Vital Records and Statistics, New Mexico Department of Health, Population Estimates: University of New Mexico, Geospatial and Population Studies (GPS) Program, http://gps.unm.edu/.Centers for Disease Control and Prevention, National Center for Health Statistics, CDC WONDER Online Database (http://wonder.cdc.gov). Retrieved from New Mexico Department of Health, https://ibis.health.state.nm.us/indicator/view/SuicDeath.Cnty.html on: November 17, 2019.
Los Alamos15.0
Section 2A | Demographic Data U.S. & New Mexico
42Data Book for New Mexico Human Services Department
