u.s. investment research
DESCRIPTION
TRANSCRIPT

MORGAN STANLEY
U.S.InvestmentResearch
This memorandum is based on information available to the public. No representation is made that it is accurate or complete. This memorandum is not an offer tobuy or sell or a solicitation of an offer to buy or sell the securities mentioned. Morgan Stanley & Co. Inc. and others associated with it may have positions in andeffect transactions in securities of companies mentioned and may also perform or seek to perform investment banking services for those companies.
February 1996
Mary Meeker (212) 761-8042 / [email protected]
Technology/New Media Chris DePuy (212) 761-6562 / [email protected]
The Internet Report
Morgan Stanley Global Technology Group:
Data Networking: George KellyPC Software/Hardware & New Media: Mary MeekerEnterprise Software: Chuck PhillipsServer Hardware: Steve MilunovichTelecommunications Equipment: Neil DanzgerComputer Services: Mark WolfenbergerSemiconductors: Alan RieperSemi. Equip., Wireless & Peripherals: Robert MaireDesign Software: Alkesh ShahDistribution: Shelby FleckCross Industry: Bob Austrian
European Technology: Angela DeanJapanese Technology: Takatoshi YamamotoJapanese Technology: Mitsuko MoritaJapanese Technology: Noriko OkiAsia/Pacific Electronics: Richard Wei
Other Contributors:
Economist: Steve RoachPublishing: Doug ArthurTelecommunications Services: Stephanie ComfortCable Television: Rich BilottiFinancial Services: David HilderEmerging Growth: Mike Sorell

MORGAN STANLEY
This memorandum is based on information available to the public. No representation is made that it is accurate or complete. This memorandum is not an offer tobuy or sell or a solicitation of an offer to buy or sell the securities mentioned. Morgan Stanley & Co. Inc. and others associated with it may have positions in andeffect transactions in securities of companies mentioned and may also perform or seek to perform investment banking services for those companies.
Trail Map: How to Read This Report
• We have prepared this report with many audiences in mind, and believe it is possible to satisfy most investors seekinginformation on the subject of the rapidly growing, commercial Internet. We hope this report will be used as a reference foridentifying risks, rewards, market opportunities, investment ideas, company competitive strategies, products, and how theInternet works. Since this report was published during the ski season, we offer some trail identifiers to help the readernavigate through the report.
uuDouble Diamond — Already know the technology andcompanies but want to understand their strategies:
Read Chapters 1, 3, 10, 15, 16, and browse 11.
uExpert — Already read all those “other” reports:
Read Chapters 1, 2, 3, 5, 6, 7, 9, 10, 14, 15, 16, 19, andbrowse 11.
nIntermediate — Browser-literate and knows own e-mailaddress:
Read Chapters 1, 2, 3, 5, 6, 7, 8, 9, 10, 11, 12, 14, 15, 16,17, 18, and 19.
lNovice — Never heard of Motley Fool, c|net, or Yahoo:
Read Chapter 1, and read Chapters 2 through 19.
• Generally speaking, mastering Sections II, III, and IV can make the reader sound smart at cocktail parties; knowingSections I and V can impress your accountant; and dropping a few URLs from Chapter 12 during dinner will wow thekids.

MORGAN STANLEY
This memorandum is based on information available to the public. No representation is made that it is accurate or complete. This memorandum is not an offer tobuy or sell or a solicitation of an offer to buy or sell the securities mentioned. Morgan Stanley & Co. Inc. and others associated with it may have positions in andeffect transactions in securities of companies mentioned and may also perform or seek to perform investment banking services for those companies.
Table of Contents
Section I: Introduction1. Summary and Investment Conclusion................................................ 1–12. The Internet: Past, Present, and Future .............................................. 2–13. Internet Market Size.......................................................................... 3–1
Section II: Features and Uses of the Internet4. How to Use the Internet..................................................................... 4–1
Section III: Infrastructure5. Worldwide Internet Infrastructure ..................................................... 5–16. Internet Service Provider Infrastructure ............................................. 6–17. Customer Premise Infrastructure ....................................................... 7–1
Section IV: Software8. Software............................................................................................ 8–1
Section V: Company-Related9. Technology and Administrative Issues............................................... 9–110. Competitive Analysis......................................................................10–1
Section VI: Supporting Documentation11. Company Descriptions....................................................................11–112. Morgan Stanley’s Internet Cool Sites .............................................12–113. Internet Glossary.............................................................................13–114. Morgan Stanley Internet Basket.......................................................14–115. Internet-Specific Stock Universe......................................................15–116. Internet-Related Stock Universe......................................................16–117. Media Stock Universe......................................................................17–118. Technology Stock Universe.............................................................18–119. Internet/Internet-Related Company Financial Data..........................19–1
FIGURES
Chapter 11.1 Internet Host Growth......................................................................... 1–71.2 Life Cycles of Mainframe, Mini, PC and Internet Enabled Systems ... 1–91.3 Timing and Development of Internet Market Segments ...................1–101.4 Competitive Analysis Internet Industry Over Next 2 to 3 Years.......1–13
Chapter 22.1 Internet Backbone (NSFNet) and Regional Networks Service............ 2–2
Chapter 33.1 Estimated Numbers of Internet, E-Mail, PC Users
In the U.S. and Worldwide, 1986–2000E........................................... 3–2

MORGAN STANLEY
This memorandum is based on information available to the public. No representation is made that it is accurate or complete. This memorandum is not an offer tobuy or sell or a solicitation of an offer to buy or sell the securities mentioned. Morgan Stanley & Co. Inc. and others associated with it may have positions in andeffect transactions in securities of companies mentioned and may also perform or seek to perform investment banking services for those companies.
Chapter 3 (cont.)
3.2 Internet Growth Drivers 1990–2005E................................................ 3–3
3.3 Internet Host Growth (Normal Scale) 1969–95E................................ 3–7
3.4 Internet Host Growth (Semi-Log Scale) 1969–95E............................ 3–7
3.5 Internet Traffic Usage on the NSFNet Backbone................................ 3–8
3.6 Worldwide Distribution of Computers 1994.....................................3–11
3.7 Share of Total Worldwide MIPS 1994.............................................3–11
3.8 Household Penetration of Consumer Electronics Products...............3–15
Chapter 44.1 StreamWorks, RealAudio, Internet Phone and Worlds Chat Session.. 4–9
Chapter 55.1 A Corporate Network........................................................................ 5–2
5.2 A Corporate Internetwork.................................................................. 5–2
5.3 Organization of Internet, 1986 through April 1995............................ 5–3
5.4 Internet Backbone (NSFNet) and Regional Networks Service............ 5–3
5.5 Worldwide Internet Connectivity....................................................... 5–4
5.6 Organization of Internet, April 1995 Through 1998 .......................... 5–4
5.7 The New NSFNet Service, 1995........................................................ 5–5
Chapter 66.1 Netcom Points of Presence and Telecommunications Backbone......... 6–1
6.2 UUNET DS-3 Backbone Network...................................................... 6–2
6.3 PSINet Leased and Dial-Up Connections........................................... 6–3
6.4 Typical PSI Point of Presence (POP)................................................. 6–5
Chapter 77.1 Client PC or Workstation Connection to a Network........................... 7–1
7.2 Client PC or Workstation Connection to an ISP................................. 7–2
7.3 Corporate Network Connected to the Internet.................................... 7–5
Chapter 88.1 Components of an Internet Server ..................................................... 8–5
8.2 Web Server Market Share by Operating System................................. 8–7
8.3 Web Server Market Share by CPU..................................................... 8–7
8.4 Web Server Market Share by HTTPd Server...................................... 8–7
Chapter 99.1 Bandwidth Technology Adoption...................................................... 9–3
9.2 HTML Code Sample......................................................................... 9–6
Chapter 1010.1 Data Networking Equipment Competitive Analysis.........................10–2
10.2 Internet Security Equipment & Software Competitive Analysis.......10–2
10.3 Internet Service Providers Competitive............................................10–3
10.4 PC, Servers and Semiconductors Competitive Analysis...................10–4

MORGAN STANLEY
This memorandum is based on information available to the public. No representation is made that it is accurate or complete. This memorandum is not an offer tobuy or sell or a solicitation of an offer to buy or sell the securities mentioned. Morgan Stanley & Co. Inc. and others associated with it may have positions in andeffect transactions in securities of companies mentioned and may also perform or seek to perform investment banking services for those companies.
Chapter 10 (cont.)
10.5 Telecommunications and Related Services Competitive Analysis.....10–4
10.6 Telecommunications Equipment Competitive Analysis....................10–5
10.7 Application Software Competitive Analysis.....................................10–6
10.8 Enterprise and Networking Software Competitive Analysis.............10–6
10.9 Internet/Online Consulting & Development Competitive Analysis... 10–7
10.10 Organization/Aggregation Competitive Analysis.............................10–8
10.11 Information Competitive Analysis...................................................10–9
10.12 Publications/Static Competitive Analysis.........................................10–9
10.13 Publications/Interactive Competitive Analysis................................10–10
10.14 Publishing (Traditional) Competitive Analysis ...............................10–10
10.15 Transaction Processing & Financial Services Competitive..............10–11
10.16 Commerce Competitive Analysis....................................................10–11
TABLES
Chapter 11.1 Recommended Internet Stock Portfolio.............................................. 1–3
1.2 Perspectives on Market Opportunities................................................ 1–7
1.3 Estimated Internet-Related Revenues 1995–2000E..........................1–12
Chapter 33.1 Worldwide Connectivity Market 1995E–2000E................................. 3–1
3.2 Internet Host Growth Rate 1990–95E................................................ 3–7
3.3 OSP Subscribers, August 1994 to December 1995............................. 3–9
3.4 ISP Subscribers, September 1994 to December 1995.......................... 3–9
3.5 Regional Host Growth on the Internet 1Q–4Q95.............................3–10
3.6 Top 20 Internet Geographic Domains May 1995 .............................3–10
3.7 Browser and Operating System Statistics.........................................3–12
3.8 Consumer Electronics Sales.............................................................3–15
3.9 Number of PCs, Modems, and Internet Users 1984–2000................3–16
Chapter 44.1 Internet Resources and Enabling Applications................................... 4–4
Chapter 88.1 Third-Generation Applications Available Today................................ 8–2
8.2 The “Big Four” Web Browsers.......................................................... 8–3
8.3 Proprietary Web Browsers................................................................. 8–4
8.4 Web Server Software......................................................................... 8–6
Chapter 99.1 Four Waves of Bandwidth................................................................. 9–2
Chapter 1010.1 Estimated Trends Over Next 5 Years...............................................10–1

MORGAN STANLEY
This memorandum is based on information available to the public. No representation is made that it is accurate or complete. This memorandum is not an offer tobuy or sell or a solicitation of an offer to buy or sell the securities mentioned. Morgan Stanley & Co. Inc. and others associated with it may have positions in andeffect transactions in securities of companies mentioned and may also perform or seek to perform investment banking services for those companies.
Chapter 1111.1 Internet Infrastructure Companies ...................................................11–2
Chapter 14Internet Basket: Performance, Valuation & Financial Statistics ................14–1
Chapter 15Internet-Specific Stock Universe................................................................15–1
Chapter 16Internet-Related Stock Universe.................................................................16–1
Chapter 17Media Stock Universe................................................................................17–1
Chapter 18Technology Stock Universe........................................................................18–1
Chapter 19
Data Networking Equipment3Com — Income Statement.......................................................................19–3
Ascend Communications — Earnings Model 1993-1997E.........................19–4
Boca Research — Financial Summary F1993–F1995.................................19–5
Cisco Systems — Income Statement..........................................................19–6
Motorola — Income Statement 1994–1997E..............................................19–7
U.S. Robotics — Income Statement...........................................................19–8
Xircom — Income Statement.....................................................................19–9
Zoom Telephonics — Financial Summary F1993–F1995..........................19–10
Internet Security Equipment and SoftwareSecurity Dynamics Technologies — Financial Summary F1993–F1995....19–11
Internet Service ProvidersBBN Corporation — Financial Summary F1993–F1995...........................19–12
Netcom — Financial Summary F1993–F1995..........................................19–13
PSINet — Financial Summary F1993–F1995...........................................19–14
UUNET Technologies — Financial Summary F1993–F1995....................19–15
PCs, Servers, and SemiconductorsApple Computer — Income Statement Comparisons F1994–F1996E........19–16
Compaq Computer — Income Statement Comparisons 1993–1996E........19–17
Dell Computer — Income Statement Comparisons F1994–F1996E..........19–18
Digital Equipment Earnings Model ..........................................................19–19
Hewlett-Packard Earnings Model..............................................................19–20
IBM Earnings Model................................................................................19–21
Intel Earnings Summary 1994–1996E ......................................................19–22
Silicon Graphics Earnings Model .............................................................19–23
Sun Microsystems.....................................................................................19–24

MORGAN STANLEY
This memorandum is based on information available to the public. No representation is made that it is accurate or complete. This memorandum is not an offer tobuy or sell or a solicitation of an offer to buy or sell the securities mentioned. Morgan Stanley & Co. Inc. and others associated with it may have positions in andeffect transactions in securities of companies mentioned and may also perform or seek to perform investment banking services for those companies.
Telecommunications and Related ServicesAT&T — Income Statement.....................................................................19–25Comcast — Consolidated CATV Systems.................................................19–26Cox Communications — Consolidated CATV Systems.............................19–27MCI Communications..............................................................................19–28Sprint — Consolidated Statement of Income 1994–96E............................19–29Tele-Communications — TCI Group — Consolidated CATV Systems.....19–30WorldComm — Consolidated Income Statement......................................19–31
Telecommunications EquipmentADTRAN — Earnings Model 1994-1997E...............................................19–32Cascade Communications — Earnings Model 1995–1997 ........................19–33DSC Communications — Earnings Model 1993–1996E ...........................19–34StrataCom — Earnings Model 1993–1995................................................19–35
Application SoftwareAdobe Systems — Income Statement Comparisons F1995–F1997E..........19–36FTP Software — Financial Summary F1993–F1995.................................19–37Firefox Communications — Financial Summary F1993–F1995................19–38Intuit — Income Statement Comparisons F1994–F1996E.........................19–39Macromedia —Income Statement Comparisons F1995–F1997E...............19–40Microsoft — Income Statement Comparisons F1994–F1996E..................19–41NetManage — Financial Summary F1993–F1995 ....................................19–42Netscape Communications — Income Statement 1994–96E.....................19–43Spyglass — Financial Summary F1993–F1996.........................................19–44
Enterprise and Networking SoftwareInformix — Sales and Earnings Summary Fiscal 1994–1996E .................19–45Novell — Sales and Earnings Summary Fiscal 1995–1997E.....................19–46Oracle Systems — Sales and Earnings Summary Fiscal 1995–1997E .......19–47
Internet/Online Services Consulting and DevelopmentFIND/SVP — Financial Summary F1993–F1995.....................................19–48
Organization/AggregationAmerica Online — Income Statement Comparisons F1995–F1997E.........19–49H&R Block/CompuServe — Financial Summary F1994–F1995................19–50
Publishing (Traditional)Dun & Bradstreet — Sales and Earnings Summary 1994–1995................19–51Gannett — Sales and Earnings Summary 1994–1996E.............................19–52Knight-Ridder — Sales and Earnings Summary 1994–1996E...................19–53McGraw-Hill — Sales and Earnings Summary 1994–1996E....................19–54McClatchy Newspapers — Sales and Earnings Summary 1994–1996E.....19–55New York Times — Sales and Earnings Summary 1994–1996E...............19–56Times Mirror — Sales and Earnings Summary 1994–1996E ....................19–57Tribune — Sales and Earnings Summary 1994–1996E.............................19–58HNC Software — Income Statement Comparisons....................................19–59VeriFone..................................................................................................19–60

MORGAN STANLEY
This memorandum is based on information available to the public. No representation is made that it is accurate or complete. This memorandum is not an offer tobuy or sell or a solicitation of an offer to buy or sell the securities mentioned. Morgan Stanley & Co. Inc. and others associated with it may have positions in andeffect transactions in securities of companies mentioned and may also perform or seek to perform investment banking services for those companies.
Chapter 3: Internet Market Size
Summary
• Though the numbers of Internet and online service users cannot be measured with certainty, we estimate that as of year-end C1995 there were 9 million users of the Internet’s World Wide Web, with 75% of them in the U.S. This figure repre-sents about 3% of the U.S. population.
• We estimate there are more than 35 million users of e-mail.
• With the increasing use of the PC as a communications device and the growing need for global information access, weestimate that e-mail users could number 200 million worldwide by the year 2000, and that about 150 million of these couldaccess the Internet/Web, with slightly less than half representing U.S. users. These numbers would represent 35% and30%, respectively, of the projected U.S. population. While we doubt that our estimates are entirely accurate, we believe theyhave directional significance. There are currently about 150 million PC users in the world, and over the next one to fouryears many PCs should be replaced by more powerful, communications-enabled PCs. In our opinion, a factor that mightpreclude these PCs from accessing the Web would not be lack of demand but rather lack of bandwidth.
• We have used the ramp of Microsoft’s Windows operating system (which went from an installed base of 3 million usersin 1990 to about 115 million today) as a sanity check in creating our Internet growth estimates.
• In short, we believe that Internet market growth has just begun, and that it will prove to be big.
Summary of Market Estimates
We believe that, within a decade, there is a good chance thePC and the Internet will become ubiquitous in the U.S.,with other industrialized countries following within fiveyears. While many companies are eager to get a handle onthe actual and projected size of the Internet, unfortunatelythere is currently no precise, direct method of counting us-ers. Even the foremost experts on sizing the Internet, Net-work Wizards, said in July 1995, “No one has any clue howmany Internet users there are.”
Nonetheless, we have joined the fray, and made what wefeel are conservative estimates of the current and futureInternet user base, based primarily upon observable growthrates of hosts, domains, and networks, and to a lesser de-gree on market research. We have correlated these resultswith the counts of subscribers to online services and Inter-net services, correlated those with user surveys, and cross-checked the results to ensure that they are consistent withgoverning factors to growth, such as the PC installed base,demographics, and regional populations.
To summarize, we estimate there are currently about 9 mil-lion interactive Internet users and about three times thatnumber who use e-mail (Table 3.1). We estimate that thenumber of Internet/Web users could grow to about 150million by the year 2000. By then, we expect most users tohave real-time graphical user interface access and to use e-mail. For the record, we define a user as an individual whouses the service at least two or three times per month —anything less probably means the user is borrowing some-one else’s account, which implies no revenue generation.
Table 3.1
Worldwide Connectivity Market 1995E–2000E
(Millions)1995 1996 1997 1998 1999 2000
Users of:PCs 144 167 184 203 217 225
E-Mail 35 60 80 130 180 200
Net/Web 9 23 46 81 122 152
Online/Hybrid 8 13 18 23 27 30
Source: Morgan Stanley Research Estimates.

3-2 MORGAN STANLEY
This memorandum is based on information available to the public. No representation is made that it is accurate or complete. This memorandum is not an offer tobuy or sell or a solicitation of an offer to buy or sell the securities mentioned. Morgan Stanley & Co. Inc. and others associated with it may have positions in andeffect transactions in securities of companies mentioned and may also perform or seek to perform investment banking services for those companies.
Sizing the Market
By all counts, the number of Internet users is growing rap-idly, at a historical sustained rate of approximately 100%per year for the past five or ten years. Similar growth isoccurring in the online services market. However, there isa distinct difference between the ways user growth can bemeasured for each of the two segments of cyberspace.
In the online service provider (OSP) market, there are a fewkey players (e.g., America Online, CompuServe, andProdigy), and each has a proprietary system that can beaccessed only by subscription. This allows the relativelysimple measurement of number of subscribers. However,there is not necessarily a one-to-one relationship betweenthe number of subscribers and the number of users of OSPs,as there can be multiple users accessing a single account or
an individual who has multiple accounts. We estimate a25% overlap in online service users — that is, on average,one of every four users have two accounts. Thus, in esti-mating the number of OSP users, we have factored in thelikelihood that some users have multiple accounts.
On the other hand, it is impossible to count the number ofInternet users, due to the various ways people access theInternet. Today, it carries much less meaning to count thenumber of Internet service provider (ISP) subscriber ac-counts, as there are generally two types of accounts: indi-vidual and commercial. For purposes of counting users,individual ISP accounts are much like those of OSP ac-counts. For commercial users, anywhere from one to100,000 or more users could be served through one ac-count. Therefore, with no means to directly count Internetusers, only estimates can be made.
Figure 3.1
Estimated Numbers of Internet, E-Mail, PC Users In the U.S. and Worldwide, 1986–2000E
0
50
100
150
200
250
300
1986
1987
1988
1989
1990
1991
1992
1993
1994
1995
1996
1997
1998
1999
2000
Use
rs (
MM
)
PC Users (MM) Internet/Web Users (MM)
Online/Hybrid Users (MM) E-Mail Users (MM)
Source: Morgan Stanley Research Estimates.

MORGAN STANLEY 3-3
This memorandum is based on information available to the public. No representation is made that it is accurate or complete. This memorandum is not an offer tobuy or sell or a solicitation of an offer to buy or sell the securities mentioned. Morgan Stanley & Co. Inc. and others associated with it may have positions in andeffect transactions in securities of companies mentioned and may also perform or seek to perform investment banking services for those companies.
Figure 3.2
Internet Growth Drivers 1990–2005E
1990 1995 2000 2005
Full 'Web Access' Users as % of total
Internet Users
Types of U.S. Users
Types of International Users
Emergence of Key Applications
PCs & Internet App's Drive Growth
Bandwidth Increases
Media Improve
0% 1% 20% 50% 75% 95%
U.S. Early Adopters
U.S. Corporate Adopters
U.S. Consumer Adopters
Int'l Early Adopters
Int'l Corporate Adopters
Int'l Consumer Adopters
Mosaic
*Real-time audio*Telephone on Internet
*Cross-Platform Executables*Cross-Platform Executables*Real-time video
PC's are enabled with IP - U.S. growth accelerates
U.S. Growth Rate Declines as PC Unit Growth Governs
Narrowband- 9600 to 28.8 kbps
Midband - 28.8 to 128+ kbps
Broadband - 1+ Mbps (1)
Text Pictures and audio Video
1990 1995 2000 2005
Source: Morgan Stanley Research Estimates. (1) Many corporate users currently have T-1 (1.5 Mbps) connections.
As an example, corporate accounts typically connect theirnetwork to an ISP through a permanent leased line, usuallya T-1 line (1.5 mbps), although 56K frame relay and ISDNconnections are also popular. Though certain applicationsmay exceed the capacity of a T-1, common applicationsused on the Internet require considerably less bandwidth;therefore, a T-1 connection would allow simultaneous usersto access the Internet through the same corporate account.So, as many as ten — or even several hundred — peoplecould gain access to the Internet via a corporate local-areanetwork (LAN) connected to the Net by a T-1 line. Bycontrast, it is relatively easy to estimate the number of usersper modem/dial-up account because, typically, only oneuser (or perhaps two or three) would connect through suchan account, as it would not provide adequate bandwidth formore users (even if the account used a high-speed 28.8 kbpsmodem connected to a LAN).
People use the Internet for many reasons, and they usuallyestablish a degree of connectivity that suits their needs andbudget. Generally, there are three such degrees of Internet
connectivity today, listed below from least expensive tomost expensive:
• E-mail and Usenet news only;• Partial Internet access; and• Fully-interactive, Web Internet access.
By the end of 1994, there were about ten times as many e-mail users as Web users. Each of the three types of accessrepresents a unique user class on the Internet. We believethe type of Internet access is an important factor for esti-mating the future of the Internet market segment. So weconsidered the factors that affect users’ decisions to use onetype of access over another.
We believe that, in about five years, the growth in Internet-connected computers will be strongly correlated with therate of growth in the installed base of PCs. However, ini-tially we expect the existing installed base to connect to theInternet rapidly. In addition, we expect other phenomenaover the next 15 years. To back up for a moment: In the

3-4 MORGAN STANLEY
This memorandum is based on information available to the public. No representation is made that it is accurate or complete. This memorandum is not an offer tobuy or sell or a solicitation of an offer to buy or sell the securities mentioned. Morgan Stanley & Co. Inc. and others associated with it may have positions in andeffect transactions in securities of companies mentioned and may also perform or seek to perform investment banking services for those companies.
early 1990s and before, Internet users generally were in theclass of “early adopters,” defined in this context as the re-search, academic, and corporate beta-test community.Then, beginning about 4Q94, corporate America beganadopting the Internet as a means of marketing and of serv-ing customers. Now, we anticipate a period of two or threemore years where corporate America’s demand for Internetconnectivity will continue at an accelerating rate, followedby a more modest pace that’s more correlated with thegrowth in corporate America itself.
Second, although a small number of consumers startedconnecting to the Internet in 1Q95, we believe they willbegin connecting in earnest during 1996–97, and that therate of growth in American Internet connectivity will con-tinue at a near-100% annual rate until the late 1990s.
Third, we believe that each user class (early, corporate, orconsumer adopter) outside the U.S. will follow about threeto five years behind the respective U.S. adopter classes.There are two good explanations for this lag: 1) Most ap-plications are written first in English and later translated,and 2) PCs and connectivity tend to cost more in geogra-phies that have low per-user density. We have observed asimilar lag in adoption of the PC. In fact, Europe, whichtends to adopt PCs quicker than most other non-U.S. areas,is still buying 486s in earnest. In 1994, a large number ofinternational Internet connections were established by thosewhom we would characterize as early adopters.
Once corporate non-U.S. connections accelerate, we expectthe overall growth rate of international connections to sur-pass the U.S. rate in the late 1990s. We would then expectinternational consumers to connect in earnest around theturn of the century. In general, we expect the adoption cy-cle for the international market to be slightly more com-pressed than for the U.S., as many of the technical issuesthat prevailed during the U.S.’s early adopter phase (1969to the early 1990s) probably will have been addressed.
We looked at installed-base figures for other electronicsproducts, such as the telephone, television, and, of course,the PC, as “sanity checks” when calculating the Internetmarket size figures. It seems the PC is reaching, or hasrecently reached, critical mass by achieving a penetrationrate of nearly one-third of the U.S. home market, just astelevision in the U.S. did in the late 1950s (TV is now inabout 99% of homes.) The availability of relatively easy-to-
use, fully interactive, graphical user interface software,such as Mosaic and later Netscape, that allows PCs (not justUNIX minicomputers and mainframes) to communicateglobally is driving a fast-growing industry — the OSP/ISPmarket. One hurdle to more mass appeal for the Internet isthe cost of connectivity, including capital costs (PC andsoftware) and monthly subscriber fees (the OSP/ISPcharge).
In the rest of this chapter, we detail our calculation meth-ods for the analysis of the Internet and online service mar-ket sizes. After defining the degrees of connectivity and thetypes of users, we present a summary of the market size —past, present, and future. Next, we present measurable andreportable facts that are available on the growth of the In-ternet. Then we present surveys on user demographics,hardware usage, and service usage, as well as an abridgedversion of others’ Internet sizing estimates. Later, we offerour opinions on the surveys and relate them to the facts,and, finally, we lay out our projections and rationale for thefuture of the market.
Degrees of Connectivity
We have presented historical Internet user data to reflectthree degrees of Internet connectivity: E-mail and Usenetnews only, partial Internet access, and fully interactive,Web/Internet access. In the vast majority of cases, userswith full Web access also have the capabilities of the par-tial-Internet and e-mail/Usenet users. Likewise, users withpartial Internet access usually have e-mail/Usenet access.Looking at it the other way, e-mail/Usenet-only users don’thave partial Internet or full Web access, and partial Internetusers do not have full Web access.
The first group, and the largest, is e-mail/Usenet users, whoare defined as having the capability of obtaining Internet e-mail and Usenet information only. Such users work oncomputers that may or may not be “hosts” on the Internet,meaning they will not necessarily be counted in the Internethost numbers presented in the following section, and thusmay not necessarily be directly connected to the Internet.Rather, these users may be connected to systems that getregular “batch feeds” from Internet-connected computersthat contain e-mail or Usenet news for users on that par-ticular system. For example, if you receive e-mail via aninternal corporate mail system, then you’re one of theseusers. Or, for instance, up until 1995 CompuServe users
MORGAN STANLEY 3-5
This memorandum is based on information available to the public. No representation is made that it is accurate or complete. This memorandum is not an offer tobuy or sell or a solicitation of an offer to buy or sell the securities mentioned. Morgan Stanley & Co. Inc. and others associated with it may have positions in andeffect transactions in securities of companies mentioned and may also perform or seek to perform investment banking services for those companies.
were only counted as e-mail/Usenet users because the Com-puServe system only received batch feeds of Internet mail.Many corporate networks have this degree of connectivity.Another example is the FidoNet network, used frequentlyby bulletin board services (BBSs).
Second, partial Internet access comprises a class of userswho have real-time access (in contrast to the delayed batch-feed method) to other Internet hosts but lack the degree ofgraphics capability or connectivity needed to interact on theWeb. In most cases, this type of connection is a UNIXshell account, which users have access to through a termi-nal-emulation software package. Therefore, the user’scomputer is not technically a “node” on the Internet, and assuch cannot run many fully-interactive programs, includinga Mosaic-based Web browser.
This deficiency is usually due to a lack of computationalpower required to run graphics programs such as Mosaic,limitations imposed on the network, or limitations on thetype of connection. An example of the second deficiencymay be that the management at a company has decided thatusers should have only FTP capabilities, evidently assum-ing employees will waste too much time on the service orthat the service is not necessary. An example of the thirddeficiency, a connection limitation, may be that the com-puter is not IP-enabled (i.e., is not a true host) but has lim-ited access to a host that allows the remote computer toissue certain (non-Web) commands. This can be accom-plished with terminal-emulation software, which is howDelphi offered Internet access in 1994. Typically, this typeof account has a command-line, text-based interface. An-other example of this type is one who uses a Unix-shell-only account.
Third, full Web access implies that the user is working onan IP-enabled computer (with some exceptions) that hasgraphics capabilities, such as Mosaic-type Web software.The full Web access computer usually has either a perma-nently registered Internet address or a temporary Internetaddress (where the computer is only considered a host dur-ing an active session). Once this type of connection is es-tablished, full Web access is achieved, and users can runWeb browser software. Many OSPs (such as AOL, Com-puServe, and Prodigy) offer full Web access — althoughonly a fraction of subscribers, perhaps 20% or 30%, use it.ISPs such as Netcom, PSINet, UUNET, BBN Planet offerfull Web access to users, except those with shell accounts.
Who Are ‘Users’?
We believe many previously published online/Internet userand subscriber measurements have been somewhat mislead-ing. Subscriber data can over- or under-represent the num-ber of real users, as users often have more than one OSP orISP account. For example, a fair number of corporate usersof the Internet also have personal OSP or ISP subscriberaccounts. On the other hand, corporations frequently en-able large numbers of their networked computers with ei-ther IP or Internet e-mail capabilities. Not all of thesecomputers are registered on the Internet, and users of theenabled computers often do not otherwise use the Internet.Perhaps five years ago, there were ten users per host. Thisis no longer the case, and the ratio is changing rapidly. Inaddition, users commonly share computers that are on theInternet, and increasingly common protocols, such as PPP,allow the sharing of IP addresses.
We define a user as an individual who accesses a service atleast two or three times per month. Any less than that, andthe user probably is borrowing someone else’s account.
What Are Hits, Visits, and Caching?
Other means of assessing Internet usage have been adoptedby various Internet content and service providers. One suchmethod is by counting “hits” to a Web server. Essentially,a hit represents the number of files that have been uploadedfrom the server to the client. A count of files sent, or“hits,” is entered into the log file of a server. A hit is gen-erated by every request made to a Web server, and thus haslittle predictable relation to users, visitors, or pages.
A Web server responds to a client’s request to upload filesmost frequently when a client requests a page, such as ahome page. However, the number of files that make up aparticular page depends on the number of graphics filesused to construct the page, as well as other factors related tothe way the page was designed.
The second means of counting Internet site usage is tocount user “visits.” Technically, a visit is a sequence ofhits made by a single user at a single time. Several soft-ware/service companies, such as I/Pro and Netcount, havedeveloped relatively sophisticated applications to countvisits.

3-6 MORGAN STANLEY
This memorandum is based on information available to the public. No representation is made that it is accurate or complete. This memorandum is not an offer tobuy or sell or a solicitation of an offer to buy or sell the securities mentioned. Morgan Stanley & Co. Inc. and others associated with it may have positions in andeffect transactions in securities of companies mentioned and may also perform or seek to perform investment banking services for those companies.
Measurement of user counts and Web usage is often dis-torted by caching, which is the storing or buffering of datain a temporary location. The data (e.g., a home page) canthen be retrieved quickly, which makes an application, likea Web browser, run faster. On the Internet, caching occursin two different places: at OSP networks, where contentfrom Internet sites is cached on servers, and on the harddrives of local PCs or workstations, where graphics filesfrom frequently visited sites are stored so that they can beretrieved locally when sites are revisited.
The second, local type of caching does not distort Internetusage counts, but the first, OSP caching, does, because thecached files are duplicates that reside in locations otherthan the original Web site. Thus, an OSP subscriber re-questing a particular Web page might actually receive theOSP’s cached version, resulting in fewer hits to the originalWeb site, or none at all. This creates problems for adver-tisers on the Web, which can’t be sure how many peoplethey’re actually reaching (refer to the Glossary later in thisreport for definitions of hit, page, media objects, visit,unique users, AdViews, AdClicks, AdClick Rate, andQualified Hits). Netscape may have a solution with its http“cookies,” files that track more accurately individuals’ useof the Internet.
Intranet versus the Internet
An intranet is a network (or internetworked system) thatuses TCP/IP but is not available to Internet users outsidethe network. Intranets are commonly used by corporationsto allow employees connected to the system to “browse”through corporate information, such as schedules, companyevents, employee manuals, technical standards, and soforth. In the future, intranets probably will be used to allowcollaborative work-sharing among users in the same corpo-ration, even if they’re in different locations.
There seems to be a lot of confusion in the marketplaceabout the difference between Intranet and Internet users.Both use browsers, servers, workstations, routers, bridges,call-aggregating (remote-access) devices, and other similarsoftware and hardware. The difference, however, is thatthe Internet is public, while Intranets are private. Nonethe-less, because both systems are based on the same protocols,
corporations with Intranets can relatively easily connecttheir networks to the Internet. In fact, Netscape estimatesthat half of its browser users are part of Intranets.
Facts — Past and Present
Any new user must register with his or her ISP or OSPprior to connecting to the Internet, to avoid duplicate Inter-net addresses. As a result, government contractors respon-sible for the collection of this publicly available informationhave been able to track trends in the number of hosts, do-mains, and networks, as well as the types and locations oforganizations. In the following paragraphs we present theraw data, which identify growth trends in:
• Hosts, domains, and networks; and• Hosts by country and domain types (.com, .gov, and soforth).
In addition, we have compiled information on some com-mercially oriented services related to the Internet. Thisinformation includes:
• The number of ISP subscribers of UUNET, PSINet, Net-com, and BBN Planet; and• The number of OSP subscribers and the percentage ofOSP users on the Internet.
Put simply, hosts are devices permanently connected to theInternet. Registered with the government contractor thatmaintains such lists, the devices include computers androuters. “Domains” are unique names for Internet connec-tions, which are hierarchical in nature. For instance, the(fictitious) Net address “[email protected]” representsa few things. The last phrase, “uk”, represents the geo-graphical top-level domain, in this case, the United King-dom. The “com” shows the type of organization, in thiscase commercial. The sub-domain “morgan” represents anetwork (or computer) name, typically corresponding to acompany, organization, or person’s name (in this case,“Mary,” who is at “Morgan,” a commercial organization inthe U.K.). Domains correlate roughly with the number ofcompanies and organizations on the Internet.

MORGAN STANLEY 3-7
This memorandum is based on information available to the public. No representation is made that it is accurate or complete. This memorandum is not an offer tobuy or sell or a solicitation of an offer to buy or sell the securities mentioned. Morgan Stanley & Co. Inc. and others associated with it may have positions in andeffect transactions in securities of companies mentioned and may also perform or seek to perform investment banking services for those companies.
Table 3.2
Internet Host Growth Rate 1990–95E
Begin Date End Date Annual Host Growth Rate
July 1994 July 1995 107%July 1993 July 1994 81%July 1992 July 1993 79%July 1991 July 1992 85%July 1990 July 1991 90%+/-
Source: Merit Networks
In the context of the Internet, networks represent groups ofcomputers that are connected to one another, usually in onelocation, and are also connected to the Internet. In Figures3.3 and 3.4, note that the rate of growth, represented by thesemi-log graph’s slope, has remained fairly steady, withtwo inflection points:
• The first inflection point came in the early 1980s, whenARPANet (the precursor to the Internet) began allowing theU.S. university system to link itself to the Net in a wide-spread manner.
• The second inflection occurred in 1989, when commer-cialization of the Internet began.
During the July 1990 to July 1995 period, the host com-pound annual growth rate was 93%. Yearly growth ratesvaried from 79% to 107%. Domains and networks haveexperienced similar growth.
As measured on the NSFNet Internet backbone, the type ofdata sent across the Internet between January 1993 andApril 1995 changed significantly. In that two-year period,WWW traffic overtook FTP and gopher — in a sense, leg-acy applications — as the dominant percentage of data.
Figure 3.3
Internet Host Growth (Normal Scale) 1969–95E
0
1,000,000
2,000,000
3,000,000
4,000,000
5,000,000
6,000,000
7,000,000
12/28/68 6/20/74 12/11/79 6/2/85 11/23/90 5/15/96
Source: Network Wizards
Figure 3.4
Internet Host Growth (Semi-Log Scale) 1969–95E
1
10
100
1,000
10,000
100,000
1,000,000
10,000,000
12/28/68 6/20/74 12/11/79 6/2/85 11/23/90 5/15/96
Source: Network Wizards. Note: In the early 1980s there is an increase inthe rate of growth attributable to the connecting of universities to the Inter-net.

3-8 MORGAN STANLEY
This memorandum is based on information available to the public. No representation is made that it is accurate or complete. This memorandum is not an offer tobuy or sell or a solicitation of an offer to buy or sell the securities mentioned. Morgan Stanley & Co. Inc. and others associated with it may have positions in andeffect transactions in securities of companies mentioned and may also perform or seek to perform investment banking services for those companies.
Figure 3.5
Internet Traffic Usage on the NSFNet Backbone, January 1993 to April 1995
Recently, online service providers have begun to provideInternet access services to their subscribers; in most cases,this is not direct access via an IP connection, which canhinder performance. A small fraction, about one-quarter,of OSP subscribers currently use these services; however,the number of OSP Internet users as a percentage of total
OSP subscribers is growing rapidly, as GUI (graphical userinterface) Internet connectivity through OSP accounts hasbeen available only since 1Q95. Data for four large pub-licly traded ISPs — Netcom, PSINet, UUNET, BBN Planet— have been compiled by growth in subscriber base overtime.

MORGAN STANLEY 3-9
This memorandum is based on information available to the public. No representation is made that it is accurate or complete. This memorandum is not an offer tobuy or sell or a solicitation of an offer to buy or sell the securities mentioned. Morgan Stanley & Co. Inc. and others associated with it may have positions in andeffect transactions in securities of companies mentioned and may also perform or seek to perform investment banking services for those companies.
Table 3.3
OSP Subscribers, August 1994 to December 1995
8/94 9/94 10/94 11/94 12/94 1/95 2/95 3/95 4/95 5/95 6/95 7/95 8/95 9/95 10/95 11/95 12/95Total Subscribers 4.2 4.5 4.7 5.0 5.4 5.8 6.3 6.9 7.3 7.7 8.3 8.5 8.8 9.6 10.5 11.2 11.5
Subscribers (x75%) 3.1 3.3 3.5 3.7 4.0 4.3 4.7 5.2 5.5 5.8 6.2 6.4 6.6 7.2 7.9 8.4 8.6IISR Subscriber Count 5.5 6.3 9.9 11.3Internet Users (x75%) 0.0 0.0 0.0 0.0 0.0 0.2 0.4 0.6 0.7 0.8 1.2 1.4 1.4 1.6 1.8 2.0 2.2Rev/Subscr ($/mo) (1) 15.0 15.0 15.0 15.0 15.5 15.5 15.5 15.5 15.5 16.0 16.0 16.0 16.0 16.0 16.0 16.0 16.0Industry Revenue ($) 62 67 70 74 83 90 98 107 113 123 133 136 141 154 168 179 184
AOL Subscribers 1.0 1.2 1.3 1.4 1.6 1.8 2.0 2.3 2.5 2.7 3.0 3.0 3.1 3.9 4.2 4.4 4.6Internet Users (%) - - - - - - - - - - - - - - - - - - 2% 5% 8% 12% 15
%15%
17%
19%Compuserve Subscribers 2 2.1 2.2 2.3 2.4 2.5 2.7 2.9 3 3.1 3.2 3.3 3.4 3.54 > 3.8 4.3 4.5
Internet Users (%) - - - - - - - - - - - - - - - - - - - - 2% 5% 10% 15%
15%
17%
20%Prodigy Subscribers 1 1 1 1.1 1.2 1.3 1.4 1.5 1.6 1.7 1.9 2 > 2.0 > 1.7 > 2.0 1.8 1.6
Internet Users (%) 10%
25% 35% 40% 40% 45% 45% 50% 50% 50% 50% 50%MSN Subscribers - - - - - - - - - - - - - - - - - - - - - - 0.05 0.15 0.2 0.3 0.5 0.6
Internet Users (%) - - - - - - - - - - - - - - - - - - - - - - 5% 25% 25% 25% 30% 35%Delphi Subscribers 0.1 0.1 0.1 0.1 0.1 0.1 0.1 0.1 0.1 0.1 0.1 0.1 0.1 0.125 0.125 0.1 0.07
Internet Users (%) 5% 10% 15%
20% 25% 30% 40% 50% 55% 55% 55% 55% 55% 55% 55%eWorld Subscribers 0.05 0.055 0.06 0.065 0.07 0.085 0.1 0.09 0.08 0.08 0.09 0.08 0.090.115 0.09 0.1 0.126
Internet Users (%) - - - - - - - - - - - - - - - - - - - - 5% 10% 15%
15%
15%
16% 17%GEnie Subscribers 0.03 0.04 0.05 0.06 0.07 0.08 0.09 0.1 0.1 0.1 0.1 0.1 0.1 0.1 0.1 0.09 0.07
Internet Users (%) - - - - - - - - - - - - - - - - - - - - - - - - - - - - - - - - - -
Source of boldfaced entries are from each company.
Source of underlined entries are from Information & Interactive Services Report (and include 64 services). Others are estimated by Morgan Stanley.
Internet users (%) - OSP users who use the OSP to access the Internet. Percentages estimated by Morgan Stanley.
(1) Overall industry rate. Estimated by Morgan Stanley. Industry Revenue is estimated as subscribers times Rev/Subscr.
Note that CompuServe, as of October 1995, is about 50% business users.
As of October 1995, CompuServe had 130K Canadian, 460K European and 100K Japanese subscribers. Another 900K to 1,000K were Japanese NiftyServe subscribers.
Table 3.4
ISP Subscribers, September 1994 to December 1995
9/94 10/94 11/94 12/94 1/95 2/95 3/95 4/95 5/95 6/95 7/95 8/95 9/95 10/95 11/95 12/95Total Commercial Subscribers 6,400 7,350 7,750 8,110 8,500 8,750 9,240 9,500 11,600 12,774 14,150 17,000 18,504 19,900 21,800 23,407
Individual Subscribers 85,200 102,500 123,500 149,920 167,000 194,000 247,840 251,000 325,000 366,500 393,000 435,000 505,600 527,000 615,000 690,000POPs 147 155 170 183 197 220 254 290 330 904 951 1020 1042 - - - - 1241
Service Revenue ($mil)* 11.0 - - - - -- - - - - -- - - - - 35.3 - - - - 49.5 - - - - N/AVNetcom Total Subscribers
Commercial Subscribers 0 0 0 0 0 0 0 0 0 0 0 2,000 2,000 2,500 2,700 3,000Individual Subscribers 41,500 50,000 60,000 72,500 80,000 90,000 114,200 115,000 150,000 168,500180,000 200,000 232,800 240,000 280,000 307,500POPs 32 40 45 51 60 75 89 110 130 171 175 190 200 203 207 210Service Revenue ($mil) 3.3 - - - - 5.2 - - - - 7.5 - - - - 10.5 - - - - 14.7 - - - - 19.7
PSI Total SubscribersCommercial Subscribers 3,500 3,750 3,850 3,910 4,100 4,250 4,440 4,500 4,600 4,700 4,850 5,100 6,200 6,800 7,500 8,200Individual Subscribers 2,200 2,500 3,500 4,920 7,000 14,000 19,440 21,000 25,000 29,500 33,000 35,000 40,000 47,000 55,000 75,000POPs 75 75 75 82 87 95 105 110 120 135 150 153 159 170 180 241Service Revenue ($mil) 4.5 - - - - 4.3 - - - - 5.9 - - - - 7.7 - - - - 11.0 - - - - - -
UUNet Total SubscribersHigh speed dedicated connections 439Commercial Subscribers 2,900 3,000 3,300 3,600 3,800 3,9004,000 4,000 6,000 7,074 8,000 8,500 8,704 9,000 10,000 10,607Individual Subscribers 0 0 0 0 0 0 0 0 0 0 0 0 0 0 0 0POPs 40 40 50 50 50 50 60 70 80 98 106 112 118 130 140 290% Rev from MSN 21% 33% 33%Service Revenue ($mil) 3.182 - - - - 4.117 - - - - 6.48 - - - - 10.47 - - - - 16.4 - - - - 33.14
BBN Planet Total SubscribersCommercial Subscribers > 600 < 600 600 600 > 600 800 > 1000 > 1000 > 1000 > 1300 1400 1600 1600 1600 1600POPs > 500 > 520 565 565 - - - - >500Service Revenue ($mil) - - - - - - - - - - - - - - - - 6.6 - - - - 7.4 - - - - 9.1
Four of the largest, publicly-traded ISP companies are included on this table.
Source of boldfaced entries are from each company. Others are estimated by Morgan Stanley.
* Netcom, PSI and UUNet only.
Netcom estimates its CQ495 quarter consisted 20% permanently connected customers (commercial).
1) BBN owns 65 POPS and leases approximately 500 POPS.
3-10 MORGAN STANLEY
This memorandum is based on information available to the public. No representation is made that it is accurate or complete. This memorandum is not an offer tobuy or sell or a solicitation of an offer to buy or sell the securities mentioned. Morgan Stanley & Co. Inc. and others associated with it may have positions in andeffect transactions in securities of companies mentioned and may also perform or seek to perform investment banking services for those companies.
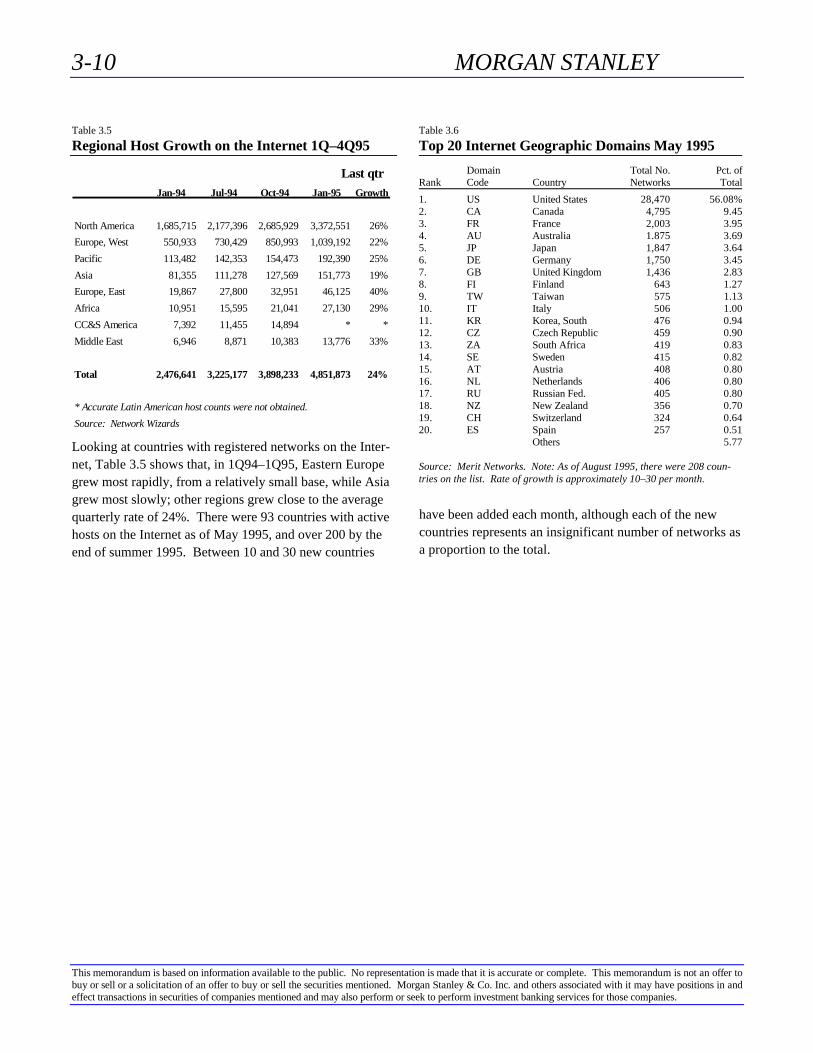
Table 3.5
Regional Host Growth on the Internet 1Q–4Q95
Last qtrJan-94 Jul-94 Oct-94 Jan-95 Growth
North America 1,685,715 2,177,396 2,685,929 3,372,551 26%
Europe, West 550,933 730,429 850,993 1,039,192 22%
Pacific 113,482 142,353 154,473 192,390 25%
Asia 81,355 111,278 127,569 151,773 19%
Europe, East 19,867 27,800 32,951 46,125 40%
Africa 10,951 15,595 21,041 27,130 29%
CC&S America 7,392 11,455 14,894 * *
Middle East 6,946 8,871 10,383 13,776 33%
Total 2,476,641 3,225,177 3,898,233 4,851,873 24%
* Accurate Latin American host counts were not obtained.
Source: Network Wizards
Looking at countries with registered networks on the Inter-net, Table 3.5 shows that, in 1Q94–1Q95, Eastern Europegrew most rapidly, from a relatively small base, while Asiagrew most slowly; other regions grew close to the averagequarterly rate of 24%. There were 93 countries with activehosts on the Internet as of May 1995, and over 200 by theend of summer 1995. Between 10 and 30 new countries
have been added each month, although each of the newcountries represents an insignificant number of networks asa proportion to the total.
Table 3.6
Top 20 Internet Geographic Domains May 1995
Domain Total No. Pct. ofRank Code Country Networks Total
1. US United States 28,470 56.08%2. CA Canada 4,795 9.453. FR France 2,003 3.954. AU Australia 1.875 3.695. JP Japan 1,847 3.646. DE Germany 1,750 3.457. GB United Kingdom 1,436 2.838. FI Finland 643 1.279. TW Taiwan 575 1.1310. IT Italy 506 1.0011. KR Korea, South 476 0.9412. CZ Czech Republic 459 0.9013. ZA South Africa 419 0.8314. SE Sweden 415 0.8215. AT Austria 408 0.8016. NL Netherlands 406 0.8017. RU Russian Fed. 405 0.8018. NZ New Zealand 356 0.7019. CH Switzerland 324 0.6420. ES Spain 257 0.51
Others 5.77
Source: Merit Networks. Note: As of August 1995, there were 208 coun-tries on the list. Rate of growth is approximately 10–30 per month.

MORGAN STANLEY 3-11
This memorandum is based on information available to the public. No representation is made that it is accurate or complete. This memorandum is not an offer tobuy or sell or a solicitation of an offer to buy or sell the securities mentioned. Morgan Stanley & Co. Inc. and others associated with it may have positions in andeffect transactions in securities of companies mentioned and may also perform or seek to perform investment banking services for those companies.
Figure 3.6
Worldwide Distribution of Computers 1994
0.000
0.000
0.000
0.000
0.000
0.001
0.001
0.002
0.006
0.009
0.010
0.011
0.011
0.013
0.013
0.017
0.021
0.021
0.022
0.023
0.030
0.030
0.036
0.044
0.054
0.085
0.087
0.099
0.099
0.109
0.118
0.120
0.133
0.147
0.151
0.152
0.159
0.162
0.170
0.170
0.182
0.182
0.195
0.203
0.220
0.221
0.221
0.319
0.000 0.050 0.100 0.150 0.200 0.250 0.300 0.350Peru
Malaysia
Jordan
Iceland
Egypt
India
China
Indonesia
Philippines
Brazil
Colombia
Turkey
Russia
Thailand
South Africa
Argentina
Mexico
Chile
Poland
Venezuela
Greece
Czech Republic
Hungary
South Korea
Portugal
Taiwan
Italy
Spain
Israel
Austria
Japan
Hong Kong
Belgium/Lux.
France
Singapore
Germany
Ireland
Switzerland
New Zealand
Netherlands
United Kingdom
Sweden
Denmark
Finland
Norway
Canada
Australia
U.S.
Computers Per Person
Sources: IMD, World Economic Forum
Figure 3.7
Share of Total Worldwide MIPS 1994
0.00
0.00
0.00
0.00
0.00
0.00
0.11
0.13
0.14
0.17
0.18
0.19
0.20
0.20
0.23
0.24
0.25
0.26
0.27
0.27
0.28
0.30
0.31
0.39
0.41
0.44
0.45
0.48
0.48
0.55
0.63
0.67
0.72
0.76
0.76
0.85
0.88
0.89
1.23
1.74
1.85
2.44
2.92
3.99
4.95
5.80
6.97
48.64
0.00 5.00 10.00 15.00 20.00 25.00 30.00 35.00 40.00 45.00 50.00
Peru
Malaysia
Jordan
Iceland
Egypt
Colombia
Chile
Czech Republic
Greece
Hungary
Indonesia
Philippines
Venezuela
Singapore
Argentina
Israel
South Africa
Portugal
New Zealand
Ireland
Hong Kong
Turkey
Thailand
Poland
Austria
India
Norway
Finland
Denmark
Switzerland
Belgium/Lux.
Brazil
China
Sweden
Russia
Taiwan
Mexico
South Korea
Netherlands
Spain
Australia
Italy
Canada
France
United Kingdom
Germany
Japan
U.S.
%
Sources: IMD, World Economic Forum

3-12 MORGAN STANLEY
This memorandum is based on information available to the public. No representation is made that it is accurate or complete. This memorandum is not an offer tobuy or sell or a solicitation of an offer to buy or sell the securities mentioned. Morgan Stanley & Co. Inc. and others associated with it may have positions in andeffect transactions in securities of companies mentioned and may also perform or seek to perform investment banking services for those companies.
Bulletin Board Services (BBSs)
There are groups of online users who are not connected tothe Internet. Of the roughly 50,000 to 70,000 bulletinboard services (BBSs) in the world, which are mainly lo-cated in the U.S., most are not connected to the Internet,although many are connected to one another. We estimatethat only 1–2% are connected in varying degrees to the Net,with most of those having e-mail/Usenet connectivity butonly 1% having partial Internet access. Currently, BBSsare not Web-capable. The larger BBSs tend to be the onesconnected to the Net; an estimate of the average subscriberbase of the larger BBSs who use the Internet functions isabout 500 per BBS. Therefore, of the roughly 0.5 millione-mail/Usenet-capable BBS users, only about half, or 0.25million, have partial Internet access.
Trends in User Types
Table 3.7 is based on information gathered from a Web sitethat features searches of compact disks by title. Althoughthese statistics clearly may not represent the Internet as awhole, they compare favorably to data at other sites and to
published statistics based on surveys. The table identifiesthree general categories: 1) the percentage of users access-ing the home page from a commercial site, 2) the type ofWeb browser used, and 3) the type of user operating sys-tem.
The number of commercial (.com) domains visiting thissite is generally rising, and the Netscape Navigator browseris noticeably dominant. At the same time, a considerablemarket-share loss was recorded for the freeware NCSAMosaic and Lynx browsers, while in August the MicrosoftInternet Explorer browser surged from almost nothing to a25% share. In addition, the Windows/DOS environmenthas become increasingly popular and is now the dominantoperating system on the Web, going from the high-30% tohigh-50% range. In the same period, the UNIX sharedropped from 30% to 20% and the Mac share fell from16% to 11%. We identify these trends simply to point outthat the character of the Internet user is changing drasti-cally, from a UNIX/Mac, freeware-oriented, non-commercial user to a Windows/PC, payware-orientedcommercial user.
Table 3.7
Browser and Operating System Statistics from a Typical ‘For-Pleasure’ Web Page
Mar-95 Apr-95 May-95 Jun-95 Jul-95 Aug-95 Sep-95 Oct-95
Retrieval information.com retrievals -- -- 24% 30% 33% 31% 29% 28%Average Traffic to Site (hits/day) 800 300 400 600 1,000 1,000 1,300 1,400
BrowsersNetscape 47% 50% 62% 65% 64% 61% 58% 56%MS Internet Explorer -- -- -- 0.0 0.3 11 19 25Lynx 15 16 12 11 8 6 4 3NCSA Mosaic 21 17 12 10 7 6 4 3Air Mosaic 1 1 1 3 3 3 2 2
User Operating SystemsWindows/DOS 37% 40% 46% 47% 48% 57% 62% 65%UNIX/X11 30 40 33 30 24 21 14 15Macintosh 16 13 14 15 14 12 13 13
Note: Statistics reflect information from browsers hitting the Craig Knudsen CD Search page only. His page has a search engine to identify album titles bysong, and other related searches. The data are reflective only of users who visit this page, not others on the Internet, and are used as an example only. Mr.Knudsen’s site was taken out of commission at the end of October but is now up and running at another location, and we have collected six days of data:Netscape is still dominant. and it appears that the MS Internet Explorer share is lower (single digits) than it was in October.
Surveys — Past and Present
Demographics: Gender and Age The most common In-ternet user is a young, educated male. However, the profileof the typical Internet user is slowly becoming more reflec-tive of the entire population. According to Georgia Tech’sGVU Fourth WWW Survey, conducted over the October 10through November 10 period of 1995, 29% of all users were
female and 71% were male. This difference is more strik-ing in Europe, where 90% are male and 10% female.
The GVU survey also indicates that 12% of users were 16–20 years of age; 18% were 21–25; 16% were 26–30; 13%were 31–35; 11% were 36–40; and 10% were 41–45. Therest of the age ranges amounted to less than 10% each.

MORGAN STANLEY 3-13
This memorandum is based on information available to the public. No representation is made that it is accurate or complete. This memorandum is not an offer tobuy or sell or a solicitation of an offer to buy or sell the securities mentioned. Morgan Stanley & Co. Inc. and others associated with it may have positions in andeffect transactions in securities of companies mentioned and may also perform or seek to perform investment banking services for those companies.
Commercial Organizations There are a few large or-ganizations and companies with thousands of hosts on theInternet, but most Internet-connected organizations havefar fewer. According to the MIDS results, the averagenumber of hosts per organization is 279, with a median ofabout 40. A TIC/MIDS survey for October 1994 showed:<10 hosts, 25%; <100 hosts, 37.6%; <1,000 hosts, 30.9%;<10,000 hosts; 6.5%; and <100,000, 0.1%.
There are many more privately held organizations on theInternet than publicly owned ones. This is consistent bothwith the greater number of small private companies in gen-eral and with the large number that have connected to theInternet lately.
Location In the GVU study, 76% of the respondents werefrom the U.S.; 10% from Canada and Mexico; and 8%from Europe. Compared to a prior GVU study — 81%from the U.S.; 10% from Europe; 6% from Canada andMexico — this represents a shift away from U.S. domi-nance of the Web. To put it all into perspective, though,11% of Web users are located in California.
Educational Organizations According to TIC/MIDS, asa percentage of total users on the Internet, 22% were edu-cationally related in October 1994. As a percentage of totaleducational users, higher education is dominant.
According to a Mika Rissa & Co. survey conducted inJanuary 1995, 23% of users were university and other“.edu” classifications; 8% were students (unspecified); 19%were in computer-related organizations; 11% were in in-dustrial companies; 9% were in professional service or-ganizations; and 8% were in government and local ad-ministration. The rest of the responses were less than 5%each.
OSP Entry versus ISP Entry In the past several months,there seems to have been a drastic shift away from usingOSPs to access the Internet and toward using ISPs. Ac-cording to the GVU study, the three main kinds of primaryInternet providers are local online providers (ISPs), at 42%;educational providers, 32%; and the workplace, 10%.Compared to the previous GVU study, local online provid-ers gained an additional 14% share, while the OSPs went to8% from 28%.
Early Adopters/Corporate Adopters The GVU FourthWWW Survey lends support to our theory that early adopt-ers use the Internet first, followed by corporate users. Inaddition, we theorize elsewhere in this report that interna-tional users follow U.S. users. In the GVU study, Europeanusers were heavier users of Unix (14% in Europe versus 7%in the U.S., and 7% of overall responses). Slightly over onein five (21%) were using Windows 95, which lends supportto the “early adopters” profile of the Web users sampled.
Means of Connection Popular methods of linking to theInternet are T-1 (corporate and academic users) and dial-up/modem connections (mainly consumers and small of-fices). In the GVU study, 2% of all users accessed the In-ternet at speeds below 14.4 kbps; 34% at 14.4%; 27% at28.8 kbps; 4% at 56 kbps; 2% at 128 kbps; 5% at 1 mbps;2% at 4 mbps; 9% at 10 mbps; and 1% at over 45 mbps.(Some 14% were not sure.)
The most popular Internet connection speeds in 1994 wereT-1 leased, 56–64 kbps leased, and 14.4 kbps dial-up.Since then, two things have changed: the 28.8 kbps mo-dem has flourished, and dial-up access has become moreconvenient, with the spreading availability of Internetservice from OSPs and the rapid buildup in POPs fromISPs.
According to the Mika Rissa survey, from December 1994to January 1995, 69% of Internet connections were directconnections, while 32% were dial-ups. Now, after a littleless than a year has gone by, about 62% of users accessthrough dial-up connections.
Opinions and Observations
There is a wide disparity among other estimates of Internetusage, most likely caused by the various time frames in-volved. Small inconsistencies in reporting the dates of thedata can cause wide differences in estimates, because theInternet grows so quickly. It is hard to keep track. Thereare, of course, upper limits on growth in the number of In-ternet users, due to the following factors, in our view:
• The number of households;• A commercial entity’s inability to expand its Internetservice networks much more quickly than 100–200% peryear (as evidenced by MSN’s and AOL’s growing pains);

3-14 MORGAN STANLEY
This memorandum is based on information available to the public. No representation is made that it is accurate or complete. This memorandum is not an offer tobuy or sell or a solicitation of an offer to buy or sell the securities mentioned. Morgan Stanley & Co. Inc. and others associated with it may have positions in andeffect transactions in securities of companies mentioned and may also perform or seek to perform investment banking services for those companies.
• The lack of reasonably priced wireless Internet tech-nology;• The difficulty in using online and Internet services;• The cost of hardware, software, and connectivity;• Alternative media, such as interactive- and cable-TV;• The relative lack of “things to do on the Internet” (youcan’t exercise or eat there); and• The lack of an ability to physically move anything butelectrons from one location to another.
On the other hand, PCs are becoming communications de-vices — perhaps a necessary communications device thatmay supersede television, radio, and, who knows, maybeeven the newspaper. There is still tremendous demandfrom potential users who want to get online.
Going forward, we expect certain dynamics to prevail asthe Internet continues to grow:
Demographics should become more reasonably represen-tative of a cross section of the world population.
Non-domestic use will grow rapidly.
Ease-of-use will increase — graphical interfaces will rule,connectivity will become trivial.
Vast arrays of services will migrate to the Internet andonline, such as retailing, consulting, news, entertainment,and just about anything else that can be viewed in two orthree dimensions.
PCs, and variants thereof, will become far-and-away thedominant platform, as well as the driver for Internet/onlinegrowth.
The cost of connectivity, as it decreases, should boost massappeal and stimulate demand.
Use will become more interactive, as more e-mail-onlyusers decide to go for full Internet access.
Communications over the Net will become commonplace,and necessary, for business as well as pleasure.
Bandwidth requirements will increase at an expandingrate, due to greater use of graphics, sound, and, ultimately,video.
Commercialization of the Internet will be extremely rapid.
Separate networks, perhaps akin to today’s BBSs, mayagain proliferate a few years from now, as users’ concernsabout security and government control increase.
There are 95 million households in the U.S., according tothe U.S. Census Bureau. As Table 3.8 shows, installedbases of most widespread communications devices is nearly100%. For instance, color television is found in 97% ofU.S. homes, and the telephone is in 96%. The VCR has an85% U.S. household penetration rate, while the PC has a30% rate.
These figures demonstrate simply that once a communica-tions technology becomes widespread, nearly everyone usesit. There are limitations to the use of communications de-vices, usually due to money or lack of connectivity. Urbanregions have been getting local-call, dial-in access to onlineservices and Internet service providers’ networks first, so itis important to identify the most likely candidates to receiveconvenient wired access. Currently, there is no reasonablewireless technology to enable nonurban users remote fromPOPs. If such connectivity were made widely available,consumers and business users might rapidly adopt it.
MORGAN STANLEY 3-15
This memorandum is based on information available to the public. No representation is made that it is accurate or complete. This memorandum is not an offer tobuy or sell or a solicitation of an offer to buy or sell the securities mentioned. Morgan Stanley & Co. Inc. and others associated with it may have positions in andeffect transactions in securities of companies mentioned and may also perform or seek to perform investment banking services for those companies.
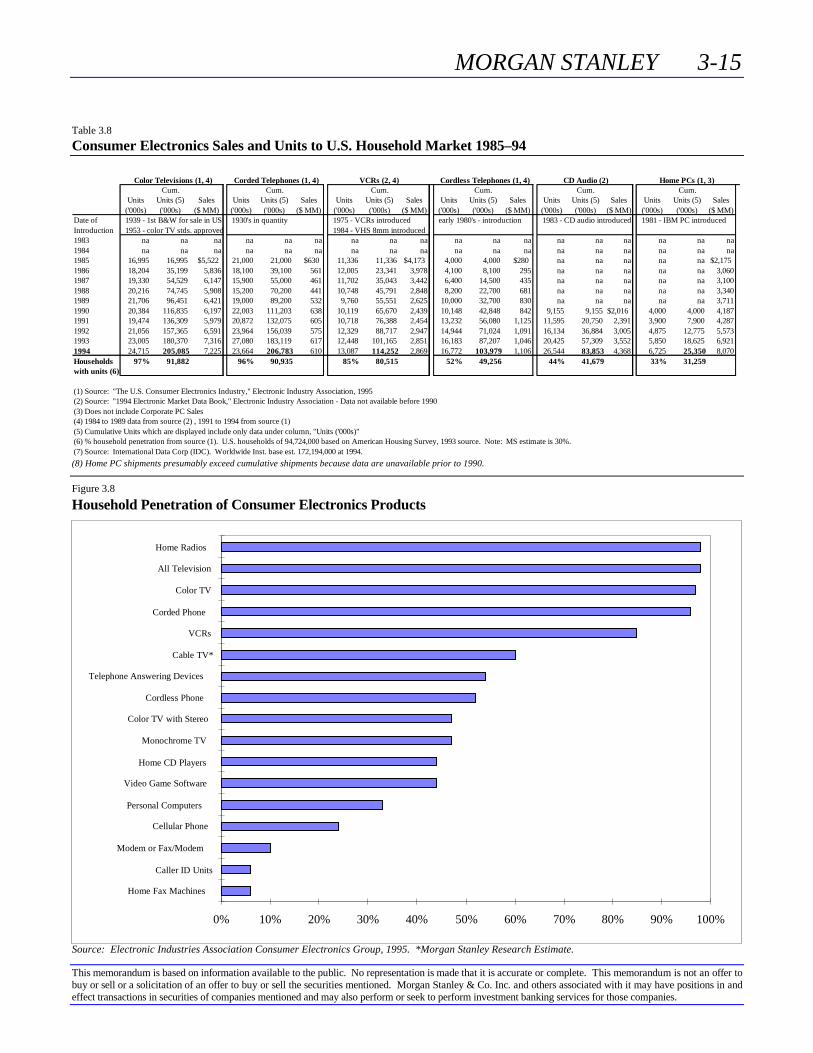
Table 3.8
Consumer Electronics Sales and Units to U.S. Household Market 1985–94
Color Televisions (1, 4) Corded Telephones (1, 4) VCRs (2, 4) Cordless Telephones (1, 4) CD Audio (2) Home PCs (1, 3)Cum. Cum. Cum. Cum. Cum. Cum.
Units Units (5) Sales Units Units (5) Sales Units Units (5) Sales Units Units (5) Sales Units Units (5) Sales Units Units (5) Sales('000s) ('000s) ($ MM) ('000s) ('000s) ($ MM) ('000s) ('000s) ($ MM) ('000s) ('000s) ($ MM) ('000s) ('000s) ($ MM) ('000s) ('000s) ($ MM)
Date of 1939 - 1st B&W for sale in US 1930's in quantity 1975 - VCRs introduced early 1980's - introduction 1983 - CD audio introduced 1981 - IBM PC introducedIntroduction 1953 - color TV stds. approved 1984 - VHS 8mm introduced1983 na na na na na na na na na na na na na na na na na na1984 na na na na na na na na na na na na na na na na na na1985 16,995 16,995 $5,522 21,000 21,000 $630 11,336 11,336 $4,173 4,000 4,000 $280 na na na na na $2,1751986 18,204 35,199 5,836 18,100 39,100 561 12,005 23,341 3,978 4,100 8,100 295 na na na na na 3,0601987 19,330 54,529 6,147 15,900 55,000 461 11,702 35,043 3,442 6,400 14,500 435 na na na na na 3,1001988 20,216 74,745 5,908 15,200 70,200 441 10,748 45,791 2,848 8,200 22,700 681 na na na na na 3,3401989 21,706 96,451 6,421 19,000 89,200 532 9,760 55,551 2,625 10,000 32,700 830 na na na na na 3,7111990 20,384 116,835 6,197 22,003 111,203 638 10,119 65,670 2,439 10,148 42,848 842 9,155 9,155 $2,016 4,000 4,000 4,1871991 19,474 136,309 5,979 20,872 132,075 605 10,718 76,388 2,454 13,232 56,080 1,125 11,595 20,750 2,391 3,900 7,900 4,2871992 21,056 157,365 6,591 23,964 156,039 575 12,329 88,717 2,947 14,944 71,024 1,091 16,134 36,884 3,005 4,875 12,775 5,5731993 23,005 180,370 7,316 27,080 183,119 617 12,448 101,165 2,851 16,183 87,207 1,046 20,425 57,309 3,552 5,850 18,625 6,9211994 24,715 205,085 7,225 23,664 206,783 610 13,087 114,252 2,869 16,772 103,979 1,106 26,544 83,853 4,368 6,725 25,350 8,070Households 97% 91,882 96% 90,935 85% 80,515 52% 49,256 44% 41,679 33% 31,259with units (6)
(1) Source: "The U.S. Consumer Electronics Industry," Electronic Industry Association, 1995(2) Source: "1994 Electronic Market Data Book," Electronic Industry Association - Data not available before 1990(3) Does not include Corporate PC Sales(4) 1984 to 1989 data from source (2) , 1991 to 1994 from source (1)(5) Cumulative Units which are displayed include only data under column, "Units ('000s)"(6) % household penetration from source (1). U.S. households of 94,724,000 based on American Housing Survey, 1993 source. Note: MS estimate is 30%.(7) Source: International Data Corp (IDC). Worldwide Inst. base est. 172,194,000 at 1994.
(8) Home PC shipments presumably exceed cumulative shipments because data are unavailable prior to 1990.
Figure 3.8
Household Penetration of Consumer Electronics Products
0% 10% 20% 30% 40% 50% 60% 70% 80% 90% 100%
Home Fax Machines
Caller ID Units
Modem or Fax/Modem
Cellular Phone
Personal Computers
Video Game Software
Home CD Players
Monochrome TV
Color TV with Stereo
Cordless Phone
Telephone Answering Devices
Cable TV*
VCRs
Corded Phone
Color TV
All Television
Home Radios
Source: Electronic Industries Association Consumer Electronics Group, 1995. *Morgan Stanley Research Estimate.

3-16 MORGAN STANLEY
This memorandum is based on information available to the public. No representation is made that it is accurate or complete. This memorandum is not an offer tobuy or sell or a solicitation of an offer to buy or sell the securities mentioned. Morgan Stanley & Co. Inc. and others associated with it may have positions in andeffect transactions in securities of companies mentioned and may also perform or seek to perform investment banking services for those companies.
Table 3.9
Number of PCs, Modems, and Internet Users 1984–2000
1984 1985 1986 1987 1988 1989 1990 1991 1992 1993 1994 1995 1996 1997 1998 1999 2000
Worldwide PC Unit Shipments (MM) 9 9 10 12 14 16 19 25 34 43 51 60 69 77 85 94 102 Y/Y Growth -- 2% 12% 17% 17% 14% 19% 32% 36% 25% 20% 18% 14% 12% 11% 10% 9%
PC Lifetime Shipments (MM) 23 32 42 54 68 84 103 128 162 205 256 316 384 461 546 640 742 PCs in Use (MM) (a) 23 28 35 40 45 52 61 74 94 121 153 188 222 256 290 324 358
Pct. with Two PCs (b) 2% 2% 3% 5% 6% 7% 8% 10% 15% 20% 22% 23% 25% 28% 30% 33% 37% Actual # of PC Users (MM) 23 27 34 38 43 49 56 67 80 96 119 144 167 184 203 217 225 Y/Y Growth -- 22% 24% 13% 11% 14% 16% 19% 20% 21% 23% 21% 15% 11% 10% 7% 4%
U.S. PC Unit Shipments (MM) 6 6 6 7 7 7 8 10 13 16 20 23 25 28 31 33 36 Y/Y Growth -- -6% 3% 8% 6% 0% 12% 23% 37% 24% 21% 15% 11% 11% 10% 8% 9%
U.S. Pct. of PC Unit Shipments 70% 65% 60% 55% 50% 44% 41% 38% 39% 38% 39% 38% 37% 37% 36% 35% 35% PC Lifetime Shipments (MM) 16 21 25 30 34 37 42 49 63 79 99 120 141 169 197 227 263 PCs in Use (MM) (a) 16 18 21 22 23 23 25 28 36 46 59 71 82 94 105 115 127
Pct. with Two PCs (b) 5% 6% 7% 8% 10% 15% 20% 22% 23% 25% 28% 30% 33% 37% 42% 48% 50% Actual # of PC Users (MM) 15 17 20 20 20 19 20 22 28 35 43 50 55 59 61 60 63 Y/Y Growth -- 12% 14% 5% 0% -5% 3% 11% 27% 24% 22% 17% 10% 8% 3% -2% 6%
Worldwide Connectivity Estimates# of PC Users (MM) 23 27 34 38 43 49 56 67 80 96 119 144 167 184 203 217 225
# E-Mail Users (MM) (c) 1 1 2 3 4 5 6 8 12 18 25 35 60 80 130 180 200 Pct. PCs with E-Mail Access 4% 4% 6% 8% 9% 10% 11% 12% 15% 19% 21% 24% 36% 43% 64% 83% 89%
# Internet/Web Users (MM) <1 <1 <1 <1 <1 <1 <1 <1 1 1 3 9 23 46 81 122 152 Pct. PCs with Internet Access 1% 1% 1% 1% 1% 1% 1% 1% 1% 1% 3% 7% 14% 25% 40% 56% 68%
# Online/Hybrid Users (MM) <1 <1 <1 <1 <1 <1 <1 1 2 3 5 8 13 18 23 27 30 Pct. PCs with Online/Hybird Access 1% 1% 1% 1% 1% 1% 1% 2% 3% 3% 4% 6% 8% 10% 11% 12% 13%
Windows Installed Base (MM) (d) <1 <1 <1 <1 <1 <1 3 8 23 44 77 115 -- -- -- -- --1000
# Web Servers (MM)(e) -- -- -- -- -- -- -- <1 0.00 0.00 0.02 0.10 0.60 1.20 2.20 3.30 4.00
U.S.# of PC Users (MM) 15 17 20 20 20 19 20 22 28 35 43 50 55 59 61 60 63 # Internet/Web Users (MM) <1 <1 <1 <1 <1 <1 <1 <1 1 1 2 6 14 25 41 58 67 Pct. PCs with Internet Access - - - - - - - - - - - - - - - - 2% 2% 5% 12% 25% 43% 67% 98% 106%
76% 74% 70% 64% 59% 55% 50% 48% 44%
U.S.Homes with PCs and Modems Installed Base (MM) - - - - - - - - - - - - - - - - - - 4 6 10 20 25 30 32 35 Y/Y Growth 50% 67% 100% 25% 20% 7% 9%
(a) Assumes that PCs have average useful life of 4 years. (b) Estimated Number of PC users that use second PCs: home, office, and portables.(c) Estimates of all e-mail accounts. We estimate that 50% of 1995 e-mail users could be connected to the Internet.(d) Estimated legal (non-pirated/copied) shipments of Microsoft Windows. Arrows added to compare Windows ramp with Internet ramp.(e) Source: Lycos, Web Crawler, and Morgan Stanley Research estimates. Note: There are more Web sites than servers.Source: Morgan Stanley Research estimates.
This kind of rapid adoption occurred recently, for example,with pagers. The number of pagers for personal and busi-ness use has grown from 9.9 million in 1990 to an esti-mated 34 million in 1995, according to the Personal Com-munications Industry Association/MAT-EMCI.
Mass appeal and high penetration rates are correlated witha low cost of participation for a particular device. We be-lieve devices other than the PC may stir additional demandfor Internet connectivity if they are competitively priced.Based on a pretax average U.S. household income of$32,000, the following are the relative costs of ownershipfor dominant communications devices: color television
0.78% ($250), VCR 1.09% ($350), telephone 0.08% ($25),and PC 7.8% ($2,100). The PC is a relatively expensivedevice, but such alternatives as low-priced Internet boxescould, over time, come to market.
Education also represents an area of growth, in our view.According to Higher Education Publications, of FallsChurch, Va., there are 3,616 accredited institutions ofhigher education.
Two observations can be made regarding Internet use andenrollment in school: students represent a new generationof Internet users, and the educational market still representsa significant and likely target for growth in Internet use.

MORGAN STANLEY 3-17
This memorandum is based on information available to the public. No representation is made that it is accurate or complete. This memorandum is not an offer tobuy or sell or a solicitation of an offer to buy or sell the securities mentioned. Morgan Stanley & Co. Inc. and others associated with it may have positions in andeffect transactions in securities of companies mentioned and may also perform or seek to perform investment banking services for those companies.
Projections
The most important and dynamic aspect to the acceptabilityof online service and Internet usage is that the softwareinterfaces to cyberspace are becoming easier to use. Webelieve the primary reason for the continued growth in thenumber of Internet users was the introduction of the Mosaicbrowser. Underlying the strong overall increase in thenumber of Internet users, we believe, is a dramatic shift inthe use of applications on the Internet, from text-based e-mail and partial FTP/telnet/gopher use to full WWW access(which includes the former applications).
The second most critical driver for growth in the Internetuser base should come from the non-U.S. market. Accessto the rest of the world’s information will be the reason thatother nations’ users will come to the Internet, in our view.We believe that by the end of the decade, fully 50% of In-ternet users will be non-domestic.
The typical Internet user is in his or her mid-30s. The av-erage age is growing steadily. Internet users who graduatedfrom college in the 1980s are still online, and the Internetis being used not only for academic purposes but also forbusiness reasons, so people in business are using it more.
Further, the user base is becoming more reflective of thepopulation in general, as its offerings become more diverse.
By and large, academia and corporate concerns should stilldominate the user base. However, we believe that, with theproliferation of consumer-oriented offerings and the neces-sity of online communication, consumers will represent afaster-growing group of users by the end of the decade. Inthe short term, corporations are expected to expand theirpresence more quickly, followed by consumers.
Perspective Check
As a check on our perspective, we note that the 1994 totalU.S. and worldwide populations were about 250 millionand 5.5 billion, respectively. There are 21 million employ-ees of Fortune 500 companies. Currently, the total number
of full-Web-access users is about 9 million, while all e-mailusers are about 35 million. According to the GVU study(conducted 10/10–11/10/95), about 75% of users are fromthe U.S. This means that about 3% of the U.S. populationare Web users and 10% are e-mail users. In the year 2010,we project, the number of U.S. Internet users will representsomewhat below 50% of the total U.S. population.
Worldwide full-Web access users and worldwide e-mailusers thus represent about 0.2% and 0.6%, respectively, ofthe total worldwide population. In the year 2010, we proj-ect, the number of worldwide Internet users should reachabout 7% of the global population.
As another check on our perspective, we can estimate thenumber of users connected to the Internet through majorISPs. According to the TIC/MIDS’ October 1994 survey,the average number of hosts per organization was 279.Using 279 hosts per commercial subscriber, and assuming a1:1 relationship between “user” and “host” (because mostcorporate users have dedicated workstations for each user),the number of users per commercial subscribers in Septem-ber 1995 can be estimated at 5.16 million. Estimated De-cember 1995 commercial users would be about 45% more,assuming the same quarterly growth rate, or 7.47 million.
That number would include many, but probably not all, ofthe other 3,000 or more ISPs in the world, as most ISPsconnect to the larger ISPs (MCI, Sprint, Net99, and ANSare also players, but this is an estimate). Therefore, theestimated number of Internet users at December 1995 (38%more than September), adding in individual users of700,000, presumably with full-Web access, was 8.2 million.We believe these user counts are fairly consistent with ourreported 9 million full-Web access worldwide Internet usersestimate, when the estimated 2.6 million Internet users ac-cessing the Web through OSPs (36% more than 1.9 millionin October) are added in. This would yield 10.8 million;however, we believe there is some overlap between the OSPand ISP Internet users.
MORGAN STANLEY
This memorandum is based on information available to the public. No representation is made that it is accurate or complete. This memorandum is not an offer tobuy or sell or a solicitation of an offer to buy or sell the securities mentioned. Morgan Stanley & Co. Inc. and others associated with it may have positions in andeffect transactions in securities of companies mentioned and may also perform or seek to perform investment banking services for those companies.
The Internet Report
Section IIFeatures and Uses of the Internet
MORGAN STANLEY
This memorandum is based on information available to the public. No representation is made that it is accurate or complete. This memorandum is not an offer tobuy or sell or a solicitation of an offer to buy or sell the securities mentioned. Morgan Stanley & Co. Inc. and others associated with it may have positions in andeffect transactions in securities of companies mentioned and may also perform or seek to perform investment banking services for those companies.
Chapter 4: How to Use the Internet
• There are multiple ways to access the Internet today: commercial Internet Service Providers (ISPs), Online Service Pro-viders (OSPs), and selected telecommunications carriers. Connections can be made by using dial-up (analog or digitalISDN) or leased-line connections.
• The Internet is already the vehicle for a broad array of services: communication, education, broadcast-like media, dailynews, reference and book-like materials, advertising, want-ads, magazine and direct marketing retailing. In the future, itmay be used for broadcast-like media, taxes, banking, and more.
• To exploit the Internet’s current capabilities, users today turn most often to the World Wide Web, e-mail, File TransferProtocol, Usenet, and many legacy Internet features (such as Gopher, IRC). There are many new applications already inbeta test (video, audio, telephony, 3D), and in the future we expect more robust systems exploiting video, audio and teleph-ony, Internet faxing, conferencing and collaborative work. There will also be highly-integrated, automated features incor-porating commercial back-end applications with the Web and other features, perhaps supported by Java or other languages.
Many newcomers think the World Wide Web is all there isto the Internet. In fact, the web is just one of its features,enabling browsers to view graphics and text stored on webservers. It coexists with other protocols such as FTP (filetransfer protocol), all of which run simultaneously over thesame Internet infrastructure. This chapter describes how to
connect to the Internet, its existing and contemplated re-sources, and the applications and protocols needed to allowthe use of those resources. Although it is not intended to bea technical guide to surfing the Web, the overview is fairlydetailed, so experienced webmasters can skip to the nextchapter and skim this one as needed.
Making an Internet Connection
In general, connecting to the Internet occurs through eithera dial-up or a permanent, leased line connection. Mostconsumers connect through dial-up or modem connectors,while corporate users usually connect with permanent con-nections (remote corporate uses, of course, require a dial-upconnection). It’s important to remember the customarydistinction today between two basic classes of users, soft-ware and equipment: the client and the server. In general,clients use network resources, while servers are repositoriesof content and information. Nearly all consumers are cli-ents; corporate users tend to be clients and servers. About80% of servers have permanent connections to the Internet,so information on the server is almost always available toclients.
Dial-Up Connections
Gaining access to the Internet has become easier over thepast year and a half. A full, interactive, graphical-based,TCP/IP Internet connection is possible with an inexpensivePC (even a 386) running Windows, a modem (28.8 kbps or
14.4 kbps is preferable), inexpensive or free software (manyservice providers give it away), and a contract agreementwith an Internet service provider that costs about $20 permonth. Two years ago, that degree of connectivity was forthe elite power-user, predominantly a UNIX user with aworkstation. Now, common PCs can inexpensively accessthe Internet. Other non-PC devices are being tested or arealready in limited distribution that hold promise as clientconnectivity devices. These could potentially include a$150 device by Philips that lets television users connect, the$500 Internet terminal being touted by Oracle, Microsoft’sITV set-top box, Sun Microsystem’s Internet box, LSILogic’s Internet-on-a-chip system, Digital Equipment’sStrongARM chip, and others. We believe these devicesmay coexist with the PC; though offering less functionality,they could expand and perhaps accelerate the trend towardsworldwide connectivity. Time will tell...
There are currently four dial-up connectivity options thatconsumers, mobile users, and small corporations might

4-2 MORGAN STANLEY
This memorandum is based on information available to the public. No representation is made that it is accurate or complete. This memorandum is not an offer tobuy or sell or a solicitation of an offer to buy or sell the securities mentioned. Morgan Stanley & Co. Inc. and others associated with it may have positions in andeffect transactions in securities of companies mentioned and may also perform or seek to perform investment banking services for those companies.
consider for Internet access with PCs or workstations: 1) aSLIP (Serial Line Internet Protocol) or PPP (Point to PointProtocol) account with an Internet service provider; 2) anonline service provider; 3) a bulletin board service with anInternet gateway; or 4) a shell account with a dedicated In-ternet service provider (UNIX). Below, we discuss thesefour options:
SLIP or PPP Account with an ISP
There are more than 3,000 Internet service providers withlocal, regional, nationwide, or worldwide networks con-nected to the Internet. A user dials into the ISP’s networkusing a modem or ISDN adapter, connects using a TCP/IP-enabled SLIP or PPP software, and conducts a real-time,interactive, graphical interface Internet session. This is themost common means of consumer access to the Internet;companies such as PSINet, Netcom, and Concentric offerthis service.
There are two major advantages to using a SLIP or PPP ac-count with an ISP, compared with a BBS gateway or shellaccount. First, a large ISP usually has a nationwide net-work that allows local-number dial-in access to the Internet(this is also the case with online service providers with In-ternet access). Second, an ISP’s graphical interface andTCP/IP enabled connections allow the use of the WorldWide Web (another service that OSPs allow). ISPs alsogenerally charge less than an online service provider. Thedrawback is that ISPs generally offer less content thanwhat’s available from OSPs, because online service provid-ers charge a premium to let subscribers access their proprie-tary networks as well as access to the Internet. ISPs onlyallow the latter.
Online Service Providers
For about a decade, online service providers have offeredeasy connections to their proprietary networks. Each pro-vider’s network is different, and many have had only lim-ited offerings. E-mail access through the OSPs has beenavailable for about a decade, but not until autumn 1994, dida major online service provider (Delphi) offer Internet Webaccess, though its service was text-based. Delphi was fol-lowed by Prodigy, which debuted Internet access with agraphical service in C1Q95, and then the other OSPs.
Today, nearly all major OSPs — America Online, Compu-Serve, Microsoft MSN, and Prodigy — allow full, interac-
tive access through their networks to the Internet. MostOSP networks have dial-up access servers throughout thecountry. These interconnected servers comprise a national(or even global) proprietary and private network operatedby the online service provider.
Bulletin Board Services with Internet Gateways
Bulletin board services (BBSs) are dial-up computer serv-ices typically operated by individuals who have a zeal forcomputers. BBSs are much like online services, exceptthey generally are not as well funded and the user interfaceis often a command-line, text-based system. Few, if any,BBSs have their own, proprietary networks, which wouldallow a user to connect to the BBS from various geographi-cal locations. About 98% of BBS users connect via mo-dem; however, some BBSs have Internet gateways, whichallow users to telnet to the BBS (such as through Concen-tric’s server), log on, and interact as if they had dialed indirectly. In addition, an Internet gateway usually allowsdial-in users access to the Internet. BBSs usually do notallow real-time graphical Internet access, due to the re-quirements of the software needed to access the Net.
Perhaps 10% of the thousands of U.S. BBSs are connectedto the Internet, via e-mail and newsgroups, and subnet-works of the Internet, such as Fidonet; about 1–2% of BBSshave real-time, text-oriented Internet access, includingFTP, Gopher, and telnet features. There are currently fewBBSs on the Web, and we believe it may be another year orso before robust software that enables them to connect be-comes widespread. Currently, at least one of the well-known BBS operating systems is being upgraded to allowsuch access to whom we spoke with on the promise of ano-nymity. In addition, San Francisco-based The WELL isdeveloping its own HTTP software with help fromNetscape. Concentric has also recently developed a Web-based software that allows connection to BBSs through itsservice.
Shell Accounts with Dedicated ISPs (UNIX)
One option that is losing popularity is an Internet-connected UNIX client using a text-based interface (i.e., thekind of terminal emulation software one would use to con-nect to a BBS.). Once connected, common UNIX com-mands, such as FTP or telnet, are used to access resourceson the Internet. Although this allows real-time, interactiveconnection to the Internet, it does not easily allow graphical
MORGAN STANLEY 4-3
This memorandum is based on information available to the public. No representation is made that it is accurate or complete. This memorandum is not an offer tobuy or sell or a solicitation of an offer to buy or sell the securities mentioned. Morgan Stanley & Co. Inc. and others associated with it may have positions in andeffect transactions in securities of companies mentioned and may also perform or seek to perform investment banking services for those companies.
Web access unless a shareware program, called SlipKnot, isused.
Leased-Line Connections
In contrast to dial-up service to the Internet, leased-lineconnections are aimed at large corporate, institutional, orgovernment organizations, and typically connect two ormore users to the Internet. Permanent connections to theInternet are used because:
• Higher-speed connections are available (9.6 kbps or 56kbps to 45 mbps) than with dial-up connections;
• There is zero connect time, compared with 4-secondISDN connects or 30-second analog modem connects;
• More reliable connections are made with unswitched,leased lines than switched analog (modems) or switcheddigital (ISDN) connections;
• Dial-up connections are more expensive to keep open allthe time (such is the case with ISDN connections kept “offthe hook” at all times);
• Applications relying upon the connection require a per-manent connection, for example, if the site operates aWWW server.
To set up a permanent Internet connection, one would needa leased-line connection from a telecom provider, as well asan IP router, which is a dedicated networking device.These two components would most likely connect the or-ganization to the Internet through an ISP or ISP hosting. Adomain name, such as “bigcompany.com”, and a corre-sponding IP address, such as “123.456.789.123”, would beobtained through an Internet registration process coordi-nated either by the company connecting to the Internet orby the ISP. The most common permanent connectionspeeds are 56 kbps and 1.54 mbps. A dedicated connectionto the Internet usually links to a campus-wide or corporate-wide network, with several hosts and workstations.
Historically, academic, government, and scientific institu-tions, most of whose connections are funded by the gov-ernment, bypass some of the commercial requirements forconnecting to the Internet. With the dismantling of theNSFNet, however, these institutions are being forced toconnect through commercial providers. Costs for 56 kpbs,excluding the leased lines, are about $300-$400 per monthand for T-1 access, $1,000 to $2,500. Costs for the leasedline are above and beyond the costs to the ISP, and varysignificantly from telco to telco with distance and RBOCtariffs.
Resources of the Internet and their Uses
When the Internet first emerged, about all you could do wasremote computing (telnet). New applications slowlyemerged, like e-mail in early 1970s, FTP in late 1980s, andso on. In the future, we believe the Internet may convergewith — or even supplant — television, radio, telephone,and other communications media we use today. At the veryleast, it will complement these older media. As more ro-bust applications appear on the Internet, many other socialand business functions may follow suit.
The table on the following page describes many of today’spersonal, corporate and governmental activities that we be-lieve will be conducted over the Internet in the next 5 to 10years, first in industrialized countries, then in emergingregions. The table also generally identifies software neces-sary to enable these functions.

4-4 MORGAN STANLEY
This memorandum is based on information available to the public. No representation is made that it is accurate or complete. This memorandum is not an offer tobuy or sell or a solicitation of an offer to buy or sell the securities mentioned. Morgan Stanley & Co. Inc. and others associated with it may have positions in andeffect transactions in securities of companies mentioned and may also perform or seek to perform investment banking services for those companies.
Table 4.1
Internet Resources and Enabling Applications
Function/Use Internet Replacement Application Software/Internet Protocols
Communication E-mail Many(including for educational purposes) Telephony VocalTec, Camelot, Quarterdeck, Pulver
Video conference CuSeeMe, Connectix VideophoneText chat IRC
Fax Faxing from the Internet to a Fax Various servicesE-mail E-mail
Broadcast Media E-mail ManyWeb sites Web server softwareVideo on demand Xing Tech, MBONE, VDONetAudio on demand Progressive Networks, DSP GroupSound and video playback Store first, then play
Daily News Personalized newspapers E-mail via services(intelligently filtered news) Browser via newspage
Books, reference materials For-charge publishing (web pages) Web server, authoring toolsFree-of-charge publishing (web page) Web server, and authoring tools
Advertising, want-ads Zero-cost publishing (personal web pages) Web server (or rented space on a web server) andauthoring tools
Magazine and direct marketing retailing Web-based retailing Web server software
Banking Web-based electronic banking Internet banking software on web server and on client station
Taxes Electronic tax filing Tax software
Retailing Web-based retailing Web server software
Communication
E-mail is the most common means of communication onthe Internet. Using e-mail, a permanent and easily dupli-cated text record is transmitted from the sender to the re-cipient. Files may be attached to e-mail messages using theMIME standard.
Multi-user, text-based conversations also take place on theInternet, such as IRC (Internet Relay Chat). Other so-called chat services are becoming available, includingWorld’s and Microsoft’s avatar-based 3D chat systems.
It is technically feasible to transmit speech in real time overthe Internet as well. This Internet telephone service is en-abled by inexpensive software available from several com-panies (VocalTec and Camelot’s Third Planet division,Quarterdeck, and Electric Magic), a Sound Blaster card,and a microphone. Various technical issues such as latencyand delay must still be resolved; these systems also requirethe use of dedicated servers.
Sound files may be transmitted as a file download for laterplayback or as a real-time broadcast. Files for later play-back must be completely downloaded before the sound canbe sampled. Real-time broadcast is similar in principle toInternet telephony. RealAudio, Xing, I-Wave, True Speechand others, are being developed to allow one-way real-timebroadcasts over the Internet. There are drawbacks to bothmethods. The first requires the user first to download rela-tively large files (about 1 megabyte per 10 to 20 seconds)before playing back the sound using software that comesstandard with sound playback hardware (a $150 sound cardand speakers, for example). Therefore, a user with a 14.4kbps modem would wait through a download of 10 minutesor so to listen to a 10 to 20 second playback. The secondmethod, in which files can be played back simultaneouslywith the download, requires either large amounts of band-width or diminished sound quality (fewer digital samplesper unit time).
Video can also be transmitted in the same two ways. Videoof TV-quality transmitted or broadcast in real-time acrossthe net requires considerable bandwidth, say 1.5 mbps. The
MORGAN STANLEY 4-5
This memorandum is based on information available to the public. No representation is made that it is accurate or complete. This memorandum is not an offer tobuy or sell or a solicitation of an offer to buy or sell the securities mentioned. Morgan Stanley & Co. Inc. and others associated with it may have positions in andeffect transactions in securities of companies mentioned and may also perform or seek to perform investment banking services for those companies.
MBONE, a network within the Internet which has beendeployed for several years, enables large video files to travelon the Internet. Currently, other software solutions (XingTechnologies) allow real-time playback with low bandwidthrequirements (28.8 kbps) of video files transmitted acrossthe Internet (not on the MBONE). Two-way videoconfer-encing has been enabled by CuSeeMe, developed at CornellUniversity, though commercial software, such as ConnectixVideophone, has recently become available.
Information (News Media) Access
Considerable information from traditional news media canbe found on the Internet, mainly the World Wide Web.These include electronic newspapers, trade and othermagazines, news feeds, and audio and video broadcasts.Innovative information sources include nontraditional newsmedia such as search engines and catalogued databases.Financial and government information also abound on the’Net. In general, and consistent with the heritage of theInternet, most information that is available is on the sub-jects of computing, medicine, and on current news topics.
Examples of traditional-news-media-gone-Internet arenewspapers like The San-Jose Mercury News (Knight Rid-der), The Wall Street Journal, and The New York Times;trade magazines from Ziff-Davis (PC Week, PC Magazine)and CMP Publications (Communications Week and Com-puter Shopper); other magazines like HotWired and Time;news feeds from PR Newswire and Reuters; audio broad-casts from c|net, ABC, and National Public Radio; andvideo broadcasts like NBC Pro. There are literally hun-dreds of traditional news media sources available on theInternet, and we estimate the growth in availability of theseservices is growing more rapidly than the growth of the In-ternet.
Nontraditional news media information sources on the In-ternet range from search engine/catalogued databases likeYahoo and Lycos to news aggregation services withsearchable databases, such as Infoseek and Individual Inc.’sNewsPage. We believe the search capabilities of the In-foseek and Newspage pay services are very powerful re-sources, but as with other traditional news media productson the Internet, they have not replaced paper-written mediainformation sources. Only when handheld, wireless devicescan be substituted for paper media will the new mediachallenge the mass market, in our view.
Financial information such as free stock quotes with 15-minute delay are available on the Web as well as by e-mail.The Edgar database contains SEC filings for many compa-nies (those that have volunteered to file electronically).Thousands of government servers dedicated to the purposeof public dissemination contain vats quantities of informa-tion. One excellent government database is the IRS Homepage, from which tax forms formatted in Adobe Acrobatcan be downloaded.
Entertainment
Hundreds of thousands of shareware and freeware gamescan be downloaded from Internet sites. There are hundredsof MUDS (Multiple User Dimensions, Multiple User Dun-geons, Multiple User Dialogues) and MOOs (MUD, ObjectOriented), multi-user chat sessions (Worlds Inc.), Usenetdiscussion groups on entertaining subjects (alt.fan.elvis),and new places and new countries and cultures to explore(such as on the China Home Page).
Education/Research
A common use of the Internet for some 15 years has beenposting and sending academic papers for review by peers,using FTP, gopher and more recently the Web. Searchinglibraries worldwide, then contacting the library to requestto borrow books or other materials, has come into wide-spread use. In nonacademic settings, corporate web pagesoffer abundant information, ranging from entire productcatalogs, in full detailed graphics, available for browsing, tosound bites of the CEO. Such audio and video content maysoon find growing applications in education and research.
Marketing/Advertising
Corporate web pages have become the most popular meansof distributing corporate information to Internet users. De-veloped by a company or an agency on its behalf, a corpo-rate web page can offer varying levels of detail and sophis-tication, depending entirely upon what the company wantsthe public to see, from simple one-page text-oriented webpages to multi-paged, interactive multi-media (video,sound, text and graphics). Most corporate web pages aresomewhere in between, and feature a company description,markets addressed, product specifications, and orderinginformation. Although most corporate web pages are tech-nology-related, other companies are quickly joining in.

4-6 MORGAN STANLEY
This memorandum is based on information available to the public. No representation is made that it is accurate or complete. This memorandum is not an offer tobuy or sell or a solicitation of an offer to buy or sell the securities mentioned. Morgan Stanley & Co. Inc. and others associated with it may have positions in andeffect transactions in securities of companies mentioned and may also perform or seek to perform investment banking services for those companies.
Corporate web page advertising designers who have beenprominent on the Internet include: Modem Media(customers include Zima, AT&T, CBS and MasterCard),CKS Interactive, Free Range Media (The NFL), and Ein-stein and Sandom. Companies that maintain their ownsites for the purpose of promoting others’ products includeOn Ramp, Inc. (Metaverse, Planet Reebok), Fry Multimedia(Ragu Pasta Sauces), and Cybersight (Stolichnaya Vodka).
As with Nielsen ratings for television, for business reasonsadvertisers and corporations want to be able to count view-ers of advertisements. This is a controversial topic on theInternet; as many have observed, it is not as simple ascounting “hits” per web page, that is, the number of timesfiles are downloaded from a home page during a user’svisit. Hits are counted in different ways, pages with manysingle graphics images cause more hits to be recorded, andthat users may often hit a site numerous times whilebrowsing, even though they only visit there once during asession.
More sophisticated and accountable means of countingvisitors to home pages have been developed and offered tothe Internet marketplace by two companies, I/PRO andNetcount. The I/PRO System consists of I/COUNT,I/AUDIT and I/CODE. With I/COUNT, site ownersmonitor aspects of site usage such as number of user-sessions, most frequently accessed files, and geographic andorganization origin of users. I/AUDIT is a third party auditreport of web site activity that site owners can provide toadvertisers and potential advertisers. I/AUDIT is commer-cially available. The I/CODE Universal Registration Sys-tem allows site owners to learn more about the demograph-ics of their visitors. The I/CODE System will be commer-cially available on August 1. Netcount is a competing sys-tem that relies upon Netcount’s servers to track visits to thesite owner’s page. Netcount has tried to differentiate itselfI/PRO by providing more service to the site owner.
Customer Service
A good example of how a company can use the Internet toimprove customer service is Federal Express, which offerspackage tracking through its interactive web page. FedExcan meet its customers’ desire for faster and more accurateaccess to information and, at the same time, control its owncosts more efficiently. Cisco Systems has CIO, Cisco In
formation Online, a web-based trouble-shooting databasecontaining network failure symptoms and possible solu-tions. This service has helped Cisco’s business and overallcustomer satisfaction, because most user questions can beanswered very quickly without having to contact Cisco en-gineers on the customer service line.
Retail/Wholesale/Commerce
A count of Yahoo’s directory shows over 40,000 companiesuse the web to advertise, to offer service, to communicate,or to sell products and services directly through the Inter-net. The latter includes companies that display productspecifications and pictures, expecting consumers to pay fora product which will then to be shipped to them using acommon carrier. The services and products available onthe Internet range from flowers, sneakers, and businesssupplies to business opportunities, music, real estate andtravel.
Shopping centers (malls) are becoming popular on the web,numbering in the hundreds. Many of the images on thescreen use the analogy of walking into the mall, enteringthrough doorways, and so on. Excellent “malls” or mar-ketplaces on the Internet are Internet Shopping Network(ISN), MarketplaceMCI, Wholesaler’s Worldwide Market-place, and CUC International’s site.
There are even ways to make shopping more expedient andto find the lowest prices for products and service publicizedon the Internet. One option consists of data bases of pricesand specifications, in which a web site will display asearchable compilation of prices and product specificationsfrom various retailers and wholesalers. Web users willtypically enters a key word or search by subject to find thelowest prices for various items. One example of this type ofInternet shopping database is Fido: the Shopping Doggie(http://www.continuumsi.com/cgi-bin/Fido/Welcome),which shows a comprehensive list of competitive prices.Another example of such a site is shareware.com, a sitecreated by c|net. It is becoming a definitive source forfinding shareware of all types.
A second option is an active agent. A software agent wouldbe launched from a client station, and would go from onesite to another, seeking the lowest prices for standardizedgoods. AT&T has announced it will produce one, and An-dersen Consulting had introduced a limited-capability beta

MORGAN STANLEY 4-7
This memorandum is based on information available to the public. No representation is made that it is accurate or complete. This memorandum is not an offer tobuy or sell or a solicitation of an offer to buy or sell the securities mentioned. Morgan Stanley & Co. Inc. and others associated with it may have positions in andeffect transactions in securities of companies mentioned and may also perform or seek to perform investment banking services for those companies.
version of a shopping agent (unfortunately, it was immedi-ately blocked from accessing the sites it was programmed tosurvey, because the sites didn’t want their prices to be com-pared with others’). FTP Software has developed software
agents to perform remote computer configuration using ahigh-level script language, which could possibly evolve intoa software shopping agent.
Internet Features and Applications
Exploiting the various resources on the Internet and ena-bling communication, news delivery, and other services re-quires some familiarity with protocols and applications ofthe ’Net.
World Wide Web and Browsers
The de facto desktop application for Internet use is the Webbrowser, which has been likened to the word processor orspreadsheet in the early days of the PC revolution. Just aswith the PC desktop applications and the Microsoft Officeplatform, the browser is being enhanced with newer revi-sions to include an ever-expanding feature set of “plug-in”applications.
The Web runs on the http protocol, which runs atop otherInternet protocols. We believe the browser is an “eye” intothe Internet, the front end that sees the result of consider-able “back end” processes such as content development,databasing, collaborative workgroup efforts, and multime-dia becoming available on the Internet.
Suffice it to say, e-mail is here to stay and will complementother means of human (and computer) communicationswell into our future. This system is also being embraced bythe U.S. Postal Service, such that proof-of-delivery systemsare maintained.
E-mail is an economical, easy way to communicate elec-tronically. It is a competing service to mail delivery serv-ices and faxing and has the advantages that it is quick (ittakes minutes to transfer a message across the world), doesnot require paper, and is less expensive than faxing. An e-mail message can be sent from one computer to another onthe Internet if each is connected to an e-mail ‘gateway’ (aspecialized Internet connected device which stores, for-wards and routes mail). Compared to other services on theInternet, e-mail messages can experience a slight delay, be-
cause most gateways collect and store messages, then proc-ess them in batches. Gateways are configured according tothe needs of the e-mail using organization, the costs of theservice, and priority of messages being sent and received.A typical delay in sending an e-mail message from one or-ganization to another, when each is connected to a large,well-funded Internet Service Provider, would be about 10minutes. On the other hand, a small corporation with ananalog dial-up connection to the Internet may decide tocollect e-mail and send it out every hour or two.
File Transfer Protocol (FTP)
FTP was developed to allow users to connect to remotesystems, log on, move and search through the file system,and upload and download files. Two types of interfacesare available: command line and graphical user interfaces.With the command line interface, once the user has loggedon to the host system, the user’s screen displays the hostmachine’s operating environment file system. Using thecommand line FTP interface therefore requires someknowledge of the host machine’s filing and operating sys-tem. Graphical user interfaces hide operating systems dif-ferences and display a consistent, easy-to-use interface ca-pable of interpreting a variety of different operating systemfiling systems.
Usenet
Usenet is a service carried over the Internet that has beenavailable since 1979. The service allows millions of usersto share their thoughts on a variety of topics by postingmessages (uploading messages to discussion groups) forpublic comment, reading and reviewing other’s thoughts,and responding to other’s comments. It is characterized byrich and consistently varying content, similar to the userforums or discussion groups found on AOL, CompuServeor other online services. Users will join or subscribe toUsenet groups that interest them; there are about 17,000active Usenet discussion groups, ranging on topics from

4-8 MORGAN STANLEY
This memorandum is based on information available to the public. No representation is made that it is accurate or complete. This memorandum is not an offer tobuy or sell or a solicitation of an offer to buy or sell the securities mentioned. Morgan Stanley & Co. Inc. and others associated with it may have positions in andeffect transactions in securities of companies mentioned and may also perform or seek to perform investment banking services for those companies.
U.S. Robotics modems, to ISDN terminal adapters, to petsand hobbies. A unique culture has arisen in the use ofUsenet. Peculiarities include the use of emoticons, such asthe smiley face :) and use of abbreviations like IMHO (inmy humble opinion), and the well-publicized flame wars,where users insult one another. Usenet posts are typicallyupdated on the same time frame as e-mail, that is it mighttake 10 minutes, 1 hour, or 12 hours, depending upon theUUCP (Unix to Unix Copy Protocol) gateway connection.
Legacy Internet Features
Several features of the Internet that are in declining use to-day are Gopher, Archie, Veronica, Jughead, WAIS, telnet,IRC, Finger and WhoIs. The first five have essentiallybeen supplanted by the functionality of the Web and itsapplications. telnet is an interface that emulates a dumbterminal connection to a mainframe or minicomputer. It isstill in use today, but few applications are being developedto use this technology. IRC (Internet Relay Chat) is a text-based multi-user chat system that allows real-time com-munications in various chat discussion groups — not asmall business, since about 1/3 of AOL’s and 1/4 of Com-puServe’s revenues derive from catering to proprietaryservices like this. Finger and WhoIs are in most cases inef-
fective user location systems: There are too many differentnetwork systems on the ’Net today, and many administra-tors of networks do not allow Finger-ing of their sites forsecurity reasons (hackers can use this information to breachsecurity networks).
New Applications in Beta Test
Several new applications exploiting various features of theInternet are in beta testing now. Each has serious implica-tions for future use of the Internet. Four such are depictedin a simultaneous Windows 95 session in Figure 4.1, enti-tled StreamWorks, RealAudio, Internet Phone and WorldsChat Session.
In the upper left-hand corner is Xing Technology’sStreamWorks software running a real-time playback of anNBC broadcast of a Charles Kurault monologue. In theupper right-hand corner is Real Audio software, which en-ables real-time playback of radio and music. Next is theWorlds Chat, a real-time, interactive chat software. In thelower left-hand corner is VocalTec’s Internet Phone soft-ware, which is connecting to an Internet Phone server tosee what other users have logged in and can speak usingthe two-way voice system (telephony) enabled by the soft-ware card.
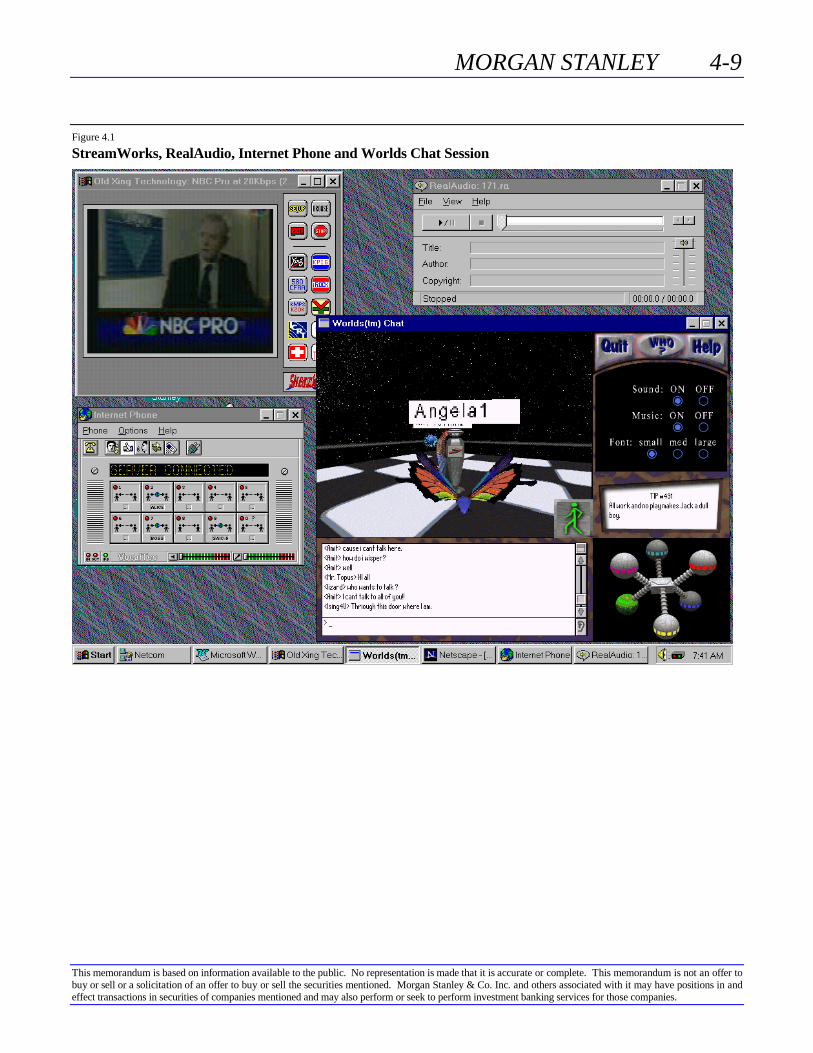
MORGAN STANLEY 4-9
This memorandum is based on information available to the public. No representation is made that it is accurate or complete. This memorandum is not an offer tobuy or sell or a solicitation of an offer to buy or sell the securities mentioned. Morgan Stanley & Co. Inc. and others associated with it may have positions in andeffect transactions in securities of companies mentioned and may also perform or seek to perform investment banking services for those companies.
Figure 4.1
StreamWorks, RealAudio, Internet Phone and Worlds Chat Session

MORGAN STANLEY
This memorandum is based on information available to the public. No representation is made that it is accurate or complete. This memorandum is not an offer tobuy or sell or a solicitation of an offer to buy or sell the securities mentioned. Morgan Stanley & Co. Inc. and others associated with it may have positions in andeffect transactions in securities of companies mentioned and may also perform or seek to perform investment banking services for those companies.
Within the last three years, Morgan Stanley & Co. Incorporated and/or its affiliates managed or comanaged a public offering of the securities of 3Com Corp.,3DO, Adobe Systems Inc., ADTRAN Inc., Amdahl, America Online Inc., American Express, Apple Computer Inc., Applied Materials, Arrow Electronics,Ascend Communications Inc., ASM Lithography, Aspect Telecommunications, AT&T Corp., Avid Technology, Bay Networks Inc., Cablevision Systems,Cascade Communications, Compaq Computer Corp., Compuware, Cox Communications, Cypress Semiconductor, Electronic Data Systems, FileNet, First DataCorp., Fiserv, Gartner Group Inc., General Motors, General Signal, Gupta Corporation, Hewlett-Packard Co., HNC Software, International Business MachinesCorp., Intuit Inc., Jones Intercable Inc., Keane Inc., KLA Instruments, Learning Company, Macromedia Inc., Maxis, Netscape Communications Corp., New YorkTimes Co., Novell Inc., Ortel, Pulitzer Publishing, Quickturn Design Systems Inc., Seagate, Sears Roebuck & Co., SGS-Thomson, Silicon Graphics Inc., SiliconValley Group, Tele-Communications Inc., The Walt Disney Company, Time Warner Inc., Times Mirror Company, Xerox, Xilinx, Xircom Inc., and YoungBroadcasting.
Morgan Stanley & Co. Incorporated and/or its affiliates make a market in the securities of 3Com Corp., 3DO, Acclaim Entertainment, Adaptec, ADCTelecommunications, Adobe Systems Inc., ADTRAN, Altera, America Online Inc., Apple Computer Inc., Applied Materials, Ascend Communications Inc.,Aspect Telecommunications, AST Research, Atmel, Auspex Systems, Autodesk Inc., Avant Corp., Avid Technology, Bay Networks Inc., BMC Software,Borland, Cascade Communications, Cirrus Logic, Cisco Systems Inc., Comcast Corp., CompUSA, Compuware, Dell Computer Corp., DSC Communications,Electronic Data Systems, Electronics for Imaging, Exabyte, FileNet, Fiserv, Gartner Group Inc., General Motors, Gupta Corporation, HBO & Company, HNCSoftware, Hyperion Software, Information Res Engr Inc., Informix, Integrated Device Technology, Integrated Measurement Sys, Intel Corp., IntelligentElectronics, Intergraph Corp., Intuit Inc., Jones Intercable Inc., KLA Instruments, Komag, Landmark Graphics Corp., Lattice Semiconductor, Macromedia Inc.,Maxim, Maxis, MCI Communications, Medaphis Corp., Mentor Graphics Corp., MFS Communications, Microchip, Microsoft Corp., Netscape CommunicationsCorp., New World Comm Group, Newbridge Networks Corp., Novell Inc., Novellus Systems, Oracle Corp., Ortel, Parametric Technology Corp., Paychex Inc.,PeopleSoft, Platinum Software, Pulitzer Publishing, Quantum, Quickturn Design Systems Inc., ReadRite, Retix, Seagate, Sequent Computer, SierraSemiconductor Corp., Silicon Valley Group, Spiegel Inc., Structural Dynamics Research, Sun Microsystems Inc., Sybase, Symantec, Synopsys Inc., TCA CableTV, Tech Data Corporation, Tele-Communications Inc., Tellabs, VeriFone Inc., Viacom Inc., VLSI Technology, Walker Interactive, Worldcom Inc./Ga., Xilinx,Xircom Inc., Young Broadcasting, and Zilog.
Morgan Stanley & Co. Incorporated and/or its affiliates or its employees have or may have a position or holding in the securities, options on securities, or otherrelated investments of issuers mentioned herein.
To our readers in the United Kingdom: This publication has been issued by Morgan Stanley & Co. Incorporated and approved by Morgan Stanley & Co.International Ltd., a member of The Securities And Futures Authority. Morgan Stanley & Co. International Ltd. and/or its affiliates may be providing or mayhave provided significant advice or investment services, including investment banking for any company mentioned in this report. The investments discussed orrecommended in this report may be unsuitable for investors depending on their specific investment objectives and financial position. Private investors shouldobtain the advice of their Morgan Stanley & Co. International Ltd. representative about the investments concerned. The price or value of the investments to whichthis report relates, either directly or indirectly, may fall or rise against the interest of investors. Where an investment is denominated in a currency other thanpounds sterling, changes in rates of exchange may have an adverse effect on the value, or price of, or income derived from the investment. Past performance is notnecessarily a guide to future performance. Income from investments may fluctuate. This publication is disseminated in Singapore by Morgan Stanley Asia(Singapore) Pte Ltd.
Additional information on recommended securities is available on request.

MORGAN STANLEY20-3, Ebisu 4-chomeShibuya-ku, Tokyo 150Tel: (813) 5424-5000
3 Exchange SquareHong KongTel: (852) 2848-5200
1585 BroadwayNew York, New York 10036-8293Tel: (212) 761-4000
Canary Wharf / 25 Cabot SquareLondon E14 4QATel: (071) 513-8000; 425-8000
This product ©1996was printed on Morgan Stanley & Co.recycled paper Incorporated