the corporate r&d tax credit and u.s. innovation …...contents 1 introduction and summary 4...
TRANSCRIPT
www.americanprogress.org
AP Ph
oto
/Rich
ARd
dRew
The Corporate R&D Tax Credit and U.S. Innovation and CompetitivenessGauging the Economic and Fiscal Effectiveness of the Credit
Laura Tyson and Greg Linden January 2012

The Corporate R&D Tax Credit and U.S. Innovation and CompetitivenessGauging the Economic and Fiscal Effectiveness of the Credit
Laura Tyson and Greg Linden January 2012

Contents 1 Introduction and summary
4 Federal support for research and development
12 U.S. business investment in R&D
19 U.S. government support of business R&D investments
22 Tax expenditures for the expensing of R&D
25 The corporate R&D tax credit
41 Assessing the effectiveness of the corporate R&D tax credit
49 Improving the effectiveness of the corporate R&D tax credit
60 Conclusion
62 About the authors

1 center for American Progress | the corporate R&d tax credit and U.S. innovation and competitiveness
Introduction and summary
Investment in research and development is a significant driver of technological progress and economic growth, particularly in high-wage developed countries. The United States spends more than any other nation in the world on research and development, or R&D, but its relative position (measured by the share of such investment in national income) has been falling even as other countries increase their investments in research. In the United States, as in most other countries, business finances and carries out the majority of R&D activities.
Economic theory provides a strong justification for government support for R&D, including subsidies and incentives for business research. Without such sup-port, companies are likely to underinvest in research (from the standpoint of the economy as a whole) because the results of R&D cannot be fully appropriated by the investing firm. Business accounts for a large and growing share of U.S. R&D spending, financing about two-thirds of the total in 2008, but business R&D as a share of U.S. gross domestic product has fallen behind the share in several other countries, including Japan and South Korea.
The U.S. government supports business R&D both through direct R&D fund-ing, mostly dedicated to national-priority areas such as defense and health, and through tax incentives such as the research tax credit—the subject of this report. The United States was one of the first nations to provide tax incentives for busi-ness R&D, but many other countries have now introduced similar incentives, and many of their incentives are more generous. Tax incentives for business R&D have become an important tool used by countries to build their innovation capabilities and bolster their growth.
At the same time, business R&D investment is becoming more globalized. The large multinational companies headquartered in the United States, Europe, and Japan that account for more than 90 percent of business R&D worldwide are locating more of their R&D outside their home countries. Their location decisions are driven by many factors, including the growth of foreign markets, lower costs,
2 center for American Progress | the corporate R&d tax credit and U.S. innovation and competitiveness
the availability of foreign talent, and the tax and other incentives offered by foreign governments. Foreign investments in R&D by U.S. and other multinational compa-nies are facilitating the development of R&D capabilities and the growth of high-technology industries in many emerging-market economies, particularly China.
Competition among nations to attract business R&D and to develop technology-intensive industries is growing. This challenges U.S. policymakers to strengthen policies that make the United States an attractive location for these activities. The most important of these tax incentives is the corporate research tax credit, formally known as the Research and Experimentation Tax Credit and also referred to by the U.S. Internal Revenue Service as the Credit for Increasing Research Activities. The goal of this corporate R&D tax credit is to encourage R&D invest-ment by domestic and foreign firms alike by rewarding incremental, qualified research in the United States.
Broad federal corporate tax reform is now under discussion in Washington, includ-ing the appropriate role of tax expenditures—special features of the tax code to encourage specific activities with incentives such as the corporate R&D tax credit. This tax credit in particular is ripe for examination because it is one of the largest corporate tax expenditures in the federal budget, amounting to between $5 billion and $10 billion every year. The credit has, in fact, lapsed as of January 1, 2012, but Congress can reinstate it retroactively as it has done nine times previously.
There have been many careful empirical studies of the efficacy of the corporate R&D tax credit. Most studies find that the credit is effective in the sense that each dollar of foregone tax revenue causes businesses to invest at least an additional dollar in R&D. In other words, the credit stimulates at least as much R&D activity as a direct subsidy. And unlike a subsidy, which is usually linked to a particular kind of R&D related to a specific national goal, the credit allows businesses to select projects on the basis of the anticipated returns from incremental research dollars.
In this report, we examine the role of the credit in federal government support for R&D, evaluate the credit’s performance in realizing its objectives, and make rec-ommendations to simplify, modify and strengthen its effectiveness. Our recom-mendations fall into two broad categories:
•Measures to simplify the corporate R&D tax credit
– Evaluate the revenue and incentive effects of replacing this credit, which is designed to apply only to incremental R&D spending by a company, with a similar credit that applies to the company’s full level of R&D spending.

3 center for American Progress | the corporate R&d tax credit and U.S. innovation and competitiveness
– Evaluate the revenue and incentive effects of replacing this credit with a “superdeduction” for R&D expenses or with an R&D jobs credit for the wages paid to R&D employees.
– Replace the complex definition of qualified-research expenses eligible for this credit with the simpler definition of research expenses eligible for the research expense deduction.
– If this credit is continued in its current form, then change the base period to a period in the more recent past, such as the most recent five years.
•Measures to strengthen the corporate R&D tax credit
– Extend a simplified version of the tax credit for a period of 5 years to 10 years, dur-ing which the effectiveness of its new design can be assessed.
– After this period, make the simplified tax credit permanent in order to increase its effectiveness.
– Increase the tax credit by about 20 percent to keep it competitive with the tax incentives offered by other nations.
– Provide small firms a larger and, in some cases, refundable version of the tax credit. – Drop the tax credit from the list of credits that are disallowed under the Alternative Minimum Tax.
– Coordinate data gathering and assessments of the tax credit across agencies, making as much detail as possible available to independent researchers.
The report ends with a brief discussion of the implications of comprehensive cor-porate tax reform for the corporate R&D tax credit. Given the spillover benefits of R&D investment and the demonstrated effectiveness of the credit, we believe it should be preserved and strengthened as part of corporate tax reform. Otherwise, innovation and growth will languish in the United States as both U.S. and foreign companies locate more of their increasingly mobile R&D to countries offering more generous tax incentives.

4 center for American Progress | the corporate R&d tax credit and U.S. innovation and competitiveness
Federal support for research and development
The U.S. government plays an important role in supporting R&D both through direct government funding and through tax incentives to encourage business R&D. The most important of these tax incentives is the corporate R&D tax credit, formally known as the Research and Experimentation Tax Credit and also referred to by the U.S. Internal Revenue Service as the Credit for Increasing Research Activities.
In this section, we examine the economic rationale for government support of R&D directly and through the tax code in the form of research tax credits. We also provide a brief summary of how federal government funding for R&D has changed over time and how it has been allocated among different types of research.
The economic rationale for government R&D support
Studies based on historical and cross-country data generally find that investment in R&D is a significant driver of economic growth. Although there are multiple ways that the relationship can be measured,1 most methods show that investments by business in R&D are at least as productive as investments in capital goods.2 As a 2005 Congressional Budget Office analysis of the relationship between R&D and productivity concluded:
A consensus has formed around the view that R&D spending has a signifi-cantly positive effect on productivity growth, with a rate of return that is about the same size as (or perhaps slightly larger than) the rate of return on conventional investments.3
Most of the relevant academic studies report their findings in terms of techni-cal economic concepts such as “elasticity” and “total factor productivity,” but a few studies report their findings in comprehensible dollar values. An analysis of a group of advanced industrial economies (the “Group of Seven” nations, which are the United States, Japan, Germany, France, the United Kingdom, Italy,

5 center for American Progress | the corporate R&d tax credit and U.S. innovation and competitiveness
and Canada) for the period 1971 to 1990, for example, found that each $100 of additional R&D led to a $123 increase in GDP.4 A more recent study of 16 industrialized member nations of the Organisation for Economic Co-operation and Development, or OECD, for the period 1980 to 1998 found that each $100 of additional R&D spending by businesses boosted GDP by $113.5
Studies based on historical and cross-country data also find in most cases that the societywide returns on investments in R&D are significantly larger than the private returns earned by the investors who fund R&D. This is because private investors in R&D are usually unable to capture all of the benefits that result from their R&D investment. Economists refer to these extra benefits as “spillovers.”6 Spillovers can be of two types: knowledge or financial. We look at each in turn.
Knowledge spillovers
Knowledge spillovers can occur for a number of reasons.7 One is that firms can’t capture all of the benefits created by their R&D investments because of incom-plete patent protection. Other reasons include an inability to keep unpatentable “tricks of the trade” secret, and the possibility of reverse engineering or imitation.
Through any or all of these mechanisms, R&D investment by one firm can speed knowledge creation by other firms, which build on the “free” knowledge leaking from the first firm to increase their productivity, improve their products, launch new research programs, develop new applications, and, perhaps, attract customers away from the firm that made the R&D investment in the first place.
Knowledge spillovers are especially important for productivity growth because they allow some of the results of one firm’s research investment to help multiple firms at little more than their cost of absorbing the additional knowledge. From the perspective of a firm on the receiving end, knowledge spillovers can come from R&D investments funded by:
•Other firms in the same industry•Other firms in other industries•Universities•The government•Firms, universities and governments in other countries
6 center for American Progress | the corporate R&d tax credit and U.S. innovation and competitiveness
From the perspective of a national economy, the first four kinds of knowledge spillovers are components of the economywide-social, or aggregate, return on the R&D investment funded by an actor within the economy, while the fifth kind of return is a knowledge spillover from R&D investment abroad.
Empirical studies identify several significant features of knowledge spillovers. Knowledge spillovers are particularly important in industries that rely heavily on R&D expenditures and skilled workers.8 Knowledge spillovers are stronger the smaller the distance between the firm doing the R&D investment and the firms that reap the knowledge benefits, although in the Internet era, distance can be technological, organizational, or geographical.9 But recent research confirms that physical distance still matters when it comes to the speed and size of knowledge diffusion.10 Critical technical and scientific knowledge is still often exchanged through face-to-face encounters or through the movement of researchers from one company to another.
As a result, both knowledge spillovers and the innovations they spawn tend to be geographically concentrated in R&D-intensive industries. This explains in part why clusters of high-technology industries have developed in numerous locations around the world, usually near one or more research universities.11
Financial spillovers
A financial spillover occurs when the knowledge resulting from one company’s R&D lowers the prices and/or raises the quality (at the same prices) of goods used by consumers or by other companies. These financial benefits are often not apparent in data linking R&D investment and GDP growth, but they are nonethe-less an important component of the societal benefit from R&D.
To understand how a financial spillover might look in practice, consider the dis-covery of a new medical technique that costs nothing to employ, is not patentable, and saves lives. The country’s gross domestic product would not reflect this shift in any obvious way—in fact any private expenses incurred to develop the technique would reduce GDP—but the innovation would reduce the cost of health care and produce significant societal benefits.
Societywide
returns on R&D are
significantly larger
than the private
returns to investors
who fund R&D.

7 center for American Progress | the corporate R&d tax credit and U.S. innovation and competitiveness
Economists refer to financial spillovers as pecuniary (or rent) externalities.12 A positive pecuniary externality exists when a firm or consumer purchases a good or service that has been improved through R&D at a lower price than the user’s private valuation of the improved product. These pricing spillovers can occur for a variety of reasons, including information asymmetries between the producer and the user, imperfect appropriability, and competition that lowers prices.
Computers and cell phones are two important examples of goods where steady improvements have brought society-level benefits that have not been fully captured by the firms that made the improvements. One study that looked at the relationship of R&D in five broadly-defined industries to the variable costs of production in the same five industries found that the R&D-related cost reduction in the receiving industry was anywhere from 10 percent to 1,000 percent of the cost reduction each industry received as a result of its own R&D.13
The social rate of return from an R&D investment is defined as the sum of the private rate of return and the economywide spillover benefits resulting from this investment. The total social returns to R&D are very difficult to measure, but empirical research confirms that the measurable social returns are almost always significantly larger than the private returns to R&D. Estimates of the relationship between private and social returns are typically on the order of about 1-to-2.
Table 1 (see next page) contains industry-level estimates of the private and social rates of return to R&D investment from several studies covering a variety of time periods and countries. It is important to note that the “within-industry” return to R&D already reflects the social returns that accrue within the industry in which the R&D was made, so the ratio between the last two columns understates the social returns.

8 center for American Progress | the corporate R&d tax credit and U.S. innovation and competitiveness
Study reference Sample Within-industry return Return in other industries
Zvi Griliches and Frank R. Lichtenberg, “Interindustry Technology Flows and Productivity Growth: a Reexamination,” Review of Economics & Statistics 66 (1984): 325-329.
193 U.S. industries,
1959-197811% to 31% 50% to 90%
Akira Goto and Kazuyuki Suzuki, “R&D capital, rate of return on R&D investment and spillover of R&D in Japanese manufacturing industries,” Review of Economics and Statistics 71 (4) (1989): 555–564.
50 Japanese industries,
1978-198326% 80%
Jeffrey I. Bernstein and M. Ishaq Nadiri, “Research and Development and Intra-Industry Spillovers: An Empirical Application of Dynamic Duality,” Review of Economic Studies 56 (2) (1989): 249–269.
4 U.S. industries, 1965-1978
7% 9% to 13%
Jeffrey I. Bernstein, “Factor intensities, rates of return, and international spillovers: The case of Canadian and U.S. industries,” Annales d’Economie et de Statistique 49/50 (1998): 541–564.
11 Canadian industries, 1962-1989
12.8% 19% to 145%
Jeffrey I. Bernstein, “Factor intensities, rates of return, and international spillovers: The case of Canadian and U.S. industries,” Annales d’Economie et de Statistique 49/50 (1998): 541–564.
11 U.S. industries, 1962-1989
16.4% 28% to 167%
Rachel Griffith, Stephen Redding, and John Van Reenen, “Mapping the Two Faces of R&D: Productivity Growth in a Panel of OECD Manufacturing Industries,” Review of Economics and Statistics 86 (4) (2004): 883–895.
12 OECD countries, 12 industries,
1974-199047% to 67% 57% to 105%
Source: The table is based on Table 5 in: Bronwyn H. Hall, Jacques Mairesse, and Pierre Mohnen, “Measuring The Returns To R&D.” Working Paper 15622 (National Bureau of Economic Research), available at http://www.nber.org/papers/w15622.
table 1
Measuring the spillover benefits of research and development
Selected estimates of the returns on business R&D
The existence of substantial social rates of return provides a powerful economic jus-tification for government policies to fund investment in R&D. In the absence of such support, private investors will base their R&D investment decisions on their private returns, will overlook the social returns from such investment, and will therefore underinvest in R&D relative to the level that would be optimal for society.
Of course, some benefits of U.S. research and development will spill over to other countries, but cross-border spillovers work in both directions. Nations learn from one another in a variety of ways, including international trade, foreign direct investment, the movement of scientists and engineers, publications in technical journals, patent documentation, and international research collaboration. A highly
9 center for American Progress | the corporate R&d tax credit and U.S. innovation and competitiveness
cited study, written by economists David Coe of the International Monetary Fund and Elhanan Helpman (currently at Harvard University), of the impact of R&D spillovers over national borders found that roughly a quarter of the benefits from R&D spending in the Group of Seven countries accrue to their trading partners.14
A number of subsequent studies have revisited this result or employed different models of international knowledge flows. This has led to a wide range of estimates of the significance of cross-border knowledge spillovers, but there is a strong consensus that R&D in one country creates knowledge spillovers that enhance productivity in other countries to some extent.15
Indeed, there is speculation that globalization may have reduced the local nature of knowledge spillovers, but the evidence on this important policy question is neither extensive nor conclusive. One study that investigated this question using data on manufacturing industries in 14 OECD countries finds that the impact of distance on technology diffusion declined about 20 percent from the 1970s to the 1980s.16 Although knowledge can—and does—spill across borders, the bulk of the empirical evidence suggests that the knowledge spillovers resulting from R&D are still most powerful and diffuse most rapidly at the local and national levels.17
Overall, then, the evidence indicates that, although international technology diffu-sion is an inescapable feature of globalization, it works in both directions and does not undermine the rationale for public support of private R&D. The purpose of government programs such as the corporate R&D tax credit is to bring the private incentive into closer alignment with the potential social returns by encouraging the spillovers that attend most R&D projects.
U.S. government investment in R&D
In 2008 the federal government spent about $104 billion on R&D, which was 26 percent of all U.S. R&D spending that year, the last year for which complete data are available. The government’s share of total R&D spending has declined considerably since 1964, when it peaked at 67 percent. But this relative decline was largely caused by the huge increase in R&D investment by business, which jumped in constant (year 2000) dollars from $26.6 billion in 1964 to $218.8 bil-lion in 2008. Real federal R&D spending also rose steadily over this period, but at a much slower rate, from $57.7 billion to $84.7 billion.18
The bulk of
evidence suggests
that knowledge
spillovers are still
most powerful
at the local and
national levels.
10 center for American Progress | the corporate R&d tax credit and U.S. innovation and competitiveness
As government R&D funding has increased over time, its composition has changed. There are three distinct, but interrelated, kinds of research:
• Basic: research to advance scientific knowledge even though commercial appli-cations may not be readily apparent. An example of a current basic research project is the construction of the Large Hadron Collider, a multinational project based in Switzerland that is designed to answer some of the fundamental ques-tions of physics. The social returns to basic research can be very large, as in the case of the discovery of DNA, the basic source code of all life.
•Applied: research to advance knowledge to meet a specific recognized need, such as the effort to use graphene, a form of carbon, to make electronic compo-nents with dimensions measured in atoms. This will allow the further miniatur-ization of electronic products.
•Development: the application of knowledge to create specific goods or services such as the programming of new computer-security software.
Applied research funded or performed by the government is usually linked to a specific national objective, such as improving the efficiency of the health care system or designing a new weapons system. Similarly, applied research by industry is usually linked to new products and processes, such as a compact yet powerful energy source capable of enabling high-volume production of the next generation of microchips.
The purpose of development research is to use knowledge to create new or improved products or processes for near-term uses. In manufacturing industries, this includes the design, prototype, and refinement activities needed to bring a product to market. An example of government-funded development is a grant for funding the creation of a robot for military use in minefields.
The U.S. government spends the largest portion of its R&D budget on basic research—38 percent in 2008—but this was not always the case. Government R&D spending was, for a long time, dominated by development activities, of which the share did not fall below 50 percent until 1996. The share of basic research has risen more or less steadily since the 1950s, when it accounted for less than 10 percent of government research spending.

11 center for American Progress | the corporate R&d tax credit and U.S. innovation and competitiveness
In 2008 development’s share had fallen to 34 percent of the total, followed by applied research at 28 percent. (see Figure 1) Many of the government projects in these two research categories are defense-related, and defense research has accounted for 50 per-cent to 70 percent of the U.S. government’s total research budget for at least the past 30 years.
Defense R&D as a share of total R&D spending is much higher in the United States than in the other developed countries. Based on appropriated budget shares, the United States devoted about 58 percent of government R&D spending to defense purposes in 2007 compared to 33 percent for all OECD countries, 28 percent for the United Kingdom, 13 percent for the entire 27 members of the European Union, and 4.5 percent for Japan.
Although basic research has not always been the largest share of government research spending, the government has always been the largest source of basic research funding. Since 1953, U.S. gov-ernment spending as a share of all basic research funding has ranged between 53 percent and 72 percent, landing at 57 percent in 2008.19
The government’s large role in funding basic research is consistent with the evidence that the social returns to this kind of research far exceed the private returns. Federal funding for basic research has been critical to the development of many technologies of everyday importance—plant genetics, fiber optics, magnetic-resonance imaging, computer-aided design and manufacturing technologies, data compression, and the Internet. Nearly all of the government’s basic-research spending (about 95 percent in recent years) goes to nondefense purposes. About 55 percent of government fund-ing for basic research in 2008 went to health science.20
Figure 1
The federal R&D mix
U.S. government R&D spending by research type, 2008
Development34%
Basic38%
Applied28%
Source: National Science Board, “Science and Engineering Indicators 2010,” Chapter 4.

12 center for American Progress | the corporate R&d tax credit and U.S. innovation and competitiveness
U.S. business investment in R&D
Businesses have increasingly funded their own R&D and account for a growing share of national R&D spending. This section provides an overview of trends in R&D spending by industry, with special consid-eration of the different roles of large and small firms. We conclude the section with a comparison of business R&D spending in the United States and other countries.
This section provides more of the larger context for understand-ing the corporate R&D tax credit. For instance, the dominance of R&D spending by large firms accounts for their large share of the R&D credit. Recent evidence shows that the lead of U.S. business in global R&D spending is gradually shrinking, in part because of competition among countries to attract business R&D spending through tax incentives.
The growing role of business in U.S. R&D
In the mid-1960s, the federal government was the major source of funds for all R&D. But the federal share fell below the business share of R&D funding in the late 1970s and continued a relative decline, with business surpassing the govern-ment’s share around 1980. In 2008, when the federal government funded 26 percent of total U.S. R&D, business funded about 67 percent. (see Figure 2)
When the amount of business R&D funded by the U.S. government through contracts and grants is included, the share of business R&D in the total R&D performed in the United States in 2008 was about 73 percent. As these numbers make clear, U.S. leadership in science and technology industries is highly depen-dent on R&D investments made by the private sector. This is not an unusual state of affairs. Businesses are the most significant funder of national R&D
Figure 2
U.S. R&D funding breakdown
Total U.S. R&D by funding source, 2008
Source: National Science Board, “Science and Engineering Indicators 2010,” Chapter 4.
Business67%
Government27%
Academia 3% Other nonprofit 3%

13 center for American Progress | the corporate R&d tax credit and U.S. innovation and competitiveness
spending in most OECD countries as well as in the top 10 countries ranked by R&D spending as a share of GDP.
Industry allocates most of its R&D funding to applied and development research, where the private returns are likely to be more immediate and more easily cap-tured by the investor. In 2008 only about 5 percent of industry’s $268 billion R&D budget was allocated to basic research (some of which was conducted in universi-ties or other nonprofits), down from a high of around 8 percent in 1991.
Since the returns to basic research are uncertain and often emerge only after many years, it is usually difficult for private firms to justify such investment. In certain cases, however, firms may have an incentive to invest in basic research to develop specialized knowledge that leads to new ideas for applied research projects and new product opportunities. A recent study of 14 large industrial firms found support for the proposition that firms making greater-than-average investments in both basic and applied research had better financial results than if they had invested only in applied research.21 The industries that invest the most in basic research, such as the pharmaceutical industry, are those for which new products and processes depend on scientific and technological advancement.
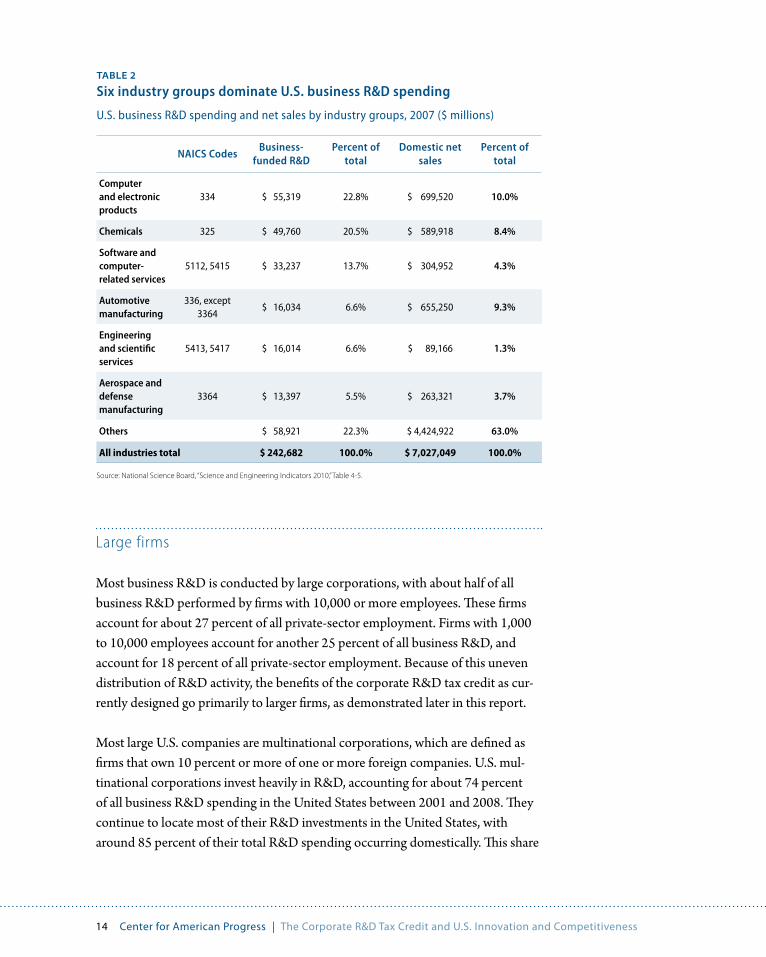
As this suggests, industries differ in their R&D intensities. Table 2 shows that six broad industry groups—chemicals (including pharmaceuticals), computers and electronic products, aerospace and defense manufacturing, the automo-tive industry, software and computer related services, and R&D services (busi-nesses that provide scientific, engineering, and architectural services to other firms)—accounted for 78 percent of all self-funded business R&D in 2007 (the most recent year for which industry-specific data are available) even though they accounted for only 37 percent of domestic sales. Since the bulk of business R&D occurs in a few major sectors, these are the sectors that benefit the most from the corporate R&D tax credit.
In 2008, business
funded 67 percent
of total R&D in the
United States.
14 center for American Progress | the corporate R&d tax credit and U.S. innovation and competitiveness
NAICS CodesBusiness-
funded R&DPercent of
totalDomestic net
salesPercent of
total
Computer and electronic products
334 $ 55,319 22.8% $ 699,520 10.0%
Chemicals 325 $ 49,760 20.5% $ 589,918 8.4%
Software and computer-related services
5112, 5415 $ 33,237 13.7% $ 304,952 4.3%
Automotive manufacturing
336, except 3364
$ 16,034 6.6% $ 655,250 9.3%
Engineering and scientific services
5413, 5417 $ 16,014 6.6% $ 89,166 1.3%
Aerospace and defense manufacturing
3364 $ 13,397 5.5% $ 263,321 3.7%
Others $ 58,921 22.3% $ 4,424,922 63.0%
All industries total $ 242,682 100.0% $ 7,027,049 100.0%
Source: National Science Board, “Science and Engineering Indicators 2010,” Table 4-5.
Large firms
Most business R&D is conducted by large corporations, with about half of all business R&D performed by firms with 10,000 or more employees. These firms account for about 27 percent of all private-sector employment. Firms with 1,000 to 10,000 employees account for another 25 percent of all business R&D, and account for 18 percent of all private-sector employment. Because of this uneven distribution of R&D activity, the benefits of the corporate R&D tax credit as cur-rently designed go primarily to larger firms, as demonstrated later in this report.
Most large U.S. companies are multinational corporations, which are defined as firms that own 10 percent or more of one or more foreign companies. U.S. mul-tinational corporations invest heavily in R&D, accounting for about 74 percent of all business R&D spending in the United States between 2001 and 2008. They continue to locate most of their R&D investments in the United States, with around 85 percent of their total R&D spending occurring domestically. This share
table 2
Six industry groups dominate U.S. business R&D spending
U.S. business R&D spending and net sales by industry groups, 2007 ($ millions)

15 center for American Progress | the corporate R&d tax credit and U.S. innovation and competitiveness
has changed little in recent years even as the share of foreign sales in the overall revenues of U.S. multinational firms has grown significantly.
But the geographic distribution of their R&D activity abroad has been changing, with the share in developed countries declining from 90 percent in 1994 to 81 percent in 2008, and the share of Asia excluding Japan more than doubling to 12 percent during the same period.
Despite the pull of fast-growing foreign markets, U.S. multinationals have many reasons to conduct a significant share of their R&D activity in the United States, including substantial funding from the U.S. government on mission-oriented R&D projects such as defense, space exploration, and specific diseases. Other rea-sons include the strength of U.S. intellectual-property protection and proximity both to U.S. engineering and scientific talent and to local or national knowledge spillovers from research at U.S. universities, laboratories, and think tanks. These factors attract R&D by foreign firms, too. According to the most recent data, the U.S. affiliates of foreign multinationals perform more R&D in the United States ($33.5 billion in 2006) than U.S. companies perform overseas ($28.5 billion).
The corporate R&D tax credit provides further inducement to U.S. and foreign multinationals to do their research in the United States by offering a rebate against each additional research dollar spent here, as we detail later in this report. But the position of the United States as the leading destination for multinational R&D investments is less secure than before. Foreign science and engineering talent is increasing in quality and quantity. Foreign universities and research institutes are expanding and offering attractive research opportunities. And, importantly, many foreign countries are now offering significant tax advantages for R&D. The upshot is that we expect U.S. multinational corporations to shift more of their R&D activ-ity abroad over time. The corporate R&D tax credit is one tool the U.S. govern-ment can use to counter this trend.
Small firms
Small firms (those with 500 employees or less) also play an important role in R&D, accounting for about 19 percent of R&D spending in 2007 (compared to about 50 percent of private-sector employment). A Small Business Administration study found that firms with fewer than 500 employees registered more than 15 times more patents per employee than large firms between 2002 and 2006.22 The study
U.S. multinationals
accounted for
about 74 percent
of all business R&D
in the United States
from 2001 to 2008.

16 center for American Progress | the corporate R&d tax credit and U.S. innovation and competitiveness
also showed that, even though small firms accounted for only 6.5 percent of the pat-ents issued during the period, their patents were about 70 percent more likely than the patents of large firms to be cited by a patent that was issued in 2007. Citations by subsequent patents are a standard measure of the quality of patents that were granted earlier.
The presence and support of small firms are vital components of the nation’s R&D infrastructure. Small companies are more likely to explore technology subfields in which large firms are less active, indicating the important complementary role small firms play in the U.S. innovation landscape.23 In the 1980s, for example, most bio-technology startups served as virtual R&D labs for large pharmaceutical companies who invested in them. Drugs developed by these startups that proved successful in clinical trials were subsequently commercialized by the large companies.24 In the fol-lowing decades, to compensate for the declining success of large pharma companies at generating new drug discoveries internally, those large companies entered into an increasing number of research alliances with small biotech companies; the number of such alliances rose from 69 in 1993 to 502 in 2004.25
The pharmaceutical industry is far from unique. In the computing and communi-cations industries, small startups are often acquired by large companies to bring innovative technologies in-house for commercialization.26 Since the mid-1990s, for example, Microsoft Corp. has acquired more than 80 small, U.S.-based companies27
Small U.S. firms are more likely than large ones to do their R&D in the United States, often in technology clusters around universities that provide both talented researchers and knowledge spillovers. In 2008, firms with fewer than 500 employ-ees kept 91 percent of their R&D spending in the United States as opposed to 78 percent for larger companies.28
The high research productivity of small firms, their ability to fill gaps in the U.S. technological infrastructure, and their propensity to conduct their research in the United States are all reasons to consider special treatment for them in government policies to support R&D, including the corporate R&D tax credit.
U.S. business R&D spending in comparative perspective
It is important to see business R&D activity in its global context, because the United States is increasingly competing with other countries to encourage such
17 center for American Progress | the corporate R&d tax credit and U.S. innovation and competitiveness
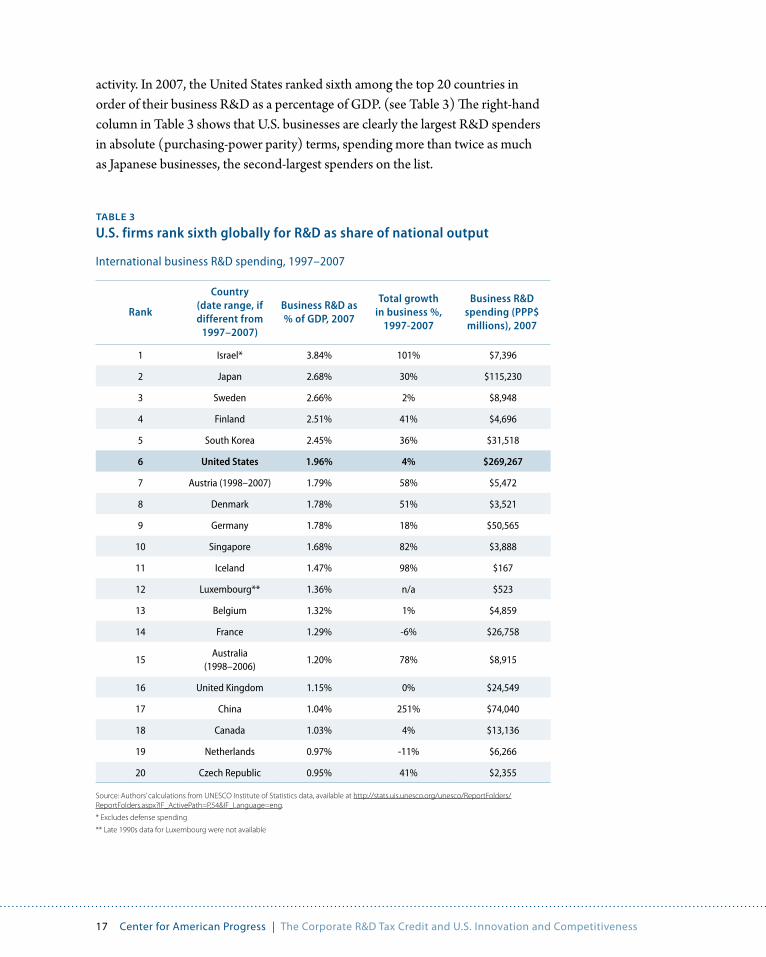
activity. In 2007, the United States ranked sixth among the top 20 countries in order of their business R&D as a percentage of GDP. (see Table 3) The right-hand column in Table 3 shows that U.S. businesses are clearly the largest R&D spenders in absolute (purchasing-power parity) terms, spending more than twice as much as Japanese businesses, the second-largest spenders on the list.
table 3
U.S. firms rank sixth globally for R&D as share of national output
International business R&D spending, 1997–2007
Rank
Country(date range, if different from
1997–2007)
Business R&D as % of GDP, 2007
Total growth in business %,
1997-2007
Business R&D spending (PPP$ millions), 2007
1 Israel* 3.84% 101% $7,396
2 Japan 2.68% 30% $115,230
3 Sweden 2.66% 2% $8,948
4 Finland 2.51% 41% $4,696
5 South Korea 2.45% 36% $31,518
6 United States 1.96% 4% $269,267
7 Austria (1998–2007) 1.79% 58% $5,472
8 Denmark 1.78% 51% $3,521
9 Germany 1.78% 18% $50,565
10 Singapore 1.68% 82% $3,888
11 Iceland 1.47% 98% $167
12 Luxembourg** 1.36% n/a $523
13 Belgium 1.32% 1% $4,859
14 France 1.29% -6% $26,758
15Australia
(1998–2006)1.20% 78% $8,915
16 United Kingdom 1.15% 0% $24,549
17 China 1.04% 251% $74,040
18 Canada 1.03% 4% $13,136
19 Netherlands 0.97% -11% $6,266
20 Czech Republic 0.95% 41% $2,355
Source: Authors’ calculations from UNESCO Institute of Statistics data, available at http://stats.uis.unesco.org/unesco/ReportFolders/ReportFolders.aspx?IF_ActivePath=P,54&IF_Language=eng.
* Excludes defense spending
** Late 1990s data for Luxembourg were not available

18 center for American Progress | the corporate R&d tax credit and U.S. innovation and competitiveness
Table 3 also shows that the share of business R&D investment as a percentage of GDP has changed very little in the United States over the preceding 10 years, while it has been rising rapidly in some emerging and developed countries. The share of business R&D in GDP grew 251 percent in China over the last decade, an increase which is especially notable because China’s GDP also grew by more than 250 percent over the same period (versus about 70 percent for the United States). The huge expansion of business R&D in China was fueled in part by the establish-ment of R&D facilities in China by U.S. and foreign multinational companies, and the share of business R&D in GDP is now about the same in China as it is in some European countries.
So while the United States is still preeminent in business R&D spending, other parts of the world are gradually closing the gap. The differences between countries shown in Table 3 are driven primarily by strong market and institutional forces. But tax incentives, which we discuss for the rest of the report, also play a role.

19 center for American Progress | the corporate R&d tax credit and U.S. innovation and competitiveness
U.S. government support of business R&D investments
The federal government supports business R&D through three main channels: direct funding for business R&D; tax incen-tives; and support of higher education in science and engineer-ing. Education provides the talent necessary for business R&D and is itself a significant determinant of innovation and growth, especially in developed economies that are close to the techno-logical frontier, but this type of government support for R&D is beyond the scope of this report.
Business R&D tax incentives are our focus, but before we turn to that subject in detail, we first provide an overview of federal government funding for business R&D.
Direct funding
According to National Science Foundation data, in 2008 the federal government provided $104 billion to support R&D car-ried out by various types of organizations. Around 40 percent was spent in federal labs, nearly 30 percent went to academia, and another quarter went to business. (see Figure 3)
Although direct government spending for business R&D, at $26 billion, was large relative to the government’s overall R&D budget, it was much smaller than busi-nesses’ own R&D spending of $263 billion. In the past, business received a much larger share of its R&D funding from the government. The level fell steadily from 55 percent in the early 1960s to its current level of about 10 percent by the year 2000. In dollar terms, government funding for business R&D has been fairly static since the mid-1980s (meaning that it has declined in real terms after accounting for inflation), while business R&D spending has grown considerably.
Source: National Science Board, “Science and Engineering Indicators 2010,” Chapter 4.
Figure 3
The disbursement of federal R&D spending
Federal R&D spending by performing sector, 2008
Government40%
Business25%
Academia29%
Other nonprofit 6%

20 center for American Progress | the corporate R&d tax credit and U.S. innovation and competitiveness
The share of federal R&D spending performed by business is dominated by defense and space exploration, areas in which businesses do most of the R&D work for the federal government. The Department of Defense provides the largest share (84 percent in fiscal year 2008) of direct federal funding for industry R&D, with most of that going to the development and testing of combat systems.29
Federal spending on health-related R&D has grown significantly over the past 25 years, reaching 52 percent of nondefense R&D in fiscal 2008. Some of this funding has been allocated directly to businesses, but most of it supports basic and applied research at universities and other nonprofit institutions. Nevertheless, the private sector benefits indirectly. The spillover benefits for the chemical and pharmaceutical industries, in particular, have been dramatic. The U.S. biotechnology industry exists today because of the significant federal fund-ing for basic research in life science disciplines.
The government has special funding programs to support R&D by small firms. Since 1982 the Small Business Innovation Research, or SBIR, program has set aside a percentage (currently 2.5 percent) of budgeted “extramural” (not for use in government-run labs) federal R&D funding for contracts or grants to qualified businesses with fewer than 500 employees. The SBIR program is administered through the 11 major research-funding agencies, among them the Departments of Agriculture, Defense, and Energy, and the National Institutes of Health. These departments and agencies solicit proposals based on their goals and criteria from eligible small firms. According to the terms of the SBIR pro-gram, funds are to be used to support high-risk, early-stage research that is likely to have difficulty finding private investors.
Like the corporate R&D tax credit, the SBIR program is not permanent, requiring periodic reauthorization and funding by Congress. The program, created in 1982, was first renewed in 1992, and again in 2000 and 2008. After a series of short-term extensions, Congress renewed the SBIR in December 2011 through September 2017 and increased the set-aside to 3.2 percent as an amendment to the National Defense Authorization Act.
The share of
business R&D
funded by the
government fell
steadily from
55 percent in
the early 1960s
to 10 percent in
the year 2000 .

21 center for American Progress | the corporate R&d tax credit and U.S. innovation and competitiveness
A related program—the Small Business Technology Transfer, or STTR, pro-gram—sets aside a small percentage (0.3 percent, increased to 0.45 percent as part of the December 2011 SBIR extension) of the extramural research budgets at five agencies to support partnerships between small businesses and nonprofit U.S. research institutions, such as universities. Together, the SBIR and STTR programs provided more than $2 billion of R&D funding for small businesses in 2008. According to a 2008 study from the National Research Council, these programs may provide as much as 20 percent of the financing for early-stage research by small startups.30 According to National Science Foundation data, the share of the U.S. government’s business R&D funding devoted to firms with fewer than 500 employees in 2007 was 18.3 percent, only slightly below the 18.7 percent share of those firms in business R&D. In other words, direct federal sup-port for R&D spending by small firms is roughly proportional to their share in the nation’s research activity.31
There is always the possibility that direct government funding for private R&D may take the place of private funding instead of increasing the overall level of R&D spending. A review in 2000 of more than 30 statistical studies on this crowd-ing out hypothesis yielded a mixed verdict.32 No evidence has emerged since then to settle the issue. As we will show below, however, the evidence on the corporate R&D tax credit is more clearly in favor of a positive net impact—that is, the credit results in more R&D spending by business than would otherwise occur.
Tax incentives
The federal government uses the tax system to encourage business investment in R&D. While the direct government R&D funding discussed in the previous sections of this report goes toward government-approved projects at private firms, tax incentives generally do not discriminate among specific projects, investments, firms, or sectors. These incentives are broadly available to businesses for any R&D activity that qualifies for preferential tax treatment, and this allows businesses to choose their own projects based on commercial considerations.
The U.S. government encourages business R&D spending through two corporate tax expenditures. One is an annual deduction for R&D spending. The other, the corporate R&D tax credit, is a nonrefundable tax credit to encourage incremental R&D spending. Before turning to the credit, which is the focus of this report, we provide a brief summary of the R&D tax deduction.

22 center for American Progress | the corporate R&d tax credit and U.S. innovation and competitiveness
Tax expenditures for the expensing of R&D
Under federal tax law, expenditures on research and development have been fully deductible for income tax purposes since 1954. Immediate expensing of R&D is attractive because a firm’s stock of R&D is like a capital good in that it gener-ates revenues over a number of years. In contrast, the tax code does not allow the immediate expensing of most investments in physical capital; such investments must be amortized and deducted over the useful life of the investment.
Deducting R&D investments as they are incurred lowers their cost to the firm rela-tive to an amortization system. The reduction in cost makes R&D a more attractive investment compared to investments in physical capital or other opportunities that do not receive the same favorable tax treatment.
The tax deduction for R&D applies primarily to that part of a U.S. firm’s R&D spending that is related to production for the U.S. market. For multinationals, some share of their domestic R&D spending may be apportioned to foreign-source income following complex rules that have changed multiple times, and that can eliminate or defer part of the deduction.33
Eligible research expenses for the deduction are described in the Code of Federal Regulations, Title 26, Sec. 1.174-2, from which the following information is para-phrased. The deduction applies only to noncapital expenses, because factories and equipment have their own (slower) tax treatment. According to the code, deducted R&D expenses must have been used for the discovery of information intended to eliminate uncertainty concerning the development or improvement of a product.
Under the program, eligible expenses include: •All costs required for the development or improvement of a product•The costs of any pilot model, process, formula, invention, technique, patent, or
similar property•The cost of products to be used by the taxpayer in its trade or business as well as
products to be held for sale, lease, or license•The costs of obtaining a patent

23 center for American Progress | the corporate R&d tax credit and U.S. innovation and competitiveness
Nondeductible costs include:•Ordinary testing or inspection of materials or products for quality control•Efficiency surveys•Management studies•Consumer surveys•Advertising or promotions •The acquisition of another’s patent, model, production, or process•Research in connection with literary, historical, or similar projects•Expenditures paid or incurred for the purpose of ascertaining the existence,
location, extent, or quality of any deposit of ore, oil, gas, or other mineral.
Deductibility is available not only for costs incurred by the business itself but also for payments covering R&D contracted to another organization such as a research institute, foundation, engineering company, or similar contractor.
Table 4 shows the amount of the corporate tax expenditure for the R&D deduc-tion and the total amount of industry R&D spending from 1997 to 2008.
table 4
The cost of accelerated R&D deduction according to the Office of Management and Budget
Tax expenditures for the immediate expensing of corporate R&D spending, 1997–2008 ($ millions)
YearTax expenditures for R&D
expense deductions (present value by fiscal year)34
Business R&D spending (calendar years)
1997 1,655 133,611
1998 1,650 145,016
1999 2,570 161,594
2000 1,650 182,844
2001 1,700 185,118
2002 1,800 177,467
2003 2,000 182,926
2004 2,220 188,035
2005 2,390 204,250
2006 2,690 223,365
2007 2,620 242,682
2008 2,750 263,310
Source: Expense deduction data from Office of Management and Budget, “Analytic Perspectives,” various years; R&D spending data from National Science Board, “Science and Engineering Indicators 2010,” Appendix table 4-7.
24 center for American Progress | the corporate R&d tax credit and U.S. innovation and competitiveness
The tax expenditure for the deduction of R&D expenses is the difference between the actual amount of the deduction and the estimated “baseline” deduction that would be allowed under a five-year amortization system. As sug-gested by a comparison of the two columns in the table, this difference amounts to a tiny share (between 0.9 percent and 1.6 percent) of the full amount of corporate R&D expenses reported in the right-hand column. These numbers indicate that the incentive provided by the R&D tax deduction is small relative to the size of business R&D spending.
To our knowledge, there are no empirical studies of the effectiveness of the R&D tax deduction as an incentive to increase business R&D investment. Although the R&D deduction is not the focus of this report, we note that it would be worthwhile to conduct an economic assessment of its effectiveness as part of the process of reforming the corporate tax system.

25 center for American Progress | the corporate R&d tax credit and U.S. innovation and competitiveness
The corporate R&D tax credit
The first iteration of this credit, the Research & Experimentation Tax Credit, was introduced in the 1981 Economic Recovery Act, which contained several tempo-rary measures to boost private demand during an economic slowdown. The credit was created with an expiration date of December 1985.
Since then, the credit has been restructured several times and renewed 13 times. With a single 12-month exception in 1995–1996 (during which the credit ceased to be in effect), each extension has continued from the previous date of expiration. The credit was most recently renewed in December 2010 effective for two years (retroactively) from January 2010. (see Table 5) The tax credit is now called the corporate research credit by the IRS, though the official name for the credit on IRS Form 6765 is the Credit for Increasing Research Activities. As of January 1, 2012, it has once again expired.
Calculating the corporate R&D tax credit
The corporate R&D tax credit boasts several distinctive elements, each of which we will discuss in turn. The general idea for the credit is that certain kinds of R&D spending, exceeding some base amount, qualify for partial reimbursement against taxes owed. While this concept is straightforward, its implementation has turned out to be exceedingly complex. The details of the credit are laid out in the Code of Federal Regulations, Title 26, Section 1.41.

26 center for American Progress | the corporate R&d tax credit and U.S. innovation and competitiveness
table 5
The legislative history of the corporate R&D tax credit
The tax credit has been amended or extended 15 times over the past 30 years
Date of enactment
Effective date Duration Remarks
Aug. 13, 1981 July 1, 1981 4 1/2 years
Initial credit based on previous three years of spending at a 25 percent rate. R&D definition limited to the United States, the hard sciences, and internal funding.
Oct. 22, 1986 Jan. 1, 1986 3 years
R&D definition limited to narrower technological definition. Credit rate reduced to 20 percent. Basic Research Credit added for collaboration between firms and universities.
Nov. 10, 1988 Jan. 1, 1989 1 year
Half of the R&E Tax Credit to be subtracted from the R&D expense deduction. The total amount of the credit is limited by setting a minimum base amount of 50 percent of current-year qualified research expense.
Dec. 19, 1989 Jan. 1, 1990 1 year
100 percent of the credit to be subtracted from the R&D expense deduction. Base period changed to include average R&D-to-sales ratio for 1984–1988; special arrangement for firms with no R&D history during the base period.
Nov. 5, 1990 Jan. 1, 1991 1 year Extension only
Dec. 11, 1991 Jan. 1, 1992 6 months Extension only
Aug. 10, 1993 July 1, 1992 3 years Extension only
Credit lapsed July 1, 1995 1 year Extension only
Aug. 20, 1996 July 1, 1996 11 monthsAlternative Incremental Research Credit introduced, based on four previous tax years, but less generous than the regular credit.
Aug. 5, 1997 June 1, 1997 13 months Extension only
Oct. 21, 1998 July 1, 1998 1 year Extension only
Dec. 17, 1999 July 1, 1999 5 years Extension only
Oct. 4, 2004 July 1, 2004 18 months Energy Research Credit added in 2005.
Dec. 20, 2006 Jan. 1, 2006 2 years
Alternative Simplified Credit introduced, which allows for 12 percent of Qualified Research Expenses beyond half the average of these expenses in the previous three years.
Oct. 3, 2008 Jan. 1, 2008 2 yearsAlternative Simplified Credit rate increased to 14 percent in 2009; Alternative Incremental Research Credit allowed to expire at end of 2008.
Dec. 17 2010 Jan. 1, 2010 2 years Extension only
Source: Authors’ compilation from various sources.

27 center for American Progress | the corporate R&d tax credit and U.S. innovation and competitiveness
The base amount
The corporate R&D tax credit was designed to be an incentive for incremental R&D spending—it was not meant to subsidize R&D spending that would have occurred anyway. In practice, however, it is impossible to know what the spending level would have been without the tax credit—and this problem has bedeviled the design of the credit from its inception.
Initially the base level, above which any qualified R&D spending would be deemed incremental, was calculated as a moving average of a company’s R&D spending during the previous three years. This calculation method was an attempt to approximate what a company could be expected to spend in the absence of the credit, and the three-year average approach smoothed out any anomalies that might have created perverse outcomes if a single year was used for the base.
This approach, however, is somewhat counterproductive because one year’s increase in R&D raises the base for each of the following three years, making it harder for the company to earn the credit in the future. This forward-looking effect undermines the incentive effect of the credit, and this may account for the credit’s poor results in early studies, discussed below, before the base-period calculation was changed.
To correct for this problem, a 1990 revision of the credit froze the base period used to calculate the credit at 1984 to 1988, at least for companies incorporated prior to January 1, 1984, and with research activity in at least three of the base-period years. For such companies a base percentage is calculated as the sum of qualified expenses from 1984 to 1988 divided by the sum of gross receipts for the same period. The base percentage is capped at 16 percent, which was intended to avoid penalizing firms that had very high ratios of R&D to sales in the base period.
For companies established since 1983, the base-percentage calculation is more com-plex, starting at an arbitrary base percentage of 3 percent that is allowed to change gradually. The base period for such companies is eventually frozen at the 5th through 10th years during which they had qualified R&D expenses eligible for the tax credit.
To calculate the base amount of R&D spending for companies using this method, the base percentage is multiplied by the average sales for the four tax years imme-diately preceding the current one. If this amount is less than 50 percent of the research expenses that qualify for the tax credit in the current year, then the base amount is raised to this 50 percent minimum level.
It is impossible
to know what
R&D spending
would have been
without the R&D
tax credit—and
this problem has
bedeviled the
design from its
inception.
28 center for American Progress | the corporate R&d tax credit and U.S. innovation and competitiveness
This approach is intended to avoid over-rewarding firms that had very low ratios of R&D to sales in the base period. According to IRS data, this approach was used by about 50 percent of the corporate tax returns that claimed the credit in 2008, with the other 50 percent using the 1984–1988 base period. Both approaches involve complex calculations to come up with arbitrary estimates of the incremental amount of R&D spending by companies compared to an arbitrary base period.
Qualified research expenditures
The corporate R&D tax credit restricts the research expenses eligible for the credit to a category called “qualified research expenditures.” This category excludes stan-dard product-development activities, which are still eligible for the research expense deduction. A percentage of the increment in qualified research expenditures above the base amount is eligible for the credit. Under the current version of the credit, this percentage is set at 20 percent.
In other words, 20 percent of the increment in qualified research expenditures above an arbitrarily calculated base amount of such expenditures is currently eligible for the credit. Not surprisingly the definition and measurement of research expenses that qualify for the credit have been major areas of contention between businesses and the IRS, with the resulting uncertainties both reducing the effective-ness of the credit and increasing the costs of administering it.35
There are four criteria that a research activity must meet in order to qualify for the credit:
•The activity has to qualify as a deductible research expense, as detailed above.
•The research has to be undertaken for the purpose of discovering information that is “technological in nature” (relies on new or existing principles of the physical or biological sciences, engineering, or computer science).
•The objective of discovering the information is its use in the development of a new or improved “business component” (any product, process, computer soft-ware, technique, formula, or invention) of the company using the credit.
• Substantially all of the research activities have to constitute elements of a process of experimentation (the theoretical and physical evaluation of design alternatives for a business component).

29 center for American Progress | the corporate R&d tax credit and U.S. innovation and competitiveness
These criteria generate the greatest difficulty for the administration of the credit. For firms, they require analyzing and tracking expenses in a way that differs sig-nificantly from their conventional accounting methods. For the IRS, they require delving deeply into issues of technology, such as what is already known and hence not sufficiently risky to be a qualified research expenditure.
The Internal Revenue Code also specifies that only the following types of expenses for in-house research or contract research are qualified:
•Wages paid or incurred to employees for qualified services•Amounts paid or incurred for supplies used in the conduct of qualified research•Amounts paid or incurred to another person for the right to use•Computers in the conduct of qualified research• In the case of contract research, 65 percent of amounts paid or incurred by the
taxpayer to any person, other than an employee, for qualified research
Spending for overhead does not qualify. In addition, the Internal Revenue Code identifies certain types of activities for which the credit cannot be claimed, includ-ing research that is:
•Conducted outside of the United States, Puerto Rico, or any other U.S. possession
•Conducted after the beginning of commercial production of a business component
•Related to the adaptation of an existing business component to a particular customer’s requirements
•Related to the duplication of an existing business component•Related to certain efficiency surveys, management functions, or market research • In the social sciences, arts, or humanities•Funded by another entity
Taxability of the tax credit
The 1988 tax act reduced the subsidy value of the corporate R&D tax credit by requiring firms to deduct half the amount of the credit from their tax deduc-tion for R&D expenses. In 1989, 100 percent of the credit became taxable in this fashion. For instance, if a firm had deductible R&D expenses of $400,000 and qualified for a research tax credit equaling $5,000 (20 percent of qualified
The definition and
measurement of
research expenses
that qualify for
the credit have
been major areas
of contention
between business
and the IRS.

30 center for American Progress | the corporate R&d tax credit and U.S. innovation and competitiveness
research expenditures of $25,000), the new rule lowered the deductible R&D expenses to $395,000.
This was a major change. If the company in our example paid the top marginal corporate income tax rate of 35 percent, this change reduced the net value of its R&D tax credit by 35 percent from $5,000 to $3,250. The net credit of $3,250 is no longer 20 percent of $25,000 in qualified expenditures but only 13 percent—a significant reduction.
For many firms, the effective rate of the research credit is even lower because of the Alternative Minimum Tax, or AMT. The AMT is a flat tax (currently set at 20 percent for corporations) to be applied to corporate income minus various tax credits, including the corporate R&D tax credit. The corporation pays the greater of the AMT or the tax it owes based on its income and the tax credits it claims. The AMT is designed to ensure that a firm is not using an excessive number of tax-preference items.
If a firm has a net loss and owes no tax, the R&D tax credit for which it is eligible can be carried forward for up to 20 years (and/or applied retroactively for one year). This can be particularly important for startup companies, most of which have yet to generate a significant revenue stream. Deferred tax credits are a posi-tive asset in the eyes of lenders and investors.
Other versions of the corporate R&D tax credit
The alternative simplified credit
In 2006 Congress enacted a variant called the “alternative simplified credit” to simplify the calculation of the base level of R&D. The alternative simplified credit revives a feature of the original formula for the credit, using a moving base period of the previous three years. This of course has the same drawback as the original for-mula because spending in one year raises the base amount for the next three years.
Expenses are still limited to qualified research expenditures. But instead of calculating a base percentage and comparing it to the ratio of qualified research expenditures in the current tax year, the alternative simplified credit is equal to 14 percent of the amount by which the current year qualified research expenditures

31 center for American Progress | the corporate R&d tax credit and U.S. innovation and competitiveness
are greater than 50 percent of the average qualified research expenditures over the three previous years.
Startup firms with profits but no qualified research expenditures in the previous three years can receive a credit amounting to 6 percent of their current-year quali-fied research expenditures.
A decision by a firm to switch from the regular calculation method to the alterna-tive simplified credit calculation is considered permanent unless the firm gains the consent of the IRS at some future date to go back. The simplified credit was cre-ated to make the corporate R&D tax credit accessible to a wider number of firms, and it immediately proved to be a popular option. In 2008 the amount of credit claimed under the alternative simplified credit, $3.9 billion, was not far behind the claims under the regular credit ($4.3 billion).36
It appears that the introduction of the alternative simplified credit increased the number of firms applying for the research tax credit. According to IRS data, the number of claimants for some form of the credit increased by about 13 percent, from 11,290 in 2005 to 12,736 in 2008. And the increase in the tax expenditure on the credit in 2007 and 2008 suggests that the alternative simplified credit may have increased the size of the credit received for the firms that select it. (see Table 6)
Targeted credits
In addition to the regular research credit and the alternative simplified credit, there are two other credits that can be claimed by firms for certain kinds of R&D activity linked to a university or to scientific nonprofit organizations. Qualified research expenditures claimed for one of these targeted credits cannot also be claimed under the general corporate R&D tax credit.
The oldest of these targeted versions of the credit, the basic research credit, was created in 1986 to foster collaboration between firms and universities. The basic research credit, like the regular credit, is 20 percent of qualified research expendi-tures above a base amount calculated according to a complicated formula detailed in Section 41(e) of the Internal Revenue Code. But the definition of qualified research expenditures for the basic credit is limited to research without any spe-cific commercial goal.
There are two other
credits for certain
kinds of R&D linked
to a university or
scientific nonprofit.

32 center for American Progress | the corporate R&d tax credit and U.S. innovation and competitiveness
The other targeted research credit, the energy research credit, was created in 2005 to promote energy-related research. The energy research credit, unlike the other versions of the corporate tax credit, is a flat credit of 20 percent on the total amount of qualified research expenditures, not just the increment in qualified research expenditures above a base amount.
To qualify for the energy research credit, the research must have been contracted to a nonprofit organization “organized and operated primarily to conduct energy research in the public interest.” One of the goals of the energy credit is to stimulate collaboration in energy research consortia. To that end, at least five discrete enti-ties must have contributed funds for energy research to the organization during the year, and none of these entities may account for more than half of total pay-ments to the organization for such research.
The energy research credit also applies to the full amount (100 percent) of payments to colleges, universities, and federal laboratories for energy research performed under contract. Payments to small firms (500 or fewer employees) performing the research can also qualify, provided the claimant does not own 50 percent or more of the stock of the small firm (if the firm is a corporation), or 50 percent or more of the small firm’s capital and profits (if the firm is another entity such as a limited partnership).
The claims and tax expenditures for the basic research and energy research credits are usually reported together with those for the general corporate R&D tax credit. Based on our estimates from IRS data, the targeted tax credits are very small compared to the general credit, accounting for less than 1 percent of total credits claimed. In 2007, for example, the energy credit accounted for about $20 million of the $8.26 billion research credits claimed, and the basic research credit accounted for a similarly small amount.
The Obama administration’s current proposal
In its budget proposal for the fiscal year beginning in October 2011, the Obama administration proposed several changes to the corporate R&D tax credit. These include making the credit permanent, which would give businesses certainty about the future availability of the credit when planning their research budgets. The administration also proposes to rely primarily on the alternative simplified credit approach because of its simplicity compared with the older methods of cal-

33 center for American Progress | the corporate R&d tax credit and U.S. innovation and competitiveness
culating the credit. Finally, the proposal suggests increasing the rate of the alterna-tive simplified credit by 20 percent, from the current 14 percent to 17 percent.
Although the administration’s proposal contains several attractive elements, espe-cially from the standpoint of business, it would make permanent the disincentive effect that results from using the three previous years to calculate the base amount of R&D spending. We will address this point in our recommendations.
The corporate R&D tax credit by the numbers
Table 6 shows two measures of the tax credit from 1997 to 2008, the most recent year for which data are available. The two measures are the “tax expenditure” (the impact of the credit on the federal budget as reported by the Office of Management and Budget, or OMB) and the total credit claims as reported by the IRS. The table also compares the size of the credits claimed (which is larger than the credits eventually allowed to the claimants) with direct federal funding for business R&D.
table 6
The cost of the corporate R&D tax credit to taxpayers
Two measures of the tax credit and a comparison with direct federal funding for business R&D, 1997-2008 ($ millions)
YearTax expenditure for the
corporate R&D tax credit (OMB; fiscal years)
Corporate R&D tax credit claims (IRS)
Federal funding for business R&D
Credit claims as % of federal funding
1997 860 4,398 21,798 20.2%
1998 2,095 5,208 22,086 23.6%
1999 1,675 5,281 20,496 25.8%
2000 1,620 7,079 17,117 41.4%
2001 5,310 6,356 16,899 37.6%
2002 6,810 5,656 16,401 34.5%
2003 4,910 5,488 17,798 30.8%
2004 4,630 5,554 20,266 27.4%
2005 5,110 6,363 21,909 29.0%
2006 2,120 7,311 24,304 30.1%
2007 10,260 8,260 26,585 31.1%
2008 7,080 8,303 25,795 32.2%
Source: Tax credit data from Office of Management and Budget, “Analytical Perspectives,” various years; “Internal Revenue Service Statistics of Income,” available at http://www.irs.gov/taxstats/article/0,,id=164402,00.html; R&D data from National Science Board, “Science and Engineering Indicators 2010,” Appendix table 4-7.

34 center for American Progress | the corporate R&d tax credit and U.S. innovation and competitiveness
Table 6 reveals significant differences in the OMB and IRS measures of the tax credit. There are no official reconciliations of the two data sets, but there are several likely reasons for the differences between them. First, not all credits claimed are allowed by the IRS, and disallowed credits do not become a tax expenditure. In 1997, for example, about 10 percent of the $4.4 billion that was claimed was eventually disallowed.37
Second, not all credits allowed by the IRS can be used in a given tax year. The credit is nonrefundable if the claimant has insufficient tax liability in a given tax year, in which case the credit can be carried forward for up to 20 years. Third, various tax limitations, such as the corporate AMT, can also reduce the total credit that can be used in the year it is claimed.
For comparison purposes Table 6 also contains data on direct federal funding for business R&D. Between 1997 and 2008, the corporate R&D tax credit grew faster than direct federal funding for business R&D, amounting to a ratio of 32 percent using the IRS measure and 27 percent using the OMB measure by 2008. The ratio of tax incentives to total federal funding for business R&D would be even larger if the values for the R&D expense deduction from Table 4 were added to the tax credit. The data show that during this period tax incentives became a much more important source of federal support for business R&D, primarily because business R&D grew much faster than direct federal funding for R&D.
Table 7 shows the data on business R&D spending and how it compares to the amount of research credits claimed in each year. The data show that between 1997 and 2008 the corporate R&D tax credit remained small compared to business R&D spending, amounting fairly consistently to just more than 3 percent using the IRS measure of the claimed credits, and closer to 2 percent using the more variable OMB tax expenditure measure.
Looking at a finer level of detail within a single year allows us to see differences across industries in the use of the corporate R&D tax credit. Table 8 shows the
table 7
Claims for the corporate R&D tax credit grew at about the same rate as overall business R&D spending
Claims filed for the tax credit as a percentage of business R&D spending, 1997–2008 ($ millions)
YearBusiness self-funding
for R&D ($ millions)Corporate R&D tax credit claims as %
1997 133,611 3.3%
1998 145,016 3.6%
1999 161,594 3.3%
2000 182,844 3.9%
2001 185,118 3.4%
2002 177,467 3.2%
2003 182,926 3.0%
2004 188,035 3.0%
2005 204,250 3.1%
2006 223,365 3.3%
2007 242,682 3.4%
2008 263,309 3.2%
Source: R&D data from National Science Board, “Science and Engineering Indicators 2010,” Appendix table 4-7; percentage column is authors’ calculations from the data in Table 6.

35 center for American Progress | the corporate R&d tax credit and U.S. innovation and competitiveness
research tax credits claimed in 2005 (the latest year for which this level of detail is available) by the six industry groups that dominate business R&D spending. These industries accounted for 70 percent of the total credits claimed, which is roughly in proportion with their 76 percent share of business-funded R&D.
It is less certain that this proportionality carries down to the firm level. Although more than 10,000 companies claim some R&D credit each year, a few hundred large companies dominate. In 2005 549 companies, each with sales above $1 billion, claimed two-thirds of the credit. Because the companies cannot legally be identified by the IRS for reasons of confidentiality, it is impossible to determine whether the credit claimed by individual companies was in line with their R&D expenses.
Table 8 also shows that the credits claimed by these industry groups vary as a per-centage of their self-funded R&D spending, from a low of 1.19 percent in aerospace to 4 percent in the automotive industry. In theory, the differences are the result of different levels of qualified research expenditures across industries, but it is not obvi-ous at first glance why car companies would be doing more exploratory R&D than aerospace companies. Although data is available at a finer level of detail for some of
table 8
Assessments of the effectiveness of the corporate R&D tax credit
Corporate R&D tax credits and R&D spending by industry group, 2005 ($ millions)
NAICS codesCorporate R&D
tax credit claims% of total
Total R&D expense
Credit as % of R&D spending
Computer and electronic products
334 1,648 25.9% $ 42,463 3.88%
Chemicals 325 1,147 18.0% $ 42,826 2.68%
Software and computer-related services
5112, 5415 444 7.0% $ 29,939 1.48%
Automotive manufacturing
336, except 3364 696 10.9% $ 17,393 4.00%
Engineering and scientific services
5413, 5417 421 6.6% $ 11,921 3.53%
Aerospace and defense manufacturing
3364 130 2.0% $ 10,928 1.19%
Others 1,878 29.5% $ 48,780 3.85%
All industries total 6,364 100.0% $ 204,250 3.12%
Source: National Science Board, “Science and Engineering Indicators 2010,” Appendix tables 4-25 and 4-12 and authors’ calculations.

36 center for American Progress | the corporate R&d tax credit and U.S. innovation and competitiveness
these groups, it isn’t fine-grained enough to permit us to under-stand what might be driving these differences.
In short, there is much we don’t know about the corporate R&D tax credit because the data are not available. Firm-level case studies might be one way to get beyond the confidential-ity limits of the Internal Revenue Service and learn how differ-ent firms and industries use the credit.
The size of the corporate R&D tax credit compared to other major tax expenditures
The corporate R&D tax credit is one of dozens of corporate tax expenditures calculated by the Office of Management and Budget. Tax expenditures record the amounts by which the individual and corporate income tax received by the Treasury Department has been reduced because of tax breaks for specific purposes. Table 9 shows the 10 largest corporate tax expendi-tures in 2008. The corporate R&D tax credit ranks fourth, and corporate expensing of R&D ranks sixth. Both are consider-ably smaller than the top two corporate tax expenditures—the accelerated depreciation of capital equipment, and the deferral of income from overseas subsidiaries.
Total tax expenditures to support business R&D through both the tax credit and the research deduction amounted to $20 billion in 2008. This was about 16 percent of total corpo-rate tax expenditures, and about 2.2 percent of total tax expenditures for corpora-tions and individuals in that year. In terms of total corporate tax expenditures, the R&E tax credit is significant, but it is small compared to total tax expenditures, most of which are bestowed on individuals rather than businesses.
Global tax competition for R&D
The United States was the first country in the world to introduce a tax credit to support business R&D. But as more countries recognized the importance of research and innovation for economic growth, they added tax incentives for R&D
table 9
Top 10 corporate tax expenditures, FY 2008
The corporate R&D tax credit ranks fourth, and corporate expensing of R&D ranks sixth
Amount ($ billions)
Description
$39.1Accelerated depreciation of machinery and equipment
$31.6Deferral of income from controlled foreign corporations
$ 8.6Deduction for U.S. production activities
$ 7.1 Corporate R&D tax credit
$ 5.6Deferred taxes for financial firms on overseas income
$ 4.9 Expensing of R&D
$ 4.2Exclusion of interest on public purpose bonds
$ 3.0Credit for low-income housing investments
$ 2.7Exclusion of interest on life insurance savings
$ 2.5Graduated corporation income tax rate
$125 Total tax expenditures for corporations
$878Total tax expenditures for corporation and individuals
Source: Authors’ calculations from Office of Management and Budget, “Analytical Perspectives, Fiscal Year 2010,” Table 19-2.
37 center for American Progress | the corporate R&d tax credit and U.S. innovation and competitiveness
and increased their support for R&D in other ways. As of 2008, 21 industrial-ized nations that are members of the Organisation for Economic Co-operation and Development, or OECD, including the United States, offered tax credits for business R&D. The only country that uses a purely incremental system like ours is Ireland. Other countries offer credits that combine incentives for both total and incremental R&D. In addition to R&D tax credits, all of the countries in the table allow the full deduction of R&D expenses in the year incurred.
According to a recent study by the Information Technology and Innovation Foundation, the United States has gradually been surpassed by other countries in terms of the generosity of its tax incentives for industry R&D.38 An OECD study that uses a single summary measure of the net R&D tax subsidy in 38 OECD and industrializing countries found that the United States ranked 24th in terms of the generosity of this subsidy in 2008.39 (see Table 10)
There is no evidence, however, that a high net-tax subsidy translates into a high level of business R&D spending. There is, in fact, no correlation between the ranking of countries by the generosity of their R&D tax incentives in Table 10 and the ranking of countries by the share of industry R&D in GDP in Table 3. Some of the countries with the most generous R&D subsidies, such as Spain and Mexico, may have intro-duced these incentives because they are trying to stimulate growth in their weak corporate-technology base.
Yet it is worth noting that the research subsidy in the United States is only about half of that available in such technology strongholds as Japan and Denmark, and about half of that available in countries such as Canada and the Czech Republic that are competing with the United States for the R&D activity of U.S. multinational companies.
The growing generosity of tax incentives for R&D around the world reflects the intense competition among countries for R&D investment and technology-intensive industries for economic growth. China and several other emerging economies in Asia have been particularly aggressive in offering a wide array of incentives—includ-ing expense deductions, tax credits, tax holidays, and special economic zones—to attract R&D investment from companies headquartered in the United States, Europe, and Japan, which together account for about 94 percent of global R&D.
These special tax incentives are in addition to other incentives to encourage inward-bound R&D investment, including preferential access to low-cost capital and land.

38 center for American Progress | the corporate R&d tax credit and U.S. innovation and competitiveness
In addition, many countries require U.S. multinational companies to establish some kind of R&D facility to gain local approval for foreign direct investment.
The evidence on the location effect of research tax incentives is limited and inconclusive. Surveys generally don’t rank tax incentives among the most important determinants of location choice.40 Survey results indicate that the most important factors affecting business decisions about where to locate R&D are the availability and cost of R&D personnel and the growth of markets. And these factors swamp the effects of tax incentives.
This is an important policy lesson to bear in mind. Tax incentives are just one aspect—and not the most important—of a nation’s total attractiveness as a location for R&D by both domestic and foreign companies. Tax incentives are designed to affect decisions at the margin. Rather than determining the location of entire R&D sites, tax incentives are more likely to influence which places among a company’s existing R&D sites will expand or where specific research projects will be located.
Econometric studies of R&D location decisions by business are rare, hard to compare, and, so far, inconclusive. One study found that the affiliates of U.S. mul-tinational corporations increased their R&D investments roughly four times more in countries offering R&D tax incentives than in countries that did not offer such incentives.41 A different study, however, found a significant effect of the “foreign user cost” of R&D—a cost that incorporates tax incentive effects on the location of R&D—for firms from a number of developed countries, but not for firms from the United States.42 A more recent study also found that tax policies have no effect on the amount of R&D undertaken by U.S. multinationals in different countries.43
A problem with all the existing statistical studies is that they use aggregate rather than firm-level data on the amount of R&D performed abroad by U.S. multina-tionals. Aggregate data might fail to spot a trend if, for example, only certain types of firms are responsive to foreign R&D tax incentives. More detailed studies are needed to clarify the role of such incentives in business decisions about the loca-tion of their R&D activities.
One intriguing empirical result was found using firm-level patent data. University of Michigan Professor James Hines and Brandeis University Professor Adam Jaffe looked at patenting behavior before and after a 1986 change in the taxes affecting the after-tax cost of R&D performed in the United States for use abroad, such as at an offshore manufacturing affiliate of the investing firm.44 The firms most affected by
The growing
generosity of R&D
tax incentives
around the world
reflects the intense
competition
among countries
for R&D investment.

39 center for American Progress | the corporate R&d tax credit and U.S. innovation and competitiveness
the increase in this cost subsequently registered fewer patents overseas. Hines and Jaffe conclude that their findings imply that domestic R&D and offshore R&D per-formed by U.S. multinational companies are complements rather than substitutes.
In other words, more R&D in the United States means more R&D activity in foreign locations. If that’s correct, then a more generous tax incentive for R&D in either the United States or in a foreign location could increases a company’s R&D spending in both locations, with no change in the distribution of that spending between them. Hence, even firm-level statistical studies may fail to detect loca-tional effects if a U.S. (or foreign) research tax credit increases the R&D activity of a U.S. multinational company both at home and offshore.
There is one obvious reason why U.S. companies might be less responsive than foreign companies to R&D tax incentives offered by other countries. The United States is one of the few major countries that taxes the offshore earnings of its com-panies, and, when those earnings are brought home, the taxes due in the United States are reduced by the amount of taxes paid abroad to foreign governments.
Therefore, in cases where the U.S. corporate tax rate is larger than the foreign cor-porate tax rate, the returns to a U.S. multinational company from taking advantage of a foreign research tax credit are offset by the higher corporate tax rate that must be paid if these returns are repatriated to the United States. Although there are many real-world complications in how these rules are applied (such as the ability of U.S. multinationals to defer repatriating foreign profits for an indefinite period), they raise the possibility that the U.S. tax code might reduce the lure of research tax credits offered to U.S. firms by other countries.

40 center for American Progress | the corporate R&d tax credit and U.S. innovation and competitiveness
table 10
The U.S. ranks 24th in terms of generosity of subsidies for business R&D
Industrialized and select industrializing countries ranked by their net R&D subsidy, 2008
Rank CountryR&D tax subsidy (for large firms)
Rank CountryR&D tax subsidy (for large firms)
1 France 42.5% 20 Singapore 9.4%
2 Spain 34.9% 21 Belgium 8.9%
3 Portugal 28.1% 22 Austria 8.8%
4 Czech Republic 27.1% 23 Netherlands 7.1%
5 India 26.9% 24 United States 6.6%
6 Brazil 25.4% 25 Greece 1.0%
7 Turkey 21.9% 26 Poland 1.0%
8 Norway 20.6% 27 Chile -0.6%
9 Canada 18.0% 28 Finland -0.8%
10 Korea 18.0% 29 Slovak Republic -0.8%
11 South Africa 16.3% 30 Switzerland -0.8%
12 Hungary 16.2% 31 Iceland -0.9%
13 China 13.8% 32 Israel -1.1%
14 Denmark 13.8% 33 Mexico -1.2%
15 Italy 11.7% 34 Russia -1.2%
16 Australia 11.7% 35 Luxembourg -1.4%
17 Japan 11.6% 36 Sweden -1.5%
18 Ireland 10.9% 37 Germany -2.0%
19 United Kingdom 10.5% 38 New Zealand -2.0%
Source: “OECD Science, Technology and Industry Scoreboard 2009,” Section 2.14, available online at http://www.oecd-ilibrary.org/science-and-technology/oecd-science-technology-and-industry-scoreboard-2009/tax-treatment-of-r-d_sti_scoreboard-2009-31-en.

41 center for American Progress | the corporate R&d tax credit and U.S. innovation and competitiveness
Assessing the effectiveness of the corporate R&D tax credit
We have detailed how the U.S. government currently provides support for basic, applied, and development research through a variety of channels with varying degrees of targeting. The corporate R&D tax credit is just one of these channels and it should be assessed on the basis of whether it achieves its goal of increasing business R&D spending efficiently.45
In this section of the report, we will examine economic studies of the effective-ness of the credit and evaluate critiques of this evidence. Although the debate will probably never be settled to the satisfaction of all parties, we believe that the weight of the evidence supports the conclusion that the tax credit is an effective means of stimulating business R&D spending.
Since this spending accounts for a large and rising share of total R&D spending in the United States, and since R&D spending is an important determinant of tech-nological innovation, which in turn is an important determinant of growth in living standards, we believe this tax credit should be retained, strengthened, and made permanent, even in the context of an overall reform of the corporate tax code. We provide the evidence to support our position in the remainder of the report.
Economic studies of the effectiveness of the corporate research tax credit
The U.S. corporate R&D tax credit is one of the most carefully studied tax incen-tives in terms of effectiveness. Since its creation in the early 1980s, at least 11 studies have been published, mostly in peer-reviewed journals by scholars using a variety of different approaches.
The pure, theoretical version of “effectiveness” is not really measurable with the available data. The ideal test of the effectiveness of the credit would take account of both the additional R&D induced by the credit and the social returns that the

42 center for American Progress | the corporate R&d tax credit and U.S. innovation and competitiveness
additional R&D generates, minus the costs of administering the credit for both firms and the government. But since the social returns to R&D investment cannot be directly measured for all of the reasons noted earlier, and since the costs of adminis-tering the credit have not been tracked over time, such a test is impractical.
In the absence of ideal data, evaluations of the effectiveness of the credit have focused on a comparison of the tax cost, or forgone government revenue, of the credit and the additional R&D spending that can statistically be attributed to it. In such evaluations, if the benefit-to-cost ratio between the incremental R&D investment and the tax cost of the credit is larger than 1, then the credit is at least as effective a use of public money as a direct government subsidy for R&D investment.46
The studies summarized in Table 11 estimate the credit’s benefit-cost ratio using a variety of data and methods. Estimates based on samples heavily dependent on the earliest years of the credit—when firms were still learning about the new incentive—found a benefit-cost ratio less than 1. More recent estimates, which covered later years, including those after the reform of the base in 1990, found benefit-cost ratios from 0.95 to 2.96.47
The studies in Table 11 also report, where available, a second measure of effective-ness known as the price elasticity of R&D. Whereas the benefit-cost ratio shows the ratio of the dollar values of incremental R&D to the tax costs of the credit, the price elasticity of R&D provides a measure of their proportional values, the ratio of the percentage change in R&D spending for a given percentage change in the tax cost of the credit.48 A price elasticity of one or more is an indication that the tax credit is effective at stimulating incremental R&D investment.
These studies have had to work with data that fall far short of what would be needed for a more definite test, which would ideally link the incremental amount of qualified research performed by individual firms and the size of the tax credit they receive for it. This can’t be done because of the confidentiality restrictions that prevent the release of company-specific data by the IRS.
Instead, academic researchers have had to make do with the total R&D expenditures reported on the firms’ financial statements and estimates of the credit claimed. Tax return confidentiality prevents researchers from knowing the amount claimed or the amount of the credit eventually allowed to individual companies. A credit earned is not always a credit used, and the tax position of firms also has to be guessed. Access to corporate tax returns whose identity is hidden is problematic because of the ease with which such data can be traced back to the filing corporation.
If the ratio of
incremental R&D to
the tax cost of the
credit is larger than
1, then the credit is
at least as effective
as a direct subsidy.

43 center for American Progress | the corporate R&d tax credit and U.S. innovation and competitiveness
table 11
Most academic studies find the corporate R&D tax credit effective
Benefit-cost and price elasticity estimates of the credit’s efficacy
Study reference SampleEstimated
benefit-cost ratioEstimated long-run price elasticity (absolute value)
Kenneth J. Klassen, Jeffrey A. Pittman, and Margaret P. Reed, “A Cross-National Comparison of R&D Expenditure Decisions: Tax Incentives and Financial Constraints,” Con-temporary Accounting Research 21 (3) (2004): 639–680.
110 firms, 1991-97 2.96 Not reported
Theofanis Mamuneas and M. Ishaq Nadiri. “Public R&D Poli-cies and Cost Behavior of the U.S. Manufacturing Industries,” Journal of Public Economics 63 (1) (1996): 57–81.
15 industries, 1981-88 0.95 0.95 to 1.0
Philip G. Berger, “Explicit and Implicit Effects of the R&D Tax Credit,” Journal of Accounting Research 31 (2) (1993): 131–171.
263 firms, 1982-85 1.74 1.0 to 1.5
Bronwyn H. Hall, “R&D Tax Policy During the Eighties: Success or Failure?”, Tax Policy and the Economy 7 (1993): 1–36.
950 firms, 1981-91 2.01.0 to 1.5 (short-run);
2.0 (long-run)
William W. McCutchen, “Estimating the Impact of the R&D Tax Credit on Strategic Groups in the Pharmaceutical Industry” Research Policy 22 (4) (1993): 337–351.
20 large drug firms, 1982-85 0.29 to 0.35 0.25 to 10.0
James R. Hines, “On the Sensitivity of R&D to Delicate Tax Changes: The Behavior of U.S. Multinationals in the 1980s.” In A. Giovannini, R.G. Hubbard, and J. Slemrod, eds., Studies in International Taxation (Chicago, IL: University of Chicago Press, 1993).
116 multinationals, 1984-89 1.3 to 2.0 1.2 to 1.6
Martin N. Baily and Robert Z. Lawrence, “Tax Incentives for R&D: What Do the Data Tell Us?”, Study commissioned by the Council on Research and Technology, Washington, D.C, 1992.
12 two-digit industries, 1981-89 1.3 0.75
Janet W. Tillinger, “An Analysis of the Effectiveness of the Research and Experimentation Tax Credit in a q Model of Valuation,” Journal of the American Taxation Association 13 (2) (1991): 1–29.
506 firms, 1980-85 0.19 (range: 0.08 to 0.42) Not reported
Government Accountability Office, “Tax Policy and Admin-istration: The Research Tax Credit Has Stimulated Some Additional Research Spending,” GAO/GGD-89-114, Report to Congressional Requesters, 1989.
800 large firms, 1981-85 0.15 to 0.36 Assumed -0.2 to -0.5
Edwin Mansfield, “The R&D Tax Credit and Other Technol-ogy Policy Issues,” American Economic Review 76 (2) (1986): 190–194.
110 firms, 1981-83 0.30 to 0.60 0.35 (short-run)
Robert Eisner, Steven H. Albert, and Martin A. Sullivan, “The New Incremental Tax Credit for R&D: Incentive or Disincen-tive?”, National Tax Journal 37 (2) (1986): 171–183.
592 firms, 1980-82 No significant result Not significant
Source: The table is adapted from: Bronwyn H. Hall and John Van Reenen, “How effective are fiscal incentives for R&D? A review of the evidence,” Research Policy 29 (4) (2000): 449–469, Table 2; and Mark Parsons,and Nicholas Phillips, “An Evaluation of the Federal Tax Credit for Scientific Research and Experimental Development.” Working Paper 2007-08 (Department of Finance Canada, 2007), available at http://dsp-psd.pwgsc.gc.ca/collection_2008/fin/F21-8-2007-8E.pdf.

44 center for American Progress | the corporate R&d tax credit and U.S. innovation and competitiveness
Taken together, the results in Table 11 indicate that the credit is effective in the sense that each dollar of foregone tax revenue or tax expenditure for the credit causes businesses to invest at least an additional dollar in R&D. In elasticity terms, each 1 percent decrease in the cost of R&D leads to a 1 percent or greater increase in the amount of R&D. The inclusion of social returns, if they could be measured reliably, would make the results even more favorable.
But this conclusion is not universally accepted, and it is to criticisms of this find-ing that we now turn.
Official treatment of the economic evidence
A 2003 report from the Joint Committee on Taxation that was cited as authorita-tive by a 2008 paper from the Congressional Research Service concluded that “the price elasticity of research is less than 1.0 and may be less than 0.5.”49 Because of the prominence of this report, which carefully documents its reasoning about the R&D price elasticity, we will devote special attention to it.
The conclusion of the Joint Committee on Taxation report is based primarily on sources that analyzed no data later than 1985. The references cited approvingly in the Congressional Research Service analysis of the Joint Committee on Taxation report were a 1985 report from Charles River Associates, an unpublished Treasury department report from 1983, and two of the studies listed in Table 11.50 We believe that focusing only on the early years of the tax credit is problematic as it covers a time when the credit was just coming into use and predates important changes in the method used to calculate the increment in R&D spending relative to spending in the base period.
Some of the more recent studies, which covered a later sample period (and found a larger price elasticity) are mentioned in the Joint Committee on Taxation report but are dismissed. A 1993 study by Bronwyn Hall is mentioned in a footnote of the report as finding a long-run price elasticity of 2, but, according to the commit-tee, “the author of this study notes that the long-run estimate should be viewed with caution for several technical reasons.”51 Yet according to the cited study, Hall’s note of caution applies only to the use of the long-run elasticity to simulate the effect of a large increase in the tax credit, not to the estimate of the elasticity itself.52 The Joint Committee on Taxation report doesn’t mention that Hall had no reservations about her short-run elasticity estimate of 1 to 1.5.
The results in
Table 11 indicate
that each dollar of
tax expenditure
for the credit
causes business to
invest at least one
additional dollar
in R&D.

45 center for American Progress | the corporate R&d tax credit and U.S. innovation and competitiveness
The Joint Committee on Taxation report also discounts the study by James Hines.53 He finds a price elasticity between 1.2 and 1.6. As the Joint Committee on Taxation report emphasizes, Hines also found that after the inclusion of a set of firms that added statistical “noise” to the data because they had undergone mergers or acquisitions, “the estimated elasticities fell by half.”54 Yet the inclu-sion of the extra data led to no statistically significant result for one of the two key equations, and Hines concluded that the data from the merged firms was inappropriate for the underlying model.55 Indeed, Hines apparently did not consider the result from the expanded sample important enough to mention in his summary of his findings. But the Joint Committee on Taxation featured this result—incorrectly in our view—as a weakness of the study rather than as an element of the study’s sample selection process.
To summarize, we believe that the Joint Committee on Taxation’s evaluation of the statistical evidence on the effectiveness of the credit assigns a misplaced weight to studies that looked at a period before the credit had reached maturity and is overly dismissive of studies that covered later periods and provided careful empirical evidence that the tax credit was effective. Based on our survey of the available studies we agree with the conclusion reached in a 2007 report by the Congressional Budget Office that most of the studies of the credit’s effectiveness “have clustered around the finding that a dollar claimed under a research tax credit leads firms to spend an additional dollar on R&D.”56
In other words, the available evidence supports the conclusion that the corporate R&D tax credit is at least as effective as direct federal funding for increasing busi-ness R&D spending.
Other critiques of the evidence
The economic findings about the responsiveness of corporate R&D to tax incen-tives have been subject to various general criticisms in the Joint Committee on Taxation report and elsewhere. We briefly review and discuss these criticisms here. A more complete discussion of the methodologies used to estimate the credit’s effectiveness can be found in an important review of studies of the credit’s effectiveness by Professor Bronwyn Hall of the University of California, Berkeley, and Professor John Van Reenen of the London School of Economics and Political Science published in 2000.57
46 center for American Progress | the corporate R&d tax credit and U.S. innovation and competitiveness
One criticism is that some of the claims for the tax credit are really for nonresearch activities that have been relabeled as R&D for the purpose of claiming the credit. This was a much bigger issue in the early years of the credit, and circumstantial evidence for relabeling was indeed found in 1981 and 1982.58 Although relabeling may have been used for a few years to inflate the rate of growth of corporate R&D expenses, it would have become less and less effective as all the marginal expendi-tures are eventually relabeled. Moreover, according to a 1995 report from the Office of Technology Assessment, claims for the credit by the largest firms are “routinely audited,” which is likely to weed out the most egregious examples of relabeling.59
A second criticism suggests that the measured increases in corporate R&D trig-gered by the tax credit are specious because the extra funds spent on R&D go, in part, toward increasing the salaries of research staff rather than increasing the amount of research conducted. Such an effect was demonstrated in a study of federal R&D spending, which found that one third or more of large programs such as the defense research increase under President Ronald Reagan went to salary increases rather than to increases in inventive activity.60
This effect is cited by the Joint Committee on Taxation in its 2003 report as another factor undermining reported estimates of R&D price elasticity with respect to the research tax credit, but we disagree with this conclusion.61 The wage effect in the 1980s most likely occurred because the supply of scientists and engi-neers was slow to adjust to the relatively large influx of funds from the Reagan-era research buildup, but that was a one-time event and wages should have gradually returned to their long-term trend. The corporate R&D tax credit, which does not normally change from year to year, stimulates predictable growth rather than sud-den, large year-to-year movements in business R&D spending. For this reason, a large salary effect is much less likely to be a matter of concern for the credit.
In sum, criticism of the credit on the basis of its possible effect on salaries appears overblown, but points to the general need for considering policies to increase the supply of engineers and scientific talent when crafting government policies to increase R&D investment.
A third criticism concerns the R&D “price” variable (an amalgam of the prices of salaries, materials, and equipment needed for research) used for the calculation of the R&D price elasticity by some of the more recent studies. As mentioned in the Joint Committee on Taxation report and elsewhere,62 this R&D price estimate, which ideally involves knowledge about the inputs needed for R&D
Claims for the
credit by the
largest firms are
routinely audited.

47 center for American Progress | the corporate R&d tax credit and U.S. innovation and competitiveness
activities in each industry over time, has not yet been reliably calculated. New measures are under development, including a major effort at the Bureau of Economic Analysis, which can be expected to improve the accuracy of estimates of the R&D price elasticity in the future.63
A fourth criticism seeks to disprove the effectiveness of the credit by point-ing out that it doesn’t work in practice as its designers intended.64 In theory, the credit provides an incentive for firms to undertake research projects that would be profitable only once the credit is taken into account. In practice, large corporations, which are the primary users of the credit, tend to set their overall research budget and then define projects within it rather than evaluating each project in isolation.65 A 1995 study from the Office of Technology Assessment confirmed in practitioner interviews that finance executives tended to be aware of the credit and its value to the firm over time, while the technologists who actually develop research programs were not.66
This criticism does not undermine the logic of the credit nor the empirical studies that show the credit increases R&D spending as intended. But this criticism does suggest that the credit might be just as effective if it were granted on the level of R&D activity rather than on the increment in such activity relative to an arbitrary base period. It is likely that the credit’s incremental approach—requiring prob-lematic calculations of qualified research expenditures and a base period of spend-ing—may be raising its administrative costs without improving its effectiveness.
A fifth criticism of the existing studies is that they do not measure the oppor-tunity cost of using scarce government resources on the credit. To do so would require comparing the social returns from using a dollar of government revenue to finance the credit with the social returns from using that dollar to support R&D spending in other ways—for example, through more funding of basic research, more funding of applied research to address national challenges, or more funding for training engineers and scientists.
Although this criticism is designed to further raise the bar for assessing the credit’s effectiveness, making the additional, and very problematic, calculations would require incorporating an estimate of the social returns to incremental business R&D. Inclusion of such returns, if measurable, could well bolster arguments in favor of the credit’s effectiveness rather than the reverse.
48 center for American Progress | the corporate R&d tax credit and U.S. innovation and competitiveness
In practice, social returns can only be known with certainty after the fact—some-times long after. Because of this uncertainty, it is appropriate for the government to allocate its research support among a variety of channels, including the tax credit, which allows businesses to choose the R&D projects that have the most promising private returns. Each form of federal support for R&D has different purposes—basic science, defense R&D, health R&D, alternative energy, and so on. The corporate R&D tax credit has the simple goal of encouraging more R&D spending by business. The evidence suggests that the credit achieves this goal. But we believe that the effectiveness of the credit can be improved in several ways that we consider in the next section.
As all these criticisms make clear, statistical analysis of the effectiveness of the corporate R&D tax credit is not an exact science. Overall, however, the empirical evidence from a number of studies adopting different methods indicates that the tax credit is effective at realizing its goal of increasing business R&D spending, and that the credit is at least as effective as a direct federal subsidy for the same purpose. Moreover, economic theory suggests that, like all R&D spending, the additional R&D spending induced by the credit is likely to generate social returns well in excess of the private returns.
49 center for American Progress | the corporate R&d tax credit and U.S. innovation and competitiveness
Improving the effectiveness of the corporate R&D tax credit
The corporate R&D tax credit encourages more R&D spending by businesses on projects of their own choice. Unlike many other tax expenditures, the impact of the credit has been carefully researched, as described in the previous section. Nonetheless there are several shortcomings in the credit’s design that undermine its effectiveness and increase its cost. In this section we recommend ways to improve the credit. We also consider whether the size of the credit should be increased.
Should the corporate R&D tax credit be simplified?
There are two sources of significant complexity in the current design of the credit that weaken its effectiveness and increase the cost of administering it:
•The base amount against which incremental R&D spending is measured•The definition and measurement of the qualified research expenditures eligible
for the credit
These complexities are a major source of discussion and dispute between the IRS and firms claiming the credit.
According to one unnamed source cited in a 2007 study, “a quarter of the audit resources of the IRS’ small and midsize business division are allocated to examin-ing claims” for the research credit.67 The large firms that claim most of the credit are routinely audited, and the disputes can last five or more years, with a signifi-cant cost to both the companies and the IRS staff.
Often these disputes result in a large difference between the value of the credit originally claimed and the amount ultimately granted. For instance the 1995 report on the credit from the Office of Technology Assessment found that a majority of audits resulted in an average 20 percent reduction in the credit ulti-mately allowed.68 This shows that firms are unable to rely on a clear forecast of the amount of the credit that will actually be received in any given year.

50 center for American Progress | the corporate R&d tax credit and U.S. innovation and competitiveness
The complexity and uncertainties that surround the calculations of a base amount and qualified research expenditures, as well as the unpredictability of which expenses will be allowed by the IRS, all serve to undermine the incentive effect of the credit for long-term R&D projects for which multiyear planning is essential. That’s the main reason why we recommend that Congress simplify the definition of qualified research expenditures, simplify the base period, and consider some alternative approaches to simplification. A second reason is the large administra-tive costs associated with the credit’s current design.
Simplifying the definition of qualified research expenditures
The current definition of qualified research expenditures is vague and riddled with uncertainties, constituting the credit’s most contentious feature. Applying the qualified research expenditures definition requires in-depth fact finding, an exami-nation of both complex technologies and the rapidly evolving research techniques for developing them, and an often arbitrary decision about when research and development of a product ends and its commercial production begins. A recent report by the Government Accountability Office, the research arm of Congress, examines these and other problems of defining qualified research expenditures.69
The IRS has attempted several times to refine and clarify its regulations, but subjectivity is inherent in many qualified research expenditure determinations, and firms probably push the boundaries of what is permissible. Frequent points of contention include whether:
• Software is only for internal use since the purchase or development of such software does not qualify.
•Product testing is for R&D or for quality control purposes since product-testing expenses for quality control do not qualify.
•Managers are involved in a research project or have strictly administrative responsibilities since salaries for pure administrative positions do not qualify.
The type and amount of recordkeeping that firms are expected to maintain to defend credit claims are further points of contention. Business and legal practitio-ners complain that IRS examiners often impose a higher standard for determining whether a project or the particular R&D expenses associated with it are eligible for the credit than required by the applicable law and regulations. Although firms undoubtedly test—and sometimes exceed—the limits of what’s a qualified
The current
definition of
qualified research
expenditures
is riddled with
uncertainties,
constituting the
credit’s most
contentious
feature.

51 center for American Progress | the corporate R&d tax credit and U.S. innovation and competitiveness
research expense, a series of court cases have accepted a less stringent standard of proof than the IRS had tried to impose.70
In addition, the resolution of ambiguity about whether particular expenses will be accepted as qualified research expenditures often requires lengthy negotiations or litigation. The resulting uncertainty about whether the credit will be granted diminishes its incentive effects.
An important, related issue is that the very concept of targeted incremental-ism at the center of the credit’s design is probably an illusion. As discussed in the previous section, large corporations view the credit in terms of their overall research budget rather than on a project-by-project basis. The qualified research expenditures rules matter only insofar as they reduce the pool of expendi-tures on which the credit is calculated; in most years the amounts of qualified research expenditures claimed by businesses for the credit are consistently between 64 percent and 68 percent of the total R&D expenses that are eligible for the expensing deduction.
The costs and uncertainties associated with the measurement of qualified research expenditures could be reduced significantly by applying the credit to all business R&D expenses eligible for the research expensing deduction. The qualified research expenditure rules for the credit are more contentious than those for the standard deduction, and this change would reduce the points of contention to one rather than two. This change, however, would also increase the amount of R&D expenses eligible for the tax credit by about half. Therefore, to preserve revenue neutrality, this simplification would also necessitate a reduc-tion in the tax credit’s rate (currently 20 percent for the regular credit and 14 percent for the simplified credit).
Recommendation: Replace the narrower and more complex definition of qualified research expenses in the corporate R&D tax credit with the broader and simpler definition of research expenses eligible for the research expensing deduction.
Simplifying the base period
As explained above, the base period for the regular credit has been frozen at 1984–1988 levels. The minimum base amount of 50 percent of current qualified

52 center for American Progress | the corporate R&d tax credit and U.S. innovation and competitiveness
research expenditures was established to limit windfalls for those firms that have had large increases of qualified research expenditures since the base period. There are two approaches to reducing the complexity of the base period calculations:
• Switching to a moving base period composed of the most recent years•Eliminating the incremental nature of the credit
The first approach would replace the different ways of measuring the base period currently in the law with the simple method used in the Alternative Simplified Credit. This method computes a “base amount” of qualified research expenses for a business from the average of its qualified research expenditures during the most recent three years. This method is straightforward and relies on the recent behav-ior of firms rather than their behavior between 1984 and 1988.
As part of its September 2010 proposal to make the credit permanent, repeated in its fiscal 2012 budget plan, the Obama Administration proposed that the Alternative Simplified Credit method become the standard for determining the base period for the credit. We agree that the Obama administration proposal is preferable to current law. Having all claimants use the same base method will make the credit easier to calculate and administer. It will also reduce the legal costs associated with auditing base periods based on expenditures that go back to the time of the Reagan administration.
The Alternative Simplified Credit’s moving-average base period, however, suf-fers from the shortcoming that caused the 1984–1988 base period to be adopted for the regular credit—namely that an increase in qualified R&D expenses by a business in the present reduces the amount of the credit for which the business is eligible in the future. And the anticipated reductions in those future credits reduce the incentive effects of the credit in the present.
A possible adjustment, one that uses a rolling five-year average instead of three years, was proposed by the Information Technology & Innovation Foundation.71 This would weaken the link between a firm’s R&D spending today and the effect it has on the firm’s eligibility for credits in the future by spreading the future impact over five years instead of three.
A second and very different approach to solving the base period problem would be to make the credit a flat credit rather than an incremental one. Instead of rewarding the increment of R&D spending over some arbitrary base period, a flat
Making the
Alternative
Simplified Credit
the standard
for determining
the base period
will reduce the
costs associated
with auditing
base-period
expenditures.

53 center for American Progress | the corporate R&d tax credit and U.S. innovation and competitiveness
credit would apply to total (qualified) R&D spending. As noted earlier many other nations have adopted this approach. And it is consistent with the general rationale for government support for business R&D—namely the social benefits it cre-ates. This rationale applies to all R&D spending by business, not just incremental spending over some base period.
The main argument against a flat credit is that it would reward firms for spending they would have done anyway. Yet the whole mechanism of using a base period is just a guess at what firms might have spent in any given year. In practice, the credit design inevitably rewards some firms for research increases that have nothing to do with the credit and denies others in an equally arbitrary manner.
Moreover, it is an unsettled question whether firms approach the credit with mar-ginal reasoning or as an approximate lump sum to be included in their planning. A 1 percent credit on a $20 million research budget may be as effective an incentive as a 20 percent credit on the incremental $1 million of that budget if the decision maker is uncertain whether an additional dollar spent will result in additional credit or be lost in a dispute with the IRS.
The incremental design of the current research credit is an artifact of the fact that it was introduced as a temporary stimulus measure to encourage more business R&D spending during an economic downturn, not as a permanent measure to encourage more R&D spending by business regardless of the economy’s cycli-cal position. We believe that additional research on the effectiveness of flat R&D credits in other countries is warranted.
Recommendation: Evaluate the revenue and incentive effects of replacing the cor-porate R&D tax credit for incremental R&D spending with a similar credit for the level of R&D spending. If a flat credit is not adopted and the regular credit is contin-ued, the base period for both the regular credit and the Alternative Simplified Credit should be changed to a long, recent period such as the most recent five years.
Alternative approaches to simplification
Other nations have adopted different and simpler forms of tax incentives to encourage industry R&D. We should consider the model of each of these incen-tives as a possible alternative to our own research tax credit.

54 center for American Progress | the corporate R&d tax credit and U.S. innovation and competitiveness
One such alternative is a simple “superdeduction” for R&D expenses that allows firms to deduct more than 100 percent of their R&D expense in the year in which it is incurred. This approach has been adopted in lieu of a separate tax credit by a number of other countries, including Australia, Belgium, China, India, Malaysia, Singapore, and the United Kingdom.
Another approach is to replace the R&E credit with an R&D jobs credit that would subsidize wages for accredited scientists and engineers. Salaries already account for most of the qualified research expenditures for both the corporate R&D tax credit and the R&D expensing deduction. The Netherlands has recently adopted such an approach.
Recommendation: Evaluate the revenue and incentive effects of replacing the corporate R&D tax credit with a “superdeduction” for R&D expenses or with an R&D jobs credit for the wages paid to R&D employees.
Should the corporate R&D tax credit be more narrowly targeted?
The data in Table 1 on page 8 support the notion that business R&D boosts pro-ductivity in other parts of the economy. In theory, pre-identification of the R&D most likely to have these desirable spillover effects, such as basic research, is likely to increase the benefits of a research subsidy. As we have already discussed, however, the current targeting to qualified research expenditures in the credit has created costly disputes between corporations and the Department of the Treasury—dis-putes that have undermined the effectiveness of the credit and dissipated its benefits.
Poorly designed attempts to target the tax credit to certain types of research would simply shift the arguments around qualified research expenditures to a new set of definitions and add even more complexity and uncertainty. For instance, if “basic research” is targeted for special treatment by the credit, then some share of applied research will simply be relabeled, ensuring that costly disputes between corpora-tions and the IRS will continue.
As noted earlier in this report, the commercial returns to basic research, which is often suggested as the appropriate type of research to target, are longer-term and less predictable than returns to other types of R&D. As a consequence, it is usu-ally not in the interests of businesses to invest in basic R&D nor do they have any special competence in such research. Indeed, there has been only limited industry
Poorly designed
attempts to target
certain types of
research would
simply shift the
arguments around
qualified research
expenditures,
adding even more
uncertainty.

55 center for American Progress | the corporate R&d tax credit and U.S. innovation and competitiveness
interest in the existing credit for basic scientific research contracted to universities and nonprofit organizations. Basic research is best done by these nonprofit institu-tions, and federal funds for basic research projects should be allocated by rigorous peer-review processes, not by corporate research departments. We believe that federal funding for projects at these institutions is a more effective way to encour-age basic research than tax incentives to encourage industry to do more of it.
It may make sense to create dedicated grant programs or tax incentives to encourage research on national priorities like the development of alternative energy sources. The energy research tax credit is a recent example of such a tar-geted tax incentive. But the goals of such incentives are different from the goals of the corporate R&D tax credit and their performance should be separately tracked and evaluated.
Recommendation: The corporate R&D tax credit should evolve toward greater simplicity. The goal of the credit is to stimulate business R&D investment, not to stimulate a particular kind of investment on a particular national goal. The perfor-mance of targeted R&D tax incentives such as the energy research credit should be monitored and assessed separately.
Should the corporate R&D tax credit be made permanent?
The effectiveness of the corporate R&D tax credit has been undermined over time by chronic uncertainty about how long it will remain in force. Partly for budget accounting reasons, the credit has remained a temporary provision, always scheduled to expire after a few years, or even months. So far, each time, with the exception of 1995, Congress and the president have agreed to extend the credit, often at the last minute or even retroactively. It appears that the credit has again been allowed to lapse as of January 1, 2012.
Under the present tight budgetary constraints, renewal of the credit remains vulnerable because it is a relatively large nondefense, discretionary tax expenditure. Even in its current form and at its current rate, the cost of the credit over the ten-year budgetary window is substantial. OMB’s most recent estimate of the cost for a five-year extension of the existing credit, for the period 2011-2015, is $12.9 billion, but this includes several years of relatively low budget costs because of projected corporate losses that will force firms to carry the credit forward.72 And many of the recommended changes in the credit discussed here, including

56 center for American Progress | the corporate R&d tax credit and U.S. innovation and competitiveness
broadening the research expenses that qualify for the credit, making it refundable for small businesses, and increasing the rate, would increase this cost.
The impermanence of the credit increases the uncertainty that firms face about the costs that they will pay for R&D. This uncertainty undermines the impact of the credit on R&D investment, which is inherently uncertain in its own right. The problem is likely to be particularly acute for long-term projects at smaller firms. For such projects, a lack of predictability about the continuation of the credit over the relevant planning horizon can be the deciding factor in whether to undertake or abandon a research program.
Recommendation: President Obama proposes to make the corporate R&D tax credit permanent. We agree that making the credit permanent would reduce a major source of uncertainty for corporate investments. But there are other important sources of uncertainty that should be addressed as well—including uncertainties about the base amount against which incremental R&D investment is assessed, uncertainties about what research expenses qualify for the credit, and uncertainties that arise from the refundable nature of the credit for many small businesses.
We recommend that the credit be redesigned to address these problems and then assessed for several years before it becomes a permanent feature of the tax code. As an interim measure, the credit in its current form should be extended until the design modifications are made. The extension period would also provide time to consider how broader corporate tax reform might affect both the corporate R&D tax credit and the research expensing deduction.
Should the corporate R&D tax credit be more generous?
Many analysts have suggested that the corporate R&D tax credit should be increased. A recent study concluded that the socially “optimal” level of R&D for the U.S. economy is two to four times larger than its actual level, and this leaves a wide scope for stronger incentives to support industry R&D.73 A 1996 Congressional Research Service study suggested that the optimal average level of the credit would be anywhere from 5 percent to 29 percent larger than its current level.74
An increase in the tax credit might also be justified in response to growing com-petition among nations in the generosity of the tax incentives offered to attract global R&D. These various perspectives all suggest that an expansion of the credit is worth considering.75
The impermanence
of the credit
undermines its
impact on R&D
investment.

57 center for American Progress | the corporate R&d tax credit and U.S. innovation and competitiveness
The Obama administration recently proposed making the corporate R&D tax credit 20 percent more generous by lifting the rate of the Alternative Simplified Credit from 14 percent to 17 percent. We believe that such an increase would be a good use of federal funds.
First, the credit has been demonstrated to be effective at achieving its goal of increasing business R&D spending in the United States. Making the credit more generous would encourage more R&D spending with the beneficial effects on knowledge creation and economic growth documented throughout this report. Second, increasing the tax credit would make the United States more competitive with other nations offering generous tax incentives to attract global R&D.
An increase in the research tax credit should be accompanied by the simplifica-tions in the credit’s design necessary to strengthen its effectiveness.
Recommendation: Increase the corporate R&D tax credit. The 20 percent increase in the credit rate proposed by the Obama administration is warranted to keep the United States competitive with other nations offering generous tax incentives to attract R&D by American and other multinational companies.
Should the corporate R&D tax credit be strengthened for small firms?
Small firms play an important role in the U.S. innovation system, yet they find it difficult to use the research credit.76 There are at least two features of the credit—its rate and its refundability—that could be modified to boost its effectiveness for small firms.
In several countries—including Japan, Canada, and the Netherlands—the research tax credit rate is higher for small firms than for large firms. Adopting this practice in the United States would not be very costly. From 2005 through 2008, the total credit claimed by companies with business receipts under $1 million amounted to less than 5 percent of the total credit claimed, so a mod-est increase in the amount of the credit for this class of firms would not lead to a very large expansion of the total tax expenditure for the credit. Doubling the credit for these firms, for example, would have increased the total credits claimed in 2008 from $8.3 billion to $8.7 billion, an increase of 4.5 percent.
The nonrefundability of the credit is another issue of importance to small firms. Currently, the credit is available only to firms reporting taxable income. And the

58 center for American Progress | the corporate R&d tax credit and U.S. innovation and competitiveness
credit is also limited as a share of income, although unused credits may be applied retroactively for one year or carried forward for up to 20 years.
The current approach is a problem for small startups that are doing valuable research yet slow to realize a profit. The rules limit the incentive effect of the credit even for more established firms when they are going through a difficult business period or are hit by the Alternative Minimum Tax. The situation of small high-tech firms that may incur years of losses before they are able to commercialize the results of their R&D is of particular concern.
One way to address this special group of firms is to make the credit refundable under certain conditions. Several countries, including France and the United Kingdom, have adopted this approach. The total revenue cost of such a change in the United States could be contained by limiting the refundability of the credit to very small firms.
Recommendation: Provide a larger and, in some cases, refundable corporate R&D tax credit for small firms.
Should the corporate R&D tax credit be exempt from the Alternative Minimum Tax?
In years when a firm is subject to the AMT, it is not allowed to claim the corporate R&D tax credit, but it may carry the credit forward for up to 20 years until it has a non-AMT-taxable profit.
Data that would allow us to know the total claims for the tax credit that were limited by the AMT are not publicly available. From the available information, it appears that the total limitation of the tax credit by the AMT may not be that large, which means, in turn, that the cost of ending the AMT limitation may not be that high. In 2007, the most recent year available, only 11,000 out of more than 5 million corporate returns had AMT limitations.
A small step has already been taken in this direction. The Small Business Jobs Act passed in September 2010 made the General Business Credit (which includes the corporate R&D tax credit) deductible against the AMT for nonpublic companies with average gross sales below $50 million.
Recommendation: The corporate R&D tax credit should be dropped from the list of credits that are disallowed under the Alternative Minimum Tax.
There are at least
two features of the
credit—its rate and
its refundability—
that could be
modified to boost
its effectiveness for
small firms.

59 center for American Progress | the corporate R&d tax credit and U.S. innovation and competitiveness
Can the assessment tools for the corporate R&D tax credit be improved?
The ideal data set for assessing the effectiveness of the corporate R&D tax credit is not available nor is it likely to become so. Firm-level data about research deduc-tions and credits claimed would be readily identifiable for the large firms that are the credit’s primary users, so access by researchers risks the release of commer-cially sensitive information. Because of confidentiality restrictions on data, studies of the credit’s effectiveness have had to estimate the amount of an individual company’s R&D that was claimed and the credit actually received.
Nevertheless, more detailed data could be made available consistent with con-fidentiality considerations. And aside from confidentiality restrictions the avail-ability of data leaves a lot to be desired. IRS estimates of claims for the credit are released with a delay of more than a year, and even then these estimates do not permit separating out the credits for basic (contracted) or energy research from the overall corporate R&D tax credit.
The reasons why the annual amounts of claimed credits reported by the IRS are smaller than the annual amounts of the tax expenditure for the credits reported by the OMB are not explained and are not public knowledge. If a reconciliation of the IRS and OMB numbers has ever been undertaken, it hasn’t been made publicly available.
There are also significant and unexplained differences in the annual estimates of the tax expenditures for the corporate R&D tax credit (and for the research expensing deduction) reported by the IRS and by the Joint Committee on Taxation. And data on the credit from both the IRS and OMB differ from the tax and R&D information reported by businesses. More complete and timely data are essential for monitoring and assessing the research credit.
Recommendation: Data collection and analysis of the corporate R&D tax credit and the research expensing deduction should be coordinated across agencies, be presented in as much detail as possible, and be readily accessible to independent researchers. An interagency effort should be made to provide a single and timely estimate of the budgetary costs of the credit each year. Policymakers and research-ers studying the effectiveness of the credit should be given timely access to as much firm-level detail as possible consistent with restrictions on firm confidentiality.

60 center for American Progress | the corporate R&d tax credit and U.S. innovation and competitiveness
Conclusion
The corporate R&D tax credit in the context of corporate tax reform
The statutory corporate tax rate in the United States is 35 percent, the second highest of all of the advanced industrial countries. By comparison, the median statutory corporate tax rate for the other industrialized country members of the OECD is about 28 percent. And most of these countries have cut their corporate tax rates significantly over the past 25 years, while the U.S. rate has remained constant. There is growing bipartisan consensus in Washington for corporate tax reform to reduce the U.S. corporate tax rate in order to increase the competitive-ness of the U.S. economy as a place to do business and to increase the competitive-ness of U.S.-based companies in the global economy.
A reduction in the corporate tax rate would increase the after-tax returns to all forms of business investment, including investment in R&D. But a reduction in the corporate tax rate would be costly. A 2010 study by President Obama’s Economic Recovery Advisory Board estimated that each percentage point decrease in the corporate tax rate would reduce corporate tax revenues by about $120 billion over 10 years.77 To make up some or all of these lost revenues, most proponents of corporate tax reform also call for broadening the corporate tax base. Broadening the base can be achieved in two ways:
•Reducing or eliminating corporate tax expenditures
•Extending the corporate tax system to noncorporate business entities, includ-ing partnerships, limited liability companies, and so called “S corporations” and other business entities that pass their incomes through to shareholders, which together account for about half of business net income and about one third of business receipts.78

61 center for American Progress | the corporate R&d tax credit and U.S. innovation and competitiveness
Both of these approaches would make the corporate tax system more neutral across types of investments, types of business organizations, and sectors of eco-nomic activity. But broadening the corporate tax base by eliminating preferential credits and deductions would also remove the incentives for the activities they are designed to encourage.
The corporate R&D tax credit illustrates the tradeoffs that would be involved in comprehensive corporate tax reform. The data in Table 9 on page 36 show that the corporate R&D tax credit is the fourth-largest corporate tax expenditure. According to official estimates, broadening the corporate tax base by eliminating the credit could fund a somewhat less than one percentage point reduction in the corporate tax rate.79
But eliminating the credit would mean eliminating a significant and effective incentive for R&D investment in the United States—at a time when other countries are strengthening their incentives to attract such investment and when such investment is increasingly mobile. Based on the research summarized in this report, we believe that this would be a policy error.
In recent statements, the Obama administration has called for comprehensive corporate tax reform to lower the corporate tax rate and broaden the corporate tax base. But it has also stated that the corporate R&D tax credit should be retained, be made permanent, and be made more generous. We agree. Given the spillover benefits of R&D investment and its importance to economic growth, we believe that the tax incentives for such investment should be preserved and strengthened as part of broader corporate tax reform.
Indeed, we believe that all of the changes implemented in the name of corporate tax reform should be evaluated for their probable impact on the amount and location of business R&D investment, especially by large U.S. corporations that are responsible for a significant share of this investment both at home and around the world.

62 center for American Progress | the corporate R&d tax credit and U.S. innovation and competitiveness
About the authors
Laura Tyson is the SK and Angela Chan Professor of Global Management at the Haas School of Business at the University of California, Berkeley. She served as dean of London Business School from 2001 through 2006 and as dean of the Haas School of Business from 1998 through 2001. She was the chair of the Council of Economic Advisers and the President’s National Economic Adviser in the Clinton administration. She was a member of President Obama’s Economic Recovery Advisory Board in 2009-2010, and was one of the co-authors of the Board’s 2010 report on tax reform options. She is currently a member of President Obama’s Council on Jobs and Competitiveness. She is a Senior Advisor at the Center for American Progress and a special adviser to the Berkeley Research Group.
Greg Linden is a research associate at the Institute for Business Innovation, a research unit at U.C. Berkeley’s Haas School of Business. In addition to numerous academic publications, he co-authored Chips and Change: How Crisis Reshapes the Semiconductor Industry (MIT Press, 2009) following a multi-year study of the globalization of semiconductor design and manufacturing. He has also worked as a consultant on projects around the world to develop industrial policy for high-tech industries.
Acknowledgements
We are grateful for helpful input from Bronwyn Hall, Rob Atkinson, and the editorial staff of the Center for American Progress. Responsibility for any errors lies with the authors.

63 center for American Progress | the corporate R&d tax credit and U.S. innovation and competitiveness
Endnotes
21 david h. henard and M. Ann McFadyen, “the complementary Roles of Applied and Basic Research: A Knowledge-Based Perspective,” Journal of Product innovation Management 22 (2005): 503–514.
22 Anthony Breitzman and diana hicks, “An Analysis of Small Business Patents by industry and Firm Size” (washington: Small Business Administration office of Advocacy, 2008), available at http://www.sba.gov/advo/research/rs335.pdf.
23 Paul Almeida and Bruce Kogut, “the exploration of technological diversity and the Geographic Localization of innovation,” Small Busi-ness economics 9 (1) (1997): 21–31.
24 Gary P. Pisano, “the Governance of innovation: Vertical integration and collaborative Arrangements in the Biotechnology industry,” Research Policy 20 (3) (1991): 237–249.
25 deloitte Research, “critical Factors for Alliance Formation: insights from the deloitte Research Biotech Alliance Survey,” (2005), p. 2, available at http://www.deloitte.com/assets/dcom- France/Local%20Assets/documents/dR_critical_Factors_Biotech_June2005.pdf.
26 Michael Ferrary, “Managing the disruptive technologies life cycle by externalising the research: social network and corporate venturing in the Silicon Valley,” international Journal of technology Manage-ment 25 (1/2) (2003): 165-180.
27 calculated from the listing “List of mergers and aquisitions by Micro-soft,” available at http://en.wikipedia.org/wiki/List_of_mergers_and acquisitions_by_Microsoft#Acquisitions (last accessed May 2011). Reported purchase prices greater than $10 million were excluded.
28 National Science Foundation “U.S. Businesses Report 2008 world-wide R&d expense of $330 Billion: Findings From New NSF Survey” (2010), infoBrief NSF 10-322, available at http://www.nsf.gov/statistics/infbrief/nsf10322/nsf10322.pdf.
29 National Science Board, “Science and engineering indicators 2010,” p. 4–25.
30 charles w. wessner, ed., An Assessment of the Small Business inno-vation Research Program, (washington: National Academies Press, 2008), available at http://www.nap.edu/catalog/11989.html.
31 National Science Board, “Science and engineering indicators 2010,” Appendix tables 4-11 and 4-13.
32 Paul A. david, Bronwyn h. hall, and Andrew A. toole, “is public R&d a complement or substitute for private R&d? A review of the econo-metric evidence,” Research Policy 29 (2000): 497–529.
33 James R. hines, “No Place like home: tax incentives and the Location of R&d by American Multinationals,” tax Policy and the economy 8 (1994): 65–104.
34 the tax expenditure reported in the table is actually a “present value” estimate, which is the office of Management and Budget’s computa-tion of the cumulative budget impact of current year R&d spending that will hit the budget in future years. this assigns, for example, credits that have to be carried forward for future deduction to the current year. the “present value” series is much smoother than the official tax expenditure value for this item, and is most closely linked to the National Science Foundation’s measure of business R&d spend-ing for any given year. in the long run, the two methods of reporting tax expenditures should be equal, apart from any discounting used in the present value calculation. in any one year, the difference between the actual tax expenditure and the estimated present value of expenditures tied to R&d spending in that year can be substantial. For instance, the present value of eventual tax expenditures for 2008 R&d spending is $2.7 billion, but the actual tax expenditure recorded in 2008 was $4.9 billion.
35 For companies with numerous subsidiaries, the system of credit
1 Leo Sveikauskas, “R&d and Productivity Growth: A Review of the Literature,” working Paper 408 (Bureau of Labor Statistics), available at http://www.bls.gov/ore/pdf/ec070070.pdf.
2 the equivalence of the private return to business R&d with other business investments is discussed in: Bronwyn h. hall, “the Private and Social Returns to Research and development.” in Bruce L. R. Smith and claude e. Barfield, eds., technology, R&d, and the economy (washington: the Brookings institution and the American enterprise institute, 1996). p. 146–148, 159.
3 congressional Budget office, “R&d and Productivity Growth: A Background Paper” (2005), available at http://www.cbo.gov/doc.cfm?index=6482.
4 david t. coe and elhanan helpman, “international R&d Spillovers,” european economic Review 39 (5) (1995): 859–887.
5 dominique Guellec and Bruno van Pottelsberghe de La Potterie, “R&d and Productivity Growth: Panel data Analysis of 16 oecd countries,” oecd economic Studies 33 (2001): 103–126.
6 Negative spillovers can occur when the result of R&d by one firm undermines the value of existing output by others as new products replace old ones, but we know of no firm- or industry-level studies in which such an effect dominates in the long run, i.e., spillovers, when they are found, are positive.
7 thomas döring and Jan Schnellenbach, “what do we Know About Geographical Knowledge Spillovers And Regional Growth?: A Survey of the Literature,” Regional Studies 40 (3) (2006): 375–395.
8 david B. Audretsch and Maryann P. Feldman, “R&d Spillovers and the Geography of innovation and Production,” American economic Review 86 (3) (1996): 630.
9 Lee Fleming, charles King iii, and Adam i. Juda, “Small worlds and Regional innovation,” organization Science 18 (6) (2007): 938–954.
10 döring and Schnellenbach, “what do we know,” provides a review of spillover studies.
11 Audretsch and Feldman, “R&d Spillovers.”
12 Zvi Griliches, “the Search for R&d Spillovers,” Scandinavian Journal of economics 94(supplement), S29-S47, 1992.
13 Jeffrey i. Bernstein and M. ishaq Nadiri, “interindustry R&d Spillovers, Rates of Return, and Production in high-tech industries,” American economic Review 78 (2) (1988): 429–434.
14 coe and helpman, “international R&d Spillovers.”
15 Bronwyn h. hall, Jacques Mairesse, and Pierre Mohnen, “Measur-ing the Returns to R&d,” working Paper 15622 (cambridge, MA: National Bureau of economic Research), available at http://www.nber.org/papers/w15622.
16 wolfgang Keller, “Geographic Localization of international technol-ogy diffusion,” American economic Review 92 (1) (2002): 120–142.
17 wolfgang Keller, “international technology diffusion,” Journal of economic Literature 42 (3) (2004): 752–782.
18 the numbers in this paragraph were calculated from Appendix table 4-7 in National Science Board, “Science and engineering indicators 2010” (2010), available at http://www.nsf.gov/statistics/seind10/start.htm.
19 calculated from National Science Board, “Science and engineering indicators 2010,” Appendix table 4-8.
20 calculated from National Science Board, “Science and engineering indicators 2010,” Appendix table 4-18.

64 center for American Progress | the corporate R&d tax credit and U.S. innovation and competitiveness
calculation and allocation across units is another source of disputes with the iRS. this is discussed in: Government Accountability of-fice, “the Research tax credit’s design and Administration can Be improved” (2009) Appendix Vii, p 10–136., available at http://www.gao.gov/new.items/d10136.pdf. while there is room for simplification in this area, a full consideration of the issues involved is beyond the scope of this report.
36 An earlier attempt at creating an alternative to the regular credit was less successful. the “Alternative incremental Research credit,” or AiRc, was added in 1996 to credit firms that invest in R&d beyond a level based on sales over the previous four years, but at a less gener-ous rate than the regular credit. the AiRc accounted for only $47 million in credit claims in 2008 and was allowed to expire at the end of that year.
37 Bronwyn h. hall, “tax incentives for innovation in the United States: A Report to the european Union,” draft dated January 15, 2001, available at http://elsa.berkeley.edu/~bhhall/papers/Bhh01%20eU%20Report%20USA%20rtax.pdf. the amounts disallowed are not publicly available for other years.
38 Robert d. Atkinson, “create Jobs by expanding the R&d tax credit” (washington: information technology and innovation Foundation, 2010), available at http://www.itif.org/files/2010-01-26-Randd.pdf.
39 “oecd Science, technology and industry Scoreboard 2009,” Section 2.14. Available online at http://www.oecd-ilibrary.org/science-and-technology/oecd-science-technology-and-industry-score-board-2009/tax-treatment-of-r-d_sti_scoreboard-2009-31-en. the methodology is explained in detail in: Jacek warda, “tax treatment of Business investments in intellectual Assets: An international comparison.” Sti working Paper 2006/4 (oecd directorate for Sci-ence, technology and industry, 2006), available at http://www.oecd.org/dataoecd/53/4/36764076.pdf. the oecd’s R&d incentive index doesn’t capture all the peculiarities of individual tax systems. For example, the study by James R. hines (“No Place like home,” 1994) found that the tax treatment of foreign-source royalties has a much greater influence on keeping R&d in the United States than does the R&e tax credit, but this is not accounted for in the oecd index.
40 See, for example: Jules duga and tim Studt, “Globalization Alters traditional R&d Rules,” R&d Magazine, September 2006, p. G1–G17, available at http://www.battelle.org/news/06/2006report.pdf; Jerry thursby and Marie thursby, “here or there? A Survey of Factors in Multinational R&d Location” (washington: National Academies Press, 2006), available at http://www.kauffman.org/pdf/thursby_fi-nal_1206.pdf.
41 B. Anthony Billings, “Are U.S. tax incentives for corporate R&d Likely to Motivate American Firms to Perform Research Abroad?” tax executive 55 (4) (2003): 291–315.
42 Nick Bloom and Rachel Griffith, “the internationalisation of UK R&d,” Fiscal Studies 22 (3) (2001): 337–355.
43 Russell thomson, “tax Policy and the Globalisation of R&d.” Melbourne institute working Paper 11/09 (Melbourne institute of Applied economic and Social Research, 2009), available at http://www.melbourneinstitute.com/wp/wp2009n11.pdf.
44 James R. hines and Adam Jaffe, “international taxation and the Loca-tion of inventive Activity.” in J.R. hines, ed., international taxation and Multinational Activity (chicago: University of chicago Press, 2001).
45 As of 2006, at least 32 states also offered tax credits for company-funded R&d, but a recent study concludes that these credits tend to affect the location of R&d spending across states, not its national level; see: daniel J. wilson, “Beggar thy Neighbor? the in-State, out-of-State, and Aggregate effects of R&d tax credits,” Review of economics and Statistics 91 (2) (2009): 431–436.
46 An alternate approach is a simulation that incorporates an estimate of social returns. Mark Parsons and Nicholas Phillips, “An evaluation of the Federal tax credit for Scientific Research and experimental development.” working Paper 2007-08 (department of Finance canada, 2007, table 7), available at http://dsp-psd.pwgsc.gc.ca/collection_2008/fin/F21-8-2007-8e.pdf ), for example, calculates this for the canadian research credit. Although the parameter values
they use lead to less than a 1-to-1 benefit-cost ratio, they find a net benefit from the credit by including social returns.
47 the one exception was a small-sample study: william w. Mccutchen, “estimating the impact of the R&d tax credit on Strategic Groups in the Pharmaceutical industry,” Research Policy 22 (4) (1993): 337–351, about which hall and Van Reenen note that “the R&d equation in this study appears to be misspecified” (p. 462).
48 Although the elasticity is always a negative number because R&d declines when its tax cost rises, the table shows its absolute value, which is positive.
49 the quote is from p. 250 of Joint committee on taxation, “descrip-tion of Revenue Provisions contained in the President’s Fiscal Year 2004 Budget Proposal” (2003), available at http://www.jct.gov/s-7-03.pdf. the report is cited as a reference on page 16 of: congressional Research Service, “Research and experimentation tax credit: current Status and Selected issues for congress” (2008), Report RL31181, Updated october 6, 2008.
50 edwin Mansfield, “the R&d tax credit and other technology Policy issues,” American economic Review 76 (2) (1986): 190–194; U.S. Gen-eral Accounting office, “tax Policy and Administration: the Research tax credit has Stimulated Some Additional Research Spending,” (1989), Report GAo/GGd-89-114.
51 the quote is from p. 250 of: Joint committee on taxation, “descrip-tion of Revenue Provisions.” the study isL Bronwyn h. hall, “R&d tax Policy during the eighties: Success or Failure?”, tax Policy and the economy,7 (1993): 1–36.
52 hall, “R&d tax Policy during the eighties,” p. 27.
53 James R. hines, “on the Sensitivity of R&d to delicate tax changes: the Behavior of U.S. Multinationals in the 1980s.” in A. Giovannini, R.G. hubbard, and J. Slemrod, eds., Studies in international taxation (chicago: University of chicago Press, 1993), 149–194.
54 the quote is from p. 251, footnote 399 of: Joint committee on taxa-tion, “description of Revenue Provisions.”
55 hines, “on the Sensitivity of R&d to delicate tax changes,” p. 173.
56 congressional Budget office, “Federal Support for Research and development” (2007), p. 24, available at http://www.cbo.gov/ftpdocs/82xx/doc8221/06-18-Research.pdf.
57 Bronwyn h. hall and John Van Reenen, “how effective are fiscal incentives for R&d? A review of the evidence,” Research Policy 29 (4) (2000): 449–469.
58 Robert eisner, Steven h. Albert, and Martin A. Sullivan, “the New incremental tax credit for R&d: incentive or disincentive?” National tax Journal 37 (2) (1986): 171–183.
59 the quote is from p. 15 of: office of technology Assessment, “the effectiveness of Research and experimentation tax credits” (1995).
60 Austan Goolsbee, “does Government R&d Policy Mainly Benefit Scientists and engineers?” American economic Review 88 (2) (1998): 298–302.
61 the Goolsbee study is cited on p. 251 of: Joint committee on taxa-tion, “description of Revenue Provisions.”
62 See, for example, p. 24 of: office of technology Assessment, “the effectiveness of Research and experimentation tax credits.”
63 Ana M. Aizcorbe, carol e. Moylan, and carol A. Robbins, “toward Bet-ter Measurement of innovation and intangibles,” Survey of current Business 89 (1) (2009): 10–23.
64 See, for example, page 30 of: Michael d. Rashkin, Practical Guide to Research and development tax incentives - Federal, State and Foreign, 2nd edition (chicago: cch, 2007).
65 Neil M. Kay, “corporate decision-making for Allocations to Research and development,” Research Policy 8 (1) (1979): 46–69.
65 center for American Progress | the corporate R&d tax credit and U.S. innovation and competitiveness
66 See p. 42 of: office of technology Assessment, “the effectiveness of Research and experimentation tax credits.”
67 the quote appears on p. 607 of: Gregory tassey, “tax incentives for innovation: time to Restructure the R&e tax credit,” Journal of technology transfer 32 (6) (2007): 605–615.
68 office of technology Assessment, “the effectiveness of Research and experimentation tax credits.”
69 Government Accountability office, “the Research tax credit’s design and Administration can Be improved” (2009), p. 10–136, available at http://www.gao.gov/new.items/d10136.pdf.
70 david L. click, “Baby, Bathwater, And Research credit: A Response to Sullivan,” tax Notes, March 8, 2010.
71 Robert d. Atkinson, “effective corporate tax Reform in the Global innovation economy” (washington: information technology and innovation Foundation, 2009), available at http://www.itif.org/files/090723_corptax.pdf.
72 office of Management and Budget, “Analytical Perspectives, Fiscal Year 2011.”
73 charles i. Jones and John c. williams, “Measuring the Social Return to R&d,” Quarterly Journal of economics 113 (4) (1998): 1119–1135.
74 the study, cRS Report 96-505, is summarized in: cRS, “Research and experimentation tax credit,” p. 20–22.
75 two recent studies have estimated the economic effects of an increase in the corporate R&d tax credit.
A study by the information technology and innovation Foundation (Robert d. Atkinson, “create Jobs by expanding the R&d tax credit”) assesses the potential impact of an increase in the simpler version of the credit (the “Alternative Simplified credit” discussed earlier) from 14 percent to 20 percent. the study assumes that $1 of addi-tional tax credit would induce $1.25 of additional R&d spending, an assumption that is consistent with the empirical results discussed earlier in this report. the study estimates that the more generous
credit would cost an additional $6 billion of tax expenditures each year and would encourage a $7.5 billion increase in the amount of industry R&d each year.
As long as the economy has significant unutilized capacity, the increase in industry R&d spending in turn would increase total employment both directly and indirectly through multiplier effects. the information technology and innovation Foundation study estimates that the increase in R&d spending would add 73,000 jobs directly for new researchers and for the suppliers of inputs to new R&d investments, and another 89,000 indirectly (through multiplier effects) each year. Although these results rely on optimistic assump-tions about how fast industry would adjust its R&d investment and employment levels in response to an increase in the corporate R&d tax credit, the size of the overall employment effects appears to be reasonable.
Another recent study, from the Milken institute (Ross deVol and Perry wong, “Jobs For America” (Santa Monica, cA: Milken institute, 2010), available at http://www.milkeninstitute.org/jobsforamerica/), used macroeconomic modeling to conclude that a 25 percent increase in the tax credit would pay for itself within a few years. the assumptions underlying the model were not published, but appear to be far more optimistic than warranted by recent research on the size and speed of the relationship between R&d investment and the levels of economic activity and tax revenues.
76 Bronwyn h. hall, “the Financing of Research and development,” oxford Review of economic Policy 18 (1) (2002): 35–51.
77 President’s economic Recovery Advisory Board (PeRAB), “the Report on tax Reform options: Simplification, compliance, and corporate taxation” (washington: white house, 2010), p. 75, available at http://www.whitehouse.gov/sites/default/files/microsites/PeRAB_tax_Reform_Report.pdf.
78 calculated from 2007 data in: PeRAB, “the Report on tax Reform options,” table 8, p.75.
79 calculated from data in: PeRAB, “the Report on tax Reform options,” p. 77–78.

The Center for American Progress is a nonpartisan research and educational institute
dedicated to promoting a strong, just, and free America that ensures opportunity
for all. We believe that Americans are bound together by a common commitment to
these values and we aspire to ensure that our national policies reflect these values.
We work to find progressive and pragmatic solutions to significant domestic and
international problems and develop policy proposals that foster a government that
is “of the people, by the people, and for the people.”
1333 H Street, NW, 10tH Floor, WaSHiNgtoN, DC 20005 • tel: 202-682-1611 • Fax: 202-682-1867 • WWW.ameriCaNprogreSS.org