u.s. geological survey, reston, virginia: 2005
TRANSCRIPT

Economics of 1998 U.S. Geological Survey’s 1002 Area Regional Assessment: An Economic Update
By E. D. Attanasi
Open-File Report 2005-1359
U.S. Department of the InteriorU.S. Geological Survey
This report is preliminary and has not been reviewed for conformity to U.S. Geological Survey editorial standards and stratigraphic nomenclature.
U.S. Department of the InteriorGale A. Norton, Secretary
U.S. Geological SurveyP. Patrick Leahy, Acting Director
U.S. Geological Survey, Reston, Virginia: 2005
For product and ordering information:
World Wide Web: http://www.usgs.gov/pubprod
Telephone: 1-888-ASK-USGS
For more information on the USGS—the Federal source for science about the Earth, its natural and living resources, natural hazards, and the environment:
World Wide Web: http://www.usgs.gov
Telephone: 1-888-ASK-USGSAny use of trade, product, or firm names in this publication is for descriptive purposes only and does not imply endorsement by the U.S. Government.
Although this report is in the public domain, permission must be secured from the individual copyright owners to reproduce any copyrighted materials contained within this report.

iii
Contents
Summary..........................................................................................................................................................1Introduction.....................................................................................................................................................1Acknowledgements .......................................................................................................................................3Economic Approach ......................................................................................................................................3Assumptions ...................................................................................................................................................3Economic Analysis Results ..........................................................................................................................5Conclusions and limitations .........................................................................................................................8References ....................................................................................................................................................10
List of tablesTable 1. Estimates of undiscovered technically recoverable conventional oil in the entire Study
Area and the Federal 1002 Area of the Arctic National Wildlife Refuge ................................2Table 2. Estimates of technically recoverable crude oil based on accumulation size distributions
for the entire Study Area and the Federal 1002 Area .................................................................3Table 3. Allocation of oil volumes to western and eastern economic sub-areas for the entire
Study area and the Federal 1002 Area ..........................................................................................5Table 4. Volumes of oil and natural gas liquids from undiscovered oil accumulations, located in
the entire Study Area and the Federal 1002 Area, available as a function of market prices that offset costs of finding, developing, producing, and transporting crude oil and natural gas liquids to market: Scenario 1 stand-alone development, 2003 dollars ............................7
List of figures1. Map showing the entire Study Area including the Federal portion of the 1002 Area of the Arc-
tic National Wildlife Refuge, Native Lands within the 1002 Area, and lands underlying adjacent Alaska state waters .....................................................................................................2
2. Size-frequency distribution of the undiscovered conventional oil accumulations associated with the (A) entire Study Area (B) Federal 1002 Area .............................................................4
3. Map showing partition of the entire Study Area into western and eastern sub-areas and the hypothetical and generalized regional pipeline transport system associated with Sce-nario 1, stand-alone field development .....................................................................................6
4. Map showing the partition of the entire Study Area into western and eastern sub-areas and the hypothetical and generalized regional pipeline transport system associated with Scenario 2, processing outside Federal 1002 Area .................................................................6
5. Incremental costs, in 2003 dollars, of finding, developing, producing, and transporting crude oil and natural gas liquids from undiscovered accumulations in the entire Study Area. Scenario 1 and Scenario 2 (see text) ........................................................................................8
6. Incremental costs, in 2003 dollars, of finding, developing, producing, and transporting crude oil and natural gas liquids from undiscovered accumulations in entire Study Area: comparison of 2005 and 2002 results .........................................................................................9

iv
TABLE OF CONVERSIONS TO SI UNITS
Multiply unit By To obtain metric unit
barrel 0.159 cubic meter
cubic foot 0.02832 cubic meterfoot 0.3048 meter

Economics of 1998 U.S. Geological Survey’s 1002 Area Regional Assessment: An Economic Update
E. D. Attanasi
SummaryThis report updates the economic analysis of the U. S.
Geological Survey’s 1998 petroleum assessment (see Bird, 1999) of the combined lands consisting of the Federal 1002 Area of the Arctic National Wildlife Refuge, Native Lands inside the boundary of the 1002 Area, and the lands underly-ing the adjacent Alaska state waters. The update includes newer field development practices based on horizontal development wells and satellite/cluster field development, as well as, an update of the 1996 base costs to a new base year of 2003. The 1998 U. S. Geological Survey’s assessment of undiscovered oil resources (in-place and technically recover-able) remains the geologic basis for the economic analysis.
The mean technically recoverable undiscovered oil for the entire study area (Federal 1002 Area, Native Lands, and lands under adjacent State waters) is 10.36 billion barrels of oil (BBO) while the 95th fractile estimate is 5.72 BBO and the 5th fractile estimate is 15.96 BBO. The Federal 1002 Area portion averaged about 74 percent of the assessed resources of the entire study area. The minimum accumulation size consid-ered in the assessment was 50 million barrels of oil in place. Though the 95th and 5th fractile estimates show a wide range in total volumes, for each estimate a substantial fraction of the assessed oil was assigned to large accumulations (500 million barrels or greater) which are of economic interest even though they are located far from infrastructure.
Results of the economic analysis are summarized as incremental cost functions that included the full costs (includ-ing a return to capital) of finding, developing, producing, and transporting the oil to market. The functions show that at $30 per barrel (2003 dollars), between 73 and 82 percent of the assessed technically recoverable resources are economic. At $55 per barrel, the economic resources represent more than 90 percent of the assessed technically recoverable resource estimate, that is, between 5.37 BBO and 14.65 BBO. These estimates are generally within 10 percent of the estimates of the economically recoverable resources published earlier for the entire study area, when those estimates were adjusted to 2003 dollars. This finding suggests that improvements in productivity have to a large extent offset increased costs that occurred between the 1996 and 2003 base years.
IntroductionThis report updates the economic analysis published in
Attanasi and Schuenemeyer (2002) of the U. S. Geological Survey’s 1998 petroleum assessment (Bird, 1999) of the com-bined lands consisting of the Federal 1002 Area of the Arctic National Wildlife Refuge, Native Lands inside the boundary of the 10021 Area, and the lands underlying the adjacent Alaska state waters (see Figure 1). In the following pages, the phrase entire Study Area is used to refer to this combined assessment area. The economic analysis assumes that the newer North Slope field development practices based on horizontal drilling and satellite/cluster field development are followed and also updates the 1996 base year costs to a new base year 2003 level, the most recent year for which essential economic data are available. This study uses the procedures and methods presented in the recent economic analysis of the Federal part of the 1002 Area (Attanasi, 2005). The 1998 U. S. Geological Survey’s assessment of undiscovered technically recoverable oil resources remains the geologic basis for the economic analysis.
The geologic assessment assigned to the Federal part of the entire Study Area about 74 percent of the undiscovered technically recoverable2 volume of oil assessed in the com-bined areas (Bird, 1999). Specifically, for the entire Study Area, resource estimates corresponding to the 95th fractile3, mean, and 5th fractile for oil in oil fields are 5.72 billion bar-rels of oil (BBO), 10.36 BBO, and 15.96 BBO, respectively,
1The Alaska National Interest Lands Conservation Act (1980) established the 19 million acre Arctic National Wildlife Refuge (ANWR). In section 1002 of that Act, Congress deferred a decision on the permanent status of the 1.5 million acre Federal part of coastal plain (“1002 Area”) in recognition of its potential oil and gas resources and its importance as a wildlife habitat.
2Undiscovered technically recoverable conventional oil and gas resources are resources posited to exist in undiscovered accumulations outside of known fields on the basis of geologic knowledge and theory. Technically recover-able resources are producible using current recovery practices, but without reference to economic viability. Accumulations assessed by geologists outside of known fields were considered for the purposes of the economic analysis as separate and discrete new fields.
3At the 95th fractile there is a 19 in 20 chance oil volume will exceed that value and at the 5th fractile there is only a 1 in 20 chance of oil volume exceed-ing that value.

2 Economics of 1998 US Geological Survey’s 1002 Area Regional Assessment: An economic update
and for just the Federal 1002 Area at the 95th, mean, and 5th fractiles the estimates are 4.25 BBO, 7.69 BBO, and 11.80 BBO, respectively (see table 1).
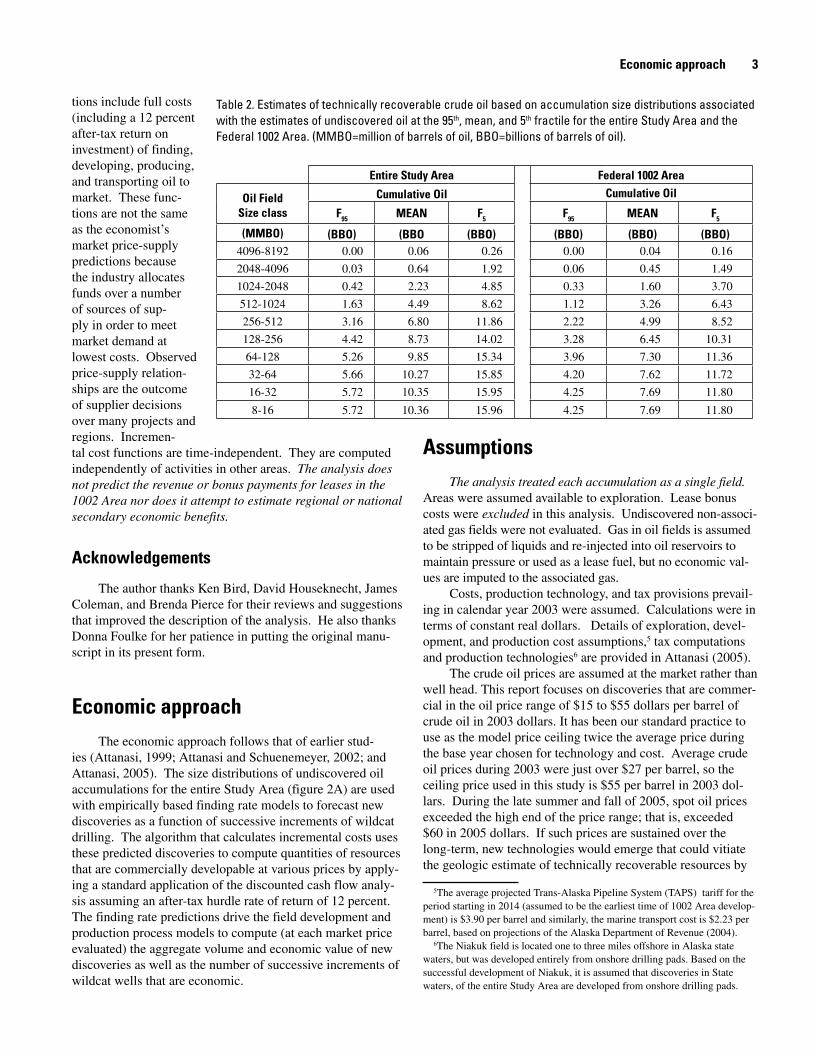
For each volume estimate of undiscovered oil, there is an associated undiscovered accumulation size-fre-quency distribution. Figure 2 shows the size frequency distributions of the assessed undiscovered oil accumula-tions for the entire Study Area, and for comparison, just the Federal area. The shape of the distributions at their lower end is a consequence of the minimum size accu-mulation cutoff of 50 million barrels of oil-in-place used for the 1998 assessment. The assessed oil is expected to occur in a number of accumulations rather than one or two very large fields, and the expected accumulation sizes are sufficiently large to be of economic interest. At the mean estimate, between 42 and 43 percent (4.49 BBO entire Study Area and 3.26 BBO Federal 1002) of the assessed resources are estimated to occur in accumu-lations of at least 512 million barrels and between 65 and 66 percent (6.80 BBO entire Study Area, and 4.99 BBO Federal 1002 Area) of the assessed resources are assigned to accumulations of at least 256 million barrels in size (see table 2). Comparing across the 95th, mean, and 5th fractile estimates, the larger the volume estimates, the higher the concentration (fraction of oil) in the large size classes.
Table 1. Estimates of undiscovered technically recoverable conven-tional oil in the entire Study Area and the Federal 1002 Area of the Arctic National Wildlife Refuge, based on the 1998 USGS Assessment (Bird, 1999). Estimates based on the 95th, mean, and 5th fractile esti-mates corresponding to the aggregated1 distributions.
Volume of oil, in billions of barrelsF95 Mean F05
Entire Study Area2 5.72 10.36 15.96
Federal part 1002 Area 4.25 7.69 11.80 Undeformed 3.40 6.42 10.22 Deformed 0 1.27 3.19
1The aggregated distributions are the stochastic combination of the play simula-tions as described in Schuenemeyer (1999).
2Includes the Federal 1002 Area shown in Figure 1, Native lands, and adjacent State water areas within 3-mile boundary.
Sadlerochit Mountains
Shublik Mountains
Northern front of Brooks Range
Camden Bay
Native lands
1002 AREA
ARCTIC NATIONAL WILDLIFE REFUGE
BEAUFORT SEA
Undeformed area
Deformed area
Approximate location of3-mile boundary
between State andFederal jurisdiction
Marsh Creek anticline
0 10 20 30
0 10 3020
MILES
KILOMETERS
Pt. Thomson(1977-79)
Hammerhead(1985)
Kuvlum(1993)
Flaxman Island(1975)
Sourdough(1994)
Badami(1991)
Figure 1. Map showing the entire Study Area that included the Federal part of the 1002 Area of the Arctic National Wildlife Refuge, Native Lands within the 1002 Area, and lands underlying adjacent Alaska state waters and the Undeformed and Deformed areas of the 1002 Area. Also shown are oil accumulations discovered near the entire Study Area during the past three decades.
Results of the economic analysis4 are summarized as incremental resource cost functions. Incremental cost func-
4 Economically recoverable resources are the part of the assessed technically recoverable resource for which the costs of finding, development, production, and transportation to market including a return to capital, can be recovered by pro-duction revenues at a given price.
AssumptionsThe analysis treated each accumulation as a single field.
Areas were assumed available to exploration. Lease bonus costs were excluded in this analysis. Undiscovered non-associ-ated gas fields were not evaluated. Gas in oil fields is assumed to be stripped of liquids and re-injected into oil reservoirs to maintain pressure or used as a lease fuel, but no economic val-ues are imputed to the associated gas.
Costs, production technology, and tax provisions prevail-ing in calendar year 2003 were assumed. Calculations were in terms of constant real dollars. Details of exploration, devel-opment, and production cost assumptions,5 tax computations and production technologies6 are provided in Attanasi (2005).
The crude oil prices are assumed at the market rather than well head. This report focuses on discoveries that are commer-cial in the oil price range of $15 to $55 dollars per barrel of crude oil in 2003 dollars. It has been our standard practice to use as the model price ceiling twice the average price during the base year chosen for technology and cost. Average crude oil prices during 2003 were just over $27 per barrel, so the ceiling price used in this study is $55 per barrel in 2003 dol-lars. During the late summer and fall of 2005, spot oil prices exceeded the high end of the price range; that is, exceeded $60 in 2005 dollars. If such prices are sustained over the long-term, new technologies would emerge that could vitiate the geologic estimate of technically recoverable resources by
5The average projected Trans-Alaska Pipeline System (TAPS) tariff for the period starting in 2014 (assumed to be the earliest time of 1002 Area develop-ment) is $3.90 per barrel and similarly, the marine transport cost is $2.23 per barrel, based on projections of the Alaska Department of Revenue (2004).
6The Niakuk field is located one to three miles offshore in Alaska state waters, but was developed entirely from onshore drilling pads. Based on the successful development of Niakuk, it is assumed that discoveries in State waters, of the entire Study Area are developed from onshore drilling pads.
Table 2. Estimates of technically recoverable crude oil based on accumulation size distributions associated with the estimates of undiscovered oil at the 95th, mean, and 5th fractile for the entire Study Area and the Federal 1002 Area. (MMBO=million of barrels of oil, BBO=billions of barrels of oil).
Entire Study Area Federal 1002 Area
Oil FieldSize class
Cumulative Oil Cumulative Oil
F95 MEAN F5 F95 MEAN F5
(MMBO) (BBO) (BBO (BBO) (BBO) (BBO) (BBO)4096-8192 0.00 0.06 0.26 0.00 0.04 0.16
2048-4096 0.03 0.64 1.92 0.06 0.45 1.49
1024-2048 0.42 2.23 4.85 0.33 1.60 3.70
512-1024 1.63 4.49 8.62 1.12 3.26 6.43
256-512 3.16 6.80 11.86 2.22 4.99 8.52
128-256 4.42 8.73 14.02 3.28 6.45 10.31
64-128 5.26 9.85 15.34 3.96 7.30 11.36
32-64 5.66 10.27 15.85 4.20 7.62 11.72
16-32 5.72 10.35 15.95 4.25 7.69 11.80
8-16 5.72 10.36 15.96 4.25 7.69 11.80
tions include full costs (including a 12 percent after-tax return on investment) of finding, developing, producing, and transporting oil to market. These func-tions are not the same as the economist’s market price-supply predictions because the industry allocates funds over a number of sources of sup-ply in order to meet market demand at lowest costs. Observed price-supply relation-ships are the outcome of supplier decisions over many projects and regions. Incremen-tal cost functions are time-independent. They are computed independently of activities in other areas. The analysis does not predict the revenue or bonus payments for leases in the 1002 Area nor does it attempt to estimate regional or national secondary economic benefits.
Acknowledgements
The author thanks Ken Bird, David Houseknecht, James Coleman, and Brenda Pierce for their reviews and suggestions that improved the description of the analysis. He also thanks Donna Foulke for her patience in putting the original manu-script in its present form.
Economic approachThe economic approach follows that of earlier stud-
ies (Attanasi, 1999; Attanasi and Schuenemeyer, 2002; and Attanasi, 2005). The size distributions of undiscovered oil accumulations for the entire Study Area (figure 2A) are used with empirically based finding rate models to forecast new discoveries as a function of successive increments of wildcat drilling. The algorithm that calculates incremental costs uses these predicted discoveries to compute quantities of resources that are commercially developable at various prices by apply-ing a standard application of the discounted cash flow analy-sis assuming an after-tax hurdle rate of return of 12 percent. The finding rate predictions drive the field development and production process models to compute (at each market price evaluated) the aggregate volume and economic value of new discoveries as well as the number of successive increments of wildcat wells that are economic.
Economic approach �

� Economics of 1998 US Geological Survey’s 1002 Area Regional Assessment: An economic update
0
2
4
6
8
10
12
14
16
Num
ber
of A
ccum
ulat
ions
8-16 16-32 32-64 64-128 128-256 256-512 512-1024 1024-2048 2048-4096 4096-8192Size, Millions of Barrels of Crude Oil95 percent mean 5 percent
20
0
2
4
6
8
10
12
14
16
Num
ber
of A
ccum
ulat
ions
8-16 16-32 32-64 64-128 128-256 256-512 512-1024 1024-2048 2048-4096 4096-8192Size, Millions of Barrels of Crude Oil95 percent mean 5 percent
A
B
Figure 2. Size-frequency distribution of the undiscovered conventional oil accumulations associated with the 95th fractile estimate, the mean estimate, and the 5th fractile estimate of the (A) entire Study Area, that is, the Federal 1002 Area, Native Lands within the 1002 Area, and the adjacent lands beneath the Alaska State waters – to the 3 mile line, and (B) Federal 1002 Area.

Economic analysis results 5
increasing play recovery factors assumed by the geologists and also by permitting commercial development of smaller accu-mulations that occur but were not assessed by the geologists.
The oil price discussed is the landed U.S. lower 48 States’ West Coast price. It also represents a sustained market price, rather than a transitory spot price. In the absence of gas markets, the well-head price of gas was assumed to be zero (non-associated gas was not considered). The price of gas liquids was assumed to be 75 percent of the oil price. Though graphs show small economic resource additions at higher prices, if prices rise substantially and rapidly, it may be unrealistic to assume that constant real costs would hold. Historical experience has shown that substantial oil and gas price increases lead to escalation in petroleum industry capital and operating costs (Kuuskraa and others, 1987).
The entire Study Area was partitioned into two sub-areas (see figures 3 and 4) from which regional pipeline costs were computed to transport oil to Pump Station 1 of the Trans-Alaska Pipeline System (TAPS). Geolo-gists allocated the assessed undiscovered resources by play (that is, the assessment rock unit) to the western and eastern economic sub-areas (see figure 3). The western economic sub-area covers about 661 thousand acres and the eastern sub-area about 1.25 million acres. At the mean oil estimate, about 79 percent of the oil in the entire Study Area was allocated to the western economic sub-area (see table 3).
Cost functions were based upon two different field development practices that are reflected in the assumed pipeline configurations to Pump Station 1 of TAPS. Sce-nario 1 assumes that discoveries are generally developed as stand-alone entities, that is, each accumulation has its own central processing facilities.7 Processed crude oil is transported from the field by feeder lines to the regional pipe-lines which transport the product to the Trans Alaska Pipeline (TAPS) Pump Station 1 (figure 3).
Scenario 2 assumes the produced fluid mixture of crude oil, water, and natural gas is transported from the produc-tion well pad to a location outside of the Federal 1002 Area for processing.8 Under Scenario 2 produced fluids from the western sub-area discoveries are transported by feeder line to a regional collector pipeline that terminates in the State land coastal area just outside of the Federal 1002 Area where the mixture is processed. Also under Scenario 2 produced fluids
7The exception to the stand-alone field development is that facility sharing is permitted for western sub-area discoveries smaller than 130 million barrels. The number of accumulations assigned to the eastern sub area made facility sharing unlikely. For details of the facilities sharing assumptions see Attanasi (2005).
8The practice tying production from well pads to a processing facility located at another accumulation is described in Nelson (2004) in relation to the development of satellite accumulations of the Alpine field. Nelson (2004) reports the Alpine field operating area (main field and satellites) covers 0.89 million acres whereas the western and eastern sub-areas considered here cover 0.66 and 1.25 million acres, respectively. Atkinson and others (2005) describe systems to monitor multi-phase flow as envisioned in Scenario 2. For example, the Mensa field, a deepwater field in the Gulf of Mexico transports its produced fluids from well head to processing a distance of 29 miles.
from the eastern sub-area are transported through feeder lines from well pads to a hypothetical regional processing facility located on Native Lands (figure 4) or alternatively to the pro-cessing facility utilized by the western sub-area discoveries. Details of the cost analysis are provided in Attanasi (2005).
Economic analysis resultsIncremental cost functions include full costs� of finding,
developing, producing, and transporting oil to market. Figure 5 shows the cost functions for the entire study area. Results for Scenario 1 (stand-alone field development) and Scenario 2 (cen-tral processing outside the Federal 1002 Area) are quite similar;
for prices greater than $40 per barrel there is no more than a two percent difference between the two sets of results. Table 4 shows the incremental cost functions for the entire Study Area and the Federal 1002 Area (from Attanasi, 2005) based on Scenario 110. For the entire Study Area at $30 per barrel 73 to 82 percent of the oil is economic to find, develop, produce, and transport to market. At $55 per barrel, the economic oil accounts for about 92 to 93 percent of the technically recover-able oil assessed.
The incremental cost functions show large potential reserve additions as prices initially increase beyond the thresh-old prices11 at which exploration is initiated because large portions of the oil associated with the mean and the 5th fractile distributions were estimated to occur in large fields (greater
9Full costs include the 12 percent after-tax hurdle rate of return on invest-ment.
10The assessed technically recoverable oil in the Federal area is about 74 per cent of the volume assessed for the entire Study Area. For prices above $36 per barrel the ratio of the volumes of economically recoverable oil for both the Federal only and entire Study Area approach the ratio of technically recover-able volumes.
11 For the entire Study Area, the threshold prices for undiscovered accumu-lation distributions associated with the 95th, 5th fractiles, and mean estimates for Scenario 1 are $19.00, $15.80, and $16.90 per barrels, respectively. The threshold prices associated with Scenario 2 are $18.90, $15.90 and $17.10, respectively.
Table 3. Allocation of oil volumes at the 95th and 5th fractile estimates and the mean to the western and eastern economic sub-areas. (BBO=billions of barrels of oil).
95th fractile mean 5th fractile(BBO) (BBO) (BBO)
Entire Study AreaWestern sub-area 4.73 8.18 12.84
Eastern sub-area 0.99 2.18 3.12
Total Area 5.72 10.36 15.96
Federal 1002 Area
Western sub-area 3.46 6.13 9.40
Eastern sub-area 0.80 1.56 2.40
Total Area 4.25 7.69 11.80

� Economics of 1998 US Geological Survey’s 1002 Area Regional Assessment: An economic update
Figure 3. Map showing the partition of the entire Study Area into western and eastern sub-areas and the hypothetical and generalized regional pipeline transport system (dashed lines from the eastern sub-area of the study area to Pump Station 1 and the double lines show the part where the eastern and western sub-area regional pipelines are parallel). Scenario 1 assumed stand-alone field develop-ment. The placement of the pipelines shown in the figure is for the purposes of cost analysis in this study and does not imply a sug-gested route for the actual system.
69° 30'
69° 45'
70° 00'
70° 15'
70° 30'
149° 00' 148° 00' 147° 00' 146° 00' 145° 00' 144° 00' 143° 00'
1 0 0 2 A R E A
A R C T I CN A T I O N A L W I L D L I F E R E F U G E
B E A U F O R T S E A
Western Sub-area
Eastern Sub-area
0 10 20 30
0 10 3020
MILES
KILOMETERS
Approximate location of3-mile boundary
between State andFederal jurisdiction
Camden Bay
Native lands
Figure 4. Map showing the partition of the entire Study Area into western and eastern sub-areas and the hypothetical and general-ized regional pipeline transport system from the Federal portions of sub-areas to processing facility areas and then to Pump Station 1 near Prudhoe Bay. Scenario 2 central processing areas are shaded gray. The placement of the pipelines shown in the figure is for the purposes of cost analysis in this study and does not imply a suggested route for the actual system.

Conclusions and limitations �
than 500 million barrels, see Table 2). It is typical that as exploration proceeds in new areas (or plays) the oil discovered per wildcat well declines rather rapidly after the initial incre-ments of wildcat drilling are completed as the larger (low cost) discoveries are depleted and the search process focuses on the smaller accumulations that require higher costs to discover and produce (Adelman and others, 1983).
If the results of this study are compared with the earlier analysis (Attanasi and Schuenemeyer, 2002), the base year 1996 dollars used for that study should be adjusted to 2003 dollars, so the economic resources can be compared in con-stant dollars. Based on the general producer price indices, the 1996 dollars are multiplied by a factor of 1.0812 to obtain their equivalence in 2003 dollars. Figure 6 shows the incremental cost functions associated with the size frequency distribution for the mean estimate of technically recoverable oil. Compar-ing economic oil volumes at $30 per barrel in 2003 dollars ($27.78 in 1996 dollars) the earlier study had about 8.59 BBO and this study 8.27 BBO. However, at prices above $36 per
12Producer price index, 1982 equals 100, is 127.7 and for 2003 the producer price index is 138.1
barrel, the incremental cost function based on the newer tech-nology of horizontal drilling permits discoveries in the smaller size classes to become commercial at a lower market price than the older technology even though North Slope costs had increased from the 1996 through 2003 in constant dollars. In summary, the estimates of economically recoverable oil shown in table 4 are generally within 10 percent of the estimates published in the earlier analyses when the 1996 dollars are adjusted to 2003 dollars (Attanasi, 1999; Attanasi and Schuen-emeyer, 2002), suggesting that improvements in productiv-ity have to a large extent offset increased costs that occurred between the 1996 and 2003 base years.
Conclusions and limitationsThe 1998 U.S. Geological Survey resource assessment of
the entire Study Area and Federal 1002 Area assigned most of the undiscovered oil to accumulations of the larger field size classes (table 2). Within a particular area, large accumulations
05
101520253035404550556065
0 2 4 6 8 10 12 14 16Billions of Barrels of Oil
Mar
ketp
rice,
dolla
rspe
rbar
rel
Stand-alone (Scenario 1) Processing Outside Federal 1002 Area (Scenario 2)
95th fractile 5th fractileMean
5.72
BB
O
10.3
6B
BO
15.9
6B
BO
Figure 5. Incremental costs, in dollars per barrel, of finding, developing, producing and transporting crude oil from undis-covered accumulations in the entire Study Area. Computations were based on discoveries developed (1) predominantly as stand-alone fields, each with processing facilities, (Scenario 1, figure 3) and (2) where production fluids are transported to two central processing facilities located outside of the Federal 1002 Area (Scenario 2, figure 4). Vertical lines represent the technically recoverable oil for the entire Study Area as reported in Bird (1999). The dollar values have a 2003 base year. (BBO=billions of barrels of oil).

8 Economics of 1998 US Geological Survey’s 1002 Area Regional Assessment: An economic update
Table 4. Volumes of oil and natural gas liquids (NGL) from undiscovered oil accumulations, located in the entire Study Area and the Federal 1002 Area, available as a function of market prices that offset costs of finding, developing, producing, and transporting oil and natural gas liquids to market, Scenario 1- stand-alone development, 2003 dollars (BBO=billions of barrels oil, BBL= billions of barrels of NGL, zero is less than 0.005, blank indicates zero).
Entire Study Area Federal 1002 Area95th fractile Mean 5th fractile 95th fractile Mean 5th fractile
Sub-Area $/bbl
OilBBO)
NGL (BBL)
Oil(BBO
NGL (BBL)
Oil BBO)
NGL (BBL)
Oil(BBO)
NGL(BBL)
OilBBO)
NGL (BBL)
Oil(BBO)
NGL(BBL)
Western sub-area
18 2.24 0.01 5.29 0.01 1.40 0.00 3.14 0.0121 1.53 0.00 3.98 0.01 7.49 0.02 0.75 0.00 2.66 0.01 5.10 0.0224 2.55 0.01 5.58 0.04 9.62 0.06 1.51 0.01 4.01 0.03 6.72 0.0627 3.15 0.03 6.38 0.09 10.25 0.09 2.23 0.03 4.54 0.05 7.31 0.0830 3.72 0.07 6.91 0.11 11.07 0.14 2.64 0.06 5.06 0.08 7.95 0.1233 3.99 0.09 7.22 0.13 11.34 0.15 2.83 0.07 5.32 0.10 8.16 0.1336 4.11 0.09 7.33 0.13 11.58 0.16 3.00 0.08 5.42 0.10 8.26 0.1439 4.34 0.11 7.51 0.14 11.69 0.17 3.05 0.08 5.55 0.11 8.45 0.1542 4.39 0.11 7.60 0.15 11.79 0.18 3.15 0.09 5.66 0.12 8.54 0.1545 4.45 0.11 7.66 0.15 11.85 0.18 3.18 0.09 5.69 0.12 8.57 0.1548 4.47 0.11 7.68 0.15 11.87 0.18 3.20 0.09 5.71 0.12 8.63 0.1551 4.52 0.12 7.73 0.15 11.90 0.18 3.24 0.09 5.75 0.12 8.65 0.1554 4.55 0.12 7.76 0.15 11.95 0.18 3.26 0.09 5.78 0.12 8.67 0.1655 4.55 0.12 7.76 0.15 11.95 0.18 3.26 0.09 5.78 0.12 8.70 0.16
Eastern sub-area
1821 0.24 0.00 1.22 0.00 0.85 0.0024 1.01 0.00 1.73 0.00 0.70 0.00 1.34 0.0027 0.12 0.00 1.23 0.00 1.96 0.00 0.10 0.00 0.90 0.00 1.67 0.0130 0.45 0.00 1.36 0.00 2.11 0.01 0.34 0.00 1.01 0.00 1.74 0.0133 0.50 0.00 1.52 0.01 2.25 0.01 0.39 0.00 1.05 0.00 1.85 0.0136 0.58 0.00 1.71 0.01 2.35 0.02 0.47 0.00 1.19 0.01 1.89 0.0139 0.62 0.00 1.76 0.02 2.52 0.02 0.50 0.00 1.23 0.01 1.92 0.0142 0.67 0.00 1.81 0.02 2.61 0.03 0.53 0.00 1.26 0.01 1.96 0.0145 0.74 0.01 1.85 0.02 2.65 0.03 0.56 0.00 1.29 0.01 2.00 0.0148 0.77 0.01 1.89 0.02 2.67 0.03 0.59 0.00 1.32 0.01 2.03 0.0151 0.79 0.01 1.91 0.02 2.68 0.03 0.62 0.00 1.34 0.01 2.03 0.0154 0.81 0.01 1.93 0.02 2.70 0.03 0.64 0.00 1.34 0.01 2.04 0.0155 0.82 0.01 1.93 0.02 2.70 0.03 0.64 0.00 1.36 0.01 2.04 0.01
Entire Study Area
18 2.24 0.01 5.29 0.01 1.40 0.00 3.14 0.0121 1.53 0.00 4.22 0.01 8.70 0.02 0.75 0.00 2.66 0.01 5.95 0.0224 2.55 0.01 6.59 0.05 11.35 0.07 1.51 0.01 4.72 0.03 8.06 0.0627 3.27 0.03 7.61 0.09 12.21 0.09 2.33 0.03 5.43 0.06 8.98 0.0930 4.17 0.07 8.27 0.11 13.18 0.15 2.98 0.06 6.07 0.09 9.69 0.1333 4.49 0.09 8.74 0.13 13.59 0.17 3.22 0.07 6.37 0.10 10.01 0.1436 4.69 0.09 9.04 0.14 13.93 0.18 3.47 0.08 6.60 0.11 10.15 0.1439 4.95 0.11 9.28 0.15 14.21 0.19 3.55 0.08 6.77 0.11 10.38 0.1542 5.06 0.11 9.41 0.16 14.40 0.20 3.67 0.09 6.92 0.12 10.50 0.1645 5.19 0.12 9.51 0.17 14.50 0.21 3.74 0.09 6.97 0.12 10.58 0.1648 5.24 0.12 9.57 0.17 14.55 0.21 3.80 0.09 7.03 0.13 10.65 0.1651 5.31 0.12 9.64 0.17 14.57 0.21 3.86 0.09 7.09 0.13 10.68 0.1654 5.35 0.12 9.69 0.18 14.65 0.21 3.90 0.10 7.12 0.13 10.71 0.1755 5.37 0.12 9.70 0.18 14.65 0.21 3.90 0.10 7.14 0.13 10.74 0.17

05
101520253035404550556065
0 2 4 6 8 10 12
Mar
ketp
rice,
dolla
rspe
rbar
rel
2005 Report (2003$) 2002 Report (2003$)
Billions of Barrels of Oil
10.3
6B
BO
are typically less costly to find and develop than smaller fields. As a consequence, the incremental cost functions show that at $30 per barrel 73 to 82 percent of the assessed undiscovered technically recoverable oil can be found, developed, and pro-duced. At $55 per barrel the economic oil accounts for more than 90 percent of the oil assessed, that is between 5.37 BBO and 11.65 BBO. Further, the results reported here are within 10 percent of the economic estimates reported in Attanasi and Scheunemeyer (2002) when those previous results are adjusted to 2003 dollars.
The results are influenced by several sources of uncer-tainty. Primary among these is the uncertainty in assess-ing undiscovered resources in frontier areas with sparse
Figure 6. Incremental costs, in dollars per barrel, of finding, developing, producing, and transporting crude oil from undiscov-ered accumulations in the entire Study Area, where computations are based on the undiscovered accumulation size distribution associated with the mean estimate and stand-alone field development (Scenario 1). The incremental costs of the 2005 Report are based on costs and technology updated to the 2003 base year and are compared to an earlier analysis published in Attanasi and Schuenemeyer (2002) after adjustment to 2003 dollars. Vertical line represents the mean estimate of the technically recoverable oil for the entire Study Area in Bird (1999). (BBO=billions of barrels of oil).
geologic data (U.S. Geological Survey ANWR Assessment Team, 1999). The uncertainty expressed in the distribution of undiscovered resources may not be resolved until there is a systematic subsurface evaluation. In addition, the produc-tion efficiency and the cost impacts of innovative develop-ment procedures implemented in the last decade are not yet fully known nor well documented in the public domain. The incomplete economic and engineering data available in the public domain required the use of numerous assumptions in preparing the economic analysis, and the uncertainty associ-ated with those assumptions has not been quantified. Conse-quently, any use of the results of this analysis should clearly convey the associated inherent uncertainties.
Conclusions and limitations 9

10 Economics of 1998 US Geological Survey’s 1002 Area Regional Assessment: An economic update
References
Adelman, M. A, Houghton, J.C., Kaufman, G. M., and Zimmerman, M.B, 1983, Energy resources in an uncertain future: Ball-inger Publishing Co., Cambridge, Mass., 434 p.
Alaska Department of Revenue, 2004, Fall 2004 revenue source book: Anchorage, Alaska.
Atkinson I., Theuvey B., Conort G., Lowe T., McDiarmid A., Mehdizabdeh P., Pinquet B., Smith G., and Williamson, K. J., 2005, A new horizon multiphase flow measurement: Oilfield Review, v.16, no. 14.Winter, 2004/2005, p. 52-63.
Attanasi, E. D., 1999, Economics of undiscovered oil in the 1002 Area of the Arctic National Wildlife Refuge, Chapter EA, in The Oil and Gas Resource Potential of the Arctic National Wildlife Refuge 1002 Area, Alaska: U.S. Geological Survey Open-File Report 98-34. CD-ROM.
Attanasi, E. D., 2005, Undiscovered oil resources in the Federal portion of the 1002 Area of the Arctic National Wildlife Refuge: an economic update: U. S. Geological Survey Open-File Report 2005-1217, 29 p.
Attanasi, E. D. and Schuenemeyer, J. H., 2002, Frontier areas and resource assessment: the Case of the 1002 Area of the Alaska North Slope: U.S. Geological Survey Open-File Report 02-119, 21 p.
Bird, K. J., 1999, Assessment overview, in The oil and gas resource potential of the 1002 Area, Arctic National Wildlife Refuge, Alaska: U.S. Geological Survey Open-File Report 98-34. CD-ROM.
Kuuskraa, V. A., Morra, F. Jr., and Godec, M.L., 1987, Importance of cost/price relationships for least-cost oil and gas resources: Society of Petroleum Engineers Paper 16290, Proceedings of 1987 Hydrocarbon Economics and Evaluation Symposium, Dal-las, Texas, p. 25-42.
Nelson, K., 2004, Alternatives to Alpine satellite project proposed, Petroleum News Alaska, January 28, p. 1, 12-13.
Schuenemeyer, J. H., 1999, Methodology, Chapter ME, in The Oil and Gas Resource Potential of the 1002 Area, Arctic National Wildlife Refuge, Alaska: U.S. Geological Survey Open-File Report 98-34. CD-ROM.
U.S. Geological Survey ANWR Assessment Team, 1999, The Oil and Gas Resource Potential of the 1002 Area, Arctic National Wildlife Refuge, Alaska: U.S. Geological Survey Open-File Report 98-34. CD-ROM.