u.s. department of commerce fiscal year 2008 annual occupational safety and health...
TRANSCRIPT

U
T
.S. DEPARTMENT OF COMMERCE FISCAL YEAR 2008
ANNUAL OCCUPATIONAL SAFETY AND HEALTH REPORT O THE DEPARTMENT OF LABOR
U.S. Department of Commerce 1401 Constitution Ave., N.W.
Washington, D.C. 20230
U.S. Department Of Commerce Fiscal Year 2008
Annual Occupational Safety and Health (OSH) Report to the Department Of Labor
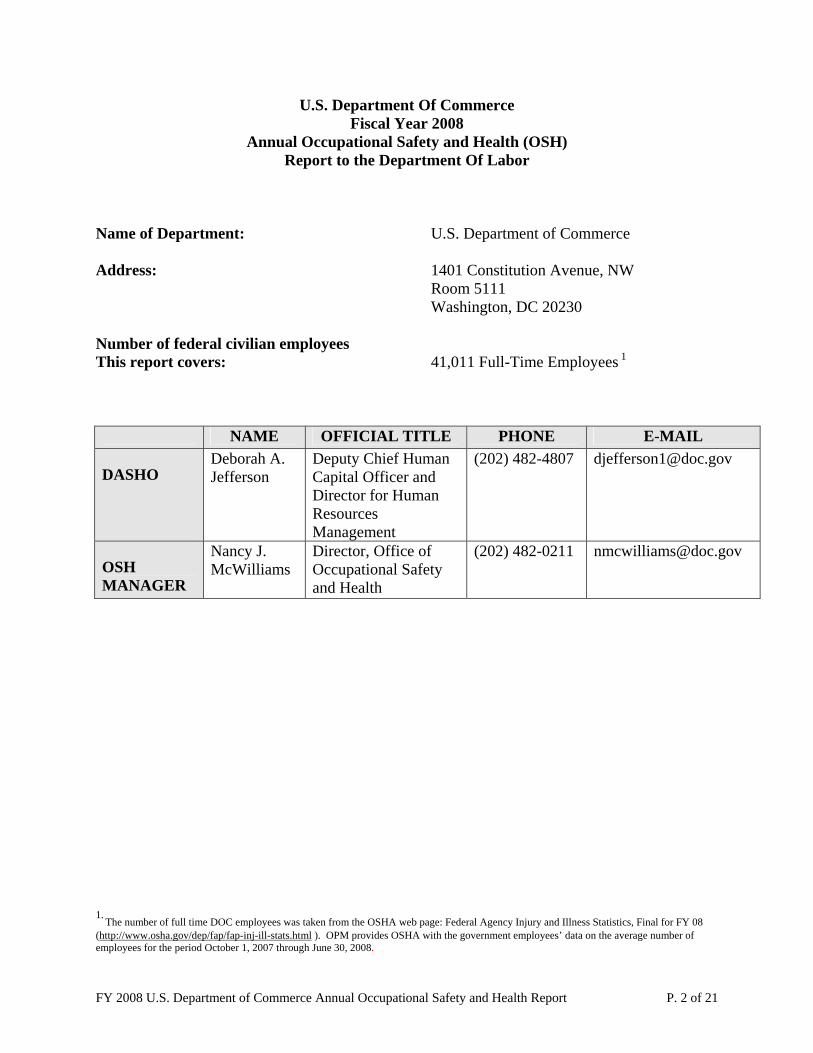
Name of Department: U.S. Department of Commerce Address: 1401 Constitution Avenue, NW
Room 5111 Washington, DC 20230
Number of federal civilian employees This report covers: 41,011 Full-Time Employees 1
NAME OFFICIAL TITLE PHONE E-MAIL
DASHO Deborah A. Jefferson
Deputy Chief Human Capital Officer and Director for Human Resources Management
(202) 482-4807 [email protected]
OSH MANAGER
Nancy J. McWilliams
Director, Office of Occupational Safety and Health
(202) 482-0211 [email protected]
1. The number of full time DOC employees was taken from the OSHA web page: Federal Agency Injury and Illness Statistics, Final for FY 08 (http://www.osha.gov/dep/fap/fap-inj-ill-stats.html ). OPM provides OSHA with the government employees’ data on the average number of employees for the period October 1, 2007 through June 30, 2008.
FY 2008 U.S. Department of Commerce Annual Occupational Safety and Health Report P. 2 of 21
U.S. Department Of Commerce Fiscal Year 2008
Annual Occupational Safety and Health (OSH) Report to the Department Of Labor
EXECUTIVE SUMMARY
The mission of the Department is to foster, serve, and promote the Nation's economic development and technological advancement. The Department’s 41,011 employees perform their work in the following bureaus:
Bureau of Industry and Security (BIS) Economic Development Administration (EDA) Economics and Statistics Administration (ESA)
Bureau of the Census (Census) Bureau of Economic Analysis (BEA)
International Trade Administration (ITA) Minority Business Development Agency (MBDA) National Institute of Standards and Technology (NIST) National Oceanic and Atmospheric Administration (NOAA) National Telecommunications and Information Administration (NTIA) National Technical Information Service (NTIS) Office of Inspector General (OIG) Office of the Secretary (OS) Patent and Trademark Office (PTO)
STATISTICS SUMMARY
Injury and Illness Trends In FY 2008 the number of Commerce employees increased 3% with a corresponding 3.5% increase in the Total Cases of injuries and illnesses but no increase in the Total Case Rate when compared with FY 2007. We experienced a 7.5% increase in the Lost Time Cases (injuries and illnesses involving days away from work) and a 4% increase in the Lost Time Case Rate. The chart on page 9 shows that Falls represent 31% of our cases, Struck by Injuries account for 23.6% and Exertions/Strains represent 23.3%. The Department met all four SHARE goals in FY 2008 (described in detail in this report), and will develop even more aggressive strategies for FY 2009 to reduce the total number of injuries and to bring employees back to work as soon as they are medically able following an injury. The Department recently hired a Workers’ Compensation Program Manager who will work with the bureaus to improve all of our SHARE results. Three of our bureaus had significant success this year implementing workers’ compensation program strategies. For example, Census was successful in bringing three injured employees on the long-term rolls back to work with a total future cost savings of $1,270,978. Two other employees were placed in jobs in the private sector with a total cost savings of $1,151,423.
FY 2008 U.S. Department of Commerce Annual Occupational Safety and Health Report P. 3 of 21

NOAA was able to return an employee to work after being out of work for a few months and they successfully had the Department of Labor deny six workers' compensation claims by providing documentation that challenged the claims. ITA was successful in getting a questionable claim and its appeal denied. The Department’s workers’ compensation chargeback costs for chargeback year (CY) 2008 showed a slight decrease ($22,703) compared with CY 2007. This is significant considering the $588,929 increase in CY 2007 and the $537,997 increase in CY 2006. We are working to prevent new claims but currently we have over 600 claims on the long term workers’ compensation rolls, which account for approximately 75% of our chargeback costs.
Fatalities and Catastrophic Accidents The Department had no employee fatalities or catastrophic accidents this year involving the hospitalization of three or more employees. In March 2008, a state of Florida employee died during an underwater dive in the Gulf of Mexico, using the platform of a NOAA vessel. The investigation is complete and corrective measures are approximately 50% completed.
Emergency Response and Disaster Recovery Operation The Department does not have any emergency response and/or disaster recovery missions.
OCCUPATIONAL SAFETY AND HEALTH (OSH) INITIATIVES
Safety, Health and Return-to-Employment (SHARE) Initiative - The Department was one of only six major Federal departments that achieved all four of its 2008 SHARE (Safety, Health, and Return to Employment) goals. The SHARE initiative was launched in FY 2004 with the purpose of reducing occupational injuries, illnesses and fatalities within the Federal government. The goals and results are explained in detail in the body of this report.
Motor Vehicle/Seat Belt Safety - In FY 2008 motor vehicle accidents increased 20% to 127 and the number of resulting injuries increased 50% to 30. The increase in numbers may have been due in part to renewed reporting requirements at Census, NIST, and NOAA. These three largest bureaus represent approximately 96% of the FY 2008 vehicle accidents. The Department continues to emphasize safe driving requirements and the mandatory use of seat belts in government owned vehicles and personally owned vehicles during government-sponsored activities.
Employee Support - The Department and its bureaus conducted safety and health training for a variety of audiences: collateral duty safety officers; new employees; new supervisors; and managers. Our bureaus also participate in or sponsor safety and health fairs as well as wellness education and health screenings. These events have excellent employee support. Participating in these events introduces our employees to new ways they can take responsibility for their health and safety in the workplace and at home.
Accomplishments and Goals - One of our FY 2009 Department-wide goals is to improve our SHARE results, because although we met all four FY 2008 SHARE goals, we recognize there is room for improvement. The Department’s Office of Occupational Safety and Health is
FY 2008 U.S. Department of Commerce Annual Occupational Safety and Health Report P. 4 of 21

working with the bureaus to develop and implement specific strategies to reduce new injuries and to reduce the amount of lost work time by returning employees to work as soon as they are medically able. [One FY 2009 initiative to prevent accidents and injuries is to train our bureau Safety and Workers’ Compensation Coordinators in accident reporting and investigation.] The purpose is twofold: to give coordinators the tools to train their employees to improve accident reporting timeliness (SHARE Goal #3); and to learn how to investigate accidents to determine the causes so they can implement actions to prevent similar accidents from recurring (SHARE Goal #1). Department-wide accomplishments to improve safety performance include holding two Department-wide Safety Council meetings that showcased bureau safety and workers’ compensation success stories. We also revised our safety management program evaluation process and have conducted a management evaluation of one bureau’s safety program. We continued our monthly Safety and Workers’ Compensation Coordinators meetings that included training on OSHA reporting and recordkeeping, an introduction to workers’ compensation, how to conduct and ergonomic assessment, and how to conduct office inspections.
FY 2008 U.S. Department of Commerce Annual Occupational Safety and Health Report P. 5 of 21

U.S. Department Of Commerce Fiscal Year 2008
Annual Occupational Safety and Health (OSH) Report to the Department Of Labor
DETAILED REPORT
I. Statistics
A. Injury and Illness Statistics
a. Injury and Illness Rates In FY 2008 the number of Department employees increased 3% and we had a corresponding 3.5% increase in the number of Total Cases of injuries and illnesses. The Total Case Rate for FY 2008 was the same as FY 2007. Lost Time Cases (injuries and illnesses involving days away from work) increased 7.5% and the Lost Time Case Rate increased 4%. So, although we met our SHARE goals, our results are not improving. The positive news is that the Department’s workers’ compensation chargeback costs for chargeback year (CY) 2008 showed a slight decrease of $22,703 compared with CY 2007, which is significant considering the $588,929 increase in CY 2007 and the $537,997 increase in 2006.
Number of Federal Cseasonal, intermittentTotal Cases Injury/Il(number of injury/illnefatalities) Total Case Rate (Fro(rate of all injury/illnes
Lost Time Cases (Fr(number of cases invo
Lost Time Case Rate(rate of only the injuryemployees) Lost Work Days (No(number of days awaLost Work Day Rate(rate of lost work days
2. The DOC injury and illnesFY 08 (http://www.osha.gov
FY 2008 U.S. Departm
Injury and Illness Statistics
FY 2007 FY 2008 2 % Change ( ) indicates
decrease ivilian Employees (including full-time, part-time,
workers) 39,948 41,162 3.0
lness (From OSHA) ss cases—no lost-time, first aid, lost-time and
423 438 3.5
m OSHA) s cases per 100 employees)
1.06 1.06 0
om OSHA) lving days away from work)
201 216 7.5
(From OSHA) /illness cases with days away from work per 100
0.5 0.52 4.0
t available) y from work)
N/A N/A N/A
(from SHARE data) 14.5 16.6 1.5
per 100 employees)s statistics for FY 2008 was taken from the OSHA web page: Federal Agency Injury and Illness Statistics, Final for /dep/fap/fap-inj-ill-stats.html ).
ent of Commerce Annual Occupational Safety and Health Report P. 6 of 21

OSHA requires the following information to be included in this report.
EMERGENCY RESPONSE AND DISASTER RECOVERY FY 2007
FY 2008
% Change
Number of Federal Civilian Employees that Perform Emergency Response and Disaster Recovery Operation, including full-time, part-time, seasonal, intermittent workers
N/A N/A N/A
Number of Supervised Contractors that Perform Emergency response and Disaster Recovery Operation, including full-time, part-time, seasonal, intermittent workers
N/A N/A N/A
Number of Volunteers that Perform Emergency response and Disaster Recovery Operation, including full-time, part-time, seasonal, intermittent workers
N/A N/A N/A
Total Cases Injury/Illness Cases related to Emergency Response and Disaster recovery Operations (number of injury/illness cases—no lost-time, first aid, lost-time and fatalities)
N/A N/A N/A
Lost Time Cases Related to Emergency Response and Disaster recovery Operations (number of cases involving days away from work)
N/A N/A N/A
Lost Work Days Related to Emergency response and Disaster recovery Operation (number of days away from work)
N/A N/A N/A
b. Emergency Response and Disaster Recovery Operation. The Department has no emergency response and recovery mission.
c. Facilities with high injury and illness rates Three of our largest bureaus (Census, NIST, and NOAA) account for approximately 95% of the Department’s injuries. NOAA In FY 2008 NOAA experienced 146 OSHA recordable injuries of which 69 involved days away from work. NOAA’s 2008 workers’ compensation chargeback costs were $6.2 million, of which only $557,000 was for new claims that occurred in FY 2008. The remaining balance was from the 200 employees on long term workers’ compensation disability. NOAA logs each incident into a web-based system that tracks injuries by facility. Facilities with high rates are targeted with increased attention by the NOAA Line Office management and possible inclusion in future safety assessments.
B. Fatalities and Catastrophic Incidents
There were no Department employee fatalities or catastrophic events involving the hospitalization of three or more employees this year. The Department did have a serious incident at its NIST Boulder, CO laboratories that involved no injuries. On June 9, 2008 a NIST guest researcher discovered that a sealed vial being used in an experiment, containing approximately 0.53 grams (0.018 ounces) in powdered form of radioactive “plutonium sulfate tetrahydrate,” had cracked and some particles had spilled from the vial. The laboratory room and an adjacent laboratory were immediately isolated and secured. Twenty-two NIST staff members and associates who were working in or near the laboratory were immediately checked out for any radiation exposure. According to dose analyses and lifetime risk estimates received from radiation health physicians and experts, the NIST personnel exposed to the plutonium as a result of this incident are not expected to suffer any clinically significant impact to either their
FY 2008 U.S. Department of Commerce Annual Occupational Safety and Health Report P. 7 of 21

short-or long-term health. Studies and investigations by the Department of Energy (DOE), Nuclear Regulatory Commission (NRC), and the NIST Blue Ribbon Commission found that a failure in the NIST safety management system is the most probable cause of the incident. The studies further recommend that NIST strengthen its “safety culture.” NIST senior management has begun implementing strategies to address this.
Fatality and Catastrophic Accident Investigations NOAA reported in March 2008 the death of a State of Florida (FL) diver. The FL state employee perished during a dive in the Gulf of Mexico, using the platform of a NOAA vessel. The investigation is complete and corrective measures are approximately 50% completed.
C. Office of Workers’ Compensation Programs Costs The Department’s workers’ compensation chargeback costs for chargeback year (CY) 2008 showed a slight decrease ($22,703) compared with CY 2007. While small, this is significant considering the $588,929 increase in CY 2007 and the $537,997 increase in CY 2006. The bureaus continue to work diligently to assess the return-to-work potential of injured employees so they can be brought back to work as soon as medically able.
Continuation of Pay (COPwork following a work-redecrease may be due to re
Workers' CompensatiOrganization
Census Decennial Census
BEA
BIS
EDA ESA
ITA
MBDA
NIST
NOAA NTIA NTIS OIG OS USPTO Chargeback Total
Continuation Of Pay (COP) To
Total Workers' Compensation
FY 2008 U.S. Department of Commerce
U.S. Department of Commerce on Chargeback Costs by Chargeback Year (7/1 - 6/30)
2005 2006 2007 2008 $ 3,489,811 $ 3,593,900 $ 3,545,930 $ 3,917,622
2,103,739 1,998,341 1,977,838 1,866,280
0 0 157 34,841
115,941 178,961 233,229 212,902
111,104 130,428 103,135 108,009
825 0 0 0
732,531 766,197 687,510 631,864
237,735 229,030 224,818 263,028
898,857 794,803 782,069 849,213
5,457,684 5,769,224 6,320,239 6,100,913 179,942 118,377 122,001 166,635
49,595 51,740 53,270 77,805 172,405 165,895 104,586 51,629 365,567 535,394 576,969 606,713 577,714 699,156 885,625 710,219
$ 14,493,450 15,031,447 $ 15,620,376 $15,597,673
tal unavailable unavailable $ 300,369 $272,625
Cost $ 14,493,450 $ 15,031,447 $ 15,920,745 $15,870,298
) is paid to employees during the first 45 days they cannot lated injury. COP costs decreased 9.2% in CY 2008. The turn to work efforts, but it may also be due to inaccurate CY
Annual Occupational Safety and Health Report P. 8 of 21

2007 data. We obtain COP data from the National Finance Center quarterly but their system does not allow us to go back to previous years to confirm the data. D. Significant Trends and Major Causes or Sources of Lost Time Disabilities a. Tracking Accidents
The Department tracks and trends injuries and illnesses using data from our workers’ compensation contractor’s database.
New Indemn
Injury Type / Bureau
Unknown 100 - Struck
110 - Struck By 111 - Stuck By Falling
Object 120 - Struck Against
210 - Fell - Same Level 220 - Fell - Different Level 230 - Slipped - No Fall 330 - Caught Between
400 - Punctured, Lacerated
510 - Contacted With 520 - Contacted By 600 - Exerted 610 - Lifted, Strained By Single Action 620 - Stressed By Repeated Action 700 - Exposed 730 - Absorbed 999 - Insufficient Data Total Percent of Total
b. ContrThe 432008. Injurieinjurieand Illfrom w
FY 2008 U.S. Depart
DOC Workers' Compensation Claims by Bureau and Injury Type ity and Medical Only Claims (Includes OSHA Recordable and Non-Recordable)
10/1/07 - 9/30/08
UNK BIS Census ESA ITA MBDA NIST NOAA NTIA OIG OS Total Percent
of Total
0 0 0 1 0 0 0 1 0 0 0 2 0.5% 0 0 6 0 0 0 3 3 0 0 0 12 2.8% 1 0 22 0 2 0 4 4 0 0 1 34 7.8%
0 1 7 0 2 0 5 14 1 0 1 31 7.1% 0 1 8 0 1 0 5 9 0 0 2 26 6% 0 1 37 0 1 0 2 16 0 1 1 59 13.5% 0 0 24 0 1 0 0 13 0 0 0 38 8.7% 0 0 23 1 1 0 0 14 0 0 0 39 8.9% 0 0 4 0 0 0 1 3 0 0 0 8 1.8%
0 0 23 0 0 0 0 8 0 0 0 31 7.1%
0 0 1 0 0 0 0 0 0 0 0 1 0% 0 0 1 0 0 0 1 3 0 0 0 5 1.1% 0 0 15 0 0 1 2 24 1 0 1 44 10.1%
0 0 13 0 0 0 4 22 0 0 0 39 8.9%
0 0 13 0 0 0 2 4 0 0 0 19 4.3% 0 0 5 0 0 0 2 5 0 0 0 12 2.8% 0 0 0 0 0 0 1 0 0 0 0 1 0% 0 1 17 0 2 0 0 15 0 0 1 36 8.2% 1 4 219 2 10 1 32 158 2 1 7 437 0 0.9% 50% 0.5% 2.3% 0 7.3% 36.2% 0.5% 0 1.6%
olling Trends 7 total injuries above represent all the new claims that were submitted in FY
The chart above illustrates that Falls represent 31% of our cases, Struck by s account for 23.6% and Exertions/Strains represent 23.3%. Of these 437 s, only 331 met the criteria to be recorded on our OSHA 300 Log of Injuries nesses. And of those 331, approximately 50% (165/331) involved days away ork, which is the same as FY 2007.
ment of Commerce Annual Occupational Safety and Health Report P. 9 of 21
The Department continues its aggressive return-to-work program to bring employees back to work as soon as they are medically able. Our two largest bureaus, Census and NOAA, had significant success returning employees to work. Specific actions the bureaus are taking:
CENSUS – In FY 2008 Slips, Trips and Falls accounted for 29% of all injuries; bitten-by represent 10% and Struck-By 9%, with the remainder being grouped under miscellaneous. Census had 22 Dog Bite injuries (6.7%) and anticipates that Dog Bites and Falls will increase as the decennial ramps-up into full gear over the next two years. NIST – In FY 2008 Strains and Sprains represented 33% of all injuries; Cuts and Lacerations were 29%; and multiple injuries including fractures and contusions were 29%. While NIST is primarily a scientific laboratory operation, the majority of injuries come from maintaining a large laboratory complex, not from the laboratories operations. NOAA – In FY 2008 sprains and strains represented 25% of all injuries; slips, trips and falls were 24%; struck-by incidents were 22%; and vehicle accidents were 12%. Sprains and strains from material handling were the major cause of these injuries. Emphasis on pre-planning and risk management have reduced new incidents but 33% of all accidents are the result of material handling. Falls continue to be an issue especially for persons with inappropriate footwear. There is no mandatory footwear policy and local administrative actions to correct this issue have been recommended. The three-year cycle of training at the Federal Law Enforcement Training Center (FLETC) resulted in a 300% increase in incidents in the NOAA Office of Law Enforcement. NOAA has approximately 150 officers, 47 of whom experienced an accident in FY 2008, with 28 of those at FLETC. The Office of Occupational Safety and Health has requested an action plan from NOAA’s Safety Office showing how it plans to improve this record. Larger NOAA ships have four times the incidents compared to land based work settings. While ship board work is inherently more dangerous than land-based work, these high numbers are also due to an abnormally high turnover rate, failure to properly train new employees, and failure to provide adequate personal protective equipment and enforce its use. In FY 2009, NOAA will assess how to improve the safety program for at sea marine operations, probably adding collateral duty personnel aboard every ship.
FY 2008 U.S. Department of Commerce Annual Occupational Safety and Health Report P. 10 of 21

E. Contract Workers and Volunteers The Department does not track the work-related injuries and illness of contract employees. It is the policy of the Department and all bureaus to investigate all incidents, regardless of who is involved and to obtain, at a minimum, the information required on the OSHA Form 301 Injury and Illness report. Our larger bureaus track contractor injuries and illness.
NOAA - NOAA uses over 5,000 contractors and volunteers nationwide and on NOAA ocean-going vessels worldwide. For FY 2008, 75 contractor/volunteer incidents occurred, including one diving fatality. The great majority of contractor incidents were minor in nature. All contractors are encouraged to attend free NOAA safety classes and several NOAA line offices are mandating contractor safety training in their contracts.
II. OSH Initiatives - SHARE, Motor Vehicle and Seat Belt Safety, Recordkeeping, Workplace Violence, and Establishments A. SHARE—Safety, Health, and Return-to-Employment Initiative
a. SHARE Analysis The Department of Commerce was one of only six major federal departments that achieved all four of its 2008 SHARE goals.
2008 DEPACOM
SHAREGoal 1: Total CaReduce total injurates by 3% per yGoal 2: Lost Tim(LTCR) Reduce lost timecase rates by 3%Goal 3: Timely F(TFC) Increase the timeand illness claimsGoal 4: Lost Pro(LPD) Reduce the rate odays due to injuryper year.
Notes: Day RatRate. Tdays pegoal wil b. SH
SHof
FY 2008 U.S. De
RTMENT OF MERCE RESULTS
FY04 BASELINE
FY05 RESULTS
FY06 RESULTS
FY07 RESULTS
FY08 TARGET
FY08
RESULTS
se Rates (TCR) ry and illness case ear. 1.39 1.23 1.17 1.08 1.25 1.06 e Case Rates
injury and illness per year. 0.6 0.57 0.64 0.53 0.6 0.52 iling of Claims
ly filing of injury by 5% per year. 40% 53.5% 53% 52.2% 55% 63.5% duction Day Rate
f lost production and illness by 1%
20.8 20.6 22.8 14.5 20.4 16.6
The rates for Goals 1, 2, and 4 are per 100 employees. For example, in Goal 4, the Lost Production e is the number of lost work days per 100 employees per year. Under Goal 4, Lost Production Day he goal is to reduce the LPD rate by 1% per year, except that no such target will be set below 15 r 100 employees. Our FY06 results were 22.8 lost production days per 100 employees. Our FY08 l be 20.8.
ARE Programs/Initiatives ARE Goal # 3 is to improve the timeliness of reporting injuries to the Department Labor. Currently the Department submits about 63% of its claims within the 14
partment of Commerce Annual Occupational Safety and Health Report P. 11 of 21

day criteria. This number should be increased. One way to reduce workers’ compensation costs is to ensure that reports are filed quickly so that actions can be taken to ensure employees receive appropriate medical care and to return them to work as soon as possible. To improve our reporting timeliness, the Department revised DAO 209-3, Injury Reporting and Investigation, to more clearly define reporting requirements. This revised DAO is scheduled for release in 2nd quarter FY 2009. In addition, 75 supervisors Department-wide were trained this past year in safety and workers’ compensation, which included emphasis on prompt reporting of injuries and accurate completion of reporting forms. CENSUS - The Census Safety Office increased its workforce from a two to seven-person staff to expand management of its workers’ compensation program to support the bureau’s 2010 Decennial Census. The Safety Office successfully initiated an aggressive return-to-work program, offered workers compensation and safety training to all Census employees, and provided training to injured employees returning to work. Additional training topics included defensive driving, seat belt usage and avoiding aggressive dogs. Census believes its approach contributed significantly to the 20% decrease in Census motor vehicle accidents in FY 2008. ITA - The International Trade Administration (ITA) includes motor vehicle safety in its Operations Manual and trains employees before they are permitted to operate a government vehicle. BIS - The Bureau of Industry and Security (BIS) conducted random safety checks to ensure offices were in compliance with OSHA regulations. Field agents were briefed and trained on weapons handling and motor vehicle operation. The BIS Safety and Workers’ Compensation Coordinator, which is a collateral duty position, works closely with supervisors and the Department’s workers’ compensation contractor to ensure that injured employees receive proper treatment and return to work as soon as medically possible. NIST – The Department’s Office of Occupational Safety and Health trained supervisors at Gaithersburg and Boulder on their responsibilities under workers’ compensation. The importance of timely reporting, which is SHARE Goal # 3, was emphasized. NOAA - NOAA’s FY 2008 incident rate was 7% below the same period in FY 2007. NOAA’s safety initiatives included mandatory online training for top management and mid-level managers as well as annual mandatory training for all NOAA employees. This has resulted in a 40% reduction in incidents since the program began. NTIS - The National Technical Information Service (NTIS) provides its employees with safety awareness information via emails, posters, and quarterly safety training
FY 2008 U.S. Department of Commerce Annual Occupational Safety and Health Report P. 12 of 21

sessions. These efforts helped employees to be more prepared to handle emergencies. The goal is to generate employee safety awareness so they support the safety program and provide suggestions for improvement.
B. Motor Vehicle / Seat Belt Safety a. Number of motor vehicle accidents experienced by employees in FY 2008
In 2008 we experienced 127 vehicle accidents, a 19.8% increase over 2007. For FY 2008 the number of motor vehicle accidents, and personnel injuries, was obtained from the individual bureaus. The Office of General Counsel (OGC) handles motor vehicle tort claims and provided the FY 08 liability cost figure. Currently the Department doesn’t have an electronic system that tracks motor vehicle accidents and their costs. When DAO 209-3, Injury Reporting and Investigation is implemented, we estimate that motor vehicle reporting will increase. This following table shows our motor vehicle statistics.
CENSaccidenwere o ITA - seat be NIST –injurie NOAAonly onduringin FY 2increasDrivin
NexNpeOVacAth
FY 2008 U.S. Depart
MOTOR VEHICLE ACCIDENT STATISTICS
FY 2007 FY 2008 Change ( ) indicates
decrease umber of motor vehicle accidents perienced by employees
106 127 19.8%
umber of accidents resulting in rsonal injury
20 + 30+ 50.0%
WCP costs of accidents Not tracked Not tracked Not Trackedehicle repair costs due to cidents
Not tracked Not tracked Not Tracked
mount of liability claims against $361,810 $158,161 (52.3%)
US - The Census Bureau Safety Office maintains a database for motor vehicle ts. Of the 35 motor vehicle accidents in FY 2008 for which police reports
btained, 100% of the employees were wearing seatbelts.
ITA reported one motor vehicle accident in FY 2008; the driver was wearing a lt and the ensuing injuries did not result in any lost time.
NIST experienced 11 vehicle accidents in FY 2008, with one resulting in s. Seatbelts were worn during all of the reported vehicle accidents.
– NOAA reported 76 vehicle accidents in FY 2008, five with injuries, and e involving lost time (a 53% reduction from FY 2007). Seatbelts were worn
all of the reported accidents. NOAA began tracking motor vehicle accidents 006 and now tracks minor incidents, which accounts for the nearly 40% e in FY 2008. In FY 2008, NOAA implemented a web based Defensive g Course with a link to the GSA sponsored web site.
e agency due to accidents
ment of Commerce Annual Occupational Safety and Health Report P. 13 of 21
b. Mechanisms in place to track seat belt usage by employees The Department supports and promotes Motor Vehicle/Seat beat initiatives, and Executive Order 13043, dated April 16, 1997, “ Increasing Seat Belt Use in the United States,” requiring Federal employees use of seat belts while on official business. This EO is reinforced during the Department’s safety and health fairs. The bureaus develop and implement initiatives to track seat belt use as follows: CENSUS - Safety information specifically relating to seatbelt usage is detailed in Census’ Field Administrative Manual, Regional Census Center Administrative Manual, and maintained in local Census offices. Every level of employee is educated on Executive Order 13043, including specific guidance on safe driving, seatbelt use and risk avoidance. In addition, Census supervisors annually conduct direct observations of all field representatives that include an assessment of safe driving practices and seat belt usage. Drivers exhibiting deficiencies are provided corrective counseling and/or training. ITA – ITA reports that 100% of ITA employees wore seat belts while on official duty in FY 2008. NIST - NIST Police remind employees to wear seatbelts as they enter the NIST campuses. The NIST Police and Department Police at both Gaithersburg, MD and Boulder, CO NIST campuses have authority to issue citations for failure to wear seat belts. All motor vehicle operators of government owned vehicles must wear their seat belt at all times when operating the vehicle.
c. Efforts taken to improve motor vehicle safety and seat belt usage As in the past several years, the NHTSA and various organizations participated in Department-wide safety and health fairs.
BIS- Posters and articles of safe driving tips are posted on the BIS office bulletin board that informs employees of the importance of complying with traffic laws and regulations. ITA- ITA has included motor vehicle safety and seat belt usage information in its training sessions, especially in the Domestic and Overseas Fields offices where motor vehicle usage is most common. This information is required before employees may operate United States Government vehicles. NIST - NIST is a certified member of the Maryland T-SAFE Project. The U.S. Department of Transportation/ National Highway Traffic Safety Administration (NHTSA), Maryland T-Safe and the Maryland State Highways had booths at NIST’s Safety Day “Spring into Safety” in June 2008 that also included a Chesapeake Regional Safety Council presentation on “Safe Driving Practices.”
FY 2008 U.S. Department of Commerce Annual Occupational Safety and Health Report P. 14 of 21
III. Employee Support A. OSH Training
a. Occupational Safety and Health Training The Department conducted safety, health and workers’ compensation training for bureau Collateral Duty Safety and Workers’ Compensation Coordinators located in the Commerce’s headquarters building on Office Ergonomics; knowledge, skills, and abilities for collateral duty positions; OSHA record keeping requirements, and Office Inspections. Each bureau located in the headquarters building was required to hold a wellness session to promote health at work and at home on topics such as: stress reduction methods; healthy life style; proper exercise & diet; and office ergonomics. CENSUS - In FY 2008, the Census Safety Office trained 13 Command Center Team members at Census HQ on the Occupant Emergency Plan, building evacuations & shelter-in-place procedures, and COOP events. Each quarter, 30 new Census supervisors and managers receive workers’ compensation and safety training. Safety and Health specialists routinely complete online OSHA education training courses and in FY 2008 attended professional conferences/continuing education such as the OSHA 10-hour program, OSHA Basic Accident Investigation, and Recording and Reporting Occupational Injuries and Illnesses. Over 200 Census Collateral Duty Safety personnel have made the commitment to help ensure the safety of all Census employees. At Census headquarters, 41 Divisional Safety Representatives, completed annual safety training and conducted quarterly safety inspections for each division and report deficiencies to the Safety Office. Safety monitors assist the Safety Office to ensure an efficient evacuation of the headquarters building when an alarm sounds. In FY 2008, 150 safety monitors completed training. To help physically challenged employees, monitors attended specialized training to assist these employees during emergencies. Because the requirements of each physically challenged employee are unique, disability monitor training is offered on an as-needed basis. Currently there are 52 disability monitors at the Census headquarters, 20 of whom were trained in FY 2008. ITA - ITA offers training in the use of escape hoods to all employees, training 1,000 employees in FY 2008, including 100% of its senior managers. ITA also teaches a Supervisor Safety Course quarterly to new supervisors as part of its Supervisory Certification Program; 30 supervisors attended this year. ITA’s Collateral Duty Safety Coordinator attended the ergonomics, workers’ compensation, and safety training classes offered by the Department. ITA also promotes Departmental safety training classes, and 15 ITA employees attended the AED/CPR training offered at Commerce headquarters in September 2008. NIST - The Safety, Health and Environment Division provided classroom style training throughout the year in coordination with Federal Occupational Health. These
FY 2008 U.S. Department of Commerce Annual Occupational Safety and Health Report P. 15 of 21

courses, attended by a total of 106 employees, included: Personal Protective Equipment, Hazard Communication; Machine Guarding, Lockout/Tag out; Electrical Safety Awareness, Respiratory Protection Initial and Fit Testing, and Respiratory Protection Annual Refresher and Fit Testing. Additionally, 10 employees were trained in Permit Required Confined Space Entry and a special presentation was given for employees of the National Center for Neutron Research. Twelve employees attended a hands-on course for crane operators. A day-long safety event “Spring into Safety” was held was held in June at the NIST Gaithersburg and Boulder facilities with workshops on Safe Driving Practices by the Chesapeake Region Safety Council and Nanotechnology Safety by ABA Technologies. Additional courses included Fall Protection, Personal Safety and Self-Defense, Security at Home and Work, Fire Extinguisher Use, and Alternatives to Mercury Thermometers. Over 1,399 employees attended in Gaithersburg, MD and 300 in Boulder, CO. All Divisions that have hazardous chemicals were trained in hazardous materials handling and satellite accumulation area procedures. Laser safety training was provided to more than 300 employees across NIST. Workers’ Compensation training for 40 supervisors was conducted at Gaithersburg and Boulder. NOAA - All NOAA employees take a mandatory annual safety course. Under the recently implemented web-based Commerce Learning Center, NOAA hopes to have the majority of specific safety training programs transferred to this medium in 2009. Managerial and mid-level programs are still held using classroom instruction. NTIS - The following mandatory safety training was conducted for NTIS personnel: Evacuation, Safe Driving/Winter Safety, Disaster Preparedness, and Stress Management. An office safety inspection was completed in April 2008. June was safety awareness month that included daily safety tips, CPR/AED training, distribution of Departmental first aid kits, fireworks and summer fire safety, and ergonomics training. Government vehicle safety inspections and monthly warehouse safety walk-throughs were conducted.
Top managemenSupervisors
Safety and healt
Safety and healt
Collateral duty spersonnel and co Employees and erepresentatives
FY 2008 U.S. Depart
TYPES OF TRAINING PROVIDED IN FY2008 NUMBER TRAINED
t officials Conducted by the bureaus. See III A Safety is included in the quarterly training classes for new supervisors.
See III A
h specialists Attendance at professional conferences and associated continuing education.
See III A
h inspectors The Department does not employ Safety and Health inspectors
N/A
afety and health mmittee members
Safety training for collateral duty safety personnel is conducted annually.
See III A
mployee Safety is included in new employee orientation at the See III A
Department. The bureaus conduct their own new employee orientation.ment of Commerce Annual Occupational Safety and Health Report P. 16 of 21

B. Field Federal Safety and Health Councils
Department safety personnel particpate in the Councils at the local levels.
Involvement and Field Council Support NIST - The staff of the Safety, Health and Environment Division attended several of the Metropolitan Washington Federal Safety and Health Council meetings.
C. Other Support Activities The Department’s Office of Occupational Safety and Health participates with professional safety and health organizations such as the American Society of Safety Engineers and the American Industrial Hygiene Association. BIS - The BIS Safety and Workers’ Compensation Coordinator attended the Office of Workers Compensation Program (OWCP) three-day Workers’ Compensation training, OSHA Basic Accident Investigation Course and attended First Aid, CPR and AED training on September 7, 2008. Fourteen BIS employees received First Aid, CPR and AED certification. CENSUS – Census Safety Office staff attended National Safety Council meetings. MBDA – The Minority Business Development Agency (MBDA) Safety and Workers’ Compensation Coordinator attended the OWCP three-day Workers’ Compensation training. NIST – NIST supports professional certification and registrations. NIST Safety Staff are members of national safety and health organizations. All staff is involved in NIST Safety Day in Gaithersburg, MD and in Boulder, CO. A collaborative meeting with the National Chapter of American Society of Safety Engineers was held at NIST, which included a tour of the National Center for Neutron Research.
IV. Self-Evaluations The Department revised its safety auditing process and completed one revised audit for NOAA. This revised process focuses on evaluating the safety management systems of the bureaus.
BIS - The Safety and Workers’ Compensation Coordinator along with the Department Safety office work in a collaborative manner to ensure BIS is meeting all the requirements. ITA - ITA conducted safety inspections and follow-ups to identify any major issues at their headquarters office and at selected overseas posts (Manila, Philippines; Cape Town, South Africa; and Johannesburg, South Africa). Additionally, ITA conducted 5 ergonomics assessments for ITA personnel and has also conducted 3 air quality assessments.
FY 2008 U.S. Department of Commerce Annual Occupational Safety and Health Report P. 17 of 21

NIST - Quarterly self evaluations are conducted by the individual Laboratory Divisions. In the first quarter FY 2008, four Divisions reported; in the 2nd Quarter 8 Divisions; in the 3rd Quarter 8 Divisions; and in the fourth quarter four Divisions reported. All worksites at NIST were reviewed by the Operating Units and the Safety, Health and Environment Division. NOAA - NOAA’s audit & safety inspection program consists of a three tier system:
o Tier I - The supervisor must conduct monthly inspection of their areas of control; o Tier II – This is a complete safety and health audit conducted by the NOAA
contractor, located in Bolder, CO; and o Tier III - As a quality check of the Tier II audit, the Tier III audit is conducted by
NOAA employees and specialists in the various safety, health and environmental areas, the team is located in Seattle, WA.
V. Accomplishments for FY 2008 The Department reconstituted the Department-wide Safety Council, revised its safety program management evaluation process and conducted its first evaluation under this program. A Department-wide Safety Management System has been drafted and is under review. A major revision was made to DAO 209-3, Injury Reporting and Investigation, and the goal is to get it signed and implemented in FY 2009. Performance criteria were developed and are awaiting implementation for Collateral Duty Safety and for Collateral Duty Workers’ Compensation Coordinators. In FY 2007 the Department initiated a Safety and Workers’ Compensation Working Group that continues to meet monthly. The work group is attended by Safety and Workers’ Compensation Specialists from each bureau and the Departmental Headquarters staff. The meetings provide opportunities for training, networking, sharing of best practices, and communication between bureau representatives and the Department’s Safety and Workers’ Compensation Managers. Attendance and participation has been consistently excellent. As a result of these meetings, we identified the need to conduct a beginner workers’ compensation class for the new workers’ compensation specialists. We will continue this work group into FY 2009. BIS - BIS conducted random office safety and health inspections and found that overall, BIS offices are compliant with OSHA office safety standards. All discrepancies are being addressed. BIS is also in the process of completing a safety and health self-assessment by the end of calendar year 2008. In addition, BIS updated its Occupant Emergency Plan (OEP), evacuation guidance and evacuation diagram. Each office is required to post at least one copy of the OEP and evacuation diagram at its entrance/exit door. The BIS Safety and Workers’ Compensation Coordinator is in charge of the recordkeeping system and works with the Office of Occupational Safety and Health and the workers’ compensation contractor very closely to manage each reported incident. BIS hosted one wellness event on stress management on October 29, 2008. The Commerce Employee Assistance Program Manager provided strategies and exercise tips to help reduce stress.
FY 2008 U.S. Department of Commerce Annual Occupational Safety and Health Report P. 18 of 21

CENSUS - Throughout the year the Census Safety Office advised and supported Census headquarters and the Census regions by managing a database for all injuries and OSHA Logs. The Census Safety Office delivered OSHA and workers compensation training to Census headquarters supervisors and managers, Regional Office Administrative Specialists and Workers Compensation Technicians. Specific guidance was provided on safety procedures, recording and record keeping, workers compensation procedures and moving employees back to work as quickly as possible. Quarterly inspections were conducted at Census headquarters and Regional Offices to identify and reduce the risks of potential injuries. Through careful inspection, risks are identified and resolved. Diligent review of all Occupational Emergency Plans is conducted annually to ensure all Census locations know how to respond in the event of an emergency. Census’ workers’ compensation program adopted a multifaceted approach to claims management, which mirrors the varied challenges the bureau faces. Long term cases are reviewed both for return-to-work potential and to ensure that current medical documentation supports claimants’ continued receipt of existing compensation levels. All new cases are reviewed to confirm the work-relatedness, return-to-work potential, and the appropriateness of recovery from responsible third parties. As a result of these efforts, Census realized over $200,000 in current budget savings in FY 2008 and lifetime cost avoidance savings estimated at nearly $8 million. ITA - ITA conducted safety inspections and follow-ups to identify any major issues at headquarters and at selected overseas posts. ITA was successful in getting DOL to deny a workers’ compensation claim and its appeal. Safety is included in the critical element of the ITA’s Safety Manager’s performance plan, and is also included in the supervisory critical element of ITA’s managers. Safety inspection findings are relayed to senior managers and disseminated to ITA’s Business Units so they can include this information in their employee assessments.
NIST – NIST completed its Laser Health and Safety Instructional for inclusion in the NIST Safety Manual. The Electronics and Electrical Engineering Laboratories developed laser safety training and offered it to all NIST laser users, with more than 300 employees attending this training. NIST updated the Office Safety Modules of its Safety Manual including an updated ergonomics checklist. Workers’ Compensation training was conducted for NIST Supervisors and Managers in March in Gaithersburg, MD and in June in Boulder, CO. The Chemical Inventory System in Gaithersburg was finalized, which is now data linked to all Divisions. Safety and environmental data was provided electronically to the Maryland Department of the Environment and the Montgomery County Local Emergency Planning Committee and the system is now data-linked to Boulder and data is currently being up loaded. NOAA - NOAA completed a Defensive Driver Training web site; had a 40% reduction in new injury claims over five years with a conservative estimate of over $1 million in savings; conducted an analysis of “working alone” issues in November 2007; created a new risk management appendix to the NOAA safety policy; prepared a list of risk management issues
FY 2008 U.S. Department of Commerce Annual Occupational Safety and Health Report P. 19 of 21

for each line office; conducted an evaluation of NOAA’s use of radioactive sources and development of protocols for compliance, storage and use and developed a central inventory management system of licenses and radioactive sources; conducted a gap analysis of its Radiation Safety Program and will implement corrective measures by end of first quarter FY 2009; developed annual managerial and facility safety and environmental goals; started development of the NOAA Safety Manual; revised the employee safety awareness program for FY 2009; implemented several new safety teams, such as the Green Team, Industrial Hygiene, Safety Manual and Radiation Safety; and partially implemented a MSDS tracking system called MSDS OnLine. NOAA conducted 20 Tier 2 and 20 tier 1 audits. All supervisors perform monthly self inspections of their areas. NTIS - NTIS has made tremendous strides to increase safety awareness in the workplace, the home and the car. NTIS communicates the importance of safety to its employees using emails, posters, meetings, and quarterly safety training. NTIS’s goal is to provide safety information to the employees that they can use daily so that safety concepts become a part of their daily routine. NTIS safety and workers compensation staff attended the monthly Department Safety and Workers’ Compensation Working Group meetings that reinforced their skill levels. NTIS conducted inspections and assessments as well as held wellness awareness seminars with the NTIS Health Unit.
VI. Resources The Department is exploring financial options to implement an automated, web-based accident reporting system that would serve as an electronic recordkeeping system to record injuries, illnesses, property damage, and motor vehicle accidents.
VII. Goals
The Department’s goals are to improve its SHARE results, continue our aggressive return-to-work program, work to eliminate fraudulent workers’ compensation claims, and identify additional safety and health resource funding.
VIII. Questions/Comments The report format used for FY 2008 required significant amounts of data that are not tracked at the agency or bureau levels. This made providing some of the requested information difficult. Recommend that agencies be informed of data requirements approximately one year in advance so that procedures to collect the required information can be implemented. The Department had planned to prepare a calendar year report since federal agencies now prepare their OSHA Log on a calendar year basis and were surprised when the OSHA request asked for a fiscal year report.
FY 2008 U.S. Department of Commerce Annual Occupational Safety and Health Report P. 20 of 21

Appendix I - BUREAU SAFETY AND HEALTH OFFICERS
BUREAU OSH MANAGER
OFFICIAL TITLE
PHONE E-MAIL
Bureau of Economic Analysis (BEA)
John J. Steiner
Program Manager
(202) 606-9282 [email protected]
Bureau of Industry and Security (BIS)
Jennifer Kuo Program Manager
(202) 482-4017 [email protected]
Census George E. Barnett
Safety and Occupational Health Manager
(301) 763-3711 [email protected]
Economic Development Administration (EDA)
Michael Barber
Program Manager
(202) 482-2686 [email protected]
Economics and Statistics Administration (ESA)
Pamela Moulder
Safety Specialist (202) 482-5997 [email protected]
International Trade Administration (ITA)
Jeffrey Scherr
Safety Specialist (202) 482-3266 [email protected]
Minority business Development Agency (MBDA)
Geraldine Marshall
Program Manager
(202) 482-2285 [email protected]
National Institute of Standards and Technology (NIST)
Rosamond Rutledge-Burns
Chief, Safety, Health and Environment Division
(301) 975-5818 [email protected]
National Oceanic and Atmospheric Administration (NOAA)
Thomas Altvater, CSP
Chief, Safety Division
(301) 713-2870 X132
National Technical Information Service (NTIS)
Doug Campion
Program Manager
(703) 605-6214 [email protected]
National Telecommunication and Information Administration (NTIA)
Anthony Calza
Program Manager
(202) 482-2196 [email protected]
Office of the Inspector General (OIG)
Dale Fields-Glivings
Program Manager
(202) 482-0923 [email protected]
Office of the Secretary (OS)
Richard Denny, CSP
Safety and Occupational Health Specialist
(202) 482-1990 [email protected]
Patent and Trademark Office (PTO)
Carol Barnhill Safety and Occupational Health Manager
(571) 272-6234 [email protected]
Appendix II - FATALITIES There were no Department employee fatalities in FY 2008.
FY 2008 U.S. Department of Commerce Annual Occupational Safety and Health Report P. 21 of 21