department of commerce safety...
TRANSCRIPT

Department of Commerce Safety Report
June 2003

Safety Report
June 2003 Introduction This report provides an update to Department of Commerce (DOC) managers and employees on the progress of Departmental safety initiatives and information regarding important Department-wide safety issues for June 2003. The report also contains the latest available accident data for the Department. Section One of the report, Program Initiatives, provides updates on the safety initiatives outlined in the Safety Program Plan available at http://ohrm.doc.gov/safetyprogram/safety.htm. Section Two, Significant Safety Issues, outlines safety issues and concerns which arose in June 2003. Section Three, Injury Statistics, provides statistics regarding Department injuries, as reported to the Workers’ Compensation Program for May 2003, and an analysis of the data to assist bureaus in focusing their safety efforts. Section Four, Survey Results, provides the June results from the on-line survey available through the intranet Occupational Safety and Health (OSH) Program Web Site. Section One: Program Initiatives Safety Slogans: While there is a place for safety slogans, it is important to ensure that those slogans are backed up by action. To state that “Safety is a First Priority” and not act on that philosophy is detrimental to the organization. That point was made by Deputy Secretary Bodman, during a briefing by senior managers from a Commerce bureau. As recently reported in Industrial Safety and Hygiene News, slogans should reflect what former Treasury Secretary Paul O’Neill called the three characteristics of great organizations.
1) Employees are treated with dignity and respect. Respect what employees know to be true about how safety is really handled in the workplace.
2) Employees are encouraged to make contributions that give meaning to their lives.
Show how safety contributes in a meaningful way, how the organization and everyone in it benefits.
3) Those contributions are recognized. If slogans urge someone to do something safely,
and they do it, recognize it, or the slogan rings hollow. Safety slogans and posters can keep awareness up, and put safety front and center. But they need to spring from an organization that walks the talk. Department of Commerce 1 June 2003

Safety Report
Over the next several months, the Office of Occupational Safety and Health will be visiting Commerce facilities to observe workplace conditions, speak with employees about safety and health concerns, and address workplace safety issues with managers and supervisors. Section Two: Significant Safety Issues Power tool safety Each month, as our accident and injury reports are reviewed, we notice accidents involving the use of power tools. Recently, an employee was severely injured in the Hoover Building while using a radial arm saw. It was determined during the accident investigation that the employee had not received training on the use of the saw, and was injured while using the saw improperly. Ensuring that employees are adequately trained prior to using power tools is essential. Many power tool accidents can be prevented by following established work practices and being aware of the hazards. While many Commerce Department employees do not use power tools on the job, many of us use them at home. A list of general safety rules that should be followed in conjunction with the use of power tools is provided below. • Before using a power tool, be familiar with its operation and any safety hazards. Reading
the operator’s manual prior to use is highly recommended. • Examine the tool for faulty parts, a worn electrical cord, broken switches, and other
defects. Electrical tools must be equipped with a three-wire grounded cord, with the grounding pin in the plug intact, or be labeled “Double Insulated.” For maximum protection against electrical shock, tools should be plugged into a ground fault circuit interrupter, commonly known as a GFCI. These devices are available at most hardware and home improvement stores and are relatively inexpensive.
• If the tool is designed to be used with a guard, be sure the guard is installed prior to use. • If the tool will produce flying chips, dust, sparks or other hazards, be sure to wear safety
goggles or a face shield, which are also available at hardware and home improvement stores.
• Keep the surrounding area free of clutter, and be sure there is adequate lighting to do the job safely.
• When changing drill bits, saw blades, or other attachments, unplug the tool first. • Do not wear rings, or other jewelry, or loose clothing while using power tools. • If the equipment produces loud noise, such as a leaf blower, lawnmower, or chainsaw,
wear hearing protection.
Department of Commerce 2 June 2003

Safety Report
These general safety recommendations are provided to help keep you safe and prevent accidents. Additional safety precautions for using power tools are posted at several sites on the internet; one of those sites is http://www.du.edu/risk/Tool_Safety.html. Section Three: Injury Statistics and Analysis This section provides information on the total number of Departmental injuries for the past five years, and analyzes the types of injuries across the Department. The information below reflects May 2003 statistics. Due to late submissions, processing limitations, and to ensure the accuracy of the information, this section will continue to include information up to the previous month. The data presented in the charts and tables are based upon Departmental Workers’ Compensation Program records. Incidence Rate: The incidence rate (IR) represents the number of injuries and illnesses per 100 full-time workers and is calculated as follows:
)000,200(EHNIR =
N = Number of injuries and illnesses EH = Total hours worked by all employees during the year1 200,000 = Base for 100 equivalent full-time workers
(40 hours per week, 50 weeks per year) 1 The total hours worked were determined based on the total number of employees and the average hours. The Commerce Workers’ Compensation Program keeps records on all injury and illness claims, including those that did not include any lost work time. An accounting of all incidents allows follow-up and more comprehensive program review by safety representatives. However, the incident rates from those records are not directly comparable, since they include many minor injuries and illnesses that are not considered “work-related” under Occupational Safety and Health Administration (OSHA) standards for private industry. Injury rates may be skewed as safety awareness increases and employees are encouraged to report all injuries, causing total injury rates to increase despite improvements to safety. Using standardized OSHA recordable incident reporting helps to reduce inconsistent reporting. An OSHA recordable incident is a work-related injury or illness that resulted in one or more of the following: medical treatment beyond first aid, a significant injury or illness diagnosed by a physician or other licensed health care professional, days away from work, restricted work or transfer to another job, loss of consciousness, or death.
Department of Commerce 3 June 2003

Safety Report
NOTE: Recordable injury rates reported in Table 1, and Charts 1 and 2 were determined from workers’ compensation claims. Recordable injury rates were used to analyze injury rate trends using recognized criteria. The remaining tables and charts include data for all injuries submitted to the Workers’ Compensation Program.
Chart 1
Total Recordable Case Incidence Rate Trend
0
0.5
1
1.5
2
2.5
FY 98 FY 99 FY 00 FY 01 FY 02 FY 03 JAN O3 FEB O3 MAR O3 APR O3
Inci
denc
e R
ate
Major Findings include: • The FY 2003 Total Recordable Case Incidence Rate (TRCIR) for Commerce is
lower than the rates for FY 2002 and FY 2001. The TRCIR is 1.37 for FY 2003, 1.60 for FY 2002, and 1.72 for FY 2001. The decreasing trend of recordable injury rates is definitely encouraging. A total of 311 recordable injuries were reported thus far for FY 2003.
• Of the larger bureaus, with the exception of the International Trade Administration
(ITA), the TRCIRs for FY 2003 are down when compared to FY 2002 (see table 1 and chart 2). The TRCIR for ITA is up from FY 2002 and FY 2001. However, injury rates for ITA are consistently low.
• Of the smaller bureaus (i.e., bureaus with less than 500 employees), the Economic
Development Administration (EDA) and the National Technical Information Service (NTIS) have not had a single recordable injury for FY 2003.
• The Total Case Incidence Rate (TCIR) for Commerce is up slightly from last year,
but down from FY 2001. The TCIRs for Commerce are 1.87 for FY 2003, 1.84 in FY 2002, and 1.98 in FY 2001.
Department of Commerce 4 June 2003

Safety Report
Chart 2
0
1
2
3
4In
cide
nce
Rat
e
OS OIGBEA
Census
BIS EDAITA MBDA
NOAANTIA
PTONIST
NTISDEPT
FY 2002 FY 2003
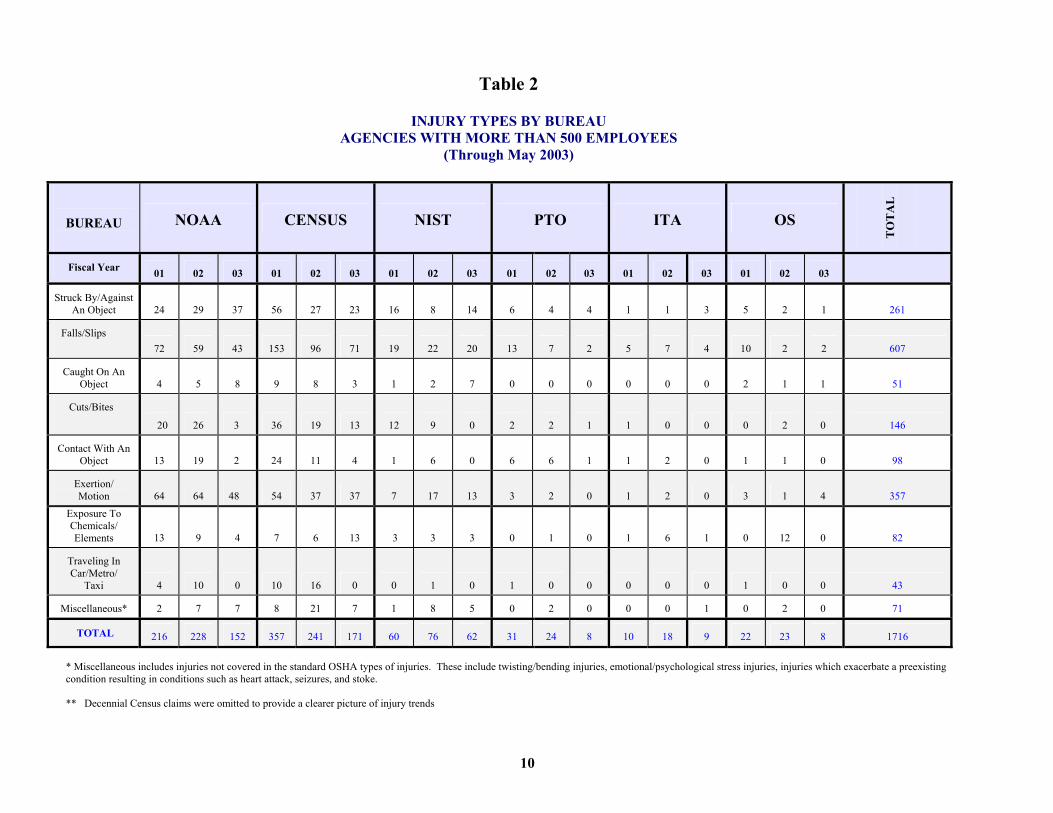
Types of Injuries: Many of the injuries reported can be prevented through improved safety awareness and proper maintenance. A Departmental and bureau focus on eliminating injuries and illnesses is essential. Eliminating injuries and illnesses can be accomplished by evaluating the types of claims submitted and structuring safety awareness training programs to eliminate accidents. Information on types of injuries is provided in charts 4 and 5, and tables 2 and 2A. Key findings are explained below: • “Slips/Falls” continue to be the most prevalent type of injury. “Slips/falls” accounted
for 36 percent of all injuries within the Department for FY 2002 and for 25 percent in May 2003. Many of the recent slips and falls were weather-related. More attention must be given to walking surfaces to reduce injuries from slips and falls. Floors that are wet from mopping must have highly visible warning signs, so employees know to avoid those areas. Trips from cords strung across floors continue to cause injuries. Telephone lines, electrical cords, and other cords should be routed away from walking areas.
• “Struck and Contact” injuries were second in frequency for May 2003. These injuries combined for 21 percent of those reported for FY 2002 and for 25 percent in May 2003. A majority of the injuries were caused when employees struck open drawers, doors, or low overhead clearances. Those injuries can be avoided by closing drawers that are not being used. Employees should also be aware of their surroundings and use caution. Low overhead clearances should be marked with highly visible paint or tape.
• “Exertion” injuries remain a concern. “Exertion” injuries were 20 percent and
29 percent of total injuries for FY 2002 and May 2003, respectively. To prevent back injuries, employees should use carts to move objects and avoid carrying them by hand. The proper lifting technique includes keeping the back straight and lifting with the legs. For jobs that require repetitive motion, an ergonomics assessment should be conducted.
Department of Commerce 5 June 2003

Safety Report
• “Exposures” were evident as well. Exposures accounted for five percent of the injuries
or illnesses reported in FY 2002, and for seven percent in April 2003. Most exposure illnesses can be prevented through proper ventilation and use of personal protective equipment.
Chart 4
Injury Type As Percentage of Total Injuries for
FY 2002
14%
36%
2%
9%
7%20%
5%
3%4%
Struck By Slips/Falls Caught OnLacerated Contact With ExertionExposure Traveling In Misc.
Department of Commerce 6 June 2003

Safety Report
Chart 5
2 6% 2 4%
7 %
3 6%
7 %
APRIL
2 5% 2 5%
7 %
2 9%
7 %
7 %
MAY
Struck By Slips/Falls Caught OnLacerated Contact With ExertionExposure Traveling In Misc.
Injury Type As Percentage Of Total Injuries
Department of Commerce 7 June 2003

8
TABLE 1 TOTAL RECORDABLE CASE INCIDENCE RATE*
FY 2003 (To Date) FY1998 FY 1999 FY 2000 FY 2001 FY2002 April 2003 May 2003
Actual Bureau No. Rate No. Rate No. Rate No. Rate No. Rate No. Rate No. Rate No. Rate Office of the Secretary 17 2.38 19 2.20* 30 3.38 17 1.91 22 2.75 0 0 2 2.99 8 1.49
Office of Inspector General 2 1.22 1 0.66 3 2.24 3 2.15 1 0.82 0 0 0 0 1 1.22
Bureau of Economic Analysis 7 1.53 4 0.88 0 0 5 1.12 3 0.77 1 2.67 1 2.57 3 0.96
Bureau of the Census 244 1.15 288 0.96 345 2.55 332 2.04 212 2.05 13 1.64 15 1.84 116 1.78
Bureau of Industry and Security 8 2.42 10 2.80 13 3.52 8 2.17 9 2.56 0 0 1 3.60 6 2.70
Economic Development Administration 4 1.72 8 3.26 4 1.69 5 2.08 6 2.60 0 0 0 0 0 0
International Trade Administration 24 1.23 17 0.86 22 1.13 11 0.57 10 0.60 1 0.72 0 0 9 0.81
Minority Business Development Agency 1 1.13 1 1.10 2 2.27 4 4.36 2 2.31 0 0 0 0 1 1.72
National Oceanic and Atmospheric Administration 260 2.34 275 2.41 289 2.53 225 1.98 203 1.81 14 1.50 10 1.07 121 1.61
National Telecommunications & Information Administration 3 1.22 2 0.88 2 0.87 5 2.16 3 1.27 0 0 0 0 1 0.62
Patent and Trademark Office 35 0.67 26 0.45 29 0.50 31 0.55 24 0.38 0 0 0 0 8 0.20
Technology Administration 0 0 0 0 0 0 0 0 0 0 0 0 0 0 1 4.17
National Institute of Standards and Technology 87 2.96 76 2.60 66 2.36 55 1.89 59 2.00 9 3.72 3 1.24 36 1.86
National Technical Information Service 2 0.66 5 2.18 4 2.15 1 0.52 3 1.78 0 0 0 0 0 0
TOTAL 694 1.54 732 1.34 809 2.13 702 1.72 557 1.60 38 1.35 32 1.13 311 1.37
Decennial Census 2000 182 3.4 890 11.3 4798 6.7 32 13.3
* The Total Recordable Case Incidence Rate includes only those injuries or illnesses that are reportable to OSHA under 29 Code of Federal Regulations, Part 1904. ** Population fluctuations can have a serious positive or negative impact on the Total Recordable Case Incidence Rate.

9
TABLE 1A TOTAL CASE INCIDENCE RATE
FY 2003 (To Date) FY1998 FY 1999 FY 2000 FY 2001 FY2002 April 2003 May 2003
Actual Bureau No. Rate No. Rate No. Rate No. Rate No. Rate No. Rate No. Rate No. Rate Office of the Secretary 17 2.38 19 2.20* 35 3.94 22 2.47 23 2.88 0 0 2 2.99 8 1.49
Office of Inspector General 2 1.22 2 1.32 4 2.98 3 2.15 1 0.82 0 0 0 0 1 1.22
Bureau of Economic Analysis 8 1.75 4 0.88 1 0.23 5 1.12 4 1.03 1 2.67 1 2.57 4 1.28
Bureau of the Census 282 1.34 311 1.04 383 2.83 393 2.41 241 2.33 17 2.14 16 1.96 171 2.62
Bureau of Industry and Security 10 3.02 11 3.08 15 4.06 9 2.44 9 2.56 0 0 1 3.60 6 2.70
Economic Development Administration 4 1.72 9 3.67 4 1.69 5 2.08 6 2.60 0 0 0 0 1 0.66
International Trade Administration 26 1.33 18 0.92 24 1.23 12 0.62 18 1.08 1 0.72 0 0 9 0.81
Minority Business Development Agency 1 1.13 1 1.10 3 3.40 4 4.36 2 2.31 0 0 1 13.75 2 3.44
National Oceanic and Atmospheric Administration 280 2.52 317 2.78 307 2.69 247 2.18 228 2.04 19 2.03 15 1.60 152 2.03
National Telecommunications & Information Administration 3 1.22 2 0.88 2 0.87 7 3.03 6 2.55 0 0 0 0 1 0.62
Patent and Trademark Office 38 0.73 27 0.47 29 0.50 31 0.55 24 0.38 0 0 0 0 8 0.20
Technology Administration 0 0 0 0 0 0 0 0 0 0 0 0 0 0 1 4.17
National Institute of Standards and Technology 105 3.57 84 2.87 79 2.82 68 2.34 76 2.58 12 4.97 4 1.65 62 3.20
National Technical Information Service 2 0.66 6 2.61 4 2.15 1 0.52 4 2.38 0 0 0 0 0 0
TOTAL 778 1.73 811 1.48 890 2.34 807 1.98 642 1.84 50 1.79 40 1.41 426 1.87
Decennial Census 2000 182 3.4 890 11.3 4798 6.7 32 13.3
* Total Case Incidence Rate includes all cases reported to the Workers’ Compensation Program. ** Population fluctuations can have a serious positive or negative impact on the Total Case Incidence Rate.
10
Table 2
INJURY TYPES BY BUREAU AGENCIES WITH MORE THAN 500 EMPLOYEES
(Through May 2003)
BUREAU
NOAA CENSUS NIST PTO ITA OS
T
OT
AL
Fiscal Year 01 02 03 01 02 03 01 02 03 01 02 03 01 02 03 01 02 03 Struck By/Against
An Object 24 29 37 56 27 23 16 8 14 6 4 4 1 1 3 5 2 1 261
Falls/Slips
72 59 43 153 96 71 19 22 20 13 7 2 5 7 4 10 2 2 607
Caught On An Object 4 5 8 9 8 3 1 2 7 0 0 0 0 0 0 2 1 1 51
Cuts/Bites 20 26 3 36 19 13 12 9 0 2 2 1 1 0 0 0 2 0 146
Contact With An Object 13 19 2 24 11 4 1 6 0 6 6 1 1 2 0 1 1 0 98
Exertion/ Motion 64 64 48 54 37 37 7 17 13 3 2 0 1 2 0 3 1 4 357
Exposure To Chemicals/ Elements 13 9 4 7 6 13 3 3 3 0 1 0 1 6 1 0 12 0 82
Traveling In Car/Metro/
Taxi 4 10 0 10 16 0 0 1 0 1 0 0 0 0 0 1 0 0 43
Miscellaneous* 2 7 7 8 21 7 1 8 5 0 2 0 0 0 1 0 2 0 71
TOTAL 216 228 152 357 241 171 60 76 62 31 24 8 10 18 9 22 23 8 1716
* Miscellaneous includes injuries not covered in the standard OSHA types of injuries. These include twisting/bending injuries, emotional/psychological stress injuries, injuries which exacerbate a preexisting condition resulting in conditions such as heart attack, seizures, and stoke. ** Decennial Census claims were omitted to provide a clearer picture of injury trends

11
Table 2A
INJURY TYPES BY BUREAU AGENCIES WITH LESS THAN 500 EMPLOYEES
(Through May 2003)
BUREAU OIG ESA/BEA EDA TA NTIS NTIA MBDA BIS
Tot
al
Fiscal Year 01 02 03 01 02 03 01 02 03 01 02 03 01 02 03 01 02 03 01 02 03 01 02 03 Struck By/Against An Object
0 0 0 2 1 1 1 0 1 0 0 0 0 0 0 3 1 1 0 0 0 0 2 2 15
Falls/Slips 2 0 1 2 2 1 4 5 0 0 0 0 1 0 0 3 3 0 3 1 1 6 0 1 36
Caught On An Object 0 0 0 0 0 0 0 0 0 0 0 0 0 0 0 0 1 0 0 0 0 0 1 0 2
Cuts/Bites 0 0 0 0 0 0 0 0 0 0 0 0 0 0 0 0 0 0 0 0 0 0 0 0 0
Contact With An Object 0 0 0 1 0 0 0 0 0 0 0 0 0 0 0 1 1 0 0 0 1 0 3 0 7
Exertion/ Motion 0 0 0 0 0 1 0 0 0 0 0 1 0 2 0 0 0 0 1 0 0 2 2 3 12
Exposure to Chemicals/ Elements 0 1 0 0 0 0 0 0 0 0 0 0 0 0 0 0 0 0 0 0 0 0 0 0 1
Traveling In Car/Metro/ Taxi 0 0 0 0 0 0 0 0 0 0 0 0 0 0 0 0 0 0 0 0 0 0 1 0 1
Miscellaneous* 0 0 0 0 1 1 0 1 0 0 0 0 0 2 0 0 0 0 0 1 0 0 0 0 6
Total 2 1 1 5 4 4 5 6 1 0 0 1 1 4 0 7 6 1 4 2 2 8 9 6 80
* Miscellaneous includes injuries not covered in the standard OSHA types of injuries. These include twisting/bending injuries, emotional/psychological stress injuries, injuries which exacerbate a preexisting condition resulting in conditions such as heart attack, seizures, and stoke.

Safety Report
Department of Commerce 12 June 2003
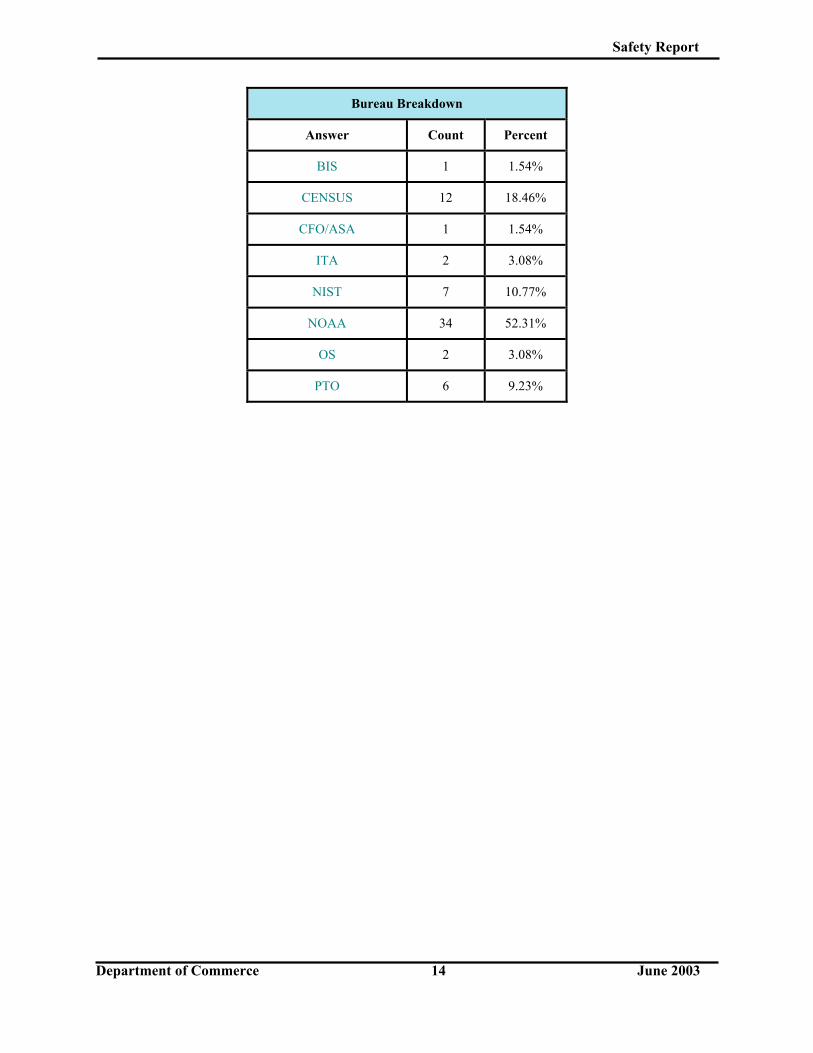
Section Four: Survey Results We continue to receive comments through the Safety Survey Web Site. We are using employee comments to help shape a safety program responsive to employee issues and concerns. The Web Site can be accessed through the Office of Human Resources Management Homepage at http://ohrm.doc.gov/. Safety Survey Statistics We received 65 responses through the Web Site survey. The following tables provide some data regarding the distribution of responses by bureau and general geographical area, as well as general safety impressions.
Safety Survey June Results
Have you experienced a safety lapse in your work area during the past 3 months?
Answer Count Percent
No 49 75.38%
Yes 13 20.00%
No Answer 3 4.62%
Have you noticed any safety improvements in your work area or in the Department as a whole during the past 3 months?
Answer Count Percent
No 33 50.77%
Yes 30 46.15%
No Answer 2 3.08%

Safety Report
Department of Commerce 13 June 2003
Geographical Location
State Count Percent
AK 1 1.54%
AZ 1 1.54%
CA 2 3.08%
CO 3 4.62%
DC 7 10.77%
IN 2 3.08%
MD 29 44.62%
MO 1 1.54%
NY 1 1.54%
OK 1 1.54%
PA 2 3.08%
SC 1 1.54%
TX 1 1.54%
UT 1 1.54%
VA 9 13.85%
WA 2 3.08%
WY 1 1.54%
Safety Report
Department of Commerce 14 June 2003
Bureau Breakdown
Answer Count Percent
BIS 1 1.54%
CENSUS 12 18.46%
CFO/ASA 1 1.54%
ITA 2 3.08%
NIST 7 10.77%
NOAA 34 52.31%
OS 2 3.08%
PTO 6 9.23%