u.s. consumers’ preference and willingness to pay for
TRANSCRIPT
U.S. Consumers’ Preference and Willingness to Pay for Country-of-
Origin-Labeled Beef Steak and Food Safety Enhancements
KAR H. LIM Dept. of Agricultural Economics, University of Kentucky
LEIGH J. MAYNARD Dept. of Agricultural Economics, University of Kentucky
WUYANG HU Dept. of Agricultural Economics, University of Kentucky
ELLEN GODDARD Dept. of Rural Economy, University of Alberta
Selected Paper prepared for presentation at the Agricultural & Applied Economics Association’s
2011 AAEA & NAREA Joint Annual Meeting, Pittsburgh, Pennsylvania, July 24-26, 2011
Copyright 2011 by Kar Ho Lim, Leigh Maynard, Wuyang Hu, and Ellen Goddard. All rights reserved. Readers may make verbatim copies of this document for non-commercial purposes by any means, provided that this copyright notice appears on all such copies.

1
U.S. Consumers’ Preference and Willingness to Pay for Country-of-Origin-Labeled Beef Steak and Food Safety Enhancements
ABSTRACT
The mandatory Country of Origin Labeling (COOL) troubles beef exporters to the U.S. This study
evaluates the extent that U.S. consumers are receptive to imported steak and their perception of food
safety level of beef from various countries. In addition, using conjoint analysis, willingness to pay for
strip loin steak from Australia, Canada and the United States is estimated along with several increasingly
important food safeties and quality attributes in beef. We find that on average U.S. consumers are
willing to pay significantly less for imported steaks.
Key words: beef, consumer preferences, country-of-origin labeling, conjoint experiment, willingness to
pay
INTRODUCTION
The Country of Origin Labeling (COOL) provision of the 2002 and 2008 Farm Bill troubles beef and cattle
exporters to the United States. In the context of beef, the law mandates only beef derived from cattle
born, raised, and processed in the U.S. can be labeled as U.S. origin. The law, in essence, differentiates
imported beef from domestic beef at the retail level. COOL has raised concerns about its negative
effects on U.S. meat and livestock imports, which prompted the governments of Canada and Mexico to
challenge the legitimacy of COOL in accordance with the World Trade Organization’s guideline.
The importance of the U.S. market for many beef exporting countries cannot be understated. Notably,
exports to the U.S. market account for about 30% of Canada, New Zealand and Nicaragua total beef and
veal production. Cattle exports from Canada and Mexico were almost exclusively destined to the U.S.
market (USDA, 2010). Stockwell Day, the Canadian International Trade Minster, claimed the law is
2
“devastating the Canadian livestock industry”. Canadian representatives of cattle industry also stated
that the law has resulted in a “glut of meat on store shelves in Canada” (Wyld, 2009).
Although COOL has been heavily explored in recent literature, much remains to be contemplated at the
consumer level. COOL will likely affect consumer choices in addition to its impact on production and
trade. For instance, some demand conditions were imposed in Brester et al (2004) and Chung et al
(2009) in their investigation on market impacts of COOL. Existing research on consumer-level impacts of
COOL, notably Loureiro and Umberger (2007), focused on the difference in willingness to pay (WTP)
between U.S.-labeled beef products and products of unknown origin. The question highly relevant to
COOL’s market implication, i.e. how U.S. consumers perceived imported steak, remains unanswered.
The objective of this research is to investigate the potential implications of COOL on the retail beef steak
market. Factors which differentiate U.S. consumers’ perception on domestic and imported steak were
examined. A conjoint experiment is used to estimate the difference in willingness-to-pay between
domestic-labeled beef and imported beef, along with WTP for several increasingly important attributes
of beef: tenderness assurance, BSE testing, traceability and natural production (hormone- and
antibiotic-free). This study extends the consumer experiment used in Loureiro and Umberger (2007) and
Tonsor et al (2009).
LITERATURE REVIEW
Lancaster (1966) proposed that attributes or properties embedded in goods influence utility from
consumption. Applying this intuition in context of COOL, consumers achieve higher utility when they
consume goods produced from the geographical location they preferred; and vice versa, lower utility
when they consume food produced from less desirable origins. Proponents of COOL argue that many
U.S. consumers associate domestic products as being safer and higher in quality than imported products
and some consumers want to support U.S. foods (Krissoff, et al., 2004).
3
Beef’s sourcing origin is by nature a credence attribute, one that cannot easily be determined by
consuming the product (Darby and Karni, 1973). A suboptimal equilibrium occurs when consumers
incorrectly discern the true quality of a product due to lack of information. Caswell and Mojduzka (1996)
proposed that such a market failure can be addressed by informational labeling.
U.S. consumers prefer domestic beef to imported beef. Mutondo and Henneberry (2007) used the
Rotterdam model to assess demand on source-differentiated beef. They found that U.S. grain-fed beef
had a competitive advantage in the domestic market over imported beef from Australia, Canada and
New Zealand.
Lusk et al (2006) outlined two incentives for consumers to favor country-of-origin labeling. Firstly, the
information on country of origin may signal product quality. In the case of beef, consumers perceive U.S.
beef as safer than imported beef (Loureiro and Umberger, 2005, Loureiro and Umberger, 2007, Schupp
and Gillespie, 2001, Umberger, et al., 2003). Secondly, consumers may be guided by ethnocentrism –
consumers’ loyalty towards their own country or antipathy toward other countries.
Several studies found that U.S. consumers were willing to pay more for beef labeled as U.S. origin over
unlabeled beef (2005, Loureiro and Umberger, 2007, Loureiro and Umberger, 2003, Umberger, et al.,
2003). However, the difference in willingness to pay between U.S. beef and imported beef were not
addressed in these studies.
Critics of COOL contested the defense of COOL as a food safety measure, but rather as a promotional
tool. Ikenson (2004) contended the Food Safety and Inspection Service would not allow importation of
any unwholesome foods. In addition, COOL exempts restaurants and butcher shops, which diminishes
the effectiveness of COOL’s role as a food safety measure.
4
Further, Krissoff et al (2004) noted that foods are rarely voluntarily labeled with sources of origin,
implying that suppliers do not believe domestic origin appeals to consumers. Profit maximizing retailers,
processors, and producers are motivated to practice voluntary labeling if they deem the benefit derived
from country of origin labeling to exceed the cost.
Opponents also questioned COOL’s ability to success as a promotion tool for domestic product. Carter
et al (2006) argued that COOL will not impose quality control and supply restriction, the two conditions
for long term premiums on domestic food products:. Further, they argued even if COOL generated
premium in short run, the premium will be dissipated by additional entry or supply.
Some studies suggested that COOL might not be as valuable to consumers as other attributes. Verbeke
and Roosen (2009) found best before date, safety guarantee quality label, and health benefits are
thought to be of more importance than country of origin by Belgian beef consumers. Country of origin,
however, is more important than the direct indication of traceability. In contrast, Loureiro and
Umberger (2007) indicated U.S. consumers are willing to pay a premium of $2.568/pound for steaks
labeled with country of origin; but consumers are willing to pay a higher premium for the food safety
inspected label than for country of origin label.
COOL can be costly to producers and consumers especially if demand is not stimulated. The costs stem
from labeling, product and livestock segregation and human resources used in compliance of COOL, are
likely to spread across producers, processors and consumers. Jones et al (2009) evaluated the impacts
of COOL on the U.S. market using a global static general equilibrium model. Under the assumption of no
demand premium on labeled commodities relative to unlabeled commodities, the cost of compliance
with COOL would increase the prices of live animals and meats. Contrary to boosting demand for
domestic products, Jones et al (2009) projected that production and equilibrium levels of both domestic
live animals and meats would decrease as the result. Demand would decrease when higher cost
5
translated into higher prices. Surprisingly, they projected imports of live animals to increase as a result
of reductions in domestic production. Regardless of the magnitude, it is crucial to understand
consumers’ willingness to pay for imported beef of specific origins; the willingness to pay may be used
as evidence to assess the implications of COOL.
Chung et al (2009) estimated that COOL will cause a loss of $52.64 million in producers’ surplus and a
loss of $297.12 million in consumers’ surplus. Market power in upstream and downstream markets of
processors could further decrease consumers’ and producers’ surplus. However, producers and
consumers could gain from COOL if there was about a 2 percent increase in the demand of beef.
As standards of living and caution toward food safety risk rise, the demand for additional food safety
guarantees and non-conventional production practices increases. Thilmany et al (2006) performed a
cluster analysis on demand for value-added natural (minimally processed, and antibiotic- and hormone-
free) beef products by Colorado consumers. They found those who ranked production attributes such as
no antibiotics, no hormones and humane treatment significantly higher, were willing to pay a premium
for natural beef.
Lusk et al (2003) found that steak consumers in France, Germany, the United Kingdom and the United
States were all willing to pay a positive amount for beef produced free of growth hormones. In a survey
conducted with consumers near meat counters in supermarkets in Utah and Idaho, 72% of the
respondents stated they were willing to pay 5% extra for beef tested for BSE (Bailey et al 2005).
The demand for beef is ever more dynamic in the midst of evolving preference and policy changes such
as COOL. In order to better understand the impact of COOL and the market for new innovations,
agribusinesses and policy makers need additional information on consumers’ perception on these
issues. This research aims to gauge the impact on consumers’ demand for beef steak after the
6
implementation of COOL along with consumers’ valuation of tenderness assurance, BSE testing,
traceability, and natural production practices.
DATA
This study employed a choice experiment to estimate WTP for beef steak attributes. Our sample consists
of 1079 responses from consumers from the U.S. We established an internet survey to elicit consumers’
preferences and behavior toward beef purchases and general food safety concerns. The surveys were
conducted through TNS Global in May 2010. TNS Global is a leading market research company with a
vast consumer panel throughout the United States. The panel of consumers were randomly contacted
by TNS Global and asked to respond to our survey, which was pre-loaded to the company’s server. The
target number of responses was set as 1,000. The survey closed with 1079 responses. A total of 83 % of
the respondents identified themselves as the primary shopper. The mean household income was a little
more than $52,000 and the average education level was some college (including community college or
technical training).
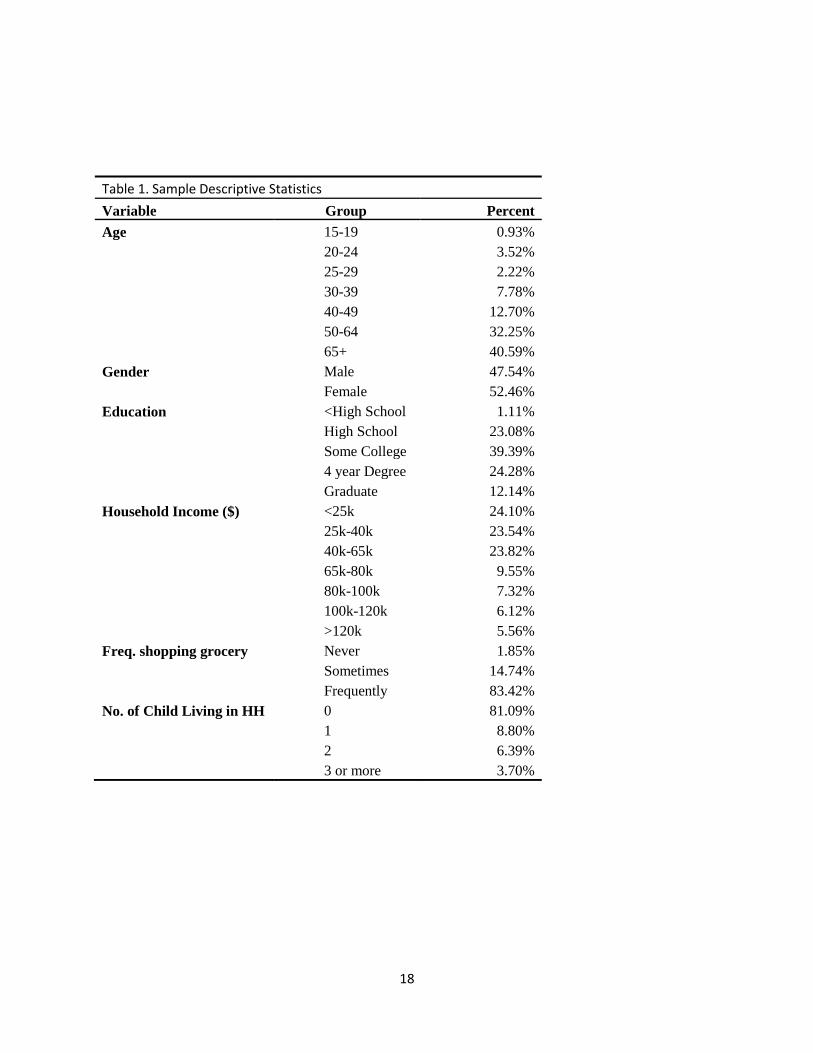
Our sample compared closely to the U.S. population in terms of gender, education, income and
household size, but it over-represented older consumers. The older population might have been more
responsive to the monetary compensation to participate in the survey given their opportunity cost of
time. This pattern of an online consumer survey with mean age higher than the population average is
not uncommon in the literature. For instance, Hu et al (2005) reported that their online survey had a
higher-than-national-average age in a Canadian national survey. Tonsor et al (2009) also found a similar
result in their online survey of U.S. consumers. Some desirable characteristics of our sample include high
percentages of primary shoppers and beef consumers. Nevertheless as with all surveys, readers should
be cautious about the ability of the sample to represent the consumer population. In most respects, our
sample is representative.
7
Some Perception of Beef from Different Origin Statistics
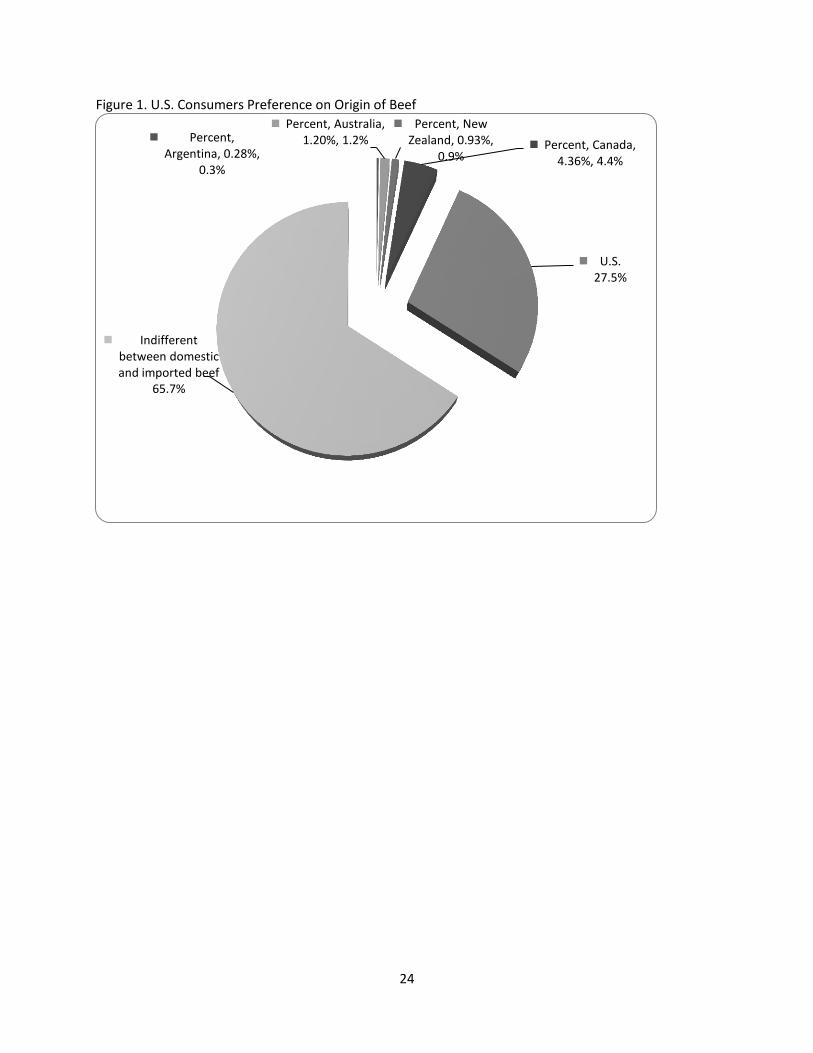
We elicit the sampled consumers’ preference for origin of beef. Figure 1 reports the result. As indicated
the majority (65.7%) is indifferent between imported and domestic beef. More than one-quarter
(27.5%) of the sample stated they would avoid imported beef. After domestic beef, 4.4% of the sample
preferred Canadian beef. Beef from Australia, New Zealand and Argentina combined are preferred by
2.4% of the sample. This result largely coincides with Loureiro and Umberger (2005). About 72.5% of
sampled indicated they either preferred imported beef or indifferent between domestic and imported
beef, this implies that a large portion of the U.S. market is open to imported beef. Nonetheless, COOL
could still significantly reduce the demand of imported beef if retailers deem that the profit earned from
carrying imported beef outweigh that gained from domestic beef.
As previous literature suggested that consumers may use COOL as a cue for food safety, a question in
the survey asked consumers to rate their perceived beef food safety level for various countries. Figure 2
reports the result. As anticipated, domestic beef is perceived to be the safest, almost 60% believe U.S.
beef is safe. In contrast, beef of unknown origin is thought to be the most unsafe, 34% rated unlabeled
beef unfavorably compare to only 10.3% who consider U.S. beef unsafe. Canadian beef ranked second
after U.S. beef by American consumers in perceived safety, follow by beef from Australia, New Zealand
and Brazil. A significant portion responded no opinion in regards to safety of imported beef, perhaps due
to limited experience with imported beef.
Overall, the perceived safety level of beef is evaluated widely across country of origin. Assuming
consumers achieve higher utility by consuming beef which is perceived to be safer, COOL will be an
effective policy instrument to aid consumers in choosing beef that maximizes utility. Without the
mandatory labeling policy in place, consumers may suffer lost utility given that beef from unknown
origin is perceived to be the least safe.
8
Factors in Beef Purchase
The survey also investigated respondents’ rating of the importance of a series of factors or concerns in
overall beef purchasing decision. From table 2, almost half of the sample considered country of origin a
very important attribute. Conversely, 15% of the sample believed source origin is unimportant.
Consistent with the finding from Verbeke and Roosen (2009), country of origin is not one of the most
important factors. A larger portion of the sample rated thirteen other attributes as being equally or even
more important than country of origin. Those attributes included taste attributes (freshness, flavor,
tenderness, leanness, and juiciness), and food safety attributes (food borne disease, BSE, nutritional info,
hormones and antibiotics, and traceability).
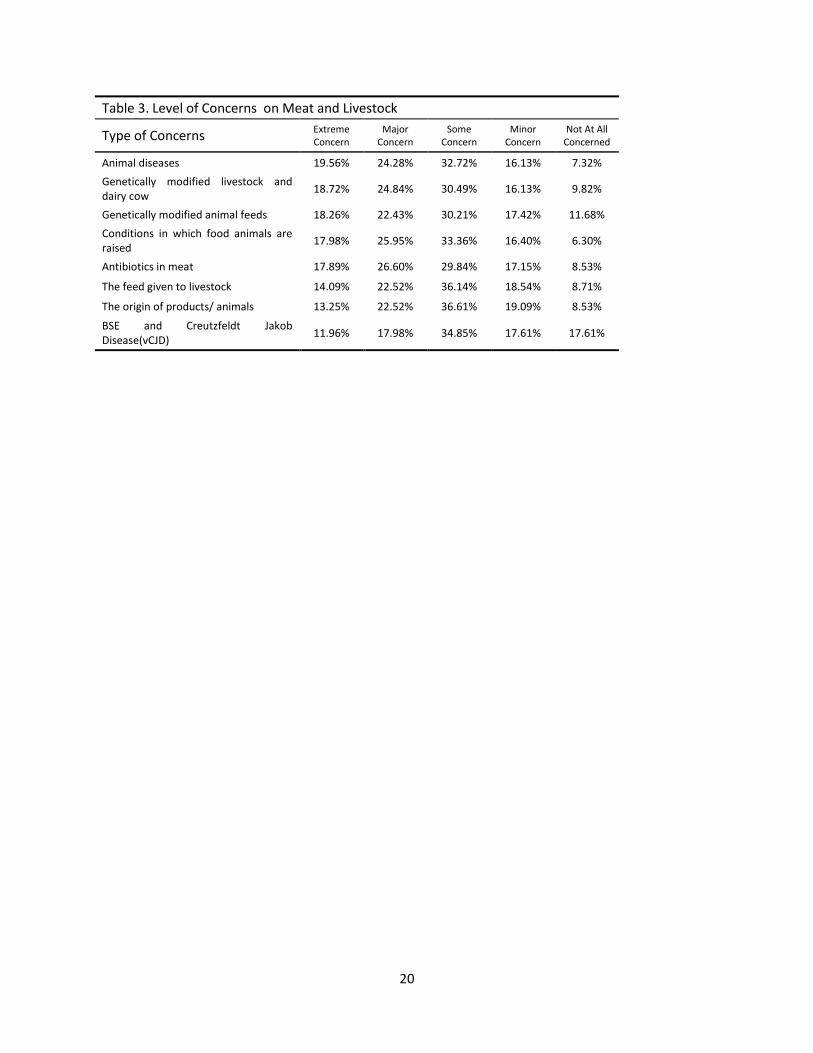
Table 3 reflects consumers’ rating on a related set of concerns regarding beef safety. Similarly, country
of origin is a major concern for about one-third of the respondents. However, more respondents were
concerned about antibiotics residue, humane treatment of livestock, livestock disease, and the usage of
genetically modified livestock and feed than country of origin.
Food manufacturers and retailers are conceivably hesitant to voluntarily employ marketing resources to
label products’ origin, given that the willingness to pay for an attribute is likely to diminish as the
number of attributes offered increases (Gao and Schroeder, 2009). Rather than mandatory country of
origin labeling, these statistics suggest implementations of regulation on BSE testing, traceability, and
monitoring the usage of antibiotics, hormones and GM technology could better ease food safety
concerns of a larger fraction of the U.S. population. Several of these important factors together with
country of origin attribute are analyzed in the conjoint analysis.
Empirical Model
Consumers’ preference on country-of-origin labeled beef steak is estimated with Error Component Logit
Model (MEL). MEL is an extension of the Mixed Logit estimator. It may allow incorporation of taste
9
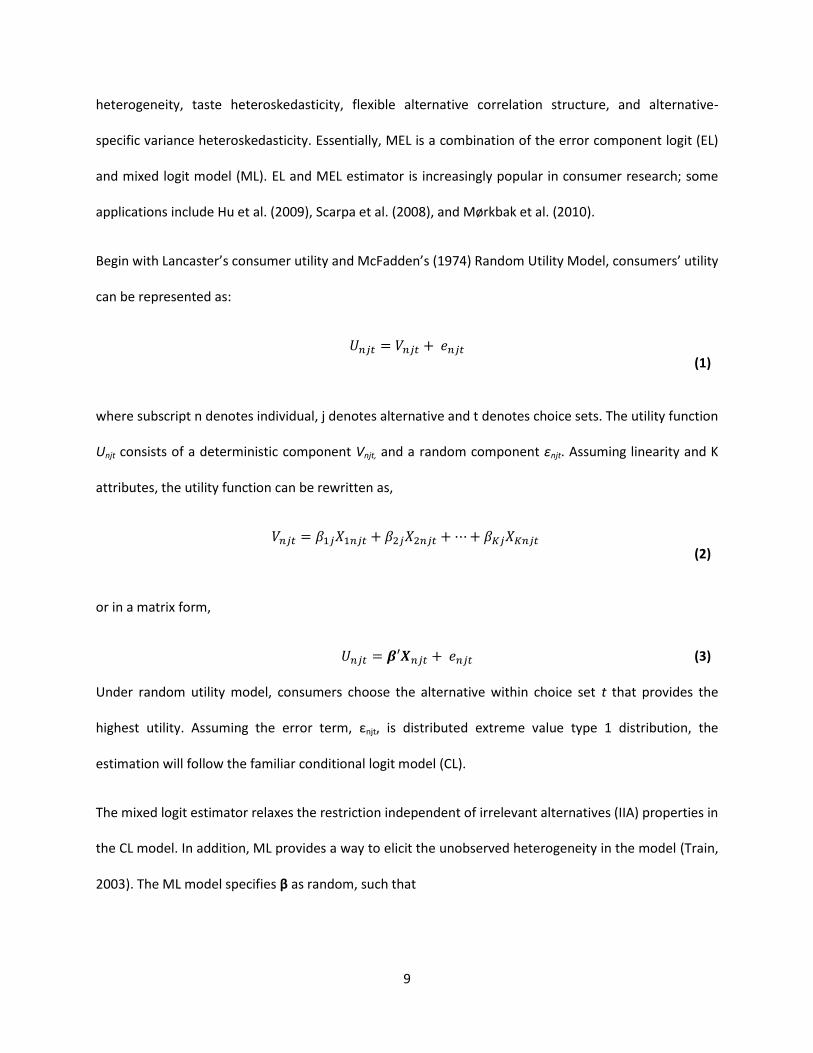
heterogeneity, taste heteroskedasticity, flexible alternative correlation structure, and alternative-
specific variance heteroskedasticity. Essentially, MEL is a combination of the error component logit (EL)
and mixed logit model (ML). EL and MEL estimator is increasingly popular in consumer research; some
applications include Hu et al. (2009), Scarpa et al. (2008), and Mørkbak et al. (2010).
Begin with Lancaster’s consumer utility and McFadden’s (1974) Random Utility Model, consumers’ utility
can be represented as:
(1)
where subscript n denotes individual, j denotes alternative and t denotes choice sets. The utility function
Unjt consists of a deterministic component Vnjt, and a random component εnjt. Assuming linearity and K
attributes, the utility function can be rewritten as,
(2)
or in a matrix form,
(3)
Under random utility model, consumers choose the alternative within choice set t that provides the
highest utility. Assuming the error term, εnjt, is distributed extreme value type 1 distribution, the
estimation will follow the familiar conditional logit model (CL).
The mixed logit estimator relaxes the restriction independent of irrelevant alternatives (IIA) properties in
the CL model. In addition, ML provides a way to elicit the unobserved heterogeneity in the model (Train,
2003). The ML model specifies β as random, such that
10
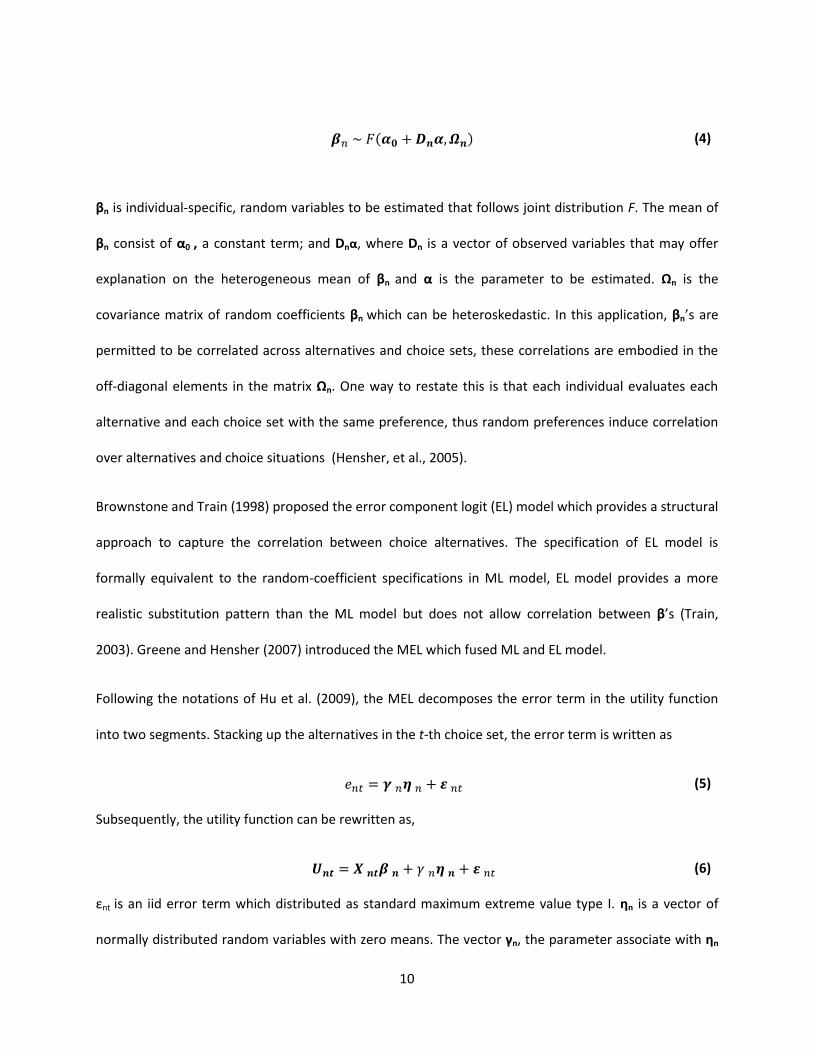
( )
(4)
βn is individual-specific, random variables to be estimated that follows joint distribution F. The mean of
βn consist of α0 , a constant term; and Dnα, where Dn is a vector of observed variables that may offer
explanation on the heterogeneous mean of βn and α is the parameter to be estimated. Ωn is the
covariance matrix of random coefficients βn which can be heteroskedastic. In this application, βn’s are
permitted to be correlated across alternatives and choice sets, these correlations are embodied in the
off-diagonal elements in the matrix Ωn. One way to restate this is that each individual evaluates each
alternative and each choice set with the same preference, thus random preferences induce correlation
over alternatives and choice situations (Hensher, et al., 2005).
Brownstone and Train (1998) proposed the error component logit (EL) model which provides a structural
approach to capture the correlation between choice alternatives. The specification of EL model is
formally equivalent to the random-coefficient specifications in ML model, EL model provides a more
realistic substitution pattern than the ML model but does not allow correlation between β’s (Train,
2003). Greene and Hensher (2007) introduced the MEL which fused ML and EL model.
Following the notations of Hu et al. (2009), the MEL decomposes the error term in the utility function
into two segments. Stacking up the alternatives in the t-th choice set, the error term is written as
(5)
Subsequently, the utility function can be rewritten as,
(6)
εnt is an iid error term which distributed as standard maximum extreme value type I. ηn is a vector of
normally distributed random variables with zero means. The vector γn, the parameter associate with ηn
11
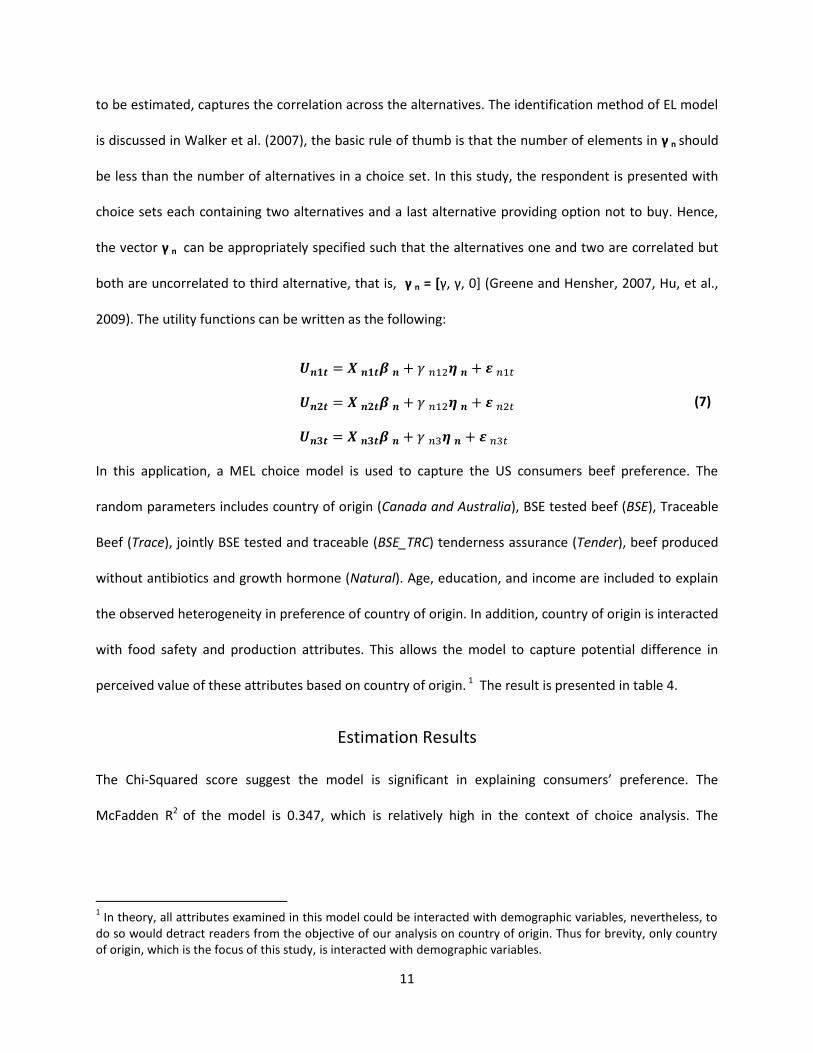
to be estimated, captures the correlation across the alternatives. The identification method of EL model
is discussed in Walker et al. (2007), the basic rule of thumb is that the number of elements in γ n should
be less than the number of alternatives in a choice set. In this study, the respondent is presented with
choice sets each containing two alternatives and a last alternative providing option not to buy. Hence,
the vector γ n can be appropriately specified such that the alternatives one and two are correlated but
both are uncorrelated to third alternative, that is, γ n = [γ, γ, 0] (Greene and Hensher, 2007, Hu, et al.,
2009). The utility functions can be written as the following:
(7)
In this application, a MEL choice model is used to capture the US consumers beef preference. The
random parameters includes country of origin (Canada and Australia), BSE tested beef (BSE), Traceable
Beef (Trace), jointly BSE tested and traceable (BSE_TRC) tenderness assurance (Tender), beef produced
without antibiotics and growth hormone (Natural). Age, education, and income are included to explain
the observed heterogeneity in preference of country of origin. In addition, country of origin is interacted
with food safety and production attributes. This allows the model to capture potential difference in
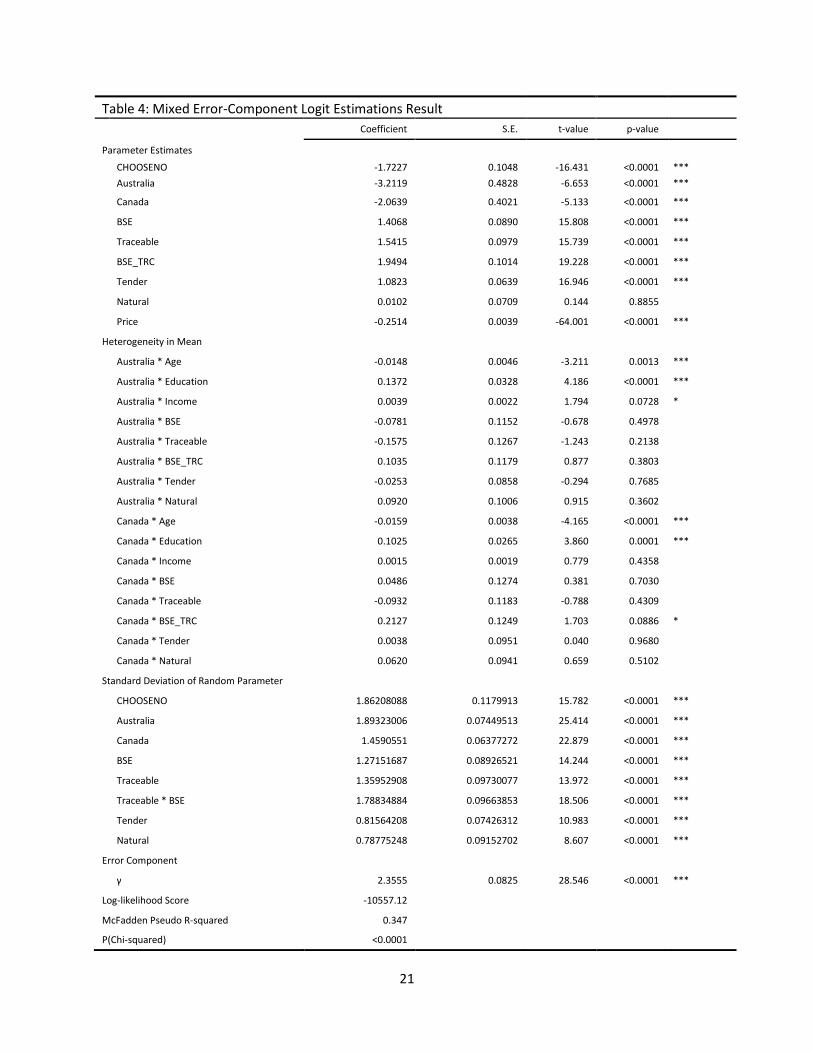
perceived value of these attributes based on country of origin. 1 The result is presented in table 4.
Estimation Results
The Chi-Squared score suggest the model is significant in explaining consumers’ preference. The
McFadden R2 of the model is 0.347, which is relatively high in the context of choice analysis. The
1 In theory, all attributes examined in this model could be interacted with demographic variables, nevertheless, to
do so would detract readers from the objective of our analysis on country of origin. Thus for brevity, only country of origin, which is the focus of this study, is interacted with demographic variables.
12
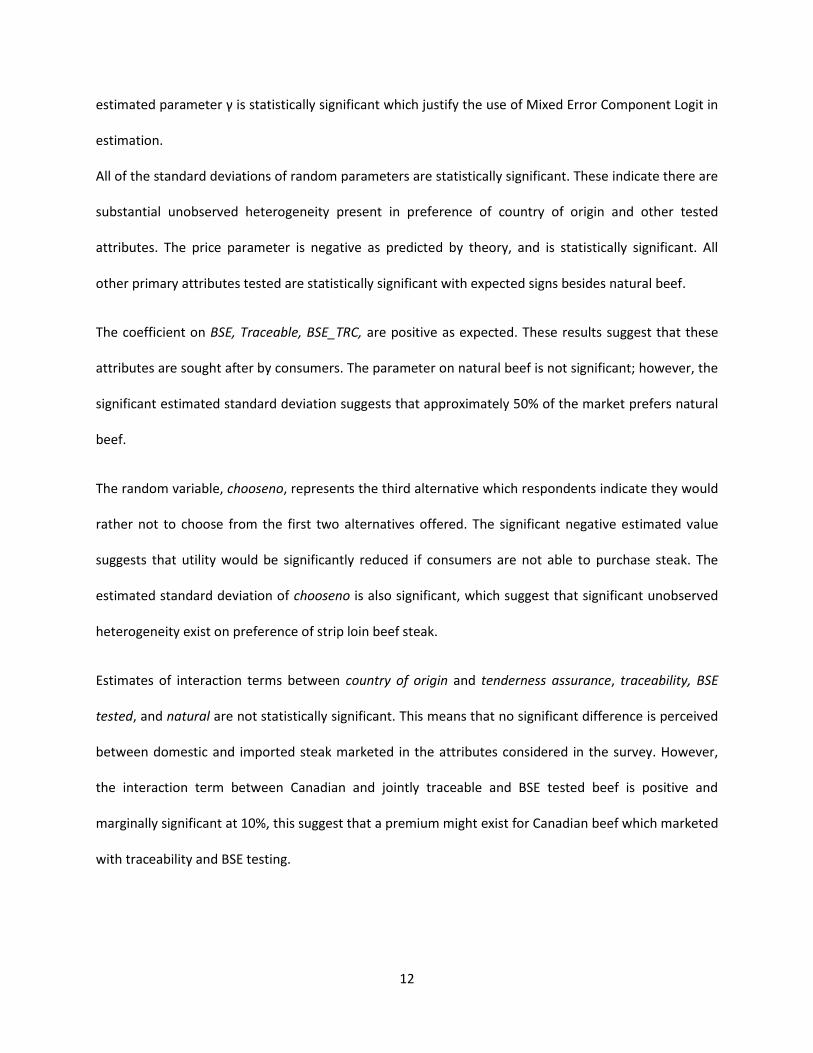
estimated parameter γ is statistically significant which justify the use of Mixed Error Component Logit in
estimation.
All of the standard deviations of random parameters are statistically significant. These indicate there are
substantial unobserved heterogeneity present in preference of country of origin and other tested
attributes. The price parameter is negative as predicted by theory, and is statistically significant. All
other primary attributes tested are statistically significant with expected signs besides natural beef.
The coefficient on BSE, Traceable, BSE_TRC, are positive as expected. These results suggest that these
attributes are sought after by consumers. The parameter on natural beef is not significant; however, the
significant estimated standard deviation suggests that approximately 50% of the market prefers natural
beef.
The random variable, chooseno, represents the third alternative which respondents indicate they would
rather not to choose from the first two alternatives offered. The significant negative estimated value
suggests that utility would be significantly reduced if consumers are not able to purchase steak. The
estimated standard deviation of chooseno is also significant, which suggest that significant unobserved
heterogeneity exist on preference of strip loin beef steak.
Estimates of interaction terms between country of origin and tenderness assurance, traceability, BSE
tested, and natural are not statistically significant. This means that no significant difference is perceived
between domestic and imported steak marketed in the attributes considered in the survey. However,
the interaction term between Canadian and jointly traceable and BSE tested beef is positive and
marginally significant at 10%, this suggest that a premium might exist for Canadian beef which marketed
with traceability and BSE testing.

13
Several demographic interaction variables are statistically significant in explaining U.S. consumers’
choices of beef steaks with different country of origin2. When considering beef steak from Canada and
Australia versus the U.S., individuals with higher education appear to be more likely to tolerate Canadian
and Australian steaks. Conversely, older consumers are less receptive to Canadian and Australian steak
compared to U.S. steak. The magnitude of the impacts of these demographic variables to the country of
origin attribute, as well as the considered product attributes themselves can be best understood in the
context of consumer willingness to pay.
Willingness-to-Pay Estimatations
The WTP values can be interpreted as the amount of compensation or discount necessary to make
consumers indifferent between two levels of utility. WTP for an attribute is calculated as the negative of
the ratio between the coefficient of an attribute variable and the coefficient of price, the WTP for an
attribute is such that:
(8)
where βattribute and βprice are estimated coefficients of a given attribute and price respectively. βattribute*D is
the estimated coefficient of interaction terms between demographic variables and attributes. D is a
vector representing the demographic information of individuals.
The relative willingness to pay for Canadian and Australian strip loin steak over U.S. strip loin steak is
calculated for consumers with various demographic characteristics. The result is presented in table 5. As
the MEL results suggested, age and education are significant factors in the preference of origin. Since
level of education is positively correlated with income level, education and income are grouped for
brevity. Nine profiles are selected based on three education/income levels and three age levels.
2 U.S. steak is the base case, thus not included in the estimation
14
Imported meat products could sell at a discount rather than domestic products commanding a premium,
since the majority of beef consumed in the U.S. is of domestic origin (Brester, et al., 2004). The negative
willingness to pay suggests that on average, consumers need to be compensated for choosing Canadian
or Australian strip loin steak over U.S. strip loin steak. Canadian strip loin steak is preferred over
Australian strip loin steak as indicated by the magnitude of the discount. Older consumers, in
comparison to younger population, are willing to pay less for imported steak. The magnitudes of the
discount also decrease as education and income level of the shopper increases. For example, on
average, the discount on the Canadian steak is $3.46 for a 35.3 year old shopper with household income
of USD80, 000 college degree holders. The discount increases 54% to $5.35 for a same-aged female
shopper with household income of USD30, 000 whose highest education level completed is high school.
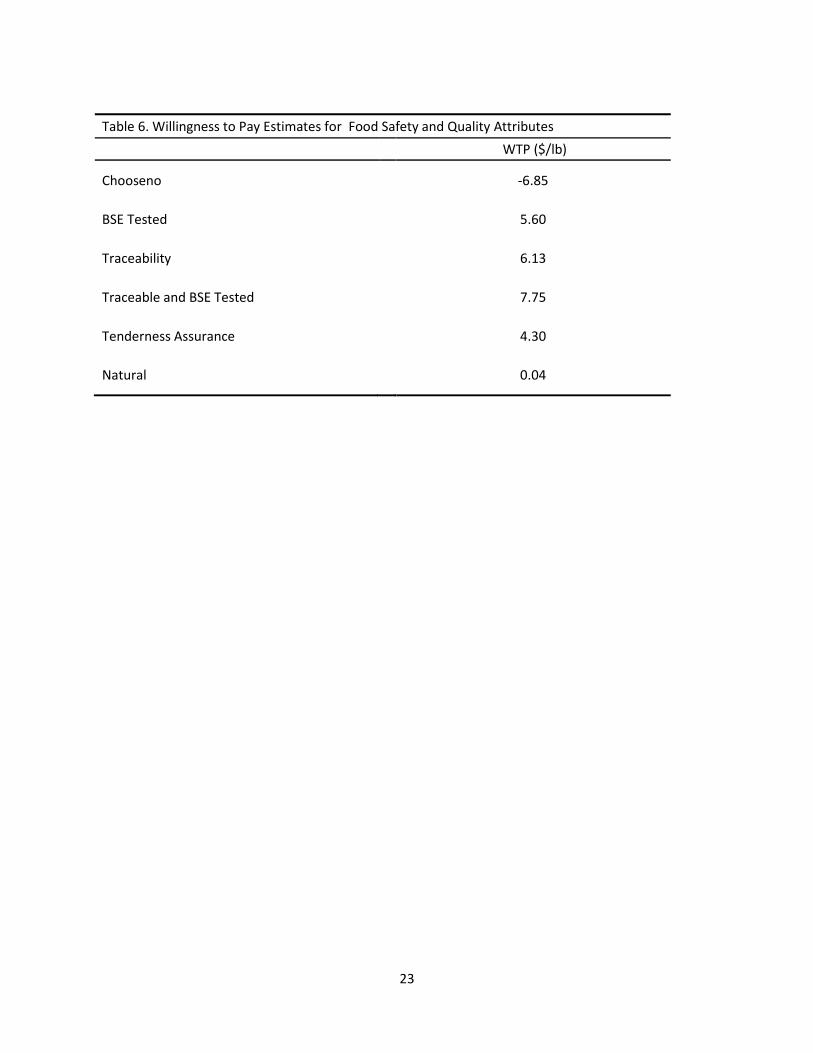
The food safety attributes examined in the model are likely to add value to steaks, the estimated
willingness to pay for these attributes is presented in table 6. Strip loin steak that is traceable from farm
to point of purchase is estimated to have an estimated premium in willingness to pay of $6.13 per
pound. Steak derived from animals that were tested for BSE is estimated to increase the willingness to
pay by $5.60 per pound. Steak with both attributes of traceability and BSE testing garner an estimated
premium of $7.75 per pound. In addition, tenderness assurance is estimated to generate additional
$4.30 per pound of willingness to pay on average.
Premiums and discount of this size are unlikely in practice. One reason is that the WTP estimates
calculated in this study represent the marginal values of the attributes and these values do not reflect a
sustained premium over a long period of time. In addition, various factors such as demand and supply
elasticity, market power, trade and other factors determines the equilibrium retail price (Chung et al,
2009).

15
The WTP estimates for country of origin strongly suggest consumers strongly prefer U.S. steak over
Canadian and Australian steak in general. This means that consumers would require reduction in price
to choose imported steak, which could limit the chance of imported steak being sold in some retail
markets. Further, given the magnitude of the discount, the market share of imported beef are likely to
be decrease in the retail level. Supply of imported beef at retail level could be diverted into food
processing sector or restaurants where COOL is not required.
Governments of beef exporting countries can adopt suitable policies to increase the competitiveness of
their products. Given that the sample average discount for beef labeled as Canadian is on average
$5.55/lb and the premium for BSE testing and traceability is $7.75/lb, the discount Canadian beef
suffered as a consequence of COOL can be mitigated by incorporating BSE testing and traceability.
CONCLUSION
How consumers substitute between domestic and imported beef is an important empirical following the
introduction of COOL. Some Canadian, Mexican and other food exporters to the U.S. are concerned with
the negative impacts of COOL, and have requested WTO intervention. Consumers’ preference of beef
steak of domestic and selected foreign origins, along with other quality and food safety attributes was
investigated in this research.
We found that consumers’ perception of the food safety level of beef is directly associated with country
of origin. This supports proponents’ argument that mandatory country of origin labeling policies could
be valuable for consumers. Origin of beef plays a deciding factor for more than one-third of the sample.
Accordingly, 27.5% of the sample would purchase only domestic beef when given the choice; and only
7% of the sample preferred imported beef over domestic beef. Two-thirds of the sample was indifferent
between imported beef and domestic beef. COOL would exclude a significant portion of the U.S. beef
market from imported beef. Overall, the majority of the U.S. market is receptive to imported beef.
16
The conjoint analysis suggested that U.S. beef consumers are willing to pay significantly less on average
for Canadian and Australian strip loin steak than for similar steak of U.S. origin. Preference for domestic-
origin steak is stronger among older consumer segments, but more moderate among consumers with
higher education levels.
The discount for foreign-origin beef steak might be alleviated by the final rules of COOL which allowed
certain imported products to be labeled as mixed-origin. The willingness-to-pay for mixed-origin steak
was not analyzed in this study, but is a worthwhile investigation for future research.
We also find that in general, U.S. consumers put a premium on beef with traceability, BSE-testing
attributes, and tenderness guarantee. The results underlined the potential for imported and domestic
beef to be marketed with such additional attributes. A more detailed cost and benefit analysis might be
conducted to evaluate the feasibility of incorporating these features into Canadian beef destined for the
U.S. market.
Reference
Brester, G.W., J. Marsh, and J. Jimmerson. "Distributional Impacts of Country-of-Origin Labeling in the U.S. Meat Industry." Montana State University, Department of Agricultural Economics and Economics.
Brownstone, D., and K. Train. 1998. "Forecasting new product penetration with flexible substitution patterns." Journal of econometrics 89(1-2):109-129.
Caswell, J.A., and E.M. Mojduszka. 1996. "Using Informational Labeling to Influence the Market for Quality in Food Products." American Journal of Agricultural Economics 78(5):1248-1253.
Chung, C., T. Zhang, and D.S. Peel. 2009. "Effects of Country of Origin Labeling in the U.S. Meat Industry with Imperfectly Competitive Processors." Agricultural and Resource Economics Review 38(3).
Darby, M., and E. Karni. 1973. "Free competition and the optimal amount of fraud." Journal of law and economics 16(1):67-88.
Gao, Z., and T.C. Schroeder. 2009. "Effects of Label Information on Consumer Willingness-to-Pay for Food Attributes." American Journal of Agricultural Economics 91(3):795-809.
Greene, W.H., and D.A. Hensher. 2007. "Heteroscedastic control for random coefficients and error components in mixed logit." Transportation Research Part E: Logistics and Transportation Review 43(5):610-623.
Hensher, D.A., J.M. Rose, and W.H. Greene. 2005. Applied choice analysis: a primer: Cambridge Univ Pr. Hu, W., K. Boehle, L.J. Cox, and M. Pan. 2009. "Economic values of dolphin excursions in Hawaii: A stated
choice analysis." Marine Resource Economics 24(1).
17
Hu, W., M. Veeman, and W. Adamowicz. 2005. "Labelling genetically modified food: Heterogeneous consumer preferences and the value of information." Canadian Journal of Agricultural Economics/Revue canadienne d'agroeconomie 53(1):83-102.
Ikenson, D.J. (2004) Uncool Rules: Second Thoughts on Mandatory country of Origin Labeling, vol. 7, January 16, 2004 Edition, The Cato Institute.
Jones, K.G., A. Somwaru, and J.B. Whitaker. 2009. "Country of Origin Labeling: Evaluating the Impacts on U.S. and World Markets." Agricultural and Resource Economics Review 38(3).
Krissoff, B., F. Kuchler, K. Nelson, J. Perry, and A. Somwaru. 2004. "Country-of-origin labeling: theory and observation." USDA, ERS, WRS–04–02.
Lancaster, K.J. 1966. "A New Approach to Consumer Theory." The Journal of Political Economy 74(2):132-157.
Loureiro, M.L., and W.J. Umberger. 2005. "Assessing Consumer Preferences for Country-of-Origin Labeling." Journal of Agricultural and Applied Economics 37(01).
Loureiro, M.L., and W.J. Umberger. 2007. "A choice experiment model for beef: What US consumer responses tell us about relative preferences for food safety, country-of-origin labeling and traceability." Food Policy 32(4):496-514.
Loureiro, M.L., and W.J. Umberger. 2003. "Estimating Consumer Willingness to Pay for Country-of-Origin Labeling." Journal of Agricultural and Resource Economics 28(02).
Lusk, J., J. Roosen, and J. Fox. 2003. "Demand for beef from cattle administered growth hormones or fed genetically modified corn: A comparison of consumers in France, Germany, the United Kingdom, and the United States." American Journal of Agricultural Economics 85(1):16-29.
Lusk, J.L., J. Brown, T. Mark, I. Proseku, R. Thompson, and J. Welsh. 2006. "Consumer Behavior, Public Policy, and Country-of-Origin Labeling." Applied Economic Perspectives and Policy 28(2):284-292.
Mørkbak, M.R., T. Christensen, and D. Gyrd-Hansen. 2010. "Consumer preferences for safety characteristics in pork." British Food Journal 112(7):775-791.
Mutondo, J.E., and S.R. Henneberry. 2007. "A Source-Differentiated Analysis of U.S. Meat Demand." Journal of Agricultural and Resource Economics 32(03).
Scarpa, R., M. Thiene, and F. Marangon. 2008. "Using flexible taste distributions to value collective reputation for environmentally friendly production methods." Canadian Journal of Agricultural Economics/Revue canadienne d'agroeconomie 56(2):145-162.
Schupp, A., and J. Gillespie. 2001. "Consumer Attitudes Toward Potential Country-Of-Origin Labeling Of Fresh Or Frozen Beef." Journal of Food Distribution Research 32(03).
Thilmany, D.D., W.J. Umberger, and A.R. Ziehl. 2006. "Strategic market planning for value-added natural beef products: A cluster analysis of Colorado consumers." Renewable Agriculture and Food Systems 21(03):192-203.
Tonsor, G., T. Schroeder, J. Pennings, and J. Mintert. 2009. "Consumer Valuation of Beef Steak Food Safety and Quality Assurances in Canada, Japan, Mexico, and the United States." Canadian Journal of Agricultural Economics 57:395-416.
Train, K. 2003. Discrete choice methods with simulation: Cambridge Univ Pr. Umberger, W.J., D.M. Feuz, C.R. Calkins, and B.M. Sitz. 2003. "Country-Of-Origin Labeling Of Beef
Products: U.S. Consumers' Perceptions." Journal of Food Distribution Research 34(03). USDA, F. (2010) Production, Supply and Distribution Online, United States Department of Agriculture
Foreign Agriculture Service, www.fas.usda.gov/psdonline/psdQuery.aspx. Verbeke, W., and J. Roosen. 2009. "Market Differentiation Potential of Country-of-origin, Quality and
Traceability Labeling." Estey Centre Journal of International Law and Trade Policy 10(1). Walker, J.L., M. Ben Akiva, and D. Bolduc. 2007. "Identification of parameters in normal error
component logit mixture (NECLM) models." Journal of Applied Econometrics 22(6):1095-1125. Wyld, A. (2009) Canada Launches Complaint Over U.S. Meat Labelling Law.
18
Table 1. Sample Descriptive Statistics
Variable Group Percent
Age 15-19 0.93%
20-24 3.52%
25-29 2.22%
30-39 7.78%
40-49 12.70%
50-64 32.25%
65+ 40.59%
Gender Male 47.54%
Female 52.46%
Education <High School 1.11%
High School 23.08%
Some College 39.39%
4 year Degree 24.28%
Graduate 12.14%
Household Income ($) <25k 24.10%
25k-40k 23.54%
40k-65k 23.82%
65k-80k 9.55%
80k-100k 7.32%
100k-120k 6.12%
>120k 5.56%
Freq. shopping grocery Never 1.85%
Sometimes 14.74%
Frequently 83.42%
No. of Child Living in HH 0 81.09%
1 8.80%
2 6.39%
3 or more 3.70%

19
Table 2. Importance of Desirable Factors in Beef Purchase
Factors Very
Important Somewhat Important
Unimportant
Freshness 82.76% 15.11% 2.13%
Flavor 73.86% 21.69% 4.45%
Food Borne Disease 73.03% 21.32% 5.65%
BSE 72.85% 20.39% 6.77%
Tenderness 62.93% 32.25% 4.82%
Leanness 62.28% 33.09% 4.63%
Price 59.31% 35.40% 5.28%
Color 58.02% 36.52% 5.47%
Use of Hormones 56.81% 33.36% 9.82%
Use of Antibiotics 55.79% 35.22% 8.99%
Nutritional Info 54.31% 38.00% 7.69%
Juiciness 50.42% 41.71% 7.88%
Traceability Back to Farm 49.49% 39.02% 11.49%
Country of Origin 45.78% 38.46% 15.76%
Labeled Natural 40.04% 39.76% 20.20%
Preparation Ease 38.18% 45.51% 16.31%
Preparation Time 35.31% 44.95% 19.74%
Labeled Organic 30.40% 38.28% 31.33%
20
Table 3. Level of Concerns on Meat and Livestock
Type of Concerns Extreme Concern
Major Concern
Some Concern
Minor Concern
Not At All Concerned
Animal diseases 19.56% 24.28% 32.72% 16.13% 7.32%
Genetically modified livestock and dairy cow
18.72% 24.84% 30.49% 16.13% 9.82%
Genetically modified animal feeds 18.26% 22.43% 30.21% 17.42% 11.68%
Conditions in which food animals are raised
17.98% 25.95% 33.36% 16.40% 6.30%
Antibiotics in meat 17.89% 26.60% 29.84% 17.15% 8.53%
The feed given to livestock 14.09% 22.52% 36.14% 18.54% 8.71%
The origin of products/ animals 13.25% 22.52% 36.61% 19.09% 8.53%
BSE and Creutzfeldt Jakob Disease(vCJD)
11.96% 17.98% 34.85% 17.61% 17.61%
21
Table 4: Mixed Error-Component Logit Estimations Result
Coefficient S.E. t-value p-value
Parameter Estimates
CHOOSENO -1.7227 0.1048 -16.431 <0.0001 ***
Australia -3.2119 0.4828 -6.653 <0.0001 ***
Canada -2.0639 0.4021 -5.133 <0.0001 ***
BSE 1.4068 0.0890 15.808 <0.0001 ***
Traceable 1.5415 0.0979 15.739 <0.0001 ***
BSE_TRC 1.9494 0.1014 19.228 <0.0001 ***
Tender 1.0823 0.0639 16.946 <0.0001 ***
Natural 0.0102 0.0709 0.144 0.8855
Price -0.2514 0.0039 -64.001 <0.0001 ***
Heterogeneity in Mean
Australia * Age -0.0148 0.0046 -3.211 0.0013 ***
Australia * Education 0.1372 0.0328 4.186 <0.0001 ***
Australia * Income 0.0039 0.0022 1.794 0.0728 *
Australia * BSE -0.0781 0.1152 -0.678 0.4978
Australia * Traceable -0.1575 0.1267 -1.243 0.2138
Australia * BSE_TRC 0.1035 0.1179 0.877 0.3803
Australia * Tender -0.0253 0.0858 -0.294 0.7685
Australia * Natural 0.0920 0.1006 0.915 0.3602
Canada * Age -0.0159 0.0038 -4.165 <0.0001 ***
Canada * Education 0.1025 0.0265 3.860 0.0001 ***
Canada * Income 0.0015 0.0019 0.779 0.4358
Canada * BSE 0.0486 0.1274 0.381 0.7030
Canada * Traceable -0.0932 0.1183 -0.788 0.4309
Canada * BSE_TRC 0.2127 0.1249 1.703 0.0886 *
Canada * Tender 0.0038 0.0951 0.040 0.9680
Canada * Natural 0.0620 0.0941 0.659 0.5102
Standard Deviation of Random Parameter
CHOOSENO 1.86208088 0.1179913 15.782 <0.0001 ***
Australia 1.89323006 0.07449513 25.414 <0.0001 ***
Canada 1.4590551 0.06377272 22.879 <0.0001 ***
BSE 1.27151687 0.08926521 14.244 <0.0001 ***
Traceable 1.35952908 0.09730077 13.972 <0.0001 ***
Traceable * BSE 1.78834884 0.09663853 18.506 <0.0001 ***
Tender 0.81564208 0.07426312 10.983 <0.0001 ***
Natural 0.78775248 0.09152702 8.607 <0.0001 ***
Error Component
γ 2.3555 0.0825 28.546 <0.0001 ***
Log-likelihood Score -10557.12
McFadden Pseudo R-squared 0.347
P(Chi-squared) <0.0001

22
Table 5. Willingness to Pay Estimates for Canadian and Australia Strip Loin Steaks over U.S. Strip Loin Steaks
Canadian Steak
Australian Steak
($/lb) ($/lb)
Higher Income, Higher Education
Income= $80K, Education = 16yrs
Age=35.3 -3.46 -4.87
Age=45.0 -4.07 -5.44
Age=56.62 -5.79 -7.66
Sample average Income and Education
Income= $52.37K, Education = 14.58yrs
Age=35.3 -4.20 -6.08
Age=45.0 -4.81 -6.65
Age=56.62 -5.55 -7.34
Lower Income, Lower Education
Income= $30k, Education= 12yrs
Age=35.3 -5.35 -7.75
Age=45.0 -5.96 -8.32
Age=56.62 -6.70 -9.01
23
Table 6. Willingness to Pay Estimates for Food Safety and Quality Attributes
WTP ($/lb)
Chooseno -6.85
BSE Tested 5.60
Traceability 6.13
Traceable and BSE Tested 7.75
Tenderness Assurance 4.30
Natural 0.04
24
Figure 1. U.S. Consumers Preference on Origin of Beef
Percent, Argentina, 0.28%,
0.3%
Percent, Australia, 1.20%, 1.2%
Percent, New Zealand, 0.93%,
0.9% Percent, Canada,
4.36%, 4.4%
U.S. 27.5%
Indifferent between domestic and imported beef
65.7%

25
Figure 2. U.S. Consumers Perceived Food Safety Level on Beef by Country
0.00%
10.00%
20.00%
30.00%
40.00%
50.00%
60.00%
70.00%
U.S. Canada Australia NewZealand
Brazil UnknownOrigin
No Opinion
Low
Moderate
High
26
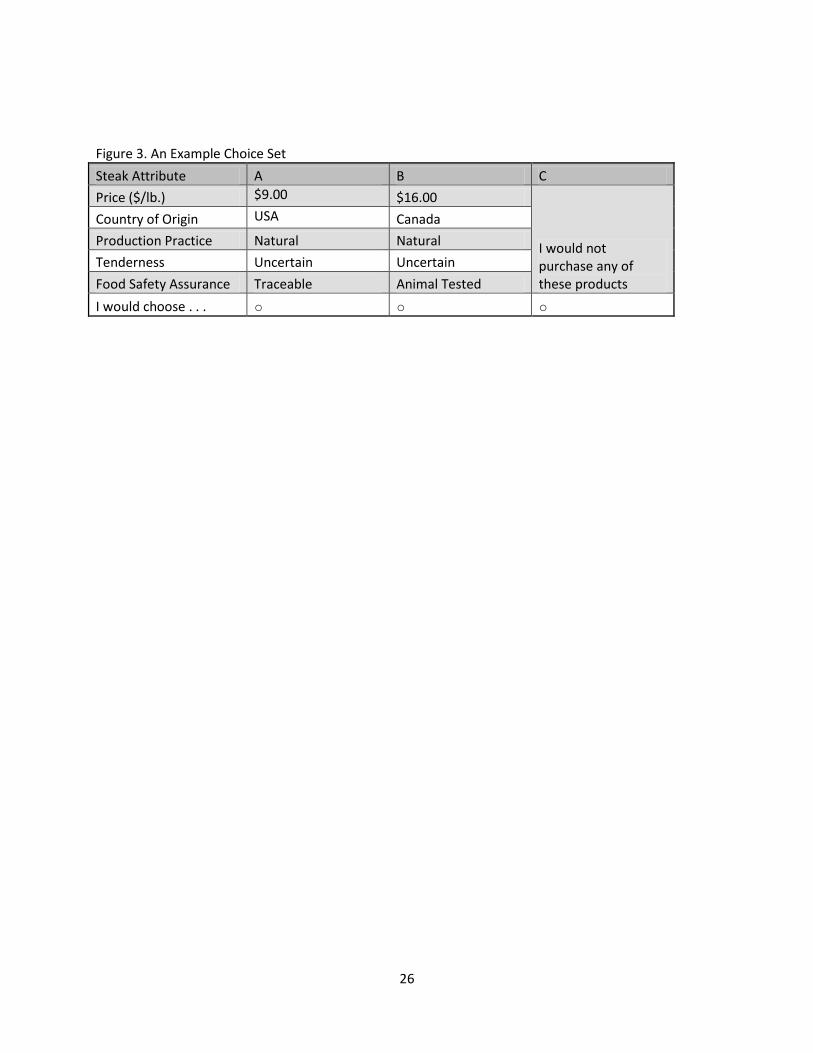
Figure 3. An Example Choice Set
Steak Attribute A B C
Price ($/lb.) $9.00 $16.00
I would not purchase any of these products
Country of Origin USA Canada
Production Practice Natural Natural
Tenderness Uncertain Uncertain
Food Safety Assurance Traceable Animal Tested
I would choose . . . ○ ○ ○
27
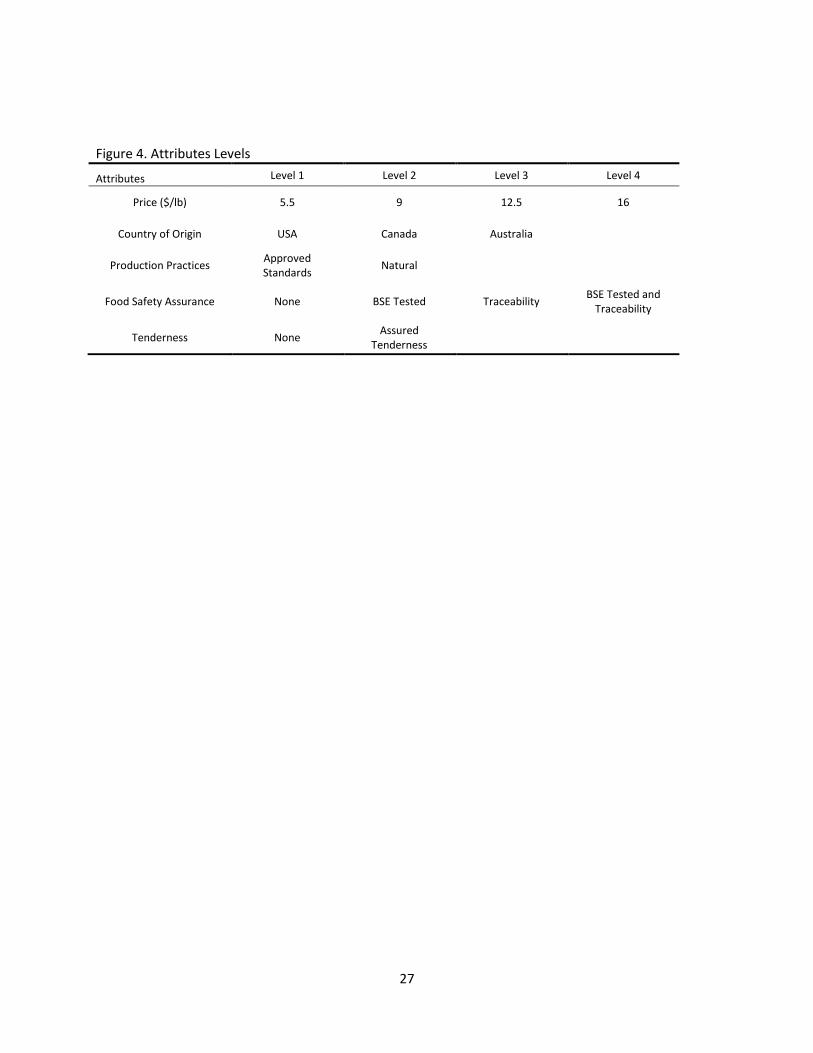
Figure 4. Attributes Levels
Attributes Level 1 Level 2 Level 3 Level 4
Price ($/lb) 5.5 9 12.5 16
Country of Origin USA Canada Australia
Production Practices Approved Standards
Natural
Food Safety Assurance None BSE Tested Traceability BSE Tested and
Traceability
Tenderness None Assured
Tenderness