mark a. cohen* and alex r. piquero benefits and costs … (1988,2000) and cohen et al. (2004)...
TRANSCRIPT

J. Benefit Cost Anal. 2015, 1–25doi:10.1017/bca.2015.50
c© Society for Benefit-Cost Analysis, 2015
Mark A. Cohen* and Alex R. Piquero
Benefits and Costs of a Targeted InterventionProgram for Youthful Offenders:The YouthBuild USA Offender Project
Abstract: This paper reports on a benefit-cost analysis of a targeted interventionprogram, the YouthBuild USA Offender Project (YBOP), aimed at low-income,criminal offenders who are 16–24 years old. Using data on 388 participants, wefind: (1) evidence of reduced recidivism and improved educational outcomes thatexceed our expectations based on similar cohorts and (2) evidence consistent witha positive benefit-cost ratio, indicating that every dollar spent on the YBOP is esti-mated to produce a return on investment between $7.20 and $21.60, with benefits tosociety ranging between $174,000 and $281,000 per participant at a cost to societybetween $13,000 and $24,000.
Keywords: benefit-cost analysis; delinquency; education and human capital; high-risk youth; high school graduation; law and regulation; other social policy; recidi-vism.
JEL classifications: D61; K42; I21.
1 Introduction
A significant proportion of street crimes are committed by a small number ofoffenders – most of whom begin their criminal careers as juveniles (Blumsteinet al., 1986; Piquero, Farrington & Blumstein, 2003; Wolfgang, Figlio & Sellin,1972). For example, based on a longitudinal analysis of over 27,000 individu-als born in 1958 in Philadelphia, Cohen and Piquero (2009, Table 2) estimatedthat those with two or more police contacts through age 26 represent 12% of the
*Corresponding author: Mark A. Cohen, Justin Potter Professor of AmericanCompetitive Enterprise and Professor of Law, Vanderbilt University, 401 21st AvenueSouth, Nashville, TN 37203, USAandResources for the Future, Washington, DC, USA, e-mail: [email protected] R. Piquero: Ashbel Smith Professor of Criminology, School of Economic, Politicaland Policy Sciences, University of Texas - Dallas, 800 W. Campbell Road, Richardson,TX 75080, USA

2 Mark A. Cohen and Alex R. Piquero
population and yet account for 86% of all offenses, while those with six or morepolice contacts represent 3.6% of the population and account for about half of alloffenses. Aggregating the estimated cost of a lifetime of crime, drug abuse, lack ofeducation, and contact with the criminal justice system, Cohen and Piquero (2009)estimated the present value of the monetary value of “saving” one of these high-riskyouth (with 6+ police contacts) to be $2.6–$5.3 million. Thus, programs targetinghigh-risk youth have the potential for tremendous benefits if they are successful inturning a youth around from a life of crime.
The use of benefit-cost analysis is relatively new in the criminal justice policyarena. Early attempts to introduce benefit-cost analysis in the 1980s often underes-timated the benefits of crime reduction by counting only the out-of-pocket victimlosses and criminal justice costs – ignoring pain, suffering, and lost quality of life tovictims and costs to the public at large such as fear or avoidance behaviors. Cohen(1988, 2000) and Cohen et al. (2004) introduced methodologies such as revealedpreference and willingness to pay commonly used in studies of traffic and workersafety and environmental protection into criminal justice policy analysis. As littleas 10–15 years ago, benefit-cost studies in criminal justice were rare. For example,a systematic review of the criminal sentencing literature in 2003 (McDougall et al.,2003) found only nine benefit-cost analyses – many of which were described ashaving “poor methodological quality” (see also Welsh & Farrington, 2006). Morerecently, benefit-cost analyses of crime reduction programs have begun to appear inthe academic literature – including studies on the long-term crime benefits of earlychildhood education (e.g., Schweinhart, Barnes & Weikart, 1993; Belfield et al.,2006), programs targeting high-risk juveniles (Farrington & Koegl, 2015), and adultincarceration (Owens, 2009). A more recent review of the crime prevention litera-ture (Welsh, Farrington & Gowar, 2015) identifies only 23 benefit-cost studies since2000 on such varied topics as preschool programs, cognitive-behavioral programsfor youthful offenders, and situational crime prevention programs such as improvedstreet lighting.
The first known use of benefit-cost analysis in a criminal justice policy set-ting appears to have been in Washington State beginning in the 1990s (see e.g.,Aos & Drake, 2010 and more generally http://www.wsipp.wa.gov/BenefitCost). Atthe behest of the state legislature, the Washington State Institute for Public Policy(WSIPP) conducts systematic meta-analyses of outcome evaluations in the areas ofjuvenile justice, adult criminal justice, child welfare, education, children’s mentalhealth, health care, substance abuse, adult mental health, and public health preven-tion, and then attempts to estimate what these programs would cost and what theirbenefits would be if adopted in Washington. The federal government’s first known

Benefits and Costs of YouthBuild Offender Project 3
use of benefit-cost analysis in a criminal justice setting was in the context of prisonrape regulation in 2012 (U.S. Department of Justice, 2012).
This paper adds to the small but growing set of benefit-cost analyses in crimi-nal justice by analyzing the YouthBuild USA Offender Project (YBOP) – a targetedintervention focussing on criminal offenders who are 16–24 years old. The pro-gram was designed to improve both educational and vocational outcomes as well asreduce recidivism. Section 2 describes the YBOP and summarizes an earlier studycomparing educational and criminal justice outcomes of participants (both suc-cessful graduates and dropouts) before and after entering the program. Next, inSection 3, we compare the YBOP sample to similar youth cohorts. We find evi-dence of reduced recidivism and improved educational outcomes that exceed ourexpectations based on similar cohorts. Section 4 compares the potential benefitsof the YBOP to its costs and finds considerable evidence consistent with a posi-tive benefit-cost ratio. Section 5 considers the extent to which our findings on theYBOP can be generalized to other YouthBuild (YB) programs. Finally, Section 6summarizes our findings.
2 The YouthBuild USA Offender Project
The YBOP is a program targeting recent juvenile or young adult offenders whowere either diverted by a court to avoid incarceration, referred by the criminal jus-tice system through reentry following incarceration, or who otherwise had servedtime in jail or prison (Leslie, 2007, 15). The YBOP program was funded for 3years by the Department of Labor starting in 2004. Participants in the YBOP wereintegrated into the existing YB program – a comprehensive program targeting low-income young adults with troubled pasts.1 YouthBuild programs are funded througha combination of public grants and private donations. Among others, the YB pro-gram has received funding from the Department of Labor and formal recognitionby Congress.2
According to the Department of Labor’s description of the YB program(http://www.doleta.gov/youth services/youthbuild.cfm):
YouthBuild is a community-based alternative education program that pro-vides job training and educational opportunities for at-risk youth ages 16–24.
1 Throughout this paper, we distinguish between “YouthBuild” (YB), which is the generic programoffered to all participants, and the “YouthBuild USA Offender Project” (YBOP), which targets priorcriminal offenders. As noted, participants are mixed in the program and thus the costs associated withboth programs are the same. However, the outcome measures – and hence benefits estimated here –apply only to the YBOP population.2 “YouthBuild Transfer Act,” Public Law 109-281, September 22, 2006; 29 USC 2801 note.

4 Mark A. Cohen and Alex R. Piquero
Youth learn construction skills while constructing or rehabilitating afford-able housing for low-income or homeless families in their own neighbor-hoods. Youth split their time between the construction site and the classroom,where they earn their GED or high school diploma, learn to be communityleaders, and prepare for college and other postsecondary training opportu-nities. YouthBuild includes significant support systems, such as a mentor-ing, follow-up education, employment, and personal counseling services; andparticipation in community service and civic engagement. There are over 220DOL funded YouthBuild programs in 43 states serving over 6000 youth peryear.
Thus, while including job training and education, YB goes beyond these indi-vidual needs and includes personal counseling, and participants become part of anongoing community of alumni and staff. Since 1994, YB has served over 130,000students in the United States aged 16–24, with more recent expansion to over 15countries (www.youthbuild.org/our-impact).
To date, only a handful of impact evaluations have been conducted on either theYB or YBOP programs (Hahn et al., 2004; Leslie, 2007; Abrazaldo et al., 2009).While providing evidence consistent with positive outcomes, these earlier studieswere based on self-reported success of YB graduates, and did not have control orcomparison groups. More recently, Levine (2012) surveyed 344 YB graduates whohad been identified as being active “leaders” in the YB network. These alumnireported significant improvements in the stability and productivity of their livesas well as increased civic activities. While largely anecdotal, the study reported onindividual graduates who went on to successful careers as nurses, youth counselors,ministers, and even serving in public office.3
A study in Minnesota attempted to conduct a benefit-cost analysis for the state’sinvestment in YB (Minnesota Department of Employment and Economic Develop-ment, 2003). Purely from the perspective of state expenditures, it was estimatedthat Minnesota’s budget saved about $3.00 for every dollar it spent on the YB pro-gram.4 About one third of this benefit was estimated to be additional tax revenuecollected from YB graduates who now have higher earnings, while the remainder ofthe benefit is estimated to be reduced prison costs due to lower recidivism. Whileinteresting, one cannot generalize from this study to other states or to an over-all social benefit-cost study, primarily because the study limited its focus to direct
3 Notably, the individuals interviewed by Levine (2012) were not necessarily candidates (or members)of the YouthBuild Offender program. For example, only 16% of respondents reported they had beenincarcerated prior to their YB experience.4 Over a 4-year period, program costs were estimated to be $3.5 million compared to $10.8 million inbenefits (Minnesota Department of Employment and Economic Development, 2003, Figure 6).

Benefits and Costs of YouthBuild Offender Project 5
expenditures. For example, the State of Minnesota spent an average of only $2200per program participant – probably about 15% of total program costs. However,benefits are also likely to be underestimated as they exclude reduced costs associ-ated with rearrests, trials, probation, and so on; and instead focus solely on reducedprison costs.
More recently, Cohen and Piquero (2010) evaluated 388 YBOP participantsby comparing graduates to dropouts. Tables 1 and 2 reproduce the descriptivestatistics shown in Tables 1 and 2 in Cohen and Piquero (2010), showing both par-ticipant characteristics at the time of entry (starting from the fourth quarter of 2004)and outcomes through the second quarter of 2007. The average age of participantswas 19.6 years at program entry and data were available for an average of 10.3quarters (3.6 quarters in the program and 6.8 quarters after completion or dropout).Only 11% of the participants had a General Educational Development (GED) orhigh school degree at the time of entry. At the time of follow-up, 58% of those whoentered without a degree and completed the YBOP program had earned either ahigh school or GED (compared to only 18% of those who dropped out of the YBOPprogram). Forty-one percent of participants reported a substance abuse problem atthe time of entry. Virtually all participants had a prior arrest, 60% had served time injuvenile detention, and 40% in an adult correctional facility. Throughout the entireevaluation period, 28% of graduates and 44% of dropouts had at least one othercriminal encounter (conviction, incarceration, or parole revocation).
It is possible that not all of the outcome differences found between graduatesand dropouts are explained by the program itself. To control for systematic dif-ferences in those who enter the program, a treatment effect model was estimated(Cohen & Piquero, 2010, 382). The first stage of the treatment effect model esti-mated a probit equation explaining graduation from the program. The most sig-nificant explanatory variable was prior juvenile or adult detention (as opposed tooffenders who were diverted from juvenile detention or prison) – participants witha prior detention had a significantly lower chance of YBOP graduation. The sec-ond stage of the treatment effect model thus controls for the expected YBOP grad-uation rate and finds that actual graduation from YBOP was a significant factorexplaining successful outcomes – measured three different ways: (a) high schoolor GED graduation, (b) high school graduation itself, or (c) any criminal violationpostentry.
To briefly summarize our earlier findings, YBOP graduates were significantlymore likely to receive a GED or to graduate from high school and less likely to havebeen convicted of a criminal violation (postentry) than dropouts. Thus, for offenderswho enter and complete the YBOP program, they are more likely to receive a GEDor high school degree and less likely to recidivate than those who drop out from this

6 Mark A. Cohen and Alex R. Piquero
Table 1 Characteristics of YouthBuild Offender Project graduates and dropouts at the timeof entry.
Total YB YB Sample sizes P-valuegraduate dropout (graduate/dropout/
total)
Demographics
Age 19.62 19.50 19.90 166/99/265 0.18
Male 0.85 0.85 0.85 272/116/388 0.92
Non-White 0.76 0.78 0.72 272/116/388 0.24
Married 0.02 0.01 0.03 272/116/388 0.45
High school or GED at entry 0.11 0.12 0.11 272/116/388 0.96
High school at entry 0.06 0.07 0.05 272/116/388 0.59
GED at entry 0.05 0.05 0.06 272/116/388 0.61
Household income $8784 $9573 $7023 199/89/288 0.03
Working at entry 0.09 0.09 0.10 272/116/388 0.64
Prior Record
Prior arrest 0.97 0.96 0.99 268/111/379 0.11
Prior misdemeanor 0.70 0.69 0.73 226/96/322 0.44
Prior felony 0.46 0.42 0.57 232/97/329 0.02
Served time in juvenile 0.60 0.57 0.68 272/116/388 0.04
detention
Served time in adult 0.40 0.36 0.48 271/116/387 0.03
correctional facility
Intensive aftercare program 0.33 0.30 0.40 271/116/387 0.05
at time of entry
Substance abuse problem 0.41 0.42 0.37 170/68/238 0.43
at time of entry
Undergoing substance abuse 0.14 0.13 0.17 163/65/228 0.51
treatment at time of entry
Living Situation
Living in group home 0.02 0.01 0.02 272/116/388 0.85
Living in half-way house 0.03 0.01 0.06 272/116/388 0.01
Homeless 0.03 0.02 0.05 272/116/388 0.07
Living in public housing 0.10 0.09 0.12 272/116/388 0.33
Foster child 0.04 0.04 0.04 272/116/388 0.90
Student on public assistance 0.28 0.28 0.28 272/116/388 0.98
Family on public assistance 0.32 0.30 0.34 272/115/387 0.51
Lives with parents 0.63 0.67 0.53 272/116/388 0.01
Lives by self 0.10 0.08 0.15 272/116/388 0.07

Benefits and Costs of YouthBuild Offender Project 7
Table 2 Program outcomes for YouthBuild Offender Project graduates and dropouts.
Total YB YB Sample sizes P-valuegraduate dropout (graduate/dropout/
total)
Number of quarters in program 3.6 4.0 2.4 258/106/364 0.00
Number of quarters after program 6.8 6.4 7.6 258/106/364 0.00
Total number of quarters 10.3 10.4 10.0 272/116/388 0.00
High school/GED after program entry 0.46 0.58 0.18 242/103/345 0.00
(only those who entered without
degree, n = 345)
High school after program entry 0.19 0.24 0.05 242/103/345 0.00
(n = 345)
GED after program entry (n = 345) 0.28 0.34 0.14 242/103 /345 0.00
Percentage of Students
(a) After Entry
Convicted of crime 0.12 0.11 0.14 272/116/388 0.44
Incarcerated 0.18 0.15 0.27 272/116/388 0.00
Parole revocation 0.18 0.13 0.29 272/116/388 0.00
Any of the above 0.33 0.28 0.44 272/116/388 0.00
Percentage of Students
(b) After Departure
Convicted of crime 0.06 0.05 0.09 263/108/371 0.16
Incarcerated 0.13 0.09 0.21 263/108/371 0.00
Parole revocation 0.12 0.08 0.20 263/108/371 0.00
Any of the above 0.21 0.17 0.33 263/108/371 0.00
Percentage of Quarters
(a) After Entry
Convicted of crime 0.02 0.01 0.02 272/116/388 0.28
Incarcerated 0.03 0.02 0.05 272/116/388 0.00
Parole revocation 0.03 0.02 0.05 272/116/388 0.00
Any of the above 0.08 0.06 0.12 272/116/388 0.00
Percentage of Quarters
(b) After Departure
Convicted of crime 0.01 0.01 0.02 253/106/359 0.12
Incarcerated 0.03 0.02 0.05 253/106/359 0.02
Parole revocation 0.03 0.02 0.04 253/106/359 0.01
Any of the above 0.07 0.05 0.11 253/106/359 0.00
Note: Convictions and incarcerations are only counted if the offense occurred subsequent to programentry. Parole revocations are for incidents that occur after entry – even if the underlying crime wascommitted prior to entry.

8 Mark A. Cohen and Alex R. Piquero
program. Of course, YBOP participants are necessarily a selected sample. While itis not possible ex post to randomize the selection process into the YBOP program,the current study builds on this earlier analysis by comparing YBOP participantsto two similar cohorts and monetizes the costs and potential benefits of the YBOPprogram.
3 Comparison of YouthBuild offender sample tosimilar youth
While we have found significant increases in high school or GED graduation ratesand what appear to be improvements in offending behavior following participationin the YBOP program, we do not know if these positive outcomes are the resultof the YBOP program itself or if participants would have had similar outcomes inthe absence of program participation. For example, it is possible that YBOP partic-ipants are a highly selected sample of students who are motivated to further theireducation and refrain from criminal offending – and would have done so regard-less. Ideally, potential participants would be randomly assigned to a treatment andcontrol group so that we could compare outcomes in these two groups. Instead,we know only a little about their selection criteria. We do know, however, that“YouthBuild programs have always welcomed young adults who have been con-victed of crimes, as long as they show a sincere desire to work hard to achieve apositive lifestyle. Applicants are not rejected based on any specific crime commit-ted . . . Sometimes they are mandated to participate, sometimes their relatives insistthat they do something positive. Sometimes they just want a GED or a job.” (Leslie,2007, 11–12).
In the absence of such an experimental design, we are able to make somecomparisons to a similar youth cohort. In the case of high school graduation, thebest data available on the likelihood that high school dropouts will subsequentlygraduate with a degree or GED is the National Longitudinal Survey of Youth(“NLSY97”).5 The NLSY97 cohort began in 1997 with about 9000 youth aged14–21 at the time, with follow-up interviews annually. Thus, we are able to esti-mate the percentage of high school dropouts who ultimately obtain their high schooldiploma or GED after originally dropping out of high school. Table 3 reports thesegraduation rates. For example, for respondents who had dropped out in 1998, 8.4%had received their high school diploma or GED after 1 year, 11.6% by year 2, and
5 See http://www.bls.gov/nls/nlsy97.htm for details. The figures reported here have been computeddirectly from these survey data.

Benefits and Costs of YouthBuild Offender Project 9
Table 3 High school and GED graduation rate for dropouts: National Longitudinal YouthSurvey 1997.
Dropout in year: Year 1 (%) Year 2 (%) Year 3 (%) Year 4 (%) Year 5 (%)
1998 (n = 560) 8.4 11.6 12.7 13.7 16.8
1999 (n = 350) 6.9 14.4 14.8 15.0 15.8
2000 (n = 330) 9.6 15.0 18.3 20.1 —
2001 (n = 240) 7.8 11.9 13.7 — —
16.8% by year 5. Overall, Table 3 suggests a 2-year cumulative graduation or GEDrate of about 12%–15% and a 3–5-year rate of 18%–20% for youth who originallydrop out of high school. This is similar to findings from an earlier study of theNLSY79 by Mishel and Roy (2006, 18) who report a 22.3% completion rate afterabout 13 years.6
In the YBOP sample, 43 out of 388 entered with a high school degree or GED.As shown in Table 2, of the remaining 345 high school dropouts, 159 (46.1%)received their GED or high school degree at some point within the time period mea-sured (10 quarters on average). This is more than three times the 2-year graduationrate in the NLSY97 survey and more than twice the 3–5-year graduation rate shownin Table 3. Interestingly, the high school/GED graduation rate for those who dropout of the YBOP program is very similar to the NLSY97 survey – about 18%. Thehigh school graduation rate for those who successfully complete the YBOP pro-gram is 58%, a difference that is highly statistically significant (p < 0.01). Thus,the YBOP program is estimated to result in up to a 40% higher high school or GEDgraduation rate for incoming participants who enter without a degree. Since 89% ofthose who enter the YBOP program had dropped out of high school prior to entry,the program is estimated to result in an “excess” high school or GED graduationrate, among those who enter the program, of 35.6% (89% × 40%). Later, we usethis 35.6% “excess” graduation rate as an estimate of the educational benefits of theYBOP program – the additional GED or high school graduation rate for all YBOPparticipants – regardless of whether or not they successfully complete the program.
In the case of criminal outcomes, we have compared the YBOP sample tothe Second Philadelphia Birth Cohort sample (“Philadelphia Cohort”) – a com-prehensive dataset of police contacts (obtained from the Juvenile Aid Division of
6 Mishel and Roy (2006) report that 8.5% of respondents had dropped out at the time of initial “com-pletion” of their schooling, compared to 6.6% at final follow-up. Thus, 1.9% of the population subse-quently received a high school degree or GED, which represents 22% of those who initially dropped out(1.9/8.5 = 22.3%).

10 Mark A. Cohen and Alex R. Piquero
the Philadelphia Police Department) for all youth born in Philadelphia in 1958 andwho resided in the city until age 18 (Figlio, Tracy & Wolfgang, 1994). The Philadel-phia Cohort data, which followed these youth through age 26, are among the bestdata sources for studying long-term patterns of juvenile delinquency and criminalactivity (Piquero et al., 2003). While this cohort is about 25 years older than theYBOP sample, it is the most recent available. We also note that the crime rates inthe United States during these two time periods are similar. For example, the violentcrime rate in the United States was 468 per 100,000 in 1976 when the PhiladelphiaCohort turned 18, compared to 463 in 2004, the first year of our YBOP sample.7
Of course, this does not mean that the rate of individual offending over time willbe the same for these offenders. If anything however, the rate of youth offending ishigher than it was in previous decades.8 As shown below, the Philadelphia Cohortsample allows us to identify youth at any age by prior police contact status.9 Sincevirtually all YBOP students enter with a prior offending record, we can use thesetwo samples for comparison purposes.
We compared the “recidivism rate”10 of YBOP students to that of the Philadel-phia Cohort sample. As shown in Table 2, we have approximately 10 quarters ofdata on the YBOP students – including their time in the program. Table 4 exam-ines the “recidivism rate” for the Philadelphia Cohort by age. For the PhiladelphiaCohort sample, for example, 16-year-olds are those youth who had at least onepolice contact at age 16. The recidivism rate is defined as the percentage of these16-year-olds who had at least one police contact at either age 17 or 18. Thus, 45.0%of 16-year-olds in the Philadelphia Cohort who had a police contact that year had atleast one additional police contact between ages 17 and 18. In the case of the YBOPparticipants, we do not know when their preentry police contacts occurred – but we
7 The Federal Bureau of Investigation Uniform Crime Report (1995 and 2006). However, propertycrime rates were higher in 1976 (4819 per 100,000) than in 2004 (3514 per 100,000). We note that themassive increase in crime rates began around 1979–1980 and these rates began to drop beginning around1995.8 Brame et al. (2011) compared reported arrest rates from the 1960s to the 1997 National LongitudinalSurvey of Youth, and found that by age 23 about 22% of youth had been arrested in the older sample,compared to 30% more recently. Although not directly comparable, in the Philadelphia Cohort data,23% of those through age 26 had at least one police contact (Cohen & Piquero, 2009, Table 2).9 In the case of juveniles, prior police contacts in the Philadelphia Cohort data include many incidentsthat are not crimes (e.g., truancy). We have eliminated from consideration any police contacts wherethere was no alleged criminal offense. Even then, however, not all of these police contacts ultimatelyresult in an arrest as police will sometimes refer the youth to a remedial program without a formal arrest.Thus, in the case of juveniles, our measure of recidivism might not be completely comparable. However,in the case of adults, the Philadelphia Cohort data include only arrests.10 Recidivism in the YBOP refers to any conviction, incarceration, or parole revocation, while recidi-vism in the Philadelphia Cohort data refers to any police contact involving a criminal offense (in thecase of juveniles) or any arrest (in the case of adults).

Benefits and Costs of YouthBuild Offender Project 11
Tabl
e4
Two-
year
reci
divi
smra
tein
Phila
delp
hia
Coh
ortd
ata
vers
usov
eral
lrec
idiv
ism
rate
inY
outh
Bui
ldO
ffen
derP
roje
ctsa
mpl
e.
Phila
delp
hia
Yout
hBui
ldYo
uthB
uild
Coh
ort
stud
ents
grad
uate
s(c
ombi
ned)
only
Age
Num
ber
Rec
idiv
ism
NR
ecid
ivis
mP-
valu
eN
Rec
idiv
ism
P-va
lue
rate
Rat
eR
ate
(2ye
ars)
(10
quar
ters
)(1
0qu
arte
rs)
(%)
(%)
(%)
1617
9345
.011
18.2
0.05
38
0—
1715
9332
.741
34.2
0.84
829
34.5
0.84
4
1810
8040
.349
38.8
0.82
932
21.9
0.01
9
1991
940
.940
27.5
0.06
825
24.0
0.06
4
2079
741
.436
38.9
0.76
224
33.3
0.42
0
2180
440
.329
37.9
0.79
814
33.3
0.58
9
2275
340
.020
15.0
0.00
710
0—
2375
235
.616
31.3
0.72
18
37.5
0.92
0
2414
42.9
257
28.6
Com
bine
dag
e16
–23
39.6
232
33.3
0.04
514
327
.30.
000
Com
bine
den
tire
YB
sam
ple
39.6
388
32.7
0.00
427
228
.30.
001
12 Mark A. Cohen and Alex R. Piquero
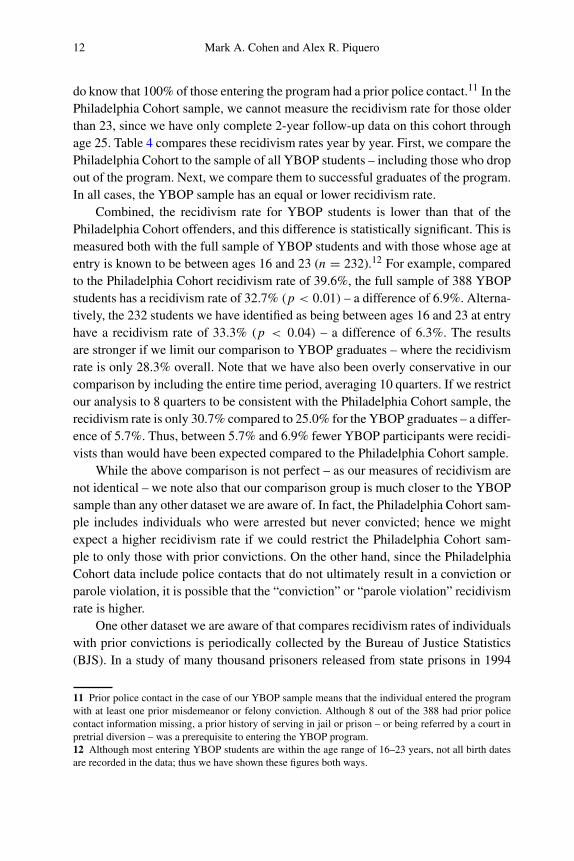
do know that 100% of those entering the program had a prior police contact.11 In thePhiladelphia Cohort sample, we cannot measure the recidivism rate for those olderthan 23, since we have only complete 2-year follow-up data on this cohort throughage 25. Table 4 compares these recidivism rates year by year. First, we compare thePhiladelphia Cohort to the sample of all YBOP students – including those who dropout of the program. Next, we compare them to successful graduates of the program.In all cases, the YBOP sample has an equal or lower recidivism rate.
Combined, the recidivism rate for YBOP students is lower than that of thePhiladelphia Cohort offenders, and this difference is statistically significant. This ismeasured both with the full sample of YBOP students and with those whose age atentry is known to be between ages 16 and 23 (n = 232).12 For example, comparedto the Philadelphia Cohort recidivism rate of 39.6%, the full sample of 388 YBOPstudents has a recidivism rate of 32.7% (p < 0.01) – a difference of 6.9%. Alterna-tively, the 232 students we have identified as being between ages 16 and 23 at entryhave a recidivism rate of 33.3% (p < 0.04) – a difference of 6.3%. The resultsare stronger if we limit our comparison to YBOP graduates – where the recidivismrate is only 28.3% overall. Note that we have also been overly conservative in ourcomparison by including the entire time period, averaging 10 quarters. If we restrictour analysis to 8 quarters to be consistent with the Philadelphia Cohort sample, therecidivism rate is only 30.7% compared to 25.0% for the YBOP graduates – a differ-ence of 5.7%. Thus, between 5.7% and 6.9% fewer YBOP participants were recidi-vists than would have been expected compared to the Philadelphia Cohort sample.
While the above comparison is not perfect – as our measures of recidivism arenot identical – we note also that our comparison group is much closer to the YBOPsample than any other dataset we are aware of. In fact, the Philadelphia Cohort sam-ple includes individuals who were arrested but never convicted; hence we mightexpect a higher recidivism rate if we could restrict the Philadelphia Cohort sam-ple to only those with prior convictions. On the other hand, since the PhiladelphiaCohort data include police contacts that do not ultimately result in a conviction orparole violation, it is possible that the “conviction” or “parole violation” recidivismrate is higher.
One other dataset we are aware of that compares recidivism rates of individualswith prior convictions is periodically collected by the Bureau of Justice Statistics(BJS). In a study of many thousand prisoners released from state prisons in 1994
11 Prior police contact in the case of our YBOP sample means that the individual entered the programwith at least one prior misdemeanor or felony conviction. Although 8 out of the 388 had prior policecontact information missing, a prior history of serving in jail or prison – or being referred by a court inpretrial diversion – was a prerequisite to entering the YBOP program.12 Although most entering YBOP students are within the age range of 16–23 years, not all birth datesare recorded in the data; thus we have shown these figures both ways.
Benefits and Costs of YouthBuild Offender Project 13
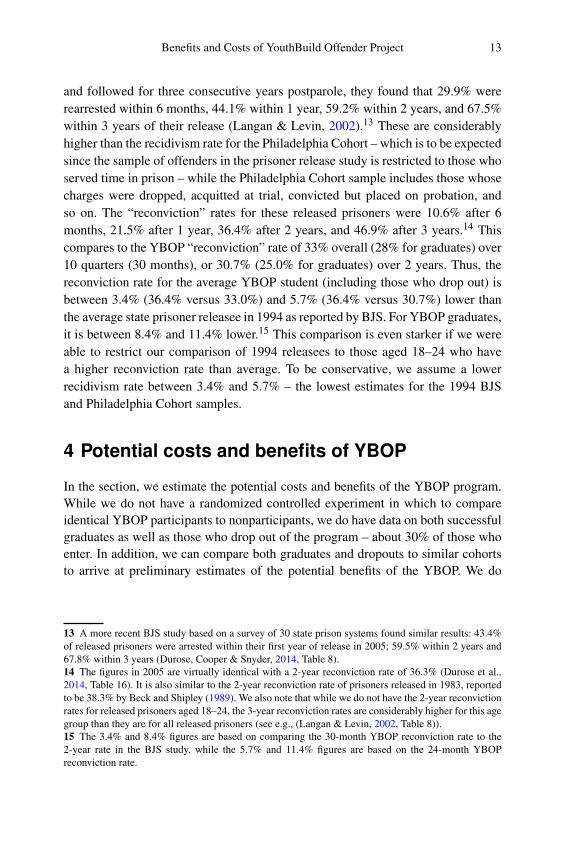
and followed for three consecutive years postparole, they found that 29.9% wererearrested within 6 months, 44.1% within 1 year, 59.2% within 2 years, and 67.5%within 3 years of their release (Langan & Levin, 2002).13 These are considerablyhigher than the recidivism rate for the Philadelphia Cohort – which is to be expectedsince the sample of offenders in the prisoner release study is restricted to those whoserved time in prison – while the Philadelphia Cohort sample includes those whosecharges were dropped, acquitted at trial, convicted but placed on probation, andso on. The “reconviction” rates for these released prisoners were 10.6% after 6months, 21.5% after 1 year, 36.4% after 2 years, and 46.9% after 3 years.14 Thiscompares to the YBOP “reconviction” rate of 33% overall (28% for graduates) over10 quarters (30 months), or 30.7% (25.0% for graduates) over 2 years. Thus, thereconviction rate for the average YBOP student (including those who drop out) isbetween 3.4% (36.4% versus 33.0%) and 5.7% (36.4% versus 30.7%) lower thanthe average state prisoner releasee in 1994 as reported by BJS. For YBOP graduates,it is between 8.4% and 11.4% lower.15 This comparison is even starker if we wereable to restrict our comparison of 1994 releasees to those aged 18–24 who havea higher reconviction rate than average. To be conservative, we assume a lowerrecidivism rate between 3.4% and 5.7% – the lowest estimates for the 1994 BJSand Philadelphia Cohort samples.
4 Potential costs and benefits of YBOP
In the section, we estimate the potential costs and benefits of the YBOP program.While we do not have a randomized controlled experiment in which to compareidentical YBOP participants to nonparticipants, we do have data on both successfulgraduates as well as those who drop out of the program – about 30% of those whoenter. In addition, we can compare both graduates and dropouts to similar cohortsto arrive at preliminary estimates of the potential benefits of the YBOP. We do
13 A more recent BJS study based on a survey of 30 state prison systems found similar results: 43.4%of released prisoners were arrested within their first year of release in 2005; 59.5% within 2 years and67.8% within 3 years (Durose, Cooper & Snyder, 2014, Table 8).14 The figures in 2005 are virtually identical with a 2-year reconviction rate of 36.3% (Durose et al.,2014, Table 16). It is also similar to the 2-year reconviction rate of prisoners released in 1983, reportedto be 38.3% by Beck and Shipley (1989). We also note that while we do not have the 2-year reconvictionrates for released prisoners aged 18–24, the 3-year reconviction rates are considerably higher for this agegroup than they are for all released prisoners (see e.g., (Langan & Levin, 2002, Table 8)).15 The 3.4% and 8.4% figures are based on comparing the 30-month YBOP reconviction rate to the2-year rate in the BJS study, while the 5.7% and 11.4% figures are based on the 24-month YBOPreconviction rate.

14 Mark A. Cohen and Alex R. Piquero
this for both educational attainment and recidivism, two key life course outcomes.To place all benefits and costs on an equal footing, all dollars are converted to2007 – the year in which the program outcomes are measured.
Program costs
Mitchell et al. (2003) evaluated the YB program and reported the average cost perprogram participant to be $14,830 in 2001 dollars, or $20,302 when constructioncosts are included (Mitchell et al., 2003, 73). They also note that trainee wages andstipends accounted for approximately 27% of program budgets (excluding con-struction costs). Thus, approximately $4004 per program participant was spenton trainee wages and stipends. While Mitchell et al. (2003, Exhibit III-3) reportthat program costs vary widely from state to state, average additional programcost categories (excluding construction costs) included education and training costs(35%), leadership development, counseling and support services (14%), adminis-trative costs (12%), outreach and recruitment activities (7%), and job placement andfollow-up (5%). (According to the U.S. Department of Housing and Urban Devel-opment [HUD] regulations, administrative costs are not to exceed 15% of totalcosts.) Combining the trainee wages with construction costs, about half of the costof the YB program ($9476) is transferred to participants or used for constructinglow-cost housing and hence provides a direct transfer benefit that is likely to exceedits social costs. While these costs are real, they are a transfer from taxpayers toother members of society who directly benefit through earnings and/or homes thatare being constructed, and thus would not generally be considered a cost in a socialbenefit-cost analysis.16 The other half ($10,826) would be considered the socialcost of the program. Converting these figures to 2007 dollars (increasing by 20% toaccount for the increase in average hourly wage rates in the United States),17 socialcosts are estimated to be $13,000 and total program costs (including constructionmaterials) to be approximately $24,000 per participant. In comparison, the costsof incarcerating an adult for 1 year averaged over $30,000 in 2010 (Henrichson& Delaney, 2012) and the costs of incarceration in a typical juvenile facility forthe same 1-year period are much higher, typically of the order of $100,000 (Naginet al., 2006).
16 See for example, Cohen (2005) for a more detailed discussion of social costs versus transfer pay-ments and Boardman et al. (2011, 297–307) for a discussion in the context of employment and trainingprograms.17 According to the Bureau of Labor Statistics, the average hourly earnings in private nonagriculturalindustries in the United States were $17.44 in 2007, compared to $14.55 in 2001 – a 19.9% increase.See Economic Report of the President (2013, Table B-47). This is slightly higher than the increase inconsumer prices over this time period, about 17.1%.

Benefits and Costs of YouthBuild Offender Project 15
Program benefits: high school education
One measure of improved educational attainment is the value of additional employ-ment opportunities and wages. While the YBOP data provide some evidence onimproved educational outcomes, it lacks any data on earnings postgraduation andonly sporadic data on preentry earning capacity. For example, preentry earningsdata are available on only 57 out of the 388 participants, and earnings data duringthe program for 160 participants. The average preprogram earnings for those 57 stu-dents were $225 per week, while the average earnings during the program for the160 students with data were $326 per week. For those 28 students where data arecontained, average earnings significantly increased from $254 to $347 per week.Of course, earnings during the YBOP program are largely obtained through theprogram itself – and hence a better assessment would be to compare postgraduateearnings. In the absence of such data, comparisons of lifetime earnings of generichigh school graduates to high school dropouts are presented.
Cohen and Piquero (2009) estimate the present value of future benefits fromsaving a youth from dropping out of high school to range between $420,000 and$630,000 (in 2007 dollars). Applying this to the 35.6% excess graduation rate esti-mated above (the additional 2-year graduation rate above that is expected for highschool dropouts more generally) yields potential educational benefits of $150,000to $225,000 per program participant. If this were the only benefit of the YBOP pro-gram, the benefit-cost ratio would thus range from 11.5 to 17.3 based on $13,000cost per participant. Even if the higher program cost of $24,000 is used, the benefit-cost ratio would range from 6.2 to 9.4. Put differently, to “break even” at a costof $13,000 per program participant, between 2% and 3% of all YBOP participantswould have to obtain a high school or GED degree as a result of the program, whilethe actual rate is estimated to be 35.6%. At a cost of $24,000, an excess gradua-tion rate of between 4% and 6% would be required for the program to break even.Note that some of these benefits are “nonpecuniary” (such as the value of a moreinformed public, health benefits from better education, etc.). Even focussing solelyon the lost productivity and value of fringe benefits (see Cohen & Piquero, 2009,Table 11), potential benefits total $350,000 – or $125,000 per program participant– significantly higher than the costs.
Program benefits: lower recidivism
As noted in the previous section, it is estimated that between 3.4% and 5.7% of par-ticipants who otherwise would have been expected to recidivate were not convicted
16 Mark A. Cohen and Alex R. Piquero
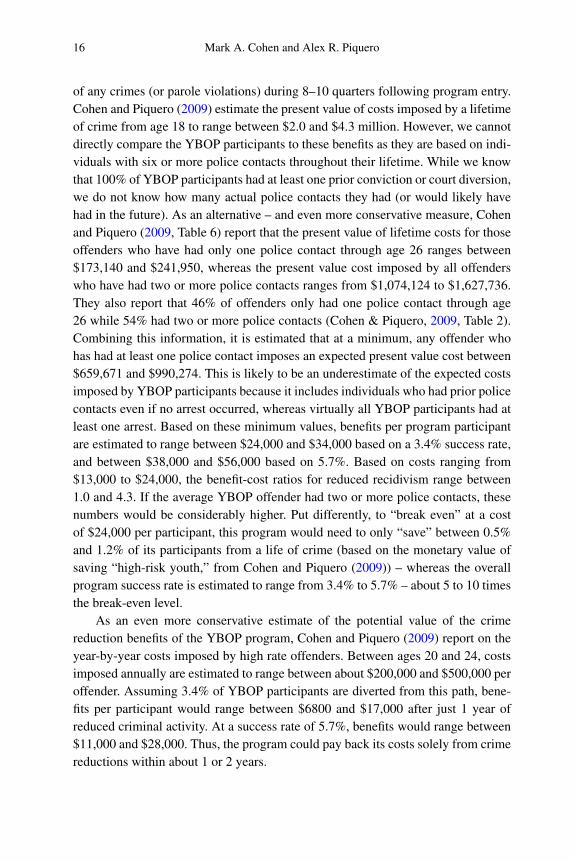
of any crimes (or parole violations) during 8–10 quarters following program entry.Cohen and Piquero (2009) estimate the present value of costs imposed by a lifetimeof crime from age 18 to range between $2.0 and $4.3 million. However, we cannotdirectly compare the YBOP participants to these benefits as they are based on indi-viduals with six or more police contacts throughout their lifetime. While we knowthat 100% of YBOP participants had at least one prior conviction or court diversion,we do not know how many actual police contacts they had (or would likely havehad in the future). As an alternative – and even more conservative measure, Cohenand Piquero (2009, Table 6) report that the present value of lifetime costs for thoseoffenders who have had only one police contact through age 26 ranges between$173,140 and $241,950, whereas the present value cost imposed by all offenderswho have had two or more police contacts ranges from $1,074,124 to $1,627,736.They also report that 46% of offenders only had one police contact through age26 while 54% had two or more police contacts (Cohen & Piquero, 2009, Table 2).Combining this information, it is estimated that at a minimum, any offender whohas had at least one police contact imposes an expected present value cost between$659,671 and $990,274. This is likely to be an underestimate of the expected costsimposed by YBOP participants because it includes individuals who had prior policecontacts even if no arrest occurred, whereas virtually all YBOP participants had atleast one arrest. Based on these minimum values, benefits per program participantare estimated to range between $24,000 and $34,000 based on a 3.4% success rate,and between $38,000 and $56,000 based on 5.7%. Based on costs ranging from$13,000 to $24,000, the benefit-cost ratios for reduced recidivism range between1.0 and 4.3. If the average YBOP offender had two or more police contacts, thesenumbers would be considerably higher. Put differently, to “break even” at a costof $24,000 per participant, this program would need to only “save” between 0.5%and 1.2% of its participants from a life of crime (based on the monetary value ofsaving “high-risk youth,” from Cohen and Piquero (2009)) – whereas the overallprogram success rate is estimated to range from 3.4% to 5.7% – about 5 to 10 timesthe break-even level.
As an even more conservative estimate of the potential value of the crimereduction benefits of the YBOP program, Cohen and Piquero (2009) report on theyear-by-year costs imposed by high rate offenders. Between ages 20 and 24, costsimposed annually are estimated to range between about $200,000 and $500,000 peroffender. Assuming 3.4% of YBOP participants are diverted from this path, bene-fits per participant would range between $6800 and $17,000 after just 1 year ofreduced criminal activity. At a success rate of 5.7%, benefits would range between$11,000 and $28,000. Thus, the program could pay back its costs solely from crimereductions within about 1 or 2 years.

Benefits and Costs of YouthBuild Offender Project 17
Table 5 Potential costs and benefits of YouthBuild Offender Project (2007 dollars).
Benefits “Social” benefit-cost “Program” benefit-costratio ($13,000 cost) ratio ($24,000 cost)
Education aloneMinimum $150,000 11.5 6.2
Maximum $225,000 17.3 9.4
Crime aloneMinimum $24,000 1.8 1.0
Maximum $56,000 4.3 2.3
CombinedMinimum $174,000 13.3 7.2
Maximum $281,000 21.6 11.7
Note: “Social” benefit-cost ratio ignores transfer payments. “Program” benefit-cost ratio is based on theactual out-of-pocket costs to YouthBuild (including grant money received); see text.
Combined with the estimated range of $150,000 to $225,000 benefits fromimproved educational attainment, the total benefits from the YBOP program arethus estimated to range between $174,000 and $281,000 – excluding any potentialbenefits from reduced drug abuse. The benefit-cost ratio is thus estimated to rangebetween 13.3 and 21.6 based on the social costs of $13,000 per participant or 7.2–11.7 based on the program costs of $24,000. Put differently, every dollar spent onthe YBOP program will return between about $7.20 and $11.70 to taxpayers andothers who donate to the program. In terms of social costs, every dollar spent isestimated to return between $13.30 and $21.60. These figures are shown in Table 5.
Program benefits: reduced drug abuse
Finally, approximately 40% of program participants reportedly had a substanceabuse problem at the time of entry. While there are no YBOP program outcomesavailable on this dimension, Cohen and Piquero (2009) estimate the present value oflifetime costs for a heavy drug abuser at age 18 to range from $950,000 to $1.1 mil-lion. (Heavy drug abusers were defined as the 3.5 million Americans who reportedusing cocaine, crack, methamphetamine, or heroin in the previous month basedon a recent drug abuse survey; see Substance Abuse and Mental Health ServicesAdministration (SAMHSA, 2007)). Ignoring crimes committed by drug abusers(since crimes are already accounted for in the reduced recidivism estimates) andsimply focussing on reduced productivity, medical costs, and so on, the costs range

18 Mark A. Cohen and Alex R. Piquero
between $230,000 and $350,000. To see the potential value of YBOP, if only 10%of program participants with substance abuse problems overcome a heavy drugabuse problem, the benefit “per participant” would range from $9000 to $14,000 –nearly the cost of the program itself. Put differently, at a cost of $24,000 per pro-gram participant, YBOP would break even solely on the drug abuse reduction ben-efits if between 7% and 11% of program participants were diverted from a heavydrug abuse career. Since approximately 40% of program participants reportedlyentered with a drug abuse problem, this would require a “success” rate of 17.5% to27.5% for those entering with a drug abuse problem. These figures are only illus-trative however, as it is unknown what fraction of the 40% of YBOP participantsare “heavy drug abusers” – the definition used by Cohen and Piquero (2009), whichis more restrictive than simply drug abusers “in need of treatment.” Thus, while abreak-even analysis for drug abuse has been provided, no data on which to estimatethe likely drug abuse benefits of the YBOP program exists at this time.
5 How do YouthBuild Offender Project studentscompare to other YouthBuild students?
While this paper largely analyzes the YBOP, the model used for that program isvirtually identical to that of the more general YB program itself – with the keydifference being that the Offender Project specifically targets offenders. To comparethe outcomes of the YBOP to the overall YB program, we obtained data on 1694YB students where sufficient demographic information as well as prior educationaland offending records existed. Though not a random sample, there is no reason tobelieve it is biased in any way – other than perhaps coming from locations that arebetter organized (as they are more likely to systematically collect data).
Of the 1694 incoming YB students, 1003 (59.2%) ultimately graduated fromthe program. This is lower than the 70.1% graduation rate for the 388 YBOP par-ticipants. As shown in Table 6, the profile of YB graduates and dropouts vary. Forexample, YB graduates entered the program with a higher educational attainmenton average (10.3% graduates entering with a degree versus 7.5% of dropouts). Theywere also less likely to have a criminal background.
While the profile of the typical YB student is similar to that of the YBOPparticipant, they are not identical. For example, while about 2/3 of YB students aremale, this figure is higher (85%) for the YBOP. The YBOP students are also slightlymore likely to have a high school diploma or GED at entry (11%) compared to theoverall sample (9.1%). Similarly, while virtually all YBOP students entered with a

Benefits and Costs of YouthBuild Offender Project 19
Table 6 Comparison of YouthBuild graduates to dropouts: demographics, prior educationalattainment, and criminal background.
YouthBuild YouthBuild P-valuegraduates (n = 1003) dropouts (n = 691)
Prior high school/GED 0.103 0.075 0.000
Male 0.68 0.65 0.290
Non-White 0.73 0.74 0.724
Married 0.04 0.04 0.853
Household income $10,071 $9052 0.039
Prior arrest 0.60 0.65 0.049
Prior misdemeanor 0.42 0.47 0.040
Prior felony 0.21 0.24 0.167
Prior juvenile detention 0.29 0.39 0.000
Prior adult corrections 0.22 0.27 0.013
Any prior offense 0.68 0.63 0.022
Prior substance abuse 0.34 0.40 0.022
prior criminal record, only about 2/3 of the more general YB sample have a priorarrest or criminal record.
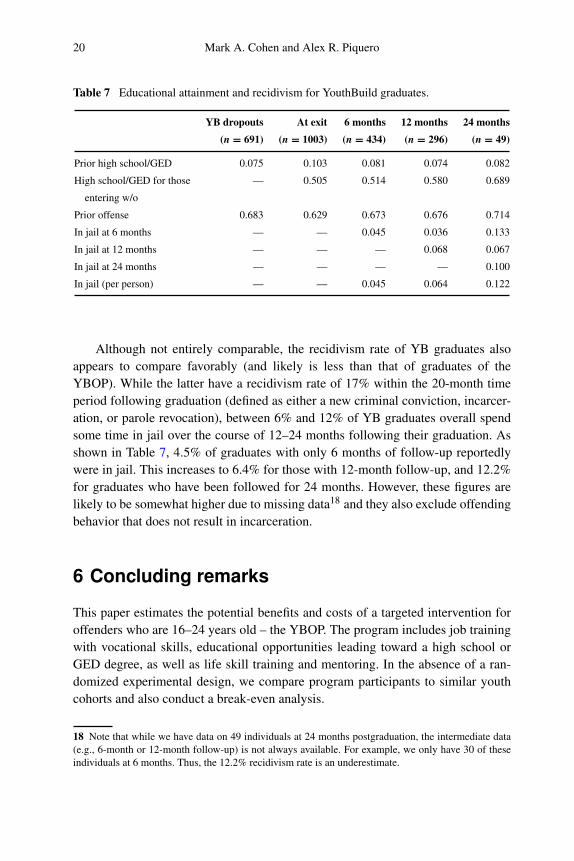
Unlike the YBOP, no follow-up data exists on dropouts of the standard YBprogram. Thus, we cannot directly compare their post-YB educational attainmentor criminal offending records. However, graduates of the YB program are moni-tored at the date of graduation, and every six months for the first two years. Table 7reports on the follow-up information that is available for YB graduates. At the timeof their graduation from the program, 50.5% of those who entered without a highschool degree or GED had received one. This increases to 51.4% at 6 months fol-lowing graduation, 58% after 12 months, and 68.9% after 24 months. This com-pares favorably with the 58% of YBOP graduates who reportedly received a highschool degree or GED at some point during their follow-up period – which averagesapproximately 20 months following graduation (see Table 2). While promising, it isimportant to note that these high school graduation rates might be biased as they arenot based on the full sample of 1003 graduates. For example, the 58% graduationrate is based on 296 reports – only 30% of the sample, and the 68.9% rate is basedon 49 reports – only 5% of the sample. It is quite possible that the “successful”graduates are those who continue to report and the “unsuccessful” ones “drop out”of the system and are not included in the follow-up data.
20 Mark A. Cohen and Alex R. Piquero
Table 7 Educational attainment and recidivism for YouthBuild graduates.
YB dropouts At exit 6 months 12 months 24 months(n = 691) (n = 1003) (n = 434) (n = 296) (n = 49)
Prior high school/GED 0.075 0.103 0.081 0.074 0.082
High school/GED for those — 0.505 0.514 0.580 0.689
entering w/o
Prior offense 0.683 0.629 0.673 0.676 0.714
In jail at 6 months — — 0.045 0.036 0.133
In jail at 12 months — — — 0.068 0.067
In jail at 24 months — — — — 0.100
In jail (per person) — — 0.045 0.064 0.122
Although not entirely comparable, the recidivism rate of YB graduates alsoappears to compare favorably (and likely is less than that of graduates of theYBOP). While the latter have a recidivism rate of 17% within the 20-month timeperiod following graduation (defined as either a new criminal conviction, incarcer-ation, or parole revocation), between 6% and 12% of YB graduates overall spendsome time in jail over the course of 12–24 months following their graduation. Asshown in Table 7, 4.5% of graduates with only 6 months of follow-up reportedlywere in jail. This increases to 6.4% for those with 12-month follow-up, and 12.2%for graduates who have been followed for 24 months. However, these figures arelikely to be somewhat higher due to missing data18 and they also exclude offendingbehavior that does not result in incarceration.
6 Concluding remarks
This paper estimates the potential benefits and costs of a targeted intervention foroffenders who are 16–24 years old – the YBOP. The program includes job trainingwith vocational skills, educational opportunities leading toward a high school orGED degree, as well as life skill training and mentoring. In the absence of a ran-domized experimental design, we compare program participants to similar youthcohorts and also conduct a break-even analysis.
18 Note that while we have data on 49 individuals at 24 months postgraduation, the intermediate data(e.g., 6-month or 12-month follow-up) is not always available. For example, we only have 30 of theseindividuals at 6 months. Thus, the 12.2% recidivism rate is an underestimate.

Benefits and Costs of YouthBuild Offender Project 21
With respect to educational attainment, we estimate that YBOP participants(whether they complete the program or not) have an “excess” high school or GEDgraduation rate (compared to our reference group of high school dropouts) of 35.6%with the resulting present value of increased benefits ranging from $150,000 to$225,000 per program participant. Further, we estimate the potential reduction inrecidivism for YBOP participants to range between 3.4% and 5.6%. Based onthe most conservative estimate of the present value of benefits from these youthavoiding a future lifetime of crime, the benefits would range between $24,000 and$56,000 per program participant.
Combined, the potential benefits from the YBOP are thus estimated to rangebetween $174,000 and $281,000. The costs of the program are estimated to be$24,000 – or $13,000 if only “social costs” (excluding transfers in the form oftrainee stipends or the cost of building materials) are excluded. The benefit-costratio is thus estimated to range between 13.3 and 21.6 based on the social costsand 7.2–11.7 based on the program costs. Put differently, every dollar spent on theYBOP will return between about $7.20 and $11.70 to taxpayers and others whodonate to the program. In terms of social costs, every dollar spent is estimated toreturn between $13.30 and $21.60.
While the benefit-cost analysis focuses on the two program outcomes – recidi-vism and educational attainment – the YB program targets other socially desirableoutcomes, including reduced drug abuse and increased civic engagement such asvoter registration and community service. While program outcomes on these mea-sures are unavailable, some hypothetical estimates of the value of substance abusereductions can be made. For example, if 10% of program participants with sub-stance abuse problems overcame a “heavy drug abuse” problem, the benefit “perparticipant” would range from $9000 to $14,000 – nearly the cost of the programitself.
Despite this relatively large benefit-cost ratio, we note several important limi-tations, which also are relevant to much of the prevention/intervention literature.First, the benefit-cost ratio above is based on the present value of future bene-fits including a lifetime of educational and reduced recidivism benefits. However,the YBOP sample was followed for approximately 30 months and had a rathershort-term follow-up period – about 18 months after completion of the program.It is possible that after a period of time, the short-term deterrent effects observedwith respect to crime could dwindle and/or the anticipated long-term employmentbenefits from achieving a high school education might not continue. Nevertheless,our preliminary benefit-cost analysis suggests that the payback period from crimereduction alone could be as little as 1 year – enough to justify the program even ifno further benefits accrue.

22 Mark A. Cohen and Alex R. Piquero
Second, some care must be taken when comparing our benefit-cost ratios tothose estimated for alternative programs targeting educational and/or crime out-comes. Our crime reduction benefit estimates are based on willingness to pay toavoid the risk of crime, and the benefits of a high school education include socialbenefits beyond wages and productivity (see Cohen & Piquero, 2009). Althoughthis approach is appropriate based on benefit-cost methodology and protocol (seee.g., Boardman et al. 2011, 81; and Cohen, 2005), not all benefit-cost analyses areas comprehensive. For example, while the WSIPP estimates a benefit-cost ratio of$10.25 per dollar spent on aggression replacement therapy (ART) programs foroffenders on probation, and between $3 and $4 for a dollar spent on Head Start andpre-K programs, the WSIPP benefits only include taxpayer and crime victim bene-fits and exclude the full social benefits such as willingness to pay for the reductionin risk of crime. Nevertheless, even if we were to limit our benefits estimates tothose received by taxpayers and crime victims, we would obtain a positive benefit-cost ratio.19
Third, we have studied 30 YBOP program sites that were chosen based on cri-teria that favored a successful outcome because of an a priori assessment by thenational YB office that these local sites were well operated and fulfilled their crite-ria for a likely successful outcome. Thus, our main findings should be consideredan assessment of well-designed and operated YBOP programs, and may not be gen-eralizable to all programs and sites. However, a more limited analysis (due to dataavailability) of a random sample of all YB participants suggests that our finding ofa high graduation rate and low recidivism is likely to carry over to the program asa whole – although we are unable to quantify this effect.
Fourth, we cannot definitively attribute the positive outcomes to YBOP itself.This is so because we do not know if these positive outcomes are the result of theYBOP program or if participants would have had similar outcomes in the absenceof program participation. While we have utilized external comparison data and thebest statistical techniques available to isolate the benefits of the YBOP program, wecannot entirely rule out the possibility that program participants were simply highlymotivated individuals who would have otherwise been successful. Ideally, potentialparticipants would be randomly assigned to a treatment and control group so that
19 For example, (Cohen & Piquero, 2009, Table 6) also report on the value of crime reduction basedon a “bottom up” approach that includes only criminal justice, victim costs, and offender productivity.Using this more restrictive definition of crime reduction benefits reduces the crime-related benefit-costratio by approximately 65% of the value shown in Table 5. Similarly, excluding the nonmarket benefitsof education (Cohen & Piquero, 2009, Table 11) reduces the benefits of education by about 10%–15%of the value shown in Table 5. Combined, the “social” benefit-cost ratio shown in Table 5 would stillrange between 5.6 and 16.2.

Benefits and Costs of YouthBuild Offender Project 23
we could compare outcomes in these two groups.20 Unfortunately, we are unable toquantify the size of this potential selection bias, but readily admit that there is somedegree of selection bias that exists and should be considered when interpreting ourresults.
In the absence of a randomized control design, we also conducted a “break-even” analysis to determine the level of effectiveness required of the YBOPprogram before it pays for itself. Simply based on the educational benefits (ignoringany crime or drug abuse reduction benefits), an “excess” graduation rate of 2%–6%of program participants would be required for the program to pay for itself, com-pared to an estimated excess graduation rate of 35.6%. Similarly, simply based onestimated crime reduction benefits (ignoring educational or drug abuse reductionbenefits), the program would need to “save” between 0.5% and 1.2% of its par-ticipants from a lifetime of crime in order to pay for itself. This compares to anestimated overall crime reduction benefit of 3.4% to 5.7% from the program.
Despite these limitations, the current study adds to the rather nascent benefit-cost literature on criminal justice and provides strong evidence that the YBOP pro-gram, even with the limited data available, provides more benefits than costs totaxpayers and society – and perhaps more importantly to the youth themselves.Continued evaluation of YBOP and similar programs targeted at young offendersappears to be a promising area for future research.
Acknowledgments: The authors gratefully acknowledge funding for thisresearch from YouthBuild USA through a grant from the Skoll Foundation. Theyexpress thanks to the Special Editor and two anonymous referees of this journalfor their helpful suggestions on an earlier draft, as well as the valuable assistanceof YouthBuild founder Dorothy Stoneman and her staff in sharing their data andhelping them understand the workings of their program and outcome measures.
References
Abrazaldo, Wally, Adefuin, Jo-Ann, Henderson-Frakes, Jennifer, Lea, Charles, Leufgen, Jill,Lewis-Charp, Heather, Soukamneuth, Sukey & Wiegand, Andrew (2009). Evaluationof the YouthBuild Youth Offender Grants. Final Report Prepared for U.S. Departmentof Labor, Social and Policy Research Associates, Available at: http://wdr.doleta.gov/research/FullText Documents/Evaluation%20of%20the%20YouthBuild%20Youth%20Offender%20Grants%20-%20Final%20Report.pdf.
20 A randomized control study is currently under way to evaluate the effectiveness of the YB model,with a 4-year follow-up survey being conducted in mid-2017. Unlike the YBOP program that targetedprior offenders, the focus of the ongoing study is on high school dropouts more generally. See MDRC (http://www.mdrc.org/sites/default/files/Adapting to Local Context.pdf) and Department of Labor Fed-eral Register Notice (http://www.gpo.gov/fdsys/pkg/FR-2015-06-02/pdf/2015-13375.pdf).

24 Mark A. Cohen and Alex R. Piquero
Aos, Steve & Drake, Elizabeth (2010). WSIPP’s Benefit-Cost Tool for States: ExaminingPolicy Options in Sentencing and Corrections. Washington State Institute for PublicPolicy.
Beck, Allen J. & Shipley, Bernard E. (1989). Recidivism of Prisoners Released in 1989,Bureau of Justice Statistics. Available at: http://www.bjs.gov/content/pub/pdf/rpr83.pdf.
Belfield, Clive R., Nores, Milagros, Barnett, Steve & Schweinhart, Lawrence (2006). TheHigh/Scope Perry Preschool Program: Cost-Benefit Analysis Using Data from the Age-40 Followup. Journal of Human Resources, 41(1), 162–190.
Boardman, Anthony, Greenberg, David H., Vining, Aidan R. & Weimer, David L. (2011).Cost-Benefit Analysis: Concepts and Practice. (4th ed.). Upper Saddle River,NJ: Pearson.
Blumstein, Alfred, Cohen, Jacqueline, Roth, Jeffrey A. & Visher, Christy A. (Eds.) (1986).In Criminal Careers and “Career Criminals” (Report of the Panel on Criminal Careers,National Research Council, Vol. 1). Washington, DC: National Academies Press.
Brame, Robert, Turner, Michael G., Paternoster, Raymond & Bushway, Shawn D. (2011).Cumulative prevalence of arrest from ages 8 to 23 in a national sample. Pediatrics, 129,21–27.
Cohen, Mark A. (1988). Pain, Suffering, and Jury Awards: A Study of the Cost of Crime toVictims. Law and Society Review, 22(3), 537–555.
Cohen, Mark A. (2000). Measuring the Costs and Benefits of Crime and Justice. In Measure-ment and Analysis of Crime and Justice (Criminal Justice 2000, Vol. 4, pp. 263–316).National Institute of Justice; July, NCJ 182411; available at http://www.ncjrs.gov/criminal justice2000/vol 4/04f.pdf.
Cohen, Mark A. (2005). The Costs of Crime and Justice. New York: Routledge.Cohen, Mark A. & Piquero, Alex R. (2009). New Evidence on the Monetary Value of Saving
a High Risk Youth. Journal of Quantitative Criminology, 25(1), 25–49.Cohen, Mark A. & Piquero, Alex R. (2010). An Outcome Evaluation of the YouthBuild USA
Offender Project. Youth Violence and Juvenile Justice, 8(4), 373–385.Cohen, Mark A., Rust, Roland T., Steen, Sarah & Tidd, Simon T. (2004). Willingness-to-Pay
for Crime Control Programs. Criminology, 42, 89–110.Durose, Matthew R., Cooper, Alexia D. & Snyder, Howard N. (2014). Recidivism of Pris-
oners Released in 30 States in 2005: Patterns from 2005 to 2010, Bureau of JusticeStatistics, NCJ 244205. Available at: http://www.bjs.gov/content/pub/pdf/rprts05p0510.pdf.
Economic Report of the President (2013). Economic Report of the President, February 2013.Washington: Government Printing Office, 2013.
Farrington, David P. & Koegl, Christopher J. (2015). Monetary Benefits and Costs of theStop Now and Plan Program for Boys Aged 6–11, Based on the Prevention of LaterOffending. Journal of Quantitative Criminology, 31, 263–287.
Figlio, Robert M., Tracy, Paul E. & Wolfgang, Marvin E. (1994). Delinquency in a BirthCohort II: Philadelphia, 1958–1988 [Computer file]. 3rd ICPSR version. Philadelphia,PA: Sellin Center for Studies in Criminology and Criminal Law and National Analysts,Division of Booz-Allen and Hamilton, Inc. [producers], 1990. Ann Arbor, MI: Inter-university Consortium for Political and Social Research [distributor].
Hahn, Andrew, Leavitt, Thomas D., McNamara, Horvat, Erin, Davis & James, Earl (2004).Life After YouthBuild (June) (available at www.youthbuild.org).

Benefits and Costs of YouthBuild Offender Project 25
Henrichson, Christian & Ruth, Delaney (2012). The Price of Prisons: What IncarcerationCosts Taxpayers. Vera Institute. Available at: http://www.vera.org/sites/default/files/resources/downloads/Price of Prisons updated version 072512.pdf.
Langan, Patrick A. & Levin, David J. (2002). Recidivism of Prisoners Released in 1994.Washington, DC: Bureau of Justice Statistics; NCJ 193427.
Leslie, Anne (2007). YouthBuild USA Youthful Offender Project Year 1. YouthBuild USA(August) (available at www.youthbuild.org).
Levine, Peter (2012). Pathways into Leadership: A Study of YouthBuild Graduates. Centerfor Information Research on Civic Learning and Engagement, Tufts University. Avail-able at: http://www.civicyouth.org/wp-content/uploads/2012/05/YouthBuild.pdf.
McDougall, Cynthia, Cohen, Mark A., Swaray, Raymond & Perry, Amanda (2003). TheCosts and Benefits of Sentencing – A Systematic Review. Annals of the AmericanAcademy of Political and Social Science, 587, 160–177.
Minnesota Department of Employment and Economic Development (2003). MinnesotaYouthBuild Program: A Measurement of Costs and Benefits to the State of Minnesota.Available at: http://mnachievementgap.mnnpo.org/shelf list/doc332 Minnesota YouthBuild Program A Measurement of Costs and Benefits to the State of Minnesota.pdf.
Mishel, Lawrence & Roy, Joydeep (2006). Rethinking High School Graduation Rates andTrends. Washington, DC: Economic Policy Institute (available at: http://www.epi.org/books/rethinking hs grad rates/rethinking hs grad rates-FULL TEXT.pdf).
Mitchell, Maxine V., Jenkins, Davis, Nguyen, Dao, Lerman, Alona & DeBerry, Marian(2003). Evaluation of the YouthBuild program. Washington, DC: U.S. Departmentof Housing and Urban Development, Office of Policy Development and Research.Available at: http://www.huduser.org/Publications/PDF/YouthBuild.pdf.
Nagin, Daniel S., Piquero, Alex R., Scott, Elizabeth S. & Steinberg, Lawrence (2006). PublicPreferences for Rehabilitation Versus Incarceration of Juvenile Offenders: Evidencefrom a Contingent Valuation Survey. Criminology & Public Policy, 5, 301–326.
Owens, Emily G. (2009). More Time, Less Crime? Estimating the Incapacitative Effect ofSentence Enhancements. Journal of Law and Economics, 52(3), 551–579.
Piquero, Alex R., Farrington, David P. & Blumstein, Alfred (2003). The Criminal CareerParadigm. In M. Tonry (Ed.), Crime and Justice: A Review of Research (Vol. 30).Chicago: University of Chicago.
Schweinhart, Lawrence J., Barnes, Helen V. & Weikart, David P. (1993). Significant Bene-fits: the High/Scope Perry Preschool Study through Age 27. Ypsilanti, MI: High/ScopePress.
Substance Abuse and Mental Health Services Administration (“SAMHSA”) (2007). Resultsfrom the 2006 National Survey on Drug Use and Health: National Findings,http://www.oas.samhsa.gov/nsduh/2k6nsduh/2k6results.pdf.
U.S. Department of Justice (2012). Prison Rape Elimination Act, Regulatory Impact Assess-ment, May 17. http://ojp.gov/programs/pdfs/prea ria.pdf.
Welsh, Brandon C. & Farrington, David P. (2006). Preventing Crime: What Works for Chil-dren, Offenders, Victims, and Places. New York: Springer.
Welsh, Brandon C., Farrington, David P. & Gowar, B. Raffan (2015). Benefit-Cost Analysisof Crime Prevention Programs. In M. Tonry (Ed.), Crime and Justice (Vol. 44, pp.447–516). Chicago: University of Chicago Press.
Wolfgang, Marvin E., Figlio, Robert M. & Sellin, Thorsten (1972). Delinquency in a BirthCohort. Chicago: University of Chicago Press.