us congressional district exports to china: 2000-08 · alabama’s top exports to china, 2008 al-1:...
TRANSCRIPT

1818 N Street, NW, Suite 200, Washington, DC 20036 Tel: 202-429-0340 | Fax: 202-775-2476 | E-mail: [email protected] | www.uschina.org
US Congressional District Exports to China:
2000–08
111th Congress
© 2009, The US-China Business Council
Executive Summary
The US-China Business Council (USCBC) each year releases analyses of US exports to China to better inform the policy debate about China trade and its impact on the US economy. This report details export growth by congressional district; a previous report showing export growth by state was issued in March 2009. The key findings from this year’s district export report: • China’s importance as a growing market for US products and services is felt broadly
throughout the country; 85 percent of congressional districts showed export growth in 2008.
• In 409 congressional districts, manufactured exports alone experienced triple-digit growth between 2000 and 2008.
• Growth in exports to China for congressional districts far outpaces growth in exports to the rest of the world for almost every district. Even in states that have had a mixed export story over the previous eight years, such as Hawaii, Vermont, South Dakota, and Tennessee, exports from congressional districts to China generally grew faster than those to the rest of the world.
• Contrary to common perceptions, congressional districts in states such as Pennsylvania, Ohio, Indiana, and North Carolina also have benefited from rapidly growing exports to China – and these exports include manufactured goods and machinery, computers and electronics, transportation equipment, and other high-end products.
• In 2008, growth rebounded in some congressional districts that experienced export declines from 2006 to 2007 in states such as Oregon, Tennessee, Pennsylvania, and South Carolina.
The global recession is significantly impacting US exports—to China and to the rest of the world. While quarterly analysis has not been done at the congressional district level, previous USCBC analysis indicates that US export growth was strong through the first three quarters of 2008 but declined significantly in the fourth quarter. USCBC expects that exports to China will continue to grow and outpace exports to other markets, once global economic growth returns

© 2009, The US-China Business Council
Editor’s Notes
Methodology This study uses county-level export data to provide estimates of congressional district exports to China. Because some congressional districts include parts of the same counties, and because the county export data cannot be apportioned to the separate districts, the total of a state's estimated individual congressional district exports in this study may exceed the state's actual total exports to China. For state-level data, please see USCBC's report on state exports, available at http://www.uschina.org/public/exports/congressional/2000_2008/full_state_report.pdf. Export Category Descriptions
• “Other Manufacturing” is the category of exports created when the US Census Bureau suppresses data to protect individual businesses’ confidentiality. When publishing data, Census includes all production figures in the aggregated “total manufacturing” data but does not release specific figures for manufacturing subsectors with too few firms reporting. “Other Manufacturing,” which can reflect suppressed data for more than one subsector, is calculated by looking at a congressional district’s total manufacturing trade and subtracting out the sum of all reported manufacturing subsectors.
• The Census Bureau states that: “Industries in the Miscellaneous Manufacturing subsector make a wide range of products that cannot readily be classified in specific NAICS [North American Industry Classification System] subsectors in manufacturing. Processes used by these establishments vary significantly, both among and within industries…. Establishments in this subsector manufacture products as diverse as medical equipment and supplies, jewelry, sporting goods, toys, and office supplies.”
• This year’s report uses the more descriptive category name “Textiles and Fabrics” to
harmonize the category names used at the state and district levels. In prior reports, these exports at the district level were referred to as “Fabric Mill Products.”
Notes on the 2000-08 Edition
• All data used for this and all previous editions of the report come from the US Department of
Commerce, Bureau of the Census. Prior to 2007, the Trade Statistics Express database operated by the US International Trade Administration was the basis for the report. The 2000–07 and 2000–08 editions are based on the Census Bureau’s USA Trade Online database. Any differences reflect minor Census Bureau data revisions.
• The US Census Bureau in early 2009 revised its national export figures back to 1990, causing minor variations in the historical datapoints used in the 2000–08 report.

© 2009, The US-China Business Council Source: US Department of Commerce
Top US Export Markets Top US Exports to China 1. Canada $260.9 billion 1. Computers & Electronics $13.9 billion
2. Mexico $151.5 billion 2. Crop Production $9.2 billion
3. China $71.5 billion 3. Chemicals $8.7 billion
4. Japan $66.6 billion 4. Transportation Equipment $7.6 billion
5. Germany $54.7 billion 5. Waste & Scrap $7.6 billion
China Is America’s 3rd-Largest Export Market
US Exports to China ($ billion)
$16.2$22.1
$28.4$34.7
$41.9
$55.2
$65.2$71.5
$19.2
$0
$25
$50
$75
2000 2001 2002 2003 2004 2005 2006 2007 2008
Growth in US Exports, 2000–08
Exports to China: 341% Exports to Rest of World: 60%

© 2009, The US-China Business Council Source: US Department of Commerce
Impact of the Global Economic Downturn on US Exports to China and the World*
*Percentage change over same period in previous year • Though export growth to China was nearly 10 percent for all of 2008, a quarterly
breakdown shows that the global economic downturn is significantly impacting US exports to China—and to the rest of the world. US export growth to China and the world was strong through the first three quarters of 2008 but declined year-on-year in the fourth quarter.
• Once economic growth resumes, US exports to China should return to the previous
pattern and outpace growth in exports to most other major markets. Between 2000 and 2008, US exports to China grew 341 percent, while US exports to the rest of the world grew 60 percent.
-15%
-10%
-5%
0%
5%
10%
15%
20%
25%Exports to China Exports to the World
2008 Q1 2008 Q2 2008 Q3 2008 Q4

© 2009, The US-China Business Council
Sources: The Trade Partnership from US Census Bureau and US Department of Agriculture data.
Alabama’s Top Exports to China, 2008 AL-1: Top Exports to China, 2008* 1. Chemicals $396 million 1. Chemicals $92 million
2. Crop Production $133 million 2. Crop Production $33 million
3. Waste & Scrap $62 million 3. Wood Products $1 million
4. Machinery (except Electrical) $59 million 4. Transportation Equipment $439,000
5. Processed Foods $29 million 5. Fabricated Metal Products $401,000 * The data for AL-1 reflect the combined exports of Baldwin, Clarke, Escambia, Mobile, Monroe, and Washington counties. The figures may understate the AL-1 district’s total exports to China because county-specific information for some products (e.g., mining, forestry, fishing, and waste and scrap) is not available.
$27 $28$34
$72 $74$78
$102
$121$128
2000 2001 2002 2003 2004 2005 2006 2007 2008
Estimated Growth in Exports from Alabama’s 1st Congressional District, 2000–08
Exports to China: 372% Exports to Rest of World: 98%
Alabama's 1st Congressional District: Exports to China ($ million)

© 2009, The US-China Business Council
Sources: The Trade Partnership from US Census Bureau and US Department of Agriculture data.
Alabama’s Top Exports to China, 2008 AL-2: Top Exports to China, 2008* 1. Chemicals $396 million 1. Other Manufacturing $64 million
2. Crop Production $133 million 2. Crop Production $37 million
3. Waste & Scrap $62 million 3. Animal Production $3 million
4. Machinery (except Electrical) $59 million 4. Plastics & Rubber Products $894,000
5. Processed Foods $29 million 5. Wood Products $555,000 * The data for AL-2 reflect the combined exports of Autauga, Barbour, Bullock, Butler, Coffee, Conecuh, Covington, Crenshaw, Dale, Elmore, Geneva, Henry, Houston, Lowndes, Montgomery, and Pike counties. The figures may understate the AL-2 district’s total exports to China because county-specific information for some products (e.g., mining, forestry, fishing, and waste and scrap) is not available.
$20$28
$32
$69
$54
$63
$103$107 $106
2000 2001 2002 2003 2004 2005 2006 2007 2008
Estimated Growth in Exports from Alabama’s 2nd Congressional District, 2000–08
Exports to China: 424% Exports to Rest of World: 100%
Alabama's 2nd Congressional District: Exports to China ($ million)
© 2009, The US-China Business Council
Sources: The Trade Partnership from US Census Bureau and US Department of Agriculture data.
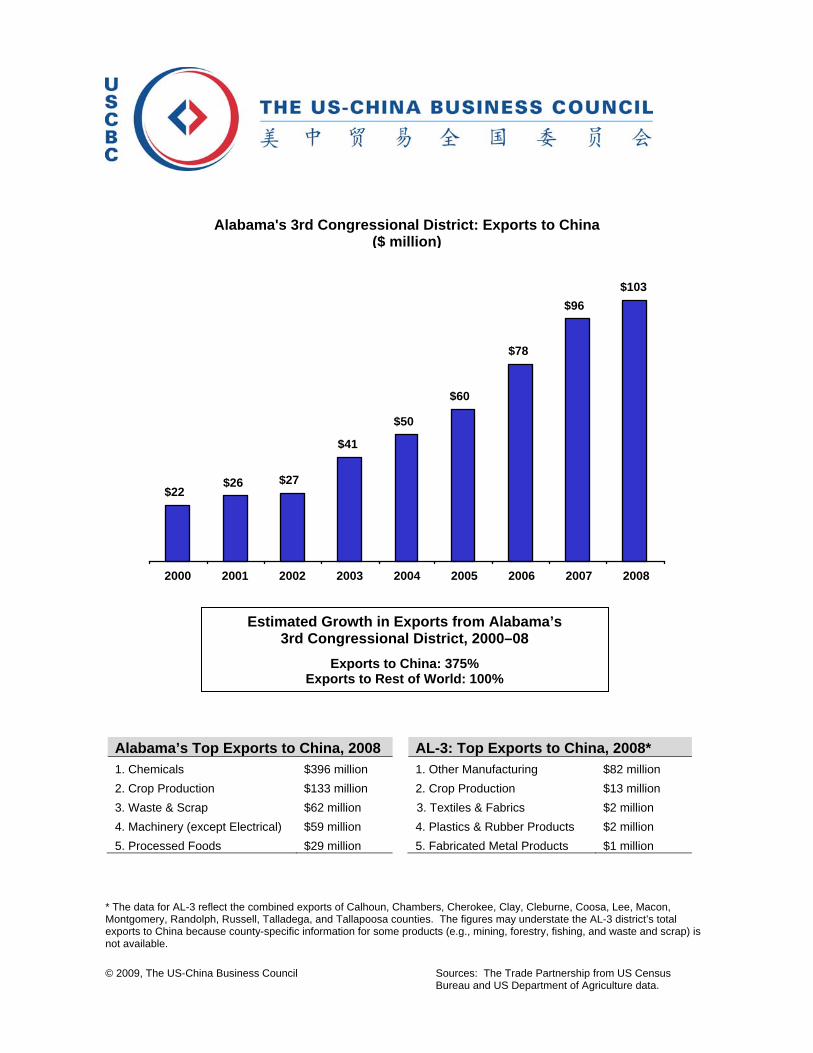
Alabama’s Top Exports to China, 2008 AL-3: Top Exports to China, 2008* 1. Chemicals $396 million 1. Other Manufacturing $82 million
2. Crop Production $133 million 2. Crop Production $13 million
3. Waste & Scrap $62 million 3. Textiles & Fabrics $2 million
4. Machinery (except Electrical) $59 million 4. Plastics & Rubber Products $2 million
5. Processed Foods $29 million 5. Fabricated Metal Products $1 million * The data for AL-3 reflect the combined exports of Calhoun, Chambers, Cherokee, Clay, Cleburne, Coosa, Lee, Macon, Montgomery, Randolph, Russell, Talladega, and Tallapoosa counties. The figures may understate the AL-3 district’s total exports to China because county-specific information for some products (e.g., mining, forestry, fishing, and waste and scrap) is not available.
$22$26 $27
$41
$50
$60
$78
$96$103
2000 2001 2002 2003 2004 2005 2006 2007 2008
Estimated Growth in Exports from Alabama’s 3rd Congressional District, 2000–08
Exports to China: 375% Exports to Rest of World: 100%
Alabama's 3rd Congressional District: Exports to China ($ million)

© 2009, The US-China Business Council
Sources: The Trade Partnership from US Census Bureau and US Department of Agriculture data.
Alabama’s Top Exports to China, 2008 AL-4: Top Exports to China, 2008* 1. Chemicals $396 million 1. Other Manufacturing $58 million
2. Crop Production $133 million 2. Crop Production $12 million
3. Waste & Scrap $62 million 3. Machinery (except Electrical) $11 million
4. Machinery (except Electrical) $59 million 4. Animal Production $7 million
5. Processed Foods $29 million 5. Processed Foods $6 million * The data for AL-4 reflect the combined exports of Blount, Cullman, DeKalb, Etowah, Fayette, Franklin, Lamar, Marion, Marshall, Morgan, Pickens, St. Clair, Walker, and Winston counties. The figures may understate the AL-4 district’s total exports to China because county-specific information for some products (e.g., mining, forestry, fishing, and waste and scrap) is not available.
$20$26 $28
$42$46
$58
$76
$95$102
2000 2001 2002 2003 2004 2005 2006 2007 2008
Estimated Growth in Exports from Alabama’s 4th Congressional District, 2000–08
Exports to China: 404% Exports to Rest of World: 102%
Alabama's 4th Congressional District: Exports to China ($ million)

© 2009, The US-China Business Council
Sources: The Trade Partnership from US Census Bureau and US Department of Agriculture data.
Alabama’s Top Exports to China, 2008 AL-5: Top Exports to China, 2008* 1. Chemicals $396 million 1. Other Manufacturing $82 million
2. Crop Production $133 million 2. Crop Production $25 million
3. Waste & Scrap $62 million 3. Machinery (except Electrical) $7 million
4. Machinery (except Electrical) $59 million 4. Plastics & Rubber Products $2 million
5. Processed Foods $29 million 5. Primary Metal Manufacturing $1 million * The data for AL-5 reflect the combined exports of Colbert, Jackson, Lauderdale, Lawrence, Limestone, Madison, and Morgan counties. The figures may understate the AL-5 district’s total exports to China because county-specific information for some products (e.g., mining, forestry, fishing, and waste and scrap) is not available.
$25$32 $33
$59 $60
$71
$101
$116$121
2000 2001 2002 2003 2004 2005 2006 2007 2008
Estimated Growth in Exports from Alabama’s 5th Congressional District, 2000–08
Exports to China: 388% Exports to Rest of World: 99%
Alabama's 5th Congressional District: Exports to China ($ million)
© 2009, The US-China Business Council
Sources: The Trade Partnership from US Census Bureau and US Department of Agriculture data.
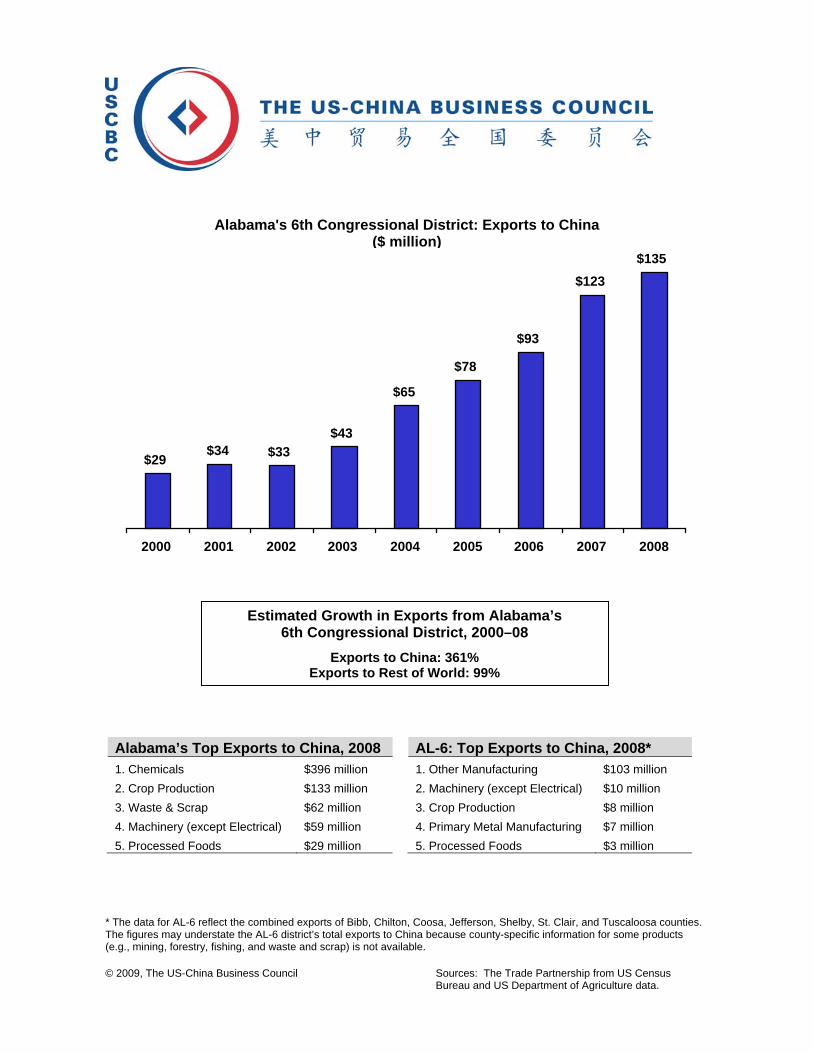
Alabama’s Top Exports to China, 2008 AL-6: Top Exports to China, 2008* 1. Chemicals $396 million 1. Other Manufacturing $103 million
2. Crop Production $133 million 2. Machinery (except Electrical) $10 million
3. Waste & Scrap $62 million 3. Crop Production $8 million
4. Machinery (except Electrical) $59 million 4. Primary Metal Manufacturing $7 million
5. Processed Foods $29 million 5. Processed Foods $3 million * The data for AL-6 reflect the combined exports of Bibb, Chilton, Coosa, Jefferson, Shelby, St. Clair, and Tuscaloosa counties. The figures may understate the AL-6 district’s total exports to China because county-specific information for some products (e.g., mining, forestry, fishing, and waste and scrap) is not available.
$29$34 $33
$43
$65
$78
$93
$123$135
2000 2001 2002 2003 2004 2005 2006 2007 2008
Estimated Growth in Exports from Alabama’s 6th Congressional District, 2000–08
Exports to China: 361% Exports to Rest of World: 99%
Alabama's 6th Congressional District: Exports to China ($ million)

© 2009, The US-China Business Council
Sources: The Trade Partnership from US Census Bureau and US Department of Agriculture data.
Alabama’s Top Exports to China, 2008 AL-7: Top Exports to China, 2008* 1. Chemicals $396 million 1. Other Manufacturing $107 million
2. Crop Production $133 million 2. Machinery (except Electrical) $7 million
3. Waste & Scrap $62 million 3. Primary Metal Manufacturing $6 million
4. Machinery (except Electrical) $59 million 4. Crop Production $6 million
5. Processed Foods $29 million 5. Processed Foods $3 million
* The data for AL-7 reflect the combined exports of Choctaw, Clarke, Dallas, Greene, Hale, Jefferson, Marengo, Perry, Pickens, Sumter, Tuscaloosa, and Wilcox counties. The figures may understate the AL-7 district’s total exports to China because county-specific information for some products (e.g., mining, forestry, fishing, and waste and scrap) is not available.
$29$34 $33
$42
$64
$78
$92
$123
$135
2000 2001 2002 2003 2004 2005 2006 2007 2008
Estimated Growth in Exports from Alabama’s 7th Congressional District, 2000–08
Exports to China: 361% Exports to Rest of World: 100%
Alabama's 7th Congressional District: Exports to China ($ million)

© 2009, The US-China Business Council Source: US Department of Commerce
Alaska’s Top Exports to China, 2008* 1. Seafood Products $417 million
2. Minerals & Ores $125 million
3. Petroleum & Coal Products $113 million
4. Transportation Equipment $45 million
5. Forestry Products $19 million
*The data for Alaska’s at-large congressional district reflect the combined exports of the entire state.
Alaska's At-Large Congressional District: Exports to China ($ million)
$103$148 $154
$241
$337
$474
$716 $733
$102
2000 2001 2002 2003 2004 2005 2006 2007 2008
Estimated Growth in Exports from Alaska, 2000–08
Exports to China: 611% Exports to Rest of World: 20%

© 2009, The US-China Business Council
Sources: The Trade Partnership from US Census Bureau and US Department of Agriculture data.
Arizona’s Top Exports to China, 2008 AZ-1: Top Exports to China, 2008* 1. Computers & Electronics $919 million 1. Other Manufacturing $60 million
2. Crop Production $101 million 2. Crop Production $16 million
3. Transportation Equipment $75 million 3. Processed Foods $3 million
4. Machinery (except Electrical) $37 million 4. Fabricated Metal Products $650,000
5. Waste & Scrap $27 million 5. Plastics & Rubber Products $464,000 * The data for AZ-1 reflect the combined exports of Apache, Coconino, Gila, Graham, Greenlee, Navajo, Pinal and Yavapai counties. The figures may understate the AZ-1 district’s total exports to China because county-specific information for some products (e.g., mining, forestry, fishing, and waste and scrap) is not available.
$9 $8
$22
$45$41 $43
$72
$83$80
2000 2001 2002 2003 2004 2005 2006 2007 2008
Estimated Growth in Exports from Arizona’s 1st Congressional District, 2000–08
Exports to China: 838% Exports to Rest of World: 22%
Arizona's 1st Congressional District: Exports to China ($ million)

© 2009, The US-China Business Council
Sources: The Trade Partnership from US Census Bureau and US Department of Agriculture data.
Arizona’s Top Exports to China, 2008 AZ-2: Top Exports to China, 2008* 1. Computers & Electronics $919 million 1. Other Manufacturing $808 million
2. Crop Production $101 million 2. Crop Production $31 million
3. Transportation Equipment $75 million 3. Electrical Equipment $16 million
4. Machinery (except Electrical) $37 million 4. Fabricated Metal Products $9 million
5. Waste & Scrap $27 million 5. Plastics & Rubber Products $7 million * The data for AZ-2 reflect the combined exports of Coconino, La Paz, Maricopa, Mohave, Navajo, and Yavapai counties. The figures may understate the AZ-2 district’s total exports to China because county-specific information for some products (e.g., mining, forestry, fishing, and waste and scrap) is not available.
$107 $98
$280
$530
$438 $449
$863$928
$893
2000 2001 2002 2003 2004 2005 2006 2007 2008
Estimated Growth in Exports from Arizona’s 2nd Congressional District, 2000–08
Exports to China: 736% Exports to Rest of World: 19%
Arizona's 2nd Congressional District: Exports to China ($ million)

© 2009, The US-China Business Council
Sources: The Trade Partnership from US Census Bureau and US Department of Agriculture data.
Arizona’s Top Exports to China, 2008 AZ-3: Top Exports to China, 2008* 1. Computers & Electronics $919 million 1. Other Manufacturing $759 million
2. Crop Production $101 million 2. Crop Production $25 million
3. Transportation Equipment $75 million 3. Electrical Equipment $16 million
4. Machinery (except Electrical) $37 million 4. Fabricated Metal Products $9 million
5. Waste & Scrap $27 million 5. Processed Foods $7 million * The data for AZ-3 reflect the exports of Maricopa County, which also includes other congressional districts. The figures may understate the AZ-3 district’s total exports to China because county-specific information for some products (e.g., mining, forestry, fishing, and waste and scrap) is not available.
$100 $92
$263
$497
$410 $420
$811$869
$836
2000 2001 2002 2003 2004 2005 2006 2007 2008
Estimated Growth in Exports from Arizona’s 3rd Congressional District, 2000–08
Exports to China: 736% Exports to Rest of World: 19%
Arizona's 3rd Congressional District: Exports to China ($ million)

© 2009, The US-China Business Council
Sources: The Trade Partnership from US Census Bureau and US Department of Agriculture data.
Arizona’s Top Exports to China, 2008 AZ-4: Top Exports to China, 2008* 1. Computers & Electronics $919 million 1. Other Manufacturing $759 million
2. Crop Production $101 million 2. Crop Production $25 million
3. Transportation Equipment $75 million 3. Electrical Equipment $16 million
4. Machinery (except Electrical) $37 million 4. Fabricated Metal Products $9 million
5. Waste & Scrap $27 million 5. Processed Foods $7 million * The data for AZ-4 reflect the exports of Maricopa County, which also includes other congressional districts. The figures may understate the AZ-4 district’s total exports to China because county-specific information for some products (e.g., mining, forestry, fishing, and waste and scrap) is not available.
$100 $92
$263
$497
$410 $420
$811$869
$836
2000 2001 2002 2003 2004 2005 2006 2007 2008
Estimated Growth in Exports from Arizona’s 4th Congressional District, 2000–08
Exports to China: 736% Exports to Rest of World: 19%
Arizona's 4th Congressional District: Exports to China ($ million)

© 2009, The US-China Business Council
Sources: The Trade Partnership from US Census Bureau and US Department of Agriculture data.
Arizona’s Top Exports to China, 2008 AZ-5: Top Exports to China, 2008* 1. Computers & Electronics $919 million 1. Other Manufacturing $759 million
2. Crop Production $101 million 2. Crop Production $25 million
3. Transportation Equipment $75 million 3. Electrical Equipment $16 million
4. Machinery (except Electrical) $37 million 4. Fabricated Metal Products $9 million
5. Waste & Scrap $27 million 5. Processed Foods $7 million * The data for AZ-5 reflect the exports of Maricopa County, which also includes other congressional districts. The figures may understate the AZ-5 district’s total exports to China because county-specific information for some products (e.g., mining, forestry, fishing, and waste and scrap) is not available.
$100 $92
$263
$497
$410 $420
$811$869
$836
2000 2001 2002 2003 2004 2005 2006 2007 2008
Estimated Growth in Exports from Arizona’s 5th Congressional District, 2000–08
Exports to China: 736% Exports to Rest of World: 19%
Arizona's 5th Congressional District: Exports to China ($ million)

© 2009, The US-China Business Council
Sources: The Trade Partnership from US Census Bureau and US Department of Agriculture data.
Arizona’s Top Exports to China, 2008 AZ-6: Top Exports to China, 2008* 1. Computers & Electronics $919 million 1. Other Manufacturing $788 million
2. Crop Production $101 million 2. Crop Production $36 million
3. Transportation Equipment $75 million 3. Electrical Equipment $16 million
4. Machinery (except Electrical) $37 million 4. Processed Foods $10 million
5. Waste & Scrap $27 million 5. Fabricated Metal Products $9 million * The data for AZ-6 reflect the combined exports of Maricopa and Pinal counties. The figures may understate the AZ-6 district’s total exports to China because county-specific information for some products (e.g., mining, forestry, fishing, and waste and scrap) is not available.
$105 $97
$275
$522
$433 $444
$850$915
$880
2000 2001 2002 2003 2004 2005 2006 2007 2008
Estimated Growth in Exports from Arizona’s 6th Congressional District, 2000–08
Exports to China: 738% Exports to Rest of World: 19%
Arizona's 6th Congressional District: Exports to China ($ million)

© 2009, The US-China Business Council
Sources: The Trade Partnership from US Census Bureau and US Department of Agriculture data.
Arizona’s Top Exports to China, 2008 AZ-7: Top Exports to China, 2008* 1. Computers & Electronics $919 million 1. Other Manufacturing $906 million
2. Crop Production $101 million 2. Computers & Electronics $72 million
3. Transportation Equipment $75 million 3. Crop Production $45 million
4. Machinery (except Electrical) $37 million 4. Electrical Equipment $16 million
5. Waste & Scrap $27 million 5. Fabricated Metal Products $12 million * The data for AZ-7 reflect the combined exports of La Paz, Maricopa, Pima, Pinal, Santa Cruz, and Yuma counties. The figures may understate the AZ-7 district’s total exports to China because county-specific information for some products (e.g., mining, forestry, fishing, and waste and scrap) is not available.
$130 $120
$340
$644
$534 $548
$1,049$1,131
$1,087
2000 2001 2002 2003 2004 2005 2006 2007 2008
Estimated Growth in Exports from Arizona’s 7th Congressional District, 2000–08
Exports to China: 736% Exports to Rest of World: 20%
Arizona's 7th Congressional District: Exports to China ($ million)

© 2009, The US-China Business Council
Sources: The Trade Partnership from US Census Bureau and US Department of Agriculture data.
Arizona’s Top Exports to China, 2008 AZ-8: Top Exports to China, 2008* 1. Computers & Electronics $919 million 1. Other Manufacturing $131 million
2. Crop Production $101 million 2. Computers & Electronics $72 million
3. Transportation Equipment $75 million 3. Crop Production $18 million
4. Machinery (except Electrical) $37 million 4. Machinery (except Electrical) $5 million
5. Waste & Scrap $27 million 5. Processed Foods $3 million
* The data for AZ-8 reflect the combined exports of Cochise, Pima, Pinal, and Santa Cruz counties. The figures may understate the AZ-8 district’s total exports to China because county-specific information for some products (e.g., mining, forestry, fishing, and waste and scrap) is not available.
$27 $25
$71
$137
$116 $119
$222
$243$233
2000 2001 2002 2003 2004 2005 2006 2007 2008
Estimated Growth in Exports from Arizona’s 8th Congressional District, 2000–08
Exports to China: 763% Exports to Rest of World: 20%
Arizona's 8th Congressional District: Exports to China ($ million)

© 2009, The US-China Business Council
Sources: The Trade Partnership from US Census Bureau and US Department of Agriculture data.
Arkansas’ Top Exports to China, 2008 AR-1: Top Exports to China, 2008* 1. Processed Foods $96 million 1. Other Manufacturing $51 million
2. Chemicals $65 million 2. Crop Production $40 million
3. Crop Production $56 million 3. Fabricated Metal Products $1 million
4. Transportation Equipment $31 million 4. Plastics & Rubber Products $336,000
5. Electrical Equipment $18 million 5. Animal Production $317,000 * The data for AR-1 reflect the combined exports of Arkansas, Baxter, Clay, Cleburne, Craighead, Crittenden, Cross, Fulton, Greene, Independence, Izard, Jackson, Lawrence, Lee, Lonoke, Mississippi, Monroe, Phillips, Poinsett, Prairie, Randolph, Searcy, Sharp, St. Francis, Stone, and Woodruff counties. The figures may understate the AR-1 district’s total exports to China because county-specific information for some products (e.g., mining, forestry, fishing, and waste and scrap) is not available.
$6 $8 $9
$29$21
$30$36
$69
$93
2000 2001 2002 2003 2004 2005 2006 2007 2008
Estimated Growth in Exports from Arkansas’ 1st Congressional District, 2000–08
Exports to China: 1,503% Exports to Rest of World: 144%
Arkansas' 1st Congressional District: Exports to China ($ million)

© 2009, The US-China Business Council
Sources: The Trade Partnership from US Census Bureau and US Department of Agriculture data.
Arkansas’ Top Exports to China, 2008 AR-2: Top Exports to China, 2008* 1. Processed Foods $96 million 1. Chemicals $22 million
2. Chemicals $65 million 2. Other Manufacturing $18 million
3. Crop Production $56 million 3. Processed Foods $2 million
4. Transportation Equipment $31 million 4. Fabricated Metal Products $2 million
5. Electrical Equipment $18 million 5. Crop Production $2 million
* The data for AR-2 reflect the combined exports of Conway, Faulkner, Perry, Pulaski, Saline, Van Buren, White, and Yell counties. The figures may understate the AR-2 district’s total exports to China because county-specific information for some products (e.g., mining, forestry, fishing, and waste and scrap) is not available.
$5$7 $7
$23
$15
$48$51
$30
$24
2000 2001 2002 2003 2004 2005 2006 2007 2008
Estimated Growth in Exports from Arkansas’ 2nd Congressional District, 2000–08
Exports to China: 855% Exports to Rest of World: 106%
Arkansas' 2nd Congressional District: Exports to China ($ million)

© 2009, The US-China Business Council
Sources: The Trade Partnership from US Census Bureau and US Department of Agriculture data.
Arkansas’ Top Exports to China, 2008 AR-3: Top Exports to China, 2008* 1. Processed Foods $96 million 1. Other Manufacturing $43 million
2. Chemicals $65 million 2. Processed Foods $32 million
3. Crop Production $56 million 3. Fabricated Metal Products $2 million
4. Transportation Equipment $31 million 4. Crop Production $1 million
5. Electrical Equipment $18 million 5. Animal Production $1 million
* The data for AR-3 reflect the combined exports of Benton, Boone, Carroll, Crawford, Franklin, Johnson, Madison, Marion, Newton, Pope, Sebastian, and Washington counties. The figures may understate the AR-3 district’s total exports to China because county-specific information for some products (e.g., mining, forestry, fishing, and waste and scrap) is not available.
$9 $11 $13
$39
$25
$42
$51
$88$81
2000 2001 2002 2003 2004 2005 2006 2007 2008
Estimated Growth in Exports from Arkansas’ 3rd Congressional District, 2000–08
Exports to China: 837% Exports to Rest of World: 104%
Arkansas' 3rd Congressional District: Exports to China ($ million)

© 2009, The US-China Business Council
Sources: The Trade Partnership from US Census Bureau and US Department of Agriculture data.
Arkansas’ Top Exports to China, 2008 AR-4: Top Exports to China, 2008* 1. Processed Foods $96 million 1. Other Manufacturing $32 million
2. Chemicals $65 million 2. Crop Production $11 million
3. Crop Production $56 million 3. Chemicals $8 million
4. Transportation Equipment $31 million 4. Transportation Equipment $1 million
5. Electrical Equipment $18 million 5. Animal Production $1 million
* The data for AR-4 reflect the combined exports of Ashley, Bradley, Calhoun, Chicot, Clark, Cleveland, Columbia, Dallas, Desha, Drew, Garland, Grant, Hempstead, Hot Spring, Howard, Jefferson, Lafayette, Lincoln, Little River, Logan, Miller, Montgomery, Nevada, Ouachita, Pike, Polk, Scott, Sevier, and Union counties. The figures may understate the AR-4 district’s total exports to China because county-specific information for some products (e.g. mining, forestry, fishing, and waste and scrap) is not available.
$5 $6 $7
$23
$15
$24$29
$52$56
2000 2001 2002 2003 2004 2005 2006 2007 2008
Estimated Growth in Exports from Arkansas’ 4th Congressional District, 2000–08
Exports to China: 1,057% Exports to Rest of World: 116%
Arkansas' 4th Congressional District: Exports to China ($ million)

© 2009, The US-China Business Council
Sources: The Trade Partnership from US Census Bureau and US Department of Agriculture data.
California’s Top Exports to China, 2008
CA-1: Top Exports to China, 2008*
1. Computers & Electronics $3.4 billion 1. Other Manufacturing $120 million
2. Waste & Scrap $2.3 billion 2. Computers & Electronics $87 million
3. Machinery (except Electrical) $1.2 billion 3. Machinery (except Electrical) $32 million
4. Transportation Equipment $1.0 billion 4. Crop Production $26 million
5. Chemicals $848 million 5. Processed Foods $9 million
* The data for CA-1 reflect the combined exports of Del Norte, Humboldt, Lake, Mendocino, Napa, Sonoma, and Yolo counties. The figures may understate the CA-1 district’s total exports to China because county-specific information for some products (e.g., mining, forestry, fishing, and waste and scrap) is not available.
$106
$137 $131$159
$202$221
$281 $286 $291
2000 2001 2002 2003 2004 2005 2006 2007 2008
Estimated Growth in Exports from California’s 1st Congressional District, 2000–08
Exports to China: 174% Exports to Rest of World: 16%
California's 1st Congressional District: Exports to China ($ million)

© 2009, The US-China Business Council
Sources: The Trade Partnership from US Census Bureau and US Department of Agriculture data.
California’s Top Exports to China, 2008
CA-2: Top Exports to China, 2008*
1. Computers & Electronics $3.4 billion 1. Other Manufacturing $82 million
2. Waste & Scrap $2.3 billion 2. Crop Production $28 million
3. Machinery (except Electrical) $1.2 billion 3. Processed Foods $11 million
4. Transportation Equipment $1.0 billion 4. Machinery (except Electrical) $7 million
5. Chemicals $848 million 5. Wood Products $2 million
* The data for CA-2 reflect the combined exports of Butte, Colusa, Glenn, Shasta, Siskiyou, Sutter, Tehama, Trinity, Yolo, and Yuba counties. The figures may understate the CA-2 district’s total exports to China because county-specific information for some products (e.g., mining, forestry, fishing, and waste and scrap) is not available. Figures are rounded.
$44$55 $53
$71
$93$99
$130$125
$129
2000 2001 2002 2003 2004 2005 2006 2007 2008
Estimated Growth in Exports from California’s 2nd Congressional District, 2000–08
Exports to China: 196% Exports to Rest of World: 26%
California's 2nd Congressional District: Exports to China ($ million)

© 2009, The US-China Business Council
Sources: The Trade Partnership from US Census Bureau and US Department of Agriculture data.
California’s Top Exports to China, 2008
CA-3: Top Exports to China, 2008*
1. Computers & Electronics $3.4 billion 1. Other Manufacturing $92 million
2. Waste & Scrap $2.3 billion 2. Computers & Electronics $44 million
3. Machinery (except Electrical) $1.2 billion 3. Chemicals $26 million
4. Transportation Equipment $1.0 billion 4. Processed Foods $22 million
5. Chemicals $848 million 5. Machinery (except Electrical) $19 million * The data for CA-3 reflect the combined exports of Alpine, Amador, Calaveras, Sacramento, and Solano counties. The figures may understate the CA-3 district’s total exports to China because county-specific information for some products (e.g., mining, forestry, fishing, and waste and scrap) is not available.
$91
$119 $113$132
$163$182
$227$239 $240
2000 2001 2002 2003 2004 2005 2006 2007 2008
Estimated Growth in Exports from California’s 3rd Congressional District, 2000–08
Exports to China: 165% Exports to Rest of World: 12%
California's 3rd Congressional District: Exports to China ($ million)

© 2009, The US-China Business Council
Sources: The Trade Partnership from US Census Bureau and US Department of Agriculture data.
California’s Top Exports to China, 2008
CA-4: Top Exports to China, 2008*
1. Computers & Electronics $3.4 billion 1. Computers & Electronics $134 million
2. Waste & Scrap $2.3 billion 2. Other Manufacturing $38 million
3. Machinery (except Electrical) $1.2 billion 3. Machinery (except Electrical) $24 million
4. Transportation Equipment $1.0 billion 4. Processed Foods $19 million
5. Chemicals $848 million 5. Transportation Equipment $17 million * The data for CA-4 reflect the combined exports of Butte, El Dorado, Lassen, Modoc, Nevada, Placer, Plumas, Sacramento, and Sierra counties. The figures may understate the CA-4 district’s total exports to China because county-specific information for some products (e.g., mining, forestry, fishing, and waste and scrap) is not available.
$98
$128 $122
$143
$178
$199
$249$260 $261
2000 2001 2002 2003 2004 2005 2006 2007 2008
Estimated Growth in Exports from California’s 4th Congressional District, 2000–08
Exports to China: 166% Exports to Rest of World: 12%
California's 4th Congressional District: Exports to China ($ million)

© 2009, The US-China Business Council
Sources: The Trade Partnership from US Census Bureau and US Department of Agriculture data.
California’s Top Exports to China, 2008
CA-5: Top Exports to China, 2008*
1. Computers & Electronics $3.4 billion 1. Computers & Electronics $44 million
2. Waste & Scrap $2.3 billion 2. Other Manufacturing $33 million
3. Machinery (except Electrical) $1.2 billion 3. Transportation Equipment $17 million
4. Transportation Equipment $1.0 billion 4. Processed Foods $17 million
5. Chemicals $848 million 5. Machinery (except Electrical) $11 million * The data for CA-5 reflect the exports of Sacramento County, which also includes other congressional districts. The figures may understate the CA-5 district’s total exports to China because county-specific information for some products (e.g., mining, forestry, fishing, and waste and scrap) is not available.
$54
$70 $67$78
$96$108
$134$141 $142
2000 2001 2002 2003 2004 2005 2006 2007 2008
Estimated Growth in Exports from California’s 5th Congressional District, 2000–08
Exports to China: 164% Exports to Rest of World: 11%
California's 5th Congressional District: Exports to China ($ million)

© 2009, The US-China Business Council
Sources: The Trade Partnership from US Census Bureau and US Department of Agriculture data.
California’s Top Exports to China, 2008
CA-6: Top Exports to China, 2008*
1. Computers & Electronics $3.4 billion 1. Computers & Electronics $92 million
2. Waste & Scrap $2.3 billion 2. Machinery (except Electrical) $32 million
3. Machinery (except Electrical) $1.2 billion 3. Crop Production $8 million
4. Transportation Equipment $1.0 billion 4. Processed Foods $6 million
5. Chemicals $848 million 5. Electrical Equipment $3 million * The data for CA-6 reflect the combined exports of Sonoma and Marin counties. The figures may understate the CA-6 district’s total exports to China because county-specific information for some products (e.g., mining, forestry, fishing, and waste and scrap) is not available.
$67
$91$85 $88
$113 $110
$145
$158$148
2000 2001 2002 2003 2004 2005 2006 2007 2008
Estimated Growth in Exports from California’s 6th Congressional District, 2000–08
Exports to China: 121% Exports to Rest of World: 15%
California's 6th Congressional District: Exports to China ($ million)

© 2009, The US-China Business Council
Sources: The Trade Partnership from US Census Bureau and US Department of Agriculture data.
California’s Top Exports to China, 2008
CA-7: Top Exports to China, 2008*
1. Computers & Electronics $3.4 billion 1. Other Manufacturing $194 million
2. Waste & Scrap $2.3 billion 2. Chemicals $45 million
3. Machinery (except Electrical) $1.2 billion 3. Computers & Electronics $42 million
4. Transportation Equipment $1.0 billion 4. Petroleum & Coal Products $23 million
5. Chemicals $848 million 5. Machinery (except Electrical) $15 million * The data for CA-7 reflect the combined exports of Contra Costa and Solano counties. The figures may understate the CA-7 district’s total exports to China because county-specific information for some products (e.g., mining, forestry, fishing, and waste and scrap) is not available.
$131
$172 $164$189
$233$261
$325$343 $345
2000 2001 2002 2003 2004 2005 2006 2007 2008
Estimated Growth in Exports from California’s 7th Congressional District, 2000–08
Exports to China: 163% Exports to Rest of World: 11%
California's 7th Congressional District: Exports to China ($ million)

© 2009, The US-China Business Council
Sources: The Trade Partnership from US Census Bureau and US Department of Agriculture data.
California’s Top Exports to China, 2008
CA-8: Top Exports to China, 2008*
1. Computers & Electronics $3.4 billion 1. Other Manufacturing $62 million
2. Waste & Scrap $2.3 billion 2. Computers & Electronics $6 million
3. Machinery (except Electrical) $1.2 billion 3. Processed Foods $3 million
4. Transportation Equipment $1.0 billion 4. Apparel Manufactures $2 million
5. Chemicals $848 million 5. Miscellaneous Manufacturing $1 million
* The data for CA-8 reflect the exports of San Francisco County, which includes another congressional district. The figures may understate the CA-8 district’s total exports to China because county-specific information for some products (e.g., mining, forestry, fishing, and waste and scrap) is not available.
$30
$39 $37$42
$53
$60
$74$77 $77
2000 2001 2002 2003 2004 2005 2006 2007 2008
Estimated Growth in Exports from California’s 8th Congressional District, 2000–08
Exports to China: 161% Exports to Rest of World: 11%
California's 8th Congressional District: Exports to China ($ million)

© 2009, The US-China Business Council
Sources: The Trade Partnership from US Census Bureau and US Department of Agriculture data.
California’s Top Exports to China, 2008
CA-9: Top Exports to China, 2008*
1. Computers & Electronics $3.4 billion 1. Computers & Electronics $403 million
2. Waste & Scrap $2.3 billion 2. Transportation Equipment $189 million
3. Machinery (except Electrical) $1.2 billion 3. Machinery (except Electrical) $105 million
4. Transportation Equipment $1.0 billion 4. Chemicals $57 million
5. Chemicals $848 million 5. Processed Foods $22 million * The data for CA-9 reflect the exports of Alameda County, which also includes other congressional districts. The figures may understate the CA-9 district’s total exports to China because county-specific information for some products (e.g., mining, forestry, fishing, and waste and scrap) is not available.
$314
$419$393
$447
$553
$645
$812 $837 $826
2000 2001 2002 2003 2004 2005 2006 2007 2008
Estimated Growth in Exports from California’s 9th Congressional District, 2000–08
Exports to China: 163% Exports to Rest of World: 9%
California's 9th Congressional District: Exports to China ($ million)

© 2009, The US-China Business Council
Sources: The Trade Partnership from US Census Bureau and US Department of Agriculture data.
California’s Top Exports to China, 2008
CA-10: Top Exports to China, 2008*
1. Computers & Electronics $3.4 billion 1. Computers & Electronics $488 million
2. Waste & Scrap $2.3 billion 2. Transportation Equipment $206 million
3. Machinery (except Electrical) $1.2 billion 3. Machinery (except Electrical) $131 million
4. Transportation Equipment $1.0 billion 4. Chemicals $112 million
5. Chemicals $848 million 5. Processed Foods $50 million * The data for CA-10 reflect the combined exports of Alameda, Contra Costa, Sacramento, and Solano counties. The figures may understate the CA-10 district’s total exports to China because county-specific information for some products (e.g., mining, forestry, fishing, and waste and scrap) is not available.
$429
$563 $535$615
$758$852
$1,057$1,120 $1,122
2000 2001 2002 2003 2004 2005 2006 2007 2008
Estimated Growth in Exports from California’s 10th Congressional District, 2000–08
Exports to China: 162% Exports to Rest of World: 10%
California's 10th Congressional District: Exports to China ($ million)

© 2009, The US-China Business Council
Sources: The Trade Partnership from US Census Bureau and US Department of Agriculture data.
California’s Top Exports to China, 2008
CA-11: Top Exports to China, 2008*
1. Computers & Electronics $3.4 billion 1. Computers & Electronics $1.6 billion
2. Waste & Scrap $2.3 billion 2. Transportation Equipment $195 million
3. Machinery (except Electrical) $1.2 billion 3. Machinery (except Electrical) $119 million
4. Transportation Equipment $1.0 billion 4. Chemicals $94 million
5. Chemicals $848 million 5. Processed Foods $59 million * The data for CA-11 reflect the combined exports of Alameda, Contra Costa, San Joaquin, and Santa Clara counties. The figures may understate the CA-11 district’s total exports to China because county-specific information for some products (e.g., mining, forestry, fishing, and waste and scrap) is not available.
$1,046
$1,400$1,246 $1,323
$1,610$1,720
$2,150$2,332
$2,206
2000 2001 2002 2003 2004 2005 2006 2007 2008
Estimated Growth in Exports from California’s 11th Congressional District, 2000–08
Exports to China: 111% Exports to Rest of World: 11%
California's 11th Congressional District: Exports to China ($ million)

© 2009, The US-China Business Council
Sources: The Trade Partnership from US Census Bureau and US Department of Agriculture data.
California’s Top Exports to China, 2008
CA-12: Top Exports to China, 2008*
1. Computers & Electronics $3.4 billion 1. Other Manufacturing $151 million
2. Waste & Scrap $2.3 billion 2. Computers & Electronics $70 million
3. Machinery (except Electrical) $1.2 billion 3. Processed Foods $12 million
4. Transportation Equipment $1.0 billion 4. Machinery (except Electrical) $9 million
5. Chemicals $848 million 5. Miscellaneous Manufacturing $4 million * The data for CA-12 reflect the combined exports of San Francisco and San Mateo counties. The figures may understate the CA-12 district’s total exports to China because county-specific information for some products (e.g., mining, forestry, fishing, and waste and scrap) is not available.
$99
$129 $123$141
$179$201
$250$259 $259
2000 2001 2002 2003 2004 2005 2006 2007 2008
Estimated Growth in Exports from California’s 12th Congressional District, 2000–08
Exports to China: 163% Exports to Rest of World: 11%
California's 12th Congressional District: Exports to China ($ million)

© 2009, The US-China Business Council
Sources: The Trade Partnership from US Census Bureau and US Department of Agriculture data.
California’s Top Exports to China, 2008
CA-13: Top Exports to China, 2008*
1. Computers & Electronics $3.4 billion 1. Computers & Electronics $403 million
2. Waste & Scrap $2.3 billion 2. Transportation Equipment $189 million
3. Machinery (except Electrical) $1.2 billion 3. Machinery (except Electrical) $105 million
4. Transportation Equipment $1.0 billion 4. Chemicals $57 million
5. Chemicals $848 million 5. Processed Foods $22 million * The data for CA-13 reflect the exports of Alameda County, which also includes other congressional districts. The figures may understate the CA-13 district’s total exports to China because county-specific information for some products (e.g., mining, forestry, fishing, and waste and scrap) is not available.
$314
$419$393
$447
$553
$645
$812 $837 $826
2000 2001 2002 2003 2004 2005 2006 2007 2008
Estimated Growth in Exports from California’s 13th Congressional District, 2000–08
Exports to China: 163% Exports to Rest of World: 9%
California's 13th Congressional District: Exports to China ($ million)

© 2009, The US-China Business Council
Sources: The Trade Partnership from US Census Bureau and US Department of Agriculture data.
California’s Top Exports to China, 2008
CA-14: Top Exports to China, 2008*
1. Computers & Electronics $3.4 billion 1. Computers & Electronics $1.2 billion
2. Waste & Scrap $2.3 billion 2. Processed Foods $19 million
3. Machinery (except Electrical) $1.2 billion 3. Crop Production $14 million
4. Transportation Equipment $1.0 billion 4. Fabricated Metal Products $13 million
5. Chemicals $848 million 5. Machinery (except Electrical) $9 million * The data for CA-14 reflect the combined exports of San Mateo, Santa Clara, and Santa Cruz counties. The figures may understate the CA-14 district’s total exports to China because county-specific information for some products (e.g., mining, forestry, fishing, and waste and scrap) is not available.
$725
$967
$838 $847
$1,023 $1,041
$1,289
$1,439
$1,302
2000 2001 2002 2003 2004 2005 2006 2007 2008
Estimated Growth in Exports from California’s 14th Congressional District, 2000–08
Exports to China: 80% Exports to Rest of World: 12%
California's 14th Congressional District: Exports to China ($ million)

© 2009, The US-China Business Council
Sources: The Trade Partnership from US Census Bureau and US Department of Agriculture data.
California’s Top Exports to China, 2008
CA-15: Top Exports to China, 2008*
1. Computers & Electronics $3.4 billion 1. Computers & Electronics $1.2 billion
2. Waste & Scrap $2.3 billion 2. Fabricated Metal Products $10 million
3. Machinery (except Electrical) $1.2 billion 3. Processed Foods $7 million
4. Transportation Equipment $1.0 billion 4. Crop Production $4 million
5. Chemicals $848 million 5. Nonmetallic Mineral Products $2 million
* The data for CA-15 reflect the exports of Santa Clara County, which also includes other congressional districts. The figures may understate the CA-15 district’s total exports to China because county-specific information for some products (e.g., mining, forestry, fishing, and waste and scrap) is not available.
$675
$900
$778 $780
$936 $955
$1,179
$1,324
$1,192
2000 2001 2002 2003 2004 2005 2006 2007 2008
Estimated Growth in Exports from California’s 15th Congressional District, 2000–08
Exports to China: 77% Exports to Rest of World: 11%
California's 15th Congressional District: Exports to China ($ million)

© 2009, The US-China Business Council
Sources: The Trade Partnership from US Census Bureau and US Department of Agriculture data.
California’s Top Exports to China, 2008
CA-16: Top Exports to China, 2008*
1. Computers & Electronics $3.4 billion 1. Computers & Electronics $1.2 billion
2. Waste & Scrap $2.3 billion 2. Fabricated Metal Products $10 million
3. Machinery (except Electrical) $1.2 billion 3. Processed Foods $7 million
4. Transportation Equipment $1.0 billion 4. Crop Production $4 million
5. Chemicals $848 million 5. Nonmetallic Mineral Products $2 million
* The data for CA-16 reflect the exports of Santa Clara County, which also includes other congressional districts. The figures may understate the CA-16 district’s total exports to China because county-specific information for some products (e.g., mining, forestry, fishing, and waste and scrap) is not available.
$675
$900
$778 $780
$936 $955
$1,179
$1,324
$1,192
2000 2001 2002 2003 2004 2005 2006 2007 2008
Estimated Growth in Exports from California’s 16th Congressional District, 2000–08
Exports to China: 77% Exports to Rest of World: 11%
California's 16th Congressional District: Exports to China ($ million)

© 2009, The US-China Business Council
Sources: The Trade Partnership from US Census Bureau and US Department of Agriculture data.
California’s Top Exports to China, 2008
CA-17: Top Exports to China, 2008*
1. Computers & Electronics $3.4 billion 1. Other Manufacturing $53 million
2. Waste & Scrap $2.3 billion 2. Crop Production $51 million
3. Machinery (except Electrical) $1.2 billion 3. Processed Foods $14 million
4. Transportation Equipment $1.0 billion 4. Computers & Electronics $7 million
5. Chemicals $848 million 5. Wood Products $235,000 * The data for CA-17 reflect the combined exports of Monterey, San Benito, and Santa Cruz counties. The figures may understate the CA-17 district’s total exports to China because county-specific information for some products (e.g., mining, forestry, fishing, and waste and scrap) is not available.
$37$44 $45
$68
$97 $98
$136
$118$126
2000 2001 2002 2003 2004 2005 2006 2007 2008
Estimated Growth in Exports from California’s 17th Congressional District, 2000–08
Exports to China: 236% Exports to Rest of World: 42%
California's 17th Congressional District: Exports to China ($ million)

© 2009, The US-China Business Council
Sources: The Trade Partnership from US Census Bureau and US Department of Agriculture data.
California’s Top Exports to China, 2008
CA-18: Top Exports to China, 2008*
1. Computers & Electronics $3.4 billion 1. Other Manufacturing $291 million
2. Waste & Scrap $2.3 billion 2. Processed Foods $103 million
3. Machinery (except Electrical) $1.2 billion 3. Crop Production $91 million
4. Transportation Equipment $1.0 billion 4. Machinery (except Electrical) $53 million
5. Chemicals $848 million 5. Transportation Equipment $14 million * The data for CA-18 reflect the combined exports of Fresno, Madera, Merced, San Joaquin, and Stanislaus counties. The figures may understate the CA-18 district’s total exports to China because county-specific information for some products (e.g., mining, forestry, fishing, and waste and scrap) is not available.
$210
$267 $259
$327
$423$457
$590 $583 $598
2000 2001 2002 2003 2004 2005 2006 2007 2008
Estimated Growth in Exports from California’s 18th Congressional District, 2000–08
Exports to China: 185% Exports to Rest of World: 21%
California's 18th Congressional District: Exports to China ($ million)

© 2009, The US-China Business Council
Sources: The Trade Partnership from US Census Bureau and US Department of Agriculture data.
California’s Top Exports to China, 2008
CA-19: Top Exports to China, 2008*
1. Computers & Electronics $3.4 billion 1. Other Manufacturing $172 million
2. Waste & Scrap $2.3 billion 2. Processed Foods $64 million
3. Machinery (except Electrical) $1.2 billion 3. Crop Production $62 million
4. Transportation Equipment $1.0 billion 4. Machinery (except Electrical) $46 million
5. Chemicals $848 million 5. Transportation Equipment $9 million * The data for CA-19 reflect the combined exports of Fresno, Madera, Mariposa, Stanislaus, and Tuolumne counties. The figures may understate the CA-19 district’s total exports to China because county-specific information for some products (e.g., mining, forestry, fishing, and waste and scrap) is not available.
$131
$166 $161
$205
$266$287
$372 $365 $375
2000 2001 2002 2003 2004 2005 2006 2007 2008
Estimated Growth in Exports from California’s 19th Congressional District, 2000–08
Exports to China: 187% Exports to Rest of World: 22%
California's 19th Congressional District: Exports to China ($ million)

© 2009, The US-China Business Council
Sources: The Trade Partnership from US Census Bureau and US Department of Agriculture data.
California’s Top Exports to China, 2008
CA-20: Top Exports to China, 2008*
1. Computers & Electronics $3.4 billion 1. Other Manufacturing $127 million
2. Waste & Scrap $2.3 billion 2. Crop Production $83 million
3. Machinery (except Electrical) $1.2 billion 3. Processed Foods $51 million
4. Transportation Equipment $1.0 billion 4. Machinery (except Electrical) $27 million
5. Chemicals $848 million 5. Chemicals $11 million * The data for CA-20 reflect the combined exports of Fresno, Kern, and Kings counties. The figures may understate the CA-20 district’s total exports to China because county-specific information for some products (e.g., mining, forestry, fishing, and waste and scrap) is not available.
$105$131 $129
$175
$235$247
$328$307
$320
2000 2001 2002 2003 2004 2005 2006 2007 2008
Estimated Growth in Exports from California’s 20th Congressional District, 2000–08
Exports to China: 204% Exports to Rest of World: 30%
California's 20th Congressional District: Exports to China ($ million)

© 2009, The US-China Business Council
Sources: The Trade Partnership from US Census Bureau and US Department of Agriculture data.
California’s Top Exports to China, 2008
CA-21: Top Exports to China, 2008*
1. Computers & Electronics $3.4 billion 1. Other Manufacturing $99 million
2. Waste & Scrap $2.3 billion 2. Crop Production $64 million
3. Machinery (except Electrical) $1.2 billion 3. Processed Foods $54 million
4. Transportation Equipment $1.0 billion 4. Machinery (except Electrical) $37 million
5. Chemicals $848 million 5. Chemicals $5 million
* The data for CA-21 reflect the combined exports of Fresno and Tulare counties. The figures may understate the CA-21 district’s total exports to China because county-specific information for some products (e.g., mining, forestry, fishing, and waste and scrap) is not available.
$92$115 $113
$151
$200$211
$279$265
$275
2000 2001 2002 2003 2004 2005 2006 2007 2008
Estimated Growth in Exports from California’s 21st Congressional District, 2000–08
Exports to China: 200% Exports to Rest of World: 28%
California's 21st Congressional District: Exports to China ($ million)
© 2009, The US-China Business Council
Sources: The Trade Partnership from US Census Bureau and US Department of Agriculture data.
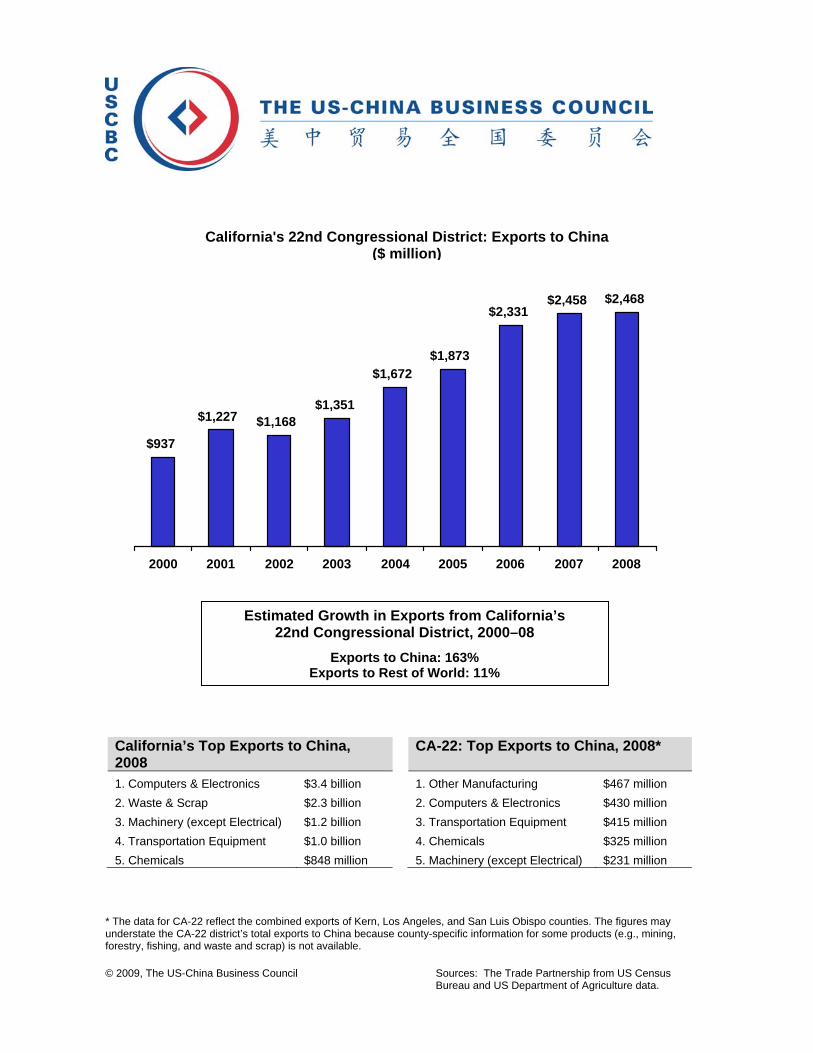
California’s Top Exports to China, 2008
CA-22: Top Exports to China, 2008*
1. Computers & Electronics $3.4 billion 1. Other Manufacturing $467 million
2. Waste & Scrap $2.3 billion 2. Computers & Electronics $430 million
3. Machinery (except Electrical) $1.2 billion 3. Transportation Equipment $415 million
4. Transportation Equipment $1.0 billion 4. Chemicals $325 million
5. Chemicals $848 million 5. Machinery (except Electrical) $231 million * The data for CA-22 reflect the combined exports of Kern, Los Angeles, and San Luis Obispo counties. The figures may understate the CA-22 district’s total exports to China because county-specific information for some products (e.g., mining, forestry, fishing, and waste and scrap) is not available.
$937
$1,227 $1,168$1,351
$1,672$1,873
$2,331$2,458 $2,468
2000 2001 2002 2003 2004 2005 2006 2007 2008
Estimated Growth in Exports from California’s 22nd Congressional District, 2000–08
Exports to China: 163% Exports to Rest of World: 11%
California's 22nd Congressional District: Exports to China ($ million)
© 2009, The US-China Business Council
Sources: The Trade Partnership from US Census Bureau and US Department of Agriculture data.
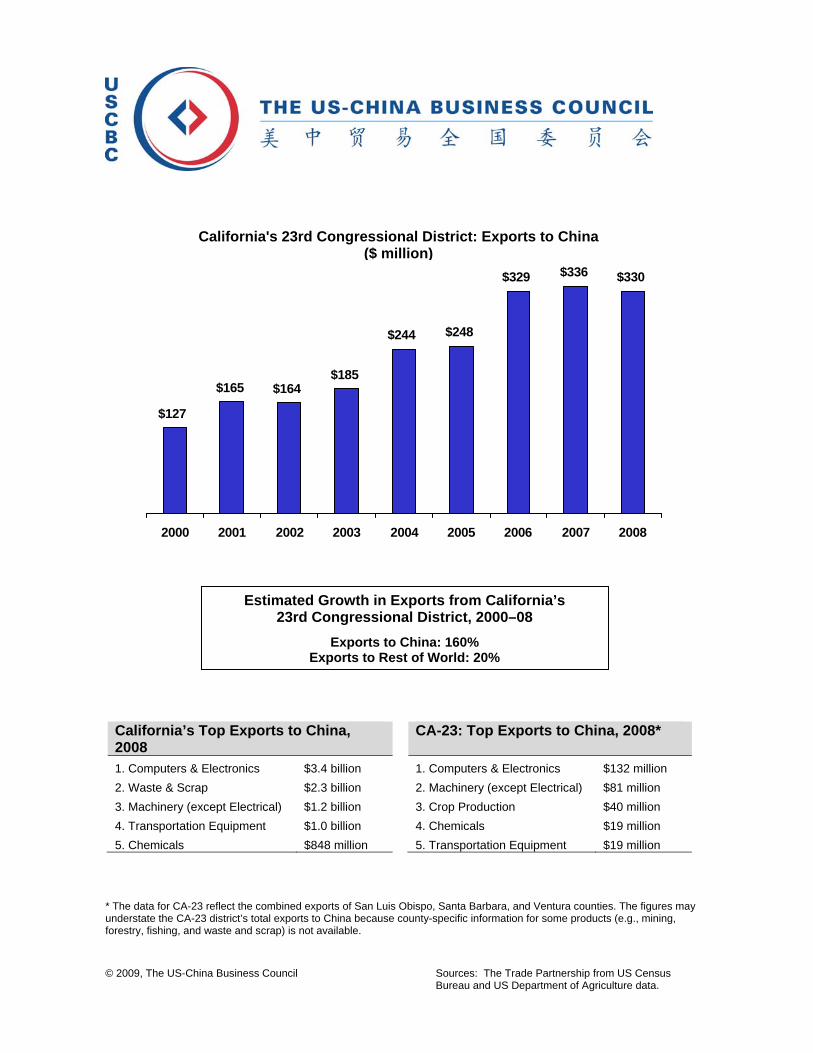
California’s Top Exports to China, 2008
CA-23: Top Exports to China, 2008*
1. Computers & Electronics $3.4 billion 1. Computers & Electronics $132 million
2. Waste & Scrap $2.3 billion 2. Machinery (except Electrical) $81 million
3. Machinery (except Electrical) $1.2 billion 3. Crop Production $40 million
4. Transportation Equipment $1.0 billion 4. Chemicals $19 million
5. Chemicals $848 million 5. Transportation Equipment $19 million * The data for CA-23 reflect the combined exports of San Luis Obispo, Santa Barbara, and Ventura counties. The figures may understate the CA-23 district’s total exports to China because county-specific information for some products (e.g., mining, forestry, fishing, and waste and scrap) is not available.
$127
$165 $164$185
$244 $248
$329 $336 $330
2000 2001 2002 2003 2004 2005 2006 2007 2008
Estimated Growth in Exports from California’s 23rd Congressional District, 2000–08
Exports to China: 160% Exports to Rest of World: 20%
California's 23rd Congressional District: Exports to China ($ million)

© 2009, The US-China Business Council
Sources: The Trade Partnership from US Census Bureau and US Department of Agriculture data.
California’s Top Exports to China, 2008
CA-24: Top Exports to China, 2008*
1. Computers & Electronics $3.4 billion 1. Computers & Electronics $127 million
2. Waste & Scrap $2.3 billion 2. Machinery (except Electrical) $73 million
3. Machinery (except Electrical) $1.2 billion 3. Crop Production $33 million
4. Transportation Equipment $1.0 billion 4. Chemicals $19 million
5. Chemicals $848 million 5. Transportation Equipment $19 million * The data for CA-24 reflect the combined exports of Santa Barbara and Ventura counties. The figures may understate the CA-24 district’s total exports to China because county-specific information for some products (e.g., mining, forestry, fishing, and waste and scrap) is not available.
$120
$156 $155$173
$227 $232
$305 $314 $307
2000 2001 2002 2003 2004 2005 2006 2007 2008
Estimated Growth in Exports from California’s 24th Congressional District, 2000–08
Exports to China: 156% Exports to Rest of World: 19%
California's 24th Congressional District: Exports to China ($ million)

© 2009, The US-China Business Council
Sources: The Trade Partnership from US Census Bureau and US Department of Agriculture data.
California’s Top Exports to China, 2008
CA-25: Top Exports to China, 2008*
1. Computers & Electronics $3.4 billion 1. Other Manufacturing $455 million
2. Waste & Scrap $2.3 billion 2. Transportation Equipment $449 million
3. Machinery (except Electrical) $1.2 billion 3. Computers & Electronics $434 million
4. Transportation Equipment $1.0 billion 4. Chemicals $347 million
5. Chemicals $848 million 5. Machinery (except Electrical) $265 million * The data for CA-25 reflect the combined exports of Inyo, Los Angeles, Mono, and San Bernardino counties. The figures may understate the CA-25 district’s total exports to China because county-specific information for some products (e.g., mining, forestry, fishing, and waste and scrap) is not available.
$1,008
$1,323 $1,257$1,441
$1,772$1,994
$2,470$2,626 $2,630
2000 2001 2002 2003 2004 2005 2006 2007 2008
Estimated Growth in Exports from California’s 25th Congressional District, 2000–08
Exports to China: 161% Exports to Rest of World: 10%
California's 25th Congressional District: Exports to China ($ million)

© 2009, The US-China Business Council
Sources: The Trade Partnership from US Census Bureau and US Department of Agriculture data.
California’s Top Exports to China, 2008
CA-26: Top Exports to China, 2008*
1. Computers & Electronics $3.4 billion 1. Other Manufacturing $455 million
2. Waste & Scrap $2.3 billion 2. Transportation Equipment $449 million
3. Machinery (except Electrical) $1.2 billion 3. Computers & Electronics $434 million
4. Transportation Equipment $1.0 billion 4. Chemicals $347 million
5. Chemicals $848 million 5. Machinery (except Electrical) $265 million * The data for CA-26 reflect the combined exports of Los Angeles and San Bernardino counties. The figures may understate the CA-26 district’s total exports to China because county-specific information for some products (e.g., mining, forestry, fishing, and waste and scrap) is not available.
$1,008
$1,323 $1,257$1,441
$1,772$1,994
$2,470$2,625 $2,630
2000 2001 2002 2003 2004 2005 2006 2007 2008
Estimated Growth in Exports from California’s 26th Congressional District, 2000–08
Exports to China: 161% Exports to Rest of World: 10%
California's 26th Congressional District: Exports to China ($ million)

© 2009, The US-China Business Council
Sources: The Trade Partnership from US Census Bureau and US Department of Agriculture data.
California’s Top Exports to China, 2008
CA-27: Top Exports to China, 2008*
1. Computers & Electronics $3.4 billion 1. Computers & Electronics $425 million
2. Waste & Scrap $2.3 billion 2. Transportation Equipment $415 million
3. Machinery (except Electrical) $1.2 billion 3. Other Manufacturing $404 million
4. Transportation Equipment $1.0 billion 4. Chemicals $319 million
5. Chemicals $848 million 5. Machinery (except Electrical) $223 million * The data for CA-27 reflect the exports of Los Angeles County, which also includes other congressional districts. The figures may understate the CA-27 district’s total exports to China because county-specific information for some products (e.g., mining, forestry, fishing, and waste and scrap) is not available.
$889
$1,168 $1,110$1,271
$1,564$1,759
$2,180$2,317 $2,321
2000 2001 2002 2003 2004 2005 2006 2007 2008
Estimated Growth in Exports from California’s 27th Congressional District, 2000–08
Exports to China: 161% Exports to Rest of World: 10%
California's 27th Congressional District: Exports to China ($ million)

© 2009, The US-China Business Council
Sources: The Trade Partnership from US Census Bureau and US Department of Agriculture data.
California’s Top Exports to China, 2008
CA-28: Top Exports to China, 2008*
1. Computers & Electronics $3.4 billion 1. Computers & Electronics $425 million
2. Waste & Scrap $2.3 billion 2. Transportation Equipment $415 million
3. Machinery (except Electrical) $1.2 billion 3. Other Manufacturing $404 million
4. Transportation Equipment $1.0 billion 4. Chemicals $319 million
5. Chemicals $848 million 5. Machinery (except Electrical) $223 million * The data for CA-28 reflect the exports of Los Angeles County, which also includes other congressional districts. The figures may understate the CA-28 district’s total exports to China because county-specific information for some products (e.g., mining, forestry, fishing, and waste and scrap) is not available.
$889
$1,168 $1,110$1,271
$1,564$1,759
$2,180$2,317 $2,321
2000 2001 2002 2003 2004 2005 2006 2007 2008
Estimated Growth in Exports from California’s 28th Congressional District, 2000–08
Exports to China: 161% Exports to Rest of World: 10%
California's 28th Congressional District: Exports to China ($ million)

© 2009, The US-China Business Council
Sources: The Trade Partnership from US Census Bureau and US Department of Agriculture data.
California’s Top Exports to China, 2008
CA-29: Top Exports to China, 2008*
1. Computers & Electronics $3.4 billion 1. Computers & Electronics $425 million
2. Waste & Scrap $2.3 billion 2. Transportation Equipment $415 million
3. Machinery (except Electrical) $1.2 billion 3. Other Manufacturing $404 million
4. Transportation Equipment $1.0 billion 4. Chemicals $319 million
5. Chemicals $848 million 5. Machinery (except Electrical) $223 million * The data for CA-29 reflect the exports of Los Angeles County, which also includes other congressional districts. The figures may understate the CA-29 district’s total exports to China because county-specific information for some products (e.g., mining, forestry, fishing, and waste and scrap) is not available.
$889
$1,168 $1,110$1,271
$1,564$1,759
$2,180$2,317 $2,321
2000 2001 2002 2003 2004 2005 2006 2007 2008
Estimated Growth in Exports from California’s 29th Congressional District, 2000–08
Exports to China: 161% Exports to Rest of World: 10%
California's 29th Congressional District: Exports to China ($ million)

© 2009, The US-China Business Council
Sources: The Trade Partnership from US Census Bureau and US Department of Agriculture data.
California’s Top Exports to China, 2008
CA-30: Top Exports to China, 2008*
1. Computers & Electronics $3.4 billion 1. Computers & Electronics $425 million
2. Waste & Scrap $2.3 billion 2. Transportation Equipment $415 million
3. Machinery (except Electrical) $1.2 billion 3. Other Manufacturing $404 million
4. Transportation Equipment $1.0 billion 4. Chemicals $319 million
5. Chemicals $848 million 5. Machinery (except Electrical) $223 million * The data for CA-30 reflect the exports of Los Angeles County, which also includes other congressional districts. The figures may understate the CA-30 district’s total exports to China because county-specific information for some products (e.g., mining, forestry, fishing, and waste and scrap) is not available.
$889
$1,168 $1,110$1,271
$1,564$1,759
$2,180$2,317 $2,321
2000 2001 2002 2003 2004 2005 2006 2007 2008
Estimated Growth in Exports from California’s 30th Congressional District, 2000–08
Exports to China: 161% Exports to Rest of World: 10%
California's 30th Congressional District: Exports to China ($ million)

© 2009, The US-China Business Council
Sources: The Trade Partnership from US Census Bureau and US Department of Agriculture data.
California’s Top Exports to China, 2008
CA-31: Top Exports to China, 2008*
1. Computers & Electronics $3.4 billion 1. Computers & Electronics $425 million
2. Waste & Scrap $2.3 billion 2. Transportation Equipment $415 million
3. Machinery (except Electrical) $1.2 billion 3. Other Manufacturing $404 million
4. Transportation Equipment $1.0 billion 4. Chemicals $319 million
5. Chemicals $848 million 5. Machinery (except Electrical) $223 million * The data for CA-31 reflect the exports of Los Angeles County, which also includes other congressional districts. The figures may understate the CA-31 district’s total exports to China because county-specific information for some products (e.g., mining, forestry, fishing, and waste and scrap) is not available.
$889
$1,168 $1,110$1,271
$1,564$1,759
$2,180$2,317 $2,321
2000 2001 2002 2003 2004 2005 2006 2007 2008
Estimated Growth in Exports from California’s 31st Congressional District, 2000–08
Exports to China: 161% Exports to Rest of World: 10%
California's 31st Congressional District: Exports to China ($ million)

© 2009, The US-China Business Council
Sources: The Trade Partnership from US Census Bureau and US Department of Agriculture data.
California’s Top Exports to China, 2008
CA-32: Top Exports to China, 2008*
1. Computers & Electronics $3.4 billion 1. Computers & Electronics $425 million
2. Waste & Scrap $2.3 billion 2. Transportation Equipment $415 million
3. Machinery (except Electrical) $1.2 billion 3. Other Manufacturing $404 million
4. Transportation Equipment $1.0 billion 4. Chemicals $319 million
5. Chemicals $848 million 5. Machinery (except Electrical) $223 million * The data for CA-32 reflect the exports of Los Angeles County, which also includes other congressional districts. The figures may understate the CA-32 district’s total exports to China because county-specific information for some products (e.g., mining, forestry, fishing, and waste and scrap) is not available.
$889
$1,168 $1,110$1,271
$1,564$1,759
$2,180$2,317 $2,321
2000 2001 2002 2003 2004 2005 2006 2007 2008
Estimated Growth in Exports from California’s 32nd Congressional District, 2000–08
Exports to China: 161% Exports to Rest of World: 10%
California's 32nd Congressional District: Exports to China ($ million)

© 2009, The US-China Business Council
Sources: The Trade Partnership from US Census Bureau and US Department of Agriculture data.
California’s Top Exports to China, 2008
CA-33: Top Exports to China, 2008*
1. Computers & Electronics $3.4 billion 1. Computers & Electronics $425 million
2. Waste & Scrap $2.3 billion 2. Transportation Equipment $415 million
3. Machinery (except Electrical) $1.2 billion 3. Other Manufacturing $404 million
4. Transportation Equipment $1.0 billion 4. Chemicals $319 million
5. Chemicals $848 million 5. Machinery (except Electrical) $223 million * The data for CA-33 reflect the exports of Los Angeles County, which also includes other congressional districts. The figures may understate the CA-33 district’s total exports to China because county-specific information for some products (e.g., mining, forestry, fishing, and waste and scrap) is not available.
$889
$1,168 $1,110$1,271
$1,564$1,759
$2,180$2,317 $2,321
2000 2001 2002 2003 2004 2005 2006 2007 2008
Estimated Growth in Exports from California’s 33rd Congressional District, 2000–08
Exports to China: 161% Exports to Rest of World: 10%
California's 33rd Congressional District: Exports to China ($ million)

© 2009, The US-China Business Council
Sources: The Trade Partnership from US Census Bureau and US Department of Agriculture data.
California’s Top Exports to China, 2008
CA-34: Top Exports to China, 2008*
1. Computers & Electronics $3.4 billion 1. Computers & Electronics $425 million
2. Waste & Scrap $2.3 billion 2. Transportation Equipment $415 million
3. Machinery (except Electrical) $1.2 billion 3. Other Manufacturing $404 million
4. Transportation Equipment $1.0 billion 4. Chemicals $319 million
5. Chemicals $848 million 5. Machinery (except Electrical) $223 million * The data for CA-34 reflect the exports of Los Angeles County, which also includes other congressional districts. The figures may understate the CA-34 district’s total exports to China because county-specific information for some products (e.g., mining, forestry, fishing, and waste and scrap) is not available.
$889
$1,168 $1,110$1,271
$1,564$1,759
$2,180$2,317 $2,321
2000 2001 2002 2003 2004 2005 2006 2007 2008
Estimated Growth in Exports from California’s 34th Congressional District, 2000–08
Exports to China: 161% Exports to Rest of World: 10%
California's 34th Congressional District: Exports to China ($ million)

© 2009, The US-China Business Council
Sources: The Trade Partnership from US Census Bureau and US Department of Agriculture data.
California’s Top Exports to China, 2008
CA-35: Top Exports to China, 2008*
1. Computers & Electronics $3.4 billion 1. Computers & Electronics $425 million
2. Waste & Scrap $2.3 billion 2. Transportation Equipment $415 million
3. Machinery (except Electrical) $1.2 billion 3. Other Manufacturing $404 million
4. Transportation Equipment $1.0 billion 4. Chemicals $319 million
5. Chemicals $848 million 5. Machinery (except Electrical) $223 million * The data for CA-35 reflect the exports of Los Angeles County, which also includes other congressional districts. The figures may understate the CA-35 district’s total exports to China because county-specific information for some products (e.g., mining, forestry, fishing, and waste and scrap) is not available.
$889
$1,168 $1,110$1,271
$1,564$1,759
$2,180$2,317 $2,321
2000 2001 2002 2003 2004 2005 2006 2007 2008
Estimated Growth in Exports from California’s 35th Congressional District, 2000–08
Exports to China: 161% Exports to Rest of World: 10%
California's 35th Congressional District: Exports to China ($ million)

© 2009, The US-China Business Council
Sources: The Trade Partnership from US Census Bureau and US Department of Agriculture data.
California’s Top Exports to China, 2008
CA-36: Top Exports to China, 2008*
1. Computers & Electronics $3.4 billion 1. Computers & Electronics $425 million
2. Waste & Scrap $2.3 billion 2. Transportation Equipment $415 million
3. Machinery (except Electrical) $1.2 billion 3. Other Manufacturing $404 million
4. Transportation Equipment $1.0 billion 4. Chemicals $319 million
5. Chemicals $848 million 5. Machinery (except Electrical) $223 million * The data for CA-36 reflect the exports of Los Angeles County, which also includes other congressional districts. The figures may understate the CA-36 district’s total exports to China because county-specific information for some products (e.g., mining, forestry, fishing, and waste and scrap) is not available.
$889
$1,168 $1,110$1,271
$1,564$1,759
$2,180$2,317 $2,321
2000 2001 2002 2003 2004 2005 2006 2007 2008
Estimated Growth in Exports from California’s 36th Congressional District, 2000–08
Exports to China: 161% Exports to Rest of World: 10%
California's 36th Congressional District: Exports to China ($ million)

© 2009, The US-China Business Council
Sources: The Trade Partnership from US Census Bureau and US Department of Agriculture data.
California’s Top Exports to China, 2008
CA-37: Top Exports to China, 2008*
1. Computers & Electronics $3.4 billion 1. Computers & Electronics $425 million
2. Waste & Scrap $2.3 billion 2. Transportation Equipment $415 million
3. Machinery (except Electrical) $1.2 billion 3. Other Manufacturing $404 million
4. Transportation Equipment $1.0 billion 4. Chemicals $319 million
5. Chemicals $848 million 5. Machinery (except Electrical) $223 million * The data for CA-37 reflect the exports of Los Angeles County, which also includes other congressional districts. The figures may understate the CA-37 district’s total exports to China because county-specific information for some products (e.g., mining, forestry, fishing, and waste and scrap) is not available.
$889
$1,168 $1,110$1,271
$1,564$1,759
$2,180$2,317 $2,321
2000 2001 2002 2003 2004 2005 2006 2007 2008
Estimated Growth in Exports from California’s 37th Congressional District, 2000–08
Exports to China: 161% Exports to Rest of World: 10%
California's 37th Congressional District: Exports to China ($ million)

© 2009, The US-China Business Council
Sources: The Trade Partnership from US Census Bureau and US Department of Agriculture data.
California’s Top Exports to China, 2008
CA-38: Top Exports to China, 2008*
1. Computers & Electronics $3.4 billion 1. Computers & Electronics $425 million
2. Waste & Scrap $2.3 billion 2. Transportation Equipment $415 million
3. Machinery (except Electrical) $1.2 billion 3. Other Manufacturing $404 million
4. Transportation Equipment $1.0 billion 4. Chemicals $319 million
5. Chemicals $848 million 5. Machinery (except Electrical) $223 million * The data for CA-38 reflect the exports of Los Angeles County, which also includes other congressional districts. The figures may understate the CA-38 district’s total exports to China because county-specific information for some products (e.g., mining, forestry, fishing, and waste and scrap) is not available.
$889
$1,168 $1,110$1,271
$1,564$1,759
$2,180$2,317 $2,321
2000 2001 2002 2003 2004 2005 2006 2007 2008
Estimated Growth in Exports from California’s 38th Congressional District, 2000–08
Exports to China: 161% Exports to Rest of World: 10%
California's 38th Congressional District: Exports to China ($ million)
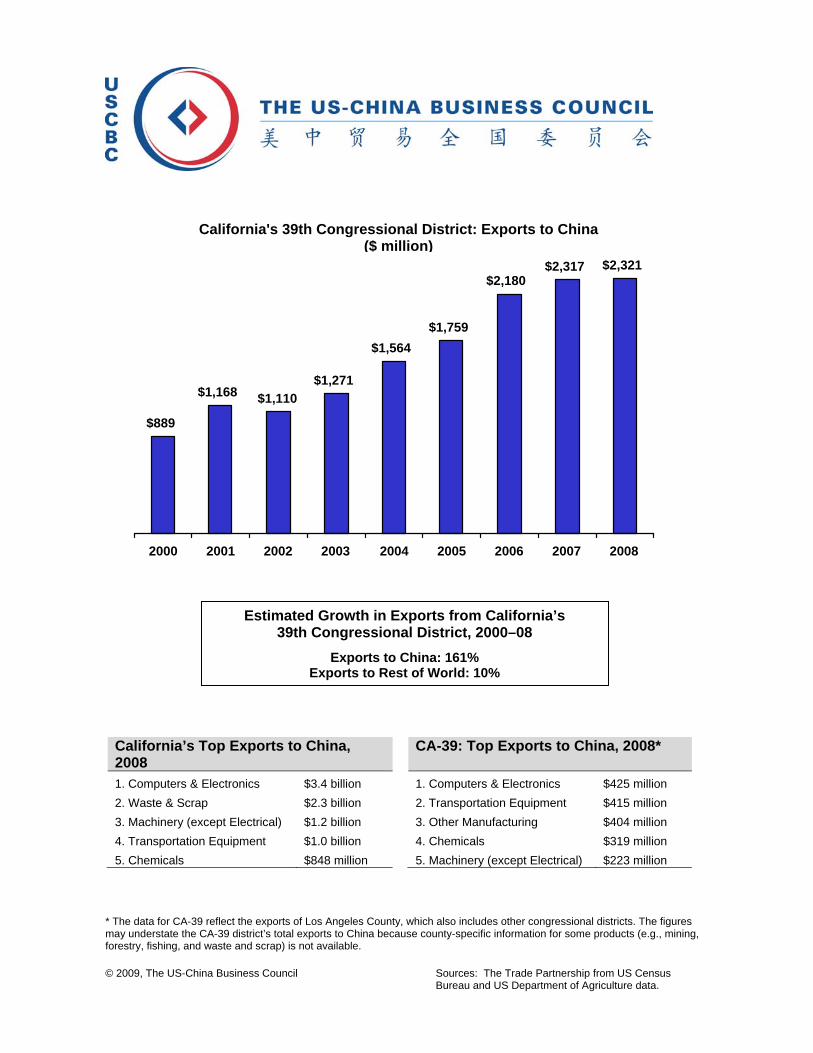
© 2009, The US-China Business Council
Sources: The Trade Partnership from US Census Bureau and US Department of Agriculture data.
California’s Top Exports to China, 2008
CA-39: Top Exports to China, 2008*
1. Computers & Electronics $3.4 billion 1. Computers & Electronics $425 million
2. Waste & Scrap $2.3 billion 2. Transportation Equipment $415 million
3. Machinery (except Electrical) $1.2 billion 3. Other Manufacturing $404 million
4. Transportation Equipment $1.0 billion 4. Chemicals $319 million
5. Chemicals $848 million 5. Machinery (except Electrical) $223 million * The data for CA-39 reflect the exports of Los Angeles County, which also includes other congressional districts. The figures may understate the CA-39 district’s total exports to China because county-specific information for some products (e.g., mining, forestry, fishing, and waste and scrap) is not available.
$889
$1,168 $1,110$1,271
$1,564$1,759
$2,180$2,317 $2,321
2000 2001 2002 2003 2004 2005 2006 2007 2008
Estimated Growth in Exports from California’s 39th Congressional District, 2000–08
Exports to China: 161% Exports to Rest of World: 10%
California's 39th Congressional District: Exports to China ($ million)

© 2009, The US-China Business Council
Sources: The Trade Partnership from US Census Bureau and US Department of Agriculture data.
California’s Top Exports to China, 2008
CA-40: Top Exports to China, 2008*
1. Computers & Electronics $3.4 billion 1. Computers & Electronics $515 million
2. Waste & Scrap $2.3 billion 2. Machinery (except Electrical) $149 million
3. Machinery (except Electrical) $1.2 billion 3. Chemicals $94 million
4. Transportation Equipment $1.0 billion 4. Transportation Equipment $53 million
5. Chemicals $848 million 5. Electrical Equipment $38 million * The data for CA-40 reflect the exports of Orange County, which also includes other congressional districts. The figures may understate the CA-40 district’s total exports to China because county-specific information for some products (e.g., mining, forestry, fishing, and waste and scrap) is not available.
$421
$557 $523 $556
$694$733
$912$1,009 $976
2000 2001 2002 2003 2004 2005 2006 2007 2008
Estimated Growth in Exports from California’s 40th Congressional District, 2000–08
Exports to China: 132% Exports to Rest of World: 10%
California's 40th Congressional District: Exports to China ($ million)

© 2009, The US-China Business Council
Sources: The Trade Partnership from US Census Bureau and US Department of Agriculture data.
California’s Top Exports to China, 2008
CA-41: Top Exports to China, 2008*
1. Computers & Electronics $3.4 billion 1. Other Manufacturing $114 million
2. Waste & Scrap $2.3 billion 2. Transportation Equipment $74 million
3. Machinery (except Electrical) $1.2 billion 3. Primary Metal Manufacturing $74 million
4. Transportation Equipment $1.0 billion 4. Machinery (except Electrical) $73 million
5. Chemicals $848 million 5. Chemicals $47 million * The data for CA-41 reflect the combined exports of Riverside and San Bernardino counties. The figures may understate the CA-41 district’s total exports to China because county-specific information for some products (e.g., mining, forestry, fishing, and waste and scrap) is not available.
$209
$274 $261$304
$376$421
$524$551 $554
2000 2001 2002 2003 2004 2005 2006 2007 2008
Estimated Growth in Exports from California’s 41st Congressional District, 2000–08
Exports to China: 165% Exports to Rest of World: 12%
California's 41st Congressional District: Exports to China ($ million)

© 2009, The US-China Business Council
Sources: The Trade Partnership from US Census Bureau and US Department of Agriculture data.
California’s Top Exports to China, 2008
CA-42: Top Exports to China, 2008*
1. Computers & Electronics $3.4 billion 1. Computers & Electronics $950 million
2. Waste & Scrap $2.3 billion 2. Transportation Equipment $501 million
3. Machinery (except Electrical) $1.2 billion 3. Chemicals $441 million
4. Transportation Equipment $1.0 billion 4. Machinery (except Electrical) $414 million
5. Chemicals $848 million 5. Other Manufacturing $344 million * The data for CA-42 reflect the combined exports of Los Angeles, Orange, and San Bernardino counties. The figures may understate the CA-42 district’s total exports to China because county-specific information for some products (e.g., mining, forestry, fishing, and waste and scrap) is not available.
$1,338
$1,757 $1,669$1,914
$2,355$2,649
$3,283$3,488 $3,495
2000 2001 2002 2003 2004 2005 2006 2007 2008
Estimated Growth in Exports from California’s 42nd Congressional District, 2000–08
Exports to China: 161% Exports to Rest of World: 10%
California's 42nd Congressional District: Exports to China ($ million)
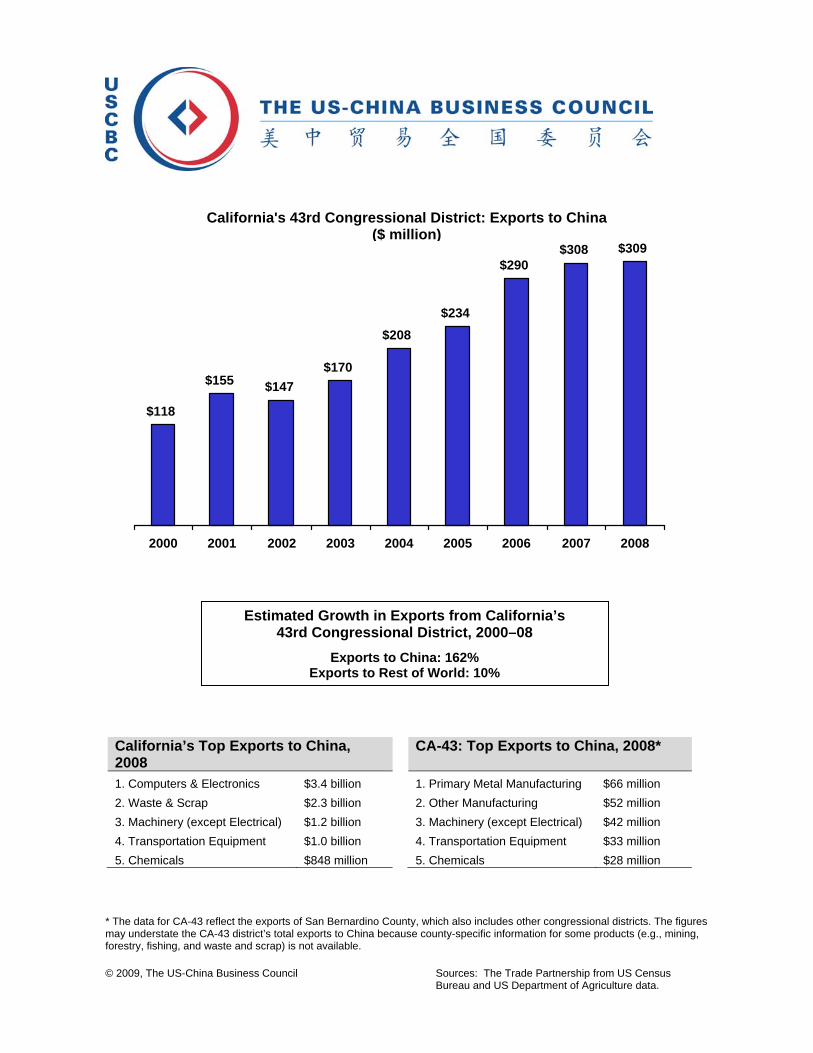
© 2009, The US-China Business Council
Sources: The Trade Partnership from US Census Bureau and US Department of Agriculture data.
California’s Top Exports to China, 2008
CA-43: Top Exports to China, 2008*
1. Computers & Electronics $3.4 billion 1. Primary Metal Manufacturing $66 million
2. Waste & Scrap $2.3 billion 2. Other Manufacturing $52 million
3. Machinery (except Electrical) $1.2 billion 3. Machinery (except Electrical) $42 million
4. Transportation Equipment $1.0 billion 4. Transportation Equipment $33 million
5. Chemicals $848 million 5. Chemicals $28 million * The data for CA-43 reflect the exports of San Bernardino County, which also includes other congressional districts. The figures may understate the CA-43 district’s total exports to China because county-specific information for some products (e.g., mining, forestry, fishing, and waste and scrap) is not available.
$118
$155 $147$170
$208$234
$290$308 $309
2000 2001 2002 2003 2004 2005 2006 2007 2008
Estimated Growth in Exports from California’s 43rd Congressional District, 2000–08
Exports to China: 162% Exports to Rest of World: 10%
California's 43rd Congressional District: Exports to China ($ million)
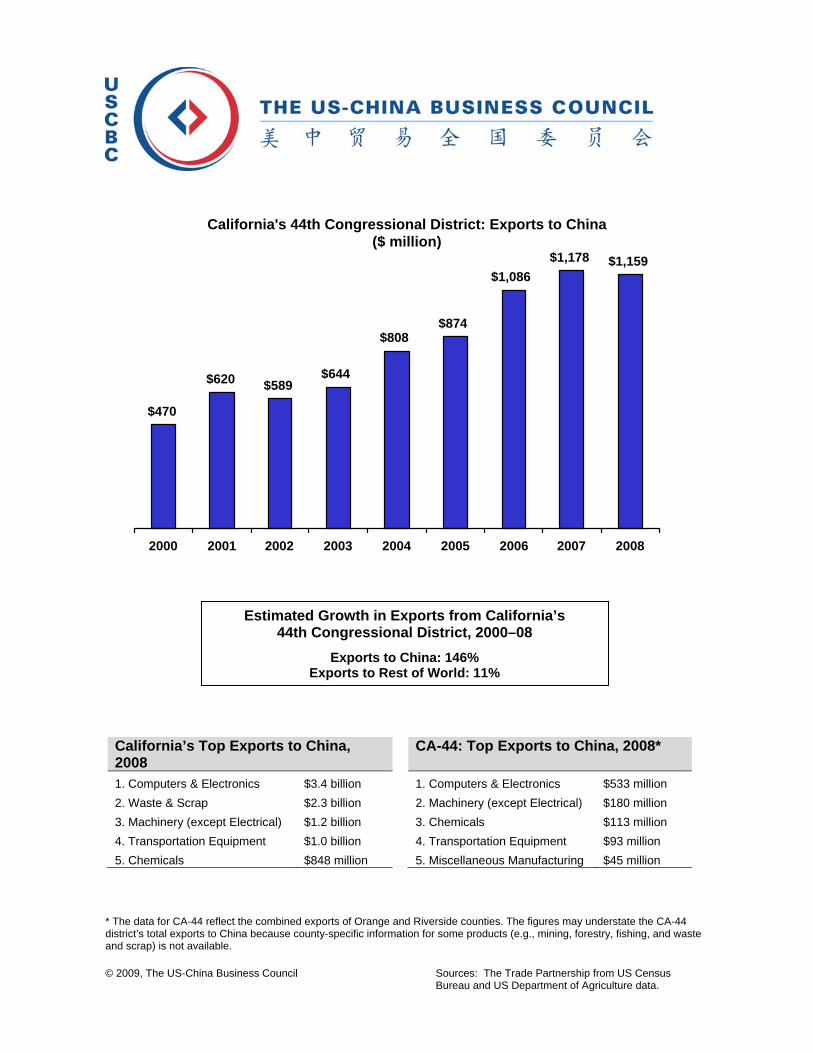
© 2009, The US-China Business Council
Sources: The Trade Partnership from US Census Bureau and US Department of Agriculture data.
California’s Top Exports to China, 2008
CA-44: Top Exports to China, 2008*
1. Computers & Electronics $3.4 billion 1. Computers & Electronics $533 million
2. Waste & Scrap $2.3 billion 2. Machinery (except Electrical) $180 million
3. Machinery (except Electrical) $1.2 billion 3. Chemicals $113 million
4. Transportation Equipment $1.0 billion 4. Transportation Equipment $93 million
5. Chemicals $848 million 5. Miscellaneous Manufacturing $45 million * The data for CA-44 reflect the combined exports of Orange and Riverside counties. The figures may understate the CA-44 district’s total exports to China because county-specific information for some products (e.g., mining, forestry, fishing, and waste and scrap) is not available.
$470
$620 $589$644
$808$874
$1,086$1,178 $1,159
2000 2001 2002 2003 2004 2005 2006 2007 2008
Estimated Growth in Exports from California’s 44th Congressional District, 2000–08
Exports to China: 146% Exports to Rest of World: 11%
California's 44th Congressional District: Exports to China ($ million)

© 2009, The US-China Business Council
Sources: The Trade Partnership from US Census Bureau and US Department of Agriculture data.
California’s Top Exports to China, 2008
CA-45: Top Exports to China, 2008*
1. Computers & Electronics $3.4 billion 1. Other Manufacturing $63 million
2. Waste & Scrap $2.3 billion 2. Transportation Equipment $41 million
3. Machinery (except Electrical) $1.2 billion 3. Machinery (except Electrical) $31 million
4. Transportation Equipment $1.0 billion 4. Chemicals $19 million
5. Chemicals $848 million 5. Computers & Electronics $17 million * The data for CA-45 reflect the exports of Riverside County, which also includes other congressional districts. The figures may understate the CA-45 district’s total exports to China because county-specific information for some products (e.g., mining, forestry, fishing, and waste and scrap) is not available.
Estimated Growth in Exports from California’s 45th Congressional District, 2000–08
Exports to China: 168% Exports to Rest of World: 14%
$91
$119 $114$134
$168$186
$234$243 $245
2000 2001 2002 2003 2004 2005 2006 2007 2008
California's 45th Congressional District: Exports to China ($ million)

© 2009, The US-China Business Council
Sources: The Trade Partnership from US Census Bureau and US Department of Agriculture data.
California’s Top Exports to China, 2008
CA-46: Top Exports to China, 2008*
1. Computers & Electronics $3.4 billion 1. Computers & Electronics $941 million
2. Waste & Scrap $2.3 billion 2. Transportation Equipment $468 million
3. Machinery (except Electrical) $1.2 billion 3. Chemicals $413 million
4. Transportation Equipment $1.0 billion 4. Machinery (except Electrical) $372 million
5. Chemicals $848 million 5. Other Manufacturing $292 million * The data for CA-46 reflect the combined exports of Los Angeles and Orange counties. The figures may understate the CA-46 district’s total exports to China because county-specific information for some products (e.g., mining, forestry, fishing, and waste and scrap) is not available.
$1,220
$1,602 $1,522$1,745
$2,147$2,415
$2,993$3,180 $3,186
2000 2001 2002 2003 2004 2005 2006 2007 2008
Estimated Growth in Exports from California’s 46th Congressional District, 2000–08
Exports to China: 161% Exports to Rest of World: 10%
California's 46th Congressional District: Exports to China ($ million)

© 2009, The US-China Business Council
Sources: The Trade Partnership from US Census Bureau and US Department of Agriculture data.
California’s Top Exports to China, 2008
CA-47: Top Exports to China, 2008*
1. Computers & Electronics $3.4 billion 1. Computers & Electronics $515 million
2. Waste & Scrap $2.3 billion 2. Machinery (except Electrical) $149 million
3. Machinery (except Electrical) $1.2 billion 3. Chemicals $94 million
4. Transportation Equipment $1.0 billion 4. Transportation Equipment $53 million
5. Chemicals $848 million 5. Electrical Equipment $38 million * The data for CA-47 reflect the exports of Orange County, which also includes other congressional districts. The figures may understate the CA-47 district’s total exports to China because county-specific information for some products (e.g., mining, forestry, fishing, and waste and scrap) is not available.
$421
$557 $523 $556
$694$733
$912$1,009 $976
2000 2001 2002 2003 2004 2005 2006 2007 2008
Estimated Growth in Exports from California’s 47th Congressional District, 2000–08
Exports to China: 132% Exports to Rest of World: 10%
California's 47th Congressional District: Exports to China ($ million)

© 2009, The US-China Business Council
Sources: The Trade Partnership from US Census Bureau and US Department of Agriculture data.
California’s Top Exports to China, 2008
CA-48: Top Exports to China, 2008*
1. Computers & Electronics $3.4 billion 1. Computers & Electronics $515 million
2. Waste & Scrap $2.3 billion 2. Machinery (except Electrical) $149 million
3. Machinery (except Electrical) $1.2 billion 3. Chemicals $94 million
4. Transportation Equipment $1.0 billion 4. Transportation Equipment $53 million
5. Chemicals $848 million 5. Electrical Equipment $38 million * The data for CA-48 reflect the exports of Orange County, which also includes other congressional districts. The figures may understate the CA-48 district’s total exports to China because county-specific information for some products (e.g., mining, forestry, fishing, and waste and scrap) is not available.
$421
$557 $523 $556
$694$733
$912$1,009 $976
2000 2001 2002 2003 2004 2005 2006 2007 2008
Estimated Growth in Exports from California’s 48th Congressional District, 2000–08
Exports to China: 132% Exports to Rest of World: 10%
California's 48th Congressional District: Exports to China ($ million)

© 2009, The US-China Business Council
Sources: The Trade Partnership from US Census Bureau and US Department of Agriculture data.
California’s Top Exports to China, 2008
CA-49: Top Exports to China, 2008*
1. Computers & Electronics $3.4 billion 1. Computers & Electronics $334 million
2. Waste & Scrap $2.3 billion 2. Machinery (except Electrical) $197 million
3. Machinery (except Electrical) $1.2 billion 3. Transportation Equipment $126 million
4. Transportation Equipment $1.0 billion 4. Chemicals $82 million
5. Chemicals $848 million 5. Miscellaneous Manufacturing $43 million * The data for CA-49 reflect the combined exports of Riverside and San Diego counties. The figures may understate the CA-49 district’s total exports to China because county-specific information for some products (e.g., mining, forestry, fishing, and waste and scrap) is not available.
$327
$440 $429$481
$616$680
$873$920 $917
2000 2001 2002 2003 2004 2005 2006 2007 2008
Estimated Growth in Exports from California’s 49th Congressional District, 2000–08
Exports to China: 180% Exports to Rest of World: 12%
California's 49th Congressional District: Exports to China ($ million)

© 2009, The US-China Business Council
Sources: The Trade Partnership from US Census Bureau and US Department of Agriculture data.
California’s Top Exports to China, 2008
CA-50: Top Exports to China, 2008*
1. Computers & Electronics $3.4 billion 1. Computers & Electronics $317 million
2. Waste & Scrap $2.3 billion 2. Machinery (except Electrical) $166 million
3. Machinery (except Electrical) $1.2 billion 3. Transportation Equipment $85 million
4. Transportation Equipment $1.0 billion 4. Chemicals $62 million
5. Chemicals $848 million 5. Miscellaneous Manufacturing $27 million
* The data for CA-50 reflect the exports of San Diego County, which also includes other congressional districts. The figures may understate the CA-50 district’s total exports to China because county-specific information for some products (e.g., mining, forestry, fishing, and waste and scrap) is not available.
$278
$378 $363$392
$502$540
$699$750 $734
2000 2001 2002 2003 2004 2005 2006 2007 2008
Estimated Growth in Exports from California’s 50th Congressional District, 2000–08
Exports to China: 164% Exports to Rest of World: 11%
California's 50th Congressional District: Exports to China ($ million)

© 2009, The US-China Business Council
Sources: The Trade Partnership from US Census Bureau and US Department of Agriculture data.
California’s Top Exports to China, 2008
CA-51: Top Exports to China, 2008*
1. Computers & Electronics $3.4 billion 1. Computers & Electronics $317 million
2. Waste & Scrap $2.3 billion 2. Machinery (except Electrical) $166 million
3. Machinery (except Electrical) $1.2 billion 3. Transportation Equipment $85 million
4. Transportation Equipment $1.0 billion 4. Chemicals $62 million
5. Chemicals $848 million 5. Crop Production $29 million * The data for CA-51 reflect the combined exports of Imperial and San Diego counties. The figures may understate the CA-51 district’s total exports to China because county-specific information for some products (e.g., mining, forestry, fishing, and waste and scrap) is not available.
$281
$379 $365$399
$513$550
$715$760 $747
2000 2001 2002 2003 2004 2005 2006 2007 2008
Estimated Growth in Exports from California’s 51st Congressional District, 2000–08
Exports to China: 166% Exports to Rest of World: 12%
California's 51st Congressional District: Exports to China ($ million)

© 2009, The US-China Business Council
Sources: The Trade Partnership from US Census Bureau and US Department of Agriculture data.
California’s Top Exports to China, 2008
CA-52: Top Exports to China, 2008*
1. Computers & Electronics $3.4 billion 1. Computers & Electronics $317 million
2. Waste & Scrap $2.3 billion 2. Machinery (except Electrical) $166 million
3. Machinery (except Electrical) $1.2 billion 3. Transportation Equipment $85 million
4. Transportation Equipment $1.0 billion 4. Chemicals $62 million
5. Chemicals $848 million 5. Miscellaneous Manufacturing $27 million
* The data for CA-52 reflect the exports of San Diego County, which also includes other congressional districts. The figures may understate the CA-52 district’s total exports to China because county-specific information for some products (e.g., mining, forestry, fishing, and waste and scrap) is not available.
$278
$378 $363$392
$502$540
$699$750 $734
2000 2001 2002 2003 2004 2005 2006 2007 2008
Estimated Growth in Exports from California’s 52nd Congressional District, 2000–08
Exports to China: 164% Exports to Rest of World: 11%
California's 52nd Congressional District: Exports to China ($ million)

© 2009, The US-China Business Council
Sources: The Trade Partnership from US Census Bureau and US Department of Agriculture data.
California’s Top Exports to China, 2008
CA-53: Top Exports to China, 2008*
1. Computers & Electronics $3.4 billion 1. Computers & Electronics $317 million
2. Waste & Scrap $2.3 billion 2. Machinery (except Electrical) $166 million
3. Machinery (except Electrical) $1.2 billion 3. Transportation Equipment $85 million
4. Transportation Equipment $1.0 billion 4. Chemicals $62 million
5. Chemicals $848 million 5. Miscellaneous Manufacturing $27 million
* The data for CA-53 reflect the exports of San Diego County, which also includes other congressional districts. The figures may understate the CA-53 district’s total exports to China because county-specific information for some products (e.g., mining, forestry, fishing, and waste and scrap) is not available.
$278
$378 $363$392
$502$540
$699$750 $734
2000 2001 2002 2003 2004 2005 2006 2007 2008
Estimated Growth in Exports from California’s 53rd Congressional District, 2000–08
Exports to China: 164% Exports to Rest of World: 11%
California's 53rd Congressional District: Exports to China ($ million)

© 2009, The US-China Business Council
Sources: The Trade Partnership from US Census Bureau and US Department of Agriculture data.
Colorado’s Top Exports to China, 2008 CO-1: Top Exports to China, 2008* 1. Computers & Electronics $152 million 1. Other Manufacturing $107 million
2. Primary Metal Manufacturing $89 million 2. Computers & Electronics $26 million
3. Processed Foods $72 million 3. Machinery (except Electrical) $21 million
4. Waste & Scrap $58 million 4. Processed Foods $19 million
5. Machinery (except Electrical) $50 million 5. Fabricated Metal Products $8 million * The data for CO-1 reflect the combined exports of Adams, Arapahoe, Denver, and Jefferson counties. The figures may understate the CO-1 district’s total exports to China because county-specific information for some products (e.g., mining, forestry, fishing, and waste and scrap) is not available.
$68 $67 $61
$85
$146 $141
$228
$180$190
2000 2001 2002 2003 2004 2005 2006 2007 2008
Estimated Growth in Exports from Colorado’s 1st Congressional District, 2000–08
Exports to China: 180% Exports to Rest of World: 4%
Colorado's 1st Congressional District: Exports to China ($ million)

© 2009, The US-China Business Council
Sources: The Trade Partnership from US Census Bureau and US Department of Agriculture data.
Colorado’s Top Exports to China, 2008 CO-2: Top Exports to China, 2008* 1. Computers & Electronics $152 million 1. Other Manufacturing $95 million
2. Primary Metal Manufacturing $89 million 2. Computers & Electronics $74 million
3. Processed Foods $72 million 3. Processed Foods $27 million
4. Waste & Scrap $58 million 4. Machinery (except Electrical) $17 million
5. Machinery (except Electrical) $50 million 5. Chemicals $6 million * The data for CO-2 reflect the combined exports of Adams, Boulder, Broomfield, Clear Creek, Eagle, Gilpin, Grand, Jefferson, Summit, and Weld counties. The figures may understate the CO-2 district’s total exports to China because county-specific information for some products (e.g., mining, forestry, fishing, and waste and scrap) is not available.
$82 $80 $73
$102
$175 $170
$274
$216$228
2000 2001 2002 2003 2004 2005 2006 2007 2008
Estimated Growth in Exports from Colorado’s 2nd Congressional District, 2000–08
Exports to China: 180% Exports to Rest of World: 4%
Colorado's 2nd Congressional District: Exports to China ($ million)

© 2009, The US-China Business Council
Sources: The Trade Partnership from US Census Bureau and US Department of Agriculture data.
Colorado’s Top Exports to China, 2008 CO-3: Top Exports to China, 2008* 1. Computers & Electronics $152 million 1. Other Manufacturing $21 million
2. Primary Metal Manufacturing $89 million 2. Processed Foods $2 million
3. Processed Foods $72 million 3. Fabricated Metal Products $417,000
4. Waste & Scrap $58 million 4. Crop Production $23,000
5. Machinery (except Electrical) $50 million * The data for CO-3 reflect the combined exports of Alamosa, Archuleta, Conejos, Costilla, Custer, Delta, Dolores, Garfield, Gunnison, Hinsdale, Huerfano, Jackson, La Plata, Las Animas, Mesa, Mineral, Moffat, Montezuma, Montrose, Otero, Ouray, Pitkin, Pueblo, Rio Blanco, Rio Grande, Routt, Saguache, San Juan, and San Miguel counties. The figures may understate the CO-3 district’s total exports to China because county-specific information for some products (e.g., mining, forestry, fishing, and waste and scrap) is not available.
$8 $8$7
$10
$18$17
$28
$22$23
2000 2001 2002 2003 2004 2005 2006 2007 2008
Estimated Growth in Exports from Colorado’s 3rd Congressional District, 2000–08
Exports to China: 176% Exports to Rest of World: 5%
Colorado's 3rd Congressional District: Exports to China ($ million)

© 2009, The US-China Business Council
Sources: The Trade Partnership from US Census Bureau and US Department of Agriculture data.
Colorado’s Top Exports to China, 2008 CO-4: Top Exports to China, 2008* 1. Computers & Electronics $152 million 1. Computers & Electronics $60 million
2. Primary Metal Manufacturing $89 million 2. Processed Foods $23 million
3. Processed Foods $72 million 3. Other Manufacturing $21 million
4. Waste & Scrap $58 million 4. Machinery (except Electrical) $17 million
5. Machinery (except Electrical) $50 million 5. Chemicals $6 million * The data for CO-4 reflect the combined exports of Baca, Bent, Boulder, Cheyenne, Crowley, Kiowa, Kit Carson, Larimer, Lincoln, Logan, Morgan, Otero, Phillips, Prowers, Sedgwick, Washington, Weld, and Yuma counties. The figures may understate the CO-4 district’s total exports to China because county-specific information for some products (e.g., mining, forestry, fishing, and waste and scrap) is not available.
$47 $46 $42
$58
$100 $97
$156
$124$131
2000 2001 2002 2003 2004 2005 2006 2007 2008
Estimated Growth in Exports from Colorado’s 4th Congressional District, 2000–08
Exports to China: 179% Exports to Rest of World: 4%
Colorado's 4th Congressional District: Exports to China ($ million)

© 2009, The US-China Business Council
Sources: The Trade Partnership from US Census Bureau and US Department of Agriculture data.
Colorado’s Top Exports to China, 2008 CO-5: Top Exports to China, 2008* 1. Computers & Electronics $152 million 1. Other Manufacturing $48 million
2. Primary Metal Manufacturing $89 million 2. Fabricated Metal Products $3 million
3. Processed Foods $72 million 3. Transportation Equipment $43,000
4. Waste & Scrap $58 million 4. Crop Production $1,000
5. Machinery (except Electrical) $50 million * The data for CO-5 reflect the combined exports of Chaffee, El Paso, Fremont, Lake, Park, and Teller counties. The figures may understate the CO-5 district’s total exports to China because county-specific information for some products (e.g., mining, forestry, fishing, and waste and scrap) is not available.
$18 $18 $16
$23
$39 $38
$61
$48$51
2000 2001 2002 2003 2004 2005 2006 2007 2008
Estimated Growth in Exports from Colorado’s 5th Congressional District, 2000–08
Exports to China: 180% Exports to Rest of World: 4%
Colorado's 5th Congressional District: Exports to China ($ million)

© 2009, The US-China Business Council
Sources: The Trade Partnership from US Census Bureau and US Department of Agriculture data.
Colorado’s Top Exports to China, 2008 CO-6: Top Exports to China, 2008* 1. Computers & Electronics $152 million 1. Other Manufacturing $66 million
2. Primary Metal Manufacturing $89 million 2. Computers & Electronics $14 million
3. Processed Foods $72 million 3. Machinery (except Electrical) $13 million
4. Waste & Scrap $58 million 4. Fabricated Metal Products $4 million
5. Machinery (except Electrical) $50 million 5. Miscellaneous Manufacturing $924,000 * The data for CO-6 reflect the combined exports of Arapahoe, Douglas, Elbert, Jefferson, and Park counties. The figures may understate the CO-6 district’s total exports to China because county-specific information for some products (e.g., mining, forestry, fishing, and waste and scrap) is not available.
$35 $35 $32
$44
$76 $74
$119
$94$99
2000 2001 2002 2003 2004 2005 2006 2007 2008
Estimated Growth in Exports from Colorado’s 6th Congressional District, 2000–08
Exports to China: 180% Exports to Rest of World: 4%
Colorado's 6th Congressional District: Exports to China ($ million)

© 2009, The US-China Business Council
Sources: The Trade Partnership from US Census Bureau and US Department of Agriculture data.
Colorado’s Top Exports to China, 2008 CO-7: Top Exports to China, 2008* 1. Computers & Electronics $152 million 1. Other Manufacturing $81 million
2. Primary Metal Manufacturing $89 million 2. Computers & Electronics $26 million
3. Processed Foods $72 million 3. Machinery (except Electrical) $15 million
4. Waste & Scrap $58 million 4. Fabricated Metal Products $6 million
5. Machinery (except Electrical) $50 million 5. Processed Foods $4 million * The data for CO-7 reflect the combined exports of Adams, Arapahoe, and Jefferson counties. The figures may understate the CO-7 district’s total exports to China because county-specific information for some products (e.g., mining, forestry, fishing, and waste and scrap) is not available.
$49 $48 $44
$61
$104 $101
$163
$129$136
2000 2001 2002 2003 2004 2005 2006 2007 2008
Estimated Growth in Exports from Colorado’s 7th Congressional District, 2000–08
Exports to China: 180% Exports to Rest of World: 4%
Colorado's 7th Congressional District: Exports to China ($ million)

© 2009, The US-China Business Council
Sources: The Trade Partnership from US Census Bureau and US Department of Agriculture data.
Connecticut’s Top Exports to China, 2008
CT-1: Top Exports to China, 2008*
1. Chemicals $151 million 1. Other Manufacturing $111 million
2. Transportation Equipment $145 million 2. Crop Production $41 million
3. Crop Production $85 million 3. Machinery (except Electrical) $25 million
4. Machinery (except Electrical) $71 million 4. Fabricated Metal Products $16 million
5. Computers & Electronics $52 million 5. Chemicals $14 million
* The data for CT-1 reflect the combined exports of Hartford, Litchfield, and Middlesex counties. The figures may understate the CT-1 district’s total exports to China because county-specific information for some products (e.g., mining, forestry, fishing, and waste and scrap) is not available.
$27$41 $37
$52$66
$115$130
$192
$242
2000 2001 2002 2003 2004 2005 2006 2007 2008
Estimated Growth in Exports from Connecticut’s 1st Congressional District, 2000–08
Exports to China: 799% Exports to Rest of World: 82%
Connecticut's 1st Congressional District: Exports to China ($ million)

© 2009, The US-China Business Council
Sources: The Trade Partnership from US Census Bureau and US Department of Agriculture data.
Connecticut’s Top Exports to China, 2008
CT-2: Top Exports to China, 2008*
1. Chemicals $151 million 1. Other Manufacturing $157 million
2. Transportation Equipment $145 million 2. Crop Production $75 million
3. Crop Production $85 million 3. Chemicals $60 million
4. Machinery (except Electrical) $71 million 4. Machinery (except Electrical) $33 million
5. Computers & Electronics $52 million 5. Computers & Electronics $26 million * The data for CT-2 reflect the combined exports of Hartford, Middlesex, New Haven, New London, Tolland, and Windham counties. The figures may understate the CT-2 district’s total exports to China because county-specific information for some products (e.g., mining, forestry, fishing, and waste and scrap) is not available.
$48$72 $64
$91$116
$201$226
$336
$427
2000 2001 2002 2003 2004 2005 2006 2007 2008
Estimated Growth in Exports from Connecticut’s 2nd Congressional District, 2000–08
Exports to China: 790% Exports to Rest of World: 82%
Connecticut's 2nd Congressional District: Exports to China ($ million)

© 2009, The US-China Business Council
Sources: The Trade Partnership from US Census Bureau and US Department of Agriculture data.
Connecticut’s Top Exports to China, 2008
CT-3: Top Exports to China, 2008*
1. Chemicals $151 million 1. Chemicals $130 million
2. Transportation Equipment $145 million 2. Other Manufacturing $50 million
3. Crop Production $85 million 3. Machinery (except Electrical) $45 million
4. Machinery (except Electrical) $71 million 4. Computers & Electronics $41 million
5. Computers & Electronics $52 million 5. Crop Production $30 million * The data for CT-3 reflect the combined exports of Fairfield, Middlesex, and New Haven counties. The figures may understate the CT-3 district’s total exports to China because county-specific information for some products (e.g., mining, forestry, fishing, and waste and scrap) is not available.
$42$64 $59
$84$106
$184$207
$308
$352
2000 2001 2002 2003 2004 2005 2006 2007 2008
Estimated Growth in Exports from Connecticut’s 3rd Congressional District, 2000–08
Exports to China: 737% Exports to Rest of World: 80%
Connecticut's 3rd Congressional District: Exports to China ($ million)

© 2009, The US-China Business Council
Sources: The Trade Partnership from US Census Bureau and US Department of Agriculture data.
Connecticut’s Top Exports to China, 2008
CT-4: Top Exports to China, 2008*
1. Chemicals $151 million 1. Chemicals $124 million
2. Transportation Equipment $145 million 2. Machinery (except Electrical) $42 million
3. Crop Production $85 million 3. Computers & Electronics $39 million
4. Machinery (except Electrical) $71 million 4. Other Manufacturing $35 million
5. Computers & Electronics $52 million 5. Crop Production $19 million * The data for CT-4 reflect the combined exports of Fairfield and New Haven counties. The figures may understate the CT-4 district’s total exports to China because county-specific information for some products (e.g., mining, forestry, fishing, and waste and scrap) is not available.
$38$58 $53
$76$96
$166$188
$279
$311
2000 2001 2002 2003 2004 2005 2006 2007 2008
Estimated Growth in Exports from Connecticut’s 4th Congressional District, 2000–08
Exports to China: 716% Exports to Rest of World: 79%
Connecticut's 4th Congressional District: Exports to China ($ million)

© 2009, The US-China Business Council
Sources: The Trade Partnership from US Census Bureau and US Department of Agriculture data.
Connecticut’s Top Exports to China, 2008
CT-5: Top Exports to China, 2008*
1. Chemicals $151 million 1. Chemicals $132 million
2. Transportation Equipment $145 million 2. Other Manufacturing $130 million
3. Crop Production $85 million 3. Machinery (except Electrical) $63 million
4. Machinery (except Electrical) $71 million 4. Crop Production $49 million
5. Computers & Electronics $52 million 5. Computers & Electronics $46 million * The data for CT-5 reflect the combined exports of Fairfield, Hartford, Litchfield, and New Haven counties. The figures may understate the CT-5 district’s total exports to China because county-specific information for some products (e.g., mining, forestry, fishing, and waste and scrap) is not available.
$61$93 $84
$120$152
$264$298
$442
$511
2000 2001 2002 2003 2004 2005 2006 2007 2008
Estimated Growth in Exports from Connecticut’s 5th Congressional District, 2000–08
Exports to China: 738% Exports to Rest of World: 80%
Connecticut's 5th Congressional District: Exports to China ($ million)
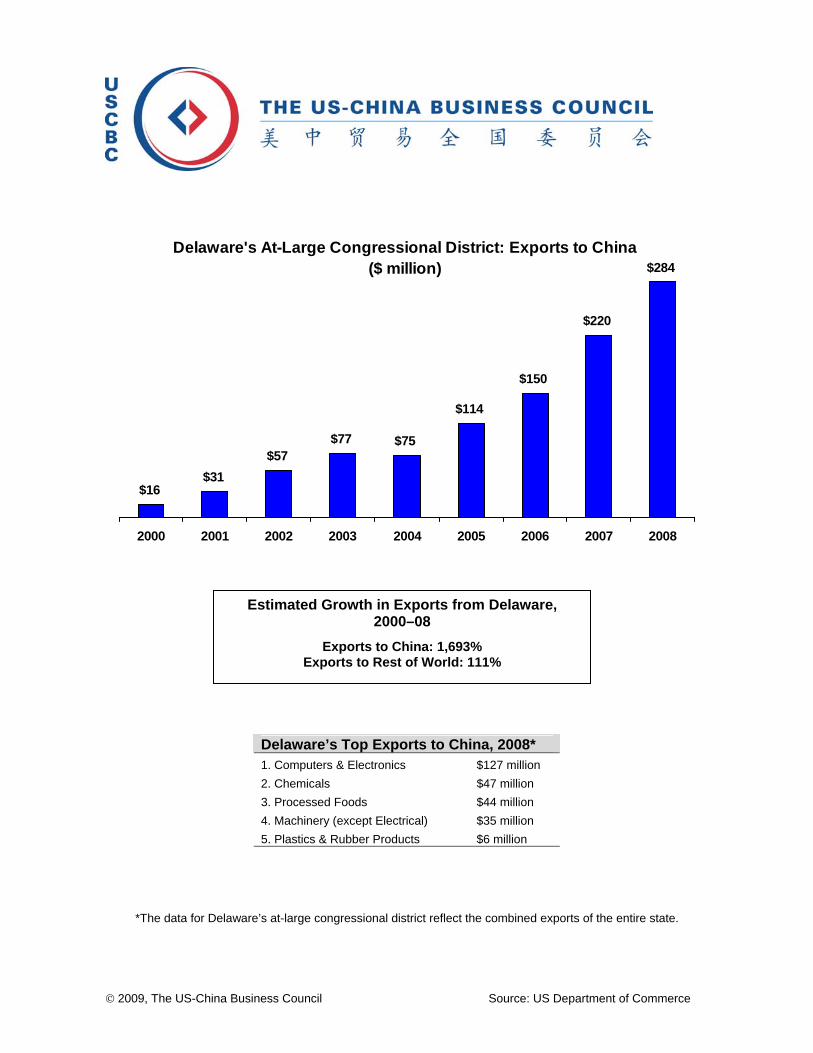
© 2009, The US-China Business Council Source: US Department of Commerce
Delaware’s Top Exports to China, 2008* 1. Computers & Electronics $127 million
2. Chemicals $47 million
3. Processed Foods $44 million
4. Machinery (except Electrical) $35 million
5. Plastics & Rubber Products $6 million
*The data for Delaware’s at-large congressional district reflect the combined exports of the entire state.
Delaware's At-Large Congressional District: Exports to China ($ million)
$16
$57$77 $75
$114
$150
$220
$284
$31
2000 2001 2002 2003 2004 2005 2006 2007 2008
Estimated Growth in Exports from Delaware, 2000–08
Exports to China: 1,693% Exports to Rest of World: 111%

© 2009, The US-China Business Council
Sources: The Trade Partnership from US Census Bureau and US Department of Agriculture data.
Florida’s Top Exports to China, 2008 FL-1: Top Exports to China, 2008* 1. Waste & Scrap $246 million 1. Other Manufacturing $18 million
2. Chemicals $156 million 2. Transportation Equipment $1 million
3. Computers & Electronics $151 million 3. Computers & Electronics $1 million
4. Transportation Equipment $101 million 4. Nonmetallic Mineral Products $50,000
5. Machinery (except Electrical) $57 million 5. Crop Production $6,000 * The data for FL-1 reflect the combined exports of Escambia, Holmes, Okaloosa, Santa Rosa, Walton, and Washington counties. The figures may understate the FL-1 district’s total exports to China because county-specific information for some products (e.g., mining, forestry, fishing, and waste and scrap) is not available.
$18$16
$22
$19
$15
$18
$24
$19$20
2000 2001 2002 2003 2004 2005 2006 2007 2008
Estimated Growth in Exports from Florida’s 1st Congressional District, 2000–08
Exports to China: 14% Exports to Rest of World: 99%
Florida's 1st Congressional District: Exports to China ($ million)

© 2009, The US-China Business Council
Sources: The Trade Partnership from US Census Bureau and US Department of Agriculture data.
Florida’s Top Exports to China, 2008 FL-2: Top Exports to China, 2008* 1. Waste & Scrap $246 million 1. Other Manufacturing $15 million
2. Chemicals $156 million 2. Transportation Equipment $4 million
3. Computers & Electronics $151 million 3. Computers & Electronics $1 million
4. Transportation Equipment $101 million 4. Fabricated Metal Products $577,000
5. Machinery (except Electrical) $57 million 5. Crop Production $24,000 * The data for FL-2 reflect the combined exports of Bay, Calhoun, Dixie, Franklin, Gadsden, Gulf, Jackson, Jefferson, Lafayette, Leon, Liberty, Okaloosa, Suwannee, Taylor, Wakulla, and Walton counties. The figures may understate the FL-2 district’s total exports to China because county-specific information for some products (e.g., mining, forestry, fishing, and waste and scrap) is not available. Figures are rounded.
$18$16
$23
$19
$15
$19
$24
$19$20
2000 2001 2002 2003 2004 2005 2006 2007 2008
Estimated Growth in Exports from Florida’s 2nd Congressional District, 2000–08
Exports to China: 14% Exports to Rest of World: 98%
Florida's 2nd Congressional District: Exports to China ($ million)

© 2009, The US-China Business Council
Sources: The Trade Partnership from US Census Bureau and US Department of Agriculture data.
Florida’s Top Exports to China, 2008 FL-3: Top Exports to China, 2008* 1. Waste & Scrap $246 million 1. Other Manufacturing $63 million
2. Chemicals $156 million 2. Computers & Electronics $38 million
3. Computers & Electronics $151 million 3. Machinery (except Electrical) $20 million
4. Transportation Equipment $101 million 4. Transportation Equipment $14 million
5. Machinery (except Electrical) $57 million 5. Chemicals $8 million * The data for FL-3 reflect the combined exports of Alachua, Clay, Duval, Lake, Marion, Orange, Putnam, Seminole, and Volusia counties. The figures may understate the FL-3 district’s total exports to China because county-specific information for some products (e.g., mining, forestry, fishing, and waste and scrap) is not available.
$145
$128
$186
$158
$122
$152
$198
$158 $165
2000 2001 2002 2003 2004 2005 2006 2007 2008
Estimated Growth in Exports from Florida’s 3rd Congressional District, 2000–08
Exports to China: 14% Exports to Rest of World: 99%
Florida's 3rd Congressional District: Exports to China ($ million)

© 2009, The US-China Business Council
Sources: The Trade Partnership from US Census Bureau and US Department of Agriculture data.
Florida’s Top Exports to China, 2008 FL-4: Top Exports to China, 2008* 1. Waste & Scrap $246 million 1. Other Manufacturing $53 million
2. Chemicals $156 million 2. Processed Foods $3 million
3. Computers & Electronics $151 million 3. Miscellaneous Manufacturing $3 million
4. Transportation Equipment $101 million 4. Fabricated Metal Products $2 million
5. Machinery (except Electrical) $57 million 5. Machinery (except Electrical) $2 million * The data for FL-4 reflect the combined exports of Baker, Columbia, Duval, Hamilton, Jefferson, Leon, Madison, Nassau, and Union counties. The figures may understate the FL-4 district’s total exports to China because county-specific information for some products (e.g., mining, forestry, fishing, and waste and scrap) is not available.
$56$50
$72
$61
$47
$59
$76
$61$64
2000 2001 2002 2003 2004 2005 2006 2007 2008
Estimated Growth in Exports from Florida’s 4th Congressional District, 2000–08
Exports to China: 14% Exports to Rest of World: 99%
Florida's 4th Congressional District: Exports to China ($ million)
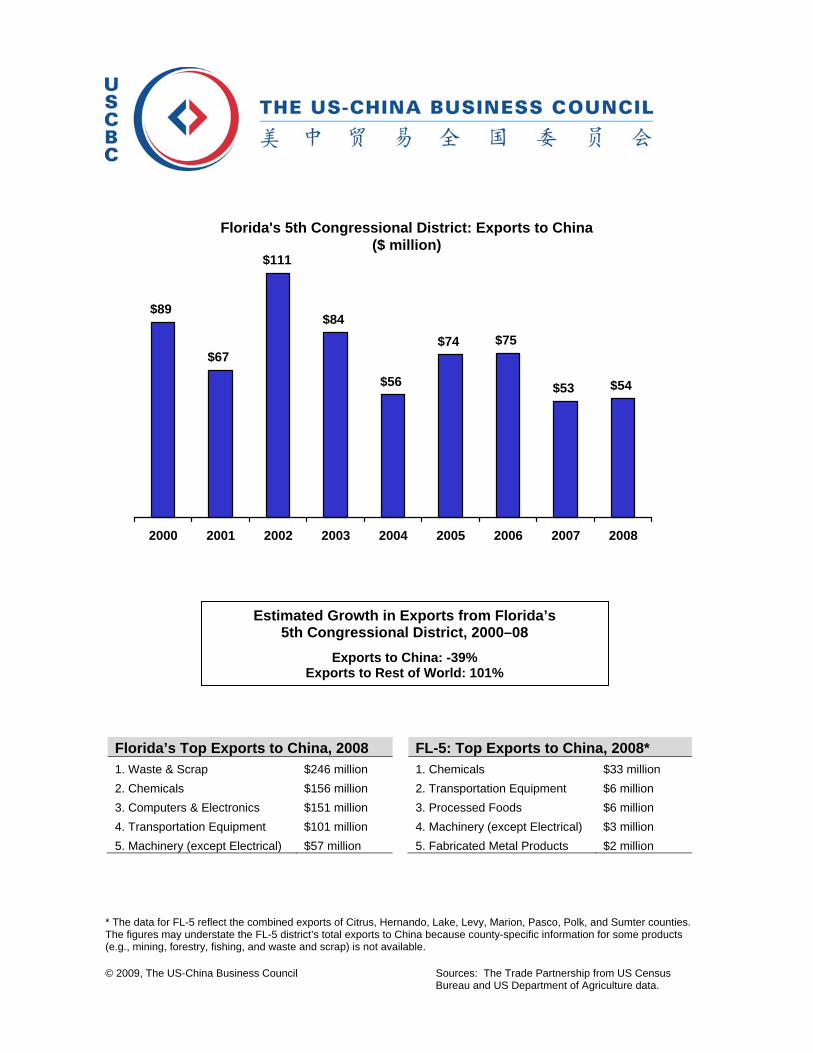
© 2009, The US-China Business Council
Sources: The Trade Partnership from US Census Bureau and US Department of Agriculture data.
Florida’s Top Exports to China, 2008 FL-5: Top Exports to China, 2008* 1. Waste & Scrap $246 million 1. Chemicals $33 million
2. Chemicals $156 million 2. Transportation Equipment $6 million
3. Computers & Electronics $151 million 3. Processed Foods $6 million
4. Transportation Equipment $101 million 4. Machinery (except Electrical) $3 million
5. Machinery (except Electrical) $57 million 5. Fabricated Metal Products $2 million * The data for FL-5 reflect the combined exports of Citrus, Hernando, Lake, Levy, Marion, Pasco, Polk, and Sumter counties. The figures may understate the FL-5 district’s total exports to China because county-specific information for some products (e.g., mining, forestry, fishing, and waste and scrap) is not available.
$89
$67
$111
$84
$56
$74 $75
$53 $54
2000 2001 2002 2003 2004 2005 2006 2007 2008
Estimated Growth in Exports from Florida’s 5th Congressional District, 2000–08
Exports to China: -39% Exports to Rest of World: 101%
Florida's 5th Congressional District: Exports to China ($ million)

© 2009, The US-China Business Council
Sources: The Trade Partnership from US Census Bureau and US Department of Agriculture data.
Florida’s Top Exports to China, 2008 FL-6: Top Exports to China, 2008* 1. Waste & Scrap $246 million 1. Other Manufacturing $59 million
2. Chemicals $156 million 2. Transportation Equipment $4 million
3. Computers & Electronics $151 million 3. Fabricated Metal Products $3 million
4. Transportation Equipment $101 million 4. Miscellaneous Manufacturing $3 million
5. Machinery (except Electrical) $57 million 5. Processed Foods $3 million * The data for FL-6 reflect the combined exports of Alachua, Bradford, Clay, Duval, Gilchrist, Lake, Levy, and Marion counties. The figures may understate the FL-6 district’s total exports to China because county-specific information for some products (e.g., mining, forestry, fishing, and waste and scrap) is not available.
$68$60
$87
$74
$57
$71
$93
$74$77
2000 2001 2002 2003 2004 2005 2006 2007 2008
Estimated Growth in Exports from Florida’s 6th Congressional District, 2000–08
Exports to China: 14% Exports to Rest of World: 99%
Florida's 6th Congressional District: Exports to China ($ million)

© 2009, The US-China Business Council
Sources: The Trade Partnership from US Census Bureau and US Department of Agriculture data.
Florida’s Top Exports to China, 2008 FL-7: Top Exports to China, 2008* 1. Waste & Scrap $246 million 1. Computers & Electronics $38 million
2. Chemicals $156 million 2. Machinery (except Electrical) $17 million
3. Computers & Electronics $151 million 3. Transportation Equipment $10 million
4. Transportation Equipment $101 million 4. Other Manufacturing $9 million
5. Machinery (except Electrical) $57 million 5. Chemicals $8 million * The data for FL-7 reflect the combined exports of Flagler, Orange, Putnam, Seminole, St. Johns, and Volusia counties. The figures may understate the FL-7 district’s total exports to China because county-specific information for some products (e.g., mining, forestry, fishing, and waste and scrap) is not available.
$82$73
$105
$90
$69
$86
$112
$89$93
2000 2001 2002 2003 2004 2005 2006 2007 2008
Estimated Growth in Exports from Florida’s 7th Congressional District, 2000–08
Exports to China: 14% Exports to Rest of World: 99%
Florida's 7th Congressional District: Exports to China ($ million)

© 2009, The US-China Business Council
Sources: The Trade Partnership from US Census Bureau and US Department of Agriculture data.
Florida’s Top Exports to China, 2008 FL-8: Top Exports to China, 2008* 1. Waste & Scrap $246 million 1. Computers & Electronics $24 million
2. Chemicals $156 million 2. Machinery (except Electrical) $17 million
3. Computers & Electronics $151 million 3. Transportation Equipment $11 million
4. Transportation Equipment $101 million 4. Chemicals $8 million
5. Machinery (except Electrical) $57 million 5. Other Manufacturing $5 million * The data for FL-8 reflect the combined exports of Lake, Marion, Orange, and Osceola counties. The figures may understate the FL-8 district’s total exports to China because county-specific information for some products (e.g., mining, forestry, fishing, and waste and scrap) is not available.
$65$58
$84
$71
$55
$69
$89
$71 $74
2000 2001 2002 2003 2004 2005 2006 2007 2008
Estimated Growth in Exports from Florida’s 8th Congressional District, 2000–08
Exports to China: 9% Exports to Rest of World: 65%
Florida's 8th Congressional District: Exports to China ($ million)

© 2009, The US-China Business Council
Sources: The Trade Partnership from US Census Bureau and US Department of Agriculture data.
Florida’s Top Exports to China, 2008 FL-9: Top Exports to China, 2008* 1. Waste & Scrap $246 million 1. Computers & Electronics $36 million
2. Chemicals $156 million 2. Chemicals $26 million
3. Computers & Electronics $151 million 3. Other Manufacturing $12 million
4. Transportation Equipment $101 million 4. Transportation Equipment $8 million
5. Machinery (except Electrical) $57 million 5. Machinery (except Electrical) $7 million * The data for FL-9 reflect the combined exports of Hillsborough, Pasco, and Pinellas counties. The figures may understate the FL-9 district’s total exports to China because county-specific information for some products (e.g., mining, forestry, fishing, and waste and scrap) is not available.
$98$87
$126
$108
$83
$103
$134
$107$112
2000 2001 2002 2003 2004 2005 2006 2007 2008
Estimated Growth in Exports from Florida’s 9th Congressional District, 2000–08
Exports to China: 14% Exports to Rest of World: 99%
Florida's 9th Congressional District: Exports to China ($ million)

© 2009, The US-China Business Council
Sources: The Trade Partnership from US Census Bureau and US Department of Agriculture data.
Florida’s Top Exports to China, 2008 FL-10: Top Exports to China, 2008* 1. Waste & Scrap $246 million 1. Computers & Electronics $31 million
2. Chemicals $156 million 2. Chemicals $11 million
3. Computers & Electronics $151 million 3. Transportation Equipment $5 million
4. Transportation Equipment $101 million 4. Machinery (except Electrical) $5 million
5. Machinery (except Electrical) $57 million 5. Miscellaneous Manufacturing $3 million * The data for FL-10 reflect the exports of Pinellas County, which also includes other congressional districts. The figures may understate the FL-10 district’s total exports to China because county-specific information for some products (e.g., mining, forestry, fishing, and waste and scrap) is not available.
$47 $47
$62$56
$45
$53
$73
$63$60
2000 2001 2002 2003 2004 2005 2006 2007 2008
Estimated Growth in Exports from Florida’s 10th Congressional District, 2000–08
Exports to China: 27% Exports to Rest of World: 99%
Florida's 10th Congressional District: Exports to China ($ million)

© 2009, The US-China Business Council
Sources: The Trade Partnership from US Census Bureau and US Department of Agriculture data.
Florida’s Top Exports to China, 2008 FL-11: Top Exports to China, 2008* 1. Waste & Scrap $246 million 1. Computers & Electronics $38 million
2. Chemicals $156 million 2. Chemicals $26 million
3. Computers & Electronics $151 million 3. Other Manufacturing $18 million
4. Transportation Equipment $101 million 4. Transportation Equipment $14 million
5. Machinery (except Electrical) $57 million 5. Machinery (except Electrical) $9 million * The data for FL-11 reflect the combined exports of Hillsborough, Manatee, and Pinellas counties. The figures may understate the FL-11 district’s total exports to China because county-specific information for some products (e.g., mining, forestry, fishing, and waste and scrap) is not available.
$112$99
$144
$122
$94
$118
$153
$122 $127
2000 2001 2002 2003 2004 2005 2006 2007 2008
Estimated Growth in Exports from Florida’s 11th Congressional District, 2000–08
Exports to China: 14% Exports to Rest of World: 99%
Florida's 11th Congressional District: Exports to China ($ million)

© 2009, The US-China Business Council
Sources: The Trade Partnership from US Census Bureau and US Department of Agriculture data.
Florida’s Top Exports to China, 2008 FL-12: Top Exports to China, 2008* 1. Waste & Scrap $246 million 1. Chemicals $49 million
2. Chemicals $156 million 2. Processed Foods $10 million
3. Computers & Electronics $151 million 3. Other Manufacturing $9 million
4. Transportation Equipment $101 million 4. Computers & Electronics $5 million
5. Machinery (except Electrical) $57 million 5. Transportation Equipment $5 million * The data for FL-12 reflect the combined exports of Hillsborough, Osceola, and Polk counties. The figures may understate the FL-12 district’s total exports to China because county-specific information for some products (e.g., mining, forestry, fishing, and waste and scrap) is not available.
$83
$73
$106
$90
$70
$87
$113
$90$94
2000 2001 2002 2003 2004 2005 2006 2007 2008
Estimated Growth in Exports from Florida’s 12th Congressional District, 2000–08
Exports to China: 14% Exports to Rest of World: 98%
Florida's 12th Congressional District: Exports to China ($ million)

© 2009, The US-China Business Council
Sources: The Trade Partnership from US Census Bureau and US Department of Agriculture data.
Florida’s Top Exports to China, 2008 FL-13: Top Exports to China, 2008* 1. Waste & Scrap $246 million 1. Other Manufacturing $14 million
2. Chemicals $156 million 2. Transportation Equipment $6 million
3. Computers & Electronics $151 million 3. Computers & Electronics $3 million
4. Transportation Equipment $101 million 4. Machinery (except Electrical) $3 million
5. Machinery (except Electrical) $57 million 5. Fabricated Metal Products $1 million * The data for FL-13 reflect the combined exports of Charlotte, DeSoto, Hardee, Manatee, and Sarasota counties. The figures may understate the FL-13 district’s total exports to China because county-specific information for some products (e.g., mining, forestry, fishing, and waste and scrap) is not available.
$25$22
$32
$27
$21
$26
$34
$27 $28
2000 2001 2002 2003 2004 2005 2006 2007 2008
Estimated Growth in Exports from Florida’s 13th Congressional District, 2000–08
Exports to China: 14% Exports to Rest of World: 97%
Florida's 13th Congressional District: Exports to China ($ million)
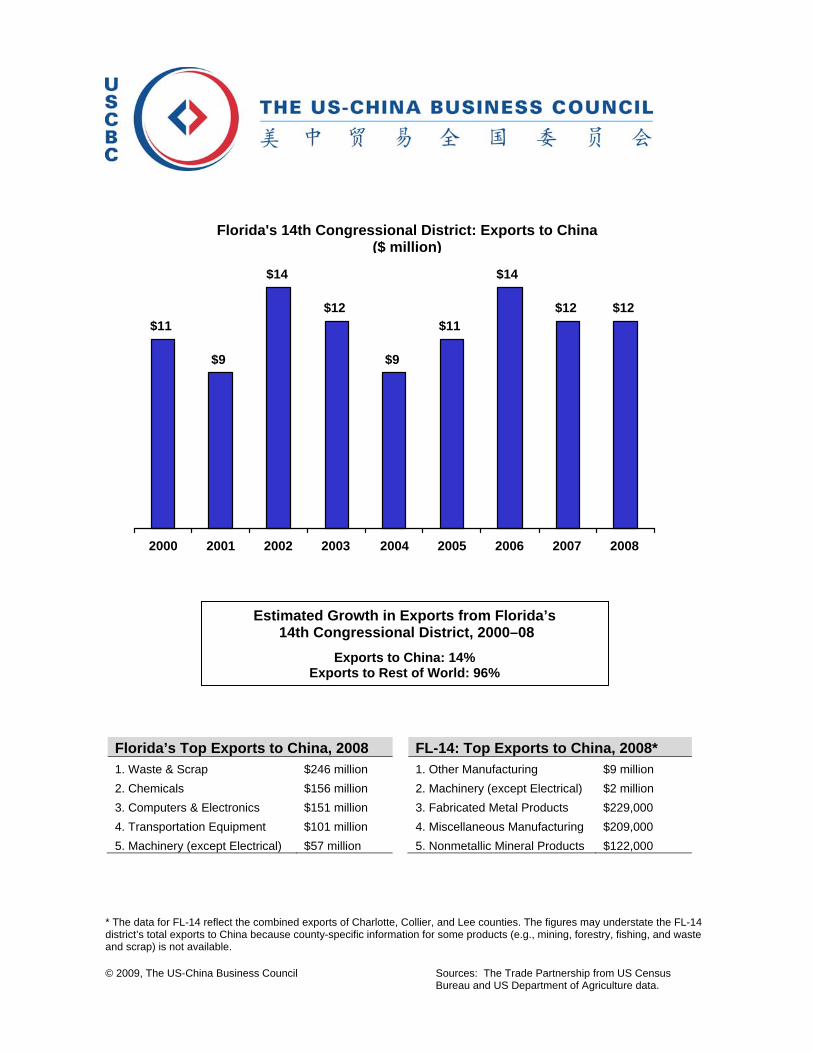
© 2009, The US-China Business Council
Sources: The Trade Partnership from US Census Bureau and US Department of Agriculture data.
Florida’s Top Exports to China, 2008 FL-14: Top Exports to China, 2008* 1. Waste & Scrap $246 million 1. Other Manufacturing $9 million
2. Chemicals $156 million 2. Machinery (except Electrical) $2 million
3. Computers & Electronics $151 million 3. Fabricated Metal Products $229,000
4. Transportation Equipment $101 million 4. Miscellaneous Manufacturing $209,000
5. Machinery (except Electrical) $57 million 5. Nonmetallic Mineral Products $122,000 * The data for FL-14 reflect the combined exports of Charlotte, Collier, and Lee counties. The figures may understate the FL-14 district’s total exports to China because county-specific information for some products (e.g., mining, forestry, fishing, and waste and scrap) is not available.
$11
$9
$14
$12
$9
$11
$14
$12 $12
2000 2001 2002 2003 2004 2005 2006 2007 2008
Estimated Growth in Exports from Florida’s 14th Congressional District, 2000–08
Exports to China: 14% Exports to Rest of World: 96%
Florida's 14th Congressional District: Exports to China ($ million)

© 2009, The US-China Business Council
Sources: The Trade Partnership from US Census Bureau and US Department of Agriculture data.
Florida’s Top Exports to China, 2008 FL-15: Top Exports to China, 2008* 1. Waste & Scrap $246 million 1. Chemicals $33 million
2. Chemicals $156 million 2. Computers & Electronics $28 million
3. Computers & Electronics $151 million 3. Transportation Equipment $18 million
4. Transportation Equipment $101 million 4. Processed Foods $6 million
5. Machinery (except Electrical) $57 million 5. Machinery (except Electrical) $5 million
* The data for FL-15 reflect the combined exports of Brevard, Indian River, Osceola, and Polk counties. The figures may understate the FL-15 district’s total exports to China because county-specific information for some products (e.g., mining, forestry, fishing, and waste and scrap) is not available.
$104
$88
$133
$109
$77
$96
$120
$88$93
2000 2001 2002 2003 2004 2005 2006 2007 2008
Estimated Growth in Exports from Florida’s 15th Congressional District, 2000–08
Exports to China: -11% Exports to Rest of World: 100%
Florida's 15th Congressional District: Exports to China ($ million)

© 2009, The US-China Business Council
Sources: The Trade Partnership from US Census Bureau and US Department of Agriculture data.
Florida’s Top Exports to China, 2008 FL-16: Top Exports to China, 2008* 1. Waste & Scrap $246 million 1. Other Manufacturing $16 million
2. Chemicals $156 million 2. Transportation Equipment $6 million
3. Computers & Electronics $151 million 3. Computers & Electronics $4 million
4. Transportation Equipment $101 million 4. Processed Foods $3 million
5. Machinery (except Electrical) $57 million 5. Chemicals $3 million * The data for FL-16 reflect the combined exports of Charlotte, Glades, Hendry, Highlands, Martin, Okeechobee, Palm Beach, and St. Lucie counties. The figures may understate the FL-16 district’s total exports to China because county-specific information for some products (e.g., mining, forestry, fishing, and waste and scrap) is not available.
$32$29
$41
$35
$27
$34
$44
$35$37
2000 2001 2002 2003 2004 2005 2006 2007 2008
Estimated Growth in Exports from Florida’s 16th Congressional District, 2000–08
Exports to China: 14% Exports to Rest of World: 95%
Florida's 16th Congressional District: Exports to China ($ million)

© 2009, The US-China Business Council
Sources: The Trade Partnership from US Census Bureau and US Department of Agriculture data.
Florida’s Top Exports to China, 2008 FL-17: Top Exports to China, 2008* 1. Waste & Scrap $246 million 1. Chemicals $37 million
2. Chemicals $156 million 2. Computers & Electronics $31 million
3. Computers & Electronics $151 million 3. Transportation Equipment $14 million
4. Transportation Equipment $101 million 4. Machinery (except Electrical) $10 million
5. Machinery (except Electrical) $57 million 5. Other Manufacturing $6 million
* The data for FL-17 reflect the combined exports of Broward and Miami-Dade counties. The figures may understate the FL-17 district’s total exports to China because county-specific information for some products (e.g., mining, forestry, fishing, and waste and scrap) is not available.
$105$93
$134
$115
$88
$110
$143
$114$119
2000 2001 2002 2003 2004 2005 2006 2007 2008
Estimated Growth in Exports from Florida’s 17th Congressional District, 2000–08
Exports to China: 14% Exports to Rest of World: 99%
Florida's 17th Congressional District: Exports to China ($ million)

© 2009, The US-China Business Council
Sources: The Trade Partnership from US Census Bureau and US Department of Agriculture data.
Florida’s Top Exports to China, 2008 FL-18: Top Exports to China, 2008* 1. Waste & Scrap $246 million 1. Chemicals $25 million
2. Chemicals $156 million 2. Other Manufacturing $10 million
3. Computers & Electronics $151 million 3. Transportation Equipment $7 million
4. Transportation Equipment $101 million 4. Computers & Electronics $6 million
5. Machinery (except Electrical) $57 million 5. Miscellaneous Manufacturing $4 million * The data for FL-18 reflect the combined exports of Miami-Dade and Monroe counties. The figures may understate the FL-18 district’s total exports to China because county-specific information for some products (e.g., mining, forestry, fishing, and waste and scrap) is not available.
$58$52
$75
$64
$49
$61
$79
$63$66
2000 2001 2002 2003 2004 2005 2006 2007 2008
Estimated Growth in Exports from Florida’s 18th Congressional District, 2000–08
Exports to China: 14% Exports to Rest of World: 99%
Florida's 18th Congressional District: Exports to China ($ million)

© 2009, The US-China Business Council
Sources: The Trade Partnership from US Census Bureau and US Department of Agriculture data.
Florida’s Top Exports to China, 2008 FL-19: Top Exports to China, 2008* 1. Waste & Scrap $246 million 1. Computers & Electronics $29 million
2. Chemicals $156 million 2. Chemicals $15 million
3. Computers & Electronics $151 million 3. Transportation Equipment $12 million
4. Transportation Equipment $101 million 4. Machinery (except Electrical) $9 million
5. Machinery (except Electrical) $57 million 5. Processed Foods $4 million * The data for FL-19 reflect the combined exports of Broward and Palm Beach counties. The figures may understate the FL-19 district’s total exports to China because county-specific information for some products (e.g., mining, forestry, fishing, and waste and scrap) is not available.
$69$61
$88
$75
$58
$72
$94
$75 $78
2000 2001 2002 2003 2004 2005 2006 2007 2008
Estimated Growth in Exports from Florida’s 19th Congressional District, 2000–08
Exports to China: 14% Exports to Rest of World: 98%
Florida's 19th Congressional District: Exports to China ($ million)

© 2009, The US-China Business Council
Sources: The Trade Partnership from US Census Bureau and US Department of Agriculture data.
Florida’s Top Exports to China, 2008 FL-20: Top Exports to China, 2008* 1. Waste & Scrap $246 million 1. Chemicals $37 million
2. Chemicals $156 million 2. Computers & Electronics $31 million
3. Computers & Electronics $151 million 3. Transportation Equipment $14 million
4. Transportation Equipment $101 million 4. Machinery (except Electrical) $10 million
5. Machinery (except Electrical) $57 million 5. Other Manufacturing $7 million
* The data for FL-20 reflect the combined exports of Broward and Miami-Dade counties. The figures may understate the FL-20 district’s total exports to China because county-specific information for some products (e.g., mining, forestry, fishing, and waste and scrap) is not available.
$105$93
$134
$115
$88
$110
$143
$114$119
2000 2001 2002 2003 2004 2005 2006 2007 2008
Estimated Growth in Exports from Florida’s 20th Congressional District, 2000–08
Exports to China: 14% Exports to Rest of World: 99%
Florida's 20th Congressional District: Exports to China ($ million)

© 2009, The US-China Business Council
Sources: The Trade Partnership from US Census Bureau and US Department of Agriculture data.
Florida’s Top Exports to China, 2008 FL-21: Top Exports to China, 2008* 1. Waste & Scrap $246 million 1. Chemicals $37 million
2. Chemicals $156 million 2. Computers & Electronics $31 million
3. Computers & Electronics $151 million 3. Transportation Equipment $14 million
4. Transportation Equipment $101 million 4. Machinery (except Electrical) $10 million
5. Machinery (except Electrical) $57 million 5. Other Manufacturing $7 million
* The data for FL-21 reflect the combined exports of Broward and Miami-Dade counties. The figures may understate the FL-21 district’s total exports to China because county-specific information for some products (e.g., mining, forestry, fishing, and waste and scrap) is not available.
$105$93
$134
$115
$88
$110
$143
$114$119
2000 2001 2002 2003 2004 2005 2006 2007 2008
Estimated Growth in Exports from Florida’s 21st Congressional District, 2000–08
Exports to China: 14% Exports to Rest of World: 99%
Florida's 21st Congressional District: Exports to China ($ million)

© 2009, The US-China Business Council
Sources: The Trade Partnership from US Census Bureau and US Department of Agriculture data.
Florida’s Top Exports to China, 2008 FL-22: Top Exports to China, 2008* 1. Waste & Scrap $246 million 1. Computers & Electronics $29 million
2. Chemicals $156 million 2. Chemicals $15 million
3. Computers & Electronics $151 million 3. Transportation Equipment $12 million
4. Transportation Equipment $101 million 4. Machinery (except Electrical) $9 million
5. Machinery (except Electrical) $57 million 5. Processed Foods $4 million * The data for FL-22 reflect the combined exports of Broward and Palm Beach counties. The figures may understate the FL-22 district’s total exports to China because county-specific information for some products (e.g., mining, forestry, fishing, and waste and scrap) is not available.
$69$61
$88
$75
$58
$72
$94
$75 $78
2000 2001 2002 2003 2004 2005 2006 2007 2008
Estimated Growth in Exports from Florida’s 22nd Congressional District, 2000–08
Exports to China: 14% Exports to Rest of World: 98%
Florida's 22nd Congressional District: Exports to China ($ million)

© 2009, The US-China Business Council
Sources: The Trade Partnership from US Census Bureau and US Department of Agriculture data.
Florida’s Top Exports to China, 2008 FL-23: Top Exports to China, 2008* 1. Waste & Scrap $246 million 1. Computers & Electronics $29 million
2. Chemicals $156 million 2. Chemicals $15 million
3. Computers & Electronics $151 million 3. Transportation Equipment $12 million
4. Transportation Equipment $101 million 4. Other Manufacturing $10 million
5. Machinery (except Electrical) $57 million 5. Machinery (except Electrical) $9 million * The data for FL-23 reflect the combined exports of Broward, Hendry, Martin, Palm Beach, and St. Lucie counties. The figures may understate the FL-23 district’s total exports to China because county-specific information for some products (e.g., mining, forestry, fishing, and waste and scrap) is not available.
$77$68
$98
$84
$65
$80
$105
$84 $87
2000 2001 2002 2003 2004 2005 2006 2007 2008
Estimated Growth in Exports from Florida’s 23rd Congressional District, 2000–08
Exports to China: 14% Exports to Rest of World: 98%
Florida's 23rd Congressional District: Exports to China ($ million)

© 2009, The US-China Business Council
Sources: The Trade Partnership from US Census Bureau and US Department of Agriculture data.
Florida’s Top Exports to China, 2008 FL-24: Top Exports to China, 2008* 1. Waste & Scrap $246 million 1. Computers & Electronics $66 million
2. Chemicals $156 million 2. Transportation Equipment $26 million
3. Computers & Electronics $151 million 3. Machinery (except Electrical) $20 million
4. Transportation Equipment $101 million 4. Chemicals $8 million
5. Machinery (except Electrical) $57 million 5. Processed Foods $4 million * The data for FL-24 reflect the combined exports of Brevard, Orange, Seminole, and Volusia counties. The figures may understate the FL-24 district’s total exports to China because county-specific information for some products (e.g., mining, forestry, fishing, and waste and scrap) is not available.
$62$73
$87 $90
$76
$93
$145
$118$131
2000 2001 2002 2003 2004 2005 2006 2007 2008
Estimated Growth in Exports from Florida’s 24th Congressional District, 2000–08
Exports to China: 110% Exports to Rest of World: 97%
Florida's 24th Congressional District: Exports to China ($ million)

© 2009, The US-China Business Council
Sources: The Trade Partnership from US Census Bureau and US Department of Agriculture data.
Florida’s Top Exports to China, 2008 FL-25: Top Exports to China, 2008* 1. Waste & Scrap $246 million 1. Chemicals $25 million
2. Chemicals $156 million 2. Other Manufacturing $14 million
3. Computers & Electronics $151 million 3. Transportation Equipment $7 million
4. Transportation Equipment $101 million 4. Computers & Electronics $6 million
5. Machinery (except Electrical) $57 million 5. Miscellaneous Manufacturing $4 million * The data for FL-25 reflect the combined exports of Collier, Miami-Dade, and Monroe counties. The figures may understate the FL-25 district’s total exports to China because county-specific information for some products (e.g., mining, forestry, fishing, and waste and scrap) is not available.
$61$54
$78
$67
$51
$64
$84
$67$70
2000 2001 2002 2003 2004 2005 2006 2007 2008
Estimated Growth in Exports from Florida’s 25th Congressional District, 2000–08
Exports to China: 14% Exports to Rest of World: 99%
Florida's 25th Congressional District: Exports to China ($ million)

© 2009, The US-China Business Council
Sources: The Trade Partnership from US Census Bureau and US Department of Agriculture data.
Georgia’s Top Exports to China, 2008 GA-1: Top Exports to China, 2008* 1. Paper Products $348 million 1. Other Manufacturing $123 million
2. Waste & Scrap $255 million 2. Chemicals $10 million
3. Processed Foods $252 million 3. Paper Products $8 million
4. Machinery (except Electrical) $214 million 4. Crop Production $8 million
5. Chemicals $209 million 5. Animal Production $72,000 * The data for GA-1 reflect the combined exports of Appling, Atkinson, Bacon, Berrien, Brantley, Bryan, Camden, Charlton, Chatham, Clinch, Coffee, Cook, Echols, Glynn, Jeff Davis, Lanier, Liberty, Long, Lowndes, McIntosh, Pierce, Telfair, Ware, Wayne, and Wheeler counties. The figures may understate the GA-1 district’s total exports to China because county-specific information for some products (e.g., mining, forestry, fishing, and waste and scrap) is not available.
$24$29 $31
$50$60
$71 $73
$117
$150
2000 2001 2002 2003 2004 2005 2006 2007 2008
Estimated Growth in Exports from Georgia’s 1st Congressional District, 2000–08
Exports to China: 514% Exports to Rest of World: 78%
Georgia's 1st Congressional District: Exports to China ($ million)

© 2009, The US-China Business Council
Sources: The Trade Partnership from US Census Bureau and US Department of Agriculture data.
Georgia’s Top Exports to China, 2008 GA-2: Top Exports to China, 2008* 1. Paper Products $348 million 1. Other Manufacturing $149 million
2. Waste & Scrap $255 million 2. Crop Production $20 million
3. Processed Foods $252 million 3. Paper Products $8 million
4. Machinery (except Electrical) $214 million 4. Transportation Equipment $1 million
5. Chemicals $209 million 5. Wood Products $465,000
* The data for GA-2 reflect the combined exports of Baker, Brooks, Calhoun, Chattahoochee, Clay, Crawford, Crisp, Decatur, Dooly, Dougherty, Early, Grady, Lee, Lowndes, Macon, Marion, Miller, Mitchell, Muscogee, Peach, Quitman, Randolph, Schley, Seminole, Stewart, Sumter, Talbot, Taylor, Terrell, Thomas, Webster, and Worth counties. The figures may understate the GA-2 district’s total exports to China because county-specific information for some products (e.g., mining, forestry, fishing, and waste and scrap) is not available.
$27$33 $36
$60$70
$81 $86
$145
$179
2000 2001 2002 2003 2004 2005 2006 2007 2008
Estimated Growth in Exports from Georgia’s 2nd Congressional District, 2000–08
Exports to China: 550% Exports to Rest of World: 82%
Georgia's 2nd Congressional District: Exports to China ($ million)

© 2009, The US-China Business Council
Sources: The Trade Partnership from US Census Bureau and US Department of Agriculture data.
Georgia’s Top Exports to China, 2008 GA-3: Top Exports to China, 2008* 1. Paper Products $348 million 1. Other Manufacturing $170 million
2. Waste & Scrap $255 million 2. Chemicals $7 million
3. Processed Foods $252 million 3. Processed Foods $6 million
4. Machinery (except Electrical) $214 million 4. Machinery (except Electrical) $4 million
5. Chemicals $209 million 5. Textiles & Fabrics $2 million * The data for GA-3 reflect the combined exports of Carroll, Coweta, Douglas, Fayette, Harris, Heard, Henry, Lamar, Meriwether, Muscogee, Pike, Rockdale, Spalding, Troup, and Upson counties. The figures may understate the GA-3 district’s total exports to China because county-specific information for some products (e.g., mining, forestry, fishing, and waste and scrap) is not available.
$34 $39 $41
$65$79
$96 $97
$147
$196
2000 2001 2002 2003 2004 2005 2006 2007 2008
Estimated Growth in Exports from Georgia’s 3rd Congressional District, 2000–08
Exports to China: 485% Exports to Rest of World: 75%
Georgia's 3rd Congressional District: Exports to China ($ million)

© 2009, The US-China Business Council
Sources: The Trade Partnership from US Census Bureau and US Department of Agriculture data.
Georgia’s Top Exports to China, 2008 GA-4: Top Exports to China, 2008* 1. Paper Products $348 million 1. Other Manufacturing $47 million
2. Waste & Scrap $255 million 2. Computers & Electronics $30 million
3. Processed Foods $252 million 3. Paper Products $28 million
4. Machinery (except Electrical) $214 million 4. Chemicals $23 million
5. Chemicals $209 million 5. Processed Foods $17 million * The data for GA-4 reflect the combined exports of DeKalb, Gwinnett, and Rockdale counties. The figures may understate the GA-4 district’s total exports to China because county-specific information for some products (e.g., mining, forestry, fishing, and waste and scrap) is not available.
$34 $40 $42
$66$80
$97 $99
$148
$199
2000 2001 2002 2003 2004 2005 2006 2007 2008
Estimated Growth in Exports from Georgia’s 4th Congressional District, 2000–08
Exports to China: 482% Exports to Rest of World: 75%
Georgia's 4th Congressional District: Exports to China ($ million)

© 2009, The US-China Business Council
Sources: The Trade Partnership from US Census Bureau and US Department of Agriculture data.
Georgia’s Top Exports to China, 2008 GA-5: Top Exports to China, 2008* 1. Paper Products $348 million 1. Other Manufacturing $103 million
2. Waste & Scrap $255 million 2. Processed Foods $65 million
3. Processed Foods $252 million 3. Paper Products $34 million
4. Machinery (except Electrical) $214 million 4. Chemicals $33 million
5. Chemicals $209 million 5. Printing & Related Products $16 million * The data for GA-5 reflect the combined exports of Clayton, DeKalb, and Fulton counties. The figures may understate the GA-5 district’s total exports to China because county-specific information for some products (e.g., mining, forestry, fishing, and waste and scrap) is not available.
$51 $59 $63
$98$120
$145 $147
$220
$295
2000 2001 2002 2003 2004 2005 2006 2007 2008
Estimated Growth in Exports from Georgia’s 5th Congressional District, 2000–08
Exports to China: 481% Exports to Rest of World: 74%
Georgia's 5th Congressional District: Exports to China ($ million)
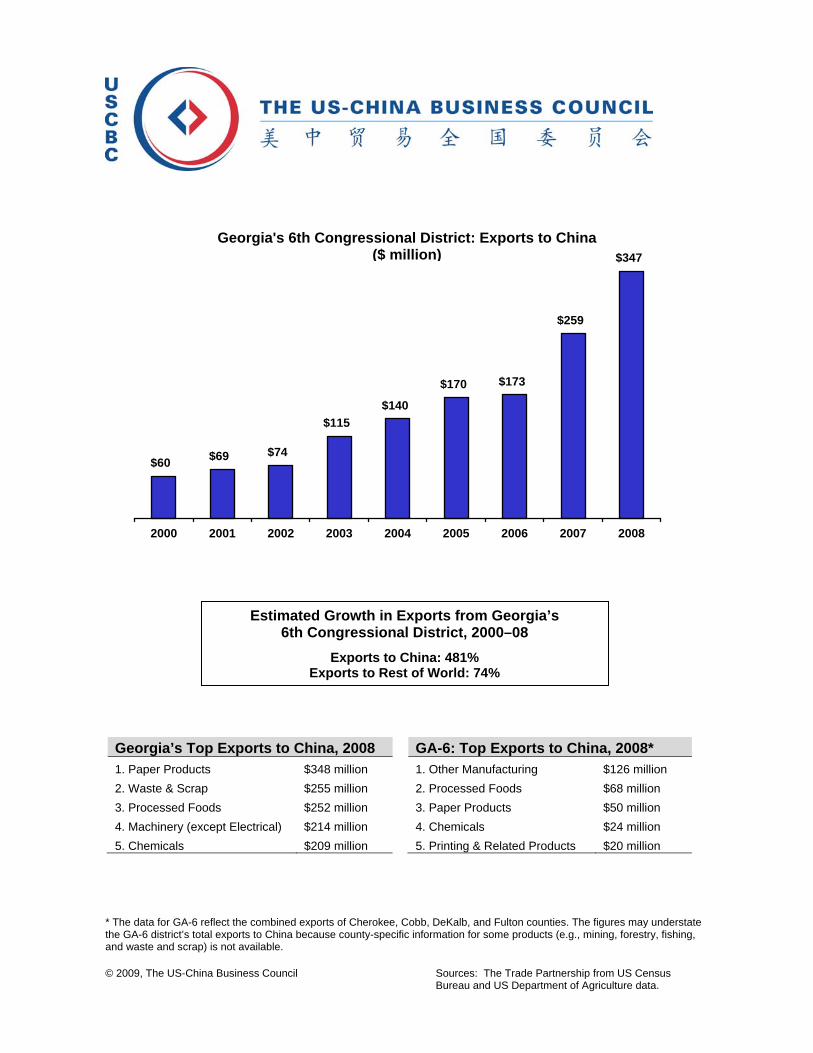
© 2009, The US-China Business Council
Sources: The Trade Partnership from US Census Bureau and US Department of Agriculture data.
Georgia’s Top Exports to China, 2008 GA-6: Top Exports to China, 2008* 1. Paper Products $348 million 1. Other Manufacturing $126 million
2. Waste & Scrap $255 million 2. Processed Foods $68 million
3. Processed Foods $252 million 3. Paper Products $50 million
4. Machinery (except Electrical) $214 million 4. Chemicals $24 million
5. Chemicals $209 million 5. Printing & Related Products $20 million * The data for GA-6 reflect the combined exports of Cherokee, Cobb, DeKalb, and Fulton counties. The figures may understate the GA-6 district’s total exports to China because county-specific information for some products (e.g., mining, forestry, fishing, and waste and scrap) is not available.
$60 $69 $74
$115$140
$170 $173
$259
$347
2000 2001 2002 2003 2004 2005 2006 2007 2008
Estimated Growth in Exports from Georgia’s 6th Congressional District, 2000–08
Exports to China: 481% Exports to Rest of World: 74%
Georgia's 6th Congressional District: Exports to China ($ million)

© 2009, The US-China Business Council
Sources: The Trade Partnership from US Census Bureau and US Department of Agriculture data.
Georgia’s Top Exports to China, 2008 GA-7: Top Exports to China, 2008* 1. Paper Products $348 million 1. Computers & Electronics $30 million
2. Waste & Scrap $255 million 2. Other Manufacturing $20 million
3. Processed Foods $252 million 3. Machinery (except Electrical) $14 million
4. Machinery (except Electrical) $214 million 4. Chemicals $14 million
5. Chemicals $209 million 5. Paper Products $12 million * The data for GA-7 reflect the combined exports of Barrow, Forsyth, Gwinnett, Newton, and Walton counties. The figures may understate the GA-7 district’s total exports to China because county-specific information for some products (e.g., mining, forestry, fishing, and waste and scrap) is not available.
$21 $24 $26
$41$50
$60 $61
$93
$123
2000 2001 2002 2003 2004 2005 2006 2007 2008
Estimated Growth in Exports from Georgia’s 7th Congressional District, 2000–08
Exports to China: 485% Exports to Rest of World: 75%
Georgia's 7th Congressional District: Exports to China ($ million)

© 2009, The US-China Business Council
Sources: The Trade Partnership from US Census Bureau and US Department of Agriculture data.
Georgia’s Top Exports to China, 2008 GA-8: Top Exports to China, 2008* 1. Paper Products $348 million 1. Other Manufacturing $54 million
2. Waste & Scrap $255 million 2. Paper Products $18 million
3. Processed Foods $252 million 3. Crop Production $9 million
4. Machinery (except Electrical) $214 million 4. Chemicals $5 million
5. Chemicals $209 million 5. Machinery (except Electrical) $4 million * The data for GA-8 reflect the combined exports of Baldwin, Ben Hill, Bibb, Bleckley, Butts, Colquitt, Dodge, Houston, Irwin, Jasper, Jones, Laurens, Monroe, Newton, Pulaski, Tift, Turner, Twiggs, Wilcox, Wilkinson, and Worth counties. The figures may understate the GA-8 district’s total exports to China because county-specific information for some products (e.g., mining, forestry, fishing, and waste and scrap) is not available.
$15 $18 $20
$32$38
$44 $46
$77
$96
2000 2001 2002 2003 2004 2005 2006 2007 2008
Estimated Growth in Exports from Georgia’s 8th Congressional District, 2000–08
Exports to China: 542% Exports to Rest of World: 81%
Georgia's 8th Congressional District: Exports to China ($ million)

© 2009, The US-China Business Council
Sources: The Trade Partnership from US Census Bureau and US Department of Agriculture data.
Georgia’s Top Exports to China, 2008 GA-9: Top Exports to China, 2008* 1. Paper Products $348 million 1. Other Manufacturing $169 million
2. Waste & Scrap $255 million 2. Processed Foods $36 million
3. Processed Foods $252 million 3. Machinery (except Electrical) $18 million
4. Machinery (except Electrical) $214 million 4. Non-Apparel Textiles & Fabrics $15 million
5. Chemicals $209 million 5. Chemicals $14 million * The data for GA-9 reflect the combined exports of Catoosa, Dade, Dawson, Fannin, Forsyth, Gilmer, Gordon, Hall, Lumpkin, Murray, Pickens, Union, Walker, White, and Whitfield counties. The figures may understate the GA-9 district’s total exports to China because county-specific information for some products (e.g., mining, forestry, fishing, and waste and scrap) is not available.
$46 $54 $57
$90$109
$132 $134
$202
$270
2000 2001 2002 2003 2004 2005 2006 2007 2008
Estimated Growth in Exports from Georgia’s 9th Congressional District, 2000–08
Exports to China: 484% Exports to Rest of World: 75%
Georgia's 9th Congressional District: Exports to China ($ million)

© 2009, The US-China Business Council
Sources: The Trade Partnership from US Census Bureau and US Department of Agriculture data.
Georgia’s Top Exports to China, 2008 GA-10: Top Exports to China, 2008* 1. Paper Products $348 million 1. Other Manufacturing $118 million
2. Waste & Scrap $255 million 2. Chemicals $32 million
3. Processed Foods $252 million 3. Processed Foods $5 million
4. Machinery (except Electrical) $214 million 4. Nonmetallic Mineral Products $4 million
5. Chemicals $209 million 5. Textiles & Fabrics $1 million * The data for GA-10 reflect the combined exports of Banks, Clarke, Columbia, Elbert, Franklin, Green, Habersham, Hart, Jackson, Lincoln, Madison, McDuffie, Morgan, Oconee, Oglethorpe, Putnam, Rabun, Richmond, Stephens, Towns, and Wilkes counties. The figures may understate the GA-10 district’s total exports to China because county-specific information for some products (e.g., mining, forestry, fishing, and waste and scrap) is not available.
$28 $33 $35
$54$66
$80 $81
$123
$164
2000 2001 2002 2003 2004 2005 2006 2007 2008
Estimated Growth in Exports from Georgia’s 10th Congressional District, 2000–08
Exports to China: 487% Exports to Rest of World: 75%
Georgia's 10th Congressional District: Exports to China ($ million)

© 2009, The US-China Business Council
Sources: The Trade Partnership from US Census Bureau and US Department of Agriculture data.
Georgia’s Top Exports to China, 2008 GA-11: Top Exports to China, 2008* 1. Paper Products $348 million 1. Other Manufacturing $149 million
2. Waste & Scrap $255 million 2. Paper Products $16 million
3. Processed Foods $252 million 3. Chemicals $13 million
4. Machinery (except Electrical) $214 million 4. Processed Foods $13 million
5. Chemicals $209 million 5. Machinery (except Electrical) $6 million * The data for GA-11 reflect the combined exports of Bartow, Carroll, Chattooga, Cobb, Floyd, Gordon, Haralson, Paulding, and Polk counties. The figures may understate the GA-11 district’s total exports to China because county-specific information for some products (e.g., mining, forestry, fishing, and waste and scrap) is not available.
$39 $45 $48
$75$92
$111 $113
$170
$227
2000 2001 2002 2003 2004 2005 2006 2007 2008
Estimated Growth in Exports from Georgia’s 11th Congressional District, 2000–08
Exports to China: 484% Exports to Rest of World: 75%
Georgia's 11th Congressional District: Exports to China ($ million)

© 2009, The US-China Business Council
Sources: The Trade Partnership from US Census Bureau and US Department of Agriculture data.
Georgia’s Top Exports to China, 2008 GA-12: Top Exports to China, 2008* 1. Paper Products $348 million 1. Other Manufacturing $113 million
2. Waste & Scrap $255 million 2. Chemicals $42 million
3. Processed Foods $252 million 3. Crop Production $7 million
4. Machinery (except Electrical) $214 million 4. Nonmetallic Mineral Products $2 million
5. Chemicals $209 million 5. Textiles & Fabrics $887,000 * The data for GA-12 reflect the combined exports of Baldwin, Bulloch, Burke, Candler, Chatham, Effingham, Emanuel, Evans, Glascock, Hancock, Jefferson, Jenkins, Johnson, Montgomery, Richmond, Screven, Taliaferro, Tattnall, Toombs, Treutlen, Warren, and Washington counties. The figures may understate the GA-12 district’s total exports to China because county-specific information for some products (e.g., mining, forestry, fishing, and waste and scrap) is not available.
$27 $32 $34
$55$66
$79 $81
$127
$165
2000 2001 2002 2003 2004 2005 2006 2007 2008
Estimated Growth in Exports from Georgia’s 12th Congressional District, 2000–08
Exports to China: 506% Exports to Rest of World: 77%
Georgia's 12th Congressional District: Exports to China ($ million)

© 2009, The US-China Business Council
Sources: The Trade Partnership from US Census Bureau and US Department of Agriculture data.
Georgia’s Top Exports to China, 2008 GA-13: Top Exports to China, 2008* 1. Paper Products $348 million 1. Other Manufacturing $146 million
2. Waste & Scrap $255 million 2. Processed Foods $69 million
3. Processed Foods $252 million 3. Paper Products $50 million
4. Machinery (except Electrical) $214 million 4. Chemicals $38 million
5. Chemicals $209 million 5. Printing & Related Products $20 million * The data for GA-13 reflect the combined exports of Clayton, Cobb, DeKalb, Douglas, Fulton, and Henry counties. The figures may understate the GA-13 district’s total exports to China because county-specific information for some products (e.g., mining, forestry, fishing, and waste and scrap) is not available.
$66 $77 $81
$127$155
$188 $191
$287
$384
2000 2001 2002 2003 2004 2005 2006 2007 2008
Estimated Growth in Exports from Georgia’s 13th Congressional District, 2000–08
Exports to China: 481% Exports to Rest of World: 74%
Georgia's 13th Congressional District: Exports to China ($ million)

© 2009, The US-China Business Council
Sources: The Trade Partnership from US Census Bureau and US Department of Agriculture data.
Hawaii’s Top Exports to China, 2008 HI-1: Top Exports to China, 2008* 1. Waste & Scrap $32 million 1. Other Manufacturing $35 million
2. Petroleum & Coal Products $29 million 2. Processed Foods $331,000
3. Chemicals $8 million 3. Crop Production $223,000
4. Primary Metal Manufacturing $2 million 4. Beverages & Tobacco Products $18,000
5. Paper Products $726,000 * The data for HI-1 reflect the exports of Honolulu County, which also includes another congressional district. The figures may understate the HI-1 district’s total exports to China because county-specific information for some products (e.g., mining, forestry, fishing, and waste and scrap) is not available.
$2 $3 $2 $2
$20
$99
$3 $5
$36
2000 2001 2002 2003 2004 2005 2006 2007 2008
Estimated Growth in Exports from Hawaii’s 1st Congressional District, 2000–08
Exports to China: 1,359% Exports to Rest of World: 150%
Hawaii's 1st Congressional District: Exports to China ($ million)

© 2009, The US-China Business Council
Sources: The Trade Partnership from US Census Bureau and US Department of Agriculture data.
Hawaii’s Top Exports to China, 2008 HI-2: Top Exports to China, 2008* 1. Waste & Scrap $32 million 1. Other Manufacturing $41 million
2. Petroleum & Coal Products $29 million 2. Crop Production $666,000
3. Chemicals $8 million 3. Processed Foods $507,000
4. Primary Metal Manufacturing $2 million 4. Beverages & Tobacco Products $18,000
5. Paper Products $726,000 * The data for HI-2 reflect the combined exports of Hawaii, Honolulu, Kauai, and Maui counties. The figures may understate the HI-2 district’s total exports to China because county-specific information for some products (e.g., mining, forestry, fishing, and waste and scrap) is not available.
$3 $4 $2 $2
$24
$115
$4 $6
$42
2000 2001 2002 2003 2004 2005 2006 2007 2008
Estimated Growth in Exports from Hawaii’s 2nd Congressional District, 2000–08
Exports to China: 1,373% Exports to Rest of World: 144%
Hawaii's 2nd Congressional District: Exports to China ($ million)
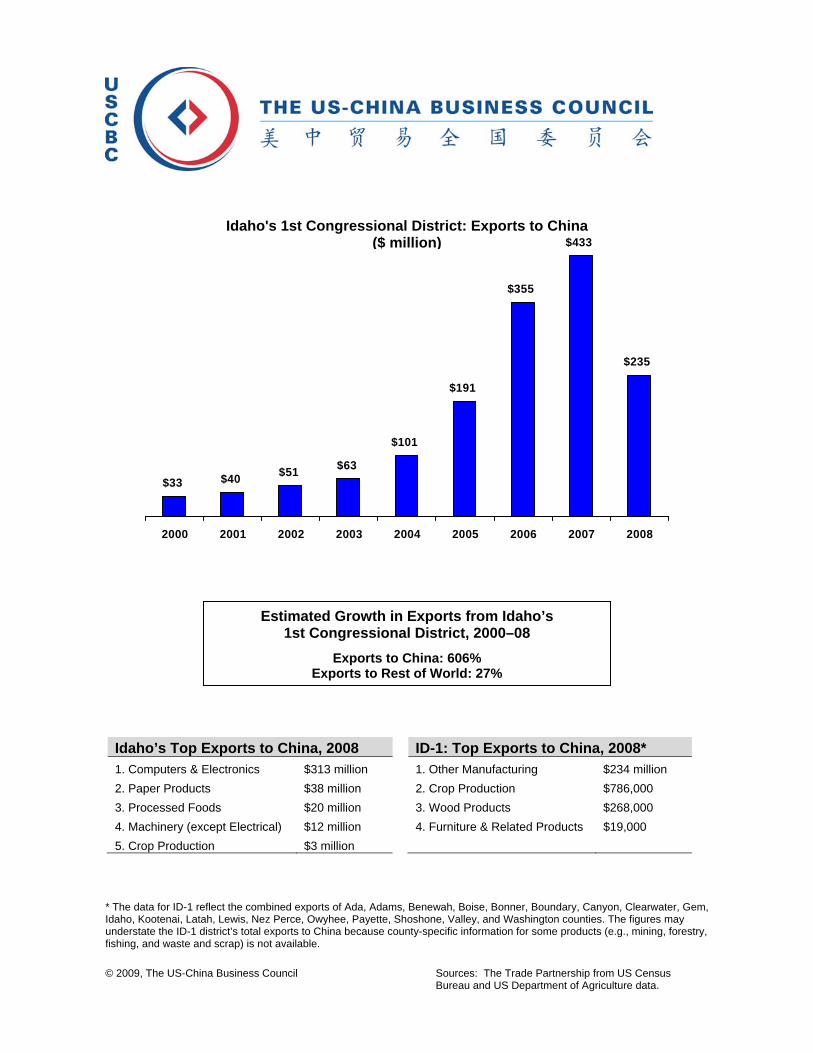
© 2009, The US-China Business Council
Sources: The Trade Partnership from US Census Bureau and US Department of Agriculture data.
Idaho’s Top Exports to China, 2008 ID-1: Top Exports to China, 2008* 1. Computers & Electronics $313 million 1. Other Manufacturing $234 million
2. Paper Products $38 million 2. Crop Production $786,000
3. Processed Foods $20 million 3. Wood Products $268,000
4. Machinery (except Electrical) $12 million 4. Furniture & Related Products $19,000
5. Crop Production $3 million * The data for ID-1 reflect the combined exports of Ada, Adams, Benewah, Boise, Bonner, Boundary, Canyon, Clearwater, Gem, Idaho, Kootenai, Latah, Lewis, Nez Perce, Owyhee, Payette, Shoshone, Valley, and Washington counties. The figures may understate the ID-1 district’s total exports to China because county-specific information for some products (e.g., mining, forestry, fishing, and waste and scrap) is not available.
$33 $40 $51 $63
$101
$191
$355
$433
$235
2000 2001 2002 2003 2004 2005 2006 2007 2008
Estimated Growth in Exports from Idaho’s 1st Congressional District, 2000–08
Exports to China: 606% Exports to Rest of World: 27%
Idaho's 1st Congressional District: Exports to China ($ million)

© 2009, The US-China Business Council
Sources: The Trade Partnership from US Census Bureau and US Department of Agriculture data.
Idaho’s Top Exports to China, 2008 ID-2: Top Exports to China, 2008* 1. Computers & Electronics $313 million 1. Other Manufacturing $195 million
2. Paper Products $38 million 2. Crop Production $2 million
3. Processed Foods $20 million 3. Processed Foods $2 million
4. Machinery (except Electrical) $12 million 4. Wood Products $61,000
5. Crop Production $3 million * The data for ID-2 reflect the combined exports of Ada, Bannock, Bear Lake, Bingham, Blaine, Bonneville, Butte, Camas, Caribou, Cassia, Clark, Custer, Elmore, Franklin, Fremont, Gooding, Jefferson, Jerome, Lemhi, Lincoln, Madison, Minidoka, Oneida, Power, Teton, and Twin Falls counties. The figures may understate the ID-2 district’s total exports to China because county-specific information for some products (e.g., mining, forestry, fishing, and waste and scrap) is not available.
$28 $34 $43 $54
$86
$161
$300
$365
$200
2000 2001 2002 2003 2004 2005 2006 2007 2008
Estimated Growth in Exports from Idaho’s 2nd Congressional District, 2000–08
Exports to China: 608% Exports to Rest of World: 29%
Idaho's 2nd Congressional District: Exports to China ($ million)

© 2009, The US-China Business Council
Sources: The Trade Partnership from US Census Bureau and US Department of Agriculture data.
.
Illinois’ Top Exports to China, 2008 IL-1: Top Exports to China, 2008* 1. Machinery (except Electrical) $533 million 1. Computers & Electronics $163 million
2. Waste & Scrap $413 million 2. Electrical Equipment $125 million
3. Computers & Electronics $342 million 3. Machinery (except Electrical) $84 million
4. Electrical Equipment $308 million 4. Chemicals $72 million
5. Chemicals $269 million 5. Other Manufacturing $44 million * The data for IL-1 reflect the exports of Cook County, which also includes other congressional districts. The figures may understate the IL-1 district’s total exports to China because county-specific information for some products (e.g., mining, forestry, fishing, and waste and scrap) is not available.
$176$225 $206 $212
$275
$355
$429
$499
$650
2000 2001 2002 2003 2004 2005 2006 2007 2008
Estimated Growth in Exports from Illinois’ 1st Congressional District, 2000–08
Exports to China: 270% Exports to Rest of World: 56%
Illinois' 1st Congressional District: Exports to China ($ million)

© 2009, The US-China Business Council
Sources: The Trade Partnership from US Census Bureau and US Department of Agriculture data.
Illinois’ Top Exports to China, 2008 IL-2: Top Exports to China, 2008* 1. Machinery (except Electrical) $533 million 1. Computers & Electronics $195 million
2. Waste & Scrap $413 million 2. Electrical Equipment $125 million
3. Computers & Electronics $342 million 3. Machinery (except Electrical) $102 million
4. Electrical Equipment $308 million 4. Chemicals $89 million
5. Chemicals $269 million 5. Other Manufacturing $60 million * The data for IL-2 reflect the combined exports of Cook and Will counties. The figures may understate the IL-2 district’s total exports to China because county-specific information for some products (e.g., mining, forestry, fishing, and waste and scrap) is not available.
$200$256 $234 $241
$313
$403
$488
$568
$742
2000 2001 2002 2003 2004 2005 2006 2007 2008
Estimated Growth in Exports from Illinois’ 2nd Congressional District, 2000–08
Exports to China: 272% Exports to Rest of World: 56%
Illinois' 2nd Congressional District: Exports to China ($ million)

© 2009, The US-China Business Council
Sources: The Trade Partnership from US Census Bureau and US Department of Agriculture data.
.
Illinois’ Top Exports to China, 2008 IL-3: Top Exports to China, 2008* 1. Machinery (except Electrical) $533 million 1. Computers & Electronics $163 million
2. Waste & Scrap $413 million 2. Electrical Equipment $125 million
3. Computers & Electronics $342 million 3. Machinery (except Electrical) $84 million
4. Electrical Equipment $308 million 4. Chemicals $72 million
5. Chemicals $269 million 5. Other Manufacturing $44 million * The data for IL-3 reflect the exports of Cook County, which also includes other congressional districts. The figures may understate the IL-3 district’s total exports to China because county-specific information for some products (e.g., mining, forestry, fishing, and waste and scrap) is not available.
$176$225 $206 $212
$275
$355
$429
$499
$650
2000 2001 2002 2003 2004 2005 2006 2007 2008
Estimated Growth in Exports from Illinois’ 3rd Congressional District, 2000–08
Exports to China: 270% Exports to Rest of World: 56%
Illinois' 3rd Congressional District: Exports to China ($ million)

© 2009, The US-China Business Council
Sources: The Trade Partnership from US Census Bureau and US Department of Agriculture data.
.
Illinois’ Top Exports to China, 2008 IL-4: Top Exports to China, 2008* 1. Machinery (except Electrical) $533 million 1. Computers & Electronics $163 million
2. Waste & Scrap $413 million 2. Electrical Equipment $125 million
3. Computers & Electronics $342 million 3. Machinery (except Electrical) $84 million
4. Electrical Equipment $308 million 4. Chemicals $72 million
5. Chemicals $269 million 5. Other Manufacturing $44 million * The data for IL-4 reflect the exports of Cook County, which also includes other congressional districts. The figures may understate the IL-4 district’s total exports to China because county-specific information for some products (e.g., mining, forestry, fishing, and waste and scrap) is not available.
$176$225 $206 $212
$275
$355
$429
$499
$650
2000 2001 2002 2003 2004 2005 2006 2007 2008
Estimated Growth in Exports from Illinois’ 4th Congressional District, 2000–08
Exports to China: 270% Exports to Rest of World: 56%
Illinois' 4th Congressional District: Exports to China ($ million)

© 2009, The US-China Business Council
Sources: The Trade Partnership from US Census Bureau and US Department of Agriculture data.
.
Illinois’ Top Exports to China, 2008 IL-5: Top Exports to China, 2008* 1. Machinery (except Electrical) $533 million 1. Computers & Electronics $163 million
2. Waste & Scrap $413 million 2. Electrical Equipment $125 million
3. Computers & Electronics $342 million 3. Machinery (except Electrical) $84 million
4. Electrical Equipment $308 million 4. Chemicals $72 million
5. Chemicals $269 million 5. Other Manufacturing $44 million * The data for IL-5 reflect the exports of Cook County, which also includes other congressional districts. The figures may understate the IL-5 district’s total exports to China because county-specific information for some products (e.g., mining, forestry, fishing, and waste and scrap) is not available.
$176$225 $206 $212
$275
$355
$429
$499
$650
2000 2001 2002 2003 2004 2005 2006 2007 2008
Estimated Growth in Exports from Illinois’ 5th Congressional District, 2000–08
Exports to China: 270% Exports to Rest of World: 56%
Illinois' 5th Congressional District: Exports to China ($ million)

© 2009, The US-China Business Council
Sources: The Trade Partnership from US Census Bureau and US Department of Agriculture data.
Illinois’ Top Exports to China, 2008 IL-6: Top Exports to China, 2008* 1. Machinery (except Electrical) $533 million 1. Computers & Electronics $210 million
2. Waste & Scrap $413 million 2. Machinery (except Electrical) $169 million
3. Computers & Electronics $342 million 3. Electrical Equipment $139 million
4. Electrical Equipment $308 million 4. Chemicals $81 million
5. Chemicals $269 million 5. Transportation Equipment $48 million * The data for IL-6 reflect the combined exports of Cook and DuPage counties. The figures may understate the IL-6 district’s total exports to China because county-specific information for some products (e.g., mining, forestry, fishing, and waste and scrap) is not available.
$214$274 $250 $258
$335
$431
$522
$607
$791
2000 2001 2002 2003 2004 2005 2006 2007 2008
Estimated Growth in Exports from Illinois’ 6th Congressional District, 2000–08
Exports to China: 271% Exports to Rest of World: 56%
Illinois' 6th Congressional District: Exports to China ($ million)

© 2009, The US-China Business Council
Sources: The Trade Partnership from US Census Bureau and US Department of Agriculture data.
.
Illinois’ Top Exports to China, 2008 IL-7: Top Exports to China, 2008* 1. Machinery (except Electrical) $533 million 1. Computers & Electronics $163 million
2. Waste & Scrap $413 million 2. Electrical Equipment $125 million
3. Computers & Electronics $342 million 3. Machinery (except Electrical) $84 million
4. Electrical Equipment $308 million 4. Chemicals $72 million
5. Chemicals $269 million 5. Other Manufacturing $44 million * The data for IL-7 reflect the exports of Cook County, which also includes other congressional districts. The figures may understate the IL-7 district’s total exports to China because county-specific information for some products (e.g., mining, forestry, fishing, and waste and scrap) is not available.
$176$225 $206 $212
$275
$355
$429
$499
$650
2000 2001 2002 2003 2004 2005 2006 2007 2008
Estimated Growth in Exports from Illinois’ 7th Congressional District, 2000–08
Exports to China: 270% Exports to Rest of World: 56%
Illinois' 7th Congressional District: Exports to China ($ million)

© 2009, The US-China Business Council
Sources: The Trade Partnership from US Census Bureau and US Department of Agriculture data.
Illinois’ Top Exports to China, 2008 IL-8: Top Exports to China, 2008* 1. Machinery (except Electrical) $533 million 1. Computers & Electronics $197 million
2. Waste & Scrap $413 million 2. Electrical Equipment $176 million
3. Computers & Electronics $342 million 3. Chemicals $146 million
4. Electrical Equipment $308 million 4. Machinery (except Electrical) $124 million
5. Chemicals $269 million 5. Transportation Equipment $44 million * The data for IL-8 reflect the combined exports of Cook, Lake, and McHenry counties. The figures may understate the IL-8 district’s total exports to China because county-specific information for some products (e.g., mining, forestry, fishing, and waste and scrap) is not available.
$234$300
$262 $267
$343
$466
$561$622
$827
2000 2001 2002 2003 2004 2005 2006 2007 2008
Estimated Growth in Exports from Illinois’ 8th Congressional District, 2000–08
Exports to China: 254% Exports to Rest of World: 56%
Illinois' 8th Congressional District: Exports to China ($ million)

© 2009, The US-China Business Council
Sources: The Trade Partnership from US Census Bureau and US Department of Agriculture data.
.
Illinois’ Top Exports to China, 2008 IL-9: Top Exports to China, 2008* 1. Machinery (except Electrical) $533 million 1. Computers & Electronics $163 million
2. Waste & Scrap $413 million 2. Electrical Equipment $125 million
3. Computers & Electronics $342 million 3. Machinery (except Electrical) $84 million
4. Electrical Equipment $308 million 4. Chemicals $72 million
5. Chemicals $269 million 5. Other Manufacturing $44 million * The data for IL-9 reflect the exports of Cook County, which also includes other congressional districts. The figures may understate the IL-9 district’s total exports to China because county-specific information for some products (e.g., mining, forestry, fishing, and waste and scrap) is not available.
$176$225 $206 $212
$275
$355
$429
$499
$650
2000 2001 2002 2003 2004 2005 2006 2007 2008
Estimated Growth in Exports from Illinois’ 9th Congressional District, 2000–08
Exports to China: 270% Exports to Rest of World: 56%
Illinois' 9th Congressional District: Exports to China ($ million)

© 2009, The US-China Business Council
Sources: The Trade Partnership from US Census Bureau and US Department of Agriculture data.
Illinois’ Top Exports to China, 2008 IL-10: Top Exports to China, 2008* 1. Machinery (except Electrical) $533 million 1. Computers & Electronics $194 million
2. Waste & Scrap $413 million 2. Electrical Equipment $154 million
3. Computers & Electronics $342 million 3. Chemicals $146 million
4. Electrical Equipment $308 million 4. Machinery (except Electrical) $107 million
5. Chemicals $269 million 5. Transportation Equipment $43 million * The data for IL-10 reflect the combined exports of Cook and Lake counties. The figures may understate the IL-10 district’s total exports to China because county-specific information for some products (e.g., mining, forestry, fishing, and waste and scrap) is not available.
$210$270 $246 $254
$330
$425
$514
$598
$780
2000 2001 2002 2003 2004 2005 2006 2007 2008
Estimated Growth in Exports from Illinois’ 10th Congressional District, 2000–08
Exports to China: 271% Exports to Rest of World: 56%
Illinois' 10th Congressional District: Exports to China ($ million)

© 2009, The US-China Business Council
Sources: The Trade Partnership from US Census Bureau and US Department of Agriculture data.
Illinois’ Top Exports to China, 2008 IL-11: Top Exports to China, 2008* 1. Machinery (except Electrical) $533 million 1. Other Manufacturing $84 million
2. Waste & Scrap $413 million 2. Chemicals $38 million
3. Computers & Electronics $342 million 3. Crop Production $33 million
4. Electrical Equipment $308 million 4. Computers & Electronics $32 million
5. Chemicals $269 million 5. Machinery (except Electrical) $20 million * The data for IL-11 reflect the combined exports of Bureau, Grundy, Kankakee, La Salle, Livingston, McLean, Will, and Woodford counties. The figures may understate the IL-11 district’s total exports to China because county-specific information for some products (e.g., mining, forestry, fishing, and waste and scrap) is not available.
$50$64 $61 $61
$79
$102
$123
$157
$218
2000 2001 2002 2003 2004 2005 2006 2007 2008
Estimated Growth in Exports from Illinois’ 11th Congressional District, 2000–08
Exports to China: 335% Exports to Rest of World: 66%
Illinois' 11th Congressional District: Exports to China ($ million)

© 2009, The US-China Business Council
Sources: The Trade Partnership from US Census Bureau and US Department of Agriculture data.
Illinois’ Top Exports to China, 2008 IL-12: Top Exports to China, 2008* 1. Machinery (except Electrical) $533 million 1. Other Manufacturing $92 million
2. Waste & Scrap $413 million 2. Crop Production $10 million
3. Computers & Electronics $342 million 3. Machinery (except Electrical) $9 million
4. Electrical Equipment $308 million 4. Chemicals $5 million
5. Chemicals $269 million 5. Fabricated Metal Products $2 million * The data for IL-12 reflect the combined exports of Alexander, Franklin, Jackson, Madison, Monroe, Perry, Pulaski, Randolph, St. Clair, Union, and Williamson counties. The figures may understate the IL-12 district’s total exports to China because county-specific information for some products (e.g., mining, forestry, fishing, and waste and scrap) is not available.
$30$38 $35 $36
$47
$60
$73
$89
$120
2000 2001 2002 2003 2004 2005 2006 2007 2008
Estimated Growth in Exports from Illinois’ 12th Congressional District, 2000–08
Exports to China: 302% Exports to Rest of World: 61%
Illinois' 12th Congressional District: Exports to China ($ million)

© 2009, The US-China Business Council
Sources: The Trade Partnership from US Census Bureau and US Department of Agriculture data.
Illinois’ Top Exports to China, 2008 IL-13: Top Exports to China, 2008* 1. Machinery (except Electrical) $533 million 1. Computers & Electronics $242 million
2. Waste & Scrap $413 million 2. Machinery (except Electrical) $187 million
3. Computers & Electronics $342 million 3. Electrical Equipment $139 million
4. Electrical Equipment $308 million 4. Chemicals $98 million
5. Chemicals $269 million 5. Transportation Equipment $49 million * The data for IL-13 reflect the combined exports of Cook, DuPage, and Will counties. The figures may understate the IL-13 district’s total exports to China because county-specific information for some products (e.g., mining, forestry, fishing, and waste and scrap) is not available.
$238$305
$278 $287
$373
$480
$581
$676
$883
2000 2001 2002 2003 2004 2005 2006 2007 2008
Estimated Growth in Exports from Illinois’ 13th Congressional District, 2000–08
Exports to China: 272% Exports to Rest of World: 56%
Illinois' 13th Congressional District: Exports to China ($ million)

© 2009, The US-China Business Council
Sources: The Trade Partnership from US Census Bureau and US Department of Agriculture data.
Illinois’ Top Exports to China, 2008 IL-14: Top Exports to China, 2008* 1. Machinery (except Electrical) $533 million 1. Machinery (except Electrical) $107 million
2. Waste & Scrap $413 million 2. Computers & Electronics $66 million
3. Computers & Electronics $342 million 3. Electrical Equipment $36 million
4. Electrical Equipment $308 million 4. Crop Production $25 million
5. Chemicals $269 million 5. Chemicals $18 million * The data for IL-14 reflect the combined exports of Bureau, DeKalb, DuPage, Henry, Kane, Kendall, Lee, and Whiteside counties. The figures may understate the IL-14 district’s total exports to China because county-specific information for some products (e.g., mining, forestry, fishing, and waste and scrap) is not available.
$82$102 $94 $93
$123$148
$180
$226
$299
2000 2001 2002 2003 2004 2005 2006 2007 2008
Estimated Growth in Exports from Illinois’ 14th Congressional District, 2000–08
Exports to China: 266% Exports to Rest of World: 62%
Illinois' 14th Congressional District: Exports to China ($ million)

© 2009, The US-China Business Council
Sources: The Trade Partnership from US Census Bureau and US Department of Agriculture data.
Illinois’ Top Exports to China, 2008 IL-15: Top Exports to China, 2008* 1. Machinery (except Electrical) $533 million 1. Other Manufacturing $183 million
2. Waste & Scrap $413 million 2. Crop Production $51 million
3. Computers & Electronics $342 million 3. Machinery (except Electrical) $3 million
4. Electrical Equipment $308 million 4. Fabricated Metal Products $2 million
5. Chemicals $269 million 5. Processed Foods $1 million * The data for IL-15 reflect the combined exports of Champaign, Clark, Coles, Crawford, Cumberland, De Witt, Douglas, Edgar, Edwards, Ford, Gallatin, Iroquois, Lawrence, Livingston, Macon, McLean, Moultrie, Piatt, Saline, Vermilion, Wabash, and White counties. The figures may understate the IL-15 district’s total exports to China because county-specific information for some products (e.g., mining, forestry, fishing, and waste and scrap) is not available.
$52$67 $64 $63
$81
$106$128
$170
$243
2000 2001 2002 2003 2004 2005 2006 2007 2008
Estimated Growth in Exports from Illinois’ 15th Congressional District, 2000–08
Exports to China: 367% Exports to Rest of World: 71%
Illinois' 15th Congressional District: Exports to China ($ million)

© 2009, The US-China Business Council
Sources: The Trade Partnership from US Census Bureau and US Department of Agriculture data.
Illinois’ Top Exports to China, 2008 IL-16: Top Exports to China, 2008* 1. Machinery (except Electrical) $533 million 1. Other Manufacturing $77 million
2. Waste & Scrap $413 million 2. Electrical Equipment $37 million
3. Computers & Electronics $342 million 3. Machinery (except Electrical) $26 million
4. Electrical Equipment $308 million 4. Crop Production $20 million
5. Chemicals $269 million 5. Computers & Electronics $10 million * The data for IL-16 reflect the combined exports of Boone, Carroll, DeKalb, Jo Daviess, McHenry, Ogle, Stephenson, Whiteside, and Winnebago counties. The figures may understate the IL-16 district’s total exports to China because county-specific information for some products (e.g., mining, forestry, fishing, and waste and scrap) is not available.
$46$59 $55 $56
$73
$94
$114
$141
$192
2000 2001 2002 2003 2004 2005 2006 2007 2008
Estimated Growth in Exports from Illinois’ 16th Congressional District, 2000–08
Exports to China: 313% Exports to Rest of World: 63%
Illinois' 16th Congressional District: Exports to China ($ million)
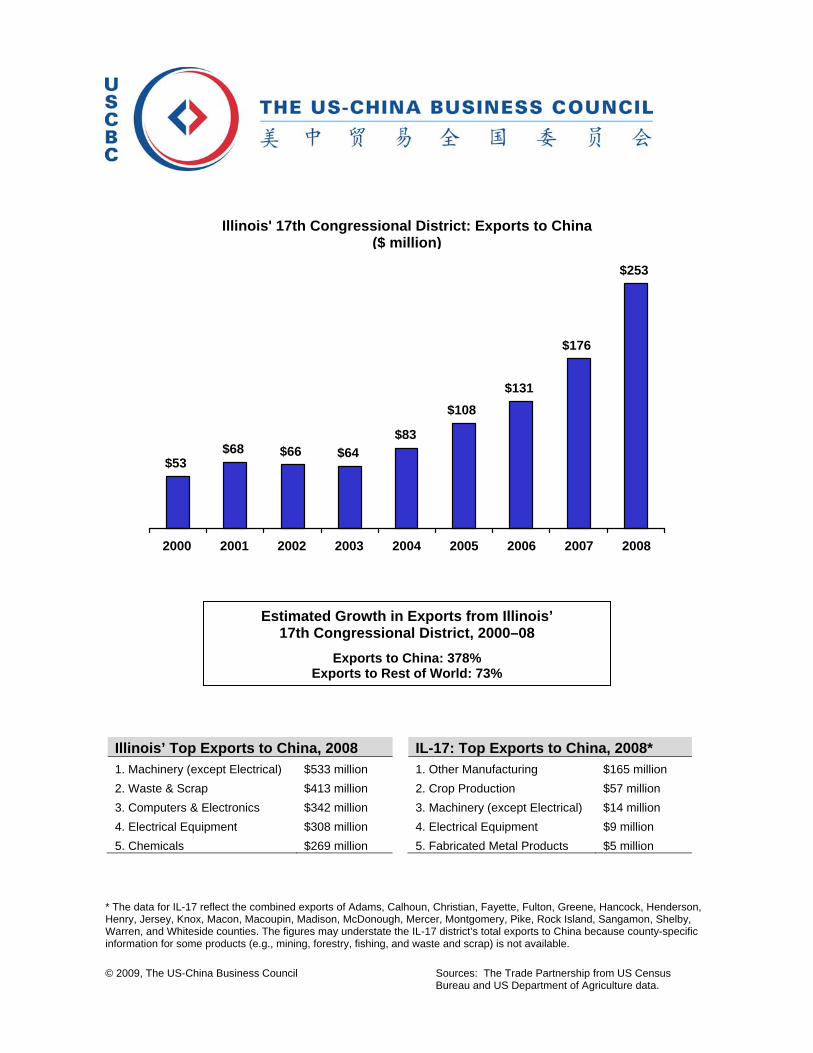
© 2009, The US-China Business Council
Sources: The Trade Partnership from US Census Bureau and US Department of Agriculture data.
Illinois’ Top Exports to China, 2008 IL-17: Top Exports to China, 2008* 1. Machinery (except Electrical) $533 million 1. Other Manufacturing $165 million
2. Waste & Scrap $413 million 2. Crop Production $57 million
3. Computers & Electronics $342 million 3. Machinery (except Electrical) $14 million
4. Electrical Equipment $308 million 4. Electrical Equipment $9 million
5. Chemicals $269 million 5. Fabricated Metal Products $5 million * The data for IL-17 reflect the combined exports of Adams, Calhoun, Christian, Fayette, Fulton, Greene, Hancock, Henderson, Henry, Jersey, Knox, Macon, Macoupin, Madison, McDonough, Mercer, Montgomery, Pike, Rock Island, Sangamon, Shelby, Warren, and Whiteside counties. The figures may understate the IL-17 district’s total exports to China because county-specific information for some products (e.g., mining, forestry, fishing, and waste and scrap) is not available.
$53$68 $66 $64
$83
$108$131
$176
$253
2000 2001 2002 2003 2004 2005 2006 2007 2008
Estimated Growth in Exports from Illinois’ 17th Congressional District, 2000–08
Exports to China: 378% Exports to Rest of World: 73%
Illinois' 17th Congressional District: Exports to China ($ million)

© 2009, The US-China Business Council
Sources: The Trade Partnership from US Census Bureau and US Department of Agriculture data.
Illinois’ Top Exports to China, 2008 IL-18: Top Exports to China, 2008* 1. Machinery (except Electrical) $533 million 1. Other Manufacturing $112 million
2. Waste & Scrap $413 million 2. Crop Production $46 million
3. Computers & Electronics $342 million 3. Chemicals $8 million
4. Electrical Equipment $308 million 4. Machinery (except Electrical) $7 million
5. Chemicals $269 million 5. Fabricated Metal Products $3 million * The data for IL-18 reflect the combined exports of Adams, Brown, Bureau, Cass, Knox, Logan, Macon, Marshall, Mason, Menard, Morgan, Peoria, Pike, Putnam, Sangamon, Schuyler, Scott, Stark, Tazewell, and Woodford counties. The figures may understate the IL-18 district’s total exports to China because county-specific information for some products (e.g., mining, forestry, fishing, and waste and scrap) is not available.
$35$45 $44 $43
$55
$72$87
$121
$177
2000 2001 2002 2003 2004 2005 2006 2007 2008
Estimated Growth in Exports from Illinois’ 18th Congressional District, 2000–08
Exports to China: 401% Exports to Rest of World: 76%
Illinois' 18th Congressional District: Exports to China ($ million)

© 2009, The US-China Business Council
Sources: The Trade Partnership from US Census Bureau and US Department of Agriculture data.
Illinois’ Top Exports to China, 2008 IL-19: Top Exports to China, 2008* 1. Machinery (except Electrical) $533 million 1. Other Manufacturing $118 million
2. Waste & Scrap $413 million 2. Crop Production $39 million
3. Computers & Electronics $342 million 3. Machinery (except Electrical) $5 million
4. Electrical Equipment $308 million 4. Animal Production $2 million
5. Chemicals $269 million 5. Fabricated Metal Products $2 million * The data for IL-19 reflect the combined exports of Bond, Christian, Clay, Clinton, Edwards, Effingham, Fayette, Gallatin, Greene, Hamilton, Hardin, Jasper, Jefferson, Jersey, Johnson, Lawrence, Madison, Marion, Massac, Montgomery, Pope, Richland, Saline, Sangamon, Shelby, Wabash, Washington, Wayne, White, and Williamson counties. The figures may understate the IL-19 district’s total exports to China because county-specific information for some products (e.g., mining, forestry, fishing, and waste and scrap) is not available.
$35$44 $43 $42
$54
$70
$85
$116
$167
2000 2001 2002 2003 2004 2005 2006 2007 2008
Estimated Growth in Exports from Illinois’ 19th Congressional District, 2000–08
Exports to China: 383% Exports to Rest of World: 73%
Illinois' 19th Congressional District: Exports to China ($ million)

© 2009, The US-China Business Council
Sources: The Trade Partnership from US Census Bureau and US Department of Agriculture data.
Indiana’s Top Exports to China, 2008 IN-1: Top Exports to China, 2008* 1. Machinery (except Electrical) $187 million 1. Other Manufacturing $83 million
2. Chemicals $159 million 2. Crop Production $2 million
3. Computers & Electronics $112 million 3. Machinery (except Electrical) $2 million
4. Waste & Scrap $93 million 4. Fabricated Metal Products $2 million
5. Primary Metal Manufacturing $81 million 5. Plastics & Rubber Products $286,000 * The data for IN-1 reflect the combined exports of Benton, Jasper, Lake, Newton, and Porter counties. The figures may understate the IN-1 district’s total exports to China because county-specific information for some products (e.g., mining, forestry, fishing, and waste and scrap) is not available.
$18$22 $20
$25$31
$44
$59
$74
$90
2000 2001 2002 2003 2004 2005 2006 2007 2008
Estimated Growth in Exports from Indiana’s 1st Congressional District, 2000–08
Exports to China: 393% Exports to Rest of World: 68%
Indiana’s 1st Congressional District: Exports to China ($ million)

© 2009, The US-China Business Council
Sources: The Trade Partnership from US Census Bureau and US Department of Agriculture data.
Indiana’s Top Exports to China, 2008 IN-2: Top Exports to China, 2008* 1. Machinery (except Electrical) $187 million 1. Other Manufacturing $75 million
2. Chemicals $159 million 2. Machinery (except Electrical) $13 million
3. Computers & Electronics $112 million 3. Transportation Equipment $10 million
4. Waste & Scrap $93 million 4. Fabricated Metal Products $6 million
5. Primary Metal Manufacturing $81 million 5. Crop Production $5 million * The data for IN-2 reflect the combined exports of Carroll, Cass, Elkhart, Fulton, Howard, LaPorte, Marshall, Porter, Pulaski, St. Joseph, Starke, and White counties. The figures may understate the IN-2 district’s total exports to China because county-specific information for some products (e.g., mining, forestry, fishing, and waste and scrap) is not available.
$26$31 $29
$36$45
$64
$86
$108
$132
2000 2001 2002 2003 2004 2005 2006 2007 2008
Estimated Growth in Exports from Indiana’s 2nd Congressional District, 2000–08
Exports to China: 398% Exports to Rest of World: 68%
Indiana’s 2nd Congressional District: Exports to China ($ million)

© 2009, The US-China Business Council
Sources: The Trade Partnership from US Census Bureau and US Department of Agriculture data.
Indiana’s Top Exports to China, 2008 IN-3: Top Exports to China, 2008* 1. Machinery (except Electrical) $187 million 1. Other Manufacturing $84 million
2. Chemicals $159 million 2. Machinery (except Electrical) $20 million
3. Computers & Electronics $112 million 3. Transportation Equipment $14 million
4. Waste & Scrap $93 million 4. Miscellaneous Manufacturing $13 million
5. Primary Metal Manufacturing $81 million 5. Primary Metal Manufacturing $12 million * The data for IN-3 reflect the combined exports of Allen, DeKalb, Elkhart, Kosciusko, LaGrange, Noble, Steuben, and Whitley counties. The figures may understate the IN-3 district’s total exports to China because county-specific information for some products (e.g., mining, forestry, fishing, and waste and scrap) is not available.
$34$41 $38
$46$58
$83
$111
$138
$166
2000 2001 2002 2003 2004 2005 2006 2007 2008
Estimated Growth in Exports from Indiana’s 3rd Congressional District, 2000–08
Exports to China: 387% Exports to Rest of World: 68%
Indiana’s 3rd Congressional District: Exports to China ($ million)

© 2009, The US-China Business Council
Sources: The Trade Partnership from US Census Bureau and US Department of Agriculture data.
Indiana’s Top Exports to China, 2008 IN-4: Top Exports to China, 2008* 1. Machinery (except Electrical) $187 million 1. Chemicals $81 million
2. Chemicals $159 million 2. Machinery (except Electrical) $48 million
3. Computers & Electronics $112 million 3. Other Manufacturing $15 million
4. Waste & Scrap $93 million 4. Computers & Electronics $12 million
5. Primary Metal Manufacturing $81 million 5. Transportation Equipment $9 million * The data for IN-4 reflect the combined exports of Boone, Clinton, Fountain, Hendricks, Johnson, Lawrence, Marion, Monroe, Montgomery, Morgan, Tippecanoe, and White counties. The figures may understate the IN-4 district’s total exports to China because county-specific information for some products (e.g., mining, forestry, fishing, and waste and scrap) is not available.
$38$45 $42
$51$64
$92
$122
$153
$185
2000 2001 2002 2003 2004 2005 2006 2007 2008
Estimated Growth in Exports from Indiana’s 4th Congressional District, 2000–08
Exports to China: 392% Exports to Rest of World: 67%
Indiana’s 4th Congressional District: Exports to China ($ million)

© 2009, The US-China Business Council
Sources: The Trade Partnership from US Census Bureau and US Department of Agriculture data.
Indiana’s Top Exports to China, 2008 IN-5: Top Exports to China, 2008* 1. Machinery (except Electrical) $187 million 1. Chemicals $79 million
2. Chemicals $159 million 2. Machinery (except Electrical) $52 million
3. Computers & Electronics $112 million 3. Computers & Electronics $15 million
4. Waste & Scrap $93 million 4. Transportation Equipment $11 million
5. Primary Metal Manufacturing $81 million 5. Primary Metal Manufacturing $5 million * The data for IN-5 reflect the combined exports of Grant, Hamilton, Hancock, Howard, Huntington, Johnson, Marion, Miami, Shelby, Tipton, and Wabash counties. The figures may understate the IN-5 district’s total exports to China because county-specific information for some products (e.g., mining, forestry, fishing, and waste and scrap) is not available.
$44$56
$49 $49
$66
$94
$113
$140
$178
2000 2001 2002 2003 2004 2005 2006 2007 2008
Estimated Growth in Exports from Indiana’s 5th Congressional District, 2000–08
Exports to China: 304% Exports to Rest of World: 67%
Indiana’s 5th Congressional District: Exports to China ($ million)

© 2009, The US-China Business Council
Sources: The Trade Partnership from US Census Bureau and US Department of Agriculture data.
Indiana’s Top Exports to China, 2008 IN-6: Top Exports to China, 2008* 1. Machinery (except Electrical) $187 million 1. Other Manufacturing $99 million
2. Chemicals $159 million 2. Machinery (except Electrical) $18 million
3. Computers & Electronics $112 million 3. Transportation Equipment $7 million
4. Waste & Scrap $93 million 4. Crop Production $7 million
5. Primary Metal Manufacturing $81 million 5. Primary Metal Manufacturing $5 million * The data for IN-6 reflect the combined exports of Adams, Allen, Bartholomew, Blackford, Dearborn, Decatur, Delaware, Fayette, Franklin, Henry, Jay, Johnson, Madison, Randolph, Rush, Shelby, Union, Wayne, and Wells counties. The figures may understate the IN-6 district’s total exports to China because county-specific information for some products (e.g., mining, forestry, fishing, and waste and scrap) is not available.
$29$34 $32
$39$49
$70
$93
$119
$145
2000 2001 2002 2003 2004 2005 2006 2007 2008
Estimated Growth in Exports from Indiana’s 6th Congressional District, 2000–08
Exports to China: 402% Exports to Rest of World: 68%
Indiana’s 6th Congressional District: Exports to China ($ million)

© 2009, The US-China Business Council
Sources: The Trade Partnership from US Census Bureau and US Department of Agriculture data.
Indiana’s Top Exports to China, 2008 IN-7: Top Exports to China, 2008* 1. Machinery (except Electrical) $187 million 1. Chemicals $79 million
2. Chemicals $159 million 2. Machinery (except Electrical) $45 million
3. Computers & Electronics $112 million 3. Computers & Electronics $8 million
4. Waste & Scrap $93 million 4. Transportation Equipment $8 million
5. Primary Metal Manufacturing $81 million 5. Fabricated Metal Products $3 million * The data for IN-7 reflect the exports of Marion County, which also includes other congressional districts. The figures may understate the IN-7 district’s total exports to China because county-specific information for some products (e.g., mining, forestry, fishing, and waste and scrap) is not available.
$39$51
$44 $42
$57
$83
$98
$119
$151
2000 2001 2002 2003 2004 2005 2006 2007 2008
Estimated Growth in Exports from Indiana’s 7th Congressional District, 2000–08
Exports to China: 285% Exports to Rest of World: 66%
Indiana’s 7th Congressional District: Exports to China ($ million)

© 2009, The US-China Business Council
Sources: The Trade Partnership from US Census Bureau and US Department of Agriculture data.
Indiana’s Top Exports to China, 2008 IN-8: Top Exports to China, 2008* 1. Machinery (except Electrical) $187 million 1. Other Manufacturing $51 million
2. Chemicals $159 million 2. Crop Production $5 million
3. Computers & Electronics $112 million 3. Processed Foods $2 million
4. Waste & Scrap $93 million 4. Plastics & Rubber Products $702,000
5. Primary Metal Manufacturing $81 million 5. Fabricated Metal Products $222,000 * The data for IN-8 reflect the combined exports of Clay, Daviess, Fountain, Gibson, Greene, Knox, Martin, Owen, Parke, Pike, Posey, Putnam, Sullivan, Vanderburgh, Vermillion, Vigo, Warren, and Warrick counties. The figures may understate the IN-8 district’s total exports to China because county-specific information for some products (e.g., mining, forestry, fishing, and waste and scrap) is not available. Figures are rounded.
$11 $13 $12$15
$19
$27
$36
$47
$58
2000 2001 2002 2003 2004 2005 2006 2007 2008
Estimated Growth in Exports from Indiana’s 8th Congressional District, 2000–08
Exports to China: 421% Exports to Rest of World: 68%
Indiana’s 8th Congressional District: Exports to China ($ million)

© 2009, The US-China Business Council
Sources: The Trade Partnership from US Census Bureau and US Department of Agriculture data.
Indiana’s Top Exports to China, 2008 IN-9: Top Exports to China, 2008* 1. Machinery (except Electrical) $187 million 1. Other Manufacturing $61 million
2. Chemicals $159 million 2. Machinery (except Electrical) $6 million
3. Computers & Electronics $112 million 3. Transportation Equipment $4 million
4. Waste & Scrap $93 million 4. Crop Production $2 million
5. Primary Metal Manufacturing $81 million 5. Furniture & Related Products $826,000 * The data for IN-9 reflect the combined exports of Bartholomew, Brown, Clark, Crawford, Dearborn, Dubois, Floyd, Harrison, Jackson, Jefferson, Jennings, Monroe, Ohio, Orange, Perry, Ripley, Scott, Spencer, Switzerland, and Washington counties. The figures may understate the IN-9 district’s total exports to China because county-specific information for some products (e.g., mining, forestry, fishing, and waste and scrap) is not available.
$15$18 $17
$21$26
$37
$49
$62
$75
2000 2001 2002 2003 2004 2005 2006 2007 2008
Estimated Growth in Exports from Indiana’s 9th Congressional District, 2000–08
Exports to China: 395% Exports to Rest of World: 68%
Indiana’s 9th Congressional District: Exports to China ($ million)

© 2009, The US-China Business Council
Sources: The Trade Partnership from US Census Bureau and US Department of Agriculture data.
Iowa’s Top Exports to China, 2008 IA-1: Top Exports to China, 2008* 1. Processed Foods $73 million 1. Other Manufacturing $45 million
2. Waste & Scrap $69 million 2. Processed Foods $8 million
3. Machinery (except Electrical) $56 million 3. Machinery (except Electrical) $4 million
4. Computers & Electronics $32 million 4. Fabricated Metal Products $3 million
5. Primary Metal Manufacturing $30 million 5. Crop Production $2 million * The data for IA-1 reflect the combined exports of Black Hawk, Bremer, Buchanan, Butler, Clayton, Clinton, Delaware, Dubuque, Fayette, Jackson, Jones, and Scott counties. The figures may understate the IA-1 district’s total exports to China because county-specific information for some products (e.g., mining, forestry, fishing, and waste and scrap) is not available.
$10
$18 $17$20
$28
$40 $42$47
$65
2000 2001 2002 2003 2004 2005 2006 2007 2008
Estimated Growth in Exports from Iowa’s 1st Congressional District, 2000–08
Exports to China: 556% Exports to Rest of World: 158%
Iowa's 1st Congressional District: Exports to China ($ million)

© 2009, The US-China Business Council
Sources: The Trade Partnership from US Census Bureau and US Department of Agriculture data.
Iowa’s Top Exports to China, 2008 IA-2: Top Exports to China, 2008* 1. Processed Foods $73 million 1. Other Manufacturing $51 million
2. Waste & Scrap $69 million 2. Crop Production $2 million
3. Machinery (except Electrical) $56 million 3. Processed Foods $1 million
4. Computers & Electronics $32 million 4. Fabricated Metal Products $838,000
5. Primary Metal Manufacturing $30 million 5. Animal Production $779,000 * The data for IA-2 reflect the combined exports of Appanoose, Cedar, Davis, Des Moines, Henry, Jefferson, Johnson, Lee, Linn, Louisa, Muscatine, Van Buren, Wapello, Washington, and Wayne counties. The figures may understate the IA-2 district’s total exports to China because county-specific information for some products (e.g., mining, forestry, fishing, and waste and scrap) is not available.
$9
$16 $15$18
$25
$35$37
$41
$56
2000 2001 2002 2003 2004 2005 2006 2007 2008
Estimated Growth in Exports from Iowa’s 2nd Congressional District, 2000–08
Exports to China: 554% Exports to Rest of World: 157%
Iowa's 2nd Congressional District: Exports to China ($ million)
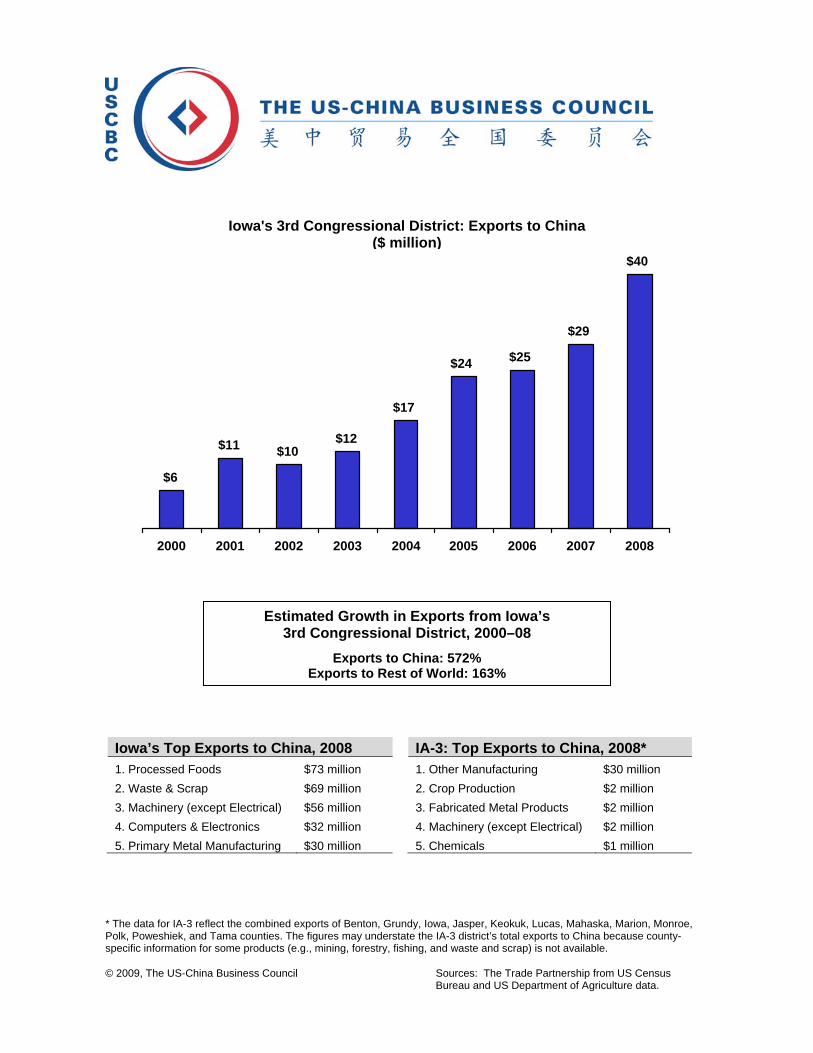
© 2009, The US-China Business Council
Sources: The Trade Partnership from US Census Bureau and US Department of Agriculture data.
Iowa’s Top Exports to China, 2008 IA-3: Top Exports to China, 2008* 1. Processed Foods $73 million 1. Other Manufacturing $30 million
2. Waste & Scrap $69 million 2. Crop Production $2 million
3. Machinery (except Electrical) $56 million 3. Fabricated Metal Products $2 million
4. Computers & Electronics $32 million 4. Machinery (except Electrical) $2 million
5. Primary Metal Manufacturing $30 million 5. Chemicals $1 million * The data for IA-3 reflect the combined exports of Benton, Grundy, Iowa, Jasper, Keokuk, Lucas, Mahaska, Marion, Monroe, Polk, Poweshiek, and Tama counties. The figures may understate the IA-3 district’s total exports to China because county-specific information for some products (e.g., mining, forestry, fishing, and waste and scrap) is not available.
$6
$11 $10$12
$17
$24 $25
$29
$40
2000 2001 2002 2003 2004 2005 2006 2007 2008
Estimated Growth in Exports from Iowa’s 3rd Congressional District, 2000–08
Exports to China: 572% Exports to Rest of World: 163%
Iowa's 3rd Congressional District: Exports to China ($ million)
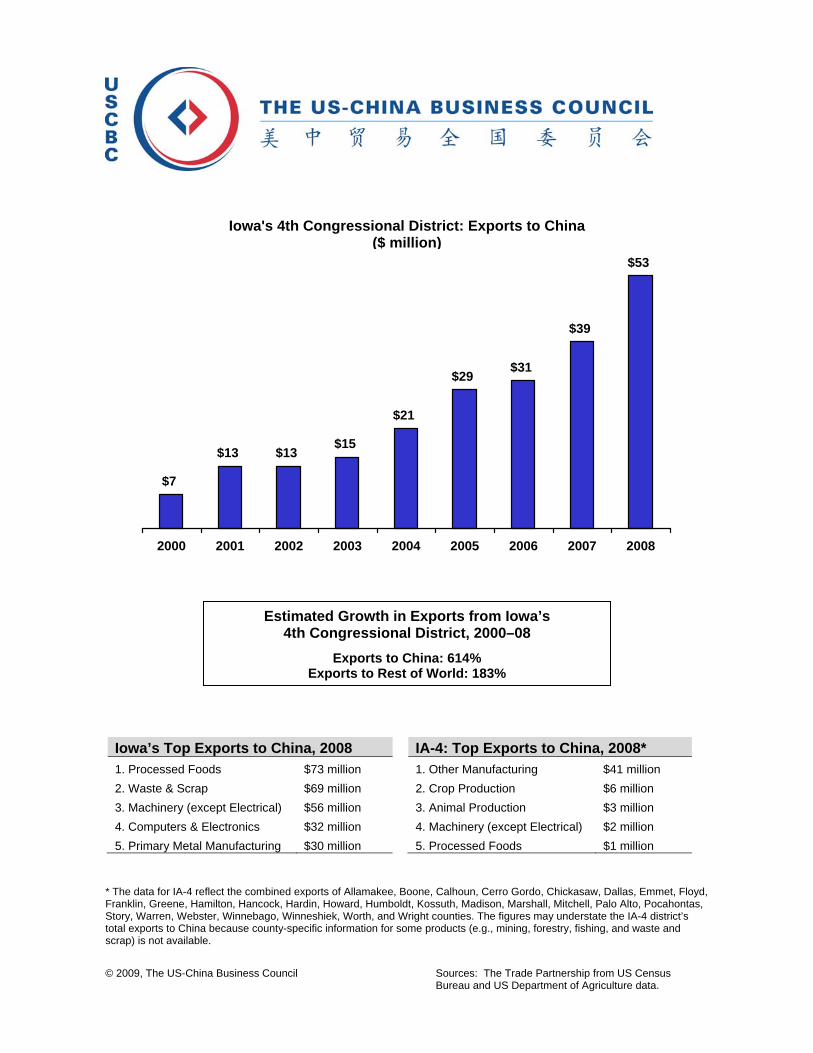
© 2009, The US-China Business Council
Sources: The Trade Partnership from US Census Bureau and US Department of Agriculture data.
Iowa’s Top Exports to China, 2008 IA-4: Top Exports to China, 2008* 1. Processed Foods $73 million 1. Other Manufacturing $41 million
2. Waste & Scrap $69 million 2. Crop Production $6 million
3. Machinery (except Electrical) $56 million 3. Animal Production $3 million
4. Computers & Electronics $32 million 4. Machinery (except Electrical) $2 million
5. Primary Metal Manufacturing $30 million 5. Processed Foods $1 million * The data for IA-4 reflect the combined exports of Allamakee, Boone, Calhoun, Cerro Gordo, Chickasaw, Dallas, Emmet, Floyd, Franklin, Greene, Hamilton, Hancock, Hardin, Howard, Humboldt, Kossuth, Madison, Marshall, Mitchell, Palo Alto, Pocahontas, Story, Warren, Webster, Winnebago, Winneshiek, Worth, and Wright counties. The figures may understate the IA-4 district’s total exports to China because county-specific information for some products (e.g., mining, forestry, fishing, and waste and scrap) is not available.
$7
$13 $13$15
$21
$29$31
$39
$53
2000 2001 2002 2003 2004 2005 2006 2007 2008
Estimated Growth in Exports from Iowa’s 4th Congressional District, 2000–08
Exports to China: 614% Exports to Rest of World: 183%
Iowa's 4th Congressional District: Exports to China ($ million)

© 2009, The US-China Business Council
Sources: The Trade Partnership from US Census Bureau and US Department of Agriculture data.
Iowa’s Top Exports to China, 2008 IA-5: Top Exports to China, 2008* 1. Processed Foods $73 million 1. Other Manufacturing $19 million
2. Waste & Scrap $69 million 2. Processed Foods $11 million
3. Machinery (except Electrical) $56 million 3. Crop Production $6 million
4. Computers & Electronics $32 million 4. Animal Production $4 million
5. Primary Metal Manufacturing $30 million 5. Machinery (except Electrical) $1 million * The data for IA-5 reflect the combined exports of Adair, Adams, Audubon, Buena Vista, Carroll, Cass, Cherokee, Clarke, Clay, Crawford, Decatur, Dickinson, Fremont, Guthrie, Harrison, Ida, Lyon, Mills, Monona, Montgomery, O’Brien, Osceola, Page, Plymouth, Pottawattamie, Ringgold, Sac, Shelby, Sioux, Taylor, Union, and Woodbury counties. The figures may understate the IA-5 district’s total exports to China because county-specific information for some products (e.g., mining, forestry, fishing, and waste and scrap) is not available.
$6
$10 $10$12
$15
$22 $23
$30
$42
2000 2001 2002 2003 2004 2005 2006 2007 2008
Estimated Growth in Exports from Iowa’s 5th Congressional District, 2000–08
Exports to China: 630% Exports to Rest of World: 191%
Iowa's 5th Congressional District: Exports to China ($ million)

© 2009, The US-China Business Council
Sources: The Trade Partnership from US Census Bureau and US Department of Agriculture data.
Kansas’ Top Exports to China, 2008 KS-1: Top Exports to China, 2008* 1. Processed Foods $195 million 1. Other Manufacturing $34 million
2. Transportation Equipment $60 million 2. Processed Foods $26 million
3. Waste & Scrap $57 million 3. Machinery (except Electrical) $3 million
4. Special Classification Provisions $60 million 4. Crop Production $1 million
5. Computer & Electronics $46 million 5. Plastics & Rubber Products $438,000 * The data for KS-1 reflect the combined exports of Barber, Barton, Chase, Cheyenne, Clark, Clay, Cloud, Comanche, Decatur, Dickinson, Edwards, Ellis, Ellsworth, Finney, Ford, Geary, Gove, Graham, Grant, Gray, Greeley, Greenwood, Hamilton, Haskell, Hodgeman, Jewell, Kearny, Kiowa, Lane, Lincoln, Logan, Lyon, Marion, Marshall, McPherson, Meade, Mitchell, Morris, Morton, Nemaha, Ness, Norton, Osborne, Ottawa, Pawnee, Phillips, Pratt, Rawlins, Reno, Republic, Rice , Rooks, Rush, Russell, Saline, Scott, Seward, Sheridan, Sherman, Smith, Stafford, Stanton, Stevens, Thomas, Trego, Wabaunsee, Wallace, Washington, and Wichita counties. The figures may understate the KS-1 district’s total exports to China because county-specific information for some products (e.g., mining, forestry, fishing, and waste and scrap) is not available.
$20
$41
$31$26
$32
$46$51
$68$65
2000 2001 2002 2003 2004 2005 2006 2007 2008
Estimated Growth in Exports from Kansas’ 1st Congressional District, 2000–08
Exports to China: 222% Exports to Rest of World: 181%
Kansas' 1st Congressional District: Exports to China ($ million)

© 2009, The US-China Business Council
Sources: The Trade Partnership from US Census Bureau and US Department of Agriculture data.
Kansas’ Top Exports to China, 2008 KS-2: Top Exports to China, 2008* 1. Processed Foods $195 million 1. Other Manufacturing $45 million
2. Transportation Equipment $60 million 2. Machinery (except Electrical) $565,000
3. Waste & Scrap $57 million 3. Crop Production $308,000
4. Special Classification Provisions $60 million 4. Transportation Equipment $259,000
5. Computer & Electronics $46 million 5. Fabricated Metal Products $243,000 * The data for KS-2 reflect the combined exports of Allen, Anderson, Atchison, Bourbon, Brown, Cherokee, Coffey, Crawford, Doniphan, Douglas, Franklin, Geary, Jackson, Jefferson, Labette, Leavenworth, Linn, Miami, Nemaha, Neosho, Osage, Pottawatomie, Riley, Shawnee, Wilson, and Woodson counties. The figures may understate the KS-2 district’s total exports to China because county-specific information for some products (e.g., mining, forestry, fishing, and waste and scrap) is not available.
$14
$29
$22$19
$23
$33$37
$49$46
2000 2001 2002 2003 2004 2005 2006 2007 2008
Estimated Growth in Exports from Kansas’ 2nd Congressional District, 2000–08
Exports to China: 230% Exports to Rest of World: 144%
Kansas' 2nd Congressional District: Exports to China ($ million)

© 2009, The US-China Business Council
Sources: The Trade Partnership from US Census Bureau and US Department of Agriculture data.
Kansas’ Top Exports to China, 2008 KS-3: Top Exports to China, 2008* 1. Processed Foods $195 million 1. Other Manufacturing $67 million
2. Transportation Equipment $60 million 2. Processed Foods $17 million
3. Waste & Scrap $57 million 3. Nonmetallic Mineral Products $4 million
4. Special Classification Provisions $60 million 4. Machinery (except Electrical) $4 million
5. Computer & Electronics $46 million 5. Printing & Related Products $737,000
* The data for KS-3 reflects the combined exports of Douglas, Johnson, and Wyandotte counties. The figures may understate the KS-3 district’s total exports to China because county-specific information for some products (e.g., mining, forestry, fishing, and waste and scrap) is not available.
$28
$59
$46$39
$46
$68$75
$99$94
2000 2001 2002 2003 2004 2005 2006 2007 2008
Estimated Growth in Exports from Kansas’ 3rd Congressional District, 2000–08
Exports to China: 235% Exports to Rest of World: 122%
Kansas' 3rd Congressional District: Exports to China ($ million)

© 2009, The US-China Business Council
Sources: The Trade Partnership from US Census Bureau and US Department of Agriculture data.
Kansas’ Top Exports to China, 2008 KS-4: Top Exports to China, 2008* 1. Processed Foods $195 million 1. Other Manufacturing $94 million
2. Transportation Equipment $60 million 2. Transportation Equipment $38 million
3. Waste & Scrap $57 million 3. Processed Foods $12 million
4. Special Classification Provisions $60 million 4. Machinery (except Electrical) $6 million
5. Computer & Electronics $46 million 5. Fabricated Metal Products $481,000
* The data for KS-4 reflects the combined exports of Butler, Chautauqua, Cowley, Elk, Greenwood, Harper, Harvey, Kingman, Montgomery, Sedgwick, and Sumner counties. The figures may understate the KS-4 district’s total exports to China because county-specific information for some products (e.g., mining, forestry, fishing, and waste and scrap) is not available.
$45
$95
$73$62
$74
$108$120
$158$150
2000 2001 2002 2003 2004 2005 2006 2007 2008
Estimated Growth in Exports from Kansas’ 4th Congressional District, 2000–08
Exports to China: 234% Exports to Rest of World: 126%
Kansas' 4th Congressional District: Exports to China ($ million)

© 2009, The US-China Business Council
Sources: The Trade Partnership from US Census Bureau and US Department of Agriculture data.
Kentucky’s Top Exports to China, 2008
KY-1: Top Exports to China, 2008*
1. Chemicals $163 million 1. Other Manufacturing $40 million
2. Transportation Equipment $124 million 2. Chemicals $36 million
3. Machinery (except Electrical) $80 million 3. Crop Production $2 million
4. Computers & Electronics $52 million 4. Plastics & Rubber Products $579,000
5. Primary Metal Manufacturing $48 million 5. Fabricated Metal Products $492,000 * The data for KY-1 reflect the combined exports of Adair, Allen, Ballard, Butler, Caldwell, Calloway, Carlisle, Casey, Christian, Clinton, Crittenden, Cumberland, Fulton, Graves, Henderson, Hickman, Hopkins, Lincoln, Livingston, Logan, Lyon, Marshall, McCracken, McLean, Metcalfe, Monroe, Muhlenberg, Ohio, Russell, Simpson, Todd, Trigg, Union, and Webster counties. The figures may understate the KY-1 district’s total exports to China because county-specific information for some products (e.g., mining, forestry, fishing, and waste and scrap) is not available.
$8 $10$16
$30
$40$47 $49
$69
$79
2000 2001 2002 2003 2004 2005 2006 2007 2008
Estimated Growth in Exports from Kentucky’s 1st Congressional District, 2000–08
Exports to China: 893% Exports to Rest of World: 87%
Kentucky's 1st Congressional District: Exports to China ($ million)

© 2009, The US-China Business Council
Sources: The Trade Partnership from US Census Bureau and US Department of Agriculture data.
Kentucky’s Top Exports to China, 2008
KY-2: Top Exports to China, 2008*
1. Chemicals $163 million 1. Other Manufacturing $146 million
2. Transportation Equipment $124 million 2. Machinery (except Electrical) $17 million
3. Machinery (except Electrical) $80 million 3. Transportation Equipment $10 million
4. Computers & Electronics $52 million 4. Fabricated Metal Products $5 million
5. Primary Metal Manufacturing $48 million 5. Processed Foods $4 million * The data for KY-2 reflect the combined exports of Barren, Breckinridge, Bullitt, Daviess, Edmonson, Grayson, Green, Hancock, Hardin, Hart, Jefferson, LaRue, Marion, Meade, Nelson, Ohio, Shelby, Spencer, Taylor, Warren, and Washington counties. The figures may understate the KY-2 district’s total exports to China because county-specific information for some products (e.g., mining, forestry, fishing, and waste and scrap) is not available.
$19 $24$39
$70
$94
$115 $117
$167
$186
2000 2001 2002 2003 2004 2005 2006 2007 2008
Estimated Growth in Exports from Kentucky’s 2nd Congressional District, 2000–08
Exports to China: 878% Exports to Rest of World: 96%
Kentucky's 2nd Congressional District: Exports to China ($ million)

© 2009, The US-China Business Council
Sources: The Trade Partnership from US Census Bureau and US Department of Agriculture data.
Kentucky’s Top Exports to China, 2008
KY-3: Top Exports to China, 2008*
1. Chemicals $163 million 1. Other Manufacturing $113 million
2. Transportation Equipment $124 million 2. Machinery (except Electrical) $12 million
3. Machinery (except Electrical) $80 million 3. Fabricated Metal Products $4 million
4. Computers & Electronics $52 million 4. Processed Foods $4 million
5. Primary Metal Manufacturing $48 million 5. Nonmetallic Mineral Products $2 million * The data for KY-3 reflect the exports of Jefferson County, which also includes another congressional district. The figures may understate the KY-3 district’s total exports to China because county-specific information for some products (e.g., mining, forestry, fishing, and waste and scrap) is not available.
$14 $17$28
$50
$68
$84 $85
$122
$135
2000 2001 2002 2003 2004 2005 2006 2007 2008
Estimated Growth in Exports from Kentucky’s 3rd Congressional District, 2000–08
Exports to China: 874% Exports to Rest of World: 98%
Kentucky's 3rd Congressional District: Exports to China ($ million)
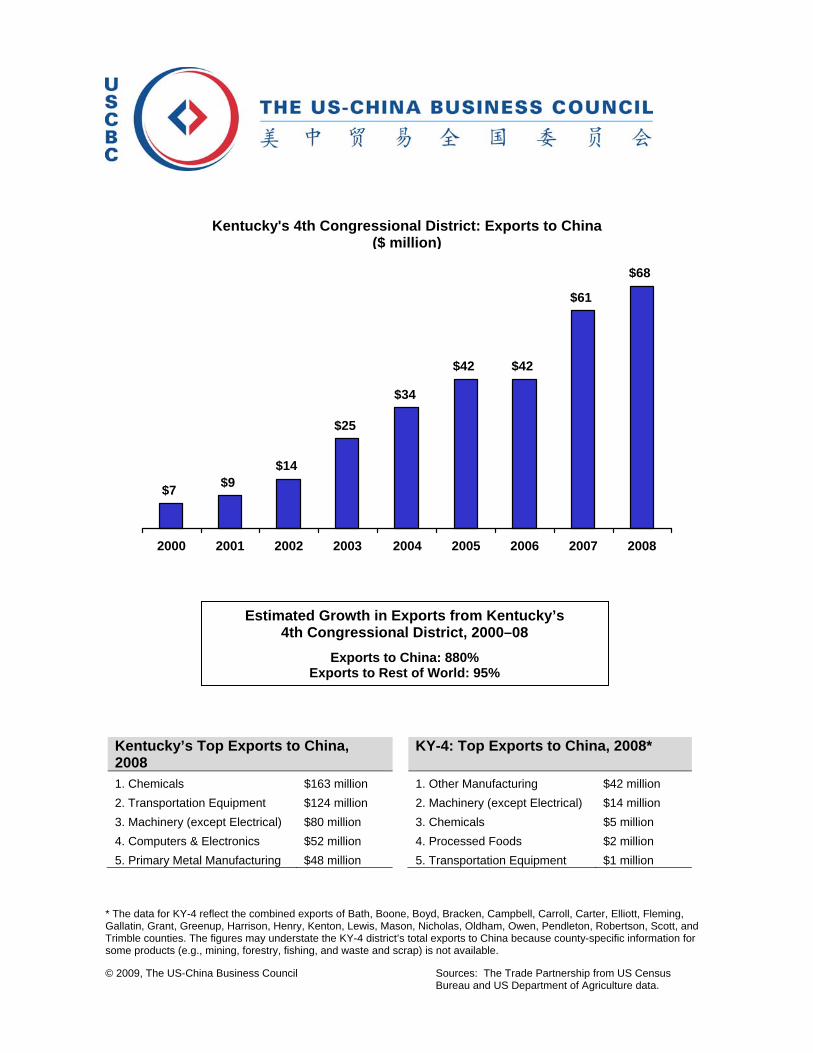
© 2009, The US-China Business Council
Sources: The Trade Partnership from US Census Bureau and US Department of Agriculture data.
Kentucky’s Top Exports to China, 2008
KY-4: Top Exports to China, 2008*
1. Chemicals $163 million 1. Other Manufacturing $42 million
2. Transportation Equipment $124 million 2. Machinery (except Electrical) $14 million
3. Machinery (except Electrical) $80 million 3. Chemicals $5 million
4. Computers & Electronics $52 million 4. Processed Foods $2 million
5. Primary Metal Manufacturing $48 million 5. Transportation Equipment $1 million * The data for KY-4 reflect the combined exports of Bath, Boone, Boyd, Bracken, Campbell, Carroll, Carter, Elliott, Fleming, Gallatin, Grant, Greenup, Harrison, Henry, Kenton, Lewis, Mason, Nicholas, Oldham, Owen, Pendleton, Robertson, Scott, and Trimble counties. The figures may understate the KY-4 district’s total exports to China because county-specific information for some products (e.g., mining, forestry, fishing, and waste and scrap) is not available.
$7 $9$14
$25
$34
$42 $42
$61
$68
2000 2001 2002 2003 2004 2005 2006 2007 2008
Estimated Growth in Exports from Kentucky’s 4th Congressional District, 2000–08
Exports to China: 880% Exports to Rest of World: 95%
Kentucky's 4th Congressional District: Exports to China ($ million)

© 2009, The US-China Business Council
Sources: The Trade Partnership from US Census Bureau and US Department of Agriculture data.
Kentucky’s Top Exports to China, 2008
KY-5: Top Exports to China, 2008*
1. Chemicals $163 million 1. Other Manufacturing $16 million
2. Transportation Equipment $124 million 2. Transportation Equipment $906,000
3. Machinery (except Electrical) $80 million 3. Wood Products $650,000
4. Computers & Electronics $52 million 4. Crop Production $251,000
5. Primary Metal Manufacturing $48 million * The data for KY-5 reflect the combined exports of Bath, Bell, Breathitt, Clay, Floyd, Harlan, Jackson, Johnson, Knott, Knox, Laurel, Lawrence, Lee, Leslie, Letcher, Magoffin, Martin, McCreary, Menifee, Morgan, Owsley, Perry, Pike, Pulaski, Rockcastle, Rowan, Wayne, Whitley, and Wolfe counties. The figures may understate the KY-5 district’s total exports to China because county-specific information for some products (e.g., mining, forestry, fishing, and waste and scrap) is not available.
$2 $2
$4
$7
$9
$11 $11
$16
$18
2000 2001 2002 2003 2004 2005 2006 2007 2008
Estimated Growth in Exports from Kentucky’s 5th Congressional District, 2000–08
Exports to China: 884% Exports to Rest of World: 92%
Kentucky's 5th Congressional District: Exports to China ($ million)

© 2009, The US-China Business Council
Sources: The Trade Partnership from US Census Bureau and US Department of Agriculture data.
Kentucky’s Top Exports to China, 2008
KY-6: Top Exports to China, 2008*
1. Chemicals $163 million 1. Other Manufacturing $52 million
2. Transportation Equipment $124 million 2. Machinery (except Electrical) $10 million
3. Machinery (except Electrical) $80 million 3. Nonmetallic Mineral Products $2 million
4. Computers & Electronics $52 million 4. Transportation Equipment $2 million
5. Primary Metal Manufacturing $48 million 5. Fabricated Metal Products $546,000 * The data for KY-6 reflect the combined exports of Anderson, Bourbon, Boyle, Clark, Estill, Fayette, Franklin, Garrard, Jessamine, Lincoln, Madison, Mercer, Montgomery, Powell, Scott, and Woodford counties. The figures may understate the KY-6 district’s total exports to China because county-specific information for some products (e.g., mining, forestry, fishing, and waste and scrap) is not available. Figures are rounded.
$7 $9$14
$25
$34
$42 $42
$60
$67
2000 2001 2002 2003 2004 2005 2006 2007 2008
Estimated Growth in Exports from Kentucky’s 6th Congressional District, 2000–08
Exports to China: 878% Exports to Rest of World: 88%
Kentucky's 6th Congressional District: Exports to China ($ million)

© 2009, The US-China Business Council
Sources: The Trade Partnership from US Census Bureau and US Department of Agriculture data.
Louisiana’s Top Exports to China, 2008
LA-1: Top Exports to China, 2008*
1. Crop Production $2.6 billion 1. Other Manufacturing $97 million
2. Chemicals $423 million 2. Crop Production $59 million
3. Processed Foods $130 million 3. Processed Foods $38 million
4. Machinery (except Electrical) $91 million 4. Machinery (except Electrical) $8 million
5. Waste & Scrap $41 million 5. Chemicals $3 million * The data for LA-1 reflect the combined exports of Jefferson, Orleans, St. Charles, St. Tammany, Tangipahoa, and Washington parishes. The figures may understate the LA-1 district’s total exports to China because county-specific information for some products (e.g., mining, forestry, fishing, and waste and scrap) is not available.
$67
$43$57
$113
$146$155
$165
$189
$213
2000 2001 2002 2003 2004 2005 2006 2007 2008
Estimated Growth in Exports from Louisiana’s 1st Congressional District, 2000–08
Exports to China: 219% Exports to Rest of World: 167%
Louisiana's 1st Congressional District: Exports to China ($ million)

© 2009, The US-China Business Council
Sources: The Trade Partnership from US Census Bureau and US Department of Agriculture data.
Louisiana’s Top Exports to China, 2008
LA-2: Top Exports to China, 2008*
1. Crop Production $2.6 billion 1. Processed Foods $33 million
2. Chemicals $423 million 2. Machinery (except Electrical) $8 million
3. Processed Foods $130 million 3. Crop Production $4 million
4. Machinery (except Electrical) $91 million 4. Chemicals $3 million
5. Waste & Scrap $41 million 5. Fabricated Metal Products $3 million * The data for LA-2 reflect the combined exports of Jefferson and Orleans parishes. The figures may understate the LA-2 district’s total exports to China because county-specific information for some products (e.g., mining, forestry, fishing, and waste and scrap) is not available.
$5 $4 $4
$18
$12
$17
$24
$53$55
2000 2001 2002 2003 2004 2005 2006 2007 2008
Estimated Growth in Exports from Louisiana’s 2nd Congressional District, 2000–08
Exports to China: 1,019% Exports to Rest of World: 164%
Louisiana's 2nd Congressional District: Exports to China ($ million)

© 2009, The US-China Business Council
Sources: The Trade Partnership from US Census Bureau and US Department of Agriculture data.
Louisiana’s Top Exports to China, 2008
LA-3: Top Exports to China, 2008*
1. Crop Production $2.6 billion 1. Crop Production $574 million
2. Chemicals $423 million 2. Other Manufacturing $209 million
3. Processed Foods $130 million 3. Chemicals $93 million
4. Machinery (except Electrical) $91 million 4. Processed Foods $15 million
5. Waste & Scrap $41 million 5. Fabricated Metal Products $10 million * The data for LA-3 reflect the combined exports of Ascension, Assumption, Iberia, Jefferson, Lafourche, Plaquemines, St. Bernard, St. Charles, St. James, St. John the Baptist, St. Martin, St. Mary, and Terrebonne parishes. The figures may understate the LA-3 district’s total exports to China because county-specific information for some products (e.g., mining, forestry, fishing, and waste and scrap) is not available.
$283
$181$216
$539$588
$553$615
$721
$914
2000 2001 2002 2003 2004 2005 2006 2007 2008
Estimated Growth in Exports from Louisiana’s 3rd Congressional District, 2000–08
Exports to China: 223% Exports to Rest of World: 151%
Louisiana's 3rd Congressional District: Exports to China ($ million)

© 2009, The US-China Business Council
Sources: The Trade Partnership from US Census Bureau and US Department of Agriculture data.
Louisiana’s Top Exports to China, 2008
LA-4: Top Exports to China, 2008*
1. Crop Production $2.6 billion 1. Crop Production $116 million
2. Chemicals $423 million 2. Machinery (except Electrical) $10 million
3. Processed Foods $130 million 3. Other Manufacturing $9 million
4. Machinery (except Electrical) $91 million 4. Fabricated Metal Products $1 million
5. Waste & Scrap $41 million 5. Animal Production $262,000 * The data for LA-4 reflect the combined exports of Allen, Beauregard, Bienville, Bossier, Caddo, Claiborne, De Soto, Grant, Natchitoches, Red River, Sabine, Vernon, and Webster parishes. The figures may understate the LA-4 district’s total exports to China because parish-specific information for some products (e.g., mining, forestry, fishing, and waste and scrap) is not available.
$42
$27 $30
$86 $84$72
$83
$100
$137
2000 2001 2002 2003 2004 2005 2006 2007 2008
Estimated Growth in Exports from Louisiana’s 4th Congressional District, 2000–08
Exports to China: 225% Exports to Rest of World: 129%
Louisiana's 4th Congressional District: Exports to China ($ million)

© 2009, The US-China Business Council
Sources: The Trade Partnership from US Census Bureau and US Department of Agriculture data.
Louisiana’s Top Exports to China, 2008
LA-5: Top Exports to China, 2008*
1. Crop Production $2.6 billion 1. Crop Production $1.4 billion
2. Chemicals $423 million 2. Chemicals $52 million
3. Processed Foods $130 million 3. Other Manufacturing $21 million
4. Machinery (except Electrical) $91 million 4. Animal Production $309,000
5. Waste & Scrap $41 million * The data for LA-5 reflect the combined exports of Allen, Avoyelles, Caldwell, Catahoula, Concordia, East Carroll, Evangeline, Franklin, Iberville, Jackson, La Salle, Lincoln, Madison, Morehouse, Ouachita, Pointe Coupee, Rapides, Richland, Tensas, Union, West Carroll, and Winn parishes. The figures may understate the LA-5 district’s total exports to China because county-specific information for some products (e.g., mining, forestry, fishing, and waste and scrap) is not available.
$449
$288 $305
$944$887
$722$848
$1,029
$1,468
2000 2001 2002 2003 2004 2005 2006 2007 2008
Estimated Growth in Exports from Louisiana’s 5th Congressional District, 2000–08
Exports to China: 227% Exports to Rest of World: 110%
Louisiana's 5th Congressional District: Exports to China ($ million)

© 2009, The US-China Business Council
Sources: The Trade Partnership from US Census Bureau and US Department of Agriculture data.
Louisiana’s Top Exports to China, 2008
LA-6: Top Exports to China, 2008*
1. Crop Production $2.6 billion 1. Crop Production $290 million
2. Chemicals $423 million 2. Chemicals $136 million
3. Processed Foods $130 million 3. Other Manufacturing $91 million
4. Machinery (except Electrical) $91 million 4. Processed Foods $5 million
5. Waste & Scrap $41 million 5. Animal Production $50,000 * The data for LA-6 reflect the combined exports of Ascension, East Baton Rouge, East Feliciana, Iberville, Livingston, Pointe Coupee, St. Helena, West Baton Rouge, and West Feliciana parishes. The figures may understate the LA-6 district’s total exports to China because county-specific information for some products (e.g., mining, forestry, fishing, and waste and scrap) is not available.
$162
$104$127
$302$341 $330
$363
$422
$522
2000 2001 2002 2003 2004 2005 2006 2007 2008
Estimated Growth in Exports from Louisiana’s 6th Congressional District, 2000–08
Exports to China: 222% Exports to Rest of World: 156%
Louisiana's 6th Congressional District: Exports to China ($ million)

© 2009, The US-China Business Council
Sources: The Trade Partnership from US Census Bureau and US Department of Agriculture data.
Louisiana’s Top Exports to China, 2008
LA-7: Top Exports to China, 2008*
1. Crop Production $2.6 billion 1. Crop Production $469 million
2. Chemicals $423 million 2. Other Manufacturing $54 million
3. Processed Foods $130 million 3. Chemicals $52 million
4. Machinery (except Electrical) $91 million 4. Machinery (except Electrical) $12 million
5. Waste & Scrap $41 million 5. Processed Foods $9 million * The data for LA-7 reflect the combined exports of the Acadia, Calcasieu, Cameron, Evangeline, Jefferson Davis, Lafayette, St. Landry, and Vermilion parishes. The figures may understate the LA-7 district’s total exports to China because county-specific information for some products (e.g., mining, forestry, fishing, and waste and scrap) is not available.
$185
$119 $135
$370 $377$333
$379
$451
$603
2000 2001 2002 2003 2004 2005 2006 2007 2008
Estimated Growth in Exports from Louisiana’s 7th Congressional District, 2000–08
Exports to China: 225% Exports to Rest of World: 138%
Louisiana's 7th Congressional District: Exports to China ($ million)

© 2009, The US-China Business Council
Sources: The Trade Partnership from US Census Bureau and US Department of Agriculture data.
Maine’s Top Exports to China, 2008 ME-1: Top Exports to China, 2008* 1. Paper Products $87 million 1. Other Manufacturing $22 million
2. Leather Products $6 million 2. Chemicals $2 million
3. Chemicals $5 million 3. Machinery (except Electrical) $1 million
4. Primary Metal Manufacturing $4 million 4. Fabricated Metal Products $766,000
5. Processed Foods $4 million 5. Computers & Electronics $357,000 * The data for ME-1 reflect the combined exports of Cumberland, Kennebec, Knox, Lincoln, Sagadahoc, and York counties. The figures may understate the ME-1 district’s total exports to China because county-specific information for some products (e.g., mining, forestry, fishing, and waste and scrap) is not available.
$5$7
$10
$17
$22 $22
$33
$30
$26
2000 2001 2002 2003 2004 2005 2006 2007 2008
Estimated Growth in Exports from Maine’s 1st Congressional District, 2000–08
Exports to China: 430% Exports to Rest of World: 93%
Maine's 1st Congressional District: Exports to China ($ million)

© 2009, The US-China Business Council
Sources: The Trade Partnership from US Census Bureau and US Department of Agriculture data.
Maine’s Top Exports to China, 2008 ME-2: Top Exports to China, 2008* 1. Paper Products $87 million 1. Other Manufacturing $70 million
2. Leather Products $6 million 2. Processed Foods $963,000
3. Chemicals $5 million 3. Fabricated Metal Products $283,000
4. Primary Metal Manufacturing $4 million 4. Printing & Related Products $189,000
5. Processed Foods $4 million 5. Transportation Equipment $101,000 * The data for ME-2 reflect the combined exports of Androscoggin, Aroostook, Franklin, Hancock, Kennebec, Oxford, Penobscot, Piscataquis, Somerset, Waldo, and Washington counties. The figures may understate the ME-2 district’s total exports to China because county-specific information for some products (e.g., mining, forestry, fishing, and waste and scrap) is not available.
$14$19
$28
$48
$60 $62
$92$84
$72
2000 2001 2002 2003 2004 2005 2006 2007 2008
Estimated Growth in Exports from Maine’s 2nd Congressional District, 2000–08
Exports to China: 427% Exports to Rest of World: 91%
Maine's 2nd Congressional District: Exports to China ($ million)

© 2009, The US-China Business Council
Sources: The Trade Partnership from US Census Bureau and US Department of Agriculture data.
Maryland’s Top Exports to China, 2008 MD-1: Top Exports to China, 2008* 1. Primary Metal Manufacturing $212 million 1. Other Manufacturing $133 million
2. Waste & Scrap $138 million 2. Chemicals $16 million
3. Machinery (except Electrical) $48 million 3. Machinery (except Electrical) $9 million
4. Chemicals $42 million 4. Electrical Equipment $5 million
5. Computers & Electronics $40 million 5. Fabricated Metal Products $3 million * The data for MD-1 reflect the combined exports of Anne Arundel, Baltimore, Caroline, Cecil, Dorchester, Harford, Kent, Queen Anne’s, Somerset, Talbot, Wicomico, and Worcester counties. The figures may understate the MD-1 district’s total exports to China because county-specific information for some products (e.g., mining, forestry, fishing, and waste and scrap) is not available.
$32
$48 $52
$69$80
$95$83
$113
$176
2000 2001 2002 2003 2004 2005 2006 2007 2008
Estimated Growth in Exports from Maryland’s 1st Congressional District, 2000–08
Exports to China: 452% Exports to Rest of World: 134%
Maryland's 1st Congressional District: Exports to China ($ million)

© 2009, The US-China Business Council
Sources: The Trade Partnership from US Census Bureau and US Department of Agriculture data.
Maryland’s Top Exports to China, 2008 MD-2: Top Exports to China, 2008* 1. Primary Metal Manufacturing $212 million 1. Other Manufacturing $151 million
2. Waste & Scrap $138 million 2. Chemicals $27 million
3. Machinery (except Electrical) $48 million 3. Machinery (except Electrical) $9 million
4. Chemicals $42 million 4. Electrical Equipment $5 million
5. Computers & Electronics $40 million 5. Plastics & Rubber Products $4 million * The data for MD-2 reflect the combined exports of Anne Arundel, Baltimore, and Harford counties, and the city of Baltimore. The figures may understate the MD-2 district’s total exports to China because county-specific information for some products (e.g., mining, forestry, fishing, and waste and scrap) is not available.
$38
$58 $62
$82$96
$113$99
$134
$211
2000 2001 2002 2003 2004 2005 2006 2007 2008
Estimated Growth in Exports from Maryland’s 2nd Congressional District, 2000–08
Exports to China: 452% Exports to Rest of World: 138%
Maryland's 2nd Congressional District: Exports to China ($ million)
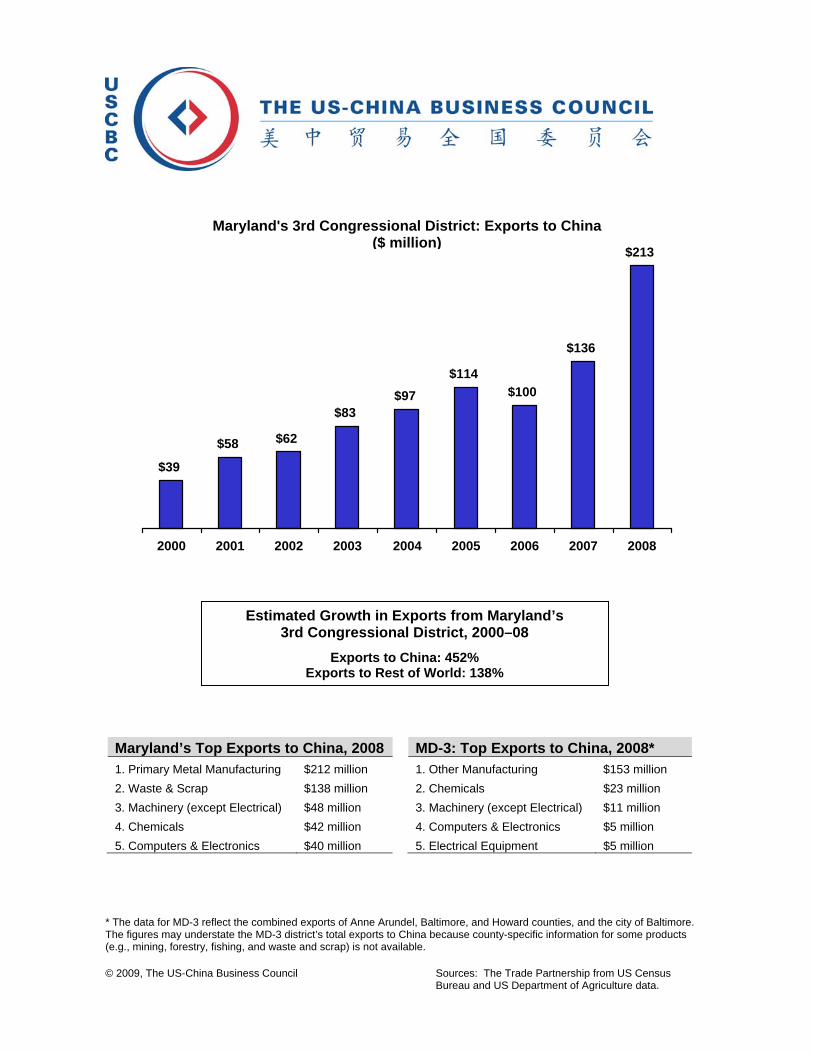
© 2009, The US-China Business Council
Sources: The Trade Partnership from US Census Bureau and US Department of Agriculture data.
Maryland’s Top Exports to China, 2008 MD-3: Top Exports to China, 2008* 1. Primary Metal Manufacturing $212 million 1. Other Manufacturing $153 million
2. Waste & Scrap $138 million 2. Chemicals $23 million
3. Machinery (except Electrical) $48 million 3. Machinery (except Electrical) $11 million
4. Chemicals $42 million 4. Computers & Electronics $5 million
5. Computers & Electronics $40 million 5. Electrical Equipment $5 million * The data for MD-3 reflect the combined exports of Anne Arundel, Baltimore, and Howard counties, and the city of Baltimore. The figures may understate the MD-3 district’s total exports to China because county-specific information for some products (e.g., mining, forestry, fishing, and waste and scrap) is not available.
$39
$58 $62
$83$97
$114$100
$136
$213
2000 2001 2002 2003 2004 2005 2006 2007 2008
Estimated Growth in Exports from Maryland’s 3rd Congressional District, 2000–08
Exports to China: 452% Exports to Rest of World: 138%
Maryland's 3rd Congressional District: Exports to China ($ million)

© 2009, The US-China Business Council
Sources: The Trade Partnership from US Census Bureau and US Department of Agriculture data.
Maryland’s Top Exports to China, 2008 MD-4: Top Exports to China, 2008* 1. Primary Metal Manufacturing $212 million 1. Other Manufacturing $45 million
2. Waste & Scrap $138 million 2. Computers & Electronics $17 million
3. Machinery (except Electrical) $48 million 3. Fabricated Metal Products $1 million
4. Chemicals $42 million 4. Miscellaneous Manufacturing $626,000
5. Computers & Electronics $40 million 5. Processed Foods $434,000 * The data for MD-4 reflect the combined exports of Montgomery and Prince George’s counties. The figures may understate the MD-4 district’s total exports to China because county-specific information for some products (e.g., mining, forestry, fishing, and waste and scrap) is not available.
$12$17
$19
$25$29
$34$30
$41
$64
2000 2001 2002 2003 2004 2005 2006 2007 2008
Estimated Growth in Exports from Maryland’s 4th Congressional District, 2000–08
Exports to China: 452% Exports to Rest of World: 137%
Maryland's 4th Congressional District: Exports to China ($ million)

© 2009, The US-China Business Council
Sources: The Trade Partnership from US Census Bureau and US Department of Agriculture data.
Maryland’s Top Exports to China, 2008 MD-5: Top Exports to China, 2008* 1. Primary Metal Manufacturing $212 million 1. Other Manufacturing $59 million
2. Waste & Scrap $138 million 2. Electrical Equipment $5 million
3. Machinery (except Electrical) $48 million 3. Fabricated Metal Products $1 million
4. Chemicals $42 million 4. Processed Foods $351,000
5. Computers & Electronics $40 million 5. Printing & Related Products $144,000 * The data for MD-5 reflect the combined exports of Anne Arundel, Calvert, Charles, Prince George’s, and St. Mary’s counties. The figures may understate the MD-5 district’s total exports to China because county-specific information for some products (e.g., mining, forestry, fishing, and waste and scrap) is not available.
$12
$18 $19
$26$30
$35$31
$42
$65
2000 2001 2002 2003 2004 2005 2006 2007 2008
Estimated Growth in Exports from Maryland’s 5th Congressional District, 2000–08
Exports to China: 452% Exports to Rest of World: 138%
Maryland's 5th Congressional District: Exports to China ($ million)

© 2009, The US-China Business Council
Sources: The Trade Partnership from US Census Bureau and US Department of Agriculture data.
Maryland’s Top Exports to China, 2008 MD-6: Top Exports to China, 2008* 1. Primary Metal Manufacturing $212 million 1. Other Manufacturing $160 million
2. Waste & Scrap $138 million 2. Computers & Electronics $21 million
3. Machinery (except Electrical) $48 million 3. Chemicals $16 million
4. Chemicals $42 million 4. Machinery (except Electrical) $11 million
5. Computers & Electronics $40 million 5. Fabricated Metal Products $4 million * The data for MD-6 reflect the combined exports of Allegany, Baltimore, Carroll, Frederick, Garrett, Harford, Montgomery, and Washington counties. The figures may understate the MD-6 district’s total exports to China because county-specific information for some products (e.g., mining, forestry, fishing, and waste and scrap) is not available.
$40
$60 $64
$86$100
$118$103
$140
$220
2000 2001 2002 2003 2004 2005 2006 2007 2008
Estimated Growth in Exports from Maryland’s 6th Congressional District, 2000–08
Exports to China: 452% Exports to Rest of World: 137%
Maryland's 6th Congressional District: Exports to China ($ million)

© 2009, The US-China Business Council
Sources: The Trade Partnership from US Census Bureau and US Department of Agriculture data.
Maryland’s Top Exports to China, 2008 MD-7: Top Exports to China, 2008* 1. Primary Metal Manufacturing $212 million 1. Other Manufacturing $119 million
2. Waste & Scrap $138 million 2. Chemicals $23 million
3. Machinery (except Electrical) $48 million 3. Machinery (except Electrical) $11 million
4. Chemicals $42 million 4. Computers & Electronics $5 million
5. Computers & Electronics $40 million 5. Fabricated Metal Products $4 million * The data for MD-7 reflect the combined exports of Baltimore and Howard counties, and the city of Baltimore. The figures may understate the MD-7 district’s total exports to China because county-specific information for some products (e.g., mining, forestry, fishing, and waste and scrap) is not available.
$32
$48 $51
$68$79
$94$82
$111
$174
2000 2001 2002 2003 2004 2005 2006 2007 2008
Estimated Growth in Exports from Maryland’s 7th Congressional District, 2000–08
Exports to China: 452% Exports to Rest of World: 138%
Maryland's 7th Congressional District: Exports to China ($ million)

© 2009, The US-China Business Council
Sources: The Trade Partnership from US Census Bureau and US Department of Agriculture data.
Maryland’s Top Exports to China, 2008 MD-8: Top Exports to China, 2008* 1. Primary Metal Manufacturing $212 million 1. Other Manufacturing $45 million
2. Waste & Scrap $138 million 2. Computers & Electronics $17 million
3. Machinery (except Electrical) $48 million 3. Fabricated Metal Products $1 million
4. Chemicals $42 million 4. Miscellaneous Manufacturing $626,000
5. Computers & Electronics $40 million 5. Processed Foods $434,000 * The data for MD-8 reflect the combined exports of Montgomery and Prince George’s counties. The figures may understate the MD-8 district’s total exports to China because county-specific information for some products (e.g., mining, forestry, fishing, and waste and scrap) is not available.
$12$17
$19
$25$29
$34$30
$41
$64
2000 2001 2002 2003 2004 2005 2006 2007 2008
Estimated Growth in Exports from Maryland’s 8th Congressional District, 2000–08
Exports to China: 452% Exports to Rest of World: 137%
Maryland's 8th Congressional District: Exports to China ($ million)

© 2009, The US-China Business Council
Sources: The Trade Partnership from US Census Bureau and US Department of Agriculture data.
Massachusetts’ Top Exports to China, 2008
MA-1: Top Exports to China, 2008*
1. Computers & Electronics $712 million 1. Computers & Electronics $437 million
2. Machinery (except Electrical) $317 million 2. Machinery (except Electrical) $188 million
3. Waste & Scrap $122 million 3. Fabricated Metal Products $29 million
4. Chemicals $65 million 4. Chemicals $28 million
5. Processed Foods $62 million 5. Processed Foods $25 million * The data for MA-1 reflect the combined exports of Berkshire, Franklin, Hampden, Hampshire, Middlesex, and Worcester counties. The figures may understate the MA-1 district’s total exports to China because county-specific information for some products (e.g., mining, forestry, fishing, and waste and scrap) is not available.
$284$223
$194
$270
$446 $424
$641$689
$810
2000 2001 2002 2003 2004 2005 2006 2007 2008
Estimated Growth in Exports from Massachusetts’ 1st Congressional District, 2000–08
Exports to China: 185% Exports to Rest of World: 29%
Massachusetts' 1st Congressional District: Exports to China ($ million)

© 2009, The US-China Business Council
Sources: The Trade Partnership from US Census Bureau and US Department of Agriculture data.
Massachusetts’ Top Exports to China, 2008
MA-2: Top Exports to China, 2008*
1. Computers & Electronics $712 million 1. Computers & Electronics $165 million
2. Machinery (except Electrical) $317 million 2. Machinery (except Electrical) $114 million
3. Waste & Scrap $122 million 3. Other Manufacturing $39 million
4. Chemicals $65 million 4. Fabricated Metal Products $23 million
5. Processed Foods $62 million 5. Chemicals $20 million * The data for MA-2 reflects the combined exports of Hampden, Hampshire, Norfolk, and Worcester counties. The figures may understate the MA-2 district’s total exports to China because county-specific information for some products (e.g., mining, forestry, fishing, and waste and scrap) is not available.
$154$125 $112
$159
$256 $245
$361$387
$456
2000 2001 2002 2003 2004 2005 2006 2007 2008
Estimated Growth in Exports from Massachusetts’ 2nd Congressional District, 2000–08
Exports to China: 196% Exports to Rest of World: 29%
Massachusetts' 2nd Congressional District: Exports to China ($ million)

© 2009, The US-China Business Council
Sources: The Trade Partnership from US Census Bureau and US Department of Agriculture data.
Massachusetts’ Top Exports to China, 2008
MA-3: Top Exports to China, 2008*
1. Computers & Electronics $712 million 1. Computers & Electronics $543 million
2. Machinery (except Electrical) $317 million 2. Machinery (except Electrical) $178 million
3. Waste & Scrap $122 million 3. Chemicals $37 million
4. Chemicals $65 million 4. Electrical Equipment $34 million
5. Processed Foods $62 million 5. Fabricated Metal Products $30 million * The data for MA-3 reflect the combined exports of Bristol, Middlesex, Norfolk, and Worcester counties. The figures may understate the MA-3 district’s total exports to China because county-specific information for some products (e.g., mining, forestry, fishing, and waste and scrap) is not available.
$342$264
$226
$324
$527 $505
$772$809
$951
2000 2001 2002 2003 2004 2005 2006 2007 2008
Estimated Growth in Exports from Massachusetts’ 3rd Congressional District, 2000–08
Exports to China: 178% Exports to Rest of World: 29%
Massachusetts' 3rd Congressional District: Exports to China ($ million)

© 2009, The US-China Business Council
Sources: The Trade Partnership from US Census Bureau and US Department of Agriculture data.
Massachusetts’ Top Exports to China, 2008
MA-4: Top Exports to China, 2008*
1. Computers & Electronics $712 million 1. Computers & Electronics $486 million
2. Machinery (except Electrical) $317 million 2. Machinery (except Electrical) $143 million
3. Waste & Scrap $122 million 3. Processed Foods $28 million
4. Chemicals $65 million 4. Miscellaneous Manufacturing $25 million
5. Processed Foods $62 million 5. Chemicals $25 million * The data for MA-4 reflect the combined exports of Bristol, Middlesex, Norfolk, and Plymouth counties. The figures may understate the MA-4 district’s total exports to China because county-specific information for some products (e.g., mining, forestry, fishing, and waste and scrap) is not available.
$296$224
$191
$268
$444 $422
$655 $677
$801
2000 2001 2002 2003 2004 2005 2006 2007 2008
Estimated Growth in Exports from Massachusetts’ 4th Congressional District, 2000–08
Exports to China: 171% Exports to Rest of World: 29%
Massachusetts' 4th Congressional District: Exports to China ($ million)

© 2009, The US-China Business Council
Sources: The Trade Partnership from US Census Bureau and US Department of Agriculture data.
Massachusetts’ Top Exports to China, 2008
MA-5: Top Exports to China, 2008*
1. Computers & Electronics $712 million 1. Computers & Electronics $555 million
2. Machinery (except Electrical) $317 million 2. Machinery (except Electrical) $206 million
3. Waste & Scrap $122 million 3. Chemicals $45 million
4. Chemicals $65 million 4. Processed Foods $29 million
5. Processed Foods $62 million 5. Electrical Equipment $25 million * The data for MA-5 reflect the combined exports of Essex, Middlesex, and Worcester counties. The figures may understate the MA-5 district’s total exports to China because county-specific information for some products (e.g., mining, forestry, fishing, and waste and scrap) is not available.
$345$264
$227
$330
$524 $502
$774$815
$958
2000 2001 2002 2003 2004 2005 2006 2007 2008
Estimated Growth in Exports from Massachusetts’ 5th Congressional District, 2000–08
Exports to China: 178% Exports to Rest of World: 29%
Massachusetts' 5th Congressional District: Exports to China ($ million)

© 2009, The US-China Business Council
Sources: The Trade Partnership from US Census Bureau and US Department of Agriculture data.
Massachusetts’ Top Exports to China, 2008
MA-6: Top Exports to China, 2008*
1. Computers & Electronics $712 million 1. Computers & Electronics $491 million
2. Machinery (except Electrical) $317 million 2. Machinery (except Electrical) $162 million
3. Waste & Scrap $122 million 3. Chemicals $32 million
4. Chemicals $65 million 4. Processed Foods $27 million
5. Processed Foods $62 million 5. Fabricated Metal Products $16 million * The data for MA-6 reflect the combined exports of Essex and Middlesex counties. The figures may understate the MA-6 district’s total exports to China because county-specific information for some products (e.g., mining, forestry, fishing, and waste and scrap) is not available.
$292$218
$185
$265
$428 $405
$640 $663
$784
2000 2001 2002 2003 2004 2005 2006 2007 2008
Estimated Growth in Exports from Massachusetts’ 6th Congressional District, 2000–08
Exports to China: 168% Exports to Rest of World: 28%
Massachusetts' 6th Congressional District: Exports to China ($ million)

© 2009, The US-China Business Council
Sources: The Trade Partnership from US Census Bureau and US Department of Agriculture data.
Massachusetts’ Top Exports to China, 2008
MA-7: Top Exports to China, 2008*
1. Computers & Electronics $712 million 1. Computers & Electronics $374 million
2. Machinery (except Electrical) $317 million 2. Machinery (except Electrical) $92 million
3. Waste & Scrap $122 million 3. Processed Foods $24 million
4. Chemicals $65 million 4. Chemicals $22 million
5. Processed Foods $62 million 5. Fabricated Metal Products $14 million * The data for MA-7 reflect the combined exports of Middlesex and Suffolk counties. The figures may understate the MA-7 district’s total exports to China because county-specific information for some products (e.g., mining, forestry, fishing, and waste and scrap) is not available.
$216
$157$133
$189
$305 $290
$466 $477
$567
2000 2001 2002 2003 2004 2005 2006 2007 2008
Estimated Growth in Exports from Massachusetts’ 7th Congressional District, 2000–08
Exports to China: 163% Exports to Rest of World: 29%
Massachusetts' 7th Congressional District: Exports to China ($ million)

© 2009, The US-China Business Council
Sources: The Trade Partnership from US Census Bureau and US Department of Agriculture data.
Massachusetts’ Top Exports to China, 2008
MA-8: Top Exports to China, 2008*
1. Computers & Electronics $712 million 1. Computers & Electronics $374 million
2. Machinery (except Electrical) $317 million 2. Machinery (except Electrical) $92 million
3. Waste & Scrap $122 million 3. Processed Foods $24 million
4. Chemicals $65 million 4. Chemicals $22 million
5. Processed Foods $62 million 5. Fabricated Metal Products $14 million * The data for MA-8 reflect the combined exports of Middlesex and Suffolk counties. The figures may understate the MA-8 district’s total exports to China because county-specific information for some products (e.g., mining, forestry, fishing, and waste and scrap) is not available.
$216
$157$133
$189
$305 $290
$466 $477
$567
2000 2001 2002 2003 2004 2005 2006 2007 2008
Estimated Growth in Exports from Massachusetts’ 8th Congressional District, 2000–08
Exports to China: 163% Exports to Rest of World: 29%
Massachusetts' 8th Congressional District: Exports to China ($ million)

© 2009, The US-China Business Council
Sources: The Trade Partnership from US Census Bureau and US Department of Agriculture data.
Massachusetts’ Top Exports to China, 2008
MA-9: Top Exports to China, 2008*
1. Computers & Electronics $712 million 1. Computers & Electronics $138 million
2. Machinery (except Electrical) $317 million 2. Other Manufacturing $84 million
3. Waste & Scrap $122 million 3. Machinery (except Electrical) $51 million
4. Chemicals $65 million 4. Processed Foods $23 million
5. Processed Foods $62 million 5. Miscellaneous Manufacturing $17 million * The data for MA-9 reflect the combined exports of Bristol, Norfolk, Plymouth, and Suffolk counties. The figures may understate the MA-9 district’s total exports to China because county-specific information for some products (e.g., mining, forestry, fishing, and waste and scrap) is not available.
$132$107 $96
$137
$220 $210
$310$332
$392
2000 2001 2002 2003 2004 2005 2006 2007 2008
Estimated Growth in Exports from Massachusetts’ 9th Congressional District, 2000–08
Exports to China: 197% Exports to Rest of World: 29%
Massachusetts' 9th Congressional District: Exports to China ($ million)

© 2009, The US-China Business Council
Sources: The Trade Partnership from US Census Bureau and US Department of Agriculture data.
Massachusetts’ Top Exports to China, 2008
MA-10: Top Exports to China, 2008*
1. Computers & Electronics $712 million 1. Computers & Electronics $104 million
2. Machinery (except Electrical) $317 million 2. Machinery (except Electrical) $33 million
3. Waste & Scrap $122 million 3. Other Manufacturing $9 million
4. Chemicals $65 million 4. Electrical Equipment $9 million
5. Processed Foods $62 million 5. Fabricated Metal Products $8 million * The data for MA-10 reflect the combined exports of Barnstable, Dukes, Nantucket, Norfolk, and Plymouth counties. The figures may understate the MA-10 district’s total exports to China because county-specific information for some products (e.g., mining, forestry, fishing, and waste and scrap) is not available.
$65$53 $47
$67
$108 $103
$152$163
$192
2000 2001 2002 2003 2004 2005 2006 2007 2008
Estimated Growth in Exports from Massachusetts’ 10th Congressional District, 2000–08
Exports to China: 196% Exports to Rest of World: 29%
Massachusetts' 10th Congressional District: Exports to China ($ million)

© 2009, The US-China Business Council
Sources: The Trade Partnership from US Census Bureau and US Department of Agriculture data.
Michigan’s Top Exports to China, 2008 MI-1: Top Exports to China, 2008* 1. Transportation Equipment $432 million 1. Other Manufacturing $20 million
2. Machinery (except Electrical) $187 million 2. Machinery (except Electrical) $5 million
3. Chemicals $159 million 3. Transportation Equipment $2 million
4. Waste & Scrap $134 million 4. Fabricated Metal Products $175,000
5. Primary Metal Manufacturing $130 million 5. Crop Production $5,000 * The data for MI-1 reflect the combined exports of Alcona, Alger, Alpena, Antrim, Arenac, Baraga, Bay, Charlevoix, Cheboygan, Chippewa, Crawford, Delta, Dickinson, Emmet, Gladwin, Gogebic, Houghton, Iosco, Iron, Keweenaw, Luce, Mackinac, Marquette, Menominee, Montmorency, Ogemaw, Ontonagon, Oscoda, Otsego, Presque Isle, and Schoolcraft counties. The figures may understate the MI-1 district’s total exports to China because county-specific information for some products (e.g., mining, forestry, fishing, and waste and scrap) is not available.
$4$5
$6$8
$13$14
$21
$27 $27
2000 2001 2002 2003 2004 2005 2006 2007 2008
Estimated Growth in Exports from Michigan’s 1st Congressional District, 2000–08
Exports to China: 504% Exports to Rest of World: 21%
Michigan's 1st Congressional District: Exports to China ($ million)

© 2009, The US-China Business Council
Sources: The Trade Partnership from US Census Bureau and US Department of Agriculture data.
Michigan’s Top Exports to China, 2008 MI-2: Top Exports to China, 2008* 1. Transportation Equipment $432 million 1. Other Manufacturing $55 million
2. Machinery (except Electrical) $187 million 2. Machinery (except Electrical) $36 million
3. Chemicals $159 million 3. Primary Metal Manufacturing $12 million
4. Waste & Scrap $134 million 4. Transportation Equipment $10 million
5. Primary Metal Manufacturing $130 million 5. Furniture & Related Products $10 million * The data for MI-2 reflect the combined exports of Allegan, Benzie, Kent, Lake, Manistee, Mason, Muskegon, Newaygo, Oceana, Ottawa, and Wexford counties. The figures may understate the MI-2 district’s total exports to China because county-specific information for some products (e.g., mining, forestry, fishing, and waste and scrap) is not available.
$26 $31 $36$46
$78$87
$126
$163 $160
2000 2001 2002 2003 2004 2005 2006 2007 2008
Estimated Growth in Exports from Michigan’s 2nd Congressional District, 2000–08
Exports to China: 504% Exports to Rest of World: 20%
Michigan's 2nd Congressional District: Exports to China ($ million)

© 2009, The US-China Business Council
Sources: The Trade Partnership from US Census Bureau and US Department of Agriculture data.
Michigan’s Top Exports to China, 2008 MI-3: Top Exports to China, 2008* 1. Transportation Equipment $432 million 1. Other Manufacturing $41 million
2. Machinery (except Electrical) $187 million 2. Machinery (except Electrical) $27 million
3. Chemicals $159 million 3. Furniture & Related Products $4 million
4. Waste & Scrap $134 million 4. Fabricated Metal Products $3 million
5. Primary Metal Manufacturing $130 million 5. Miscellaneous Manufacturing $2 million * The data for MI-3 reflect the combined exports of Barry, Ionia, and Kent counties. The figures may understate the MI-3 district’s total exports to China because county-specific information for some products (e.g., mining, forestry, fishing, and waste and scrap) is not available.
$13 $15 $17$22
$38$42
$62
$80 $78
2000 2001 2002 2003 2004 2005 2006 2007 2008
Estimated Growth in Exports from Michigan’s 3rd Congressional District, 2000–08
Exports to China: 504% Exports to Rest of World: 20%
Michigan's 3rd Congressional District: Exports to China ($ million)

© 2009, The US-China Business Council
Sources: The Trade Partnership from US Census Bureau and US Department of Agriculture data.
Michigan’s Top Exports to China, 2008 MI-4: Top Exports to China, 2008* 1. Transportation Equipment $432 million 1. Other Manufacturing $56 million
2. Machinery (except Electrical) $187 million 2. Machinery (except Electrical) $5 million
3. Chemicals $159 million 3. Transportation Equipment $1 million
4. Waste & Scrap $134 million 4. Fabricated Metal Products $1 million
5. Primary Metal Manufacturing $130 million 5. Electrical Equipment $737,000
* The data for MI-4 reflect the combined exports of Clare, Grand Traverse, Gratiot, Isabella, Kalkaska, Leelanau, Mecosta, Midland, Missaukee, Montcalm, Osceola, Roscommon, Saginaw, and Shiawassee counties. The figures may understate the MI-4 district’s total exports to China because county-specific information for some products (e.g., mining, forestry, fishing, and waste and scrap) is not available.
$10 $12 $14$18
$30$34
$49
$63 $62
2000 2001 2002 2003 2004 2005 2006 2007 2008
Estimated Growth in Exports from Michigan’s 4th Congressional District, 2000–08
Exports to China: 504% Exports to Rest of World: 21%
Michigan's 4th Congressional District: Exports to China ($ million)

© 2009, The US-China Business Council
Sources: The Trade Partnership from US Census Bureau and US Department of Agriculture data.
Michigan’s Top Exports to China, 2008 MI-5: Top Exports to China, 2008* 1. Transportation Equipment $432 million 1. Other Manufacturing $73 million
2. Machinery (except Electrical) $187 million 2. Machinery (except Electrical) $5 million
3. Chemicals $159 million 3. Transportation Equipment $2 million
4. Waste & Scrap $134 million 4. Fabricated Metal Products $1 million
5. Primary Metal Manufacturing $130 million 5. Plastics & Rubber Products $403,000
* The data for MI-5 reflect the combined exports of Bay, Genesee, Saginaw, and Tuscola counties. The figures may understate the MI-5 district’s total exports to China because county-specific information for some products (e.g., mining, forestry, fishing, and waste and scrap) is not available. Totals may not agree because of rounding.
$14 $16 $18$23
$40$44
$64
$83 $82
2000 2001 2002 2003 2004 2005 2006 2007 2008
Estimated Growth in Exports from Michigan’s 5th Congressional District, 2000–08
Exports to China: 504% Exports to Rest of World: 20%
Michigan's 5th Congressional District: Exports to China ($ million)

© 2009, The US-China Business Council
Sources: The Trade Partnership from US Census Bureau and US Department of Agriculture data.
Michigan’s Top Exports to China, 2008 MI-6: Top Exports to China, 2008* 1. Transportation Equipment $432 million 1. Other Manufacturing $58 million
2. Machinery (except Electrical) $187 million 2. Transportation Equipment $15 million
3. Chemicals $159 million 3. Machinery (except Electrical) $10 million
4. Waste & Scrap $134 million 4. Primary Metal Manufacturing $8 million
5. Primary Metal Manufacturing $130 million 5. Processed Foods $7 million
* The data for MI-6 reflect the combined exports of Allegan, Berrien, Calhoun, Cass, Kalamazoo, St. Joseph, and Van Buren counties. The figures may understate the MI-6 district’s total exports to China because county-specific information for some products (e.g., mining, forestry, fishing, and waste and scrap) is not available.
$18 $21 $24$31
$53$59
$85
$110 $108
2000 2001 2002 2003 2004 2005 2006 2007 2008
Estimated Growth in Exports from Michigan’s 6th Congressional District, 2000–08
Exports to China: 504% Exports to Rest of World: 21%
Michigan's 6th Congressional District: Exports to China ($ million)

© 2009, The US-China Business Council
Sources: The Trade Partnership from US Census Bureau and US Department of Agriculture data.
Michigan’s Top Exports to China, 2008 MI-7: Top Exports to China, 2008* 1. Transportation Equipment $432 million 1. Transportation Equipment $29 million
2. Machinery (except Electrical) $187 million 2. Computers & Electronics $20 million
3. Chemicals $159 million 3. Other Manufacturing $12 million
4. Waste & Scrap $134 million 4. Machinery (except Electrical) $10 million
5. Primary Metal Manufacturing $130 million 5. Chemicals $6 million * The data for MI-7 reflect the combined exports of Branch, Calhoun, Eaton, Hillsdale, Jackson, Lewanee, and Washtenaw counties. The figures may understate the MI-7 district’s total exports to China because county-specific information for some products (e.g., mining, forestry, fishing, and waste and scrap) is not available.
$16 $18 $21$27
$46$52
$75
$97 $95
2000 2001 2002 2003 2004 2005 2006 2007 2008
Estimated Growth in Exports from Michigan’s 7th Congressional District, 2000–08
Exports to China: 504% Exports to Rest of World: 20%
Michigan's 7th Congressional District: Exports to China ($ million)

© 2009, The US-China Business Council
Sources: The Trade Partnership from US Census Bureau and US Department of Agriculture data.
Michigan’s Top Exports to China, 2008 MI-8: Top Exports to China, 2008* 1. Transportation Equipment $432 million 1. Transportation Equipment $70 million
2. Machinery (except Electrical) $187 million 2. Machinery (except Electrical) $41 million
3. Chemicals $159 million 3. Other Manufacturing $12 million
4. Waste & Scrap $134 million 4. Chemicals $11 million
5. Primary Metal Manufacturing $130 million 5. Computers & Electronics $7 million * The data for MI-8 reflect the combined exports of Clinton, Ingham, Livingston, Oakland, and Shiawassee counties. The figures may understate the MI-8 district’s total exports to China because county-specific information for some products (e.g., mining, forestry, fishing, and waste and scrap) is not available.
$26 $30 $35$45
$77$86
$125
$161 $158
2000 2001 2002 2003 2004 2005 2006 2007 2008
Estimated Growth in Exports from Michigan’s 8th Congressional District, 2000–08
Exports to China: 505% Exports to Rest of World: 20%
Michigan's 8th Congressional District: Exports to China ($ million)

© 2009, The US-China Business Council
Sources: The Trade Partnership from US Census Bureau and US Department of Agriculture data.
Michigan’s Top Exports to China, 2008 MI-9: Top Exports to China, 2008* 1. Transportation Equipment $432 million 1. Transportation Equipment $65 million
2. Machinery (except Electrical) $187 million 2. Machinery (except Electrical) $39 million
3. Chemicals $159 million 3. Chemicals $11 million
4. Waste & Scrap $134 million 4. Computers & Electronics $7 million
5. Primary Metal Manufacturing $130 million 5. Fabricated Metal Products $5 million * The data for MI-9 reflect the exports of Oakland County, which also includes other congressional districts. The figures may understate the MI-9 district’s total exports to China because county-specific information for some products (e.g., mining, forestry, fishing, and waste and scrap) is not available.
$23 $27 $31$40
$68$76
$111
$143 $140
2000 2001 2002 2003 2004 2005 2006 2007 2008
Estimated Growth in Exports from Michigan’s 9th Congressional District, 2000–08
Exports to China: 505% Exports to Rest of World: 19%
Michigan's 9th Congressional District: Exports to China ($ million)

© 2009, The US-China Business Council
Sources: The Trade Partnership from US Census Bureau and US Department of Agriculture data.
Michigan’s Top Exports to China, 2008 MI-10: Top Exports to China, 2008* 1. Transportation Equipment $432 million 1. Transportation Equipment $70 million
2. Machinery (except Electrical) $187 million 2. Machinery (except Electrical) $32 million
3. Chemicals $159 million 3. Other Manufacturing $22 million
4. Waste & Scrap $134 million 4. Chemicals $14 million
5. Primary Metal Manufacturing $130 million 5. Fabricated Metal Products $6 million * The data for MI-10 reflect the combined exports of Huron, Lapeer, Macomb, Sanilac, and St. Clair counties. The figures may understate the MI-10 district’s total exports to China because county-specific information for some products (e.g., mining, forestry, fishing, and waste and scrap) is not available.
$26 $30 $35$45
$75$84
$123
$158 $155
2000 2001 2002 2003 2004 2005 2006 2007 2008
Estimated Growth in Exports from Michigan’s 10th Congressional District, 2000–08
Exports to China: 504% Exports to Rest of World: 20%
Michigan's 10th Congressional District: Exports to China ($ million)

© 2009, The US-China Business Council
Sources: The Trade Partnership from US Census Bureau and US Department of Agriculture data.
Michigan’s Top Exports to China, 2008 MI-11: Top Exports to China, 2008* 1. Transportation Equipment $432 million 1. Transportation Equipment $201 million
2. Machinery (except Electrical) $187 million 2. Machinery (except Electrical) $69 million
3. Chemicals $159 million 3. Primary Metal Manufacturing $52 million
4. Waste & Scrap $134 million 4. Chemicals $24 million
5. Primary Metal Manufacturing $130 million 5. Other Manufacturing $17 million * The data for MI-11 reflect the combined exports of Oakland and Wayne counties. The figures may understate the MI-11 district’s total exports to China because county-specific information for some products (e.g., mining, forestry, fishing, and waste and scrap) is not available.
$68 $79 $92$118
$200$223
$325
$420 $412
2000 2001 2002 2003 2004 2005 2006 2007 2008
Estimated Growth in Exports from Michigan’s 11th Congressional District, 2000–08
Exports to China: 504% Exports to Rest of World: 19%
Michigan's 11th Congressional District: Exports to China ($ million)

© 2009, The US-China Business Council
Sources: The Trade Partnership from US Census Bureau and US Department of Agriculture data.
Michigan’s Top Exports to China, 2008 MI-12: Top Exports to China, 2008* 1. Transportation Equipment $432 million 1. Transportation Equipment $130 million
2. Machinery (except Electrical) $187 million 2. Machinery (except Electrical) $68 million
3. Chemicals $159 million 3. Chemicals $22 million
4. Waste & Scrap $134 million 4. Other Manufacturing $16 million
5. Primary Metal Manufacturing $130 million 5. Fabricated Metal Products $10 million * The data for MI-12 reflect the combined exports of Macomb and Oakland counties. The figures may understate the MI-12 district’s total exports to China because county-specific information for some products (e.g., mining, forestry, fishing, and waste and scrap) is not available.
$45 $52 $61$78
$132$148
$215
$278 $272
2000 2001 2002 2003 2004 2005 2006 2007 2008
Estimated Growth in Exports from Michigan’s 12th Congressional District, 2000–08
Exports to China: 504% Exports to Rest of World: 19%
Michigan's 12th Congressional District: Exports to China ($ million)

© 2009, The US-China Business Council
Sources: The Trade Partnership from US Census Bureau and US Department of Agriculture data.
Michigan’s Top Exports to China, 2008 MI-13: Top Exports to China, 2008* 1. Transportation Equipment $432 million 1. Transportation Equipment $136 million
2. Machinery (except Electrical) $187 million 2. Primary Metal Manufacturing $49 million
3. Chemicals $159 million 3. Machinery (except Electrical) $29 million
4. Waste & Scrap $134 million 4. Other Manufacturing $15 million
5. Primary Metal Manufacturing $130 million 5. Chemicals $14 million * The data for MI-13 reflect the exports of Wayne County, which also includes other districts. The figures may understate the MI-13 district’s total exports to China because county-specific information for some products (e.g., mining, forestry, fishing, and waste and scrap) is not available.
$45 $52 $60$78
$132$147
$215
$277 $271
2000 2001 2002 2003 2004 2005 2006 2007 2008
Estimated Growth in Exports from Michigan’s 13th Congressional District, 2000–08
Exports to China: 504% Exports to Rest of World: 19%
Michigan's 13th Congressional District: Exports to China ($ million)

© 2009, The US-China Business Council
Sources: The Trade Partnership from US Census Bureau and US Department of Agriculture data.
Michigan’s Top Exports to China, 2008 MI-14: Top Exports to China, 2008* 1. Transportation Equipment $432 million 1. Transportation Equipment $136 million
2. Machinery (except Electrical) $187 million 2. Primary Metal Manufacturing $49 million
3. Chemicals $159 million 3. Machinery (except Electrical) $29 million
4. Waste & Scrap $134 million 4. Other Manufacturing $15 million
5. Primary Metal Manufacturing $130 million 5. Chemicals $14 million * The data for MI-14 reflect the exports of Wayne County, which also includes other districts. The figures may understate the MI-14 district’s total exports to China because county-specific information for some products (e.g., mining, forestry, fishing, and waste and scrap) is not available.
$45 $52 $60$78
$132$147
$215
$277 $271
2000 2001 2002 2003 2004 2005 2006 2007 2008
Estimated Growth in Exports from Michigan’s 14th Congressional District, 2000–08
Exports to China: 504% Exports to Rest of World: 19%
Michigan's 14th Congressional District: Exports to China ($ million)

© 2009, The US-China Business Council
Sources: The Trade Partnership from US Census Bureau and US Department of Agriculture data.
Michigan’s Top Exports to China, 2008 MI-15: Top Exports to China, 2008* 1. Transportation Equipment $432 million 1. Transportation Equipment $150 million
2. Machinery (except Electrical) $187 million 2. Primary Metal Manufacturing $49 million
3. Chemicals $159 million 3. Machinery (except Electrical) $34 million
4. Waste & Scrap $134 million 4. Other Manufacturing $28 million
5. Primary Metal Manufacturing $130 million 5. Computers & Electronics $26 million * The data for MI-15 reflect the combined exports of Monroe, Washtenaw, and Wayne counties. The figures may understate the MI-15 district’s total exports to China because county-specific information for some products (e.g., mining, forestry, fishing, and waste and scrap) is not available.
$54 $63 $73$94
$159$178
$259
$334 $328
2000 2001 2002 2003 2004 2005 2006 2007 2008
Estimated Growth in Exports from Michigan’s 15th Congressional District, 2000–08
Exports to China: 504% Exports to Rest of World: 19%
Michigan's 15th Congressional District: Exports to China ($ million)

© 2009, The US-China Business Council
Sources: The Trade Partnership from US Census Bureau and US Department of Agriculture data.
Minnesota’s Top Exports to China, 2008
MN-1: Top Exports to China, 2008*
1. Machinery (except Electrical) $255 million 1. Other Manufacturing $167 million
2. Computers & Electronics $224 million 2. Crop Production $12 million
3. Paper Products $70 million 3. Computers & Electronics $6 million
4. Waste & Scrap $69 million 4. Processed Foods $3 million
5. Chemicals $63 million 5. Fabricated Metal Products $3 million * The data for MN-1 reflect the combined exports of Blue Earth, Brown, Cottonwood, Dodge, Faribault, Fillmore, Freeborn, Houston, Jackson, Le Sueur, Martin, Mower, Murray, Nicollet, Nobles, Olmstead, Pipestone, Rock, Steele, Wabasha, Waseca, Watonwan, and Winona counties. The figures may understate the MN-1 district’s total exports to China because county-specific information for some products (e.g., mining, forestry, fishing, and waste and scrap) is not available.
$41 $41
$62$70 $75
$136
$164$181
$193
2000 2001 2002 2003 2004 2005 2006 2007 2008
Estimated Growth in Exports from Minnesota’s 1st Congressional District, 2000–08
Exports to China: 367% Exports to Rest of World: 77%
Minnesota’s 1st Congressional District: Exports to China ($ million)

© 2009, The US-China Business Council
Sources: The Trade Partnership from US Census Bureau and US Department of Agriculture data.
Minnesota’s Top Exports to China, 2008
MN-2: Top Exports to China, 2008*
1. Machinery (except Electrical) $255 million 1. Machinery (except Electrical) $130 million
2. Computers & Electronics $224 million 2. Computers & Electronics $83 million
3. Paper Products $70 million 3. Miscellaneous Manufacturing $32 million
4. Waste & Scrap $69 million 4. Plastics & Rubber Products $30 million
5. Chemicals $63 million 5. Chemicals $23 million * The data for MN-2 reflect the combined exports of Carver, Dakota, Goodhue, Hennepin, Le Sueur, Rice, Scott, and Washington counties. The figures may understate the MN-2 district’s total exports to China because county-specific information for some products (e.g., mining, forestry, fishing, and waste and scrap) is not available.
$79 $87$114
$146 $158
$286
$334 $341
$381
2000 2001 2002 2003 2004 2005 2006 2007 2008
Estimated Growth in Exports from Minnesota’s 2nd Congressional District, 2000–08
Exports to China: 379% Exports to Rest of World: 76%
Minnesota’s 2nd Congressional District: Exports to China ($ million)
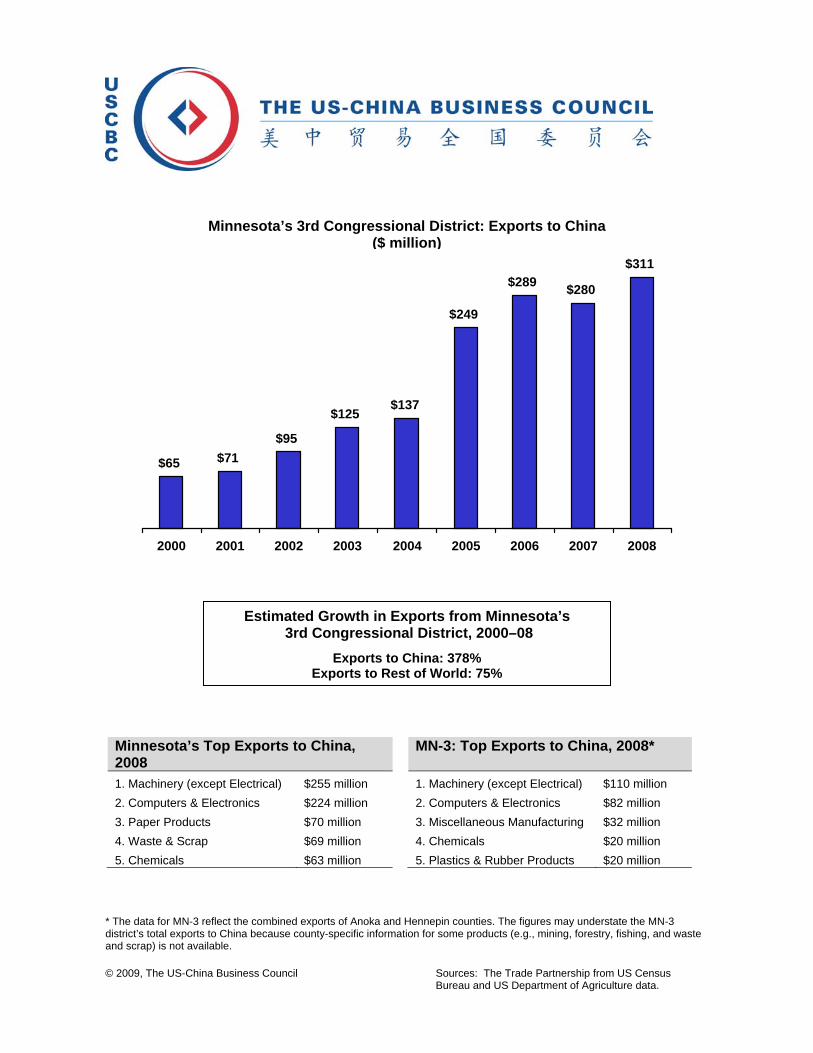
© 2009, The US-China Business Council
Sources: The Trade Partnership from US Census Bureau and US Department of Agriculture data.
Minnesota’s Top Exports to China, 2008
MN-3: Top Exports to China, 2008*
1. Machinery (except Electrical) $255 million 1. Machinery (except Electrical) $110 million
2. Computers & Electronics $224 million 2. Computers & Electronics $82 million
3. Paper Products $70 million 3. Miscellaneous Manufacturing $32 million
4. Waste & Scrap $69 million 4. Chemicals $20 million
5. Chemicals $63 million 5. Plastics & Rubber Products $20 million * The data for MN-3 reflect the combined exports of Anoka and Hennepin counties. The figures may understate the MN-3 district’s total exports to China because county-specific information for some products (e.g., mining, forestry, fishing, and waste and scrap) is not available.
$65 $71$95
$125$137
$249
$289 $280
$311
2000 2001 2002 2003 2004 2005 2006 2007 2008
Estimated Growth in Exports from Minnesota’s 3rd Congressional District, 2000–08
Exports to China: 378% Exports to Rest of World: 75%
Minnesota’s 3rd Congressional District: Exports to China ($ million)

© 2009, The US-China Business Council
Sources: The Trade Partnership from US Census Bureau and US Department of Agriculture data.
Minnesota’s Top Exports to China, 2008
MN-4: Top Exports to China, 2008*
1. Machinery (except Electrical) $255 million 1. Other Manufacturing $63 million
2. Computers & Electronics $224 million 2. Computers & Electronics $52 million
3. Paper Products $70 million 3. Machinery (except Electrical) $34 million
4. Waste & Scrap $69 million 4. Paper Products $15 million
5. Chemicals $63 million 5. Chemicals $13 million * The data for MN-4 reflect the combined exports of Dakota, Ramsey, and Washington counties. The figures may understate the MN-4 district’s total exports to China because county-specific information for some products (e.g., mining, forestry, fishing, and waste and scrap) is not available.
$45 $49$64
$83 $89
$161
$188 $191
$214
2000 2001 2002 2003 2004 2005 2006 2007 2008
Estimated Growth in Exports from Minnesota’s 4th Congressional District, 2000–08
Exports to China: 380% Exports to Rest of World: 76%
Minnesota’s 4th Congressional District: Exports to China ($ million)

© 2009, The US-China Business Council
Sources: The Trade Partnership from US Census Bureau and US Department of Agriculture data.
Minnesota’s Top Exports to China, 2008
MN-5: Top Exports to China, 2008*
1. Machinery (except Electrical) $255 million 1. Computers & Electronics $134 million
2. Computers & Electronics $224 million 2. Machinery (except Electrical) $126 million
3. Paper Products $70 million 3. Miscellaneous Manufacturing $40 million
4. Waste & Scrap $69 million 4. Chemicals $25 million
5. Chemicals $63 million 5. Paper Products $24 million * The data for MN-5 reflect the combined exports of Anoka, Hennepin, and Ramsey counties. The figures may understate the MN-5 district’s total exports to China because county-specific information for some products (e.g., mining, forestry, fishing, and waste and scrap) is not available.
$92 $100$135
$174 $184
$336
$373 $367
$413
2000 2001 2002 2003 2004 2005 2006 2007 2008
Estimated Growth in Exports from Minnesota’s 5th Congressional District, 2000–08
Exports to China: 349% Exports to Rest of World: 75%
Minnesota’s 5th Congressional District: Exports to China ($ million)

© 2009, The US-China Business Council
Sources: The Trade Partnership from US Census Bureau and US Department of Agriculture data.
Minnesota’s Top Exports to China, 2008
MN-6: Top Exports to China, 2008*
1. Machinery (except Electrical) $255 million 1. Machinery (except Electrical) $143 million
2. Computers & Electronics $224 million 2. Computers & Electronics $134 million
3. Paper Products $70 million 3. Miscellaneous Manufacturing $41 million
4. Waste & Scrap $69 million 4. Chemicals $33 million
5. Chemicals $63 million 5. Plastics & Rubber Products $26 million * The data for MN-6 reflect the combined exports of Anoka, Benton, Hennepin, Ramsey, Sherburne, Stearns, Washington, and Wright counties. The figures may understate the MN-6 district’s total exports to China because county-specific information for some products (e.g., mining, forestry, fishing, and waste and scrap) is not available.
$97 $105$143
$184 $197
$360
$408 $401
$447
2000 2001 2002 2003 2004 2005 2006 2007 2008
Estimated Growth in Exports from Minnesota’s 6th Congressional District, 2000–08
Exports to China: 362% Exports to Rest of World: 76%
Minnesota’s 6th Congressional District: Exports to China ($ million)

© 2009, The US-China Business Council
Sources: The Trade Partnership from US Census Bureau and US Department of Agriculture data.
Minnesota’s Top Exports to China, 2008
MN-7: Top Exports to China, 2008*
1. Machinery (except Electrical) $255 million 1. Other Manufacturing $78 million
2. Computers & Electronics $224 million 2. Crop Production $17 million
3. Paper Products $70 million 3. Machinery (except Electrical) $11 million
4. Waste & Scrap $69 million 4. Processed Foods $5 million
5. Chemicals $63 million 5. Computers & Electronics $1 million
* The data for MN-7 reflect the combined exports of Becker, Beltrami, Big Stone, Chippewa, Clay, Clearwater, Douglas, Grant, Kandiyohi, Kittson, Lac qui Parle, Lake of the Woods, Lincoln, Lyon, Mahnomen, Marshall, McLeod, Meeker, Norman, Otter Tail, Pennington, Polk, Pope, Red Lake, Redwood, Renville, Roseau, Sibley, Stearns, Stevens, Swift, Todd, Traverse, Wilkin, and Yellow Medicine counties. The figures may understate the MN-7 district’s total exports to China because county-specific information for some products (e.g., mining, forestry, fishing, and waste and scrap) is not available.
$26 $22
$42 $38 $41
$73
$93
$117 $115
2000 2001 2002 2003 2004 2005 2006 2007 2008
Estimated Growth in Exports from Minnesota’s 7th Congressional District, 2000–08
Exports to China: 344% Exports to Rest of World: 78%
Minnesota’s 7th Congressional District: Exports to China ($ million)

© 2009, The US-China Business Council
Sources: The Trade Partnership from US Census Bureau and US Department of Agriculture data.
Minnesota’s Top Exports to China, 2008
MN-8: Top Exports to China, 2008*
1. Machinery (except Electrical) $255 million 1. Other Manufacturing $37 million
2. Computers & Electronics $224 million 2. Computers & Electronics $2 million
3. Paper Products $70 million 3. Plastics & Rubber Products $1 million
4. Waste & Scrap $69 million 4. Fabricated Metal Products $1 million
5. Chemicals $63 million 5. Crop Production $1 million
* The data for MN-8 reflect the combined exports of Aitkin, Beltrami, Carlton, Cass, Chisago, Cook, Crow Wing, Hubbard, Isanti, Itasca, Kanabec, Koochiching, Lake, Mille Lacs, Morrison, Pine, St. Louis, and Wadena counties. The figures may understate the MN-8 district’s total exports to China because county-specific information for some products (e.g., mining, forestry, fishing, and waste and scrap) is not available.
$9 $10$13
$16 $17
$32
$37$39
$43
2000 2001 2002 2003 2004 2005 2006 2007 2008
Estimated Growth in Exports from Minnesota’s 8th Congressional District, 2000–08
Exports to China: 375% Exports to Rest of World: 77%
Minnesota’s 8th Congressional District: Exports to China ($ million)

© 2009, The US-China Business Council
Sources: The Trade Partnership from US Census Bureau and US Department of Agriculture data.
Mississippi’s Top Exports to China, 2008
MS-1: Top Exports to China, 2008*
1. Crop Production $143 million 1. Other Manufacturing $82 million
2. Processed Foods $87 million 2. Crop Production $26 million
3. Chemicals $61 million 3. Plastics & Rubber Products $709,000
4. Computers & Electronics $23 million 4. Wood Products $571,000
5. Wood Products $14 million 5. Fabricated Metal Products $278,000 * The data for MS-1 reflect the combined exports of Alcorn, Benton, Calhoun, Chickasaw, Choctaw, Clay, DeSoto, Grenada, Itawamba, Lafayette, Lee, Lowndes, Marshall, Monroe, Panola, Pontotoc, Prentiss, Tate, Tippah, Tishomingo, Union, Webster, Winston, and Yalobusha counties. The figures may understate the MS-1 district’s total exports to China because county-specific information for some products (e.g., mining, forestry, fishing, and waste and scrap) is not available.
$28$34
$51
$36 $37
$57
$87
$100
$110
2000 2001 2002 2003 2004 2005 2006 2007 2008
Estimated Growth in Exports from Mississippi’s 1st Congressional District, 2000–08
Exports to China: 301% Exports to Rest of World: 159%
Mississippi's 1st Congressional District: Exports to China ($ million)

© 2009, The US-China Business Council
Sources: The Trade Partnership from US Census Bureau and US Department of Agriculture data.
Mississippi’s Top Exports to China, 2008
MS-2: Top Exports to China, 2008*
1. Crop Production $143 million 1. Crop Production $102 million
2. Processed Foods $87 million 2. Other Manufacturing $29 million
3. Chemicals $61 million 3. Processed Foods $2 million
4. Computers & Electronics $23 million 4. Chemicals $2 million
5. Wood Products $14 million 5. Machinery (except Electrical) $1 million * The data for MS-2 reflect the combined exports of Attala, Bolivar, Carroll, Claiborne, Coahoma, Copiah, Hinds, Holmes, Humphreys, Issaquena, Jefferson, Leake, Leflore, Madison, Montgomery, Quitman, Sharkey, Sunflower, Tallahatchie, Tunica, Warren, Washington, and Yazoo counties. The figures may understate the MS-2 district’s total exports to China because county-specific information for some products (e.g., mining, forestry, fishing, and waste and scrap) is not available.
$12 $14$26
$32 $35 $38
$74
$142 $138
2000 2001 2002 2003 2004 2005 2006 2007 2008
Estimated Growth in Exports from Mississippi’s 2nd Congressional District, 2000–08
Exports to China: 1,076% Exports to Rest of World: 172%
Mississippi's 2nd Congressional District: Exports to China ($ million)

© 2009, The US-China Business Council
Sources: The Trade Partnership from US Census Bureau and US Department of Agriculture data.
Mississippi’s Top Exports to China, 2008
MS-3: Top Exports to China, 2008*
1. Crop Production $143 million 1. Other Manufacturing $23 million
2. Processed Foods $87 million 2. Processed Foods $14 million
3. Chemicals $61 million 3. Crop Production $12 million
4. Computers & Electronics $23 million 4. Chemicals $10 million
5. Wood Products $14 million 5. Machinery (except Electrical) $1 million * The data for MS-3 reflect the combined exports of Adams, Amite, Covington, Franklin, Hinds, Jasper, Jefferson Davis, Jones, Kemper, Lauderdale, Lawrence, Leake, Lincoln, Madison, Marion, Neshoba, Newton, Noxubee, Oktibbeha, Pike, Rankin, Scott, Simpson, Smith, Walthall, Webster, Wilkinson, and Winston counties. The figures may understate the MS-3 district’s total exports to China because county-specific information for some products (e.g., mining, forestry, fishing, and waste and scrap) is not available.
$16$19
$29
$20 $21
$32
$49$54
$60
2000 2001 2002 2003 2004 2005 2006 2007 2008
Estimated Growth in Exports from Mississippi’s 3rd Congressional District, 2000–08
Exports to China: 277% Exports to Rest of World: 159%
Mississippi's 3rd Congressional District: Exports to China ($ million)

© 2009, The US-China Business Council
Sources: The Trade Partnership from US Census Bureau and US Department of Agriculture data.
Mississippi’s Top Exports to China, 2008
MS-4: Top Exports to China, 2008*
1. Crop Production $143 million 1. Manufacturing $11 million
2. Processed Foods $87 million 2. Crop Production $5 million
3. Chemicals $61 million
4. Computers & Electronics $23 million
5. Wood Products $14 million * The data for MS-4 reflect the combined exports of Clarke, Forrest, George, Greene, Hancock, Harrison, Jackson, Jasper, Jones, Lamar, Marion, Pearl River, Perry, Stone, and Wayne counties. The figures may understate the MS-4 district’s total exports to China because county-specific information for some products (e.g., mining, forestry, fishing, and waste and scrap) is not available.
$4$5
$7
$5 $5
$8
$12
$15$16
2000 2001 2002 2003 2004 2005 2006 2007 2008
Estimated Growth in Exports from Mississippi’s 4th Congressional District, 2000–08
Exports to China: 332% Exports to Rest of World: 160%
Mississippi's 4th Congressional District: Exports to China ($ million)

© 2009, The US-China Business Council
Sources: The Trade Partnership from US Census Bureau and US Department of Agriculture data.
Missouri’s Top Exports to China, 2008 MO-1: Top Exports to China, 2008* 1. Waste & Scrap $322 million 1. Chemicals $57 million
2. Chemicals $123 million 2. Other Manufacturing $39 million
3. Machinery (except Electrical) $103 million 3. Machinery (except Electrical) $25 million
4. Minerals & Ores $65 million 4. Transportation Equipment $18 million
5. Computers & Electronics $58 million 5. Computers & Electronics $12 million * The data for MO-1 reflect the combined exports of St. Louis City and St. Louis County, which also include other congressional districts. The figures may understate the MO-1 district’s total exports to China because county-specific information for some products (e.g., mining, forestry, fishing, and waste and scrap) is not available.
$23$31 $37
$73
$95
$113
$136
$194
$165
2000 2001 2002 2003 2004 2005 2006 2007 2008
Estimated Growth in Exports from Missouri’s 1st Congressional District, 2000–08
Exports to China: 605% Exports to Rest of World: 74%
Missouri's 1st Congressional District: Exports to China ($ million)

© 2009, The US-China Business Council
Sources: The Trade Partnership from US Census Bureau and US Department of Agriculture data.
Missouri’s Top Exports to China, 2008 MO-2: Top Exports to China, 2008* 1. Waste & Scrap $322 million 1. Other Manufacturing $53 million
2. Chemicals $123 million 2. Machinery (except Electrical) $33 million
3. Machinery (except Electrical) $103 million 3. Chemicals $19 million
4. Minerals & Ores $65 million 4. Computers & Electronics $19 million
5. Computers & Electronics $58 million 5. Transportation Equipment $18 million * The data for MO-2 reflect the combined exports of Lincoln, St. Charles, and St. Louis counties. The figures may understate the MO-2 district’s total exports to China because county-specific information for some products (e.g., mining, forestry, fishing, and waste and scrap) is not available.
$22 $28$34
$67
$87
$104
$125
$181
$153
2000 2001 2002 2003 2004 2005 2006 2007 2008
Estimated Growth in Exports from Missouri’s 2nd Congressional District, 2000–08
Exports to China: 611% Exports to Rest of World: 75%
Missouri's 2nd Congressional District: Exports to China ($ million)

© 2009, The US-China Business Council
Sources: The Trade Partnership from US Census Bureau and US Department of Agriculture data.
Missouri’s Top Exports to China, 2008 MO-3: Top Exports to China, 2008* 1. Waste & Scrap $322 million 1. Chemicals $57 million
2. Chemicals $123 million 2. Other Manufacturing $44 million
3. Machinery (except Electrical) $103 million 3. Machinery (except Electrical) $25 million
4. Minerals & Ores $65 million 4. Transportation Equipment $18 million
5. Computers & Electronics $58 million 5. Computers & Electronics $12 million * The data for MO-3 reflect the combined exports of St. Louis City, and Jefferson, St. Louis, and Ste. Genevieve counties. The figures may understate the MO-3 district’s total exports to China because county-specific information for some products (e.g., mining, forestry, fishing, and waste and scrap) is not available.
$24$32 $38
$76
$99
$118
$142
$202
$172
2000 2001 2002 2003 2004 2005 2006 2007 2008
Estimated Growth in Exports from Missouri’s 3rd Congressional District, 2000–08
Exports to China: 606% Exports to Rest of World: 74%
Missouri's 3rd Congressional District: Exports to China ($ million)

© 2009, The US-China Business Council
Sources: The Trade Partnership from US Census Bureau and US Department of Agriculture data.
Missouri’s Top Exports to China, 2008 MO-4: Top Exports to China, 2008* 1. Waste & Scrap $322 million 1. Chemicals $33 million
2. Chemicals $123 million 2. Other Manufacturing $26 million
3. Machinery (except Electrical) $103 million 3. Computers & Electronics $13 million
4. Minerals & Ores $65 million 4. Crop Production $9 million
5. Computers & Electronics $58 million 5. Processed Foods $3 million * The data for MO-4 reflect the combined exports of Barton, Bates, Benton, Camden, Cass, Cedar, Cole, Dade, Dallas, Henry, Hickory, Jackson, Johnson, Laclede, Lafayette, Moniteau, Morgan, Pettis, Polk, Pulaski, Ray, Saline, St. Clair, Vernon, and Webster counties. The figures may understate the MO-4 district’s total exports to China because county-specific information for some products (e.g., mining, forestry, fishing, and waste and scrap) is not available.
$11$15 $18
$35
$45
$56$64
$111
$88
2000 2001 2002 2003 2004 2005 2006 2007 2008
Estimated Growth in Exports from Missouri’s 4th Congressional District, 2000–08
Exports to China: 694% Exports to Rest of World: 82%
Missouri's 4th Congressional District: Exports to China ($ million)

© 2009, The US-China Business Council
Sources: The Trade Partnership from US Census Bureau and US Department of Agriculture data.
Missouri’s Top Exports to China, 2008 MO-5: Top Exports to China, 2008* 1. Waste & Scrap $322 million 1. Chemicals $33 million
2. Chemicals $123 million 2. Computers & Electronics $13 million
3. Machinery (except Electrical) $103 million 3. Processed Foods $3 million
4. Minerals & Ores $65 million 4. Crop Production $1 million
5. Computers & Electronics $58 million 5. Nonmetallic Mineral Products $430,000 * The data for MO-5 reflect the combined exports of Cass and Jackson counties. The figures may understate the MO-5 district’s total exports to China because county-specific information for some products (e.g., mining, forestry, fishing, and waste and scrap) is not available.
$7$9 $9
$21
$31$28
$33
$57
$51
2000 2001 2002 2003 2004 2005 2006 2007 2008
Estimated Growth in Exports from Missouri’s 5th Congressional District, 2000–08
Exports to China: 654% Exports to Rest of World: 74%
Missouri's 5th Congressional District: Exports to China ($ million)

© 2009, The US-China Business Council
Sources: The Trade Partnership from US Census Bureau and US Department of Agriculture data.
Missouri’s Top Exports to China, 2008 MO-6: Top Exports to China, 2008* 1. Waste & Scrap $322 million 1. Other Manufacturing $61 million
2. Chemicals $123 million 2. Chemicals $33 million
3. Machinery (except Electrical) $103 million 3. Computers & Electronics $13 million
4. Minerals & Ores $65 million 4. Crop Production $13 million
5. Computers & Electronics $58 million 5. Processed Foods $3 million * The data for MO-6 reflect the combined exports of Andrew, Atchison, Buchanan, Caldwell, Carroll, Chariton, Clay, Clinton, Cooper, Daviess, DeKalb, Gentry, Grundy, Harrison, Holt, Howard, Jackson, Linn, Livingston, Mercer, Nodaway, Platte, Putnam, Schuyler, Sullivan, and Worth counties. The figures may understate the MO-6 district’s total exports to China because county-specific information for some products (e.g., mining, forestry, fishing, and waste and scrap) is not available.
$16 $21 $25
$50$64
$80$93
$157
$124
2000 2001 2002 2003 2004 2005 2006 2007 2008
Estimated Growth in Exports from Missouri’s 6th Congressional District, 2000–08
Exports to China: 682% Exports to Rest of World: 82%
Missouri's 6th Congressional District: Exports to China ($ million)

© 2009, The US-China Business Council
Sources: The Trade Partnership from US Census Bureau and US Department of Agriculture data.
Missouri’s Top Exports to China, 2008 MO-7: Top Exports to China, 2008* 1. Waste & Scrap $322 million 1. Other Manufacturing $35 million
2. Chemicals $123 million 2. Machinery (except Electrical) $4 million
3. Machinery (except Electrical) $103 million 3. Processed Foods $4 million
4. Minerals & Ores $65 million 4. Fabricated Metal Products $2 million
5. Computers & Electronics $58 million 5. Crop Production $2 million * The data for MO-7 reflect the combined exports of Barry, Christian, Greene, Jasper, Lawrence, McDonald, Newton, Polk, Stone, and Taney counties. The figures may understate the MO-7 district’s total exports to China because county-specific information for some products (e.g., mining, forestry, fishing, and waste and scrap) is not available.
$6$9 $10
$20
$26
$32
$37
$56
$47
2000 2001 2002 2003 2004 2005 2006 2007 2008
Estimated Growth in Exports from Missouri’s 7th Congressional District, 2000–08
Exports to China: 639% Exports to Rest of World: 77%
Missouri's 7th Congressional District: Exports to China ($ million)

© 2009, The US-China Business Council
Sources: The Trade Partnership from US Census Bureau and US Department of Agriculture data.
Missouri’s Top Exports to China, 2008 MO-8: Top Exports to China, 2008* 1. Waste & Scrap $322 million 1. Other Manufacturing $22 million
2. Chemicals $123 million 2. Crop Production $14 million
3. Machinery (except Electrical) $103 million 3. Machinery (except Electrical) $2 million
4. Minerals & Ores $65 million 4. Animal Production $447,000
5. Computers & Electronics $58 million 5. Plastics & Rubber Products $348,00 * The data for MO-8 reflect the combined exports of Bollinger, Butler, Cape Girardeau, Carter, Dent, Douglas, Dunklin, Howell, Iron, Madison, Mississippi, New Madrid, Oregon, Ozark, Pemiscot, Perry, Phelps, Reynolds, Ripley, Scott, Shannon, St. Francois, Stoddard, Taney, Texas, Washington, Wayne, and Wright counties. The figures may understate the MO-8 district’s total exports to China because county-specific information for some products (e.g., mining, forestry, fishing, and waste and scrap) is not available.
$4 $5 $6
$12$15
$22 $22
$61
$40
2000 2001 2002 2003 2004 2005 2006 2007 2008
Estimated Growth in Exports from Missouri’s 8th Congressional District, 2000–08
Exports to China: 972% Exports to Rest of World: 110%
Missouri's 8th Congressional District: Exports to China ($ million)

© 2009, The US-China Business Council
Sources: The Trade Partnership from US Census Bureau and US Department of Agriculture data.
Missouri’s Top Exports to China, 2008 MO-9: Top Exports to China, 2008* 1. Waste & Scrap $322 million 1. Other Manufacturing $30 million
2. Chemicals $123 million 2. Machinery (except Electrical) $18 million
3. Machinery (except Electrical) $103 million 3. Crop Production $11 million
4. Minerals & Ores $65 million 4. Computers & Electronics $7 million
5. Computers & Electronics $58 million 5. Plastics & Rubber Products $1 million * The data for MO-9 reflect the combined exports of Adair, Audrain, Boone, Callaway, Camden, Clark, Crawford, Franklin, Gasconade, Knox, Lewis, Macon, Maries, Marion, Miller, Monroe, Montgomery, Osage, Pike, Ralls, Randolph, Scotland, Shelby, St. Charles, and Warren counties. The figures may understate the MO-9 district’s total exports to China because county-specific information for some products (e.g., mining, forestry, fishing, and waste and scrap) is not available.
$8$11 $13
$26$34
$43$49
$92
$70
2000 2001 2002 2003 2004 2005 2006 2007 2008
Estimated Growth in Exports from Missouri’s 9th Congressional District, 2000–08
Exports to China: 736% Exports to Rest of World: 87%
Missouri's 9th Congressional District: Exports to China ($ million)
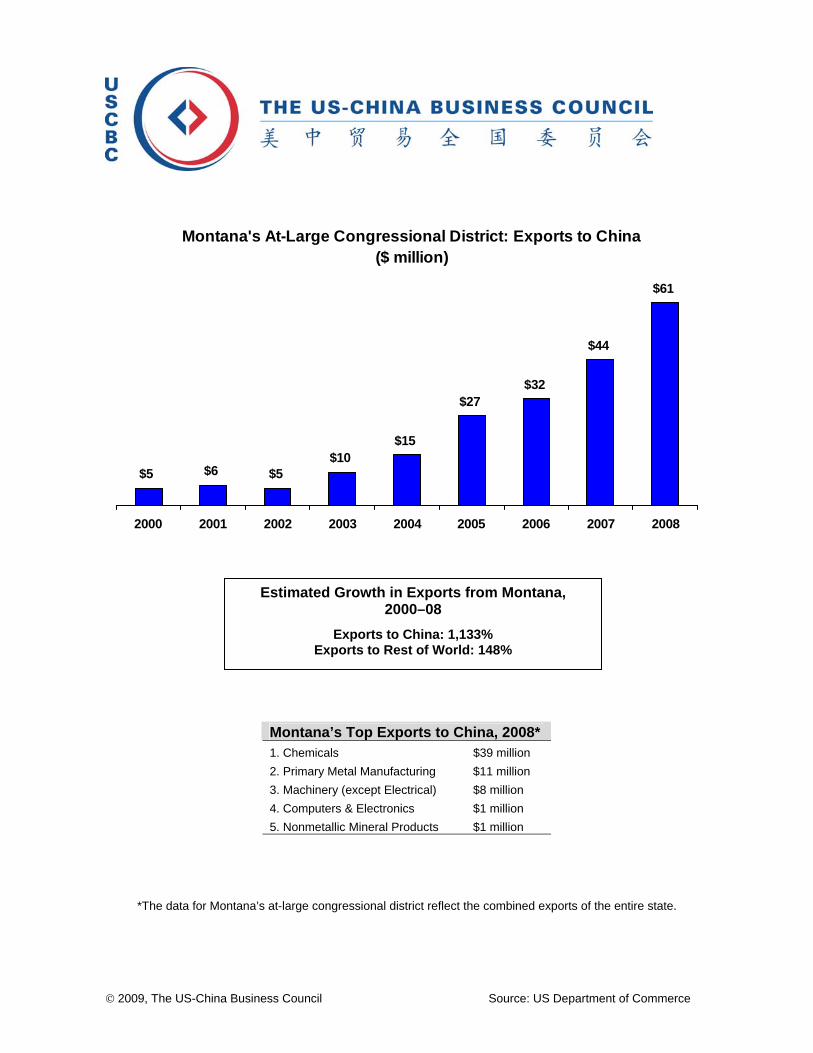
© 2009, The US-China Business Council Source: US Department of Commerce
Montana’s Top Exports to China, 2008* 1. Chemicals $39 million
2. Primary Metal Manufacturing $11 million
3. Machinery (except Electrical) $8 million
4. Computers & Electronics $1 million
5. Nonmetallic Mineral Products $1 million
*The data for Montana’s at-large congressional district reflect the combined exports of the entire state.
Montana's At-Large Congressional District: Exports to China ($ million)
$5 $5$10
$15
$27$32
$44
$61
$6
2000 2001 2002 2003 2004 2005 2006 2007 2008
Estimated Growth in Exports from Montana, 2000–08
Exports to China: 1,133% Exports to Rest of World: 148%

© 2009, The US-China Business Council
Sources: The Trade Partnership from US Census Bureau and US Department of Agriculture data.
Nebraska’s Top Exports to China, 2008
NE-1: Top Exports to China, 2008*
1. Processed Foods $101 million 1. Other Manufacturing $36 million
2. Machinery (except Electrical) $33 million 2. Processed Foods $5 million
3. Chemicals $16 million 3. Machinery (except Electrical) $4 million
4. Waste & Scrap $15 million 4. Computers & Electronics $3 million
5. Computers & Electronics $9 million 5. Electrical Equipment $2 million * The data for NE-1 reflect the combined exports of Burt, Butler, Cass, Cedar, Colfax, Cuming, Dakota, Dixon, Dodge, Gage, Johnson, Lancaster, Madison, Nemaha, Otoe, Pawnee, Richardson, Sarpy, Saunders, Seward, Stanton, Thurston, Washington, and Wayne counties. The figures may understate the NE-1 district’s total exports to China because county-specific information for some products (e.g., mining, forestry, fishing, and waste and scrap) is not available.
$13
$18$20
$22 $22
$28
$45$49 $50
2000 2001 2002 2003 2004 2005 2006 2007 2008
Estimated Growth in Exports from Nebraska’s 1st Congressional District, 2000–08
Exports to China: 275% Exports to Rest of World: 105%
Nebraska's 1st Congressional District: Exports to China ($ million)

© 2009, The US-China Business Council
Sources: The Trade Partnership from US Census Bureau and US Department of Agriculture data.
Nebraska’s Top Exports to China, 2008
NE-2: Top Exports to China, 2008*
1. Processed Foods $101 million 1. Processed Foods $24 million
2. Machinery (except Electrical) $33 million 2. Other Manufacturing $16 million
3. Chemicals $16 million 3. Chemicals $4 million
4. Waste & Scrap $15 million 4. Electrical Equipment $2 million
5. Computers & Electronics $9 million 5. Miscellaneous Manufacturing $759,000 * The data for NE-2 reflect the combined exports of Douglas and Sarpy counties. The figures may understate the NE-2 district’s total exports to China because county-specific information for some products (e.g., mining, forestry, fishing, and waste and scrap) is not available. Figures are rounded.
$12
$17$19 $20 $20
$25
$41$45 $46
2000 2001 2002 2003 2004 2005 2006 2007 2008
Estimated Growth in Exports from Nebraska’s 2nd Congressional District, 2000–08
Exports to China: 276% Exports to Rest of World: 87%
Nebraska's 2nd Congressional District: Exports to China ($ million)

© 2009, The US-China Business Council
Sources: The Trade Partnership from US Census Bureau and US Department of Agriculture data.
.
Nebraska’s Top Exports to China, 2008
NE-3: Top Exports to China, 2008*
1. Processed Foods $101 million 1. Other Manufacturing $9 million
2. Machinery (except Electrical) $33 million 2. Machinery (except Electrical) $5 million
3. Chemicals $16 million 3. Processed Foods $3 million
4. Waste & Scrap $15 million 4. Fabricated Metal Products $151,000
5. Computers & Electronics $9 million 5. Crop Production $134,000
* The data for NE-3 reflect the combined exports of Adams, Antelope, Arthur, Banner, Blaine, Boone, Box Butte, Boyd, Brown, Buffalo, Cedar, Chase, Cherry, Cheyenne, Clay, Custer, Dawes, Dawson, Deuel, Dundy, Fillmore, Franklin, Frontier, Furnas, Garden, Garfield, Gosper, Grant, Greeley, Hall, Hamilton, Harlan, Hayes, Hitchcock, Holt, Hooker, Howard, Jefferson, Kearney, Keith, Keya Paha, Kimball, Knox, Lincoln, Logan, Loup, McPherson, Merrick, Morrill, Nance, Nuckolls, Perkins, Phelps, Pierce, Platte, Polk, Red Willow, Rock, Saline, Scotts Bluff, Sheridan, Sherman, Sioux, Thayer, Thomas, Valley, Webster, Wheeler, and York counties. The figures may understate the NE-3 district’s total exports to China because county-specific information for some products (e.g., mining, forestry, fishing, and waste and scrap) is not available.
$5
$7 $7$8 $8
$10
$16
$18 $18
2000 2001 2002 2003 2004 2005 2006 2007 2008
Estimated Growth in Exports from Nebraska’s 3rd Congressional District, 2000–08
Exports to China: 267% Exports to Rest of World: 176%
Nebraska's 3rd Congressional District: Exports to China ($ million)
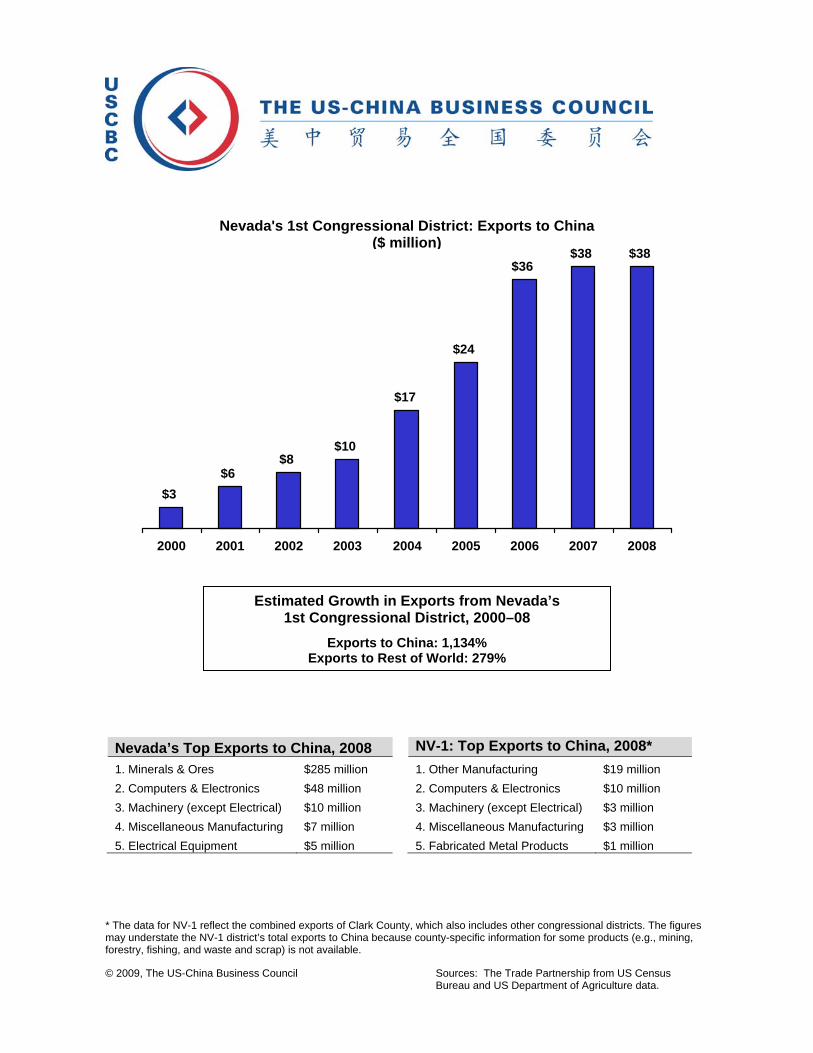
© 2009, The US-China Business Council
Sources: The Trade Partnership from US Census Bureau and US Department of Agriculture data.
Nevada’s Top Exports to China, 2008 NV-1: Top Exports to China, 2008* 1. Minerals & Ores $285 million 1. Other Manufacturing $19 million
2. Computers & Electronics $48 million 2. Computers & Electronics $10 million
3. Machinery (except Electrical) $10 million 3. Machinery (except Electrical) $3 million
4. Miscellaneous Manufacturing $7 million 4. Miscellaneous Manufacturing $3 million
5. Electrical Equipment $5 million 5. Fabricated Metal Products $1 million
* The data for NV-1 reflect the combined exports of Clark County, which also includes other congressional districts. The figures may understate the NV-1 district’s total exports to China because county-specific information for some products (e.g., mining, forestry, fishing, and waste and scrap) is not available.
$3$6
$8$10
$17
$24
$36$38 $38
2000 2001 2002 2003 2004 2005 2006 2007 2008
Estimated Growth in Exports from Nevada’s 1st Congressional District, 2000–08
Exports to China: 1,134% Exports to Rest of World: 279%
Nevada's 1st Congressional District: Exports to China ($ million)

© 2009, The US-China Business Council
Sources: The Trade Partnership from US Census Bureau and US Department of Agriculture data.
Nevada’s Top Exports to China, 2008 NV-2: Top Exports to China, 2008* 1. Minerals & Ores $285 million 1. Computers & Electronics $24 million
2. Computers & Electronics $48 million 2. Machinery (except Electrical) $8 million
3. Machinery (except Electrical) $10 million 3. Miscellaneous Manufacturing $7 million
4. Miscellaneous Manufacturing $7 million 4. Other Manufacturing $4 million
5. Electrical Equipment $5 million 5. Fabricated Metal Products $4 million * The data for NV-2 reflect the combined exports of Carson City and Churchill, Clark, Douglas, Elko, Esmeralda, Eureka, Humboldt, Lander, Lincoln, Lyon, Mineral, Nye, Pershing, Storey, Washoe, and White Pine counties. The figures may understate the NV-2 district’s total exports to China because county-specific information for some products (e.g., mining, forestry, fishing, and waste and scrap) is not available.
$4$8
$11$13
$22
$31
$48$50 $50
2000 2001 2002 2003 2004 2005 2006 2007 2008
Estimated Growth in Exports from Nevada’s 2nd Congressional District, 2000–08
Exports to China: 1130% Exports to Rest of World: 278%
Nevada's 2nd Congressional District: Exports to China ($ million)

© 2009, The US-China Business Council
Sources: The Trade Partnership from US Census Bureau and US Department of Agriculture data.
Nevada’s Top Exports to China, 2008 NV-3: Top Exports to China, 2008* 1. Minerals & Ores $285 million 1. Other Manufacturing $19 million
2. Computers & Electronics $48 million 2. Computers & Electronics $10 million
3. Machinery (except Electrical) $10 million 3. Machinery (except Electrical) $3 million
4. Miscellaneous Manufacturing $7 million 4. Miscellaneous Manufacturing $3 million
5. Electrical Equipment $5 million 5. Fabricated Metal Products $1 million
* The data for NV-3 reflect the combined exports of Clark County, which also includes the other congressional districts. The figures may understate the NV-3 district’s total exports to China because county-specific information for some products (e.g., mining, forestry, fishing, and waste and scrap) is not available.
$3$6
$8$10
$17
$24
$36$38 $38
2000 2001 2002 2003 2004 2005 2006 2007 2008
Estimated Growth in Exports from Nevada’s 3rd Congressional District, 2000–08
Exports to China: 1,134% Exports to Rest of World: 279%
Nevada's 3rd Congressional District: Exports to China ($ million)
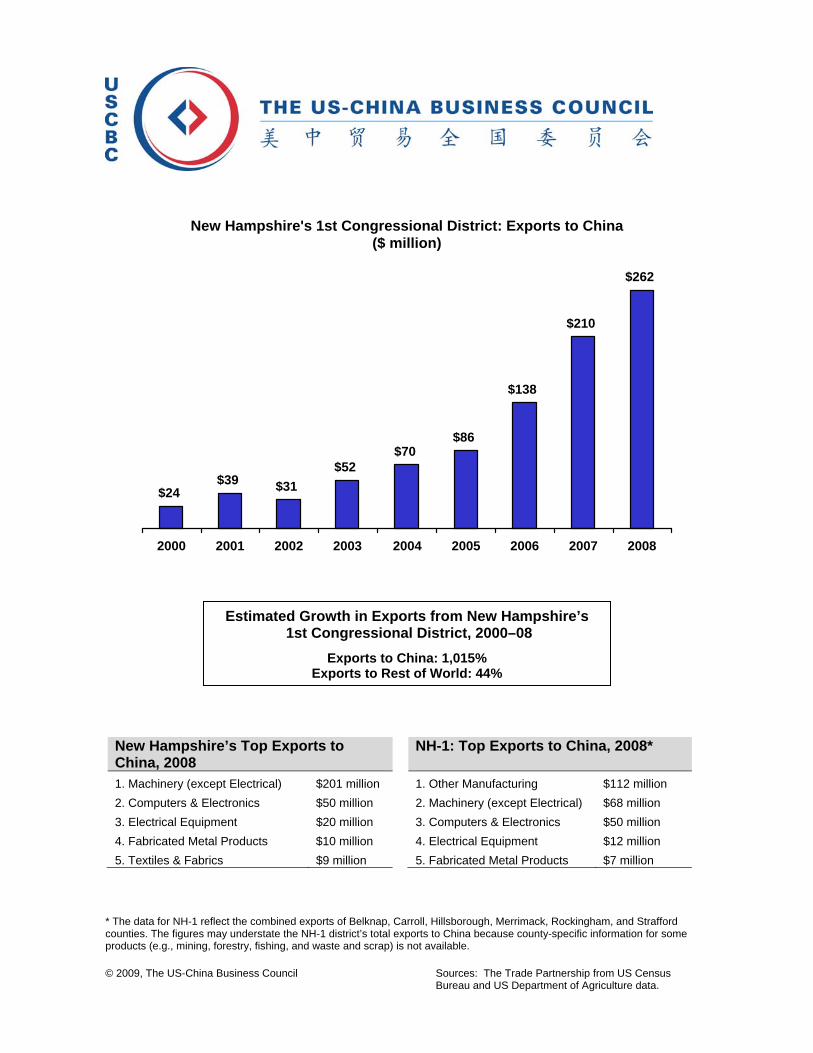
© 2009, The US-China Business Council
Sources: The Trade Partnership from US Census Bureau and US Department of Agriculture data.
New Hampshire’s Top Exports to China, 2008
NH-1: Top Exports to China, 2008*
1. Machinery (except Electrical) $201 million 1. Other Manufacturing $112 million
2. Computers & Electronics $50 million 2. Machinery (except Electrical) $68 million
3. Electrical Equipment $20 million 3. Computers & Electronics $50 million
4. Fabricated Metal Products $10 million 4. Electrical Equipment $12 million
5. Textiles & Fabrics $9 million 5. Fabricated Metal Products $7 million * The data for NH-1 reflect the combined exports of Belknap, Carroll, Hillsborough, Merrimack, Rockingham, and Strafford counties. The figures may understate the NH-1 district’s total exports to China because county-specific information for some products (e.g., mining, forestry, fishing, and waste and scrap) is not available.
$24$39 $31
$52$70
$86
$138
$210
$262
2000 2001 2002 2003 2004 2005 2006 2007 2008
Estimated Growth in Exports from New Hampshire’s 1st Congressional District, 2000–08
Exports to China: 1,015% Exports to Rest of World: 44%
New Hampshire's 1st Congressional District: Exports to China ($ million)

© 2009, The US-China Business Council
Sources: The Trade Partnership from US Census Bureau and US Department of Agriculture data.
New Hampshire’s Top Exports to China, 2008
NH-2: Top Exports to China, 2008*
1. Machinery (except Electrical) $201 million 1. Machinery (except Electrical) $124 million
2. Computers & Electronics $50 million 2. Other Manufacturing $88 million
3. Electrical Equipment $20 million 3. Computers & Electronics $48 million
4. Fabricated Metal Products $10 million 4. Electrical Equipment $12 million
5. Textiles & Fabrics $9 million 5. Fabricated Metal Products $8 million * The data for NH-2 reflect the combined exports of Belknap, Cheshire, Coos, Grafton, Hillsborough, Merrimack, Rockingham, and Sullivan counties. The figures may understate the NH-2 district’s total exports to China because county-specific information for some products (e.g., mining, forestry, fishing, and waste and scrap) is not available.
$26$43 $34
$58$79
$96
$154
$235
$294
2000 2001 2002 2003 2004 2005 2006 2007 2008
Estimated Growth in Exports from New Hampshire’s 2nd Congressional District, 2000–08
Exports to China: 1,015% Exports to Rest of World: 44%
New Hampshire's 2nd Congressional District: Exports to China ($ million)
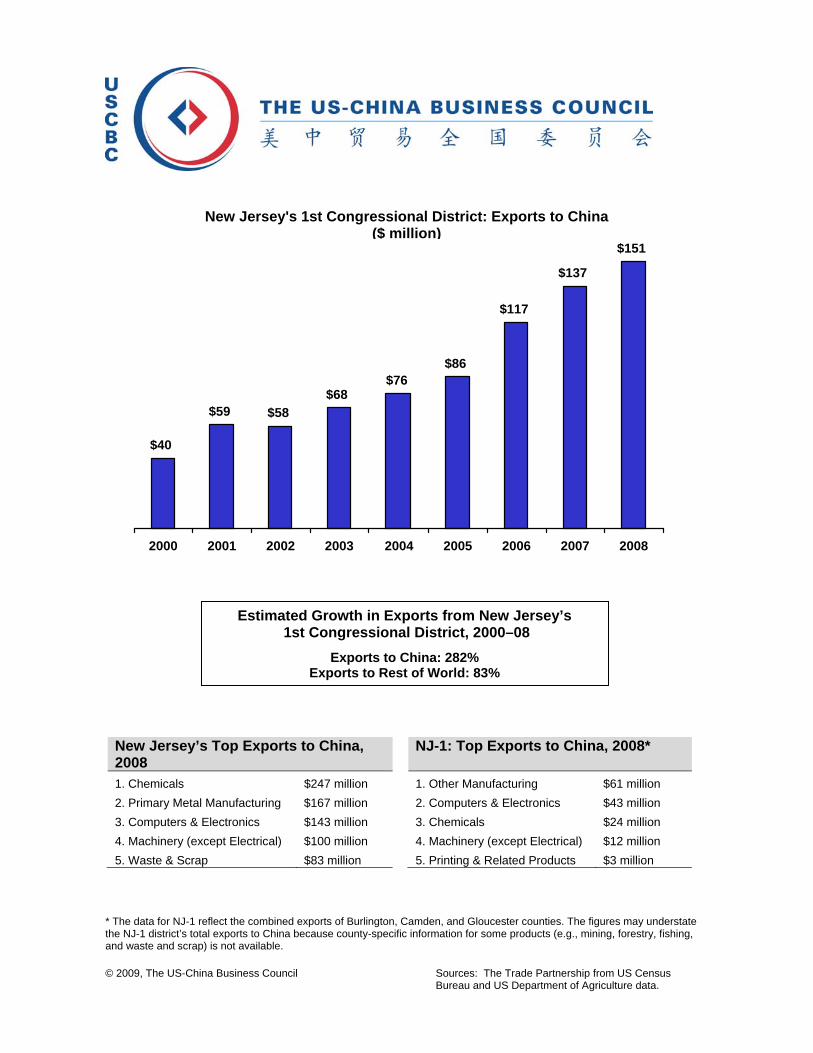
© 2009, The US-China Business Council
Sources: The Trade Partnership from US Census Bureau and US Department of Agriculture data.
New Jersey’s Top Exports to China, 2008
NJ-1: Top Exports to China, 2008*
1. Chemicals $247 million 1. Other Manufacturing $61 million
2. Primary Metal Manufacturing $167 million 2. Computers & Electronics $43 million
3. Computers & Electronics $143 million 3. Chemicals $24 million
4. Machinery (except Electrical) $100 million 4. Machinery (except Electrical) $12 million
5. Waste & Scrap $83 million 5. Printing & Related Products $3 million * The data for NJ-1 reflect the combined exports of Burlington, Camden, and Gloucester counties. The figures may understate the NJ-1 district’s total exports to China because county-specific information for some products (e.g., mining, forestry, fishing, and waste and scrap) is not available.
$40
$59 $58$68
$76$86
$117
$137
$151
2000 2001 2002 2003 2004 2005 2006 2007 2008
Estimated Growth in Exports from New Jersey’s 1st Congressional District, 2000–08
Exports to China: 282% Exports to Rest of World: 83%
New Jersey's 1st Congressional District: Exports to China ($ million)

© 2009, The US-China Business Council
Sources: The Trade Partnership from US Census Bureau and US Department of Agriculture data.
New Jersey’s Top Exports to China, 2008
NJ-2: Top Exports to China, 2008*
1. Chemicals $247 million 1. Other Manufacturing $85 million
2. Primary Metal Manufacturing $167 million 2. Computers & Electronics $43 million
3. Computers & Electronics $143 million 3. Chemicals $31 million
4. Machinery (except Electrical) $100 million 4. Machinery (except Electrical) $12 million
5. Waste & Scrap $83 million 5. Processed Foods $6 million * The data for NJ-2 reflect the combined exports of Atlantic, Burlington, Camden, Cape May, Cumberland, Gloucester, and Salem counties. The figures may understate the NJ-2 district’s total exports to China because county-specific information for some products (e.g., mining, forestry, fishing, and waste and scrap) is not available.
$50
$74 $73$85
$95$108
$146
$172
$190
2000 2001 2002 2003 2004 2005 2006 2007 2008
Estimated Growth in Exports from New Jersey’s 2nd Congressional District, 2000–08
Exports to China: 281% Exports to Rest of World: 85%
New Jersey's 2nd Congressional District: Exports to China ($ million)

© 2009, The US-China Business Council
Sources: The Trade Partnership from US Census Bureau and US Department of Agriculture data.
New Jersey’s Top Exports to China, 2008
NJ-3: Top Exports to China, 2008*
1. Chemicals $247 million 1. Computers & Electronics $42 million
2. Primary Metal Manufacturing $167 million 2. Other Manufacturing $15 million
3. Computers & Electronics $143 million 3. Machinery (except Electrical) $12 million
4. Machinery (except Electrical) $100 million 4. Chemicals $12 million
5. Waste & Scrap $83 million 5. Processed Foods $3 million * The data for NJ-3 reflect the combined exports of Burlington, Camden, and Ocean counties. The figures may understate the NJ-3 district’s total exports to China because county-specific information for some products (e.g., mining, forestry, fishing, and waste and scrap) is not available.
$24
$35 $35$40
$45$51
$70
$82$90
2000 2001 2002 2003 2004 2005 2006 2007 2008
Estimated Growth in Exports from New Jersey’s 3rd Congressional District, 2000–08
Exports to China: 281% Exports to Rest of World: 83%
New Jersey's 3rd Congressional District: Exports to China ($ million)

© 2009, The US-China Business Council
Sources: The Trade Partnership from US Census Bureau and US Department of Agriculture data.
New Jersey’s Top Exports to China, 2008
NJ-4: Top Exports to China, 2008*
1. Chemicals $247 million 1. Computers & Electronics $36 million
2. Primary Metal Manufacturing $167 million 2. Machinery (except Electrical) $24 million
3. Computers & Electronics $143 million 3. Chemicals $18 million
4. Machinery (except Electrical) $100 million 4. Other Manufacturing $7 million
5. Waste & Scrap $83 million 5. Printing & Related Products $3 million * The data for NJ-4 reflect the combined exports of Burlington, Mercer, Monmouth, and Ocean counties. The figures may understate the NJ-4 district’s total exports to China because county-specific information for some products (e.g., mining, forestry, fishing, and waste and scrap) is not available.
$25
$37 $36$43
$48$54
$73
$86
$95
2000 2001 2002 2003 2004 2005 2006 2007 2008
Estimated Growth in Exports from New Jersey’s 4th Congressional District, 2000–08
Exports to China: 280% Exports to Rest of World: 84%
New Jersey's 4th Congressional District: Exports to China ($ million)

© 2009, The US-China Business Council
Sources: The Trade Partnership from US Census Bureau and US Department of Agriculture data.
New Jersey’s Top Exports to China, 2008
NJ-5: Top Exports to China, 2008*
1. Chemicals $247 million 1. Computers & Electronics $55 million
2. Primary Metal Manufacturing $167 million 2. Other Manufacturing $33 million
3. Computers & Electronics $143 million 3. Chemicals $33 million
4. Machinery (except Electrical) $100 million 4. Machinery (except Electrical) $22 million
5. Waste & Scrap $83 million 5. Miscellaneous Manufacturing $11 million * The data for NJ-5 reflect the combined exports of Bergen, Passaic, Sussex, and Warren counties. The figures may understate the NJ-5 district’s total exports to China because county-specific information for some products (e.g., mining, forestry, fishing, and waste and scrap) is not available.
$50
$74 $73$85
$95$108
$146
$172
$189
2000 2001 2002 2003 2004 2005 2006 2007 2008
Estimated Growth in Exports from New Jersey’s 5th Congressional District, 2000–08
Exports to China: 281% Exports to Rest of World: 80%
New Jersey's 5th Congressional District: Exports to China ($ million)

© 2009, The US-China Business Council
Sources: The Trade Partnership from US Census Bureau and US Department of Agriculture data.
New Jersey’s Top Exports to China, 2008
NJ-6: Top Exports to China, 2008*
1. Chemicals $247 million 1. Chemicals $106 million
2. Primary Metal Manufacturing $167 million 2. Other Manufacturing $56 million
3. Computers & Electronics $143 million 3. Primary Metal Manufacturing $45 million
4. Machinery (except Electrical) $100 million 4. Machinery (except Electrical) $26 million
5. Waste & Scrap $83 million 5. Computers & Electronics $20 million * The data for NJ-6 reflect the combined exports of Middlesex, Monmouth, Somerset, and Union counties. The figures may understate the NJ-6 district’s total exports to China because county-specific information for some products (e.g., mining, forestry, fishing, and waste and scrap) is not available.
$77
$115 $113$132
$147$167
$227
$267
$295
2000 2001 2002 2003 2004 2005 2006 2007 2008
Estimated Growth in Exports from New Jersey’s 6th Congressional District, 2000–08
Exports to China: 282% Exports to Rest of World: 81%
New Jersey's 6th Congressional District: Exports to China ($ million)

© 2009, The US-China Business Council
Sources: The Trade Partnership from US Census Bureau and US Department of Agriculture data.
New Jersey’s Top Exports to China, 2008
NJ-7: Top Exports to China, 2008*
1. Chemicals $247 million 1. Chemicals $100 million
2. Primary Metal Manufacturing $167 million 2. Other Manufacturing $62 million
3. Computers & Electronics $143 million 3. Primary Metal Manufacturing $45 million
4. Machinery (except Electrical) $100 million 4. Machinery (except Electrical) $24 million
5. Waste & Scrap $83 million 5. Computers & Electronics $16 million * The data for NJ-7 reflect the combined exports of Hunterdon, Middlesex, Somerset, and Union counties. The figures may understate the NJ-7 district’s total exports to China because county-specific information for some products (e.g., mining, forestry, fishing, and waste and scrap) is not available.
$75
$111 $109$127
$143$162
$220
$258
$285
2000 2001 2002 2003 2004 2005 2006 2007 2008
Estimated Growth in Exports from New Jersey’s 7th Congressional District, 2000–08
Exports to China: 282% Exports to Rest of World: 81%
New Jersey's 7th Congressional District: Exports to China ($ million)

© 2009, The US-China Business Council
Sources: The Trade Partnership from US Census Bureau and US Department of Agriculture data.
New Jersey’s Top Exports to China, 2008
NJ-8: Top Exports to China, 2008*
1. Chemicals $247 million 1. Chemicals $50 million
2. Primary Metal Manufacturing $167 million 2. Machinery (except Electrical) $17 million
3. Computers & Electronics $143 million 3. Computers & Electronics $16 million
4. Machinery (except Electrical) $100 million 4. Other Manufacturing $14 million
5. Waste & Scrap $83 million 5. Primary Metal Manufacturing $12 million * The data for NJ-8 reflect the combined exports of Essex and Passaic counties. The figures may understate the NJ-8 district’s total exports to China because county-specific information for some products (e.g., mining, forestry, fishing, and waste and scrap) is not available.
$35
$52 $51$59
$66$75
$102
$120
$132
2000 2001 2002 2003 2004 2005 2006 2007 2008
Estimated Growth in Exports from New Jersey’s 8th Congressional District, 2000–08
Exports to China: 282% Exports to Rest of World: 81%
New Jersey's 8th Congressional District: Exports to China ($ million)

© 2009, The US-China Business Council
Sources: The Trade Partnership from US Census Bureau and US Department of Agriculture data.
New Jersey’s Top Exports to China, 2008
NJ-9: Top Exports to China, 2008*
1. Chemicals $247 million 1. Computers & Electronics $55 million
2. Primary Metal Manufacturing $167 million 2. Chemicals $33 million
3. Computers & Electronics $143 million 3. Other Manufacturing $24 million
4. Machinery (except Electrical) $100 million 4. Machinery (except Electrical) $22 million
5. Waste & Scrap $83 million 5. Primary Metal Manufacturing $12 million * The data for NJ-9 reflect the combined exports of Bergen, Hudson, and Passaic counties. The figures may understate the NJ-9 district’s total exports to China because county-specific information for some products (e.g., mining, forestry, fishing, and waste and scrap) is not available.
$52
$77 $75$88
$98$112
$152
$178
$197
2000 2001 2002 2003 2004 2005 2006 2007 2008
Estimated Growth in Exports from New Jersey’s 9th Congressional District, 2000–08
Exports to China: 282% Exports to Rest of World: 80%
New Jersey's 9th Congressional District: Exports to China ($ million)

© 2009, The US-China Business Council
Sources: The Trade Partnership from US Census Bureau and US Department of Agriculture data.
New Jersey’s Top Exports to China, 2008
NJ-10: Top Exports to China, 2008*
1. Chemicals $247 million 1. Chemicals $91 million
2. Primary Metal Manufacturing $167 million 2. Other Manufacturing $66 million
3. Computers & Electronics $143 million 3. Primary Metal Manufacturing $24 million
4. Machinery (except Electrical) $100 million 4. Machinery (except Electrical) $22 million
5. Waste & Scrap $83 million 5. Processed Foods $7 million * The data for NJ-10 reflect the combined exports of Essex, Hudson, and Union counties. The figures may understate the NJ-10 district’s total exports to China because county-specific information for some products (e.g., mining, forestry, fishing, and waste and scrap) is not available.
$62
$93 $91$106
$119$135
$184
$216
$238
2000 2001 2002 2003 2004 2005 2006 2007 2008
Estimated Growth in Exports from New Jersey’s 10th Congressional District, 2000–08
Exports to China: 282% Exports to Rest of World: 80%
New Jersey's 10th Congressional District: Exports to China ($ million)

© 2009, The US-China Business Council
Sources: The Trade Partnership from US Census Bureau and US Department of Agriculture data.
New Jersey’s Top Exports to China, 2008
NJ-11: Top Exports to China, 2008*
1. Chemicals $247 million 1. Chemicals $93 million
2. Primary Metal Manufacturing $167 million 2. Computers & Electronics $38 million
3. Computers & Electronics $143 million 3. Machinery (except Electrical) $27 million
4. Machinery (except Electrical) $100 million 4. Primary Metal Manufacturing $20 million
5. Waste & Scrap $83 million 5. Other Manufacturing $20 million * The data for NJ-11 reflect the combined exports of Essex, Morris, Passaic, Somerset, and Sussex counties. The figures may understate the NJ-11 district’s total exports to China because county-specific information for some products (e.g., mining, forestry, fishing, and waste and scrap) is not available.
$61
$91 $90$105
$117$133
$180
$212
$234
2000 2001 2002 2003 2004 2005 2006 2007 2008
Estimated Growth in Exports from New Jersey’s 11th Congressional District, 2000–08
Exports to China: 282% Exports to Rest of World: 81%
New Jersey's 11th Congressional District: Exports to China ($ million)

© 2009, The US-China Business Council
Sources: The Trade Partnership from US Census Bureau and US Department of Agriculture data.
New Jersey’s Top Exports to China, 2008
NJ-12: Top Exports to China, 2008*
1. Chemicals $247 million 1. Chemicals $66 million
2. Primary Metal Manufacturing $167 million 2. Primary Metal Manufacturing $45 million
3. Computers & Electronics $143 million 3. Machinery (except Electrical) $29 million
4. Machinery (except Electrical) $100 million 4. Computers & Electronics $19 million
5. Waste & Scrap $83 million 5. Plastics & Rubber Products $9 million * The data for NJ-12 reflect the combined exports of Hunterdon, Mercer, Middlesex, Monmouth, and Somerset counties. The figures may understate the NJ-12 district’s total exports to China because county-specific information for some products (e.g., mining, forestry, fishing, and waste and scrap) is not available.
$51
$77 $75$88
$98$111
$151
$178$196
2000 2001 2002 2003 2004 2005 2006 2007 2008
Estimated Growth in Exports from New Jersey’s 12th Congressional District, 2000–08
Exports to China: 281% Exports to Rest of World: 81%
New Jersey's 12th Congressional District: Exports to China ($ million)

© 2009, The US-China Business Council
Sources: The Trade Partnership from US Census Bureau and US Department of Agriculture data.
New Jersey’s Top Exports to China, 2008
NJ-13: Top Exports to China, 2008*
1. Chemicals $247 million 1. Chemicals $124 million
2. Primary Metal Manufacturing $167 million 2. Other Manufacturing $64 million
3. Computers & Electronics $143 million 3. Primary Metal Manufacturing $61 million
4. Machinery (except Electrical) $100 million 4. Machinery (except Electrical) $32 million
5. Waste & Scrap $83 million 5. Computers & Electronics $13 million * The data for NJ-13 reflect the combined exports of Essex, Hudson, Middlesex, and Union counties. The figures may understate the NJ-13 district’s total exports to China because county-specific information for some products (e.g., mining, forestry, fishing, and waste and scrap) is not available.
$90
$134 $132$154
$172$195
$265
$312
$344
2000 2001 2002 2003 2004 2005 2006 2007 2008
Estimated Growth in Exports from New Jersey’s 13th Congressional District, 2000–08
Exports to China: 282% Exports to Rest of World: 81%
New Jersey's 13th Congressional District: Exports to China ($ million)
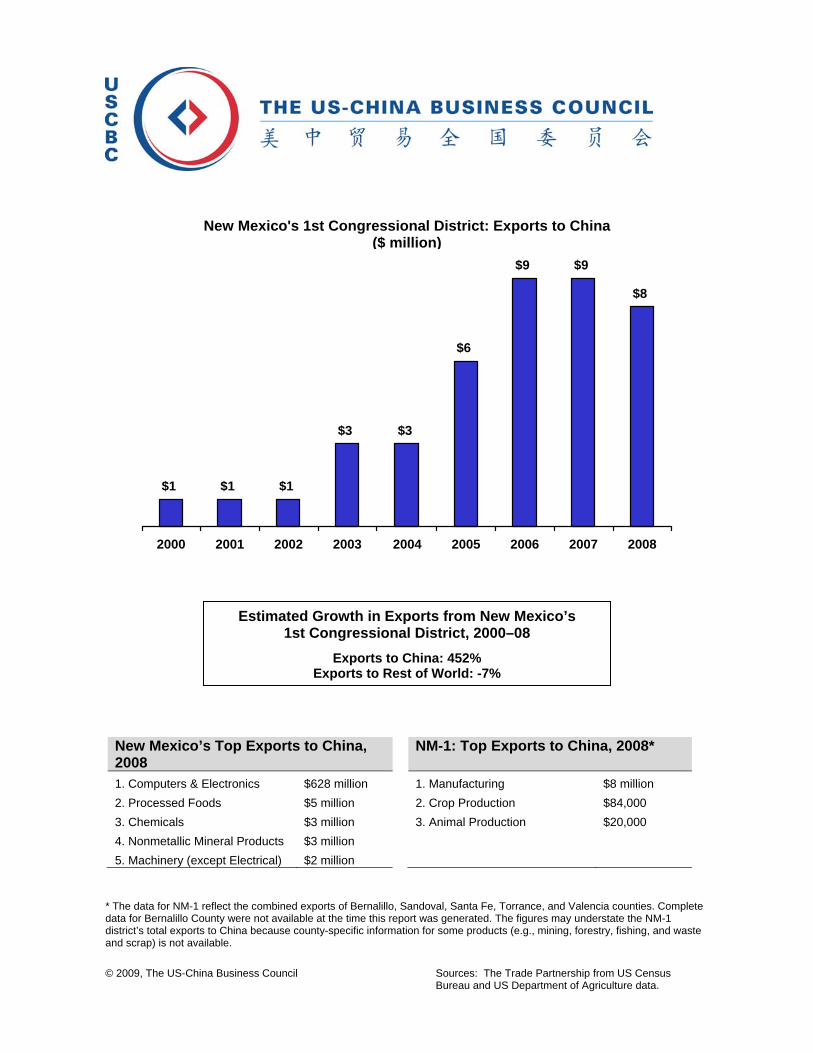
© 2009, The US-China Business Council
Sources: The Trade Partnership from US Census Bureau and US Department of Agriculture data.
New Mexico’s Top Exports to China, 2008
NM-1: Top Exports to China, 2008*
1. Computers & Electronics $628 million 1. Manufacturing $8 million
2. Processed Foods $5 million 2. Crop Production $84,000
3. Chemicals $3 million 3. Animal Production $20,000
4. Nonmetallic Mineral Products $3 million
5. Machinery (except Electrical) $2 million * The data for NM-1 reflect the combined exports of Bernalillo, Sandoval, Santa Fe, Torrance, and Valencia counties. Complete data for Bernalillo County were not available at the time this report was generated. The figures may understate the NM-1 district’s total exports to China because county-specific information for some products (e.g., mining, forestry, fishing, and waste and scrap) is not available.
$1 $1 $1
$3 $3
$6
$9 $9
$8
2000 2001 2002 2003 2004 2005 2006 2007 2008
Estimated Growth in Exports from New Mexico’s 1st Congressional District, 2000–08
Exports to China: 452% Exports to Rest of World: -7%
New Mexico's 1st Congressional District: Exports to China ($ million)

© 2009, The US-China Business Council
Sources: The Trade Partnership from US Census Bureau and US Department of Agriculture data.
New Mexico’s Top Exports to China, 2008
NM-2: Top Exports to China, 2008*
1. Computers & Electronics $628 million 1. Manufacturing $200 million
2. Processed Foods $5 million 2. Processed Foods $2 million
3. Chemicals $3 million 3. Crop Production $768,000
4. Nonmetallic Mineral Products $3 million 4. Animal Production $212,000
5. Machinery (except Electrical) $2 million
* The data for NM-2 reflect the combined exports of Bernalillo, Catron, Chaves, Cibola, DeBaca, Dona Ana, Eddy, Grant, Guadalupe, Hidalgo, Lea, Lincoln, Luna, McKinley, Otero, Sierra, Socorro, and Valencia counties. Complete data for Bernalillo County were not available at the time this report was generated. The figures may understate the NM-2 district’s total exports to China because county-specific information for some products (e.g., mining, forestry, fishing, and waste and scrap) is not available.
$37
$11 $15
$65 $70
$139
$219 $215$203
2000 2001 2002 2003 2004 2005 2006 2007 2008
Estimated Growth in Exports from New Mexico’s 2nd Congressional District, 2000–08
Exports to China: 448% Exports to Rest of World: -11%
New Mexico's 2nd Congressional District: Exports to China ($ million)

© 2009, The US-China Business Council
Sources: The Trade Partnership from US Census Bureau and US Department of Agriculture data.
New Mexico’s Top Exports to China, 2008
NM-3: Top Exports to China, 2008*
1. Computers & Electronics $628 million 1. Manufacturing $48 million
2. Processed Foods $5 million 2. Crop Production $329,000
3. Chemicals $3 million 3. Animal Production $195,000
4. Nonmetallic Mineral Products $3 million
5. Machinery (except Electrical) $2 million
* The data for NM-3 reflect the combined exports of Bernalillo, Colfax, Curry, Harding, Los Alamos, McKinley, Mora, Quay, Rio Arriba, Roosevelt, Sandoval, San Juan, San Miguel, Santa Fe, Taos and Union counties. Complete data for Bernalillo County were not available at the time this report was generated. The figures may understate the NM-3 district’s total exports to China because county-specific information for some products (e.g., mining, forestry, fishing, and waste and scrap) is not available.
$9
$3 $4
$16 $17
$33
$53 $52$49
2000 2001 2002 2003 2004 2005 2006 2007 2008
Estimated Growth in Exports from New Mexico’s 3rd Congressional District, 2000–08
Exports to China: 451% Exports to Rest of World: -9%
New Mexico's 3rd Congressional District: Exports to China ($ million)

© 2009, The US-China Business Council
Sources: The Trade Partnership from US Census Bureau and US Department of Agriculture data.
New York’s Top Exports to China, 2008
NY-1: Top Exports to China, 2008*
1. Waste & Scrap $929 million 1. Chemicals $54 million
2. Machinery (except Electrical) $479 million 2. Computers & Electronics $44 million
3. Computers & Electronics $307 million 3. Other Manufacturing $25 million
4. Chemicals $271 million 4. Machinery (except Electrical) $21 million
5. Transportation Equipment $149 million 5. Electrical Equipment $13 million * The data for NY-1 reflect the exports of Suffolk County, which also includes other congressional districts. The figures may understate the NY-1 district’s total exports to China because county-specific information for some products (e.g., mining, forestry, fishing, and waste and scrap) is not available.
$69
$91 $94
$120
$162 $166
$146$161
$187
2000 2001 2002 2003 2004 2005 2006 2007 2008
Estimated Growth in Exports from New York’s 1st Congressional District, 2000–08
Exports to China: 172% Exports to Rest of World: 71%
New York's 1st Congressional District: Exports to China ($ million)

© 2009, The US-China Business Council
Sources: The Trade Partnership from US Census Bureau and US Department of Agriculture data.
New York’s Top Exports to China, 2008
NY-2: Top Exports to China, 2008*
1. Waste & Scrap $929 million 1. Chemicals $78 million
2. Machinery (except Electrical) $479 million 2. Computers & Electronics $76 million
3. Computers & Electronics $307 million 3. Machinery (except Electrical) $40 million
4. Chemicals $271 million 4. Other Manufacturing $34 million
5. Transportation Equipment $149 million 5. Electrical Equipment $18 million * The data for NY-2 reflect the combined exports of Nassau and Suffolk counties. The figures may understate the NY-2 district’s total exports to China because county-specific information for some products (e.g., mining, forestry, fishing, and waste and scrap) is not available.
$106
$140 $146
$185
$250 $258
$227$250
$289
2000 2001 2002 2003 2004 2005 2006 2007 2008
Estimated Growth in Exports from New York’s 2nd Congressional District, 2000–08
Exports to China: 172% Exports to Rest of World: 71%
New York's 2nd Congressional District: Exports to China ($ million)

© 2009, The US-China Business Council
Sources: The Trade Partnership from US Census Bureau and US Department of Agriculture data.
New York’s Top Exports to China, 2008
NY-3: Top Exports to China, 2008*
1. Waste & Scrap $929 million 1. Chemicals $78 million
2. Machinery (except Electrical) $479 million 2. Computers & Electronics $76 million
3. Computers & Electronics $307 million 3. Machinery (except Electrical) $40 million
4. Chemicals $271 million 4. Other Manufacturing $34 million
5. Transportation Equipment $149 million 5. Electrical Equipment $18 million * The data for NY-3 reflect the combined exports of Nassau and Suffolk counties. The figures may understate the NY-3 district’s total exports to China because county-specific information for some products (e.g., mining, forestry, fishing, and waste and scrap) is not available.
$106
$140 $146
$185
$250 $258
$227$250
$289
2000 2001 2002 2003 2004 2005 2006 2007 2008
Estimated Growth in Exports from New York’s 3rd Congressional District, 2000–08
Exports to China: 172% Exports to Rest of World: 71%
New York's 3rd Congressional District: Exports to China ($ million)

© 2009, The US-China Business Council
Sources: The Trade Partnership from US Census Bureau and US Department of Agriculture data.
New York’s Top Exports to China, 2008
NY-4: Top Exports to China, 2008*
1. Waste & Scrap $929 million 1. Computers & Electronics $32 million
2. Machinery (except Electrical) $479 million 2. Chemicals $23 million
3. Computers & Electronics $307 million 3. Machinery (except Electrical) $20 million
4. Chemicals $271 million 4. Other Manufacturing $9 million
5. Transportation Equipment $149 million 5. Electrical Equipment $5 million * The data for NY-4 reflect the exports of Nassau County, which also includes other congressional districts. The figures may understate the NY-4 district’s total exports to China because county-specific information for some products (e.g., mining, forestry, fishing, and waste and scrap) is not available.
$38
$50 $52
$66
$88$92
$80$89
$102
2000 2001 2002 2003 2004 2005 2006 2007 2008
Estimated Growth in Exports from New York’s 4th Congressional District, 2000–08
Exports to China: 171% Exports to Rest of World: 71%
New York's 4th Congressional District: Exports to China ($ million)

© 2009, The US-China Business Council
Sources: The Trade Partnership from US Census Bureau and US Department of Agriculture data.
New York’s Top Exports to China, 2008
NY-5: Top Exports to China, 2008*
1. Waste & Scrap $929 million 1. Other Manufacturing $37 million
2. Machinery (except Electrical) $479 million 2. Computers & Electronics $35 million
3. Computers & Electronics $307 million 3. Machinery (except Electrical) $29 million
4. Chemicals $271 million 4. Chemicals $26 million
5. Transportation Equipment $149 million 5. Electrical Equipment $13 million * The data for NY-5 reflect the combined exports of Nassau and Queens counties. The figures may understate the NY-5 district’s total exports to China because county-specific information for some products (e.g., mining, forestry, fishing, and waste and scrap) is not available.
$65
$86 $89
$113
$151$158
$138$152
$176
2000 2001 2002 2003 2004 2005 2006 2007 2008
Estimated Growth in Exports from New York’s 5th Congressional District, 2000–08
Exports to China: 171% Exports to Rest of World: 71%
New York's 5th Congressional District: Exports to China ($ million)

© 2009, The US-China Business Council
Sources: The Trade Partnership from US Census Bureau and US Department of Agriculture data.
New York’s Top Exports to China, 2008
NY-6: Top Exports to China, 2008*
1. Waste & Scrap $929 million 1. Other Manufacturing $28 million
2. Machinery (except Electrical) $479 million 2. Machinery (except Electrical) $10 million
3. Computers & Electronics $307 million 3. Electrical Equipment $8 million
4. Chemicals $271 million 4. Miscellaneous Manufacturing $6 million
5. Transportation Equipment $149 million 5. Paper Products $4 million * The data for NY-6 reflect the exports of Queens County, which also includes other congressional districts. The figures may understate the NY-6 district’s total exports to China because county-specific information for some products (e.g., mining, forestry, fishing, and waste and scrap) is not available.
$27
$36 $37
$47
$63$66
$58$64
$74
2000 2001 2002 2003 2004 2005 2006 2007 2008
Estimated Growth in Exports from New York’s 6th Congressional District, 2000–08
Exports to China: 171% Exports to Rest of World: 71%
New York's 6th Congressional District: Exports to China ($ million)

© 2009, The US-China Business Council
Sources: The Trade Partnership from US Census Bureau and US Department of Agriculture data.
New York’s Top Exports to China, 2008
NY-7: Top Exports to China, 2008*
1. Waste & Scrap $929 million 1. Other Manufacturing $39 million
2. Machinery (except Electrical) $479 million 2. Machinery (except Electrical) $13 million
3. Computers & Electronics $307 million 3. Electrical Equipment $8 million
4. Chemicals $271 million 4. Miscellaneous Manufacturing $6 million
5. Transportation Equipment $149 million 5. Paper Products $5 million * The data for NY-7 reflect the combined exports of Bronx and Queens counties. The figures may understate the NY-7 district’s total exports to China because county-specific information for some products (e.g., mining, forestry, fishing, and waste and scrap) is not available.
$33
$44 $46
$58
$77$81
$71$78
$90
2000 2001 2002 2003 2004 2005 2006 2007 2008
Estimated Growth in Exports from New York’s 7th Congressional District, 2000–08
Exports to China: 171% Exports to Rest of World: 71%
New York's 7th Congressional District: Exports to China ($ million)

© 2009, The US-China Business Council
Sources: The Trade Partnership from US Census Bureau and US Department of Agriculture data.
New York’s Top Exports to China, 2008
NY-8: Top Exports to China, 2008*
1. Waste & Scrap $929 million 1. Other Manufacturing $131 million
2. Machinery (except Electrical) $479 million 2. Chemicals $20 million
3. Computers & Electronics $307 million 3. Miscellaneous Manufacturing $19 million
4. Chemicals $271 million 4. Computers & Electronics $10 million
5. Transportation Equipment $149 million 5. Electrical Equipment $6 million * The data for NY-8 reflect the combined exports of Kings and New York counties. The figures may understate the NY-8 district’s total exports to China because county-specific information for some products (e.g., mining, forestry, fishing, and waste and scrap) is not available.
$77
$102 $106
$134
$180$188
$165$183
$210
2000 2001 2002 2003 2004 2005 2006 2007 2008
Estimated Growth in Exports from New York’s 8th Congressional District, 2000–08
Exports to China: 172% Exports to Rest of World: 67%
New York's 8th Congressional District: Exports to China ($ million)

© 2009, The US-China Business Council
Sources: The Trade Partnership from US Census Bureau and US Department of Agriculture data.
New York’s Top Exports to China, 2008
NY-9: Top Exports to China, 2008*
1. Waste & Scrap $929 million 1. Other Manufacturing $70 million
2. Machinery (except Electrical) $479 million 2. Chemicals $21 million
3. Computers & Electronics $307 million 3. Machinery (except Electrical) $13 million
4. Chemicals $271 million 4. Miscellaneous Manufacturing $9 million
5. Transportation Equipment $149 million 5. Electrical Equipment $8 million * The data for NY-9 reflect the combined exports of Kings and Queens counties. The figures may understate the NY-9 district’s total exports to China because county-specific information for some products (e.g., mining, forestry, fishing, and waste and scrap) is not available.
$56
$73 $76
$97
$129$135
$118$130
$151
2000 2001 2002 2003 2004 2005 2006 2007 2008
Estimated Growth in Exports from New York’s 9th Congressional District, 2000–08
Exports to China: 171% Exports to Rest of World: 71%
New York's 9th Congressional District: Exports to China ($ million)

© 2009, The US-China Business Council
Sources: The Trade Partnership from US Census Bureau and US Department of Agriculture data.
New York’s Top Exports to China, 2008
NY-10: Top Exports to China, 2008*
1. Waste & Scrap $929 million 1. Other Manufacturing $41 million
2. Machinery (except Electrical) $479 million 2. Chemicals $18 million
3. Computers & Electronics $307 million 3. Machinery (except Electrical) $3 million
4. Chemicals $271 million 4. Processed Foods $3 million
5. Transportation Equipment $149 million 5. Computers & Electronics $3 million * The data for NY-10 reflect the exports of Kings County, which also includes other congressional districts. The figures may understate the NY-10 district’s total exports to China because county-specific information for some products (e.g., mining, forestry, fishing, and waste and scrap) is not available.
$28
$37 $39
$49
$66$69
$60$67
$77
2000 2001 2002 2003 2004 2005 2006 2007 2008
Estimated Growth in Exports from New York’s 10th Congressional District, 2000–08
Exports to China: 171% Exports to Rest of World: 71%
New York's 10th Congressional District: Exports to China ($ million)

© 2009, The US-China Business Council
Sources: The Trade Partnership from US Census Bureau and US Department of Agriculture data.
New York’s Top Exports to China, 2008
NY-11: Top Exports to China, 2008*
1. Waste & Scrap $929 million 1. Other Manufacturing $41 million
2. Machinery (except Electrical) $479 million 2. Chemicals $18 million
3. Computers & Electronics $307 million 3. Machinery (except Electrical) $3 million
4. Chemicals $271 million 4. Processed Foods $3 million
5. Transportation Equipment $149 million 5. Computers & Electronics $3 million * The data for NY-11 reflect the exports of Kings County, which also includes other congressional districts. The figures may understate the NY-11 district’s total exports to China because county-specific information for some products (e.g., mining, forestry, fishing, and waste and scrap) is not available.
$28
$37 $39
$49
$66$69
$60$67
$77
2000 2001 2002 2003 2004 2005 2006 2007 2008
Estimated Growth in Exports from New York’s 11th Congressional District, 2000–08
Exports to China: 171% Exports to Rest of World: 71%
New York's 11th Congressional District: Exports to China ($ million)

© 2009, The US-China Business Council
Sources: The Trade Partnership from US Census Bureau and US Department of Agriculture data.
New York’s Top Exports to China, 2008
NY-12: Top Exports to China, 2008*
1. Waste & Scrap $929 million 1. Other Manufacturing $159 million
2. Machinery (except Electrical) $479 million 2. Miscellaneous Manufacturing $25 million
3. Computers & Electronics $307 million 3. Chemicals $23 million
4. Chemicals $271 million 4. Electrical Equipment $14 million
5. Transportation Equipment $149 million 5. Machinery (except Electrical) $13 million * The data for NY-12 reflect the combined exports of Kings, New York, and Queens counties. The figures may understate the NY-12 district’s total exports to China because county-specific information for some products (e.g., mining, forestry, fishing, and waste and scrap) is not available.
$105
$138 $143
$182
$243$254
$223$246
$284
2000 2001 2002 2003 2004 2005 2006 2007 2008
Estimated Growth in Exports from New York’s 12th Congressional District, 2000–08
Exports to China: 172% Exports to Rest of World: 68%
New York's 12th Congressional District: Exports to China ($ million)

© 2009, The US-China Business Council
Sources: The Trade Partnership from US Census Bureau and US Department of Agriculture data.
New York’s Top Exports to China, 2008
NY-13: Top Exports to China, 2008*
1. Waste & Scrap $929 million 1. Other Manufacturing $45 million
2. Machinery (except Electrical) $479 million 2. Chemicals $18 million
3. Computers & Electronics $307 million 3. Machinery (except Electrical) $3 million
4. Chemicals $271 million 4. Processed Foods $3 million
5. Transportation Equipment $149 million 5. Computers & Electronics $3 million * The data for NY-13 reflect the combined exports of Kings and Richmond counties. The figures may understate the NY-13 district’s total exports to China because county-specific information for some products (e.g., mining, forestry, fishing, and waste and scrap) is not available.
$30
$39 $41
$52
$69$72
$63$70
$80
2000 2001 2002 2003 2004 2005 2006 2007 2008
Estimated Growth in Exports from New York’s 13th Congressional District, 2000–08
Exports to China: 171% Exports to Rest of World: 71%
New York's 13th Congressional District: Exports to China ($ million)

© 2009, The US-China Business Council
Sources: The Trade Partnership from US Census Bureau and US Department of Agriculture data.
New York’s Top Exports to China, 2008
NY-14: Top Exports to China, 2008*
1. Waste & Scrap $929 million 1. Other Manufacturing $118 million
2. Machinery (except Electrical) $479 million 2. Miscellaneous Manufacturing $22 million
3. Computers & Electronics $307 million 3. Electrical Equipment $14 million
4. Chemicals $271 million 4. Machinery (except Electrical) $10 million
5. Transportation Equipment $149 million 5. Computers & Electronics $9 million * The data for NY-14 reflect the exports of New York and Queens counties. The figures may understate the NY-14 district’s total exports to China because county-specific information for some products (e.g., mining, forestry, fishing, and waste and scrap) is not available.
$76
$101 $104
$132
$177$185
$163$180
$207
2000 2001 2002 2003 2004 2005 2006 2007 2008
Estimated Growth in Exports from New York’s 14th Congressional District, 2000–08
Exports to China: 172% Exports to Rest of World: 67%
New York's 14th Congressional District: Exports to China ($ million)

© 2009, The US-China Business Council
Sources: The Trade Partnership from US Census Bureau and US Department of Agriculture data.
New York’s Top Exports to China, 2008
NY-15: Top Exports to China, 2008*
1. Waste & Scrap $929 million 1. Other Manufacturing $128 million
2. Machinery (except Electrical) $479 million 2. Miscellaneous Manufacturing $22 million
3. Computers & Electronics $307 million 3. Electrical Equipment $14 million
4. Chemicals $271 million 4. Machinery (except Electrical) $13 million
5. Transportation Equipment $149 million 5. Computers & Electronics $9 million * The data for NY-15 reflect the combined exports of Bronx, New York, and Queens counties. The figures may understate the NY-15 district’s total exports to China because county-specific information for some products (e.g., mining, forestry, fishing, and waste and scrap) is not available
$82
$109 $113
$143
$191$200
$176$194
$224
2000 2001 2002 2003 2004 2005 2006 2007 2008
Estimated Growth in Exports from New York’s 15th Congressional District, 2000–08
Exports to China: 172% Exports to Rest of World: 67%
New York's 15th Congressional District: Exports to China ($ million)

© 2009, The US-China Business Council
Sources: The Trade Partnership from US Census Bureau and US Department of Agriculture data.
New York’s Top Exports to China, 2008
NY-16: Top Exports to China, 2008*
1. Waste & Scrap $929 million 1. Other Manufacturing $10 million
2. Machinery (except Electrical) $479 million 2. Machinery (except Electrical) $3 million
3. Computers & Electronics $307 million 3. Fabricated Metal Products $2 million
4. Chemicals $271 million 4. Paper Products $797,000
5. Transportation Equipment $149 million 5. Plastics & Rubber Products $387,000 * The data for NY-16 reflect the exports of Bronx County, which also includes other congressional districts. The figures may understate the NY-16 district’s total exports to China because county-specific information for some products (e.g., mining, forestry, fishing, and waste and scrap) is not available.
$6
$8 $8
$11
$14$15
$13$14
$16
2000 2001 2002 2003 2004 2005 2006 2007 2008
Estimated Growth in Exports from New York’s 16th Congressional District, 2000–08
Exports to China: 171% Exports to Rest of World: 71%
New York's 16th Congressional District: Exports to China ($ million)

© 2009, The US-China Business Council
Sources: The Trade Partnership from US Census Bureau and US Department of Agriculture data.
New York’s Top Exports to China, 2008
NY-17: Top Exports to China, 2008*
1. Waste & Scrap $929 million 1. Other Manufacturing $65 million
2. Machinery (except Electrical) $479 million 2. Chemicals $58 million
3. Computers & Electronics $307 million 3. Machinery (except Electrical) $11 million
4. Chemicals $271 million 4. Miscellaneous Manufacturing $6 million
5. Transportation Equipment $149 million 5. Computers & Electronics $5 million * The data for NY-17 reflect the combined exports of Bronx, Rockland, and Westchester counties. The figures may understate the NY-17 district’s total exports to China because county-specific information for some products (e.g., mining, forestry, fishing, and waste and scrap) is not available.
$59
$78 $81
$103
$137$143
$126$138
$160
2000 2001 2002 2003 2004 2005 2006 2007 2008
Estimated Growth in Exports from New York’s 17th Congressional District, 2000–08
Exports to China: 171% Exports to Rest of World: 70%
New York's 17th Congressional District: Exports to China ($ million)

© 2009, The US-China Business Council
Sources: The Trade Partnership from US Census Bureau and US Department of Agriculture data.
New York’s Top Exports to China, 2008
NY-18: Top Exports to China, 2008*
1. Waste & Scrap $929 million 1. Chemicals $58 million
2. Machinery (except Electrical) $479 million 2. Other Manufacturing $55 million
3. Computers & Electronics $307 million 3. Machinery (except Electrical) $8 million
4. Chemicals $271 million 4. Miscellaneous Manufacturing $6 million
5. Transportation Equipment $149 million 5. Computers & Electronics $5 million * The data for NY-18 reflect the combined exports of Rockland and Westchester counties. The figures may understate the NY-18 district’s total exports to China because county-specific information for some products (e.g., mining, forestry, fishing, and waste and scrap) is not available.
$53
$70 $72
$92
$123$128
$113$124
$143
2000 2001 2002 2003 2004 2005 2006 2007 2008
Estimated Growth in Exports from New York’s 18th Congressional District, 2000–08
Exports to China: 171% Exports to Rest of World: 70%
New York's 18th Congressional District: Exports to China ($ million)

© 2009, The US-China Business Council
Sources: The Trade Partnership from US Census Bureau and US Department of Agriculture data.
New York’s Top Exports to China, 2008
NY-19: Top Exports to China, 2008*
1. Waste & Scrap $929 million 1. Other Manufacturing $142 million
2. Machinery (except Electrical) $479 million 2. Chemicals $58 million
3. Computers & Electronics $307 million 3. Machinery (except Electrical) $8 million
4. Chemicals $271 million 4. Miscellaneous Manufacturing $6 million
5. Transportation Equipment $149 million 5. Computers & Electronics $5 million * The data for NY-19 reflect the combined exports of Dutchess, Orange, Putnam, Rockland, and Westchester counties. The figures may understate the NY-19 district’s total exports to China because county-specific information for some products (e.g., mining, forestry, fishing, and waste and scrap) is not available.
$85
$112 $116
$148
$199 $206
$181$199
$230
2000 2001 2002 2003 2004 2005 2006 2007 2008
Estimated Growth in Exports from New York’s 19th Congressional District, 2000–08
Exports to China: 171% Exports to Rest of World: 70%
New York's 19th Congressional District: Exports to China ($ million)

© 2009, The US-China Business Council
Sources: The Trade Partnership from US Census Bureau and US Department of Agriculture data.
New York’s Top Exports to China, 2008
NY-20: Top Exports to China, 2008*
1. Waste & Scrap $929 million 1. Other Manufacturing $126 million
2. Machinery (except Electrical) $479 million 2. Fabricated Metal Products $2 million
3. Computers & Electronics $307 million 3. Plastics & Rubber Products $503,000
4. Chemicals $271 million 4. Crop Production $461,000
5. Transportation Equipment $149 million 5. Animal Production $234,000 * The data for NY-20 reflect the combined exports of Columbia, Delaware, Dutchess, Essex, Greene, Otsego, Rensselaer, Saratoga, Warren, and Washington counties. The figures may understate the NY-20 district’s total exports to China because county-specific information for some products (e.g., mining, forestry, fishing, and waste and scrap) is not available.
$48
$63 $65
$83
$112 $115
$101$111
$129
2000 2001 2002 2003 2004 2005 2006 2007 2008
Estimated Growth in Exports from New York’s 20th Congressional District, 2000–08
Exports to China: 172% Exports to Rest of World: 70%
New York's 20th Congressional District: Exports to China ($ million)

© 2009, The US-China Business Council
Sources: The Trade Partnership from US Census Bureau and US Department of Agriculture data.
New York’s Top Exports to China, 2008
NY-21: Top Exports to China, 2008*
1. Waste & Scrap $929 million 1. Other Manufacturing $99 million
2. Machinery (except Electrical) $479 million 2. Nonmetallic Mineral Products $6 million
3. Computers & Electronics $307 million 3. Chemicals $4 million
4. Chemicals $271 million 4. Fabricated Metal Products $3 million
5. Transportation Equipment $149 million 5. Plastics & Rubber Products $963,000 * The data for NY-21 reflect the combined exports of Albany, Fulton, Montgomery, Rensselaer, Saratoga, Schenectady, and Schoharie counties. The figures may understate the NY-21 district’s total exports to China because county-specific information for some products (e.g., mining, forestry, fishing, and waste and scrap) is not available.
$42
$55 $58
$73
$98$102
$89$98
$114
2000 2001 2002 2003 2004 2005 2006 2007 2008
Estimated Growth in Exports from New York’s 21st Congressional District, 2000–08
Exports to China: 171% Exports to Rest of World: 70%
New York's 21st Congressional District: Exports to China ($ million)

© 2009, The US-China Business Council
Sources: The Trade Partnership from US Census Bureau and US Department of Agriculture data.
New York’s Top Exports to China, 2008
NY-22: Top Exports to China, 2008*
1. Waste & Scrap $929 million 1. Other Manufacturing $151 million
2. Machinery (except Electrical) $479 million 2. Electrical Equipment $3 million
3. Computers & Electronics $307 million 3. Fabricated Metal Products $2 million
4. Chemicals $271 million 4. Crop Production $568,000
5. Transportation Equipment $149 million 5. Animal Production $183,000 * The data for NY-22 reflect the combined exports of Broome, Delaware, Dutchess, Orange, Sullivan, Tioga, Tompkins, and Ulster counties. The figures may understate the NY-22 district’s total exports to China because county-specific information for some products (e.g., mining, forestry, fishing, and waste and scrap) is not available.
$58
$76 $79
$101
$136 $140
$123$136
$157
2000 2001 2002 2003 2004 2005 2006 2007 2008
Estimated Growth in Exports from New York’s 22nd Congressional District, 2000–08
Exports to China: 172% Exports to Rest of World: 71%
New York's 22nd Congressional District: Exports to China ($ million)

© 2009, The US-China Business Council
Sources: The Trade Partnership from US Census Bureau and US Department of Agriculture data.
New York’s Top Exports to China, 2008
NY-23: Top Exports to China, 2008*
1. Waste & Scrap $929 million 1. Other Manufacturing $100 million
2. Machinery (except Electrical) $479 million 2. Primary Metal Manufacturing $9 million
3. Computers & Electronics $307 million 3. Miscellaneous Manufacturing $3 million
4. Chemicals $271 million 4. Fabricated Metal Products $1 million
5. Transportation Equipment $149 million 5. Plastics & Rubber Products $888,000 * The data for NY-23 reflect the combined exports of Clinton, Essex, Franklin, Fulton, Hamilton, Jefferson, Lewis, Madison, Oneida, Oswego, and St. Lawrence counties. The figures may understate the NY-23 district’s total exports to China because county-specific information for some products (e.g., mining, forestry, fishing, and waste and scrap) is not available.
$42
$56 $58
$74
$99 $102
$90$99
$115
2000 2001 2002 2003 2004 2005 2006 2007 2008
Estimated Growth in Exports from New York’s 23rd Congressional District, 2000–08
Exports to China: 172% Exports to Rest of World: 70%
New York's 23rd Congressional District: Exports to China ($ million)

© 2009, The US-China Business Council
Sources: The Trade Partnership from US Census Bureau and US Department of Agriculture data.
New York’s Top Exports to China, 2008
NY-24: Top Exports to China, 2008*
1. Waste & Scrap $929 million 1. Other Manufacturing $93 million
2. Machinery (except Electrical) $479 million 2. Machinery (except Electrical) $12 million
3. Computers & Electronics $307 million 3. Primary Metal Manufacturing $9 million
4. Chemicals $271 million 4. Fabricated Metal Products $6 million
5. Transportation Equipment $149 million 5. Nonmetallic Mineral Products $4 million * The data for NY-24 reflect the combined exports of Broome, Cayuga, Chenango, Cortland, Herkimer, Oneida, Ontario, Otsego, Seneca, Tioga, and Tompkins counties. The figures may understate the NY-24 district’s total exports to China because county-specific information for some products (e.g., mining, forestry, fishing, and waste and scrap) is not available.
$50
$67 $69
$88
$119 $122
$107$118
$137
2000 2001 2002 2003 2004 2005 2006 2007 2008
Estimated Growth in Exports from New York’s 24th Congressional District, 2000–08
Exports to China: 172% Exports to Rest of World: 70%
New York's 24th Congressional District: Exports to China ($ million)

© 2009, The US-China Business Council
Sources: The Trade Partnership from US Census Bureau and US Department of Agriculture data.
New York’s Top Exports to China, 2008
NY-25: Top Exports to China, 2008*
1. Waste & Scrap $929 million 1. Other Manufacturing $137 million
2. Machinery (except Electrical) $479 million 2. Machinery (except Electrical) $92 million
3. Computers & Electronics $307 million 3. Computers & Electronics $30 million
4. Chemicals $271 million 4. Fabricated Metal Products $8 million
5. Transportation Equipment $149 million 5. Plastics & Rubber Products $4 million * The data for NY-25 reflect the combined exports of Cayuga, Monroe, Onondaga, and Wayne counties. The figures may understate the NY-25 district’s total exports to China because county-specific information for some products (e.g., mining, forestry, fishing, and waste and scrap) is not available.
$106
$140 $145
$184
$249 $256
$225$248
$287
2000 2001 2002 2003 2004 2005 2006 2007 2008
Estimated Growth in Exports from New York’s 25th Congressional District, 2000–08
Exports to China: 171% Exports to Rest of World: 71%
New York's 25th Congressional District: Exports to China ($ million)
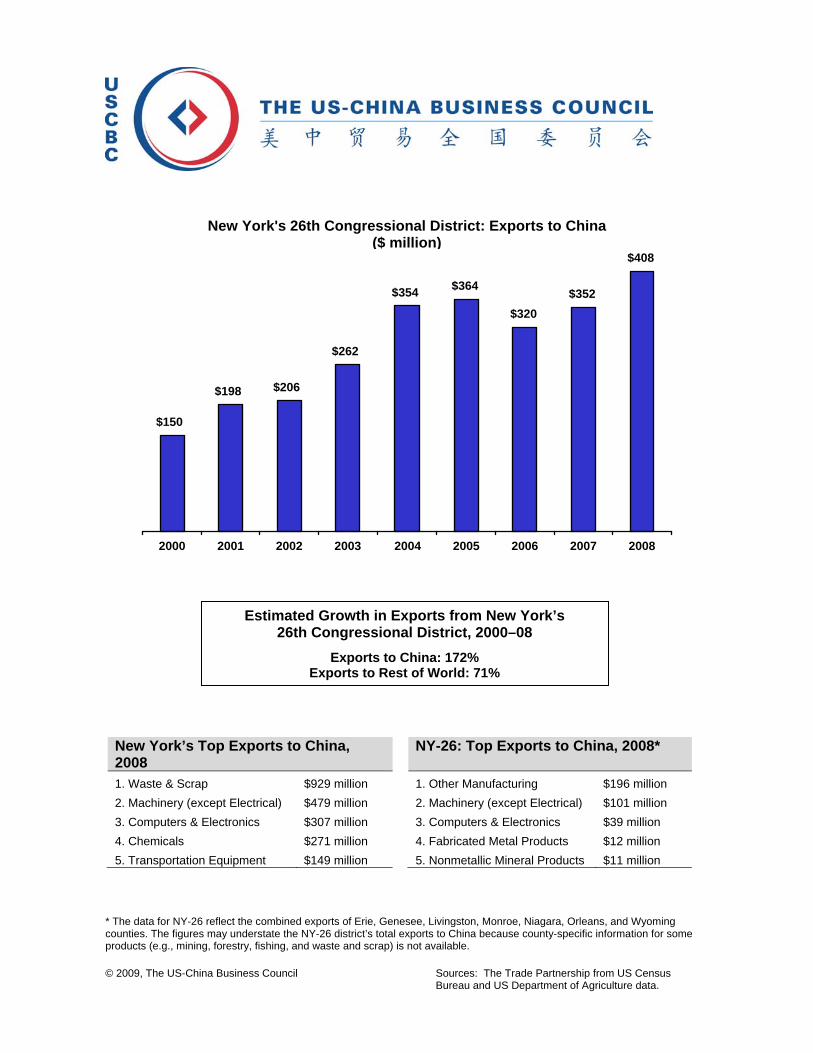
© 2009, The US-China Business Council
Sources: The Trade Partnership from US Census Bureau and US Department of Agriculture data.
New York’s Top Exports to China, 2008
NY-26: Top Exports to China, 2008*
1. Waste & Scrap $929 million 1. Other Manufacturing $196 million
2. Machinery (except Electrical) $479 million 2. Machinery (except Electrical) $101 million
3. Computers & Electronics $307 million 3. Computers & Electronics $39 million
4. Chemicals $271 million 4. Fabricated Metal Products $12 million
5. Transportation Equipment $149 million 5. Nonmetallic Mineral Products $11 million * The data for NY-26 reflect the combined exports of Erie, Genesee, Livingston, Monroe, Niagara, Orleans, and Wyoming counties. The figures may understate the NY-26 district’s total exports to China because county-specific information for some products (e.g., mining, forestry, fishing, and waste and scrap) is not available.
$150
$198 $206
$262
$354 $364
$320$352
$408
2000 2001 2002 2003 2004 2005 2006 2007 2008
Estimated Growth in Exports from New York’s 26th Congressional District, 2000–08
Exports to China: 172% Exports to Rest of World: 71%
New York's 26th Congressional District: Exports to China ($ million)

© 2009, The US-China Business Council
Sources: The Trade Partnership from US Census Bureau and US Department of Agriculture data.
New York’s Top Exports to China, 2008
NY-27: Top Exports to China, 2008*
1. Waste & Scrap $929 million 1. Other Manufacturing $71 million
2. Machinery (except Electrical) $479 million 2. Machinery (except Electrical) $68 million
3. Computers & Electronics $307 million 3. Primary Metal Manufacturing $11 million
4. Chemicals $271 million 4. Computers & Electronics $10 million
5. Transportation Equipment $149 million 5. Fabricated Metal Products $6 million * The data for NY-27 reflect the combined exports of Chautauqua and Erie counties. The figures may understate the NY-27 district’s total exports to China because county-specific information for some products (e.g., mining, forestry, fishing, and waste and scrap) is not available.
$72
$96 $99
$126
$170 $176
$154$170
$197
2000 2001 2002 2003 2004 2005 2006 2007 2008
Estimated Growth in Exports from New York’s 27th Congressional District, 2000–08
Exports to China: 171% Exports to Rest of World: 71%
New York's 27th Congressional District: Exports to China ($ million)

© 2009, The US-China Business Council
Sources: The Trade Partnership from US Census Bureau and US Department of Agriculture data.
New York’s Top Exports to China, 2008
NY-28: Top Exports to China, 2008*
1. Waste & Scrap $929 million 1. Other Manufacturing $180 million
2. Machinery (except Electrical) $479 million 2. Machinery (except Electrical) $101 million
3. Computers & Electronics $307 million 3. Computers & Electronics $39 million
4. Chemicals $271 million 4. Fabricated Metal Products $12 million
5. Transportation Equipment $149 million 5. Primary Metal Manufacturing $11 million * The data for NY-28 reflect the combined exports of Erie, Monroe, Niagara, and Orleans counties. The figures may understate the NY-28 district’s total exports to China because county-specific information for some products (e.g., mining, forestry, fishing, and waste and scrap) is not available.
$144
$189 $197
$250
$337 $348
$306$337
$390
2000 2001 2002 2003 2004 2005 2006 2007 2008
Estimated Growth in Exports from New York’s 28th Congressional District, 2000–08
Exports to China: 171% Exports to Rest of World: 71%
New York's 28th Congressional District: Exports to China ($ million)

© 2009, The US-China Business Council
Sources: The Trade Partnership from US Census Bureau and US Department of Agriculture data.
New York’s Top Exports to China, 2008
NY-29: Top Exports to China, 2008*
1. Waste & Scrap $929 million 1. Other Manufacturing $120 million
2. Machinery (except Electrical) $479 million 2. Machinery (except Electrical) $62 million
3. Computers & Electronics $307 million 3. Computers & Electronics $32 million
4. Chemicals $271 million 4. Fabricated Metal Products $9 million
5. Transportation Equipment $149 million 5. Plastics & Rubber Products $6 million * The data for NY-29 reflect the combined exports of Allegany, Cattaraugus, Chemung, Monroe, Ontario, Schuyler, Steuben, and Yates counties. The figures may understate the NY-29 district’s total exports to China because county-specific information for some products (e.g., mining, forestry, fishing, and waste and scrap) is not available.
$92
$121 $126
$160
$216 $222
$196$215
$249
2000 2001 2002 2003 2004 2005 2006 2007 2008
Estimated Growth in Exports from New York’s 29th Congressional District, 2000–08
Exports to China: 172% Exports to Rest of World: 71%
New York's 29th Congressional District: Exports to China ($ million)

© 2009, The US-China Business Council
Sources: The Trade Partnership from US Census Bureau and US Department of Agriculture data.
North Carolina’s Top Exports to China, 2008
NC-1: Top Exports to China, 2008*
1. Computers & Electronics $380 million 1. Other Manufacturing $160 million
2. Chemicals $306 million 2. Crop Production $41 million
3. Waste & Scrap $215 million 3. Processed Foods $6 million
4. Machinery (except Electrical) $184 million 4. Plastics & Rubber Products $6 million
5. Paper Products $117 million 5. Chemicals $3 million * The data for NC-1 reflect the combined exports of Beaufort, Bertie, Chowan, Craven, Edgecombe, Gates, Granville, Greene, Halifax, Hertford, Jones, Lenoir, Martin, Nash, Northampton, Pasquotank, Perquimans, Pitt, Vance, Warren, Washington, Wayne, and Wilson counties. The figures may understate the NC-1 district’s total exports to China because county-specific information for some products (e.g., mining, forestry, fishing, and waste and scrap) is not available.
$40 $43 $39
$72 $70$81
$150
$192
$222
2000 2001 2002 2003 2004 2005 2006 2007 2008
Estimated Growth in Exports from North Carolina’s 1st Congressional District, 2000–08
Exports to China: 457% Exports to Rest of World: 28%
North Carolina's 1st Congressional District: Exports to China ($ million)

© 2009, The US-China Business Council
Sources: The Trade Partnership from US Census Bureau and US Department of Agriculture data.
North Carolina’s Top Exports to China, 2008
NC-2: Top Exports to China, 2008*
1. Computers & Electronics $380 million 1. Other Manufacturing $170 million
2. Chemicals $306 million 2. Crop Production $20 million
3. Waste & Scrap $215 million 3. Machinery (except Electrical) $7 million
4. Machinery (except Electrical) $184 million 4. Processed Foods $6 million
5. Paper Products $117 million 5. Fabricated Metal Products $5 million * The data for NC-2 reflect the combined exports of Chatham, Cumberland, Franklin, Harnett, Johnston, Lee, Nash, Sampson, Vance, and Wake counties. The figures may understate the NC-2 district’s total exports to China because county-specific information for some products (e.g., mining, forestry, fishing, and waste and scrap) is not available.
$42 $45 $42
$75 $71$82
$146
$187
$210
2000 2001 2002 2003 2004 2005 2006 2007 2008
Estimated Growth in Exports from North Carolina’s 2nd Congressional District, 2000–08
Exports to China: 401% Exports to Rest of World: 30%
North Carolina's 2nd Congressional District: Exports to China ($ million)

© 2009, The US-China Business Council
Sources: The Trade Partnership from US Census Bureau and US Department of Agriculture data.
North Carolina’s Top Exports to China, 2008
NC-3: Top Exports to China, 2008*
1. Computers & Electronics $380 million 1. Other Manufacturing $95 million
2. Chemicals $306 million 2. Crop Production $30 million
3. Waste & Scrap $215 million 3. Plastics & Rubber Products $6 million
4. Machinery (except Electrical) $184 million 4. Processed Foods $6 million
5. Paper Products $117 million 5. Chemicals $3 million * The data for NC-3 reflect the combined exports of Beaufort, Camden, Carteret, Craven, Currituck, Dare, Duplin, Hyde, Jones, Lenoir, Nash, Onslow, Pamlico, Pitt, Tyrrell, Wayne, and Wilson counties. The figures may understate the NC-3 district’s total exports to China because county-specific information for some products (e.g., mining, forestry, fishing, and waste and scrap) is not available.
$25 $27 $25
$46 $45$52
$97
$125
$145
2000 2001 2002 2003 2004 2005 2006 2007 2008
Estimated Growth in Exports from North Carolina’s 3rd Congressional District, 2000–08
Exports to China: 471% Exports to Rest of World: 27%
North Carolina's 3rd Congressional District: Exports to China ($ million)

© 2009, The US-China Business Council
Sources: The Trade Partnership from US Census Bureau and US Department of Agriculture data.
North Carolina’s Top Exports to China, 2008
NC-4: Top Exports to China, 2008*
1. Computers & Electronics $380 million 1. Other Manufacturing $155 million
2. Chemicals $306 million 2. Crop Production $4 million
3. Waste & Scrap $215 million 3. Processed Foods $2 million
4. Machinery (except Electrical) $184 million 4. Fabricated Metal Products $2 million
5. Paper Products $117 million 5. Wood Products $2 million * The data for NC-4 reflect the combined exports of Chatham, Durham, Orange, and Wake counties. The figures may understate the NC-4 district’s total exports to China because county-specific information for some products (e.g., mining, forestry, fishing, and waste and scrap) is not available.
$36 $38 $35
$63 $59$68
$117
$151
$166
2000 2001 2002 2003 2004 2005 2006 2007 2008
Estimated Growth in Exports from North Carolina’s 4th Congressional District, 2000–08
Exports to China: 366% Exports to Rest of World: 32%
North Carolina's 4th Congressional District: Exports to China ($ million)

© 2009, The US-China Business Council
Sources: The Trade Partnership from US Census Bureau and US Department of Agriculture data.
North Carolina’s Top Exports to China, 2008
NC-5: Top Exports to China, 2008*
1. Computers & Electronics $380 million 1. Other Manufacturing $184 million
2. Chemicals $306 million 2. Crop Production $9 million
3. Waste & Scrap $215 million 3. Textiles & Fabrics $7 million
4. Machinery (except Electrical) $184 million 4. Machinery (except Electrical) $5 million
5. Paper Products $117 million 5. Nonmetallic Mineral Products $4 million * The data for NC-5 reflect the combined exports of Alexander, Alleghany, Ashe, Davie, Forsyth, Iredell, Rockingham, Stokes, Surry, Watauga, Wilkes, and Yadkin counties. The figures may understate the NC-5 district’s total exports to China because county-specific information for some products (e.g., mining, forestry, fishing, and waste and scrap) is not available.
$48 $52 $47
$85 $79$92
$159
$205
$226
2000 2001 2002 2003 2004 2005 2006 2007 2008
Estimated Growth in Exports from North Carolina’s 5th Congressional District, 2000–08
Exports to China: 373% Exports to Rest of World: 32%
North Carolina's 5th Congressional District: Exports to China ($ million)

© 2009, The US-China Business Council
Sources: The Trade Partnership from US Census Bureau and US Department of Agriculture data.
North Carolina’s Top Exports to China, 2008
NC-6: Top Exports to China, 2008*
1. Computers & Electronics $380 million 1. Other Manufacturing $106 million
2. Chemicals $306 million 2. Chemicals $45 million
3. Waste & Scrap $215 million 3. Plastics & Rubber Products $13 million
4. Machinery (except Electrical) $184 million 4. Textiles & Fabrics $12 million
5. Paper Products $117 million 5. Paper Products $11 million * The data for NC-6 reflect the combined exports of Alamance, Davidson, Guilford, Moore, Randolph, and Rowan counties. The figures may understate the NC-6 district’s total exports to China because county-specific information for some products (e.g., mining, forestry, fishing, and waste and scrap) is not available.
$49 $53 $49
$87 $81$94
$162
$209
$229
2000 2001 2002 2003 2004 2005 2006 2007 2008
Estimated Growth in Exports from North Carolina’s 6th Congressional District, 2000–08
Exports to China: 368% Exports to Rest of World: 32%
North Carolina's 6th Congressional District: Exports to China ($ million)

© 2009, The US-China Business Council
Sources: The Trade Partnership from US Census Bureau and US Department of Agriculture data.
North Carolina’s Top Exports to China, 2008
NC-7: Top Exports to China, 2008*
1. Computers & Electronics $380 million 1. Other Manufacturing $80 million
2. Chemicals $306 million 2. Crop Production $20 million
3. Waste & Scrap $215 million 3. Processed Foods $3 million
4. Machinery (except Electrical) $184 million 4. Nonmetallic Mineral Products $3 million
5. Paper Products $117 million 5. Textiles & Fabrics $2 million * The data for NC-7 reflect the combined exports of Bladen, Brunswick, Columbus, Cumberland, Duplin, New Hanover, Pender, Robeson, Sampson, and Scotland counties. The figures may understate the NC-7 district’s total exports to China because county-specific information for some products (e.g., mining, forestry, fishing, and waste and scrap) is not available.
$21 $22 $20
$37 $36$42
$77
$99
$113
2000 2001 2002 2003 2004 2005 2006 2007 2008
Estimated Growth in Exports from North Carolina’s 7th Congressional District, 2000–08
Exports to China: 448% Exports to Rest of World: 28%
North Carolina's 7th Congressional District: Exports to China ($ million)

© 2009, The US-China Business Council
Sources: The Trade Partnership from US Census Bureau and US Department of Agriculture data.
North Carolina’s Top Exports to China, 2008
NC-8: Top Exports to China, 2008*
1. Computers & Electronics $380 million 1. Other Manufacturing $167 million
2. Chemicals $306 million 2. Machinery (except Electrical) $21 million
3. Waste & Scrap $215 million 3. Plastics & Rubber Products $14 million
4. Machinery (except Electrical) $184 million 4. Chemicals $11 million
5. Paper Products $117 million 5. Paper Products $11 million * The data for NC-8 reflect the combined exports of Anson, Cabarrus, Cumberland, Hoke, Mecklenburg, Montgomery, Richmond, Scotland, Stanly, and Union counties. The figures may understate the NC-8 district’s total exports to China because county-specific information for some products (e.g., mining, forestry, fishing, and waste and scrap) is not available.
$55 $60 $55
$98 $91$107
$184
$237
$261
2000 2001 2002 2003 2004 2005 2006 2007 2008
Estimated Growth in Exports from North Carolina’s 8th Congressional District, 2000–08
Exports to China: 371% Exports to Rest of World: 32%
North Carolina's 8th Congressional District: Exports to China ($ million)

© 2009, The US-China Business Council
Sources: The Trade Partnership from US Census Bureau and US Department of Agriculture data.
North Carolina’s Top Exports to China, 2008
NC-9: Top Exports to China, 2008*
1. Computers & Electronics $380 million 1. Other Manufacturing $56 million
2. Chemicals $306 million 2. Machinery (except Electrical) $21 million
3. Waste & Scrap $215 million 3. Chemicals $16 million
4. Machinery (except Electrical) $184 million 4. Plastics & Rubber Products $14 million
5. Paper Products $117 million 5. Processed Foods $8 million * The data for NC-9 reflect the combined exports of Gaston, Mecklenburg, and Union counties. The figures may understate the NC-9 district’s total exports to China because county-specific information for some products (e.g., mining, forestry, fishing, and waste and scrap) is not available.
$31 $33 $30
$54 $51$59
$102
$132
$145
2000 2001 2002 2003 2004 2005 2006 2007 2008
Estimated Growth in Exports from North Carolina’s 9th Congressional District, 2000–08
Exports to China: 374% Exports to Rest of World: 32%
North Carolina's 9th Congressional District: Exports to China ($ million)

© 2009, The US-China Business Council
Sources: The Trade Partnership from US Census Bureau and US Department of Agriculture data.
North Carolina’s Top Exports to China, 2008
NC-10: Top Exports to China, 2008*
1. Computers & Electronics $380 million 1. Other Manufacturing $138 million
2. Chemicals $306 million 2. Textiles & Fabrics $15 million
3. Waste & Scrap $215 million 3. Chemicals $8 million
4. Machinery (except Electrical) $184 million 4. Plastics & Rubber Products $7 million
5. Paper Products $117 million 5. Furniture & Related Products $6 million * The data for NC-10 reflect the combined exports of Avery, Burke, Caldwell, Catawba, Cleveland, Gaston, Iredell, Lincoln, Mitchell, and Rutherford counties. The figures may understate the NC-10 district’s total exports to China because county-specific information for some products (e.g., mining, forestry, fishing, and waste and scrap) is not available.
$45 $48 $44
$79 $73$86
$147
$190$208
2000 2001 2002 2003 2004 2005 2006 2007 2008
Estimated Growth in Exports from North Carolina’s 10th Congressional District, 2000–08
Exports to China: 368% Exports to Rest of World: 32%
North Carolina's 10th Congressional District: Exports to China ($ million)

© 2009, The US-China Business Council
Sources: The Trade Partnership from US Census Bureau and US Department of Agriculture data.
North Carolina’s Top Exports to China, 2008
NC-11: Top Exports to China, 2008*
1. Computers & Electronics $380 million 1. Other Manufacturing $58 million
2. Chemicals $306 million 2. Machinery (except Electrical) $11 million
3. Waste & Scrap $215 million 3. Crop Production $8 million
4. Machinery (except Electrical) $184 million 4. Plastics & Rubber Products $4 million
5. Paper Products $117 million 5. Textiles & Fabrics $4 million * The data for NC-11 reflect the combined exports of Buncombe, Cherokee, Clay, Graham, Haywood, Henderson, Jackson, Macon, Madison, McDowell, Polk, Rutherford, Swain, Transylvania, and Yancey counties. The figures may understate the NC-11 district’s total exports to China because county-specific information for some products (e.g., mining, forestry, fishing, and waste and scrap) is not available.
$18 $20 $18
$33 $31$36
$64
$82
$91
2000 2001 2002 2003 2004 2005 2006 2007 2008
Estimated Growth in Exports from North Carolina’s 11th Congressional District, 2000–08
Exports to China: 395% Exports to Rest of World: 31%
North Carolina's 11th Congressional District: Exports to China ($ million)

© 2009, The US-China Business Council
Sources: The Trade Partnership from US Census Bureau and US Department of Agriculture data.
North Carolina’s Top Exports to China, 2008
NC-12: Top Exports to China, 2008*
1. Computers & Electronics $380 million 1. Other Manufacturing $287 million
2. Chemicals $306 million 2. Chemicals $59 million
3. Waste & Scrap $215 million 3. Machinery (except Electrical) $31 million
4. Machinery (except Electrical) $184 million 4. Plastics & Rubber Products $20 million
5. Paper Products $117 million 5. Paper Products $13 million * The data for NC-12 reflect the combined exports of Cabarrus, Davidson, Forsyth, Guilford, Mecklenburg, and Rowan counties. The figures may understate the NC-12 district’s total exports to China because county-specific information for some products (e.g., mining, forestry, fishing, and waste and scrap) is not available.
$99 $107 $98
$176 $163$190
$326
$420
$460
2000 2001 2002 2003 2004 2005 2006 2007 2008
Estimated Growth in Exports from North Carolina’s 12th Congressional District, 2000–08
Exports to China: 364% Exports to Rest of World: 32%
North Carolina's 12th Congressional District: Exports to China ($ million)

© 2009, The US-China Business Council
Sources: The Trade Partnership from US Census Bureau and US Department of Agriculture data.
North Carolina’s Top Exports to China, 2008
NC-13: Top Exports to China, 2008*
1. Computers & Electronics $380 million 1. Other Manufacturing $226 million
2. Chemicals $306 million 2. Chemicals $41 million
3. Waste & Scrap $215 million 3. Textiles & Fabrics $14 million
4. Machinery (except Electrical) $184 million 4. Machinery (except Electrical) $9 million
5. Paper Products $117 million 5. Crop Production $9 million * The data for NC-13 reflect the combined exports of Alamance, Caswell, Granville, Guilford, Person, Rockingham, and Wake counties. The figures may understate the NC-13 district’s total exports to China because county-specific information for some products (e.g., mining, forestry, fishing, and waste and scrap) is not available.
$71 $77 $70
$126 $117$137
$235
$302
$332
2000 2001 2002 2003 2004 2005 2006 2007 2008
Estimated Growth in Exports from North Carolina’s 13th Congressional District, 2000–08
Exports to China: 368% Exports to Rest of World: 32%
North Carolina's 13th Congressional District: Exports to China ($ million)

© 2009, The US-China Business Council Source: US Department of Commerce
North Dakota’s Top Exports to China, 2008* 1. Machinery (except Electrical) $11 million
2. Processed Foods $1 million
3. Computers & Electronics $1 million
4. Crop Production $807,000
5. Transportation Equipment $677,000
*The data for North Dakota’s at-large congressional district reflect the combined exports of the entire state.
North Dakota's At-Large Congressional District: Exports to China ($ million)
$5$4
$6
$10
$13
$18
$10
$15
$2
2000 2001 2002 2003 2004 2005 2006 2007 2008
Estimated Growth in Exports from North Dakota, 2000–08
Exports to China: 213% Exports to Rest of World: 342%

© 2009, The US-China Business Council
Sources: The Trade Partnership from US Census Bureau and US Department of Agriculture data.
Ohio’s Top Exports to China, 2008 OH-1: Top Exports to China, 2008* 1. Machinery (except Electrical) $370 million 1. Chemicals $48 million
2. Computers & Electronics $290 million 2. Other Manufacturing $38 million
3. Chemicals $268 million 3. Machinery (except Electrical) $32 million
4. Waste & Scrap $198 million 4. Computers & Electronics $14 million
5. Transportation Equipment $138 million 5. Fabricated Metal Products $10 million * The data for OH-1 reflect the combined exports of Butler and Hamilton counties. The figures may understate the OH-1 district’s total exports to China because county-specific information for some products (e.g., mining, forestry, fishing, and waste and scrap) is not available.
$28
$44 $49$61
$93$87
$116
$132
$160
2000 2001 2002 2003 2004 2005 2006 2007 2008
Estimated Growth in Exports from Ohio’s 1st Congressional District, 2000–08
Exports to China: 469% Exports to Rest of World: 67%
Ohio's 1st Congressional District: Exports to China ($ million)

© 2009, The US-China Business Council
Sources: The Trade Partnership from US Census Bureau and US Department of Agriculture data.
Ohio’s Top Exports to China, 2008 OH-2: Top Exports to China, 2008* 1. Machinery (except Electrical) $370 million 1. Chemicals $46 million
2. Computers & Electronics $290 million 2. Other Manufacturing $42 million
3. Chemicals $268 million 3. Computers & Electronics $29 million
4. Waste & Scrap $198 million 4. Machinery (except Electrical) $21 million
5. Transportation Equipment $138 million 5. Fabricated Metal Products $9 million * The data for OH-2 reflect the combined exports of Adams, Brown, Clermont, Hamilton, Pike, Scioto, and Warren counties. The figures may understate the OH-2 district’s total exports to China because county-specific information for some products (e.g., mining, forestry, fishing, and waste and scrap) is not available.
$28
$44$50
$62
$94$87
$117
$133
$162
2000 2001 2002 2003 2004 2005 2006 2007 2008
Estimated Growth in Exports from Ohio’s 2nd Congressional District, 2000–08
Exports to China: 470% Exports to Rest of World: 68%
Ohio's 2nd Congressional District: Exports to China ($ million)

© 2009, The US-China Business Council
Sources: The Trade Partnership from US Census Bureau and US Department of Agriculture data.
Ohio’s Top Exports to China, 2008 OH-3: Top Exports to China, 2008* 1. Machinery (except Electrical) $370 million 1. Other Manufacturing $58 million
2. Computers & Electronics $290 million 2. Machinery (except Electrical) $37 million
3. Chemicals $268 million 3. Computers & Electronics $28 million
4. Waste & Scrap $198 million 4. Fabricated Metal Products $7 million
5. Transportation Equipment $138 million 5. Chemicals $3 million * The data for OH-3 reflect the combined exports of Clinton, Highland, Montgomery, and Warren counties. The figures may understate the OH-3 district’s total exports to China because county-specific information for some products (e.g., mining, forestry, fishing, and waste and scrap) is not available.
$24
$38 $42$53
$80$74
$100
$113
$138
2000 2001 2002 2003 2004 2005 2006 2007 2008
Estimated Growth in Exports from Ohio’s 3rd Congressional District, 2000–08
Exports to China: 471% Exports to Rest of World: 68%
Ohio's 3rd Congressional District: Exports to China ($ million)

© 2009, The US-China Business Council
Sources: The Trade Partnership from US Census Bureau and US Department of Agriculture data.
Ohio’s Top Exports to China, 2008 OH-4: Top Exports to China, 2008* 1. Machinery (except Electrical) $370 million 1. Other Manufacturing $130 million
2. Computers & Electronics $290 million 2. Machinery (except Electrical) $27 million
3. Chemicals $268 million 3. Transportation Equipment $14 million
4. Waste & Scrap $198 million 4. Computers & Electronics $7 million
5. Transportation Equipment $138 million 5. Fabricated Metal Products $6 million * The data for OH-4 reflect the combined exports of Allen, Auglaize, Champaign, Hancock, Hardin, Logan, Marion, Morrow, Richland, Shelby, and Wyandot counties. The figures may understate the OH-4 district’s total exports to China because county-specific information for some products (e.g., mining, forestry, fishing, and waste and scrap) is not available.
$35
$55$62
$76
$116$108
$145
$165
$201
2000 2001 2002 2003 2004 2005 2006 2007 2008
Estimated Growth in Exports from Ohio’s 4th Congressional District, 2000–08
Exports to China: 472% Exports to Rest of World: 68%
Ohio's 4th Congressional District: Exports to China ($ million)

© 2009, The US-China Business Council
Sources: The Trade Partnership from US Census Bureau and US Department of Agriculture data.
Ohio’s Top Exports to China, 2008 OH-5: Top Exports to China, 2008* 1. Machinery (except Electrical) $370 million 1. Other Manufacturing $141 million
2. Computers & Electronics $290 million 2. Machinery (except Electrical) $40 million
3. Chemicals $268 million 3. Fabricated Metal Products $18 million
4. Waste & Scrap $198 million 4. Transportation Equipment $15 million
5. Transportation Equipment $138 million 5. Chemicals $7 million * The data for OH-5 reflect the combined exports of Ashland, Crawford, Defiance, Fulton, Henry, Huron, Lucas, Mercer, Paulding, Putnam, Sandusky, Seneca, Van Wert, Williams, Wood, and Wyandot counties. The figures may understate the OH-5 district’s total exports to China because county-specific information for some products (e.g., mining, forestry, fishing, and waste and scrap) is not available.
$41
$63$71
$89
$135$125
$168
$192
$234
2000 2001 2002 2003 2004 2005 2006 2007 2008
Estimated Growth in Exports from Ohio’s 5th Congressional District, 2000–08
Exports to China: 476% Exports to Rest of World: 68%
Ohio's 5th Congressional District: Exports to China ($ million)

© 2009, The US-China Business Council
Sources: The Trade Partnership from US Census Bureau and US Department of Agriculture data.
Ohio’s Top Exports to China, 2008 OH-6: Top Exports to China, 2008* 1. Machinery (except Electrical) $370 million 1. Other Manufacturing $33 million
2. Computers & Electronics $290 million 2. Fabricated Metal Products $6 million
3. Chemicals $268 million 3. Primary Metal Manufacturing $4 million
4. Waste & Scrap $198 million 4. Machinery (except Electrical) $3 million
5. Transportation Equipment $138 million 5. Nonmetallic Mineral Products $1 million * The data for OH-6 reflect the combined exports of Athens, Belmont, Columbiana, Gallia, Jefferson, Lawrence, Mahoning, Meigs, Monroe, Noble, Scioto, and Washington counties. The figures may understate the OH-6 district’s total exports to China because county-specific information for some products (e.g., mining, forestry, fishing, and waste and scrap) is not available.
$8
$13$15
$18
$28$26
$34
$39
$48
2000 2001 2002 2003 2004 2005 2006 2007 2008
Estimated Growth in Exports from Ohio’s 6th Congressional District, 2000–08
Exports to China: 472% Exports to Rest of World: 68%
Ohio's 6th Congressional District: Exports to China ($ million)

© 2009, The US-China Business Council
Sources: The Trade Partnership from US Census Bureau and US Department of Agriculture data.
Ohio’s Top Exports to China, 2008 OH-7: Top Exports to China, 2008* 1. Machinery (except Electrical) $370 million 1. Other Manufacturing $65 million
2. Computers & Electronics $290 million 2. Machinery (except Electrical) $25 million
3. Chemicals $268 million 3. Chemicals $16 million
4. Waste & Scrap $198 million 4. Fabricated Metal Products $12 million
5. Transportation Equipment $138 million 5. Nonmetallic Mineral Products $7 million * The data for OH-7 reflect the combined exports of Clark, Fairfield, Fayette, Franklin, Greene, Perry, Pickaway, and Ross counties. The figures may understate the OH-7 district’s total exports to China because county-specific information for some products (e.g., mining, forestry, fishing, and waste and scrap) is not available.
$24
$38$43
$53
$81$75
$101
$114
$140
2000 2001 2002 2003 2004 2005 2006 2007 2008
Estimated Growth in Exports from Ohio’s 7th Congressional District, 2000–08
Exports to China: 474% Exports to Rest of World: 68%
Ohio's 7th Congressional District: Exports to China ($ million)

© 2009, The US-China Business Council
Sources: The Trade Partnership from US Census Bureau and US Department of Agriculture data.
Ohio’s Top Exports to China, 2008 OH-8: Top Exports to China, 2008* 1. Machinery (except Electrical) $370 million 1. Other Manufacturing $86 million
2. Computers & Electronics $290 million 2. Machinery (except Electrical) $58 million
3. Chemicals $268 million 3. Computers & Electronics $13 million
4. Waste & Scrap $198 million 4. Fabricated Metal Products $9 million
5. Transportation Equipment $138 million 5. Chemicals $6 million * The data for OH-8 reflect the combined exports of Butler, Darke, Mercer, Miami, Montgomery, and Preble counties. The figures may understate the OH-8 district’s total exports to China because county-specific information for some products (e.g., mining, forestry, fishing, and waste and scrap) is not available.
$32
$50$57
$70
$107$99
$133
$151
$184
2000 2001 2002 2003 2004 2005 2006 2007 2008
Estimated Growth in Exports from Ohio’s 8th Congressional District, 2000–08
Exports to China: 471% Exports to Rest of World: 68%
Ohio's 8th Congressional District: Exports to China ($ million)

© 2009, The US-China Business Council
Sources: The Trade Partnership from US Census Bureau and US Department of Agriculture data.
Ohio’s Top Exports to China, 2008 OH-9: Top Exports to China, 2008* 1. Machinery (except Electrical) $370 million 1. Other Manufacturing $78 million
2. Computers & Electronics $290 million 2. Machinery (except Electrical) $26 million
3. Chemicals $268 million 3. Transportation Equipment $20 million
4. Waste & Scrap $198 million 4. Chemicals $13 million
5. Transportation Equipment $138 million 5. Fabricated Metal Products $8 million * The data for OH-9 reflect the combined exports of Erie, Lorain, Lucas, and Ottawa counties. The figures may understate the OH-9 district’s total exports to China because county-specific information for some products (e.g., mining, forestry, fishing, and waste and scrap) is not available.
$27
$42$48
$60
$91$84
$113
$128
$156
2000 2001 2002 2003 2004 2005 2006 2007 2008
Estimated Growth in Exports from Ohio’s 9th Congressional District, 2000–08
Exports to China: 471% Exports to Rest of World: 68%
Ohio's 9th Congressional District: Exports to China ($ million)

© 2009, The US-China Business Council
Sources: The Trade Partnership from US Census Bureau and US Department of Agriculture data.
Ohio’s Top Exports to China, 2008 OH-10: Top Exports to China, 2008* 1. Machinery (except Electrical) $370 million 1. Machinery (except Electrical) $50 million
2. Computers & Electronics $290 million 2. Computers & Electronics $39 million
3. Chemicals $268 million 3. Chemicals $38 million
4. Waste & Scrap $198 million 4. Fabricated Metal Products $21 million
5. Transportation Equipment $138 million 5. Primary Metal Manufacturing $8 million * The data for OH-10 reflect the exports of Cuyahoga County, which also includes other congressional districts. The figures may understate the OH-10 district’s total exports to China because county-specific information for some products (e.g., mining, forestry, fishing, and waste and scrap) is not available.
$33
$50$57
$69
$107$101
$133$145
$179
2000 2001 2002 2003 2004 2005 2006 2007 2008
Estimated Growth in Exports from Ohio’s 10th Congressional District, 2000–08
Exports to China: 435% Exports to Rest of World: 66%
Ohio's 10th Congressional District: Exports to China ($ million)

© 2009, The US-China Business Council
Sources: The Trade Partnership from US Census Bureau and US Department of Agriculture data.
Ohio’s Top Exports to China, 2008 OH-11: Top Exports to China, 2008* 1. Machinery (except Electrical) $370 million 1. Machinery (except Electrical) $50 million
2. Computers & Electronics $290 million 2. Computers & Electronics $39 million
3. Chemicals $268 million 3. Chemicals $38 million
4. Waste & Scrap $198 million 4. Fabricated Metal Products $21 million
5. Transportation Equipment $138 million 5. Primary Metal Manufacturing $8 million * The data for OH-11 reflect the exports of Cuyahoga County, which also includes other congressional districts. The figures may understate the OH-11 district’s total exports to China because county-specific information for some products (e.g., mining, forestry, fishing, and waste and scrap) is not available.
$33
$50$57
$69
$107$101
$133$145
$179
2000 2001 2002 2003 2004 2005 2006 2007 2008
Estimated Growth in Exports from Ohio’s 11th Congressional District, 2000–08
Exports to China: 435% Exports to Rest of World: 66%
Ohio's 11th Congressional District: Exports to China ($ million)

© 2009, The US-China Business Council
Sources: The Trade Partnership from US Census Bureau and US Department of Agriculture data.
Ohio’s Top Exports to China, 2008 OH-12: Top Exports to China, 2008* 1. Machinery (except Electrical) $370 million 1. Other Manufacturing $45 million
2. Computers & Electronics $290 million 2. Machinery (except Electrical) $18 million
3. Chemicals $268 million 3. Chemicals $16 million
4. Waste & Scrap $198 million 4. Nonmetallic Mineral Products $10 million
5. Transportation Equipment $138 million 5. Fabricated Metal Products $9 million * The data for OH-12 reflect the combined exports of Delaware, Franklin, and Licking counties. The figures may understate the OH-12 district’s total exports to China because county-specific information for some products (e.g., mining, forestry, fishing, and waste and scrap) is not available.
$19
$29$33
$41
$63$58
$78
$89
$108
2000 2001 2002 2003 2004 2005 2006 2007 2008
Estimated Growth in Exports from Ohio’s 12th Congressional District, 2000–08
Exports to China: 471% Exports to Rest of World: 67%
Ohio's 12th Congressional District: Exports to China ($ million)

© 2009, The US-China Business Council
Sources: The Trade Partnership from US Census Bureau and US Department of Agriculture data.
Ohio’s Top Exports to China, 2008 OH-13: Top Exports to China, 2008* 1. Machinery (except Electrical) $370 million 1. Machinery (except Electrical) $84 million
2. Computers & Electronics $290 million 2. Chemicals $61 million
3. Chemicals $268 million 3. Computers & Electronics $39 million
4. Waste & Scrap $198 million 4. Fabricated Metal Products $29 million
5. Transportation Equipment $138 million 5. Transportation Equipment $14 million * The data for OH-13 reflect the combined exports of Cuyahoga, Lorain, Medina, and Summit counties. The figures may understate the OH-13 district’s total exports to China because county-specific information for some products (e.g., mining, forestry, fishing, and waste and scrap) is not available.
$52
$77$87
$109
$168$156
$204$225
$274
2000 2001 2002 2003 2004 2005 2006 2007 2008
Estimated Growth in Exports from Ohio’s 13th Congressional District, 2000–08
Exports to China: 427% Exports to Rest of World: 67%
Ohio's 13th Congressional District: Exports to China ($ million)

© 2009, The US-China Business Council
Sources: The Trade Partnership from US Census Bureau and US Department of Agriculture data.
Ohio’s Top Exports to China, 2008 OH-14: Top Exports to China, 2008* 1. Machinery (except Electrical) $370 million 1. Machinery (except Electrical) $84 million
2. Computers & Electronics $290 million 2. Chemicals $68 million
3. Chemicals $268 million 3. Computers & Electronics $54 million
4. Waste & Scrap $198 million 4. Fabricated Metal Products $36 million
5. Transportation Equipment $138 million 5. Primary Metal Manufacturing $19 million * The data for OH-14 reflect the combined exports of Ashtabula, Cuyahoga, Geauga, Lake, Portage, Summit, and Trumbull counties. The figures may understate the OH-14 district’s total exports to China because county-specific information for some products (e.g., mining, forestry, fishing, and waste and scrap) is not available.
$56$81
$93$116
$179 $170
$223$248
$305
2000 2001 2002 2003 2004 2005 2006 2007 2008
Estimated Growth in Exports from Ohio’s 14th Congressional District, 2000–08
Exports to China: 445% Exports to Rest of World: 68%
Ohio's 14th Congressional District: Exports to China ($ million)

© 2009, The US-China Business Council
Sources: The Trade Partnership from US Census Bureau and US Department of Agriculture data.
Ohio’s Top Exports to China, 2008 OH-15: Top Exports to China, 2008* 1. Machinery (except Electrical) $370 million 1. Other Manufacturing $30 million
2. Computers & Electronics $290 million 2. Machinery (except Electrical) $18 million
3. Chemicals $268 million 3. Chemicals $16 million
4. Waste & Scrap $198 million 4. Fabricated Metal Products $8 million
5. Transportation Equipment $138 million 5. Nonmetallic Mineral Products $5 million * The data for OH-15 reflect the combined exports of Franklin, Madison, and Union counties. The figures may understate the OH-15 district’s total exports to China because county-specific information for some products (e.g., mining, forestry, fishing, and waste and scrap) is not available.
$15
$24$27
$33
$50$47
$63
$71
$87
2000 2001 2002 2003 2004 2005 2006 2007 2008
Estimated Growth in Exports from Ohio’s 15th Congressional District, 2000–08
Exports to China: 472% Exports to Rest of World: 67%
Ohio's 15th Congressional District: Exports to China ($ million)

© 2009, The US-China Business Council
Sources: The Trade Partnership from US Census Bureau and US Department of Agriculture data.
Ohio’s Top Exports to China, 2008 OH-16: Top Exports to China, 2008* 1. Machinery (except Electrical) $370 million 1. Machinery (except Electrical) $22 million
2. Computers & Electronics $290 million 2. Primary Metal Manufacturing $22 million
3. Chemicals $268 million 3. Other Manufacturing $18 million
4. Waste & Scrap $198 million 4. Fabricated Metal Products $9 million
5. Transportation Equipment $138 million 5. Electrical Equipment $6 million * The data for OH-16 reflect the combined exports of Ashland, Medina, Stark, and Wayne counties. The figures may understate the OH-16 district’s total exports to China because county-specific information for some products (e.g., mining, forestry, fishing, and waste and scrap) is not available.
$16
$25 $28$35
$53$49
$66
$76
$92
2000 2001 2002 2003 2004 2005 2006 2007 2008
Estimated Growth in Exports from Ohio’s 16th Congressional District, 2000–08
Exports to China: 471% Exports to Rest of World: 68%
Ohio's 16th Congressional District: Exports to China ($ million)

© 2009, The US-China Business Council
Sources: The Trade Partnership from US Census Bureau and US Department of Agriculture data.
Ohio’s Top Exports to China, 2008 OH-17: Top Exports to China, 2008* 1. Machinery (except Electrical) $370 million 1. Other Manufacturing $61 million
2. Computers & Electronics $290 million 2. Machinery (except Electrical) $19 million
3. Chemicals $268 million 3. Chemicals $15 million
4. Waste & Scrap $198 million 4. Primary Metal Manufacturing $15 million
5. Transportation Equipment $138 million 5. Fabricated Metal Products $11 million * The data for OH-17 reflect the combined exports of Mahoning, Portage, Summit, and Trumbull counties. The figures may understate the OH-17 district’s total exports to China because county-specific information for some products (e.g., mining, forestry, fishing, and waste and scrap) is not available.
$24
$37$42
$52
$80$74
$99
$113
$137
2000 2001 2002 2003 2004 2005 2006 2007 2008
Estimated Growth in Exports from Ohio’s 17th Congressional District, 2000–08
Exports to China: 469% Exports to Rest of World: 68%
Ohio's 17th Congressional District: Exports to China ($ million)
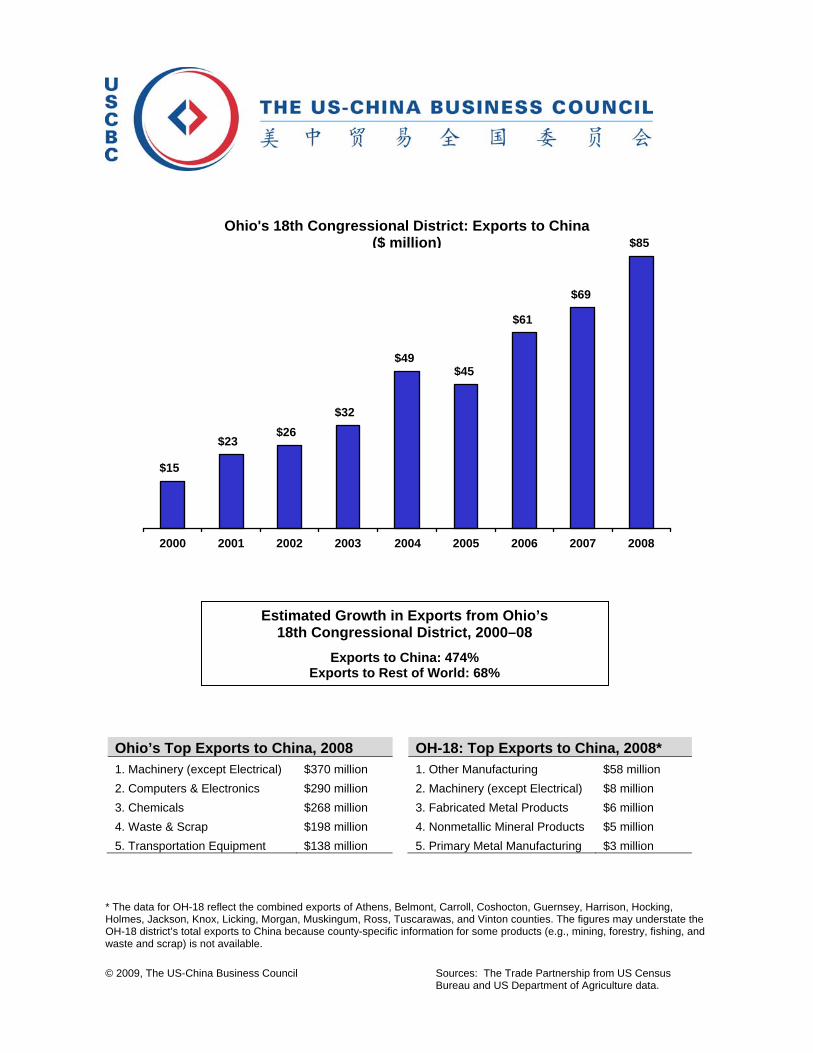
© 2009, The US-China Business Council
Sources: The Trade Partnership from US Census Bureau and US Department of Agriculture data.
Ohio’s Top Exports to China, 2008 OH-18: Top Exports to China, 2008* 1. Machinery (except Electrical) $370 million 1. Other Manufacturing $58 million
2. Computers & Electronics $290 million 2. Machinery (except Electrical) $8 million
3. Chemicals $268 million 3. Fabricated Metal Products $6 million
4. Waste & Scrap $198 million 4. Nonmetallic Mineral Products $5 million
5. Transportation Equipment $138 million 5. Primary Metal Manufacturing $3 million * The data for OH-18 reflect the combined exports of Athens, Belmont, Carroll, Coshocton, Guernsey, Harrison, Hocking, Holmes, Jackson, Knox, Licking, Morgan, Muskingum, Ross, Tuscarawas, and Vinton counties. The figures may understate the OH-18 district’s total exports to China because county-specific information for some products (e.g., mining, forestry, fishing, and waste and scrap) is not available.
$15
$23$26
$32
$49$45
$61
$69
$85
2000 2001 2002 2003 2004 2005 2006 2007 2008
Estimated Growth in Exports from Ohio’s 18th Congressional District, 2000–08
Exports to China: 474% Exports to Rest of World: 68%
Ohio's 18th Congressional District: Exports to China ($ million)
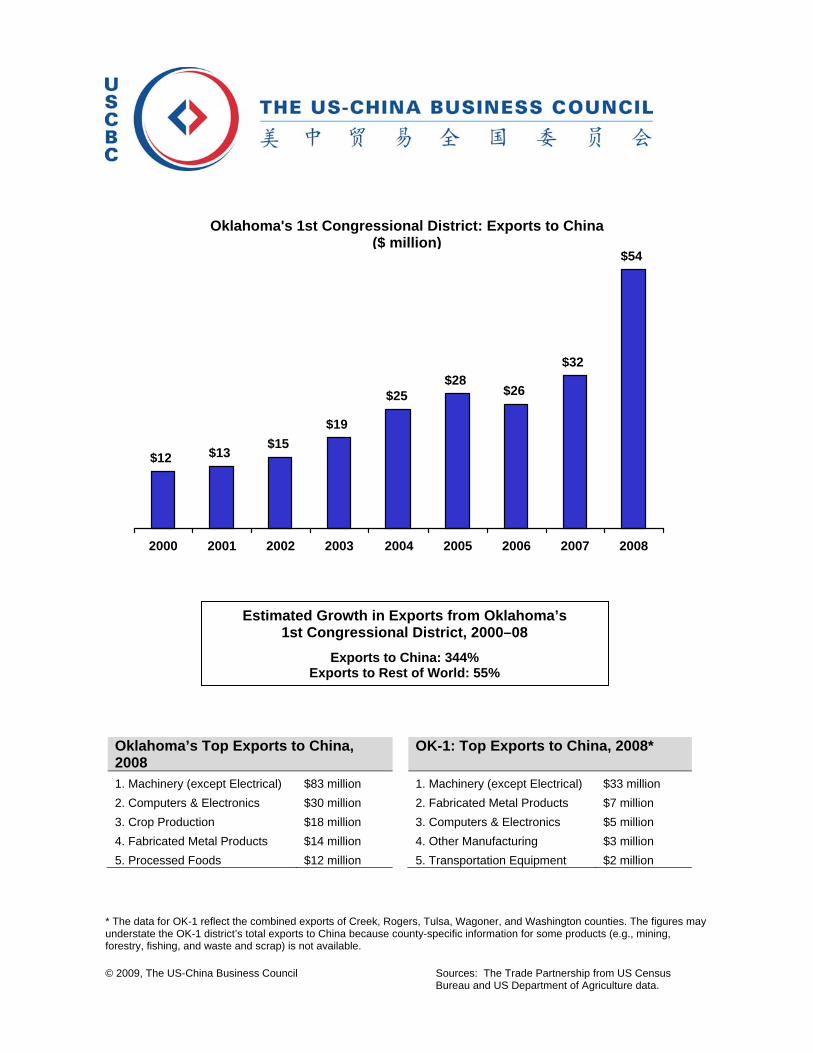
© 2009, The US-China Business Council
Sources: The Trade Partnership from US Census Bureau and US Department of Agriculture data.
Oklahoma’s Top Exports to China, 2008
OK-1: Top Exports to China, 2008*
1. Machinery (except Electrical) $83 million 1. Machinery (except Electrical) $33 million
2. Computers & Electronics $30 million 2. Fabricated Metal Products $7 million
3. Crop Production $18 million 3. Computers & Electronics $5 million
4. Fabricated Metal Products $14 million 4. Other Manufacturing $3 million
5. Processed Foods $12 million 5. Transportation Equipment $2 million * The data for OK-1 reflect the combined exports of Creek, Rogers, Tulsa, Wagoner, and Washington counties. The figures may understate the OK-1 district’s total exports to China because county-specific information for some products (e.g., mining, forestry, fishing, and waste and scrap) is not available.
$12 $13$15
$19
$25$28
$26
$32
$54
2000 2001 2002 2003 2004 2005 2006 2007 2008
Estimated Growth in Exports from Oklahoma’s 1st Congressional District, 2000–08
Exports to China: 344% Exports to Rest of World: 55%
Oklahoma's 1st Congressional District: Exports to China ($ million)
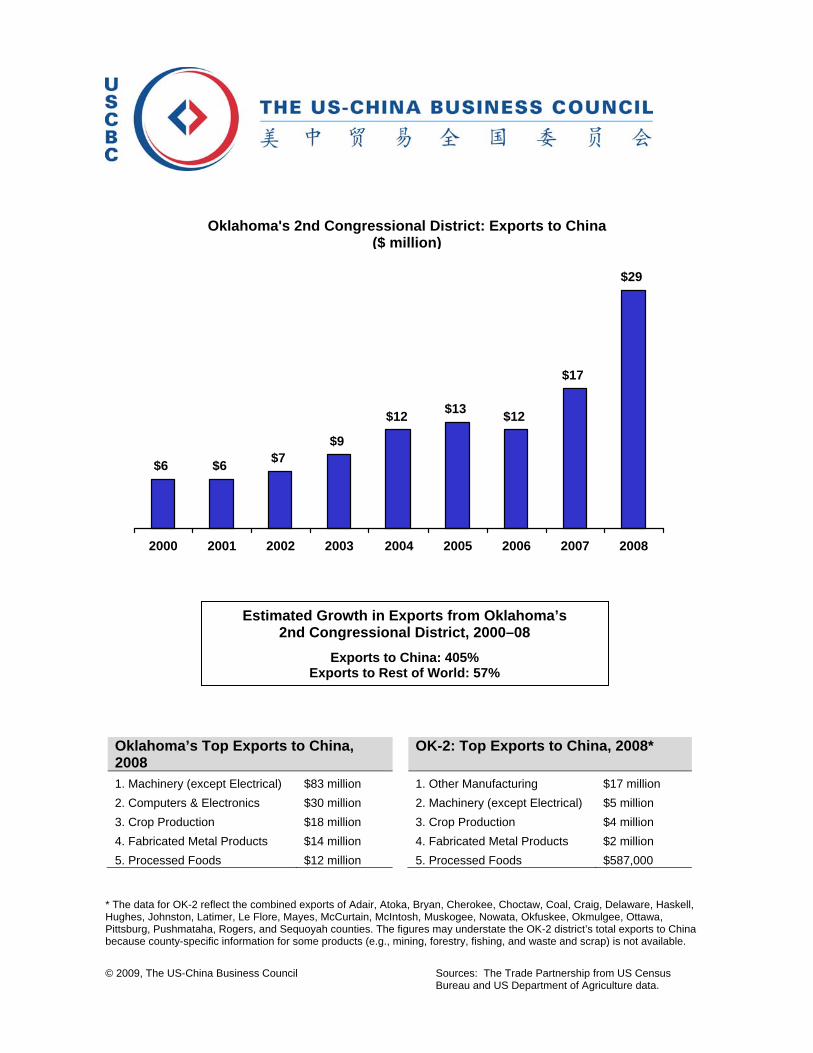
© 2009, The US-China Business Council
Sources: The Trade Partnership from US Census Bureau and US Department of Agriculture data.
Oklahoma’s Top Exports to China, 2008
OK-2: Top Exports to China, 2008*
1. Machinery (except Electrical) $83 million 1. Other Manufacturing $17 million
2. Computers & Electronics $30 million 2. Machinery (except Electrical) $5 million
3. Crop Production $18 million 3. Crop Production $4 million
4. Fabricated Metal Products $14 million 4. Fabricated Metal Products $2 million
5. Processed Foods $12 million 5. Processed Foods $587,000 * The data for OK-2 reflect the combined exports of Adair, Atoka, Bryan, Cherokee, Choctaw, Coal, Craig, Delaware, Haskell, Hughes, Johnston, Latimer, Le Flore, Mayes, McCurtain, McIntosh, Muskogee, Nowata, Okfuskee, Okmulgee, Ottawa, Pittsburg, Pushmataha, Rogers, and Sequoyah counties. The figures may understate the OK-2 district’s total exports to China because county-specific information for some products (e.g., mining, forestry, fishing, and waste and scrap) is not available.
$6 $6 $7$9
$12 $13 $12
$17
$29
2000 2001 2002 2003 2004 2005 2006 2007 2008
Estimated Growth in Exports from Oklahoma’s 2nd Congressional District, 2000–08
Exports to China: 405% Exports to Rest of World: 57%
Oklahoma's 2nd Congressional District: Exports to China ($ million)

© 2009, The US-China Business Council
Sources: The Trade Partnership from US Census Bureau and US Department of Agriculture data.
Oklahoma’s Top Exports to China, 2008
OK-3: Top Exports to China, 2008*
1. Machinery (except Electrical) $83 million 1. Other Manufacturing $23 million
2. Computers & Electronics $30 million 2. Crop Production $10 million
3. Crop Production $18 million 3. Machinery (except Electrical) $2 million
4. Fabricated Metal Products $14 million 4. Fabricated Metal Products $2 million
5. Processed Foods $12 million 5. Nonmetallic Mineral Products $121,000 * The data for OK-3 reflect the combined exports of Alfalfa, Beaver, Beckham, Blaine, Caddo, Canadian, Cimarron, Creek, Custer, Dewey, Ellis, Garfield, Grant, Greer, Harmon, Harper, Jackson, Kay, Kingfisher, Kiowa, Lincoln, Logan, Major, Noble, Osage, Pawnee, Payne, Roger Mills, Texas, Washita, Woods, and Woodward counties. The figures may understate the OK-3 district’s total exports to China because county-specific information for some products (e.g., mining, forestry, fishing, and waste and scrap) is not available.
$6 $6 $7$10
$13 $14 $13
$23
$37
2000 2001 2002 2003 2004 2005 2006 2007 2008
Estimated Growth in Exports from Oklahoma’s 3rd Congressional District, 2000–08
Exports to China: 503% Exports to Rest of World: 61%
Oklahoma's 3rd Congressional District: Exports to China ($ million)

© 2009, The US-China Business Council
Sources: The Trade Partnership from US Census Bureau and US Department of Agriculture data.
Oklahoma’s Top Exports to China, 2008
OK-4: Top Exports to China, 2008*
1. Machinery (except Electrical) $83 million 1. Other Manufacturing $41 million
2. Computers & Electronics $30 million 2. Machinery (except Electrical) $12 million
3. Crop Production $18 million 3. Fabricated Metal Products $4 million
4. Fabricated Metal Products $14 million 4. Crop Production $3 million
5. Processed Foods $12 million 5. Miscellaneous Manufacturing $824,000 * The data for OK-4 reflect the combined exports of Canadian, Carter, Cleveland, Comanche, Cotton, Garvin, Grady, Jefferson, Love, Marshall, McClain, Murray, Oklahoma, Pontotoc, Stephens, and Tillman counties. The figures may understate the OK-4 district’s total exports to China because county-specific information for some products (e.g., mining, forestry, fishing, and waste and scrap) is not available.
$14 $14$16
$21
$28$31 $29
$37
$62
2000 2001 2002 2003 2004 2005 2006 2007 2008
Estimated Growth in Exports from Oklahoma’s 4th Congressional District, 2000–08
Exports to China: 356% Exports to Rest of World: 55%
Oklahoma's 4th Congressional District: Exports to China ($ million)
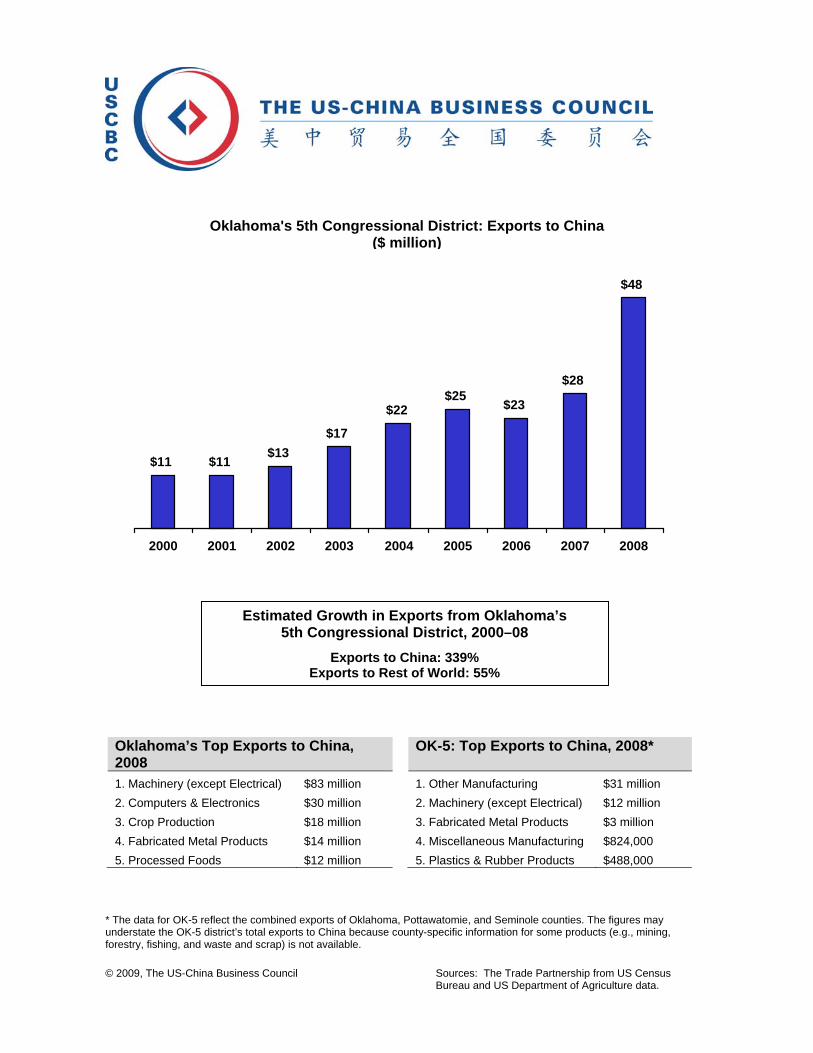
© 2009, The US-China Business Council
Sources: The Trade Partnership from US Census Bureau and US Department of Agriculture data.
Oklahoma’s Top Exports to China, 2008
OK-5: Top Exports to China, 2008*
1. Machinery (except Electrical) $83 million 1. Other Manufacturing $31 million
2. Computers & Electronics $30 million 2. Machinery (except Electrical) $12 million
3. Crop Production $18 million 3. Fabricated Metal Products $3 million
4. Fabricated Metal Products $14 million 4. Miscellaneous Manufacturing $824,000
5. Processed Foods $12 million 5. Plastics & Rubber Products $488,000 * The data for OK-5 reflect the combined exports of Oklahoma, Pottawatomie, and Seminole counties. The figures may understate the OK-5 district’s total exports to China because county-specific information for some products (e.g., mining, forestry, fishing, and waste and scrap) is not available.
$11 $11$13
$17
$22$25
$23
$28
$48
2000 2001 2002 2003 2004 2005 2006 2007 2008
Estimated Growth in Exports from Oklahoma’s 5th Congressional District, 2000–08
Exports to China: 339% Exports to Rest of World: 55%
Oklahoma's 5th Congressional District: Exports to China ($ million)

© 2009, The US-China Business Council
Sources: The Trade Partnership from US Census Bureau and US Department of Agriculture data.
Oregon’s Top Exports to China, 2008 OR-1: Top Exports to China, 2008* 1. Computers & Electronics $1.8 billion 1. Computers & Electronics $1.3 billion
2. Chemicals $161 million 2. Primary Metal Manufacturing $38 million
3. Waste & Scrap $111 million 3. Machinery (except Electrical) $33 million
4. Paper Products $83 million 4. Chemicals $24 million
5. Machinery (except Electrical) $73 million 5. Fabricated Metal Products $14 million * The data for OR-1 reflect the combined exports of Clatsop, Columbia, Multnomah, Washington, and Yamhill counties. The figures may understate the OR-1 district’s total exports to China because county-specific information for some products (e.g., mining, forestry, fishing, and waste and scrap) is not available.
$115$224
$351$259
$320$368
$782 $757
$1,473
2000 2001 2002 2003 2004 2005 2006 2007 2008
Estimated Growth in Exports from Oregon’s 1st Congressional District, 2000–08
Exports to China: 1,176% Exports to Rest of World: 37%
Oregon's 1st Congressional District: Exports to China ($ million)

© 2009, The US-China Business Council
Sources: The Trade Partnership from US Census Bureau and US Department of Agriculture data.
Oregon’s Top Exports to China, 2008 OR-2: Top Exports to China, 2008* 1. Computers & Electronics $1.8 billion 1. Other Manufacturing $208 million
2. Chemicals $161 million 2. Crop Production $9 million
3. Waste & Scrap $111 million 3. Wood Products $6 million
4. Paper Products $83 million 4. Transportation Equipment $340,000
5. Machinery (except Electrical) $73 million * The data for OR-2 reflect the combined exports of Baker, Crook, Deschutes, Gilliam, Grant, Harney, Hood River, Jackson, Jefferson, Josephine, Klamath, Lake, Malheur, Morrow, Sherman, Umatilla, Union, Wallowa, Wasco, and Wheeler counties. The figures may understate the OR-2 district’s total exports to China because county-specific information for some products (e.g., mining, forestry, fishing, and waste and scrap) is not available.
$31$44
$67$57
$109
$85
$128$141
$223
2000 2001 2002 2003 2004 2005 2006 2007 2008
Estimated Growth in Exports from Oregon’s 2nd Congressional District, 2000–08
Exports to China: 630% Exports to Rest of World: 71%
Oregon's 2nd Congressional District: Exports to China ($ million)

© 2009, The US-China Business Council
Sources: The Trade Partnership from US Census Bureau and US Department of Agriculture data.
Oregon’s Top Exports to China, 2008 OR-3: Top Exports to China, 2008* 1. Computers & Electronics $1.8 billion 1. Other Manufacturing $454 million
2. Chemicals $161 million 2. Primary Metal Manufacturing $45 million
3. Waste & Scrap $111 million 3. Machinery (except Electrical) $26 million
4. Paper Products $83 million 4. Chemicals $24 million
5. Machinery (except Electrical) $73 million 5. Paper Products $16 million * The data for OR-3 reflect the combined exports of Clackamas and Multnomah counties. The figures may understate the OR-3 district’s total exports to China because county-specific information for some products (e.g., mining, forestry, fishing, and waste and scrap) is not available.
$66$105
$159$125
$167 $182
$329 $329
$590
2000 2001 2002 2003 2004 2005 2006 2007 2008
Estimated Growth in Exports from Oregon’s 3rd Congressional District, 2000–08
Exports to China: 792% Exports to Rest of World: 45%
Oregon's 3rd Congressional District: Exports to China ($ million)
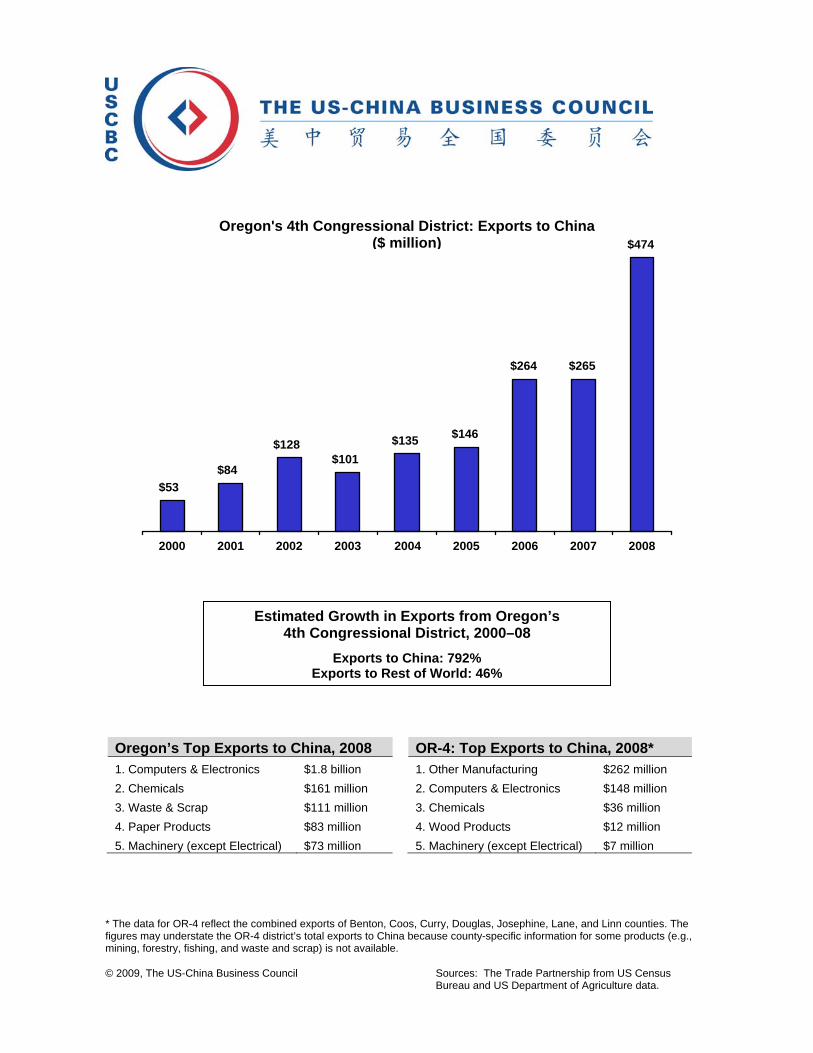
© 2009, The US-China Business Council
Sources: The Trade Partnership from US Census Bureau and US Department of Agriculture data.
Oregon’s Top Exports to China, 2008 OR-4: Top Exports to China, 2008* 1. Computers & Electronics $1.8 billion 1. Other Manufacturing $262 million
2. Chemicals $161 million 2. Computers & Electronics $148 million
3. Waste & Scrap $111 million 3. Chemicals $36 million
4. Paper Products $83 million 4. Wood Products $12 million
5. Machinery (except Electrical) $73 million 5. Machinery (except Electrical) $7 million * The data for OR-4 reflect the combined exports of Benton, Coos, Curry, Douglas, Josephine, Lane, and Linn counties. The figures may understate the OR-4 district’s total exports to China because county-specific information for some products (e.g., mining, forestry, fishing, and waste and scrap) is not available.
$53$84
$128$101
$135 $146
$264 $265
$474
2000 2001 2002 2003 2004 2005 2006 2007 2008
Estimated Growth in Exports from Oregon’s 4th Congressional District, 2000–08
Exports to China: 792% Exports to Rest of World: 46%
Oregon's 4th Congressional District: Exports to China ($ million)

© 2009, The US-China Business Council
Sources: The Trade Partnership from US Census Bureau and US Department of Agriculture data.
Oregon’s Top Exports to China, 2008 OR-5: Top Exports to China, 2008* 1. Computers & Electronics $1.8 billion 1. Other Manufacturing $600 million
2. Chemicals $161 million 2. Computers & Electronics $50 million
3. Waste & Scrap $111 million 3. Primary Metal Manufacturing $45 million
4. Paper Products $83 million 4. Machinery (except Electrical) $26 million
5. Machinery (except Electrical) $73 million 5. Chemicals $24 million * The data for OR-5 reflect the combined exports of Benton, Clackamas, Lincoln, Marion, Multnomah, Polk, and Tillamook counties. The figures may understate the OR-5 district’s total exports to China because county-specific information for some products (e.g., mining, forestry, fishing, and waste and scrap) is not available.
$93$144
$219$175
$255 $256
$446 $455
$796
2000 2001 2002 2003 2004 2005 2006 2007 2008
Estimated Growth in Exports from Oregon’s 5th Congressional District, 2000–08
Exports to China: 758% Exports to Rest of World: 51%
Oregon's 5th Congressional District: Exports to China ($ million)

© 2009, The US-China Business Council
Sources: The Trade Partnership from US Census Bureau and US Department of Agriculture data.
Pennsylvania’s Top Exports to China, 2008
PA-1: Top Exports to China, 2008*
1. Machinery (except Electrical) $370 million 1. Other Manufacturing $122 million
2. Primary Metal Manufacturing $328 million 2. Transportation Equipment $15 million
3. Chemicals $215 million 3. Electrical Equipment $12 million
4. Computers & Electronics $193 million 4. Machinery (except Electrical) $10 million
5. Electrical Equipment $119 million 5. Chemicals $7 million * The data for PA-1 reflect the combined exports of Delaware and Philadelphia counties. The figures may understate the PA-1 district’s total exports to China because county-specific information for some products (e.g., mining, forestry, fishing, and waste and scrap) is not available.
$31 $34$46
$61
$86$100
$133 $133
$176
2000 2001 2002 2003 2004 2005 2006 2007 2008
Estimated Growth in Exports from Pennsylvania’s 1st Congressional District, 2000–08
Exports to China: 478% Exports to Rest of World: 70%
Pennsylvania's 1st Congressional District: Exports to China ($ million)

© 2009, The US-China Business Council
Sources: The Trade Partnership from US Census Bureau and US Department of Agriculture data.
Pennsylvania’s Top Exports to China, 2008
PA-2: Top Exports to China, 2008*
1. Machinery (except Electrical) $370 million 1. Other Manufacturing $207 million
2. Primary Metal Manufacturing $328 million 2. Machinery (except Electrical) $26 million
3. Chemicals $215 million 3. Electrical Equipment $19 million
4. Computers & Electronics $193 million 4. Computers & Electronics $17 million
5. Electrical Equipment $119 million 5. Transportation Equipment $12 million * The data for PA-2 reflect the combined exports of Montgomery and Philadelphia counties. The figures may understate the PA-2 district’s total exports to China because county-specific information for some products (e.g., mining, forestry, fishing, and waste and scrap) is not available.
$55 $61$83
$111
$154$180
$240 $239
$318
2000 2001 2002 2003 2004 2005 2006 2007 2008
Estimated Growth in Exports from Pennsylvania’s 2nd Congressional District, 2000–08
Exports to China: 477% Exports to Rest of World: 72%
Pennsylvania's 2nd Congressional District: Exports to China ($ million)

© 2009, The US-China Business Council
Sources: The Trade Partnership from US Census Bureau and US Department of Agriculture data.
Pennsylvania’s Top Exports to China, 2008
PA-3: Top Exports to China, 2008*
1. Machinery (except Electrical) $370 million 1. Primary Metal Manufacturing $51 million
2. Primary Metal Manufacturing $328 million 2. Machinery (except Electrical) $44 million
3. Chemicals $215 million 3. Computers & Electronics $9 million
4. Computers & Electronics $193 million 4. Fabricated Metal Products $9 million
5. Electrical Equipment $119 million 5. Plastics & Rubber Products $3 million * The data for PA-3 reflect the combined exports of Armstrong, Butler, Crawford, Erie, Mercer, Venango, and Warren counties. The figures may understate the PA-3 district’s total exports to China because county-specific information for some products (e.g., mining, forestry, fishing, and waste and scrap) is not available.
$21 $24$32
$43
$59$69
$93 $92
$123
2000 2001 2002 2003 2004 2005 2006 2007 2008
Estimated Growth in Exports from Pennsylvania’s 3rd Congressional District, 2000–08
Exports to China: 476% Exports to Rest of World: 72%
Pennsylvania's 3rd Congressional District: Exports to China ($ million)
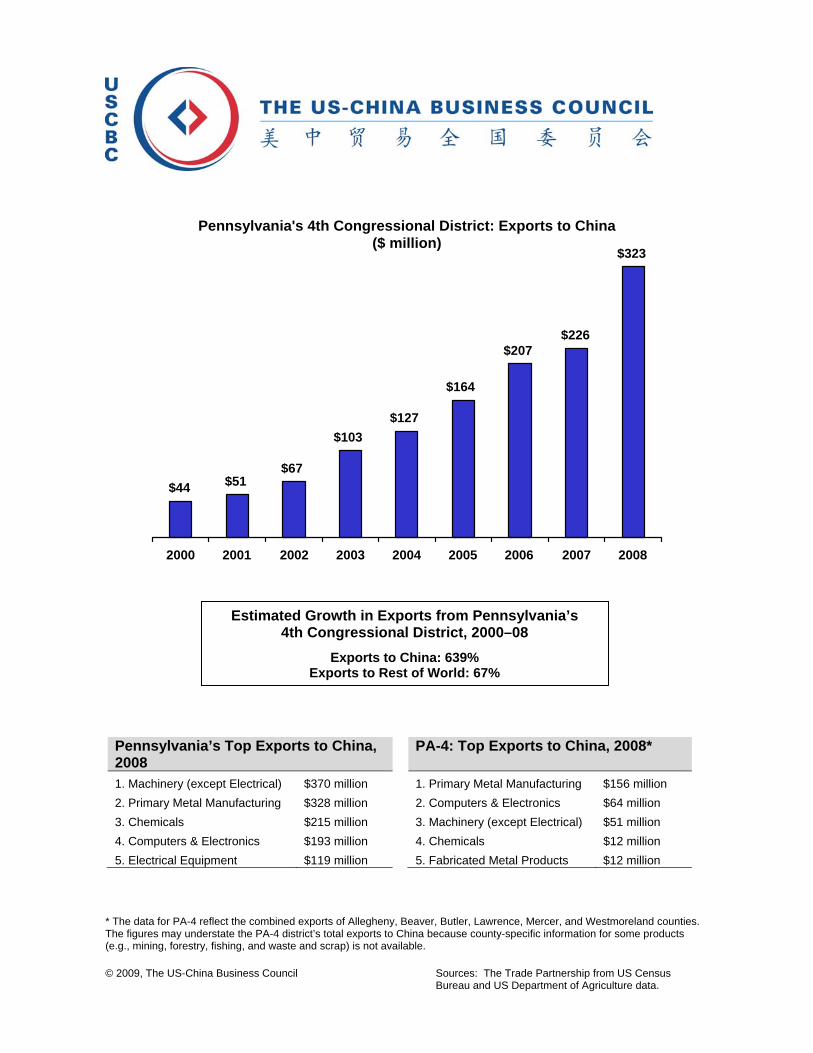
© 2009, The US-China Business Council
Sources: The Trade Partnership from US Census Bureau and US Department of Agriculture data.
Pennsylvania’s Top Exports to China, 2008
PA-4: Top Exports to China, 2008*
1. Machinery (except Electrical) $370 million 1. Primary Metal Manufacturing $156 million
2. Primary Metal Manufacturing $328 million 2. Computers & Electronics $64 million
3. Chemicals $215 million 3. Machinery (except Electrical) $51 million
4. Computers & Electronics $193 million 4. Chemicals $12 million
5. Electrical Equipment $119 million 5. Fabricated Metal Products $12 million * The data for PA-4 reflect the combined exports of Allegheny, Beaver, Butler, Lawrence, Mercer, and Westmoreland counties. The figures may understate the PA-4 district’s total exports to China because county-specific information for some products (e.g., mining, forestry, fishing, and waste and scrap) is not available.
$44 $51$67
$103$127
$164
$207$226
$323
2000 2001 2002 2003 2004 2005 2006 2007 2008
Estimated Growth in Exports from Pennsylvania’s 4th Congressional District, 2000–08
Exports to China: 639% Exports to Rest of World: 67%
Pennsylvania's 4th Congressional District: Exports to China ($ million)

© 2009, The US-China Business Council
Sources: The Trade Partnership from US Census Bureau and US Department of Agriculture data.
Pennsylvania’s Top Exports to China, 2008
PA-5: Top Exports to China, 2008*
1. Machinery (except Electrical) $370 million 1. Other Manufacturing $47 million
2. Primary Metal Manufacturing $328 million 2. Machinery (except Electrical) $26 million
3. Chemicals $215 million 3. Computers & Electronics $11 million
4. Computers & Electronics $193 million 4. Primary Metal Manufacturing $10 million
5. Electrical Equipment $119 million 5. Electrical Equipment $9 million * The data for PA-5 reflect the combined exports of Cameron, Centre, Clarion, Clearfield, Clinton, Crawford, Elk, Forest, Jefferson, Juniata, Lycoming, McKean, Mifflin, Potter, Tioga, Venango, and Warren counties. The figures may understate the PA-5 district’s total exports to China because county-specific information for some products (e.g., mining, forestry, fishing, and waste and scrap) is not available.
$20 $23$31
$41
$56$66
$88 $88
$116
2000 2001 2002 2003 2004 2005 2006 2007 2008
Estimated Growth in Exports from Pennsylvania’s 5th Congressional District, 2000–08
Exports to China: 476% Exports to Rest of World: 72%
Pennsylvania's 5th Congressional District: Exports to China ($ million)

© 2009, The US-China Business Council
Sources: The Trade Partnership from US Census Bureau and US Department of Agriculture data.
Pennsylvania’s Top Exports to China, 2008
PA-6: Top Exports to China, 2008*
1. Machinery (except Electrical) $370 million 1. Other Manufacturing $181 million
2. Primary Metal Manufacturing $328 million 2. Primary Metal Manufacturing $57 million
3. Chemicals $215 million 3. Machinery (except Electrical) $40 million
4. Computers & Electronics $193 million 4. Computers & Electronics $29 million
5. Electrical Equipment $119 million 5. Electrical Equipment $20 million * The data for PA-6 reflect the combined exports of Berks, Chester, Lehigh, and Montgomery counties. The figures may understate the PA-6 district’s total exports to China because county-specific information for some products (e.g., mining, forestry, fishing, and waste and scrap) is not available.
$64 $71$96
$129
$178
$208
$278 $277
$368
2000 2001 2002 2003 2004 2005 2006 2007 2008
Estimated Growth in Exports from Pennsylvania’s 6th Congressional District, 2000–08
Exports to China: 476% Exports to Rest of World: 72%
Pennsylvania's 6th Congressional District: Exports to China ($ million)

© 2009, The US-China Business Council
Sources: The Trade Partnership from US Census Bureau and US Department of Agriculture data.
Pennsylvania’s Top Exports to China, 2008
PA-7: Top Exports to China, 2008*
1. Machinery (except Electrical) $370 million 1. Other Manufacturing $216 million
2. Primary Metal Manufacturing $328 million 2. Machinery (except Electrical) $38 million
3. Chemicals $215 million 3. Primary Metal Manufacturing $21 million
4. Computers & Electronics $193 million 4. Transportation Equipment $19 million
5. Electrical Equipment $119 million 5. Computers & Electronics $17 million * The data for PA-7 reflect the combined exports of Chester, Delaware, and Montgomery counties. The figures may understate the PA-7 district’s total exports to China because county-specific information for some products (e.g., mining, forestry, fishing, and waste and scrap) is not available.
$59 $65$88
$118
$165$191
$256 $255
$339
2000 2001 2002 2003 2004 2005 2006 2007 2008
Estimated Growth in Exports from Pennsylvania’s 7th Congressional District, 2000–08
Exports to China: 476% Exports to Rest of World: 71%
Pennsylvania's 7th Congressional District: Exports to China ($ million)

© 2009, The US-China Business Council
Sources: The Trade Partnership from US Census Bureau and US Department of Agriculture data.
Pennsylvania’s Top Exports to China, 2008
PA-8: Top Exports to China, 2008*
1. Machinery (except Electrical) $370 million 1. Other Manufacturing $233 million
2. Primary Metal Manufacturing $328 million 2. Machinery (except Electrical) $44 million
3. Chemicals $215 million 3. Computers & Electronics $28 million
4. Computers & Electronics $193 million 4. Chemicals $26 million
5. Electrical Equipment $119 million 5. Electrical Equipment $19 million * The data for PA-8 reflect the combined exports of Bucks, Montgomery, and Philadelphia counties. The figures may understate the PA-8 district’s total exports to China because county-specific information for some products (e.g., mining, forestry, fishing, and waste and scrap) is not available.
$69 $77$104
$139
$193$226
$302 $300
$399
2000 2001 2002 2003 2004 2005 2006 2007 2008
Estimated Growth in Exports from Pennsylvania’s 8th Congressional District, 2000–08
Exports to China: 477% Exports to Rest of World: 72%
Pennsylvania's 8th Congressional District: Exports to China ($ million)

© 2009, The US-China Business Council
Sources: The Trade Partnership from US Census Bureau and US Department of Agriculture data.
Pennsylvania’s Top Exports to China, 2008
PA-9: Top Exports to China, 2008*
1. Machinery (except Electrical) $370 million 1. Machinery (except Electrical) $45 million
2. Primary Metal Manufacturing $328 million 2. Computers & Electronics $41 million
3. Chemicals $215 million 3. Primary Metal Manufacturing $19 million
4. Computers & Electronics $193 million 4. Other Manufacturing $15 million
5. Electrical Equipment $119 million 5. Electrical Equipment $9 million * The data for PA-9 reflect the combined exports of Bedford, Blair, Cambria, Clearfield, Cumberland, Fayette, Franklin, Fulton, Huntington, Indiana, Juniata, Mifflin, Perry, Somerset, and Westmoreland counties. The figures may understate the PA-9 district’s total exports to China because county-specific information for some products (e.g., mining, forestry, fishing, and waste and scrap) is not available.
$25 $28$38
$52
$70$82
$110 $109
$145
2000 2001 2002 2003 2004 2005 2006 2007 2008
Estimated Growth in Exports from Pennsylvania’s 9th Congressional District, 2000–08
Exports to China: 476% Exports to Rest of World: 72%
Pennsylvania's 9th Congressional District: Exports to China ($ million)

© 2009, The US-China Business Council
Sources: The Trade Partnership from US Census Bureau and US Department of Agriculture data.
Pennsylvania’s Top Exports to China, 2008
PA-10: Top Exports to China, 2008*
1. Machinery (except Electrical) $370 million 1. Other Manufacturing $70 million
2. Primary Metal Manufacturing $328 million 2. Primary Metal Manufacturing $7 million
3. Chemicals $215 million 3. Machinery (except Electrical) $4 million
4. Computers & Electronics $193 million 4. Computers & Electronics $4 million
5. Electrical Equipment $119 million 5. Wood Products $3 million * The data for PA-10 reflect the combined exports of Bradford, Lackawanna, Luzerne, Lycoming, Montour, Northumberland, Pike, Snyder, Sullivan, Susquehanna, Tioga, Union, Wayne, and Wyoming counties. The figures may understate the PA-10 district’s total exports to China because county-specific information for some products (e.g., mining, forestry, fishing, and waste and scrap) is not available.
$17 $19$26
$35
$47$55
$74 $73
$97
2000 2001 2002 2003 2004 2005 2006 2007 2008
Estimated Growth in Exports from Pennsylvania’s 10th Congressional District, 2000–08
Exports to China: 476% Exports to Rest of World: 72%
Pennsylvania's 10th Congressional District: Exports to China ($ million)

© 2009, The US-China Business Council
Sources: The Trade Partnership from US Census Bureau and US Department of Agriculture data.
Pennsylvania’s Top Exports to China, 2008
PA-11: Top Exports to China, 2008*
1. Machinery (except Electrical) $370 million 1. Other Manufacturing $48 million
2. Primary Metal Manufacturing $328 million 2. Plastics & Rubber Products $2 million
3. Chemicals $215 million 3. Fabricated Metal Products $2 million
4. Computers & Electronics $193 million 4. Chemicals $2 million
5. Electrical Equipment $119 million 5. Wood Products $529,000 * The data for PA-11 reflect the combined exports of Carbon, Columbia, Lackawanna, Luzerne, and Monroe counties .The figures may understate the PA-11 district’s total exports to China because county-specific information for some products (e.g., mining, forestry, fishing, and waste and scrap) is not available. Figures are rounded.
$9 $10$14
$19
$26
$31
$41 $41
$54
2000 2001 2002 2003 2004 2005 2006 2007 2008
Estimated Growth in Exports from Pennsylvania’s 11th Congressional District, 2000–08
Exports to China: 476% Exports to Rest of World: 72%
Pennsylvania's 11th Congressional District: Exports to China ($ million)
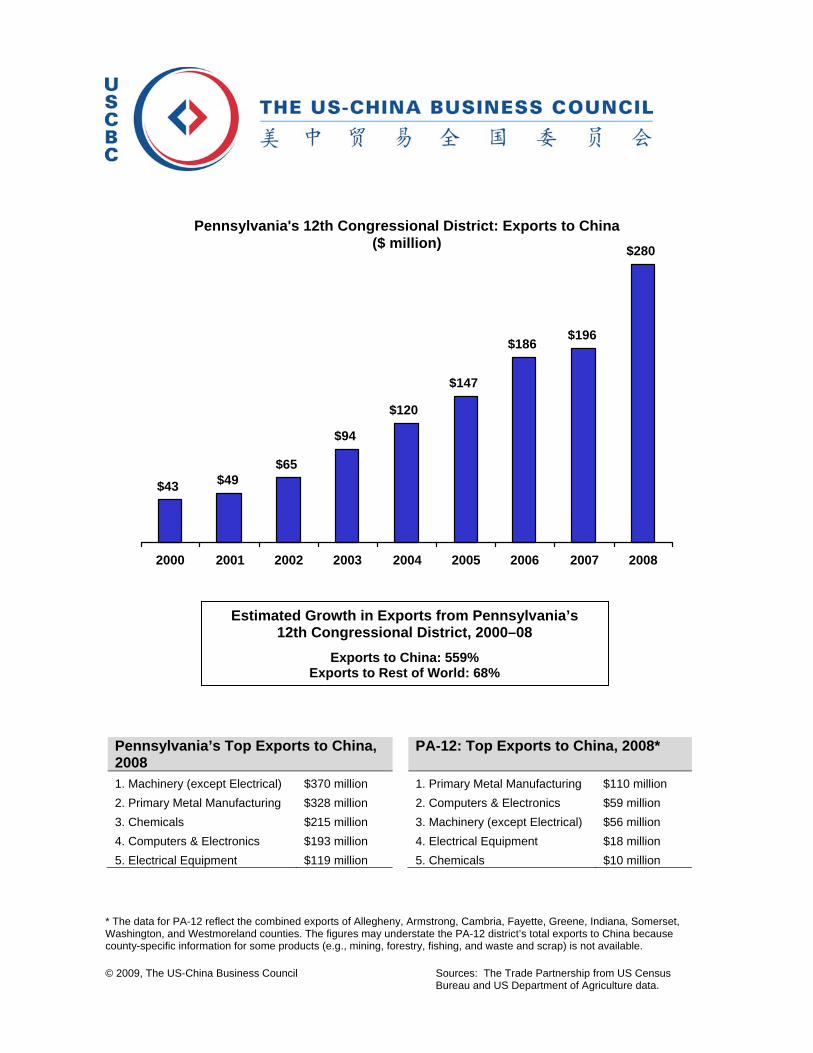
© 2009, The US-China Business Council
Sources: The Trade Partnership from US Census Bureau and US Department of Agriculture data.
Pennsylvania’s Top Exports to China, 2008
PA-12: Top Exports to China, 2008*
1. Machinery (except Electrical) $370 million 1. Primary Metal Manufacturing $110 million
2. Primary Metal Manufacturing $328 million 2. Computers & Electronics $59 million
3. Chemicals $215 million 3. Machinery (except Electrical) $56 million
4. Computers & Electronics $193 million 4. Electrical Equipment $18 million
5. Electrical Equipment $119 million 5. Chemicals $10 million * The data for PA-12 reflect the combined exports of Allegheny, Armstrong, Cambria, Fayette, Greene, Indiana, Somerset, Washington, and Westmoreland counties. The figures may understate the PA-12 district’s total exports to China because county-specific information for some products (e.g., mining, forestry, fishing, and waste and scrap) is not available.
$43 $49$65
$94
$120
$147
$186$196
$280
2000 2001 2002 2003 2004 2005 2006 2007 2008
Estimated Growth in Exports from Pennsylvania’s 12th Congressional District, 2000–08
Exports to China: 559% Exports to Rest of World: 68%
Pennsylvania's 12th Congressional District: Exports to China ($ million)

© 2009, The US-China Business Council
Sources: The Trade Partnership from US Census Bureau and US Department of Agriculture data.
Pennsylvania’s Top Exports to China, 2008
PA-13: Top Exports to China, 2008*
1. Machinery (except Electrical) $370 million 1. Other Manufacturing $207 million
2. Primary Metal Manufacturing $328 million 2. Machinery (except Electrical) $26 million
3. Chemicals $215 million 3. Electrical Equipment $19 million
4. Computers & Electronics $193 million 4. Computers & Electronics $17 million
5. Electrical Equipment $119 million 5. Transportation Equipment $12 million * The data for PA-13 reflect the combined exports of Montgomery and Philadelphia counties. The figures may understate the PA-13 district’s total exports to China because county-specific information for some products (e.g., mining, forestry, fishing, and waste and scrap) is not available.
$55 $61$83
$111
$154$180
$240 $239
$318
2000 2001 2002 2003 2004 2005 2006 2007 2008
Estimated Growth in Exports from Pennsylvania’s 13th Congressional District, 2000–08
Exports to China: 477% Exports to Rest of World: 72%
Pennsylvania's 13th Congressional District: Exports to China ($ million)

© 2009, The US-China Business Council
Sources: The Trade Partnership from US Census Bureau and US Department of Agriculture data.
Pennsylvania’s Top Exports to China, 2008
PA-14: Top Exports to China, 2008*
1. Machinery (except Electrical) $370 million 1. Primary Metal Manufacturing $73 million
2. Primary Metal Manufacturing $328 million 2. Machinery (except Electrical) $24 million
3. Chemicals $215 million 3. Computers & Electronics $20 million
4. Computers & Electronics $193 million 4. Transportation Equipment $8 million
5. Electrical Equipment $119 million 5. Chemicals $7 million * The data for PA-14 reflect the exports of Allegheny County, which also includes other congressional districts. The figures may understate the PA-14 district’s total exports to China because county-specific information for some products (e.g., mining, forestry, fishing, and waste and scrap) is not available.
$17 $19$27
$43$53
$70
$95 $98
$142
2000 2001 2002 2003 2004 2005 2006 2007 2008
Estimated Growth in Exports from Pennsylvania’s 14th Congressional District, 2000–08
Exports to China: 747% Exports to Rest of World: 66%
Pennsylvania's 14th Congressional District: Exports to China ($ million)
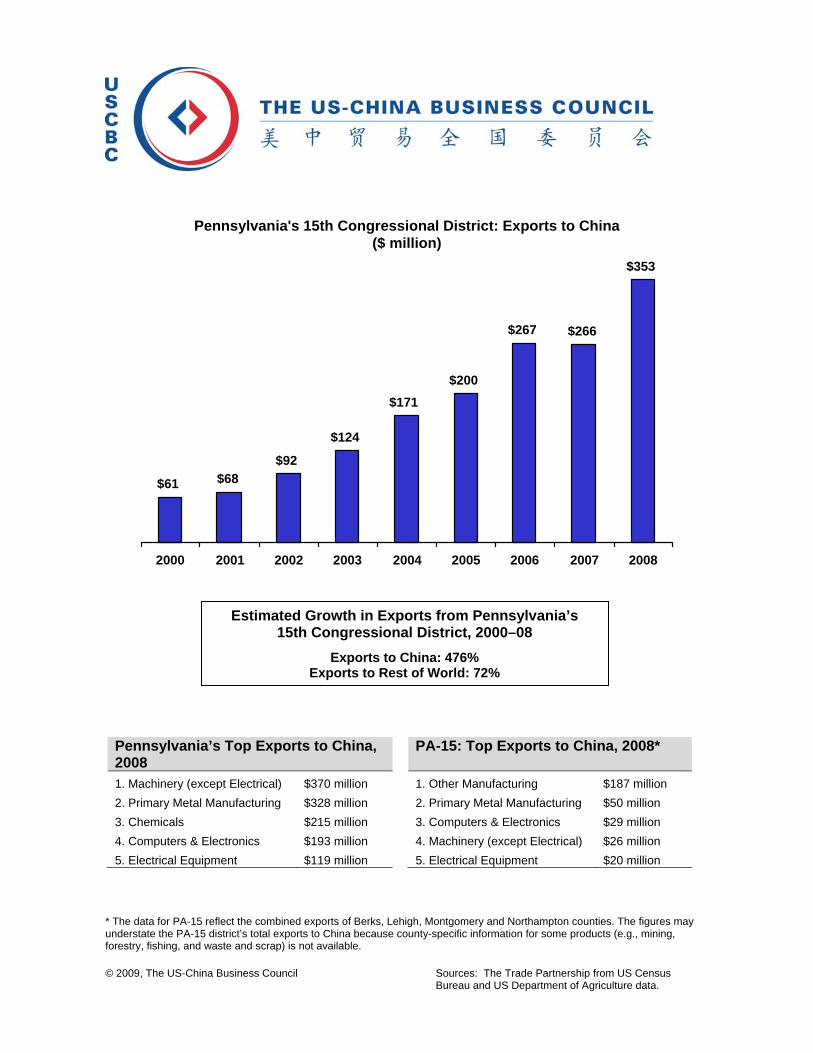
© 2009, The US-China Business Council
Sources: The Trade Partnership from US Census Bureau and US Department of Agriculture data.
Pennsylvania’s Top Exports to China, 2008
PA-15: Top Exports to China, 2008*
1. Machinery (except Electrical) $370 million 1. Other Manufacturing $187 million
2. Primary Metal Manufacturing $328 million 2. Primary Metal Manufacturing $50 million
3. Chemicals $215 million 3. Computers & Electronics $29 million
4. Computers & Electronics $193 million 4. Machinery (except Electrical) $26 million
5. Electrical Equipment $119 million 5. Electrical Equipment $20 million * The data for PA-15 reflect the combined exports of Berks, Lehigh, Montgomery and Northampton counties. The figures may understate the PA-15 district’s total exports to China because county-specific information for some products (e.g., mining, forestry, fishing, and waste and scrap) is not available.
$61 $68$92
$124
$171$200
$267 $266
$353
2000 2001 2002 2003 2004 2005 2006 2007 2008
Estimated Growth in Exports from Pennsylvania’s 15th Congressional District, 2000–08
Exports to China: 476% Exports to Rest of World: 72%
Pennsylvania's 15th Congressional District: Exports to China ($ million)

© 2009, The US-China Business Council
Sources: The Trade Partnership from US Census Bureau and US Department of Agriculture data.
Pennsylvania’s Top Exports to China, 2008
PA-16: Top Exports to China, 2008*
1. Machinery (except Electrical) $370 million 1. Primary Metal Manufacturing $65 million
2. Primary Metal Manufacturing $328 million 2. Machinery (except Electrical) $43 million
3. Chemicals $215 million 3. Electrical Equipment $18 million
4. Computers & Electronics $193 million 4. Chemicals $16 million
5. Electrical Equipment $119 million 5. Other Manufacturing $14 million * The data for PA-16 reflect the combined exports of Berks, Chester, and Lancaster counties. The figures may understate the PA-16 district’s total exports to China because county-specific information for some products (e.g., mining, forestry, fishing, and waste and scrap) is not available.
$35 $39$53
$71
$97$113
$151 $150
$200
2000 2001 2002 2003 2004 2005 2006 2007 2008
Estimated Growth in Exports from Pennsylvania’s 16th Congressional District, 2000–08
Exports to China: 475% Exports to Rest of World: 72%
Pennsylvania's 16th Congressional District: Exports to China ($ million)

© 2009, The US-China Business Council
Sources: The Trade Partnership from US Census Bureau and US Department of Agriculture data.
Pennsylvania’s Top Exports to China, 2008
PA-17: Top Exports to China, 2008*
1. Machinery (except Electrical) $370 million 1. Primary Metal Manufacturing $38 million
2. Primary Metal Manufacturing $328 million 2. Other Manufacturing $30 million
3. Chemicals $215 million 3. Machinery (except Electrical) $14 million
4. Computers & Electronics $193 million 4. Electrical Equipment $13 million
5. Electrical Equipment $119 million 5. Chemicals $8 million * The data for PA-17 reflect the combined exports of Berks, Dauphin, Lebanon, Perry, and Schuylkill counties. The figures may understate the PA-17 district’s total exports to China because county-specific information for some products (e.g., mining, forestry, fishing, and waste and scrap) is not available.
$21 $23$32
$43
$58$68
$91 $90
$120
2000 2001 2002 2003 2004 2005 2006 2007 2008
Estimated Growth in Exports from Pennsylvania’s 17th Congressional District, 2000–08
Exports to China: 475% Exports to Rest of World: 72%
Pennsylvania's 17th Congressional District: Exports to China ($ million)

© 2009, The US-China Business Council
Sources: The Trade Partnership from US Census Bureau and US Department of Agriculture data.
Pennsylvania’s Top Exports to China, 2008
PA-18: Top Exports to China, 2008*
1. Machinery (except Electrical) $370 million 1. Primary Metal Manufacturing $124 million
2. Primary Metal Manufacturing $328 million 2. Computers & Electronics $59 million
3. Chemicals $215 million 3. Machinery (except Electrical) $50 million
4. Computers & Electronics $193 million 4. Electrical Equipment $18 million
5. Electrical Equipment $119 million 5. Chemicals $13 million * The data for PA-18 reflect the combined exports of Allegheny, Beaver, Washington, and Westmoreland counties. The figures may understate the PA-18 district’s total exports to China because county-specific information for some products (e.g., mining, forestry, fishing, and waste and scrap) is not available.
$42 $49$63
$94$119
$148
$188$202
$289
2000 2001 2002 2003 2004 2005 2006 2007 2008
Estimated Growth in Exports from Pennsylvania’s 18th Congressional District, 2000–08
Exports to China: 590% Exports to Rest of World: 67%
Pennsylvania's 18th Congressional District: Exports to China ($ million)

© 2009, The US-China Business Council
Sources: The Trade Partnership from US Census Bureau and US Department of Agriculture data.
Pennsylvania’s Top Exports to China, 2008
PA-19: Top Exports to China, 2008*
1. Machinery (except Electrical) $370 million 1. Machinery (except Electrical) $36 million
2. Primary Metal Manufacturing $328 million 2. Other Manufacturing $27 million
3. Chemicals $215 million 3. Transportation Equipment $17 million
4. Computers & Electronics $193 million 4. Primary Metal Manufacturing $6 million
5. Electrical Equipment $119 million 5. Electrical Equipment $4 million * The data for PA-19 reflect the combined exports of Adams, Cumberland, and York counties. The figures may understate the PA-19 district’s total exports to China because county-specific information for some products (e.g., mining, forestry, fishing, and waste and scrap) is not available.
$18 $20$27
$37
$50$59
$78 $78
$103
2000 2001 2002 2003 2004 2005 2006 2007 2008
Estimated Growth in Exports from Pennsylvania’s 19th Congressional District, 2000–08
Exports to China: 476% Exports to Rest of World: 72%
Pennsylvania's 19th Congressional District: Exports to China ($ million)

© 2009, The US-China Business Council
Sources: The Trade Partnership from US Census Bureau and US Department of Agriculture data.
Rhode Island’s Top Exports to China, 2008
RI-1: Top Exports to China, 2008*
1. Chemicals $16 million 1. Chemicals $11 million
2. Machinery (except Electrical) $10 million 2. Other Manufacturing $6 million
3. Seafood Products $8 million 3. Miscellaneous Manufacturing $5 million
4. Computers & Electronics $7 million 4. Machinery (except Electrical) $5 million
5. Miscellaneous Manufacturing $6 million 5. Electrical Equipment $2 million * The data for RI-1 reflect the combined exports of Bristol, Newport, and Providence counties. The figures may understate the RI-1 district’s total exports to China because county-specific information for some products (e.g., mining, forestry, fishing, and waste and scrap) is not available.
$10 $9$12
$16
$21
$17
$27$30
$34
2000 2001 2002 2003 2004 2005 2006 2007 2008
Estimated Growth in Exports from Rhode Island’s 1st Congressional District, 2000–08
Exports to China: 250% Exports to Rest of World: 33%
Rhode Island's 1st Congressional District: Exports to China ($ million)

© 2009, The US-China Business Council
Sources: The Trade Partnership from US Census Bureau and US Department of Agriculture data.
Rhode Island’s Top Exports to China, 2008
RI-2: Top Exports to China, 2008*
1. Chemicals $16 million 1. Chemicals $15 million
2. Machinery (except Electrical) $10 million 2. Other Manufacturing $12 million
3. Seafood Products $8 million 3. Machinery (except Electrical) $9 million
4. Computers & Electronics $7 million 4. Miscellaneous Manufacturing $6 million
5. Miscellaneous Manufacturing $6 million 5. Fabricated Metal Products $2 million * The data for RI-2 reflect the combined exports of Kent, Providence and Washington counties. The figures may understate the RI-2 district’s total exports to China because county-specific information for some products (e.g., mining, forestry, fishing, and waste and scrap) is not available.
$14 $13$17
$23
$30
$25
$39$43
$50
2000 2001 2002 2003 2004 2005 2006 2007 2008
Estimated Growth in Exports from Rhode Island’s 2nd Congressional District, 2000–08
Exports to China: 250% Exports to Rest of World: 33%
Rhode Island's 2nd Congressional District: Exports to China ($ million)

© 2009, The US-China Business Council
Sources: The Trade Partnership from US Census Bureau and US Department of Agriculture data.
South Carolina’s Top Exports to China, 2008
SC-1: Top Exports to China, 2008*
1. Waste & Scrap $145 million 1. Other Manufacturing $61 million
2. Chemicals $126 million 2. Fabricated Metal Products $3 million
3. Machinery (except Electrical) $114 million 3. Crop Production $2 million
4. Plastics & Rubber Products $65 million 4. Miscellaneous Manufacturing $519,000
5. Processed Foods $56 million * The data for SC-1 reflect the combined exports of Berkeley, Charleston, Dorchester, Georgetown, and Horry counties. The figures may understate the SC-1 district’s total exports to China because county-specific information for some products (e.g., mining, forestry, fishing, and waste and scrap) is not available.
$12$16
$23$28
$48
$62
$68
$51
$66
2000 2001 2002 2003 2004 2005 2006 2007 2008
Estimated Growth in Exports from South Carolina’s 1st Congressional District, 2000–08
Exports to China: 436% Exports to Rest of World: 126%
South Carolina's 1st Congressional District: Exports to China
($ million)

© 2009, The US-China Business Council
Sources: The Trade Partnership from US Census Bureau and US Department of Agriculture data.
South Carolina’s Top Exports to China, 2008
SC-2: Top Exports to China, 2008*
1. Waste & Scrap $145 million 1. Other Manufacturing $90 million
2. Chemicals $126 million 2. Processed Foods $7 million
3. Machinery (except Electrical) $114 million 3. Paper Products $6 million
4. Plastics & Rubber Products $65 million 4. Fabricated Metal Products $5 million
5. Processed Foods $56 million 5. Crop Production $3 million * The data for SC-2 reflect the combined exports of Aiken, Allendale, Barnwell, Beaufort, Calhoun, Hampton, Jasper, Lexington, Orangeburg, and Richland counties. The figures may understate the SC-2 district’s total exports to China because county-specific information for some products (e.g., mining, forestry, fishing, and waste and scrap) is not available.
$21$28
$39$47
$79
$102$109
$87
$113
2000 2001 2002 2003 2004 2005 2006 2007 2008
Estimated Growth in Exports from South Carolina’s 2nd Congressional District, 2000–08
Exports to China: 430% Exports to Rest of World: 126%
South Carolina's 2nd Congressional District: Exports to China
($ million)

© 2009, The US-China Business Council
Sources: The Trade Partnership from US Census Bureau and US Department of Agriculture data.
South Carolina’s Top Exports to China, 2008
SC-3: Top Exports to China, 2008*
1. Waste & Scrap $145 million 1. Other Manufacturing $84 million
2. Chemicals $126 million 2. Chemicals $18 million
3. Machinery (except Electrical) $114 million 3. Textiles & Fabrics $6 million
4. Plastics & Rubber Products $65 million 4. Fabricated Metal Products $4 million
5. Processed Foods $56 million 5. Machinery (except Electrical) $2 million * The data for SC-3 reflect the combined exports of Abbeville, Aiken, Anderson, Edgefield, Greenwood, Laurens, McCormick, Oconee, Pickens, and Saluda counties. The figures may understate the SC-3 district’s total exports to China because county-specific information for some products (e.g., mining, forestry, fishing, and waste and scrap) is not available.
$22$29
$41$48
$79
$101$107
$89
$115
2000 2001 2002 2003 2004 2005 2006 2007 2008
Estimated Growth in Exports from South Carolina’s 3rd Congressional District, 2000–08
Exports to China: 426% Exports to Rest of World: 127%
South Carolina's 3rd Congressional District: Exports to China
($ million)

© 2009, The US-China Business Council
Sources: The Trade Partnership from US Census Bureau and US Department of Agriculture data.
South Carolina’s Top Exports to China, 2008
SC-4: Top Exports to China, 2008*
1. Waste & Scrap $145 million 1. Machinery (except Electrical) $88 million
2. Chemicals $126 million 2. Other Manufacturing $54 million
3. Machinery (except Electrical) $114 million 3. Chemicals $26 million
4. Plastics & Rubber Products $65 million 4. Plastics & Rubber Products $25 million
5. Processed Foods $56 million 5. Fabricated Metal Products $6 million * The data for SC-4 reflect the combined exports of Greenville, Laurens, Spartanburg, and Union counties. The figures may understate the SC-4 district’s total exports to China because county-specific information for some products (e.g., mining, forestry, fishing, and waste and scrap) is not available.
$40$54
$75$87
$138
$175 $180
$160
$210
2000 2001 2002 2003 2004 2005 2006 2007 2008
Estimated Growth in Exports from South Carolina’s 4th Congressional District, 2000–08
Exports to China: 420% Exports to Rest of World: 127%
South Carolina's 4th Congressional District: Exports to China
($ million)

© 2009, The US-China Business Council
Sources: The Trade Partnership from US Census Bureau and US Department of Agriculture data.
South Carolina’s Top Exports to China, 2008
SC-5: Top Exports to China, 2008*
1. Waste & Scrap $145 million 1. Other Manufacturing $127 million
2. Chemicals $126 million 2. Chemicals $7 million
3. Machinery (except Electrical) $114 million 3. Fabricated Metal Products $7 million
4. Plastics & Rubber Products $65 million 4. Paper Products $4 million
5. Processed Foods $56 million 5. Computers & Electronics $3 million * The data for SC-5 reflect the combined exports of Cherokee, Chester, Chesterfield, Darlington, Dillon, Fairfield, Florence, Kershaw, Lancaster, Lee, Marlboro, Newberry, Sumter, and York counties. The figures may understate the SC-5 district’s total exports to China because county-specific information for some products (e.g., mining, forestry, fishing, and waste and scrap) is not available.
$30$40
$56$66
$110
$140$148
$122
$159
2000 2001 2002 2003 2004 2005 2006 2007 2008
Estimated Growth in Exports from South Carolina’s 5th Congressional District, 2000–08
Exports to China: 427% Exports to Rest of World: 127%
South Carolina's 5th Congressional District: Exports to China
($ million)

© 2009, The US-China Business Council
Sources: The Trade Partnership from US Census Bureau and US Department of Agriculture data.
South Carolina’s Top Exports to China, 2008
SC-6: Top Exports to China, 2008*
1. Waste & Scrap $145 million 1. Other Manufacturing $147 million
2. Chemicals $126 million 2. Fabricated Metal Products $8 million
3. Machinery (except Electrical) $114 million 3. Paper Products $6 million
4. Plastics & Rubber Products $65 million 4. Crop Production $5 million
5. Processed Foods $56 million 5. Processed Foods $2 million * The data for SC-6 reflect the combined exports of Bamberg, Berkeley, Calhoun, Charleston, Clarendon, Colleton, Dorchester, Florence, Georgetown, Lee, Marion, Orangeburg, Richland, Sumter, and Williamsburg counties. The figures may understate the SC-6 district’s total exports to China because county-specific information for some products (e.g., mining, forestry, fishing, and waste and scrap) is not available.
$32$43
$59$72
$124
$159$172
$133
$170
2000 2001 2002 2003 2004 2005 2006 2007 2008
Estimated Growth in Exports from South Carolina’s 6th Congressional District, 2000–08
Exports to China: 435% Exports to Rest of World: 126%
South Carolina's 6th Congressional District: Exports to China
($ million)

© 2009, The US-China Business Council Source: US Department of Commerce
South Dakota’s Top Exports to China, 2008* 1. Computers & Electronics $11 million
2. Processed Foods $8 million
3. Machinery (except Electrical) $3 million
4. Furniture & Related Products $3 million
5. Minerals & Ores $1 million
*The data for South Dakota’s at-large congressional district reflect the combined exports of the entire state.
South Dakota's At-Large Congressional District: Exports to China ($ million)
$7 $10 $10
$30$34
$96
$31 $33
$6
2000 2001 2002 2003 2004 2005 2006 2007 2008
Estimated Growth in Exports from South Dakota, 2000–08
Exports to China: 402% Exports to Rest of World: 140%

© 2009, The US-China Business Council
Sources: The Trade Partnership from US Census Bureau and US Department of Agriculture data.
Tennessee’s Top Exports to China, 2008
TN-1: Top Exports to China, 2008*
1. Chemicals $391 million 1. Chemicals $131 million
2. Crop Production $230 million 2. Crop Production $15 million
3. Waste & Scrap $134 million 3. Machinery (except Electrical) $4 million
4. Computers & Electronics $108 million 4. Fabricated Metal Products $2 million
5. Primary Metal Manufacturing $90 million 5. Wood Products $447,000 * The data for TN-1 reflect the combined exports of Carter, Cocke, Greene, Hamblen, Hancock, Hawkins, Jefferson, Johnson, Sevier, Sullivan, Unicoi, and Washington counties. The figures may understate the TN-1 district’s total exports to China because county-specific information for some products (e.g., mining, forestry, fishing, and waste and scrap) is not available.
$29 $29$42
$62
$114
$156
$176
$136
$154
2000 2001 2002 2003 2004 2005 2006 2007 2008
Estimated Growth in Exports from Tennessee’s 1st Congressional District, 2000–08
Exports to China: 432% Exports to Rest of World: 93%
Tennessee's 1st Congressional District: Exports to China ($ million)

© 2009, The US-China Business Council
Sources: The Trade Partnership from US Census Bureau and US Department of Agriculture data.
Tennessee’s Top Exports to China, 2008
TN-2: Top Exports to China, 2008*
1. Chemicals $391 million 1. Other Manufacturing $92 million
2. Crop Production $230 million 2. Crop Production $8 million
3. Waste & Scrap $134 million 3. Fabricated Metal Products $2 million
4. Computers & Electronics $108 million 4. Transportation Equipment $2 million
5. Primary Metal Manufacturing $90 million 5. Nonmetallic Mineral Products $2 million * The data for TN-2 reflect the combined exports of Blount, Knox, Loudon, McMinn, Monroe, and Sevier counties. The figures may understate the TN-2 district’s total exports to China because county-specific information for some products (e.g., mining, forestry, fishing, and waste and scrap) is not available.
$15 $17
$28$39
$67
$88
$116
$91
$107
2000 2001 2002 2003 2004 2005 2006 2007 2008
Estimated Growth in Exports from Tennessee’s 2nd Congressional District, 2000–08
Exports to China: 611% Exports to Rest of World: 94%
Tennessee's 2nd Congressional District: Exports to China ($ million)

© 2009, The US-China Business Council
Sources: The Trade Partnership from US Census Bureau and US Department of Agriculture data.
Tennessee’s Top Exports to China, 2008
TN-3: Top Exports to China, 2008*
1. Chemicals $391 million 1. Other Manufacturing $99 million
2. Crop Production $230 million 2. Electrical Equipment $9 million
3. Waste & Scrap $134 million 3. Crop Production $9 million
4. Computers & Electronics $108 million 4. Primary Metal Manufacturing $7 million
5. Primary Metal Manufacturing $90 million 5. Processed Foods $819,000 * The data for TN-3 reflect the combined exports of Anderson, Bradley, Claiborne, Grainger, Hamilton, Jefferson, Meigs, Polk, Rhea, Roane, and Union counties. The figures may understate the TN-3 district’s total exports to China because county-specific information for some products (e.g., mining, forestry, fishing, and waste and scrap) is not available.
$18 $20
$33
$46
$77
$101
$135
$107
$127
2000 2001 2002 2003 2004 2005 2006 2007 2008
Estimated Growth in Exports from Tennessee’s 3rd Congressional District, 2000–08
Exports to China: 607% Exports to Rest of World: 94%
Tennessee's 3rd Congressional District: Exports to China ($ million)

© 2009, The US-China Business Council
Sources: The Trade Partnership from US Census Bureau and US Department of Agriculture data.
Tennessee’s Top Exports to China, 2008
TN-4: Top Exports to China, 2008*
1. Chemicals $391 million 1. Other Manufacturing $86 million
2. Crop Production $230 million 2. Crop Production $44 million
3. Waste & Scrap $134 million 3. Machinery (except Electrical) $3 million
4. Computers & Electronics $108 million 4. Nonmetallic Mineral Products $1 million
5. Primary Metal Manufacturing $90 million 5. Fabricated Metal Products $464,000 * The data for TN-4 reflect the combined exports of Bledsoe, Campbell, Coffee, Cumberland, Fentress, Franklin, Giles, Grundy, Hickman, Lawrence, Lewis, Lincoln, Marion, Maury, Moore, Morgan, Pickett, Roane, Scott, Sequatchie, Van Buren, Warren, White, and Williamson counties. The figures may understate the TN-4 district’s total exports to China because county-specific information for some products (e.g., mining, forestry, fishing, and waste and scrap) is not available.
$15 $17$37
$89
$188$202
$257
$102
$135
2000 2001 2002 2003 2004 2005 2006 2007 2008
Estimated Growth in Exports from Tennessee’s 4th Congressional District, 2000–08
Exports to China: 798% Exports to Rest of World: 91%
Tennessee's 4th Congressional District: Exports to China ($ million)

© 2009, The US-China Business Council
Sources: The Trade Partnership from US Census Bureau and US Department of Agriculture data.
Tennessee’s Top Exports to China, 2008
TN-5: Top Exports to China, 2008*
1. Chemicals $391 million 1. Other Manufacturing $126 million
2. Crop Production $230 million 2. Electrical Equipment $4 million
3. Waste & Scrap $134 million 3. Miscellaneous Manufacturing $4 million
4. Computers & Electronics $108 million 4. Crop Production $4 million
5. Primary Metal Manufacturing $90 million 5. Machinery (except Electrical) $4 million * The data for TN-5 reflect the combined exports of Cheatham, Davidson, and Wilson counties. The figures may understate the TN-5 district’s total exports to China because county-specific information for some products (e.g., mining, forestry, fishing, and waste and scrap) is not available.
$22 $25
$38$47
$71
$103
$140$129
$149
2000 2001 2002 2003 2004 2005 2006 2007 2008
Estimated Growth in Exports from Tennessee’s 5th Congressional District, 2000–08
Exports to China: 585% Exports to Rest of World: 98%
Tennessee's 5th Congressional District: Exports to China ($ million)

© 2009, The US-China Business Council
Sources: The Trade Partnership from US Census Bureau and US Department of Agriculture data.
Tennessee’s Top Exports to China, 2008
TN-6: Top Exports to China, 2008*
1. Chemicals $391 million 1. Other Manufacturing $201 million
2. Crop Production $230 million 2. Crop Production $33 million
3. Waste & Scrap $134 million 3. Miscellaneous Manufacturing $4 million
4. Computers & Electronics $108 million 4. Machinery (except Electrical) $3 million
5. Primary Metal Manufacturing $90 million 5. Fabricated Metal Products $3 million * The data for TN-6 reflect the combined exports of Bedford, Cannon, Clay, DeKalb, Jackson, Macon, Marshall, Overton, Putnam, Robertson, Rutherford, Smith, Sumner, Trousdale, and Wilson counties. The figures may understate the TN-6 district’s total exports to China because county-specific information for some products (e.g., mining, forestry, fishing, and waste and scrap) is not available.
$33 $37$65
$108
$199
$242
$316
$203
$246
2000 2001 2002 2003 2004 2005 2006 2007 2008
Estimated Growth in Exports from Tennessee’s 6th Congressional District, 2000–08
Exports to China: 650% Exports to Rest of World: 93%
Tennessee's 6th Congressional District: Exports to China ($ million)

© 2009, The US-China Business Council
Sources: The Trade Partnership from US Census Bureau and US Department of Agriculture data.
Tennessee’s Top Exports to China, 2008
TN-7: Top Exports to China, 2008*
1. Chemicals $391 million 1. Other Manufacturing $188 million
2. Crop Production $230 million 2. Crop Production $29 million
3. Waste & Scrap $134 million 3. Fabricated Metal Products $8 million
4. Computers & Electronics $108 million 4. Electrical Equipment $4 million
5. Primary Metal Manufacturing $90 million 5. Miscellaneous Manufacturing $4 million * The data for TN-7 reflect the combined exports of Cheatham, Chester, Davidson, Decatur, Fayette, Hardeman, Hardin, Henderson, Hickman, McNairy, Montgomery, Perry, Shelby, Wayne, and Williamson counties. The figures may understate the TN-7 district’s total exports to China because county-specific information for some products (e.g., mining, forestry, fishing, and waste and scrap) is not available.
$33 $38$64
$103
$185
$229
$301
$204
$245
2000 2001 2002 2003 2004 2005 2006 2007 2008
Estimated Growth in Exports from Tennessee’s 7th Congressional District, 2000–08
Exports to China: 640% Exports to Rest of World: 96%
Tennessee's 7th Congressional District: Exports to China ($ million)

© 2009, The US-China Business Council
Sources: The Trade Partnership from US Census Bureau and US Department of Agriculture data.
Tennessee’s Top Exports to China, 2008
TN-8: Top Exports to China, 2008*
1. Chemicals $391 million 1. Other Manufacturing $204 million
2. Crop Production $230 million 2. Crop Production $97 million
3. Waste & Scrap $134 million 3. Primary Metal Manufacturing $7 million
4. Computers & Electronics $108 million 4. Fabricated Metal Products $5 million
5. Primary Metal Manufacturing $90 million 5. Processed Foods $3 million * The data for TN-8 reflect the combined exports of Benton, Carroll, Crockett, Dickson, Dyer, Gibson, Haywood, Henry, Houston, Humphreys, Lake, Lauderdale, Madison, Montgomery, Obion, Shelby, Stewart, Tipton, and Weakley counties. The figures may understate the TN-8 district’s total exports to China because county-specific information for some products (e.g., mining, forestry, fishing, and waste and scrap) is not available.
$36 $42$88
$204
$426$462
$588
$245
$320
2000 2001 2002 2003 2004 2005 2006 2007 2008
Estimated Growth in Exports from Tennessee’s 8th Congressional District, 2000–08
Exports to China: 789% Exports to Rest of World: 91%
Tennessee's 8th Congressional District: Exports to China ($ million)

© 2009, The US-China Business Council
Sources: The Trade Partnership from US Census Bureau and US Department of Agriculture data.
Tennessee’s Top Exports to China, 2008
TN-9: Top Exports to China, 2008*
1. Chemicals $391 million 1. Other Manufacturing $99 million
2. Crop Production $230 million 2. Crop Production $5 million
3. Waste & Scrap $134 million 3. Fabricated Metal Products $3 million
4. Computers & Electronics $108 million 4. Processed Foods $2 million
5. Primary Metal Manufacturing $90 million 5. Nonmetallic Mineral Products $731,000 * The data for TN-9 reflect the exports of Shelby County, which also includes other congressional districts. The figures may understate the TN-9 district’s total exports to China because county-specific information for some products (e.g., mining, forestry, fishing, and waste and scrap) is not available.
$16 $18
$28$36
$58
$81
$108
$94
$110
2000 2001 2002 2003 2004 2005 2006 2007 2008
Estimated Growth in Exports from Tennessee’s 9th Congressional District, 2000–08
Exports to China: 595% Exports to Rest of World: 95%
Tennessee's 9th Congressional District: Exports to China ($ million)

© 2009, The US-China Business Council
Sources: The Trade Partnership from US Census Bureau and US Department of Agriculture data.
Texas’ Top Exports to China, 2008 TX-1: Top Exports to China, 2008* 1. Chemicals $2.5 billion 1. Other Manufacturing $112 million
2. Computers & Electronics $1.7 billion 2. Machinery (except Electrical) $80 million
3. Machinery (except Electrical) $1.1 billion 3. Crop Production $17 million
4. Crop Production $800 million 4. Processed Foods $6 million
5. Primary Metal Manufacturing $718 million 5. Fabricated Metal Products $6 million * The data for TX-1 reflect the combined exports of Angelina, Cass, Gregg, Harrison, Marion, Nacogdoches, Panola, Rusk, Sabine, San Augustine, Shelby, Smith, and Upshur counties. The figures may understate the TX-1 district’s total exports to China because county-specific information for some products (e.g., mining, forestry, fishing, and waste and scrap) is not available.
$41 $45$58
$85
$125$134
$175
$217 $224
2000 2001 2002 2003 2004 2005 2006 2007 2008
Estimated Growth in Exports from Texas’ 1st Congressional District, 2000–08
Exports to China: 445% Exports to Rest of World: 77%
Texas' 1st Congressional District: Exports to China ($ million)

© 2009, The US-China Business Council
Sources: The Trade Partnership from US Census Bureau and US Department of Agriculture data.
Texas’ Top Exports to China, 2008 TX-2: Top Exports to China, 2008* 1. Chemicals $2.5 billion 1. Chemicals $1.3 billion
2. Computers & Electronics $1.7 billion 2. Machinery (except Electrical) $354 million
3. Machinery (except Electrical) $1.1 billion 3. Other Manufacturing $183 million
4. Crop Production $800 million 4. Fabricated Metal Products $64 million
5. Primary Metal Manufacturing $718 million 5. Petroleum & Coal Products $27 million * The data for TX-2 reflect the combined exports of Harris, Jefferson, and Liberty counties. The figures may understate the TX-2 district’s total exports to China because county-specific information for some products (e.g., mining, forestry, fishing, and waste and scrap) is not available.
$389 $429$561
$799
$1,182 $1,249
$1,617
$1,978 $2,012
2000 2001 2002 2003 2004 2005 2006 2007 2008
Estimated Growth in Exports from Texas’ 2nd Congressional District, 2000–08
Exports to China: 417% Exports to Rest of World: 76%
Texas' 2nd Congressional District: Exports to China ($ million)

© 2009, The US-China Business Council
Sources: The Trade Partnership from US Census Bureau and US Department of Agriculture data.
Texas’ Top Exports to China, 2008 TX-3: Top Exports to China, 2008* 1. Chemicals $2.5 billion 1. Computers & Electronics $461 million
2. Computers & Electronics $1.7 billion 2. Chemicals $137 million
3. Machinery (except Electrical) $1.1 billion 3. Machinery (except Electrical) $111 million
4. Crop Production $800 million 4. Fabricated Metal Products $30 million
5. Primary Metal Manufacturing $718 million 5. Primary Metal Manufacturing $27 million * The data for TX-3 reflect the combined exports of Collin and Dallas counties. The figures may understate the TX-3 district’s total exports to China because county-specific information for some products (e.g., mining, forestry, fishing, and waste and scrap) is not available.
$174$210
$286
$406
$584$626
$845$887 $875
2000 2001 2002 2003 2004 2005 2006 2007 2008
Estimated Growth in Exports from Texas’ 3rd Congressional District, 2000–08
Exports to China: 403% Exports to Rest of World: 76%
Texas’ 3rd Congressional District: Exports to China ($ million)

© 2009, The US-China Business Council
Sources: The Trade Partnership from US Census Bureau and US Department of Agriculture data.
Texas’ Top Exports to China, 2008 TX-4: Top Exports to China, 2008* 1. Chemicals $2.5 billion 1. Other Manufacturing $184 million
2. Computers & Electronics $1.7 billion 2. Computers & Electronics $91 million
3. Machinery (except Electrical) $1.1 billion 3. Crop Production $25 million
4. Crop Production $800 million 4. Primary Metal Manufacturing $14 million
5. Primary Metal Manufacturing $718 million 5. Fabricated Metal Products $12 million * The data for TX-4 reflect the combined exports of Bowie, Camp, Cass, Collin, Delta, Fannin, Franklin, Grayson, Hopkins, Hunt, Lamar, Morris, Rains, Red River, Rockwall, and Titus counties. The figures may understate the TX-4 district’s total exports to China because county-specific information for some products (e.g., mining, forestry, fishing, and waste and scrap) is not available.
$62 $67$88
$129
$190$203
$265
$328 $339
2000 2001 2002 2003 2004 2005 2006 2007 2008
Estimated Growth in Exports from Texas’ 4th Congressional District, 2000–08
Exports to China: 445% Exports to Rest of World: 77%
Texas’ 4th Congressional District: Exports to China ($ million)

© 2009, The US-China Business Council
Sources: The Trade Partnership from US Census Bureau and US Department of Agriculture data.
Texas’ Top Exports to China, 2008 TX-5: Top Exports to China, 2008* 1. Chemicals $2.5 billion 1. Computers & Electronics $370 million
2. Computers & Electronics $1.7 billion 2. Chemicals $137 million
3. Machinery (except Electrical) $1.1 billion 3. Machinery (except Electrical) $111 million
4. Crop Production $800 million 4. Crop Production $36 million
5. Primary Metal Manufacturing $718 million 5. Fabricated Metal Products $30 million * The data for TX-5 reflect the combined exports of Anderson, Cherokee, Dallas, Henderson, Kaufman, Van Zandt, and Wood counties. The figures may understate the TX-5 district’s total exports to China because county-specific information for some products (e.g., mining, forestry, fishing, and waste and scrap) is not available.
$155$183
$247
$354
$511$548
$742$804 $799
2000 2001 2002 2003 2004 2005 2006 2007 2008
Estimated Growth in Exports from Texas’ 5th Congressional District, 2000–08
Exports to China: 416% Exports to Rest of World: 77%
Texas’ 5th Congressional District: Exports to China ($ million)

© 2009, The US-China Business Council
Sources: The Trade Partnership from US Census Bureau and US Department of Agriculture data.
Texas’ Top Exports to China, 2008 TX-6: Top Exports to China, 2008* 1. Chemicals $2.5 billion 1. Other Manufacturing $570 million
2. Computers & Electronics $1.7 billion 2. Machinery (except Electrical) $96 million
3. Machinery (except Electrical) $1.1 billion 3. Chemicals $53 million
4. Crop Production $800 million 4. Fabricated Metal Products $19 million
5. Primary Metal Manufacturing $718 million 5. Crop Production $16 million * The data for TX-6 reflect the combined exports of Ellis, Freestone, Houston, Leon, Limestone, Navarro, Tarrant, and Trinity counties. The figures may understate the TX-6 district’s total exports to China because county-specific information for some products (e.g., mining, forestry, fishing, and waste and scrap) is not available.
$149 $164$214
$307
$454$480
$624
$765 $780
2000 2001 2002 2003 2004 2005 2006 2007 2008
Estimated Growth in Exports from Texas’ 6th Congressional District, 2000–08
Exports to China: 423% Exports to Rest of World: 77%
Texas’ 6th Congressional District: Exports to China ($ million)

© 2009, The US-China Business Council
Sources: The Trade Partnership from US Census Bureau and US Department of Agriculture data.
Texas’ Top Exports to China, 2008 TX-7: Top Exports to China, 2008* 1. Chemicals $2.5 billion 1. Chemicals $1.1 billion
2. Computers & Electronics $1.7 billion 2. Machinery (except Electrical) $354 million
3. Machinery (except Electrical) $1.1 billion 3. Fabricated Metal Products $60 million
4. Crop Production $800 million 4. Petroleum & Coal Products $27 million
5. Primary Metal Manufacturing $718 million 5. Electrical Equipment $23 million * The data for TX-7 reflect the exports of Harris County, which also includes other congressional districts. The figures may understate the TX-7 district’s total exports to China because county-specific information for some products (e.g., mining, forestry, fishing, and waste and scrap) is not available.
$356 $359$451
$627
$932 $941
$1,148
$1,665 $1,625
2000 2001 2002 2003 2004 2005 2006 2007 2008
Estimated Growth in Exports from Texas’ 7th Congressional District, 2000–08
Exports to China: 356% Exports to Rest of World: 45%
Texas’ 7th Congressional District: Exports to China ($ million)

© 2009, The US-China Business Council
Sources: The Trade Partnership from US Census Bureau and US Department of Agriculture data.
Texas’ Top Exports to China, 2008 TX-8: Top Exports to China, 2008* 1. Chemicals $2.5 billion 1. Chemicals $82 million
2. Computers & Electronics $1.7 billion 2. Machinery (except Electrical) $15 million
3. Machinery (except Electrical) $1.1 billion 3. Other Manufacturing $13 million
4. Crop Production $800 million 4. Crop Production $9 million
5. Primary Metal Manufacturing $718 million 5. Fabricated Metal Products $5 million * The data for TX-8 reflect the combined exports of Hardin, Jasper, Liberty, Montgomery, Newton, Orange, Polk, San Jacinto, Trinity, Tyler, and Walker counties. The figures may understate the TX-8 district’s total exports to China because county-specific information for some products (e.g., mining, forestry, fishing, and waste and scrap) is not available.
$23 $25$32
$47
$69$74
$97
$120 $124
2000 2001 2002 2003 2004 2005 2006 2007 2008
Estimated Growth in Exports from Texas’ 8th Congressional District, 2000–08
Exports to China: 445% Exports to Rest of World: 77%
Texas’ 8th Congressional District: Exports to China ($ million)

© 2009, The US-China Business Council
Sources: The Trade Partnership from US Census Bureau and US Department of Agriculture data.
Texas’ Top Exports to China, 2008 TX-9: Top Exports to China, 2008* 1. Chemicals $2.5 billion 1. Chemicals $1.1 billion
2. Computers & Electronics $1.7 billion 2. Machinery (except Electrical) $354 million
3. Machinery (except Electrical) $1.1 billion 3. Fabricated Metal Products $66 million
4. Crop Production $800 million 4. Petroleum & Coal Products $27 million
5. Primary Metal Manufacturing $718 million 5. Electrical Equipment $23 million * The data for TX-9 reflect the combined exports of Fort Bend and Harris counties. The figures may understate the TX-9 district’s total exports to China because county-specific information for some products (e.g., mining, forestry, fishing, and waste and scrap) is not available.
$357 $360$452
$631
$936 $946
$1,156
$1,675 $1,638
2000 2001 2002 2003 2004 2005 2006 2007 2008
Estimated Growth in Exports from Texas’ 9th Congressional District, 2000–08
Exports to China: 358% Exports to Rest of World: 77%
Texas’ 9th Congressional District: Exports to China ($ million)

© 2009, The US-China Business Council
Sources: The Trade Partnership from US Census Bureau and US Department of Agriculture data.
Texas’ Top Exports to China, 2008 TX-10: Top Exports to China, 2008* 1. Chemicals $2.5 billion 1. Chemicals $1.1 billion
2. Computers & Electronics $1.7 billion 2. Other Manufacturing $403 million
3. Machinery (except Electrical) $1.1 billion 3. Machinery (except Electrical) $371 million
4. Crop Production $800 million 4. Fabricated Metal Products $61 million
5. Primary Metal Manufacturing $718 million 5. Petroleum & Coal Products $27 million * The data for TX-10 reflect the combined exports of Austin, Bastrop, Burleson, Harris, Lee, Travis, Waller, and Washington counties. The figures may understate the TX-10 district’s total exports to China because county-specific information for some products (e.g., mining, forestry, fishing, and waste and scrap) is not available.
$397 $437$572
$816
$1,207 $1,276
$1,654
$2,023 $2,061
2000 2001 2002 2003 2004 2005 2006 2007 2008
Estimated Growth in Exports from Texas’ 10th Congressional District, 2000–08
Exports to China: 419% Exports to Rest of World: 76%
Texas’ 10th Congressional District: Exports to China ($ million)

© 2009, The US-China Business Council
Sources: The Trade Partnership from US Census Bureau and US Department of Agriculture data.
Texas’ Top Exports to China, 2008 TX-11: Top Exports to China, 2008* 1. Chemicals $2.5 billion 1. Crop Production $42 million
2. Computers & Electronics $1.7 billion 2. Chemicals $20 million
3. Machinery (except Electrical) $1.1 billion 3. Other Manufacturing $19 million
4. Crop Production $800 million 4. Machinery (except Electrical) $11 million
5. Primary Metal Manufacturing $718 million 5. Fabricated Metal Products $6 million * The data for TX-11 reflect the combined exports of Andrews, Brown, Burnet, Coke, Coleman, Comanche, Concho, Crane, Dawson, Ector, Gillespie, Glasscock, Irion, Kimble, Lampasas, Llano, Loving, Martin, Mason, McCulloch, Menard, Midland, Mills, Mitchell, Nolan, Reagan, Runnels, San Saba, Schleicher, Scurry, Sterling, Sutton, Tom Green, Upton, Ward, and Winkler counties. The figures may understate the TX-11 district’s total exports to China because county-specific information for some products (e.g., mining, forestry, fishing, and waste and scrap) is not available.
$13 $13$17
$30
$41$47
$67
$88
$98
2000 2001 2002 2003 2004 2005 2006 2007 2008
Estimated Growth in Exports from Texas’ 11th Congressional District, 2000–08
Exports to China: 654% Exports to Rest of World: 87%
Texas’ 11th Congressional District: Exports to China ($ million)

© 2009, The US-China Business Council
Sources: The Trade Partnership from US Census Bureau and US Department of Agriculture data.
Texas’ Top Exports to China, 2008 TX-12: Top Exports to China, 2008* 1. Chemicals $2.5 billion 1. Other Manufacturing $508 million
2. Computers & Electronics $1.7 billion 2. Machinery (except Electrical) $96 million
3. Machinery (except Electrical) $1.1 billion 3. Chemicals $53 million
4. Crop Production $800 million 4. Fabricated Metal Products $16 million
5. Primary Metal Manufacturing $718 million 5. Processed Foods $14 million * The data for TX-12 reflect the combined exports of Parker, Tarrant, and Wise counties. The figures may understate the TX-12 district’s total exports to China because county-specific information for some products (e.g., mining, forestry, fishing, and waste and scrap) is not available.
$136 $149$195
$279
$413 $436
$566
$692 $705
2000 2001 2002 2003 2004 2005 2006 2007 2008
Estimated Growth in Exports from Texas’ 12th Congressional District, 2000–08
Exports to China: 420% Exports to Rest of World: 76%
Texas’ 12th Congressional District: Exports to China ($ million)

© 2009, The US-China Business Council
Sources: The Trade Partnership from US Census Bureau and US Department of Agriculture data.
Texas’ Top Exports to China, 2008 TX-13: Top Exports to China, 2008* 1. Chemicals $2.5 billion 1. Other Manufacturing $169 million
2. Computers & Electronics $1.7 billion 2. Crop Production $127 million
3. Machinery (except Electrical) $1.1 billion 3. Plastics & Rubber Products $2 million
4. Crop Production $800 million 4. Fabricated Metal Products $2 million
5. Primary Metal Manufacturing $718 million 5. Animal Production $604,000 * The data for TX-13 reflect the combined exports of Archer, Armstrong, Baylor, Briscoe, Carson, Childress, Clay, Collingsworth, Cooke, Cottle, Crosby, Dallam, Dickens, Donley, Foard, Gray, Hall, Hansford, Hardeman, Hartley, Haskell, Hemphill, Hutchinson, Jack, Jones, King , Knox, Lipscomb, Montague, Moore, Motley, Ochiltree, Oldham, Palo Pinto, Potter, Randall, Roberts, Sherman, Stonewall, Swisher, Throckmorton, Wheeler, Wichita, and Wilbarger counties. The figures may understate the TX-13 district’s total exports to China because county-specific information for some products (e.g., mining, forestry, fishing, and waste and scrap) is not available. Figures are rounded.
$40 $39$51
$91
$126$146
$204
$269
$300
2000 2001 2002 2003 2004 2005 2006 2007 2008
Estimated Growth in Exports from Texas’ 13th Congressional District, 2000–08
Exports to China: 649% Exports to Rest of World: 86%
Texas’ 13th Congressional District: Exports to China ($ million)

© 2009, The US-China Business Council
Sources: The Trade Partnership from US Census Bureau and US Department of Agriculture data.
Texas’ Top Exports to China, 2008 TX-14: Top Exports to China, 2008* 1. Chemicals $2.5 billion 1. Chemicals $333 million
2. Computers & Electronics $1.7 billion 2. Other Manufacturing $199 million
3. Machinery (except Electrical) $1.1 billion 3. Crop Production $66 million
4. Crop Production $800 million 4. Fabricated Metal Products $10 million
5. Primary Metal Manufacturing $718 million 5. Plastics & Rubber Products $1 million * The data for TX-14 reflect the combined exports of Aransas, Brazoria, Calhoun, Chambers, Fort Bend, Galveston, Jackson, Matagorda, Victoria, and Wharton counties. The figures may understate the TX-14 district’s total exports to China because county-specific information for some products (e.g., mining, forestry, fishing, and waste and scrap) is not available.
$109 $117$154
$228
$333$358
$472
$586$610
2000 2001 2002 2003 2004 2005 2006 2007 2008
Estimated Growth in Exports from Texas’ 14th Congressional District, 2000–08
Exports to China: 459% Exports to Rest of World: 78%
Texas’ 14th Congressional District: Exports to China ($ million)

© 2009, The US-China Business Council
Sources: The Trade Partnership from US Census Bureau and US Department of Agriculture data.
Texas’ Top Exports to China, 2008 TX-15: Top Exports to China, 2008* 1. Chemicals $2.5 billion 1. Crop Production $73 million
2. Computers & Electronics $1.7 billion 2. Other Manufacturing $64 million
3. Machinery (except Electrical) $1.1 billion 3. Processed Foods $4 million
4. Crop Production $800 million 4. Machinery (except Electrical) $3 million
5. Primary Metal Manufacturing $718 million 5. Fabricated Metal Products $2 million * The data for TX-15 reflect the combined exports of Bee, Brooks, Cameron, DeWitt, Duval, Goliad, Hidalgo, Jim Wells, Karnes, Live Oak, Refugio, and San Patricio counties. The figures may understate the TX-15 district’s total exports to China because county-specific information for some products (e.g., mining, forestry, fishing, and waste and scrap) is not available.
$18 $17$23
$42
$58$68
$98
$130
$148
2000 2001 2002 2003 2004 2005 2006 2007 2008
Estimated Growth in Exports from Texas’ 15th Congressional District, 2000–08
Exports to China: 709% Exports to Rest of World: 90%
Texas’ 15th Congressional District: Exports to China ($ million)

© 2009, The US-China Business Council
Sources: The Trade Partnership from US Census Bureau and US Department of Agriculture data.
Texas’ Top Exports to China, 2008 TX-16: Top Exports to China, 2008* 1. Chemicals $2.5 billion 1. Other Manufacturing $116 million
2. Computers & Electronics $1.7 billion 2. Electrical Equipment $28 million
3. Machinery (except Electrical) $1.1 billion 3. Computers & Electronics $17 million
4. Crop Production $800 million 4. Leather & Related Products $9 million
5. Primary Metal Manufacturing $718 million 5. Crop Production $6 million * The data for TX-16 reflect the exports of El Paso County, which also includes other congressional districts. The figures may understate the TX-16 district’s total exports to China because county-specific information for some products (e.g., mining, forestry, fishing, and waste and scrap) is not available.
$36 $40$52
$75
$111 $117
$153
$188 $192
2000 2001 2002 2003 2004 2005 2006 2007 2008
Estimated Growth in Exports from Texas’ 16th Congressional District, 2000–08
Exports to China: 427% Exports to Rest of World: 77%
Texas’ 16th Congressional District: Exports to China ($ million)

© 2009, The US-China Business Council
Sources: The Trade Partnership from US Census Bureau and US Department of Agriculture data.
Texas’ Top Exports to China, 2008 TX-17: Top Exports to China, 2008* 1. Chemicals $2.5 billion 1. Other Manufacturing $110 million
2. Computers & Electronics $1.7 billion 2. Crop Production $24 million
3. Machinery (except Electrical) $1.1 billion 3. Machinery (except Electrical) $14 million
4. Crop Production $800 million 4. Processed Foods $9 million
5. Primary Metal Manufacturing $718 million 5. Fabricated Metal Products $6 million * The data for TX-17 reflect the combined exports of Bosque, Brazos, Burleson, Grimes, Hill, Hood, Johnson, Limestone, Madison, McLennan, Robertson, and Somervell counties. The figures may understate the TX-17 district’s total exports to China because county-specific information for some products (e.g., mining, forestry, fishing, and waste and scrap) is not available.
$29 $31$41
$62
$90$98
$129
$162$170
2000 2001 2002 2003 2004 2005 2006 2007 2008
Estimated Growth in Exports from Texas’ 17th Congressional District, 2000–08
Exports to China: 476% Exports to Rest of World: 79%
Texas’ 17th Congressional District: Exports to China ($ million)

© 2009, The US-China Business Council
Sources: The Trade Partnership from US Census Bureau and US Department of Agriculture data.
Texas’ Top Exports to China, 2008 TX-18: Top Exports to China, 2008* 1. Chemicals $2.5 billion 1. Chemicals $1.1 billion
2. Computers & Electronics $1.7 billion 2. Machinery (except Electrical) $354 million
3. Machinery (except Electrical) $1.1 billion 3. Fabricated Metal Products $60 million
4. Crop Production $800 million 4. Petroleum & Coal Products $27 million
5. Primary Metal Manufacturing $718 million 5. Electrical Equipment $23 million * The data for TX-18 reflect the exports of Harris County, which also includes other congressional districts. The figures may understate the TX-18 district’s total exports to China because county-specific information for some products (e.g., mining, forestry, fishing, and waste and scrap) is not available.
$356 $359$451
$627
$932 $941
$1,148
$1,665 $1,625
2000 2001 2002 2003 2004 2005 2006 2007 2008
Estimated Growth in Exports from Texas’ 18th Congressional District, 2000–08
Exports to China: 356% Exports to Rest of World: 45%
Texas’ 18th Congressional District: Exports to China ($ million)

© 2009, The US-China Business Council
Sources: The Trade Partnership from US Census Bureau and US Department of Agriculture data.
Texas’ Top Exports to China, 2008 TX-19: Top Exports to China, 2008* 1. Chemicals $2.5 billion 1. Crop Production $177 million
2. Computers & Electronics $1.7 billion 2. Other Manufacturing $70 million
3. Machinery (except Electrical) $1.1 billion 3. Processed Foods $4 million
4. Crop Production $800 million 4. Fabricated Metal Products $3 million
5. Primary Metal Manufacturing $718 million 5. Animal Production $524,000 * The data for TX-19 reflect the combined exports of Archer, Bailey, Borden, Callahan, Castro, Cochran, Deaf Smith, Eastland, Fisher, Floyd, Gaines, Garza, Hale, Hockley, Howard, Kent, Lamb, Lubbock, Lynn, Nolan, Parmer, Shackelford, Stephens, Taylor, Terry, Yoakum, and Young counties. The figures may understate the TX-19 district’s total exports to China because county-specific information for some products (e.g., mining, forestry, fishing, and waste and scrap) is not available.
$24 $19 $26
$61$78
$101
$153
$214
$255
2000 2001 2002 2003 2004 2005 2006 2007 2008
Estimated Growth in Exports from Texas’ 19th Congressional District, 2000–08
Exports to China: 957% Exports to Rest of World: 101%
Texas’ 19th Congressional District: Exports to China ($ million)

© 2009, The US-China Business Council
Sources: The Trade Partnership from US Census Bureau and US Department of Agriculture data.
Texas’ Top Exports to China, 2008 TX-20: Top Exports to China, 2008* 1. Chemicals $2.5 billion 1. Other Manufacturing $94 million
2. Computers & Electronics $1.7 billion 2. Machinery (except Electrical) $32 million
3. Machinery (except Electrical) $1.1 billion 3. Crop Production $13 million
4. Crop Production $800 million 4. Processed Foods $8 million
5. Primary Metal Manufacturing $718 million 5. Fabricated Metal Products $4 million * The data for TX-20 reflect the exports of Bexar County, which also includes other congressional districts. The figures may understate the TX-20 district’s total exports to China because county-specific information for some products (e.g., mining, forestry, fishing, and waste and scrap) is not available.
$28 $31$40
$59
$86$92
$121
$150 $155
2000 2001 2002 2003 2004 2005 2006 2007 2008
Estimated Growth in Exports from Texas’ 20th Congressional District, 2000–08
Exports to China: 448% Exports to Rest of World: 78%
Texas’ 20th Congressional District: Exports to China ($ million)

© 2009, The US-China Business Council
Sources: The Trade Partnership from US Census Bureau and US Department of Agriculture data.
Texas’ Top Exports to China, 2008 TX-21: Top Exports to China, 2008* 1. Chemicals $2.5 billion 1. Other Manufacturing $610 million
2. Computers & Electronics $1.7 billion 2. Machinery (except Electrical) $32 million
3. Machinery (except Electrical) $1.1 billion 3. Crop Production $17 million
4. Crop Production $800 million 4. Processed Foods $8 million
5. Primary Metal Manufacturing $718 million 5. Fabricated Metal Products $4 million * The data for TX-21 reflect the combined exports of Bandera, Bexar, Blanco, Comal, Kendall, Kerr, Real, and Travis counties. The figures may understate the TX-21 district’s total exports to China because county-specific information for some products (e.g., mining, forestry, fishing, and waste and scrap) is not available.
$129 $141$185
$265
$391$415
$539
$661 $675
2000 2001 2002 2003 2004 2005 2006 2007 2008
Estimated Growth in Exports from Texas’ 21st Congressional District, 2000–08
Exports to China: 425% Exports to Rest of World: 77%
Texas’ 21st Congressional District: Exports to China ($ million)

© 2009, The US-China Business Council
Sources: The Trade Partnership from US Census Bureau and US Department of Agriculture data.
Texas’ Top Exports to China, 2008 TX-22: Top Exports to China, 2008* 1. Chemicals $2.5 billion 1. Chemicals $1.5 billion
2. Computers & Electronics $1.7 billion 2. Machinery (except Electrical) $354 million
3. Machinery (except Electrical) $1.1 billion 3. Other Manufacturing $90 million
4. Crop Production $800 million 4. Fabricated Metal Products $70 million
5. Primary Metal Manufacturing $718 million 5. Petroleum & Coal Products $27 million * The data for TX-22 reflect the combined exports of Brazoria, Fort Bend, Galveston, and Harris counties. The figures may understate the TX-22 district’s total exports to China because county-specific information for some products (e.g., mining, forestry, fishing, and waste and scrap) is not available.
$400 $439$575
$820
$1,214 $1,283
$1,663
$2,035 $2,072
2000 2001 2002 2003 2004 2005 2006 2007 2008
Estimated Growth in Exports from Texas’ 22nd Congressional District, 2000–08
Exports to China: 419% Exports to Rest of World: 76%
Texas’ 22nd Congressional District: Exports to China ($ million)

© 2009, The US-China Business Council
Sources: The Trade Partnership from US Census Bureau and US Department of Agriculture data.
Texas’ Top Exports to China, 2008 TX-23: Top Exports to China, 2008* 1. Chemicals $2.5 billion 1. Other Manufacturing $211 million
2. Computers & Electronics $1.7 billion 2. Crop Production $46 million
3. Machinery (except Electrical) $1.1 billion 3. Machinery (except Electrical) $32 million
4. Crop Production $800 million 4. Electrical Equipment $28 million
5. Primary Metal Manufacturing $718 million 5. Computers & Electronics $17 million * The data for TX-23 reflect the combined exports of Bexar, Brewster, Crockett, Culberson, Dimmit, Edwards, El Paso, Hudspeth, Jeff Davis, Kinney, Maverick, Medina, Pecos, Presidio, Reeves, Sutton, Terrell, Uvalde, Val Verde, and Zavala counties. The figures may understate the TX-23 district’s total exports to China because county-specific information for some products (e.g., mining, forestry, fishing, and waste and scrap) is not available.
$66 $71$93
$139
$202$218
$288
$359$375
2000 2001 2002 2003 2004 2005 2006 2007 2008
Estimated Growth in Exports from Texas’ 23rd Congressional District, 2000–08
Exports to China: 466% Exports to Rest of World: 78%
Texas’ 23rd Congressional District: Exports to China ($ million)

© 2009, The US-China Business Council
Sources: The Trade Partnership from US Census Bureau and US Department of Agriculture data.
Texas’ Top Exports to China, 2008 TX-24: Top Exports to China, 2008* 1. Chemicals $2.5 billion 1. Other Manufacturing $514 million
2. Computers & Electronics $1.7 billion 2. Computers & Electronics $370 million
3. Machinery (except Electrical) $1.1 billion 3. Machinery (except Electrical) $222 million
4. Crop Production $800 million 4. Chemicals $190 million
5. Primary Metal Manufacturing $718 million 5. Fabricated Metal Products $45 million * The data for TX-24 reflect the combined exports of Dallas, Denton, and Tarrant counties. The figures may understate the TX-24 district’s total exports to China because county-specific information for some products (e.g., mining, forestry, fishing, and waste and scrap) is not available.
$288 $317$415
$592
$876$926
$1,200
$1,467 $1,493
2000 2001 2002 2003 2004 2005 2006 2007 2008
Estimated Growth in Exports from Texas’ 24th Congressional District, 2000–08
Exports to China: 418% Exports to Rest of World: 76%
Texas’ 24th Congressional District: Exports to China ($ million)

© 2009, The US-China Business Council
Sources: The Trade Partnership from US Census Bureau and US Department of Agriculture data.
Texas’ Top Exports to China, 2008 TX-25: Top Exports to China, 2008* 1. Chemicals $2.5 billion 1. Other Manufacturing $527 million
2. Computers & Electronics $1.7 billion 2. Crop Production $15 million
3. Machinery (except Electrical) $1.1 billion 3. Fabricated Metal Products $2 million
4. Crop Production $800 million 4. Processed Foods $1 million
5. Primary Metal Manufacturing $718 million 5. Publishing Industries $411,000 * The data for TX-25 reflect the combined exports of Bastrop, Caldwell, Colorado, Fayette, Gonzales, Hays, Lavaca, and Travis counties. The figures may understate the TX-25 district’s total exports to China because county-specific information for some products (e.g., mining, forestry, fishing, and waste and scrap) is not available.
$104 $114$149
$214
$316$335
$436
$534 $546
2000 2001 2002 2003 2004 2005 2006 2007 2008
Estimated Growth in Exports from Texas’ 25th Congressional District, 2000–08
Exports to China: 426% Exports to Rest of World: 77%
Texas’ 25th Congressional District: Exports to China ($ million)

© 2009, The US-China Business Council
Sources: The Trade Partnership from US Census Bureau and US Department of Agriculture data.
Texas’ Top Exports to China, 2008 TX-26: Top Exports to China, 2008* 1. Chemicals $2.5 billion 1. Other Manufacturing $524 million
2. Computers & Electronics $1.7 billion 2. Computers & Electronics $370 million
3. Machinery (except Electrical) $1.1 billion 3. Machinery (except Electrical) $222 million
4. Crop Production $800 million 4. Chemicals $190 million
5. Primary Metal Manufacturing $718 million 5. Fabricated Metal Products $47 million * The data for TX-26 reflect the combined exports of Cooke, Dallas, Denton, and Tarrant counties. The figures may understate the TX-26 district’s total exports to China because county-specific information for some products (e.g., mining, forestry, fishing, and waste and scrap) is not available.
$291 $320$418
$597
$883$933
$1,209
$1,479 $1,506
2000 2001 2002 2003 2004 2005 2006 2007 2008
Estimated Growth in Exports from Texas’ 26th Congressional District, 2000–08
Exports to China: 418% Exports to Rest of World: 76%
Texas’ 26th Congressional District: Exports to China ($ million)

© 2009, The US-China Business Council
Sources: The Trade Partnership from US Census Bureau and US Department of Agriculture data.
Texas’ Top Exports to China, 2008 TX-27: Top Exports to China, 2008* 1. Chemicals $2.5 billion 1. Crop Production $43 million
2. Computers & Electronics $1.7 billion 2. Other Manufacturing $17 million
3. Machinery (except Electrical) $1.1 billion 3. Petroleum & Coal Products $13 million
4. Crop Production $800 million 4. Fabricated Metal Products $2 million
5. Primary Metal Manufacturing $718 million 5. Processed Foods $2 million * The data for TX-27 reflect the combined exports of Cameron, Kenedy, Kleberg, Nueces, San Patricio, and Willacy counties. The figures may understate the TX-27 district’s total exports to China because county-specific information for some products (e.g., mining, forestry, fishing, and waste and scrap) is not available.
$9 $8$11
$22
$29$35
$51
$69
$79
2000 2001 2002 2003 2004 2005 2006 2007 2008
Estimated Growth in Exports from Texas’ 27th Congressional District, 2000–08
Exports to China: 755% Exports to Rest of World: 92%
Texas’ 27th Congressional District: Exports to China ($ million)

© 2009, The US-China Business Council
Sources: The Trade Partnership from US Census Bureau and US Department of Agriculture data.
Texas’ Top Exports to China, 2008 TX-28: Top Exports to China, 2008* 1. Chemicals $2.5 billion 1. Other Manufacturing $167 million
2. Computers & Electronics $1.7 billion 2. Crop Production $71 million
3. Machinery (except Electrical) $1.1 billion 3. Machinery (except Electrical) $35 million
4. Crop Production $800 million 4. Processed Foods $10 million
5. Primary Metal Manufacturing $718 million 5. Fabricated Metal Products $4 million * The data for TX-28 reflect the combined exports of Atascosa, Bexar, Frio, Guadalupe, Hidalgo, Jim Hogg, La Salle, McMullen, Starr, Webb, Wilson, and Zapata counties. The figures may understate the TX-28 district’s total exports to China because county-specific information for some products (e.g., mining, forestry, fishing, and waste and scrap) is not available.
$46 $48$63
$100
$143$158
$214
$272$291
2000 2001 2002 2003 2004 2005 2006 2007 2008
Estimated Growth in Exports from Texas’ 28th Congressional District, 2000–08
Exports to China: 527% Exports to Rest of World: 81%
Texas’ 28th Congressional District: Exports to China ($ million)

© 2009, The US-China Business Council
Sources: The Trade Partnership from US Census Bureau and US Department of Agriculture data.
Texas’ Top Exports to China, 2008 TX-29: Top Exports to China, 2008* 1. Chemicals $2.5 billion 1. Chemicals $1.1 billion
2. Computers & Electronics $1.7 billion 2. Machinery (except Electrical) $354 million
3. Machinery (except Electrical) $1.1 billion 3. Fabricated Metal Products $60 million
4. Crop Production $800 million 4. Petroleum & Coal Products $27 million
5. Primary Metal Manufacturing $718 million 5. Electrical Equipment $23 million * The data for TX-29 reflect the exports of Harris County, which also includes other congressional districts. The figures may understate the TX-29 district’s total exports to China because county-specific information for some products (e.g., mining, forestry, fishing, and waste and scrap) is not available.
$356 $359$451
$627
$932 $941
$1,148
$1,665 $1,625
2000 2001 2002 2003 2004 2005 2006 2007 2008
Estimated Growth in Exports from Texas’ 29th Congressional District, 2000–08
Exports to China: 356% Exports to Rest of World: 45%
Texas’ 29th Congressional District: Exports to China ($ million)
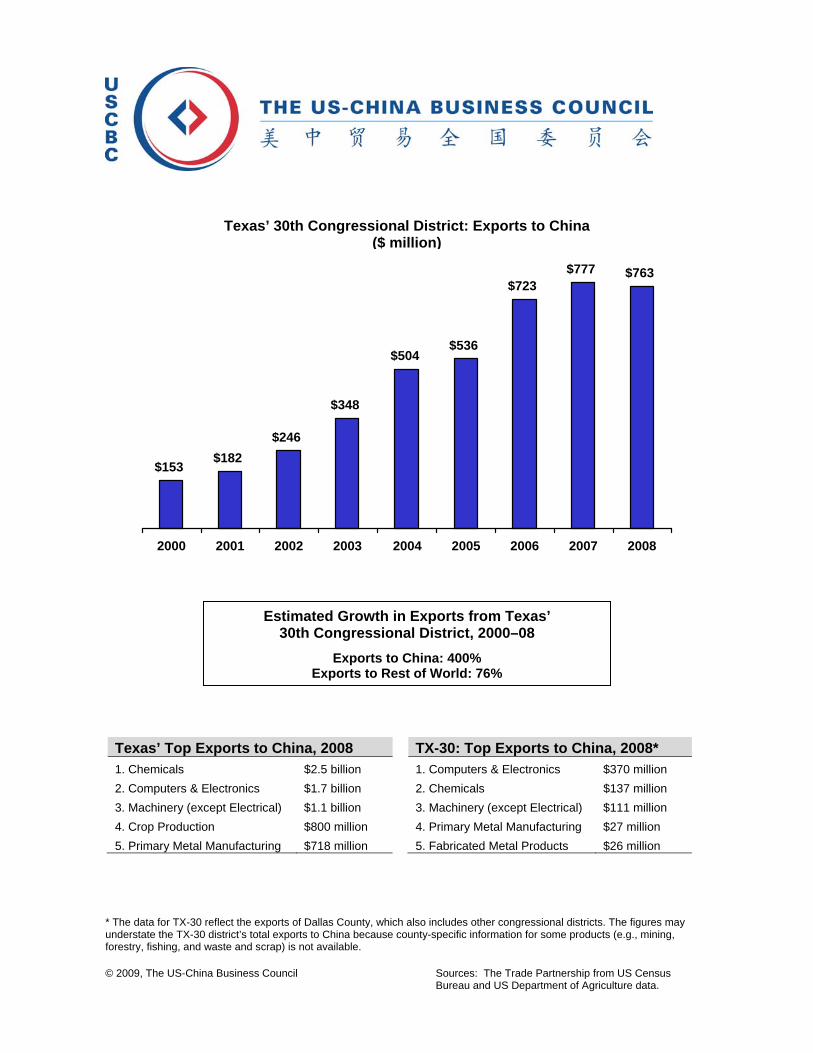
© 2009, The US-China Business Council
Sources: The Trade Partnership from US Census Bureau and US Department of Agriculture data.
Texas’ Top Exports to China, 2008 TX-30: Top Exports to China, 2008* 1. Chemicals $2.5 billion 1. Computers & Electronics $370 million
2. Computers & Electronics $1.7 billion 2. Chemicals $137 million
3. Machinery (except Electrical) $1.1 billion 3. Machinery (except Electrical) $111 million
4. Crop Production $800 million 4. Primary Metal Manufacturing $27 million
5. Primary Metal Manufacturing $718 million 5. Fabricated Metal Products $26 million * The data for TX-30 reflect the exports of Dallas County, which also includes other congressional districts. The figures may understate the TX-30 district’s total exports to China because county-specific information for some products (e.g., mining, forestry, fishing, and waste and scrap) is not available.
$153$182
$246
$348
$504$536
$723$777 $763
2000 2001 2002 2003 2004 2005 2006 2007 2008
Estimated Growth in Exports from Texas’ 30th Congressional District, 2000–08
Exports to China: 400% Exports to Rest of World: 76%
Texas’ 30th Congressional District: Exports to China ($ million)

© 2009, The US-China Business Council
Sources: The Trade Partnership from US Census Bureau and US Department of Agriculture data.
Texas’ Top Exports to China, 2008 TX-31: Top Exports to China, 2008* 1. Chemicals $2.5 billion 1. Other Manufacturing $91 million
2. Computers & Electronics $1.7 billion 2. Crop Production $24 million
3. Machinery (except Electrical) $1.1 billion 3. Primary Metal Manufacturing $6 million
4. Crop Production $800 million 4. Animal Production $96,000
5. Primary Metal Manufacturing $718 million * The data for TX-31 reflect the combined exports of Bell, Coryell, Erath, Falls, Hamilton, Milam, Robertson, and Williamson counties. The figures may understate the TX-31 district’s total exports to China because county-specific information for some products (e.g., mining, forestry, fishing, and waste and scrap) is not available.
$20 $21$28
$43
$62$68
$91
$114$121
2000 2001 2002 2003 2004 2005 2006 2007 2008
Estimated Growth in Exports from Texas’ 31st Congressional District, 2000–08
Exports to China: 503% Exports to Rest of World: 80%
Texas’ 31st Congressional District: Exports to China ($ million)

© 2009, The US-China Business Council
Sources: The Trade Partnership from US Census Bureau and US Department of Agriculture data.
Texas’ Top Exports to China, 2008 TX-32: Top Exports to China, 2008* 1. Chemicals $2.5 billion 1. Computers & Electronics $370 million
2. Computers & Electronics $1.7 billion 2. Chemicals $137 million
3. Machinery (except Electrical) $1.1 billion 3. Machinery (except Electrical) $111 million
4. Crop Production $800 million 4. Primary Metal Manufacturing $27 million
5. Primary Metal Manufacturing $718 million 5. Fabricated Metal Products $26 million * The data for TX-32 reflect the exports of Dallas County, which also includes other congressional districts. The figures may understate the TX-32 district’s total exports to China because county-specific information for some products (e.g., mining, forestry, fishing, and waste and scrap) is not available.
$153$182
$246
$348
$504$536
$723$777 $763
2000 2001 2002 2003 2004 2005 2006 2007 2008
Estimated Growth in Exports from Texas’ 32nd Congressional District, 2000–08
Exports to China: 400% Exports to Rest of World: 76%
Texas’ 32nd Congressional District: Exports to China ($ million)

© 2009, The US-China Business Council
Sources: The Trade Partnership from US Census Bureau and US Department of Agriculture data.
Utah’s Top Exports to China, 2008 UT-1: Top Exports to China, 2008* 1. Computers & Electronics $364 million 1. Other Manufacturing $377 million
2. Waste & Scrap $32 million 2. Computers & Electronics $16 million
3. Processed Foods $31 million 3. Processed Foods $14 million
4. Transportation Equipment $19 million 4. Fabricated Metal Products $7 million
6. Machinery (except Electrical) $15 million 5. Electrical Equipment $3 million * The data for UT-1 reflect the combined exports of Box Elder, Cache, Davis, Juab, Morgan, Rich, Salt Lake, Summit, Tooele, and Weber counties. The figures may understate the UT-1 district’s total exports to China because county-specific information for some products (e.g., mining, forestry, fishing, and waste and scrap) is not available.
$24 $31$50
$89 $97$122
$137
$273
$420
2000 2001 2002 2003 2004 2005 2006 2007 2008
Estimated Growth in Exports from Utah’s 1st Congressional District, 2000–08
Exports to China: 1,630% Exports to Rest of World: 209%
Utah's 1st Congressional District: Exports to China ($ million)

© 2009, The US-China Business Council
Sources: The Trade Partnership from US Census Bureau and US Department of Agriculture data.
Utah’s Top Exports to China, 2008 UT-2: Top Exports to China, 2008* 1. Computers & Electronics $364 million 1. Other Manufacturing $176 million
2. Waste & Scrap $32 million 2. Computers & Electronics $78 million
3. Processed Foods $31 million 3. Processed Foods $11 million
4. Transportation Equipment $19 million 4. Fabricated Metal Products $4 million
6. Machinery (except Electrical) $15 million 5. Electrical Equipment $3 million * The data for UT-2 reflect the combined exports of Carbon, Daggett, Duchesne, Emery, Garfield, Grand, Iron, Kane, Piute, Salt Lake, San Juan, Uintah, Utah, Wasatch, Washington, and Wayne counties. The figures may understate the UT-2 district’s total exports to China because county-specific information for some products (e.g., mining, forestry, fishing, and waste and scrap) is not available.
$16 $20$33
$58 $64$80
$90
$179
$275
2000 2001 2002 2003 2004 2005 2006 2007 2008
Estimated Growth in Exports from Utah’s 2nd Congressional District, 2000–08
Exports to China: 1,618% Exports to Rest of World: 209%
Utah's 2nd Congressional District: Exports to China ($ million)

© 2009, The US-China Business Council
Sources: The Trade Partnership from US Census Bureau and US Department of Agriculture data.
Utah’s Top Exports to China, 2008 UT-3: Top Exports to China, 2008* 1. Computers & Electronics $364 million 1. Other Manufacturing $165 million
2. Waste & Scrap $32 million 2. Computers & Electronics $78 million
3. Processed Foods $31 million 3. Processed Foods $11 million
4. Transportation Equipment $19 million 4. Fabricated Metal Products $4 million
6. Machinery (except Electrical) $15 million 5. Electrical Equipment $3 million * The data for UT-3 reflect the combined exports of Beaver, Juab, Millard, Salt Lake, Sanpete, Sevier, and Utah counties. The figures may understate the UT-3 district’s total exports to China because county-specific information for some products (e.g., mining, forestry, fishing, and waste and scrap) is not available.
$15 $19$31
$56 $61$77
$87
$172
$264
2000 2001 2002 2003 2004 2005 2006 2007 2008
Estimated Growth in Exports from Utah’s 3rd Congressional District, 2000–08
Exports to China: 1,616% Exports to Rest of World: 208%
Utah's 3rd Congressional District: Exports to China ($ million)

© 2009, The US-China Business Council Source: US Department of Commerce
Vermont’s Top Exports to China, 2008* 1. Computers & Electronics $151 million
2. Minerals & Ores $10 million
3. Processed Foods $10 million
4. Machinery (except Electrical) $8 million
5. Fabricated Metal Products $3 million
*The data for Vermont’s at-large congressional district reflect the combined exports of the entire state.
Vermont's At-Large Congressional District: Exports to China ($ million)
$13 $21$32
$83
$212
$189
$151
$194
$16
2000 2001 2002 2003 2004 2005 2006 2007 2008
Estimated Growth in Exports from Vermont, 2000–08
Exports to China: 1,367% Exports to Rest of World: - 17%

© 2009, The US-China Business Council
Sources: The Trade Partnership from US Census Bureau and US Department of Agriculture data.
Virginia’s Top Exports to China, 2008 VA-1: Top Exports to China, 2008* 1. Chemicals $307 million 1. Other Manufacturing $94 million
2. Computers & Electronics $215 million 2. Crop Production $2 million
3. Waste & Scrap $130 million 3. Machinery (except Electrical) $2 million
4. Paper Products $93 million 4. Processed Foods $1 million
5. Textiles & Fabrics $63 million 5. Fabricated Metal Products $321,000 * The data for VA-1 reflect the combined exports of Caroline, Essex, Fauquier, Gloucester, James City, King and Queen, King George, King William, Lancaster, Mathews, Middlesex, Northumberland, Prince William, Richmond, Spotsylvania, Stafford, Westmoreland, and York counties, and the cities of Fredericksburg, Hampton, and Newport News. The figures may understate the VA-1 district’s total exports to China because county-specific information for some products (e.g., mining, forestry, fishing, and waste and scrap) is not available.
$19$23
$33
$50 $52
$62
$78
$93$99
2000 2001 2002 2003 2004 2005 2006 2007 2008
Estimated Growth in Exports from Virginia’s 1st Congressional District, 2000–08
Exports to China: 436% Exports to Rest of World: 49%
Virginia's 1st Congressional District: Exports to China ($ million)
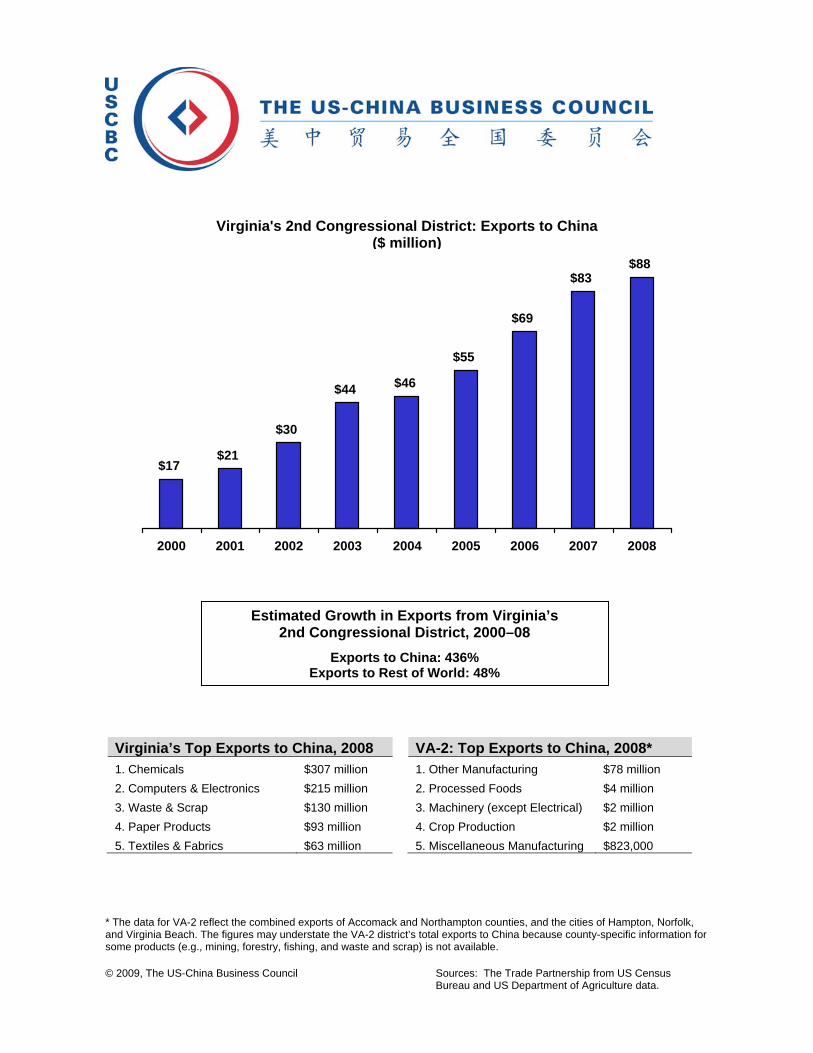
© 2009, The US-China Business Council
Sources: The Trade Partnership from US Census Bureau and US Department of Agriculture data.
Virginia’s Top Exports to China, 2008 VA-2: Top Exports to China, 2008* 1. Chemicals $307 million 1. Other Manufacturing $78 million
2. Computers & Electronics $215 million 2. Processed Foods $4 million
3. Waste & Scrap $130 million 3. Machinery (except Electrical) $2 million
4. Paper Products $93 million 4. Crop Production $2 million
5. Textiles & Fabrics $63 million 5. Miscellaneous Manufacturing $823,000 * The data for VA-2 reflect the combined exports of Accomack and Northampton counties, and the cities of Hampton, Norfolk, and Virginia Beach. The figures may understate the VA-2 district’s total exports to China because county-specific information for some products (e.g., mining, forestry, fishing, and waste and scrap) is not available.
$17$21
$30
$44 $46
$55
$69
$83$88
2000 2001 2002 2003 2004 2005 2006 2007 2008
Estimated Growth in Exports from Virginia’s 2nd Congressional District, 2000–08
Exports to China: 436% Exports to Rest of World: 48%
Virginia's 2nd Congressional District: Exports to China ($ million)

© 2009, The US-China Business Council
Sources: The Trade Partnership from US Census Bureau and US Department of Agriculture data.
Virginia’s Top Exports to China, 2008 VA-3: Top Exports to China, 2008* 1. Chemicals $307 million 1. Other Manufacturing $273 million
2. Computers & Electronics $215 million 2. Chemicals $20 million
3. Waste & Scrap $130 million 3. Paper Products $14 million
4. Paper Products $93 million 4. Machinery (except Electrical) $4 million
5. Textiles & Fabrics $63 million 5. Processed Foods $3 million * The data for VA-3 reflect the combined exports of Charles City, Henrico, New Kent, Prince George, and Surry counties, and the cities of Hampton, Newport News, Norfolk, Portsmouth, and Richmond. The figures may understate the VA-3 district’s total exports to China because county-specific information for some products (e.g., mining, forestry, fishing, and waste and scrap) is not available.
$60$74
$109$136
$155
$189
$252
$301$317
2000 2001 2002 2003 2004 2005 2006 2007 2008
Estimated Growth in Exports from Virginia’s 3rd Congressional District, 2000–08
Exports to China: 424% Exports to Rest of World: 43%
Virginia's 3rd Congressional District: Exports to China ($ million)
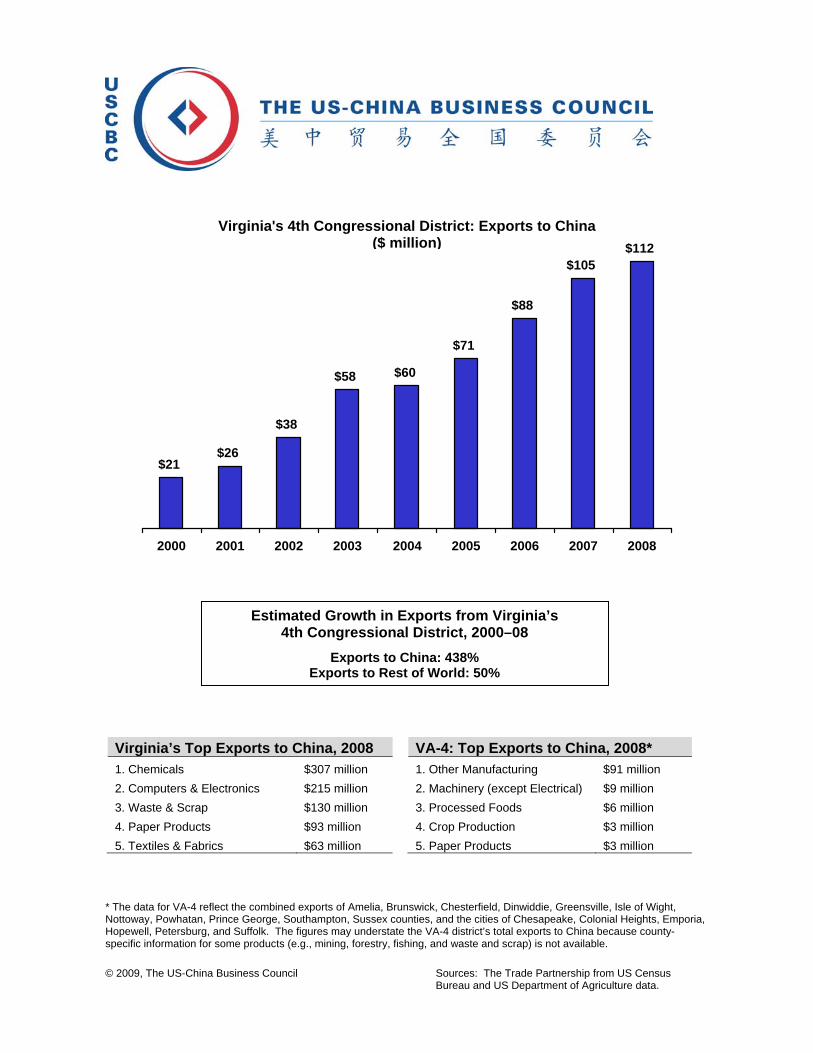
© 2009, The US-China Business Council
Sources: The Trade Partnership from US Census Bureau and US Department of Agriculture data.
Virginia’s Top Exports to China, 2008 VA-4: Top Exports to China, 2008* 1. Chemicals $307 million 1. Other Manufacturing $91 million
2. Computers & Electronics $215 million 2. Machinery (except Electrical) $9 million
3. Waste & Scrap $130 million 3. Processed Foods $6 million
4. Paper Products $93 million 4. Crop Production $3 million
5. Textiles & Fabrics $63 million 5. Paper Products $3 million * The data for VA-4 reflect the combined exports of Amelia, Brunswick, Chesterfield, Dinwiddie, Greensville, Isle of Wight, Nottoway, Powhatan, Prince George, Southampton, Sussex counties, and the cities of Chesapeake, Colonial Heights, Emporia, Hopewell, Petersburg, and Suffolk. The figures may understate the VA-4 district’s total exports to China because county-specific information for some products (e.g., mining, forestry, fishing, and waste and scrap) is not available.
$21$26
$38
$58 $60
$71
$88
$105$112
2000 2001 2002 2003 2004 2005 2006 2007 2008
Estimated Growth in Exports from Virginia’s 4th Congressional District, 2000–08
Exports to China: 438% Exports to Rest of World: 50%
Virginia's 4th Congressional District: Exports to China ($ million)

© 2009, The US-China Business Council
Sources: The Trade Partnership from US Census Bureau and US Department of Agriculture data.
Virginia’s Top Exports to China, 2008 VA-5: Top Exports to China, 2008* 1. Chemicals $307 million 1. Other Manufacturing $85 million
2. Computers & Electronics $215 million 2. Textiles & Fabrics $3 million
3. Waste & Scrap $130 million 3. Crop Production $3 million
4. Paper Products $93 million 4. Wood Products $1 million
5. Textiles & Fabrics $63 million 5. Publishing Industries $46,000 * The data for VA-5 reflect the combined exports of Albemarle, Appomattox, Bedford, Brunswick, Buckingham, Campbell, Charlotte, Cumberland, Fluvanna, Franklin, Greene, Halifax, Henry, Lunenburg, Mecklenburg, Nelson, Pittsylvania, and Prince Edward, and the cities of Bedford, Charlottesville, Danville, and Martinsville. The figures may understate the VA-5 district’s total exports to China because county-specific information for some products (e.g., mining, forestry, fishing, and waste and scrap) is not available.
$17$21
$31
$48 $49
$59
$72
$86$92
2000 2001 2002 2003 2004 2005 2006 2007 2008
Estimated Growth in Exports from Virginia’s 5th Congressional District, 2000–08
Exports to China: 440% Exports to Rest of World: 50%
Virginia's 5th Congressional District: Exports to China ($ million)

© 2009, The US-China Business Council
Sources: The Trade Partnership from US Census Bureau and US Department of Agriculture data.
Virginia’s Top Exports to China, 2008 VA-6: Top Exports to China, 2008* 1. Chemicals $307 million 1. Other Manufacturing $161 million
2. Computers & Electronics $215 million 2. Processed Foods $10 million
3. Waste & Scrap $130 million 3. Machinery (except Electrical) $3 million
4. Paper Products $93 million 4. Fabricated Metal Products $3 million
5. Textiles & Fabrics $63 million 5. Crop Production $1 million * The data for VA-6 reflect the combined exports of Alleghany, Amherst, Augusta, Bath, Bedford, Botetourt, Highland, Roanoke, Rockbridge, Rockingham, and Shenandoah counties, and the cities of Buena Vista, Covington, Harrisonburg, Lynchburg, Roanoke, Salem, and Waynesboro. The figures may understate the VA-6 district’s total exports to China because county-specific information for some products (e.g., mining, forestry, fishing, and waste and scrap) is not available.
$34$42
$61
$79$88
$107
$141
$169$178
2000 2001 2002 2003 2004 2005 2006 2007 2008
Estimated Growth in Exports from Virginia’s 6th Congressional District, 2000–08
Exports to China: 426% Exports to Rest of World: 44%
Virginia's 6th Congressional District: Exports to China ($ million)

© 2009, The US-China Business Council
Sources: The Trade Partnership from US Census Bureau and US Department of Agriculture data.
Virginia’s Top Exports to China, 2008 VA-7: Top Exports to China, 2008* 1. Chemicals $307 million 1. Other Manufacturing $221 million
2. Computers & Electronics $215 million 2. Chemicals $20 million
3. Waste & Scrap $130 million 3. Paper Products $17 million
4. Paper Products $93 million 4. Machinery (except Electrical) $4 million
5. Textiles & Fabrics $63 million 5. Crop Production $2 million * The data for VA-7 reflect the combined exports of Caroline, Chesterfield, Culpeper, Goochland, Hanover, Henrico, Louisa, Madison, Orange, Page, Rappahannock, and Spotsylvania counties, and the city of Richmond. The figures may understate the VA-7 district’s total exports to China because county-specific information for some products (e.g., mining, forestry, fishing, and waste and scrap) is not available.
$50$62
$91
$120$133
$161
$211
$251$266
2000 2001 2002 2003 2004 2005 2006 2007 2008
Estimated Growth in Exports from Virginia’s 7th Congressional District, 2000–08
Exports to China: 428% Exports to Rest of World: 45%
Virginia's 7th Congressional District: Exports to China ($ million)

© 2009, The US-China Business Council
Sources: The Trade Partnership from US Census Bureau and US Department of Agriculture data.
Virginia’s Top Exports to China, 2008 VA-8: Top Exports to China, 2008* 1. Chemicals $307 million 1. Computers & Electronics $27 million
2. Computers & Electronics $215 million 2. Processed Foods $1 million
3. Waste & Scrap $130 million 3. Publishing Industries $470,000
4. Paper Products $93 million 4. Miscellaneous Manufacturing $433,000
5. Textiles & Fabrics $63 million 5. Printing & Related Products $152,000 * The data for VA-8 reflect the combined exports of Arlington and Fairfax counties, and the cities of Alexandria and Falls Church. The figures may understate the VA-8 district’s total exports to China because county-specific information for some products (e.g., mining, forestry, fishing, and waste and scrap) is not available.
$3 $3 $4 $3 $4$7
$21
$40
$29
2000 2001 2002 2003 2004 2005 2006 2007 2008
Estimated Growth in Exports from Virginia’s 8th Congressional District, 2000–08
Exports to China: 1,048% Exports to Rest of World: 39%
Virginia's 8th Congressional District: Exports to China ($ million)

© 2009, The US-China Business Council
Sources: The Trade Partnership from US Census Bureau and US Department of Agriculture data.
Virginia’s Top Exports to China, 2008 VA-9: Top Exports to China, 2008* 1. Chemicals $307 million 1. Other Manufacturing $86 million
2. Computers & Electronics $215 million 2. Textiles & Fabrics $3 million
3. Waste & Scrap $130 million 3. Crop Production $2 million
4. Paper Products $93 million 4. Wood Products $1 million
5. Textiles & Fabrics $63 million 5. Fabricated Metal Products $447,000 * The data for VA-9 reflect the combined exports of Alleghany, Bland, Buchanan, Carroll, Craig, Dickenson, Floyd, Giles, Grayson, Henry, Lee, Montgomery, Patrick, Pulaski, Roanoke, Russell, Scott, Smyth, Tazewell, Washington, Wise, and Wythe counties, and the cities of Bristol, Covington, Galax, and Radford. The figures may understate the VA-9 district’s total exports to China because county-specific information for some products (e.g., mining, forestry, fishing, and waste and scrap) is not available.
$18$22
$32
$45$48
$58
$74
$88$93
2000 2001 2002 2003 2004 2005 2006 2007 2008
Estimated Growth in Exports from Virginia’s 9th Congressional District, 2000–08
Exports to China: 433% Exports to Rest of World: 47%
Virginia's 9th Congressional District: Exports to China ($ million)

© 2009, The US-China Business Council
Sources: The Trade Partnership from US Census Bureau and US Department of Agriculture data.
Virginia’s Top Exports to China, 2008 VA-10: Top Exports to China, 2008* 1. Chemicals $307 million 1. Computers & Electronics $36 million
2. Computers & Electronics $215 million 2. Other Manufacturing $10 million
3. Waste & Scrap $130 million 3. Plastics & Rubber Products $4 million
4. Paper Products $93 million 4. Processed Foods $3 million
5. Textiles & Fabrics $63 million 5. Crop Production $1 million * The data for VA-10 reflect the combined exports of Clarke, Fairfax, Fauquier, Frederick, Loudon, Prince William, and Warren counties, and the cities of Manassas and Winchester. The figures may understate the VA-10 district’s total exports to China because county-specific information for some products (e.g., mining, forestry, fishing, and waste and scrap) is not available.
$11$13
$19
$28$30
$36
$44
$53$57
2000 2001 2002 2003 2004 2005 2006 2007 2008
Estimated Growth in Exports from Virginia’s 10th Congressional District, 2000–08
Exports to China: 440% Exports to Rest of World: 48%
Virginia's 10th Congressional District: Exports to China ($ million)
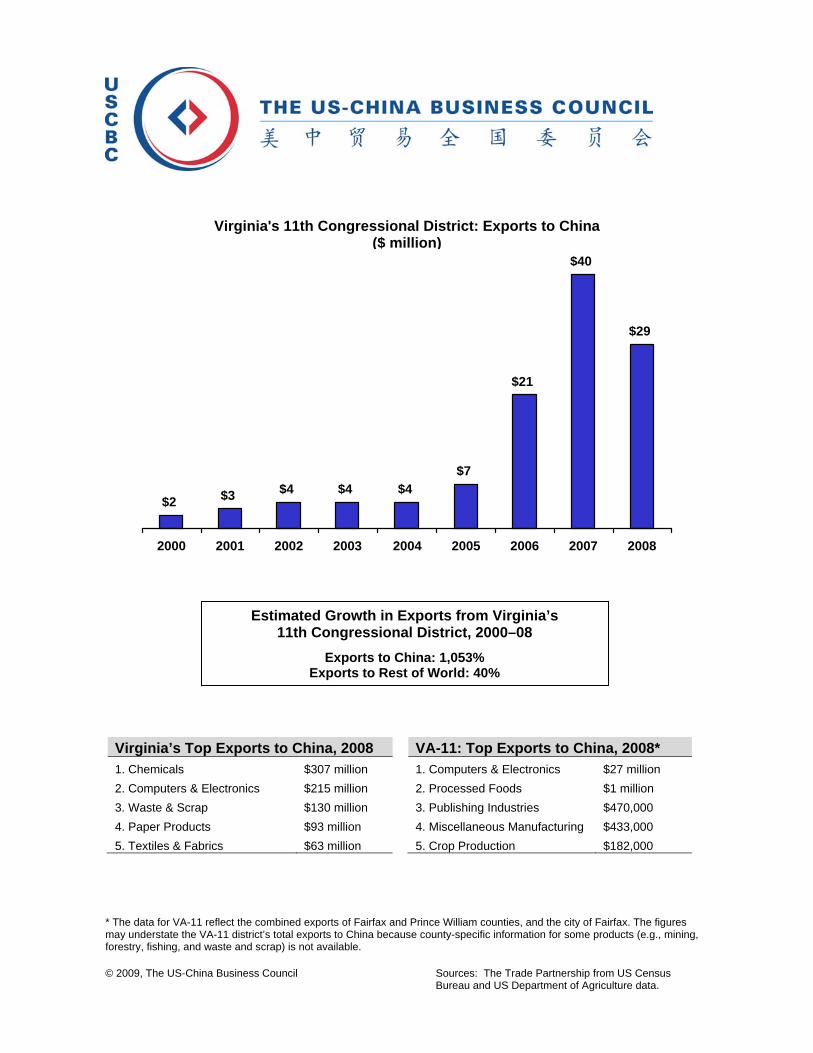
© 2009, The US-China Business Council
Sources: The Trade Partnership from US Census Bureau and US Department of Agriculture data.
Virginia’s Top Exports to China, 2008 VA-11: Top Exports to China, 2008* 1. Chemicals $307 million 1. Computers & Electronics $27 million
2. Computers & Electronics $215 million 2. Processed Foods $1 million
3. Waste & Scrap $130 million 3. Publishing Industries $470,000
4. Paper Products $93 million 4. Miscellaneous Manufacturing $433,000
5. Textiles & Fabrics $63 million 5. Crop Production $182,000 * The data for VA-11 reflect the combined exports of Fairfax and Prince William counties, and the city of Fairfax. The figures may understate the VA-11 district’s total exports to China because county-specific information for some products (e.g., mining, forestry, fishing, and waste and scrap) is not available.
$2 $3 $4 $4 $4$7
$21
$40
$29
2000 2001 2002 2003 2004 2005 2006 2007 2008
Estimated Growth in Exports from Virginia’s 11th Congressional District, 2000–08
Exports to China: 1,053% Exports to Rest of World: 40%
Virginia's 11th Congressional District: Exports to China ($ million)

© 2009, The US-China Business Council
Sources: The Trade Partnership from US Census Bureau and US Department of Agriculture data.
Washington’s Top Exports to China, 2008
WA-1: Top Exports to China, 2008*
1. Transportation Equipment $4.2 billion 1. Other Manufacturing $2.8 billion
2. Crop Production $4.1 billion 2. Computers & Electronics $222 million
3. Computers & Electronics $315 million 3. Crop Production $165 million
4. Waste & Scrap $275 million 4. Processed Foods $60 million
5. Processed Foods $171 million 5. Animal Production $9 million * The data for WA-1 reflect the combined exports of King, Kitsap, and Snohomish counties. The figures may understate the WA-1 district’s total exports to China because county-specific information for some products (e.g., mining, forestry, fishing, and waste and scrap) is not available.
$1,052
$1,479
$2,096
$1,330$1,174
$2,268
$3,309
$4,438
$3,295
2000 2001 2002 2003 2004 2005 2006 2007 2008
Estimated Growth in Exports from Washington’s 1st Congressional District, 2000–08
Exports to China: 213% Exports to Rest of World: 76%
Washington's 1st Congressional District: Exports to China ($ million)

© 2009, The US-China Business Council
Sources: The Trade Partnership from US Census Bureau and US Department of Agriculture data.
Washington’s Top Exports to China, 2008
WA-2: Top Exports to China, 2008*
1. Transportation Equipment $4.2 billion 1. Other Manufacturing $3.4 billion
2. Crop Production $4.1 billion 2. Crop Production $415 million
3. Computers & Electronics $315 million 3. Computers & Electronics $219 million
4. Waste & Scrap $275 million 4. Processed Foods $63 million
5. Processed Foods $171 million 5. Animal Production $26 million * The data for WA-2 reflect the combined exports of Island, King, San Juan, Skagit, Snohomish, and Whatcom counties. The figures may understate the WA-2 district’s total exports to China because county-specific information for some products (e.g., mining, forestry, fishing, and waste and scrap) is not available.
$1,242
$1,759
$2,484
$1,614$1,437
$2,722
$3,946
$5,324
$4,108
2000 2001 2002 2003 2004 2005 2006 2007 2008
Estimated Growth in Exports from Washington’s 2nd Congressional District, 2000–08
Exports to China: 231% Exports to Rest of World: 77%
Washington's 2nd Congressional District: Exports to China ($ million)

© 2009, The US-China Business Council
Sources: The Trade Partnership from US Census Bureau and US Department of Agriculture data.
Washington’s Top Exports to China, 2008
WA-3: Top Exports to China, 2008*
1. Transportation Equipment $4.2 billion 1. Other Manufacturing $379 million
2. Crop Production $4.1 billion 2. Crop Production $133 million
3. Computers & Electronics $315 million 3. Computers & Electronics $54 million
4. Waste & Scrap $275 million 4. Animal Production $14 million
5. Processed Foods $171 million 5. Paper Products $8 million * The data for WA-3 reflect the combined exports of Clark, Cowlitz, Lewis, Pacific, Skamania, Thurston, and Wahkiakum counties. The figures may understate the WA-3 district’s total exports to China because county-specific information for some products (e.g., mining, forestry, fishing, and waste and scrap) is not available.
$156
$226
$315
$219 $201
$360
$512
$701
$601
2000 2001 2002 2003 2004 2005 2006 2007 2008
Estimated Growth in Exports from Washington’s 3rd Congressional District, 2000–08
Exports to China: 284% Exports to Rest of World: 80%
Washington's 3rd Congressional District: Exports to China ($ million)

© 2009, The US-China Business Council
Sources: The Trade Partnership from US Census Bureau and US Department of Agriculture data.
Washington’s Top Exports to China, 2008
WA-4: Top Exports to China, 2008*
1. Transportation Equipment $4.2 billion 1. Crop Production $2.7 billion
2. Crop Production $4.1 billion 2. Other Manufacturing $327 million
3. Computers & Electronics $315 million 3. Animal Production $51 million
4. Waste & Scrap $275 million 4. Processed Foods $26 million
5. Processed Foods $171 million 5. Machinery (except Electrical) $7 million * The data for WA-4 reflect the combined exports of Adams, Benton, Chelan, Douglas, Franklin, Grant, Kittitas, Klickitat, Skamania, and Yakima counties. The figures may understate the WA-4 district’s total exports to China because county-specific information for some products (e.g., mining, forestry, fishing, and waste and scrap) is not available. Figures are rounded.
$201$437 $492
$764 $792$904
$1,043
$1,792
$3,071
2000 2001 2002 2003 2004 2005 2006 2007 2008
Estimated Growth in Exports from Washington’s 4th Congressional District, 2000–08
Exports to China: 1,426% Exports to Rest of World: 159%
Washington's 4th Congressional District: Exports to China ($ million)

© 2009, The US-China Business Council
Sources: The Trade Partnership from US Census Bureau and US Department of Agriculture data.
Washington’s Top Exports to China, 2008
WA-5: Top Exports to China, 2008*
1. Transportation Equipment $4.2 billion 1. Crop Production $744 million
2. Crop Production $4.1 billion 2. Other Manufacturing $208 million
3. Computers & Electronics $315 million 3. Computers & Electronics $23 million
4. Waste & Scrap $275 million 4. Machinery (except Electrical) $9 million
5. Processed Foods $171 million 5. Animal Production $9 million * The data for WA-5 reflect the combined exports of Adams, Asotin, Columbia, Ferry, Garfield, Lincoln, Okanogan, Pend Oreille, Spokane, Stevens, Walla Walla, and Whitman counties. The figures may understate the WA-5 district’s total exports to China because county-specific information for some products (e.g., mining, forestry, fishing, and waste and scrap) is not available.
$104$190
$234$273 $272
$354
$440
$701
$998
2000 2001 2002 2003 2004 2005 2006 2007 2008
Estimated Growth in Exports from Washington’s 5th Congressional District, 2000–08
Exports to China: 856% Exports to Rest of World: 121%
Washington's 5th Congressional District: Exports to China ($ million)

© 2009, The US-China Business Council
Sources: The Trade Partnership from US Census Bureau and US Department of Agriculture data.
Washington’s Top Exports to China, 2008
WA-6: Top Exports to China, 2008*
1. Transportation Equipment $4.2 billion 1. Other Manufacturing $334 million
2. Crop Production $4.1 billion 2. Crop Production $78 million
3. Computers & Electronics $315 million 3. Animal Production $10 million
4. Waste & Scrap $275 million 4. Processed Foods $9 million
5. Processed Foods $171 million 5. Wood Products $9 million * The data for WA-6 reflect the combined exports of Clallam, Grays Harbor, Jefferson, Kitsap, Mason, and Pierce counties. The figures may understate the WA-6 district’s total exports to China because county-specific information for some products (e.g., mining, forestry, fishing, and waste and scrap) is not available.
$127
$182
$255
$172 $156
$287
$411
$559
$459
2000 2001 2002 2003 2004 2005 2006 2007 2008
Estimated Growth in Exports from Washington’s 6th Congressional District, 2000–08
Exports to China: 261% Exports to Rest of World: 79%
Washington's 6th Congressional District: Exports to China ($ million)
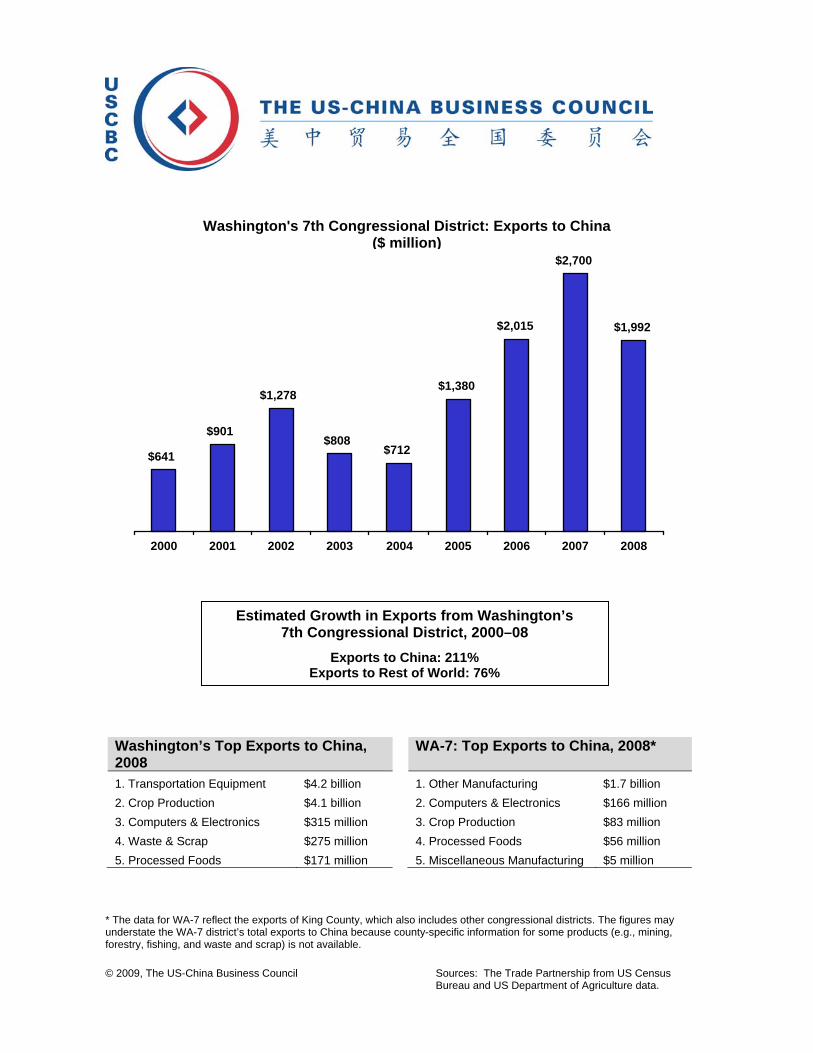
© 2009, The US-China Business Council
Sources: The Trade Partnership from US Census Bureau and US Department of Agriculture data.
Washington’s Top Exports to China, 2008
WA-7: Top Exports to China, 2008*
1. Transportation Equipment $4.2 billion 1. Other Manufacturing $1.7 billion
2. Crop Production $4.1 billion 2. Computers & Electronics $166 million
3. Computers & Electronics $315 million 3. Crop Production $83 million
4. Waste & Scrap $275 million 4. Processed Foods $56 million
5. Processed Foods $171 million 5. Miscellaneous Manufacturing $5 million * The data for WA-7 reflect the exports of King County, which also includes other congressional districts. The figures may understate the WA-7 district’s total exports to China because county-specific information for some products (e.g., mining, forestry, fishing, and waste and scrap) is not available.
$641
$901
$1,278
$808$712
$1,380
$2,015
$2,700
$1,992
2000 2001 2002 2003 2004 2005 2006 2007 2008
Estimated Growth in Exports from Washington’s 7th Congressional District, 2000–08
Exports to China: 211% Exports to Rest of World: 76%
Washington's 7th Congressional District: Exports to China ($ million)

© 2009, The US-China Business Council
Sources: The Trade Partnership from US Census Bureau and US Department of Agriculture data.
Washington’s Top Exports to China, 2008
WA-8: Top Exports to China, 2008*
1. Transportation Equipment $4.2 billion 1. Other Manufacturing $1.9 billion
2. Crop Production $4.1 billion 2. Computers & Electronics $166 million
3. Computers & Electronics $315 million 3. Crop Production $123 million
4. Waste & Scrap $275 million 4. Processed Foods $65 million
5. Processed Foods $171 million 5. Animal Production $7 million * The data for WA-8 reflect the combined exports of King and Pierce counties. The figures may understate the WA-8 district’s total exports to China because county-specific information for some products (e.g., mining, forestry, fishing, and waste and scrap) is not available.
$728
$1,024
$1,451
$922$815
$1,571
$2,291
$3,074
$2,289
2000 2001 2002 2003 2004 2005 2006 2007 2008
Estimated Growth in Exports from Washington’s 8th Congressional District, 2000–08
Exports to China: 215% Exports to Rest of World: 76%
Washington's 8th Congressional District: Exports to China ($ million)

© 2009, The US-China Business Council
Sources: The Trade Partnership from US Census Bureau and US Department of Agriculture data.
Washington’s Top Exports to China, 2008
WA-9: Top Exports to China, 2008*
1. Transportation Equipment $4.2 billion 1. Other Manufacturing $1.9 billion
2. Crop Production $4.1 billion 2. Crop Production $180 million
3. Computers & Electronics $315 million 3. Computers & Electronics $166 million
4. Waste & Scrap $275 million 4. Processed Foods $65 million
5. Processed Foods $171 million 5. Animal Production $11 million * The data for WA-9 reflect the combined exports of King, Pierce, and Thurston counties. The figures may understate the WA-9 district’s total exports to China because county-specific information for some products (e.g., mining, forestry, fishing, and waste and scrap) is not available.
$746
$1,052
$1,489
$955$847
$1,621
$2,357
$3,170
$2,399
2000 2001 2002 2003 2004 2005 2006 2007 2008
Estimated Growth in Exports from Washington’s 9th Congressional District, 2000–08
Exports to China: 222% Exports to Rest of World: 77%
Washington's 9th Congressional District: Exports to China ($ million)
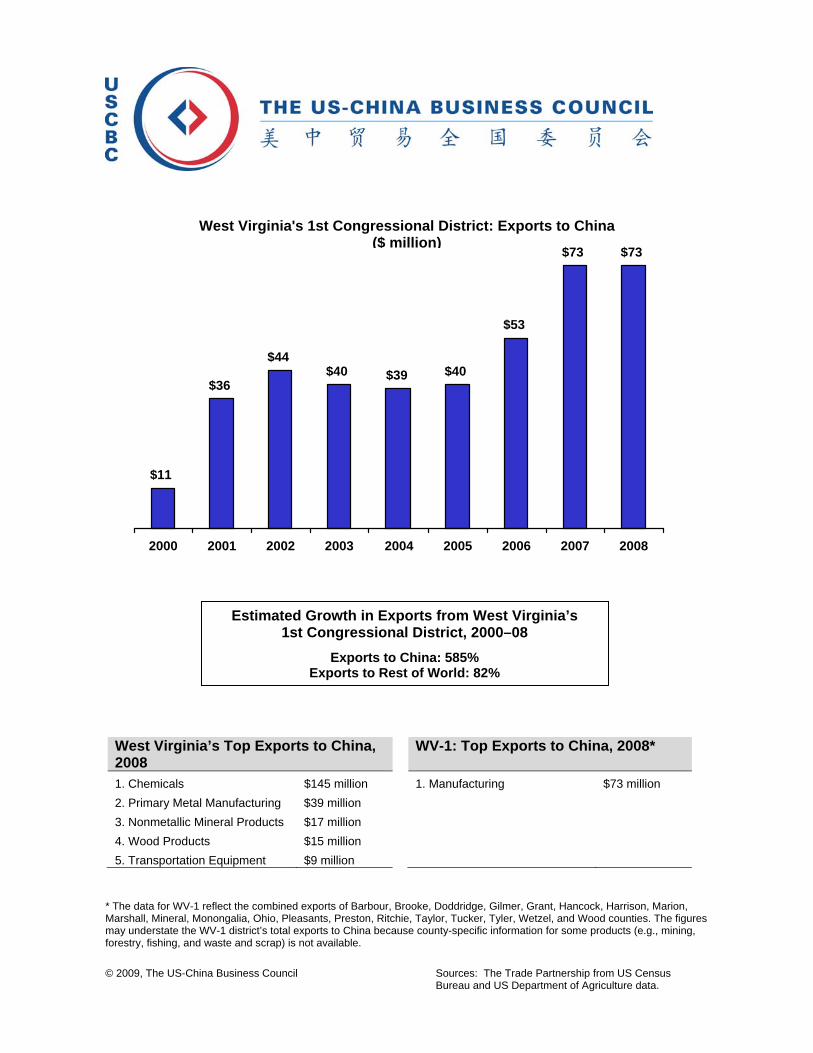
© 2009, The US-China Business Council
Sources: The Trade Partnership from US Census Bureau and US Department of Agriculture data.
West Virginia’s Top Exports to China, 2008
WV-1: Top Exports to China, 2008*
1. Chemicals $145 million 1. Manufacturing $73 million
2. Primary Metal Manufacturing $39 million
3. Nonmetallic Mineral Products $17 million
4. Wood Products $15 million
5. Transportation Equipment $9 million * The data for WV-1 reflect the combined exports of Barbour, Brooke, Doddridge, Gilmer, Grant, Hancock, Harrison, Marion, Marshall, Mineral, Monongalia, Ohio, Pleasants, Preston, Ritchie, Taylor, Tucker, Tyler, Wetzel, and Wood counties. The figures may understate the WV-1 district’s total exports to China because county-specific information for some products (e.g., mining, forestry, fishing, and waste and scrap) is not available.
$11
$36
$44$40 $39 $40
$53
$73 $73
2000 2001 2002 2003 2004 2005 2006 2007 2008
Estimated Growth in Exports from West Virginia’s 1st Congressional District, 2000–08
Exports to China: 585% Exports to Rest of World: 82%
West Virginia's 1st Congressional District: Exports to China ($ million)

© 2009, The US-China Business Council
Sources: The Trade Partnership from US Census Bureau and US Department of Agriculture data.
West Virginia’s Top Exports to China, 2008
WV-2: Top Exports to China, 2008*
1. Chemicals $145 million 1. Other Manufacturing $71 million
2. Primary Metal Manufacturing $39 million 2. Nonmetallic Mineral Products $4 million
3. Nonmetallic Mineral Products $17 million 3. Wood Products $2 million
4. Wood Products $15 million
5. Transportation Equipment $9 million * The data for WV-2 reflect the combined exports of Berkeley, Braxton, Calhoun, Clay, Hampshire, Hardy, Jackson, Jefferson, Kanawha, Lewis, Mason, Morgan, Pendleton, Putnam, Randolph, Roane, Upshur, and Wirt counties. The figures may understate the WV-2 district’s total exports to China because county-specific information for some products (e.g., mining, forestry, fishing, and waste and scrap) is not available.
$11
$39$46
$42 $41 $43
$56
$78 $77
2000 2001 2002 2003 2004 2005 2006 2007 2008
Estimated Growth in Exports from West Virginia’s 2nd Congressional District, 2000–08
Exports to China: 583% Exports to Rest of World: 82%
West Virginia's 2nd Congressional District: Exports to China ($ million)

© 2009, The US-China Business Council
Sources: The Trade Partnership from US Census Bureau and US Department of Agriculture data.
West Virginia’s Top Exports to China, 2008
WV-3: Top Exports to China, 2008*
1. Chemicals $145 million 1. Manufacturing $31 million
2. Primary Metal Manufacturing $39 million
3. Nonmetallic Mineral Products $17 million
4. Wood Products $15 million
5. Transportation Equipment $9 million * The data for WV-3 reflect the combined exports of Boone, Cabell, Fayette, Greenbrier, Lincoln, Logan, McDowell, Mercer, Mingo, Monroe, Nicholas, Pocahontas, Raleigh, Summers, Wayne, Webster, and Wyoming counties. The figures may understate the WV-3 district’s total exports to China because county-specific information for some products (e.g., mining, forestry, fishing, and waste and scrap) is not available.
$4
$15
$18 $17$16
$17
$22
$31 $31
2000 2001 2002 2003 2004 2005 2006 2007 2008
Estimated Growth in Exports from West Virginia’s 3rd Congressional District, 2000–08
Exports to China: 584% Exports to Rest of World: 82%
West Virginia's 3rd Congressional District: Exports to China ($ million)

© 2009, The US-China Business Council
Sources: The Trade Partnership from US Census Bureau and US Department of Agriculture data.
Wisconsin’s Top Exports to China, 2008
WI-1: Top Exports to China, 2008*
1. Machinery (except Electrical) $434 million 1. Machinery (except Electrical) $160 million
2. Computers & Electronics $215 million 2. Computers & Electronics $113 million
3. Transportation Equipment $118 million 3. Other Manufacturing $62 million
4. Waste & Scrap $113 million 4. Fabricated Metal Products $24 million
5. Fabricated Metal Products $63 million 5. Electrical Equipment $20 million
* The data for WI-1 reflect the combined exports of Kenosha, Milwaukee, Racine, Rock, Walworth, and Waukesha counties. The figures may understate the WI-1 district’s total exports to China because county-specific information for some products (e.g., mining, forestry, fishing, and waste and scrap) is not available.
$66
$119 $127
$186$215
$249
$305
$414 $421
2000 2001 2002 2003 2004 2005 2006 2007 2008
Estimated Growth in Exports from Wisconsin’s 1st Congressional District, 2000–08
Exports to China: 537% Exports to Rest of World: 87%
Wisconsin's 1st Congressional District: Exports to China ($ million)

© 2009, The US-China Business Council
Sources: The Trade Partnership from US Census Bureau and US Department of Agriculture data.
Wisconsin’s Top Exports to China, 2008
WI-2: Top Exports to China, 2008*
1. Machinery (except Electrical) $434 million 1. Other Manufacturing $168 million
2. Computers & Electronics $215 million 2. Machinery (except Electrical) $35 million
3. Transportation Equipment $118 million 3. Fabricated Metal Products $7 million
4. Waste & Scrap $113 million 4. Processed Foods $6 million
5. Fabricated Metal Products $63 million 5. Transportation Equipment $4 million
* The data for WI-2 reflect the combined exports of Columbia, Dane, Green, Jefferson, Rock, Sauk, and Walworth counties. The figures may understate the WI-2 district’s total exports to China because county-specific information for some products (e.g., mining, forestry, fishing, and waste and scrap) is not available.
$36
$64 $69
$107$117
$134
$165
$225 $228
2000 2001 2002 2003 2004 2005 2006 2007 2008
Estimated Growth in Exports from Wisconsin’s 2nd Congressional District, 2000–08
Exports to China: 531% Exports to Rest of World: 85%
Wisconsin's 2nd Congressional District: Exports to China ($ million)
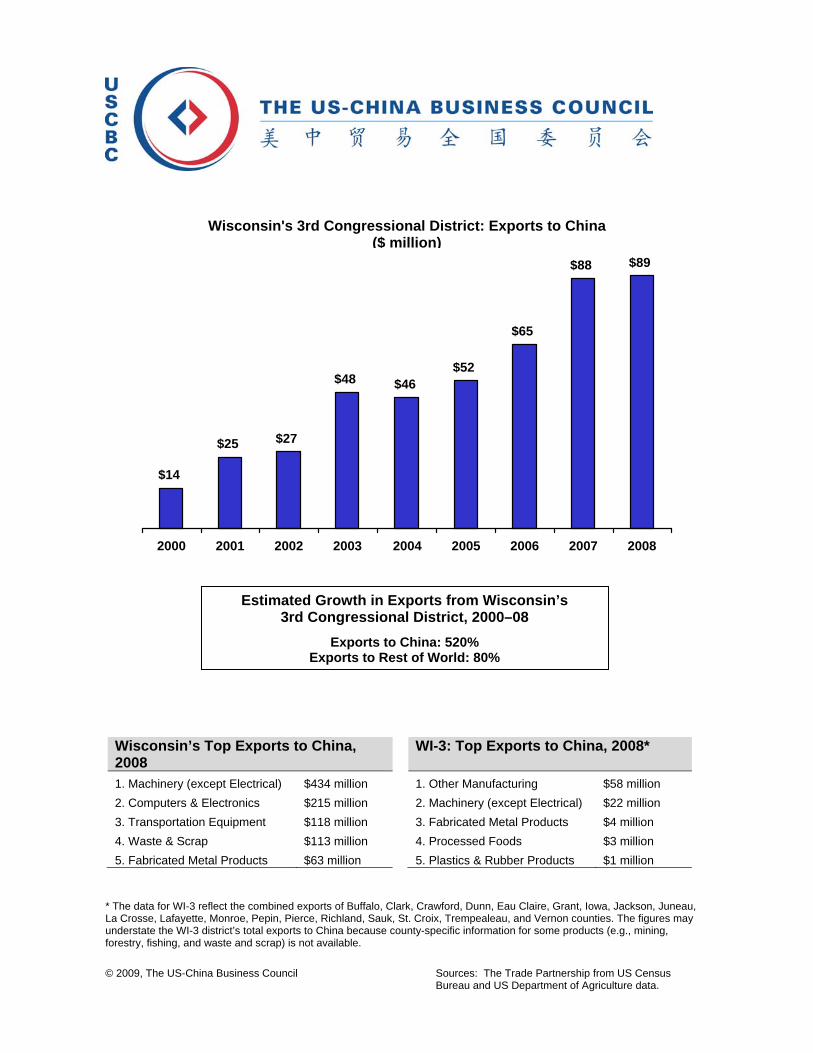
© 2009, The US-China Business Council
Sources: The Trade Partnership from US Census Bureau and US Department of Agriculture data.
Wisconsin’s Top Exports to China, 2008
WI-3: Top Exports to China, 2008*
1. Machinery (except Electrical) $434 million 1. Other Manufacturing $58 million
2. Computers & Electronics $215 million 2. Machinery (except Electrical) $22 million
3. Transportation Equipment $118 million 3. Fabricated Metal Products $4 million
4. Waste & Scrap $113 million 4. Processed Foods $3 million
5. Fabricated Metal Products $63 million 5. Plastics & Rubber Products $1 million
* The data for WI-3 reflect the combined exports of Buffalo, Clark, Crawford, Dunn, Eau Claire, Grant, Iowa, Jackson, Juneau, La Crosse, Lafayette, Monroe, Pepin, Pierce, Richland, Sauk, St. Croix, Trempealeau, and Vernon counties. The figures may understate the WI-3 district’s total exports to China because county-specific information for some products (e.g., mining, forestry, fishing, and waste and scrap) is not available.
$14
$25 $27
$48 $46$52
$65
$88 $89
2000 2001 2002 2003 2004 2005 2006 2007 2008
Estimated Growth in Exports from Wisconsin’s 3rd Congressional District, 2000–08
Exports to China: 520% Exports to Rest of World: 80%
Wisconsin's 3rd Congressional District: Exports to China ($ million)

© 2009, The US-China Business Council
Sources: The Trade Partnership from US Census Bureau and US Department of Agriculture data.
Wisconsin’s Top Exports to China, 2008
WI-4: Top Exports to China, 2008*
1. Machinery (except Electrical) $434 million 1. Computers & Electronics $55 million
2. Computers & Electronics $215 million 2. Machinery (except Electrical) $51 million
3. Transportation Equipment $118 million 3. Electrical Equipment $13 million
4. Waste & Scrap $113 million 4. Fabricated Metal Products $12 million
5. Fabricated Metal Products $63 million 5. Chemicals $7 million
* The data for WI-4 reflect the exports of Milwaukee County, which also includes other congressional districts. The figures may understate the WI-4 district’s total exports to China because county-specific information for some products (e.g., mining, forestry, fishing, and waste and scrap) is not available.
$29
$59 $56
$86 $91$105
$129
$162$153
2000 2001 2002 2003 2004 2005 2006 2007 2008
Estimated Growth in Exports from Wisconsin’s 4th Congressional District, 2000–08
Exports to China: 428% Exports to Rest of World: 88%
Wisconsin's 4th Congressional District: Exports to China ($ million)

© 2009, The US-China Business Council
Sources: The Trade Partnership from US Census Bureau and US Department of Agriculture data.
Wisconsin’s Top Exports to China, 2008
WI-5: Top Exports to China, 2008*
1. Machinery (except Electrical) $434 million 1. Machinery (except Electrical) $136 million
2. Computers & Electronics $215 million 2. Computers & Electronics $108 million
3. Transportation Equipment $118 million 3. Fabricated Metal Products $26 million
4. Waste & Scrap $113 million 4. Electrical Equipment $13 million
5. Fabricated Metal Products $63 million 5. Primary Metal Manufacturing $10 million
* The data for WI-5 reflect the combined exports of Jefferson, Milwaukee, Ozaukee, Washington, and Waukesha counties. The figures may understate the WI-5 district’s total exports to China because county-specific information for some products (e.g., mining, forestry, fishing, and waste and scrap) is not available.
$58
$118 $114
$177 $188$217
$268
$354$326
2000 2001 2002 2003 2004 2005 2006 2007 2008
Estimated Growth in Exports from Wisconsin’s 5th Congressional District, 2000–08
Exports to China: 460% Exports to Rest of World: 86%
Wisconsin's 5th Congressional District: Exports to China ($ million)

© 2009, The US-China Business Council
Sources: The Trade Partnership from US Census Bureau and US Department of Agriculture data.
Wisconsin’s Top Exports to China, 2008
WI-6: Top Exports to China, 2008*
1. Machinery (except Electrical) $434 million 1. Other Manufacturing $116 million
2. Computers & Electronics $215 million 2. Machinery (except Electrical) $82 million
3. Transportation Equipment $118 million 3. Fabricated Metal Products $12 million
4. Waste & Scrap $113 million 4. Processed Foods $8 million
5. Fabricated Metal Products $63 million 5. Transportation Equipment $7 million
* The data for WI-6 reflect the combined exports of Adams, Calumet, Dodge, Fond du Lac, Green Lake, Jefferson, Manitowoc, Marquette, Outagamie, Sheboygan, Waushara, and Winnebago counties. The figures may understate the WI-6 district’s total exports to China because county-specific information for some products (e.g., mining, forestry, fishing, and waste and scrap) is not available.
$39
$69 $74
$116$126
$145
$178
$242 $245
2000 2001 2002 2003 2004 2005 2006 2007 2008
Estimated Growth in Exports from Wisconsin’s 6th Congressional District, 2000–08
Exports to China: 531% Exports to Rest of World: 85%
Wisconsin's 6th Congressional District: Exports to China ($ million)

© 2009, The US-China Business Council
Sources: The Trade Partnership from US Census Bureau and US Department of Agriculture data.
Wisconsin’s Top Exports to China, 2008
WI-7: Top Exports to China, 2008*
1. Machinery (except Electrical) $434 million 1. Other Manufacturing $104 million
2. Computers & Electronics $215 million 2. Processed Foods $6 million
3. Transportation Equipment $118 million 3. Machinery (except Electrical) $6 million
4. Waste & Scrap $113 million 4. Wood Products $3 million
5. Fabricated Metal Products $63 million 5. Fabricated Metal Products $2 million * The data for WI-7 reflect the combined exports of Ashland, Barron, Bayfield, Burnett, Chippewa, Clark, Douglas, Iron, Langlade, Lincoln, Marathon, Oneida, Polk, Portage, Price, Rusk, Sawyer, Taylor, Washburn, and Wood counties. The figures may understate the WI-7 district’s total exports to China because county-specific information for some products (e.g., mining, forestry, fishing, and waste and scrap) is not available.
$20
$35 $38
$62 $64$74
$91
$124 $125
2000 2001 2002 2003 2004 2005 2006 2007 2008
Estimated Growth in Exports from Wisconsin’s 7th Congressional District, 2000–08
Exports to China: 528% Exports to Rest of World: 83%
Wisconsin's 7th Congressional District: Exports to China ($ million)

© 2009, The US-China Business Council
Sources: The Trade Partnership from US Census Bureau and US Department of Agriculture data.
Wisconsin’s Top Exports to China, 2008
WI-8: Top Exports to China, 2008*
1. Machinery (except Electrical) $434 million 1. Other Manufacturing $133 million
2. Computers & Electronics $215 million 2. Machinery (except Electrical) $22 million
3. Transportation Equipment $118 million 3. Processed Foods $5 million
4. Waste & Scrap $113 million 4. Plastics & Rubber Products $1 million
5. Fabricated Metal Products $63 million 5. Transportation Equipment $531,000 * The data for WI-8 reflect the combined exports of Brown, Calumet, Door, Florence, Forest, Kewaunee, Langlade, Marinette, Menominee, Oconto, Oneida, Outagamie, Shawano, Vilas, and Waupaca counties. The figures may understate the WI-8 district’s total exports to China because county-specific information for some products (e.g., mining, forestry, fishing, and waste and scrap) is not available.
$26
$46 $49
$75$83
$96
$118
$160 $162
2000 2001 2002 2003 2004 2005 2006 2007 2008
Estimated Growth in Exports from Wisconsin’s 8th Congressional District, 2000–08
Exports to China: 533% Exports to Rest of World: 86%
Wisconsin's 8th Congressional District: Exports to China ($ million)

© 2009, The US-China Business Council Source: US Department of Commerce
Wyoming’s Top Exports to China, 2008* 1. Chemicals $2 million
2. Machinery (except Electrical) $2 million
3. Transportation Equipment $1 million
4. Electrical Equipment $339,000
5. Computers & Electronics $286,000
*The data for Wyoming’s at-large congressional district reflect the combined exports of the entire state.
Wyoming's At-Large Congressional District: Exports to China ($ million)
$11
$25
$21
$14 $15 $16
$20
$6$7
2000 2001 2002 2003 2004 2005 2006 2007 2008
Estimated Growth in Exports from Wyoming, 2000–08
Exports to China: - 45% Exports to Rest of World: 119%