is china becoming a high tech superpower ? of chinese manufacturing exports by sector, 2000-2004...
TRANSCRIPT
2006 Tokyo Club Macro Conference
Is China Becoming Is China Becoming a High Tech Superpower ?a High Tech Superpower ?
The Contrasted Picture of ChinaThe Contrasted Picture of China’’s s Scientific and Technological CapabilitiesScientific and Technological Capabilities
Frédérique SachwaldIfri

Introduction 1.Introduction 1.
Since 2000, prominence of emerging countries in world trade, in particular China.Inroads of emerging countries in export markets that had long been the preserve of advanced countries: electronics (China), IT services (India), cars (Eastern Europe).
Fears that emerging countries and China in particular are rapidly becoming technological powers and that the leadership (US) or growth potential of advanced countries (Europe) may be threatened.
F. Sachwald, Tokyo Club 6-7 Dec. 2006
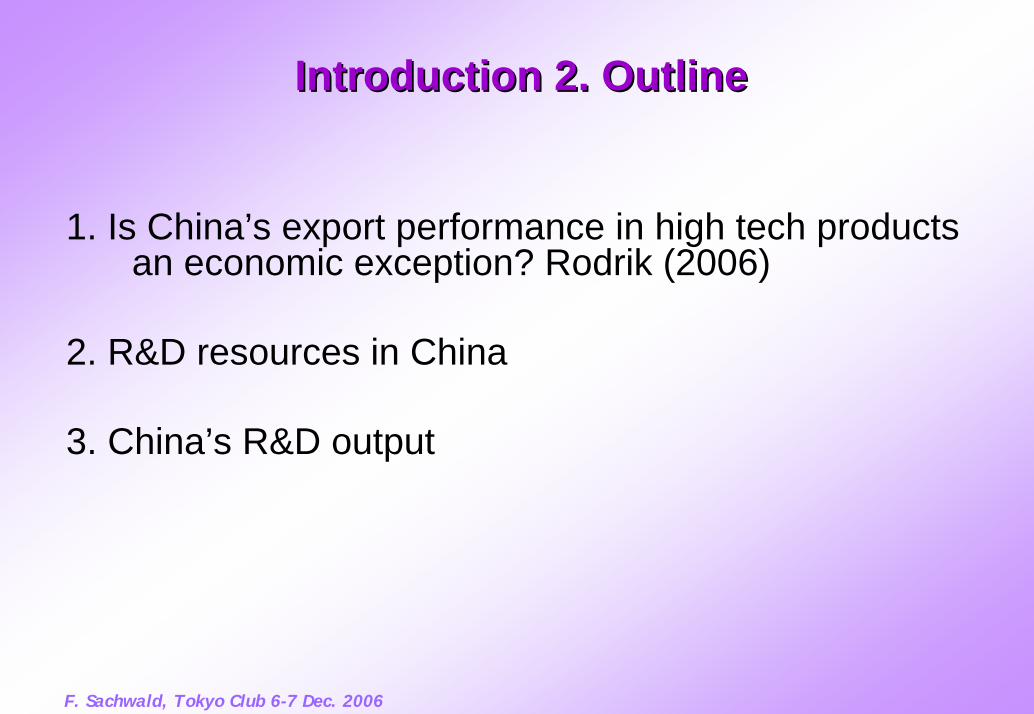
Introduction 2. OutlineIntroduction 2. Outline
1. Is China’s export performance in high tech products an economic exception? Rodrik (2006)
2. R&D resources in China
3. China’s R&D output
F. Sachwald, Tokyo Club 6-7 Dec. 2006

Is China (really) a Large Exporter of High Tech Products ?

Main Main Exporters Exporters of ICT, $bnof ICT, $bn
Source : SYSPROD-IFRI
0
20
40
60
80
100
120
140
160
180
1993 1994 1995 1996 1997 1998 1999 2000 2001 2002 2003 2004 2005
Germany China Korea France Japan UK U.S.
F. Sachwald, Tokyo Club 6-7 Dec. 2006

ICT ICT Trade Trade Balance of China, $ millionBalance of China, $ million
-75 000
-60 000
-45 000
-30 000
-15 000
0
15 000
30 000
45 000
60 000
75 000
Computerequipment
Telecom & TVequipment
Electroniccomponents
Other ICT goods
1992 2001 2005
Source : SYSPROD-IFRI
F. Sachwald, Tokyo Club 6-7 Dec. 2006

Geographical Geographical Distribution of ChinaDistribution of China ’’ss TradeTradeBalance ICT Balance ICT productsproducts, $ million 2005, $ million 2005
-10000
-5000
0
5000
10000
15000
20000
25000
30000
35000
Computer equipment Telecom & TV equipment Electronic components
ThailandKoreaSingaporeMalaysiaUKFranceJapanU.S.
97% 78 / 91% 92%
F. Sachwald, Tokyo Club 6-7 Dec. 2006Source : SYSPROD-IFRI

Main Main Exporters Exporters of of High High Tech Manufactures, $bnTech Manufactures, $bn
0
50
100
150
200
250
300
1993 1994 1995 1996 1997 1998 1999 2000 2001 2002 2003 2004 2005
Germany China Korea France Japan UK U.S.Source : SYSPROD-IFRI
F. Sachwald, Tokyo Club 6-7 Dec. 2006
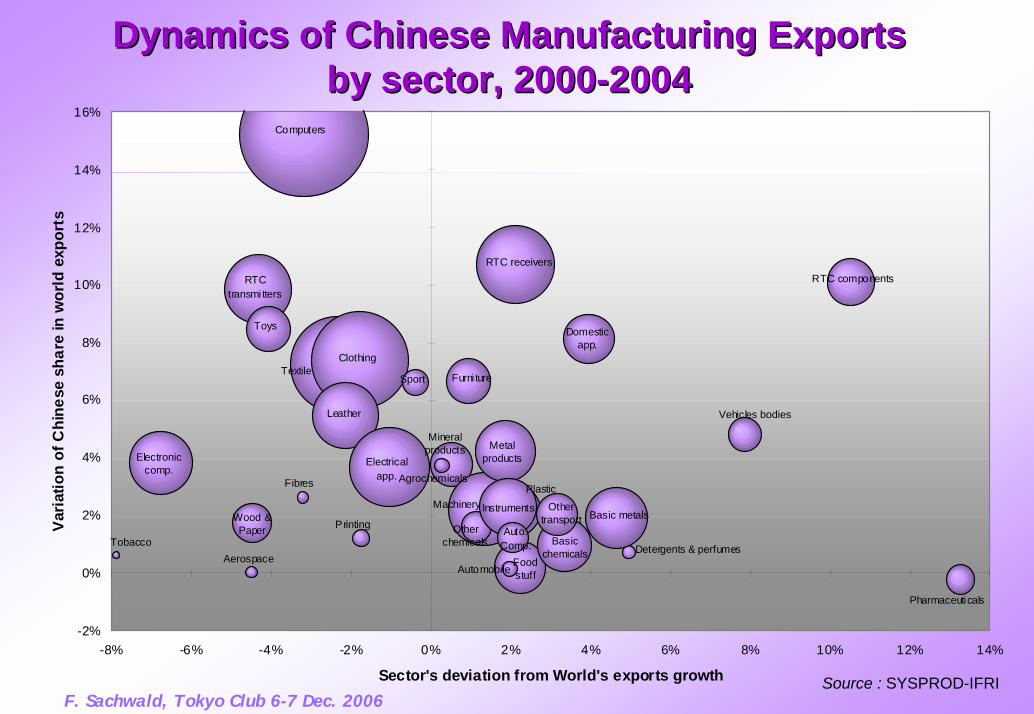
Dynamics Dynamics of of Chinese Manufacturing Chinese Manufacturing Exports Exports by by sectorsector, 2000, 2000--20042004
Food stuff
Tobacco
TextileClothing
Leather
Wood & Paper Printing
Basic chemicals
Mineral products
Pharmaceuticals
Detergents & perfumes
Machinery
Fibres PlasticAgrochemicals
Basic metals
Metal products
Other chemicals
Domestic app.
Computers
Electrical app.
RTC components
Electronic comp.
RTC transmitters
RTC receivers
Instruments
Automobile
Vehicles bodies
Auto. Comp.
Other transport
Aerospace
Furni tureSport
Toys
-2%
0%
2%
4%
6%
8%
10%
12%
14%
16%
-8% -6% -4% -2% 0% 2% 4% 6% 8% 10% 12% 14%
Sector's deviation from World's exports growth
Varia
tion
of C
hine
se s
hare
in w
orld
exp
orts
Source : SYSPROD-IFRIF. Sachwald, Tokyo Club 6-7 Dec. 2006

HighHigh Tech Exports as a Tech Exports as a ShareShare of of Manufactured Manufactured Exports, in %Exports, in %
10.0
15.0
20.0
25.0
30.0
35.0
40.0
1990 1991 1992 1993 1994 1995 1996 1997 1998 1999 2000 2001 2002 2003 2004 2005
EU15 China Korea Japan U.S.
F. Sachwald, Tokyo Club 6-7 Dec. 2006 Source : SYSPROD-IFRI

Contribution of Contribution of HighHigh Tech Industries to the Tech Industries to the Trade Trade Balance, as % of Balance, as % of Manufacturing TradeManufacturing Trade, 2005, 2005
F. Sachwald, Tokyo Club 6-7 Dec. 2006
-32
-24
-16
-8
0
8
16
24
32
UK
U.S
.
Sout
h K
orea
Taiw
an*
Fran
ce
Japa
n
Chin
a
Ger
man
y
Ital
y
Low technology Mid-low technology Mid-high technology High technology
Source : SYSPROD-IFRI
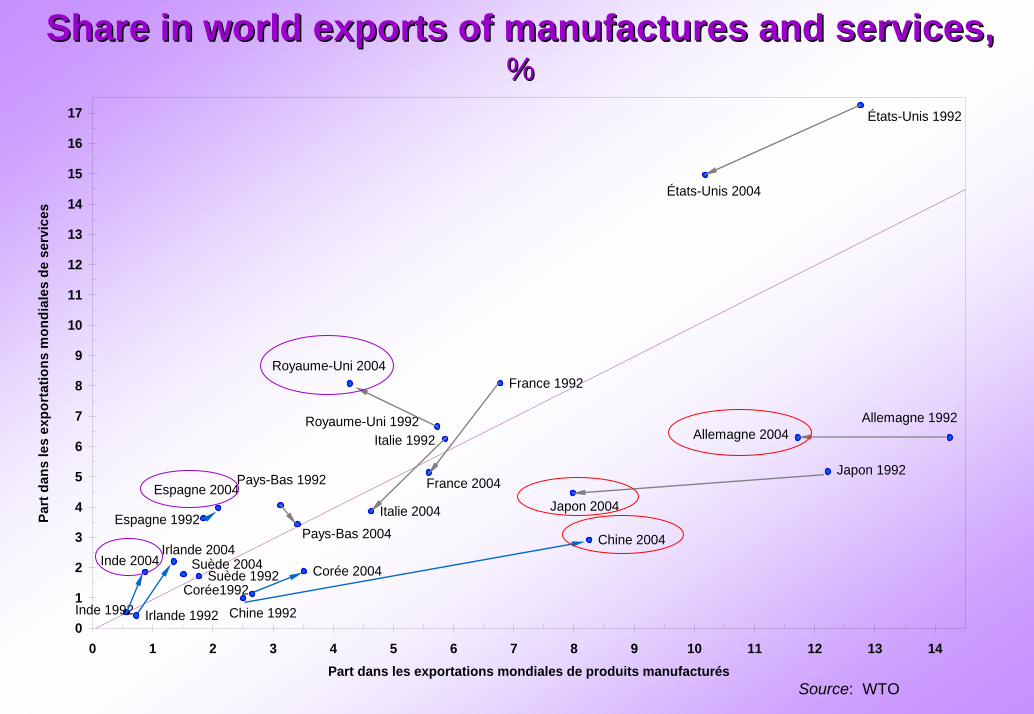
ShareShare in in worldworld exports exports ofof manufactures manufactures andand services,services,%%
États-Unis 2004
Royaume-Uni 2004
Suède 2004
Espagne 2004
Pays-Bas 2004
Corée 2004
Japon 2004Italie 2004
Irlande 2004Inde 2004
Allemagne 2004
France 2004
Chine 2004
États-Unis 1992
Royaume-Uni 1992
Suède 1992
Espagne 1992
Pays-Bas 1992
Corée1992
Japon 1992
Italie 1992
Irlande 1992Inde 1992
Allemagne 1992
France 1992
Chine 19920
1
2
3
4
5
6
7
8
9
10
11
12
13
14
15
16
17
0 1 2 3 4 5 6 7 8 9 10 11 12 13 14Part dans les exportations mondiales de produits manufacturés
Part
dan
s le
s ex
port
atio
ns m
ondi
ales
de
serv
ices
Source: WTO

Contribution ofContribution of HighHigh Tech Industries to theTech Industries to the TradeTradeBalance, as % ofBalance, as % of Manufacturing TradeManufacturing Trade, 1992, 1992--20052005
Source : SYSPROD-IFRI
-10
-5
0
5
10
15
UK U.S
.
Kor
ea
Taiw
an*
Fran
ce
Japa
n
Chin
a
Ger
man
y
Italy
2005 2001 1992
F. Sachwald, Tokyo Club 6-7 Dec. 2006

R&D Resources in China
- R&D Spending and Researchers- Tertiary Education

R&D Resources and IntensityR&D Resources and Intensity
Source : OECD
F. Sachwald, EPFL 23-24 oct. 2006
GERD 2004Million PPP$
GERD as a% of GDP1
Number ofresearchers
2003
Researchersper 000
employment2
US 312,535.4 2.68 1,334,628 9.6Japan 112,714.7 3.15 675,330 10.4China 102,622.9 1.44 926,252 1.2Germany 58,687.6 2.49 268,943 6.9France 39,740.3 2.16 192,790 7.7UK 33,705.7 1.88 157,662 n.a.Korea 24,273.7 2.63 151,254 6.8Canada 19,326.5 1.93 112,624 7.2Russia 16,457.8 1.29 477,647 7.1Taiwan 13,493.6 2.45 67,599 7.1Spain 11,071.8 1.05 92,523 5.2Sweden 10,340.0 3.98 47,836 11.0Australia 9,608.6 1.69 73,344 7.8

Students Enrolled in Tertiary Education, 2004Students Enrolled in Tertiary Education, 2004
CountryTotal enrolment
in tertiary educationTertiary studentsper 100,000 hab.
China 19,417,044 1,494United States 16,900,471 5,776India 11,852,936 1,107Japan 4,031,604 3,146Mexico 2,322,781 2,226United Kingdom 2,247,441 3,791Germany 2,185,224 2,660France 2,160,300 3,600
Source : UNESCO
F. Sachwald, Tokyo Club 6-7 Dec. 2006

The Supply Paradox:The Supply Paradox:Comparing Tertiary Education AttainmentComparing Tertiary Education Attainment
- Comparing degrees Bachelor degrees in Engineering, Computer science, Electrical and IT: 644,100 in China, 215,000 in India, 222,300 in the U.S.
(Gereffi and Wadhwa 2006)
- Employability Surveys and interviews with multinational companies hiring engineers in China
- Lower educational attainment than East Asian countries Bosworth and Collins (Tokyo Club contribution)
F. Sachwald, Tokyo Club 6-7 Dec. 2006

Assessment of China’s R&D Output and Overall S&T Capabilities

World Share of Scientific Publications, in %World Share of Scientific Publications, in %
Korea France China FRG UK Japan USA EU-151993 0.18 5.98 1.69 7.45 8.89 8.19 34.73 33.781994 0.58 5.99 1.70 7.54 8.97 8.57 33.66 34.121997 1.16 6.31 2.66 8.32 8.73 8.98 31.94 35.722000 1.76 6.31 3.89 8.69 9.22 9.49 30.93 36.552003 2.43 6.10 5.51 8.35 8.46 9.40 30.68 35.962004 2.70 5.81 6.52 8.11 8.33 8.81 30.18 35.18
Source : Zhou and Leydesdorff (2006)
F. Sachwald, Tokyo Club 6-7 Dec. 2006

RankingRanking of Countries for of Countries for ScientificScientific Publications Publications andand Citations, 2003Citations, 2003
Rank Country Number of papers Average citations perpaper
1 United States 2,705,652 122 Japan 713,542 73 Germany 655,586 94 United Kingdom 598,470 105 France 484,291 96 Canada 358,007 107 Italy 310,557 88 Russia 285,856 39 China 236,996 310 Australia 211,549 816 South Korea 111,406 4
Source : Seong et al. (2005)
F. Sachwald, Tokyo Club 6-7 Dec. 2006
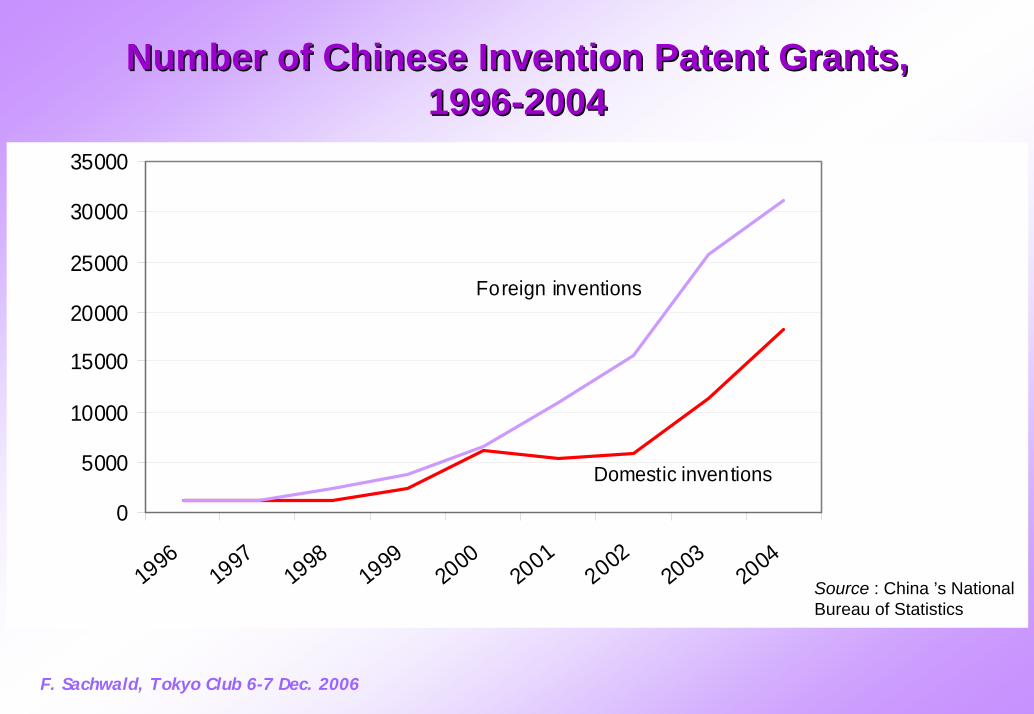
Number Number of of Chinese Chinese Invention Patent Invention Patent GrantsGrants, , 19961996--20042004
0
5000
10000
15000
20000
25000
30000
35000
1996
19971998
19992000
20012002
20032004
Foreign inventions
Domestic inventions
Source : China ’s National Bureau of Statistics
F. Sachwald, Tokyo Club 6-7 Dec. 2006

Four Classifications of National S&T Four Classifications of National S&T CapabilitiesCapabilitiesComparison between the
four classificationsScience andTechnologyCapacityIndexRAND
TechnologyAchievementIndexUNDP
Indicator ofTechnologicalCapabilitiesArtCo
TechnologyIndexWEF Rank
meanStandarddev.
Rank onthe mean
US 1 2 4 1 2.0 1.41 1Finland 4 1 2 3 2.5 1.29 2Sweden 3 3 1 5 3.0 1.63 3Canada 2 9 5 2 4.5 3.32 4Australia 8 10 8 4 7.5 2.52 5Norway 10 12 6 6 8.5 3.00 6Japan 5 4 7 19 8.8 6.95 7UK 9 7 11 8 8.8 1.71 8Netherlands 12 6 9 11 9.5 2.65 9Germany 6 11 10 12 9.8 2.63 10Korea 16 5 15 7 10.8 5.56 11Mexico 36 30 35 29 32.5 3.51 34South Africa 32 35 32 34 33.3 1.50 35Thailand 41 36 37 31 36.3 4.11 36Brazil 35 37 38 37 36.8 1.26 37Philippines 42 38 39 32 37.8 4.19 38China 33 39 41 39 38.0 3.46 39Egypt 43 43 44 43 43.3 0.50 43India 37 46 47 44 43.5 4.51 44
TI 2004

Conclusions 1.Conclusions 1.
A contrasted picture of China ’s S&T capabilities
- Size vs. Intensity: R&D spending, number of researchers
- Quantity vs. Quality: Tertiry education, publications, patents
- Stocks vs. Flows: cumulated investment vs dynamic growth
- Domestic vs. Global contributions ? Large role of foreign firms and global connections
F. Sachwald, EPFL 23-24 oct. 2006

Conclusions 2.Conclusions 2.
Has China ’s technological capability « taken off » ?- Clearly above 1% R&D intensity ?- The path between 1 and 2%
R&D efficiency: linkages between public research and firms’ R&D
Domestic innovation capability and technonationalism
F. Sachwald, EPFL 23-24 oct. 2006