us-china state business export council report 2017 state export... · to china come from a wide...
TRANSCRIPT

STATE EXPORT REPORT
US-CHINA BUSINESS
COUNCILJUNE 2017
CHINA IS ONE OF THE TOP FIVE GOODS OR SERVICES EXPORT MARKETS FOR 49 STATES

2 © 2017 US-China Business Council
STATE EXPORT REPORT
US-CHINA BUSINESS
COUNCILJUNE 2017
Executive Summary
Exports to China: Vital to US economic growth• China’s economic growth rate is slowing, but it remains an important market for US exports. In 2016,
US goods exports to China totaled $113 billion, holding steady with the previous year and still the third-largest US goods export market behind Canada and Mexico, our neighbors and NAFTA partners.
• Exports of services to China are becoming significant. In 2015, the most recent complete year of available data, US services exports to China totaled $47 billion, making China the United States’ third-largest services export market. From 2006 to 2015, US services exports to China increased more than 400 percent. Services exports to the rest of the world increased 76 percent.
• Global trade is slowing, but exports of US goods and services to China continue to outpace exports to other major markets. On average, US goods exports to China grew by 8 percent annually over the past 10 years, despite the modest decline over the past two years versus 2014. Of the United States’ top 10 goods export markets, only Japan had positive export growth in 2016, reflecting an overall slowdown in global trade.
• US services exports to China grew more rapidly than all other major trading partners, averaging nearly 19 percent annually over the last decade. Only Brazil came close over the same period, with 17 percent average annual growth. The 6.8 percent growth in services exports to China in 2015 far outpaced growth in exports to the United States’ top three markets: the United Kingdom (3.4 percent), Canada (-9.2 percent), and Japan (-5.2 percent).
• China’s maturing economy is undergoing important changes that have resulted in a slowdown in GDP and trade growth. Even so, US exports of goods and services to China have grown faster than exports to any other major US trading partner over the past decade. From 2006 to 2016, US goods exports to China increased 114 percent. That is greater than the growth to any of the other top 10 US goods export markets, including the two largest US trading partners: Canada (41 percent growth) and Mexico (13 percent growth).
• Exports continue to play an essential role in the US economy and job growth. US goods exports to China come from a wide range of industries including transportation equipment, agriculture, computers and electronics, and chemicals. These exports also sustain logistics jobs in America’s ports and throughout the country. US services exports to China included travel and education, royalties, transportation, business and professional services, and financial services.
US GOODS EXPORTS TO CHINA HAVE GROWN 114 PERCENT SINCE 2006
2006 2007 2008 2009 2010 2011 2012 2013 2014 2015 2016
52.861.8
68.4 68.4
89.7
102.2108.2
119.0 120.4113.4 113.2
US Goods Exports to China, in billions
Source: Estimated by The Trade Partnership

© 2017 US-China Business Council 3
STATE EXPORT REPORT
US-CHINA BUSINESS
COUNCILJUNE 2017
China: An important market for states across the country• Most states have seen significant increases in exports of goods and services to China since 2006. Thirty
states experienced at least triple-digit goods export growth to China since 2006, and four states saw growth of more than 500 percent over the same period: Alabama, Montana, North Dakota, and South Carolina. Every US state had triple-digit services export growth to China since 2006, 16 states had export growth of more than 400 percent.
• China is among the top five goods and services export markets for most states. China was a top three goods export market for 39 states in 2016, and among the top five for another eight states. That includes states that are not usually associated with strong China trade ties, including Alabama, Arizona, Minnesota, Michigan, New Jersey, New York, Pennsylvania, Ohio, South Carolina, and Tennessee.
• The value of US goods and services exports to China is significant. Last year, 29 states exported more than $1 billion in goods to China, while another 11 states exported more than $500 million. In 2006, only 17 states exported more than $1 billion of goods to China and only one state exported more than $1 billion in services to China – California.
• While larger states like Texas, California and New York saw significant growth in exports to China, smaller states benefited, too. Kentucky, Kansas, Utah, Wyoming, Rhode Island, Mississippi, Nevada, and New Hampshire all experienced more than 200 percent growth in goods or services exports over the past decade.
More can be done to strengthen US exports to China • China is a significant market for US exports and
it should be even bigger. The United States has a small share of China’s overall market. US goods accounted for about 8.4 percent of China’s total imports in 2015, trailing behind China’s purchases from the European Union, South Korea, Japan, and Taiwan. That market share represents a decline from 2000, when the United States held a 10 percent share of China’s import market.
• Expanding market opportunities in China requires a variety of tools. China maintains an array of tariff and non-tariff barriers that prevent more American goods, agriculture products, and services from reaching Chinese customers. The United States should continue to bring legally sound, industry-supported cases to the World Trade Organization. Congress should expand the resources at the Office of the United States Trade Representative to build upon the successful track record of using the WTO to address unfair Chinese trade practices. The Trump administration should pursue results-oriented engagement with China designed to address barriers of longstanding concern.
• In addition, the United States should push forward negotiations with China on a high-standard bilateral investment treaty, which would reduce ownership and licensing barriers that keep American companies from selling more products and services in China, including exports.
US GOODS EXPORTS TO CHINA HAVE GROWN 348 PERCENT SINCE 2006
2006 2007 2008 2009 2010 2011 2012 2013 2014 2015
10.412.3
14.2 15.0
20.8
27.4
32.0
36.9
43.946.9US Services Exports
to China, in billions
Source: Estimated by The Trade Partnership

4 © 2017 US-China Business Council
STATE EXPORT REPORT
US-CHINA BUSINESS
COUNCILJUNE 2017
Methodology
This year’s edition of the US-China Business Council (USCBC) US Exports to China by State report uses data provided by The Trade Partnership, an economic research firm. The report provides a separate breakdown of each state’s goods and services exports to China. The national export totals include the export data for each state and for Washington, DC.
Goods export figures are based primarily on data from the US Census Bureau, the US Department of Ag-riculture (USDA), and Moody’s Analytics. Goods export figures are classified according to the US govern-ment’s North American Industry Classification (NAICS) system. Services export figures are based pri-marily on data from the US Bureau of Economic Analysis (BEA) and Moody’s Analytics. Services export figures are classified according to the BEA categories.
This year’s edition of US Exports to China by State uses more detailed sector categories for both goods and services. The number of reported goods sectors increased from 29 last year to 104 this year, while the number of reported services sectors increased from 8 to 33. In both cases, the more detailed sectors provide a better sense of the types of goods and services exported to China. For example, whereas past editions reported exports of “Machinery,” this edition breaks those exports down further to “Agricultural & Construction Machinery” and “HVAC & Refrigeration Equipment” and “Engines & Turbines.”
Goods exports cover 2006-2016; services exports are reported through 2015, the most recent year detailed services export data are available from BEA. As historical data from each of these sources is revised annu-ally, this issue of US Exports to China by State replaces all prior editions.
Similar to previous editions of US Exports to China by State, this report uses a methodology that credits agricultural exports to states where crops are grown as opposed to states with large ports where bulk commodities are aggregated prior to export. A detailed explanation of the methodology for goods and services export estimates is available at http://tradepartnership.com/data/cdxports-and-cdxjobs/.
This year’s edition of US Exports to China by State includes estimates for U.S. jobs supported by exports to China from each state. Estimates for “direct” and “indirect” jobs tied to exports to China from a given state are derived using domestic employment requirement tables from the U.S. Bureau of Labor Statistics. Estimates are calculated at the sector level and then summed to determine the total U.S. jobs supported by exports from the state. All reported jobs figures are for 2015, the most recent year available for both goods and services. Since “indirect” jobs may be located outside the state (e.g., autos exported from South Carolina may support tire manufacturing jobs in Ohio), it is important to note the distinction between “U.S. jobs supported by exports from Ohio to China,” as reported here, and “jobs in Ohio supported by exports to China,” which are not reported here.
Additional notes on goods export categories:NAICS 3399 (Miscellaneous Manufacturing) – According to the Census Bureau, “Miscellaneous Manufac-turing” includes a wide range of products that cannot readily be classified in specific NAICS subsectors in manufacturing. Establishments in this subsector manufacture products as diverse as jewelry, sporting goods, toys, and office supplies.
NAICS 9100 (Waste & Scrap) – The Census Bureau includes a variety of second-hand scrap and recycled materials in this export classification, including ferrous metals, copper, aluminum, paper, wood, and saw-dust. Many of these products are used by China to produce rebar steel and packaging materials.

© 2017 US-China Business Council 5
STATE EXPORT REPORT
US-CHINA BUSINESS
COUNCILJUNE 2017
Additional notes on services export categories:Credit-Related Services – BEA classifies non-depository, non-investment financial transactions as credit-related services. The services may include credit card issuing, sales financing, trade financing, and similar activities.
Royalties from Industrial Processes – According to the BEA, “Royalties from Industrial Processes” in-clude transactions with nonresidents that involve intangible assets—including patents, trade secrets, and other proprietary rights—that are used in connection with the production of goods.

6 © 2017 US-China Business Council
Sponsors
Applied Materials
Caterpillar
Chevron
Corning
Dupont
JPMorgan
Smithfield
Thermo Fisher Scientific
Underwriters Laboratories Inc.
STATE EXPORT REPORT
US-CHINA BUSINESS
COUNCILJUNE 2017

© 2017 US-China Business Council • Source: Estimated by The Trade Partnership 7
US Goods Exports to China, in billions
EXPORTS TO CHINA
Top 5 US states service exporters to China1. California $7 billion 2. New York $4 billion3. Texas $3 billion 4. Florida $3 billion5. Massachusetts $2 billion
Top 5 US states goods exporters to China1. California $13 billion2. Washington $11 billion3. Texas $10 billion4. South Carolina $6 billion5. Oregon $5 billion
Top Goods exports to China 1. Oilseeds & Grains $15 billion 2. Aerospace Products & Parts $14 billion 3. Motor Vehicles $8 billion4. Semiconductors & Components $6 billion 5. Navigational & Meas. Instruments $5 billion
Top Goods markets1. Canada $235billion 2. Mexico $222 billion 3. China $113 billion 4. Japan $60 billion5. United Kingdom $49 billion
Top services exports1. Travel $26.8 billion2. Royalties & License Fees $6.0 billion3. Transportation Services $4.9 billion4. Business, Professional & Technical Services $3.7 billion5. Financial Services $3.0 billion
Top services markets1. United Kingdom $66 billion2. Canada $56 billion3. China $47 billion4. Japan $44 billion5. Mexico $31 billion
2006 2007 2008 2009 2010 2011 2012 2013 2014 2015 2016
52.861.8
68.4 68.4
89.7
102.2108.2
119.0 120.4113.4 113.2
2006 2007 2008 2009 2010 2011 2012 2013 2014 2015
10.412.3
14.2 15.0
20.8
27.4
32.0
36.9
43.946.9
US Services Exports to China, in billions
114%growth in exports of goods to China
348%growth in exports of
services to China
compared to 76% growth in exports of services to
rest of world
compared to 37% growth in exports of
goods to rest of world
CHINA IS THE UNITED STATES’ THIRD-LARGEST EXPORT MARKET
FOR GOODS AND SERVICES
US exports

8 Source: Estimated by The Trade Partnership • © 2017 US-China Business Council
Top US Goods Export Markets, 2016
1 CANADATotal $235 billionGrowth -6%Avg. growth 4.2%
CHINATotal $113 billionGrowth -0.2%Avg. growth 8.4%
3BRAZILTotal $29 billionGrowth -4.7%Avg. growth 6.8%
10
UNITED KINGDOMTotal $49 billionGrowth -0.6%Avg. growth 2.3%
5
MEXICOTotal $222 billionGrowth -2.3%Avg. growth 6.3%
2
JAPANTotal $60 billionGrowth 1.2%Avg. growth 1.3%
4
6 GERMANYTotal $46 billionGrowth -1.5%Avg. growth 2.6%
7 SOUTH KOREATotal $41 billionGrowth -2.7%Avg. growth 3.6%
8 NETHERLANDSTotal $36 billionGrowth -1.2%Avg. growth 3.5%
9HONG KONGTotal $32 billionGrowth -5.3%Avg. growth 7.7%
• China continues to be an important market for US goods exports, even as China’s economy slows. China is currently the United States’ third-largest export market. In 2016, US exports to China reached more than $113 billion.
• Although US exports to China slowed in 2016 compared to previous years, US exports to China have grown faster over the last decade than exports to the other top 10 US trade partners.
• Hong Kong is often a throughpoint for US exports ultimately destined for China. In 2016, combined US exports to Hong Kong and China totaled nearly $145 billion.
Growth represents 2016 annual growth. Average growth represents the average annual growth from 2006-2016

© 2017 US-China Business Council • Source: Estimated by The Trade Partnership 9
Top US Services Export Markets, 2015
2 CANADATotal $56 billionGrowth -9.2%Avg. growth 4.9%
3
8
1
5
4
7
• China is an increasingly important market for US services exports and is currently the United States’ third-largest export market. In 2015, US exports to China reached more than $47 billion.
• Despite China’s slowing economy, US exports to China have grown faster over the last decade than exports to any other top US trade partner. US services exports include travel and tourism, when Chinese students and visitors come to the United States; royalties from industrial processes, such as patents; and business management and advisory services.
9
6
10
UNITED KINGDOMTotal $66 billionGrowth 3.4%Avg. growth 3.6%
CHINATotal $47 billionGrowth 6.8%Avg. growth 18.6%
JAPANTotal $44 billionGrowth -5.2%Avg. growth 1.5%
MEXICOTotal $31 billionGrowth 4.0%Avg. growth 10.6%
SWITZERLANDTotal $30 billionGrowth 6.6%Avg. growth 9.4%
GERMANYTotal $30 billionGrowth 7.0%Avg. growth 5.1%
BRAZILTotal $28 billionGrowth -1.5%Avg. growth 17.4%
IRELANDTotal $26 billionGrowth -9.3%Avg. growth 7.1%
AUSTRALIATotal $22 billionGrowth 3.8%Avg. growth 10.6%
Growth represents 2015 annual growth. Average growth represents the average annual growth from 2006-2015.

10 Source: Estimated by The Trade Partnership • © 2017 US-China Business Council
Fastest growing US export markets
China Brazil Australia Switzerland Germany Ireland Canada United Mexico Japan Rest Kingdom of World
Most growth in US services exports from 2006-2015
Most growth in US goods exports from 2006-2016
• Over the past decade, US exports of goods to China have rise by 114 percent, making China the United States’ third-largest export market.
• US services exports to China outpaced all fo the top 10 export markets.
• China is the third-largest services market for US exports, behind the United Kingdom and Canada.
114%
94%
74%
60%
32% 32%
21% 19%12%
8%
47%
China Hong Mexico Brazil South Netherlands Germany United Canada Japan Rest Kong Korea Kingdom of World
348%
276%
144%119%
52% 52% 49%33% 32%
13%
106%
Note: Rankings are based on export data for 2006 and 2016 for goods, and 2006 and 2015 for services, comparing the top 10 markets for US exports. “Rest of World” export growth for this page is calculated using the cumulative sums for US exports to all remaining markets (non-top 10) for those years. Full-year services export data are available only through year-end 2015.

© 2017 US-China Business Council • Source: China Customs Statistics 11
China’s imports
China’s top 5 import sources in 2016, in billions
THE UNITED STATES IS ONLY CHINA’S FIFTH-LARGEST SOURCE OF IMPORTS
• The European Union and South Korea continue to export more goods to China than the United States. The United States also fell two places in 2016 to become the fifth-ranked source of imports for China, overtaken by Taiwan and Japan.
• Although US exports to China have grown significantly over the last decade, US imports to China in 2016 accounted for about 8.4 percent of China’s total imports.
• China’s slowing economy has had an impact on its purchases of US goods. Chinese imports of US products between 2015 and 2014 were down 9.6 percent. While the decline was notable, three of the other top import sources to China saw declines: imports from Taiwan were down 2.8 percent, from South Korea were down 8.9 percent, and from the EU were down 0.4 percent. Only Japanese imports saw an increase — of 1.7 percent.
Note: Data for this chart are based on PRC government statistics. The value of PRC imports from the United States is higher than US exports to China because of several data discrepancies between US and PRC trade statistics, reflecting methodological differences regarding shipping costs, as well as tariffs that are applied as goods pass through other customs territories on their way to China.
United States Taiwan Japan South Korea EU
$134 $139 $146 $159
$208

12 Source: Estimated by The Trade Partnership • © 2017 US-China Business Council
Top State Goods Exporters to China, 2016
3
• Thirty states experienced triple-digit goods export growth to China since 2006. Four states – Alabama, Montana, North Dakota, and South Carolina – saw export growth of more than 500 percent over the past decade.
• In 2016, 29 states exported more than $1 billion in goods to China, while another 11 states exported more than $500 million. In 2006, only 17 states exported more than $1 billion to China.
• The top 10 states exporting goods to China in 2016 span the nation. This list includes states that are not often thought of as those benefiting from trade with China – Alabama, Minnesota, Michigan, New York, Ohio, South Carolina and Tennessee.
TEXASExports $10 billionGrowth 44%
1CALIFORNIAExports $13 billionGrowth 38%
2 WASHINGTONExports $11 billionGrowth 179%
5OREGONExports $5.6 billionGrowth 306%
10
ILLINOISExports $5.4 billionGrowth 196%
7MICHIGANExports $3.5 billionGrowth 224%
4SOUTH CAROLINAExports $6.5 billionGrowth 890%
8OHIOExports $3.5 billionGrowth 137%
6
MINNESOTAExports $2.9 billionGrowth 156%
9ALABAMAExports $3.2 billionGrowth 550%
Growth represents the total growth from 2006-2016.

© 2017 US-China Business Council • Source: Estimated by The Trade Partnership 13
Top State Services Exporters to China, 2015
• All 50 states experienced triple-digit services export growth to China since 2006. Sixteen states—Montana, Indiana, Idaho, South Dakota, North Dakota, Iowa, Maine, Nebraska, North Carolina, Vermont, New York, Mississippi, Missouri, Oregon, Rhode Island, and Pennsylvania—saw export growth of more than 400 percent over the period.
• In 2015, 14 states exported more than $1 billion in services to China, while another eleven states exported more than $500 million. In 2006, only one state exported more than $1 billion to China—California.
• The top 10 states exporting services to China in 2015 span the nation. This list includes states that are not often thought of as those benefiting from trade with China – Massachusetts, Georgia, and Pennsylvania.
1CALIFORNIAExports $7.3 billionGrowth 323%
NEW YORKExports $4.7 billionGrowth 463%
3TEXASExports $3.7 billionGrowth 301% 4 FLORIDA
Exports $3.1 billionGrowth 280%
MASSACHUSETTSExports $2 billionGrowth 435%
ILLINOISExports $1.9 billionGrowth 346%
6
7PENNSYLVANIAExports $1.5 billionGrowth 446%
GEORGIAExports $1.3 billionGrowth 383%
8
9 WASHINGTONExports $1.3 billionGrowth 213%
10NEW JERSEYExports $1.3 billionGrowth 225%
5
2
Growth represents the total growth from 2006-2015.

14 Source: Estimated by The Trade Partnership • © 2017 US-China Business Council
Note: Full-year services export data are available only through year-end 2015
Alabama
ALABAMA’S EXPORTS TO CHINA SUPPORTED 17,400 AMERICAN JOBS IN 2015
Top Goods Export Markets, 20161. Canada $4.2 billion2. China $3.2 billion3. Germany $3.2 billion4. Mexico $2.7 billion5. United Kingdom $555 million
Top Services Export Markets, 20151. Canada $394 million2. China $390 million3. United Kingdom $366 million4. Japan $287 million5. Mexico $258 million
Top Services Exported to China, 20151. Travel $165 million2. Education $70 million3. Equipment Install., Maint., & Repair $38 million4. Royalties from Industrial Processes $24 million5. Architect., Engin., & Tech. Services $20 million
Top Goods Exported to China, 20161. Motor Vehicles $2.0 billion2. Pulp & Paperboard Mill Products $289 million3. Resins & Synthetic Fibers $288 million4. Basic Chemicals $202 million5. Oilseeds & Grains $75 million
State exports of services to China, in millions
EXPORTS TO CHINA
State exports of goods to China, in billions
550%growth in exports of goods to China
compared to 34% growth in exports of
goods to rest of world
427%growth in exports of
services to China
compared to 78% growth in exports of services to
rest of world
© 2017 US-China Business Council • Source: Estimated by The Trade Partnership 15
Note: Full-year services export data are available only through year-end 2015
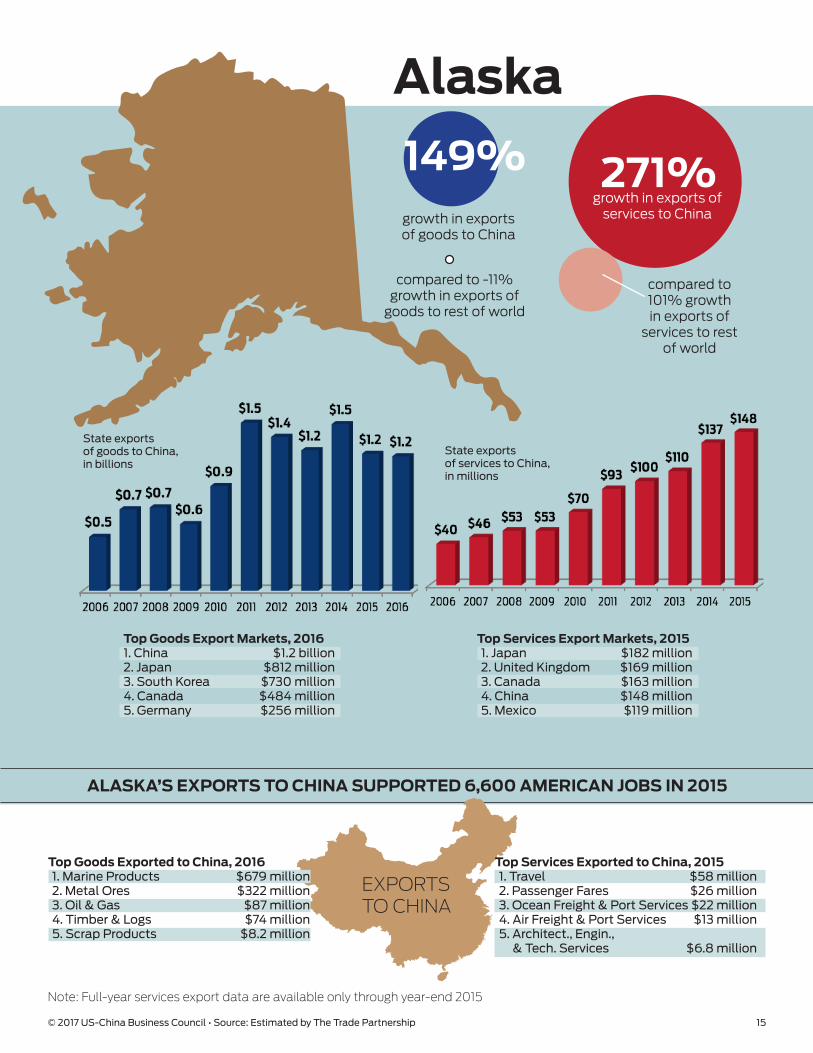
Alaska
ALASKA’S EXPORTS TO CHINA SUPPORTED 6,600 AMERICAN JOBS IN 2015
149%growth in exports of goods to China
271%growth in exports of
services to China
compared to 101% growth in exports of
services to rest of world
compared to -11% growth in exports of
goods to rest of world
Top Goods Export Markets, 20161. China $1.2 billion2. Japan $812 million3. South Korea $730 million4. Canada $484 million5. Germany $256 million
Top Services Export Markets, 20151. Japan $182 million2. United Kingdom $169 million3. Canada $163 million4. China $148 million5. Mexico $119 million
Top Services Exported to China, 20151. Travel $58 million2. Passenger Fares $26 million3. Ocean Freight & Port Services $22 million4. Air Freight & Port Services $13 million5. Architect., Engin., & Tech. Services $6.8 million
Top Goods Exported to China, 20161. Marine Products $679 million2. Metal Ores $322 million3. Oil & Gas $87 million4. Timber & Logs $74 million5. Scrap Products $8.2 million
State exports of goods to China, in billions
State exports of services to China, in millions
EXPORTS TO CHINA

16 Source: Estimated by The Trade Partnership • © 2017 US-China Business Council
Note: Full-year services export data are available only through year-end 2015
Arizona
ARIZONA’S EXPORTS TO CHINA SUPPORTED 15,500 AMERICAN JOBS IN 2015
-0.1%growth in exports of goods to China
compared to 20% growth in exports of
goods to rest of world
Top Goods Export Markets, 20161. Mexico $8.2 billion2. Canada $1.8 billion3. South Korea $1.3 billion4. China $1.2 billion5. United Kingdom $773 million
Top Services Export Markets, 20151. United Kingdom $1.1 billion2. Canada $1.0 billion3. China $949 million4. Japan $846 million5. Mexico $678 million
Top Services Exported to China, 20151. Travel $401 million2. Education $198 million3. Passenger Fares $91 million4. Royalties from Industrial Processes $54 million5. Air Freight & Port Services $38 million
Top Goods Exported to China, 20161. Semiconductors & Components $427 million2. Aerospace Products & Parts $332 million3. Navigational & Meas. Instruments $55 million4. Scrap Products $35 million5. Misc. Crops $35 million
State exports of goods to China, in billions
State exports of services to China, in millions
EXPORTS TO CHINA
391%growth in exports of
services to China
compared to 67% growth in exports of services to
rest of world

© 2017 US-China Business Council • Source: Estimated by The Trade Partnership 17
Note: Full-year services export data are available only through year-end 2015
Arkansas
ARKANSAS’ EXPORTS TO CHINA SUPPORTED 6,100 AMERICAN JOBS IN 2015
compared to 82% growth in exports of
services to rest of world
compared to 27% growth in exports of
goods to rest of world
Top Goods Export Markets, 20161. Canada $1.2 billion2. China $865 million3. France $788 million4. Mexico $710 million5. Japan $321 million
Top Services Export Markets, 20151. Canada $179 million2. United Kingdom $156 million3. China $155 million4. Brazil $128 million5. Mexico $96 million
Top Services Exported to China, 20151. Travel $55 million2. Education $48 million3. Equipment Install., Maint., & Repair $15 million4. Trademarks $10 million5. Operational Leasing $9.9 million
Top Goods Exported to China, 20161. Oilseeds & Grains $571 million2. Resins & Synthetic Fibers $56 million3. Aerospace Products & Parts $49 million4. Basic Chemicals $49 million5. Misc. Crops $37 million
State exports of goods to China, in millions
State exports of services to China, in millions
EXPORTS TO CHINA
89%growth in exports of goods to China
377%growth in exports of
services to China

18 Source: Estimated by The Trade Partnership • © 2017 US-China Business Council
Note: Full-year services export data are available only through year-end 2015
California
CALIFORNIA’S EXPORTS TO CHINA SUPPORTED 121,100 AMERICAN JOBS IN 2015
Top Goods Export Markets, 20161. Mexico $25 billion2. Canada $17 billion3. China $13 billion4. Japan $11 billion5. Hong Kong $9.5 billion
Top Services Export Markets, 20151. United Kingdom $12 billion2. Canada $9.2 billion3. Japan $7.4 billion4. China $7.3 billion5. Switzerland $6.3 billion
Top Services Exported to China, 20151. Travel $2.3 billion2. Education $1.7 billion3. Royalties from Industrial Processes $579 million4. Film & TV Distribution $359 million5. Passenger Fares $256 million
Top Goods Exported to China, 20161. Communications Equipment $1.6 billion2. Scrap Products $1.6 billion3. Motor Vehicles $1.2 billion4. Navigational & Meas. Instruments $1.1 billion5. Industrial Machinery $787 million
State exports of goods to China, in billions
EXPORTS TO CHINA
38% 323%growth in exports of
services to China
compared to 71% growth in exports of services to rest
of world
compared to 27% growth in
exports of goods to rest of world
growth in exports of goods to China
State exports of services to China, in billions

© 2017 US-China Business Council • Source: Estimated by The Trade Partnership 19
Note: Full-year services export data are available only through year-end 2015
Colorado
COLORADO’S EXPORTS TO CHINA SUPPORTED 12,600 AMERICAN JOBS IN 2015
12%growth in exports of goods to
China
375%growth in exports of
services to China
compared to 80% growth in exports of services to rest
of world
compared to -4% growth in exports of goods to rest
of world
Top Goods Export Markets, 20161. Canada $1.4 billion2. Mexico $1.1 billion3. China $652 million4. Japan $512 million5. South Korea $424 million
Top Services Export Markets, 20151. United Kingdom $1.3 billion2. Canada $1.2 billion3. Japan $951 million4. China $905 million5. Brazil $731 million
Top Services Exported to China, 20151. Travel $384 million2. Education $121 million3. Passenger Fares $90 million4. Architect., Engin., & Tech. Services $44 million5. Mgmt. & Advisory Services $40 million
Top Goods Exported to China, 20161. Navigational & Meas. Instruments $121 million2. Meat Products $118 million3. Scrap Products $54 million4. Misc. Chemical Preparations $53 million5. Oilseeds & Grains $42 million
State exports of goods to China, in millions
State exports of services to China, in millions
EXPORTS TO CHINA

20 Source: Estimated by The Trade Partnership • © 2017 US-China Business Council
Note: Full-year services export data are available only through year-end 2015
CONNECTICUT’S EXPORTS TO CHINA SUPPORTED 9,600 AMERICAN JOBS IN 2015
Top Goods Export Markets, 20161. France $1.9 billion2. Germany $1.6 billion3. Canada $1.6 billion4. United Arab Emirates $1.2 billion7. China $777 million
Top Services Export Markets, 20151. British Overseas Territories (Carib.) $1.5 billion2. United Kingdom $1.2 billion3. Canada $751 million4. China $542 million5. Japan $533 million
Top Services Exported to China, 20151. Education $166 million2. Travel $110 million3. Mgmt. & Advisory Services $105 million4. Trademarks $22 million5. Royalties from Industrial Processes $20 million
Top Goods Exported to China, 20161. Aerospace Products & Parts $193 million2. Nonferrous Metals & Processing $109 million3. Navigational & Meas. Instruments $96 million4. Misc. General Purpose Machinery $33 million5. Misc. Fabricated Metal Products $28 million
State exports of goods to China, in millions
State exports of services to China, in millions
EXPORTS TO CHINA
112%growth in exports of goods to China
274%growth in exports of
services to China
compared to 51% growth in exports of
services to rest of world
compared to 12% growth in exports of
goods to rest of world
Connecticut

© 2017 US-China Business Council • Source: Estimated by The Trade Partnership 21
Note: Full-year services export data are available only through year-end 2015
Delaware
DELAWARE’S EXPORTS TO CHINA SUPPORTED 3,200 AMERICAN JOBS IN 2015
Top Goods Export Markets, 20161. United Kingdom $549 million2. United Arab Emirates $381 million3. China $371 million4. Canada $370 million5. Saudi Arabia $367 million
Top Services Export Markets, 20151. British Overseas Territories (Carib.) $622 million2. United Kingdom $385 million3. Canada $218 million4. Japan $159 million5. China $153 million
Top Services Exported to China, 20151. Education $43 million2. Credit-Related Services $37 million3. Travel $20 million4. Mgmt. & Advisory Services $11 million5. Operational Leasing $7.1 million
Top Goods Exported to China, 20161. Navigational & Meas. Instruments $98 million2. Pharmaceuticals & Medicines $64 million3. Resins & Synthetic Fibers $34 million4. Oilseeds & Grains $30 million5. Basic Chemicals $30 million
State exports of services to China, in millions
EXPORTS TO CHINA
144%growth in exports of goods to China
340%growth in exports of
services to China
compared to 112% growth in exports of services
to rest of world
compared to 7% growth in exports of
goods to rest of world
State exports of goods to China, in millions

22 Source: Estimated by The Trade Partnership • © 2017 US-China Business Council
Note: Full-year services export data are available only through year-end 2015
Florida
FLORIDA’S EXPORTS TO CHINA SUPPORTED 34,900 AMERICAN JOBS IN 2015
23%growth in exports of goods to China
compared to 34% growth in exports of
goods to rest of world
Top Goods Export Markets, 20161. Brazil $3.5 billion2. Canada $3.4 billion3. Mexico $2.8 billion4. Colombia $2.1 billion13. China $1.3 billion
Top Services Export Markets, 20151. United Kingdom $3.6 billion2. Canada $3.4 billion3. China $3.1 billion4. Japan $3.0 billion5. Mexico $2.4 billion
Top Services Exported to China, 20151. Travel $1.6 billion2. Education $424 million3. Passenger Fares $243 million4. Ocean Freight & Port Services $212 million5. Air Freight & Port Services $109 million
Top Goods Exported to China, 20161. Scrap Products $293 million2. Aerospace Products & Parts $161 million3. Pulp & Paperboard Mill Products $71 million4. Navigational & Meas. Instruments $65 million5. Misc. Manufactured Commodities $59 million
State exports of goods to China, in billions State exports
of services to China, in billions
EXPORTS TO CHINA
280%growth in exports of
services to China
compared to 67% growth in exports of
services to rest of world

© 2017 US-China Business Council • Source: Estimated by The Trade Partnership 23
Note: Full-year services export data are available only through year-end 2015
Georgia
GEORGIA’S EXPORTS TO CHINA SUPPORTED 26,100 AMERICAN JOBS IN 2015
107%growth in exports of goods to China
383%growth in exports of
services to China
compared to 95% growth in exports of services to
rest of worldcompared to 71% growth in exports of goods to rest
of world
Top Goods Export Markets, 20161. Canada $5.8 billion2. Mexico $3.6 billion3. China $2.6 billion4. Germany $1.6 billion5. Japan $1.4 billion
Top Services Export Markets, 20151. United Kingdom $2.1 billion2. Canada $1.9 billion3. Japan $1.5 billion4. China $1.3 billion5. Brazil $1.1 billion
Top Services Exported to China, 20151. Travel $411 million2. Passenger Fares $235 million3. Education $218 million4. Air Freight & Port Services $102 million5. Computer Software $45 million
Top Goods Exported to China, 20161. Pulp & Paperboard Mill Products $654 million2. Aerospace Products & Parts $456 million3. Misc. Crops $160 million4. Scrap Products $146 million5. Medical Equipment & Supplies $121 million
State exports of goods to China, in billions
State exports of services to China, in billions
EXPORTS TO CHINA

24 Source: Estimated by The Trade Partnership • © 2017 US-China Business Council
Note: Full-year services export data are available only through year-end 2015
Hawaii
HAWAII’S EXPORTS TO CHINA SUPPORTED 3,900 AMERICAN JOBS IN 2015
compared to 56% growth in exports of
services to rest of world
compared to 63% growth in exports of
goods to rest of world
Top Goods Export Markets, 20161. Australia $707 million2. China $116 million3. Canada $99 million4. Singapore $64 million5. Japan $55 million
Top Services Export Markets, 20151. Canada $425 million2. China $393 million3. Japan $391 million4. United Kingdom $378 million5. Mexico $341 million
Top Services Exported to China, 20151. Travel $231 million2. Passenger Fares $63 million3. Education $35 million4. Air Freight & Port Services $22 million5. Ocean Freight & Port Services $18 million
Top Goods Exported to China, 20161. Basic Chemicals $42 million2. Petroleum & Coal Products $35 million3. Scrap Products $17 million4. Timber & Logs $11 million5. Marine Products $3.1 million
State exports of goods to China, in millions
State exports of services to China, in millions
EXPORTS TO CHINA
325%growth in exports of goods to China 277%
growth in exports of services to China

© 2017 US-China Business Council • Source: Estimated by The Trade Partnership 25
Note: Full-year services export data are available only through year-end 2015
Idaho
IDAHO’S EXPORTS TO CHINA SUPPORTED 5,500 AMERICAN JOBS IN 2015
Top Goods Export Markets, 20161. Canada $960 million2. Singapore $854 million3. China $759 million4. Taiwan $603 million5. Malaysia $349 million
Top Services Export Markets, 20151. China $124 million2. Switzerland $116 million3. Canada $113 million4. United Kingdom $100 million5. Japan $92 million
Top Services Exported to China, 20151. Travel $45 million2. Education $36 million3. Royalties from Industrial Processes $17 million4. Equipment Install., Maint., & Repair $7.0 million5. Trademarks $4.8 million
Top Goods Exported to China, 20161. Navigational & Meas. Instruments $298 million2. Semiconductors & Components $173 million3. Oilseeds & Grains $117 million4. Computer Equipment $37 million5. Misc. Crops $25 million
EXPORTS TO CHINA
State exports of goods to China, in millions
State exports of services to China, in millions
27%growth in exports of goods to China
480%growth in exports of
services to China
compared to 70% growth in exports of services to
rest of worldcompared to 36%
growth in exports of goods to rest of world

26 Source: Estimated by The Trade Partnership • © 2017 US-China Business Council
Note: Full-year services export data are available only through year-end 2015
Illinois
ILLINOIS’ EXPORTS TO CHINA SUPPORTED 48,100 AMERICAN JOBS IN 2015
Top Goods Export Markets, 20161. Canada $16 billion2. Mexico $9.8 billion3. China $5.4 billion4. Germany $2.8 billion5. Japan $2.5 billion
Top Services Export Markets, 20151. United Kingdom $3.2 billion2. Canada $2.7 billion3. British Overseas Territories (Carib.) $2.3 billion4. Japan $1.9 billion5. China $1.9 billion
Top Services Exported to China, 20151. Education $503 million2. Travel $471 million3. Passenger Fares $200 million4. Mgmt. & Advisory Services $94 million5. Air Freight & Port Services $82 million
Top Goods Exported to China, 20161. Oilseeds & Grains $2.1 billion2. Scrap Products $333 million3. Navigational & Meas. Instruments $322 million4. Beverages $265 million5. Motor Vehicle Parts $192 million
EXPORTS TO CHINA
State exports of goods to China, in billions
State exports of services to China, in billions
196%growth in exports
of goods to China
346%growth in exports of
services to China
compared to 74% growth in exports of services to
rest of world
compared to 34% growth in exports of
goods to rest of world

© 2017 US-China Business Council • Source: Estimated by The Trade Partnership 27
Note: Full-year services export data are available only through year-end 2015
Indiana
INDIANA’S EXPORTS TO CHINA SUPPORTED 20,300 AMERICAN JOBS IN 2015
Top Goods Export Markets, 20161. Canada $11 billion2. Mexico $5.2 billion3. China $2.9 billion4. Japan $1.9 billion5. Germany $1.8 billion
Top Services Export Markets, 20151. China $749 million2. Switzerland $714 million3. Canada $584 million4. Ireland $562 million5. United Kingdom $538 million
Top Services Exported to China, 20151. Education $307 million2. Travel $180 million3. Royalties from Industrial Processes $138 million4. Equipment Install., Maint., & Repair $38 million5. Trademarks $27 million
Top Goods Exported to China, 20161. Oilseeds & Grains $1.2 billion2. Pharmaceuticals & Medicines $321 million3. Motor Vehicles $260 million4. Medical Equipment & Supplies $178 million5. Motor Vehicle Parts $151 million
State exports of goods to China, in billions
State exports of services to China, in millions
EXPORTS TO CHINA
282%growth in exports of goods to China
495%growth in exports of
services to China
compared to 74% growth in exports of services to
rest of world
compared to 51% growth in exports of goods to rest
of world

28 Source: Estimated by The Trade Partnership • © 2017 US-China Business Council
Note: Full-year services export data are available only through year-end 2015
Iowa
IOWA’S EXPORTS TO CHINA SUPPORTED 18,100 AMERICAN JOBS IN 2015
Top Goods Export Markets, 20161. Canada $3.4 billion2. China $2.3 billion3. Mexico $2.0 billion4. Japan $1.4 billion5. Germany $486 million
Top Services Export Markets, 20151. United Kingdom $299 million2. Canada $289 million3. China $278 million4. Japan $212 million5. Switzerland $188 million
Top Services Exported to China, 20151. Education $117 million2. Travel $52 million3. Royalties from Industrial Processes $34 million4. Equipment Install., Maint., & Repair $24 million5. Trademarks $14 million
Top Goods Exported to China, 20161. Oilseeds & Grains $1.8 billion2. Beverages $39 million3. Meat Products $34 million4. Leather & Hide Tanning $34 million5. Scrap Products $30 million
State exports of goods to China, in billions State exports
of services to China, in millions
EXPORTS TO CHINA
254%growth in exports of goods to China
498%growth in exports of
services to China
compared to 84% growth of services to rest of world
compared to 30% growth in
exports of goods to rest of world

© 2017 US-China Business Council • Source: Estimated by The Trade Partnership 29
Note: Full-year services export data are available only through year-end 2015
Kansas
KANSAS’ EXPORTS TO CHINA SUPPORTED 13,700 AMERICAN JOBS IN 2015
Top Goods Export Markets, 20161. Canada $1.8 billion2. Mexico $1.5 billion3. China $1.3 billion4. Japan $993 million5. United Kingdom $436 million
Top Services Export Markets, 20151. United Kingdom $330 million2. Canada $302 million3. China $261 million4. Japan $190 million5. Mexico $160 million
Top Services Exported to China, 20151. Travel $85 million2. Education $79 million3. Equipment Install., Maint., & Repair $18 million4. Architect., Engin., & Tech. Services $12 million5. Trademarks $12 million
Top Goods Exported to China, 20161. Oilseeds & Grains $767 million2. Meat Products $157 million3. Aerospace Products & Parts $88 million4. Leather & Hides $50 million5. Navigational & Meas. Instruments $27 million
State exports of goods to China, in billions
State exports of services to China, in millions
EXPORTS TO CHINA
200%growth in exports
of goods to China
334%growth in exports of
services to China
compared to 50% growth in exports of services to
rest of worldcompared to 3%
growth in exports of goods to rest of world

30 Source: Estimated by The Trade Partnership • © 2017 US-China Business Council
Note: Full-year services export data are available only through year-end 2015
Kentucky
KENTUCKY’S EXPORTS TO CHINA SUPPORTED 15,100 AMERICAN JOBS IN 2015
Top Goods Export Markets, 20161. Canada $7.4 billion2. France $2.8 billion3. United Kingdom $2.8 billion4. Mexico $2.3 billion5. China $2.2 billion
Top Services Export Markets, 20151. United Kingdom $440 million2. Canada $405 million3. China $399 million4. Japan $321 million5. Mexico $267 million
Top Services Exported to China, 20151. Travel $177 million2. Education $69 million3. Air Freight & Port Services $31 million4. Equipment Install., Maint., & Repair $30 million5. Royalties from Industrial Processes $27 million
Top Goods Exported to China, 20161. Aerospace Products & Parts $803 million2. Oilseeds & Grains $329 million3. Pharmaceuticals & Medicines $228 million4. Resins & Synthetic Fibers $131 million5. Basic Chemicals $69 million
State exports of goods to China, in billions
State exports of services to China, in millions
EXPORTS TO CHINA
367%
323%growth in exports of
services to China
compared to 49% growth in exports of services to
rest of world
compared to 65% growth in exports of
goods to rest of world
growth in exports of goods to China

© 2017 US-China Business Council • Source: Estimated by The Trade Partnership 31
Note: Full-year services export data are available only through year-end 2015
Louisiana
LOUISIANA’S EXPORTS TO CHINA SUPPORTED 16,400 AMERICAN JOBS IN 2015
Top Goods Export Markets, 20161. Mexico $4.6 billion2. Canada $2.7 billion3. China $1.9 billion4. Brazil $1.7 billion5. Netherlands $1.7 billion
Top Services Export Markets, 20151. China $835 million2. Japan $827 million3. Canada $722 million4. United Kingdom $672 million5. Germany $563 million
Top Services Exported to China, 20151. Travel $325 million2. Ocean Freight & Port Services $169 million3. Royalties from Industrial Processes $75 million4. Education $69 million5. Operational Leasing $69 million
Top Goods Exported to China, 20161. Basic Chemicals $504 million2. Oilseeds & Grains $292 million3. Resins & Synthetic Fibers $217 million4. Nonferrous Metals & Processing $170 million5. Oil & Gas $160 million
State exports of goods to China, in billions
State exports of services to China, in millions
EXPORTS TO CHINA
130%growth in exports of goods to China
220%growth in exports of
services to China
compared to 109% growth in exports of services to rest
of world
compared to 122%
growth in exports
of goods to rest of
world

32 Source: Estimated by The Trade Partnership • © 2017 US-China Business Council
Note: Full-year services export data are available only through year-end 2015
Maine
MAINE’S EXPORTS TO CHINA SUPPORTED 2,400 AMERICAN JOBS IN 2015
Top Services Export Markets, 20151. Canada $141 million2. United Kingdom $138 million3. China $121 million4. Mexico $93 million5. Japan $92 million
Top Services Exported to China, 20151. Travel $72 million2. Education $17 million3. Equipment Install., Maint., & Repair $7.6 million4. Trademarks $4.9 million5. Architect., Engin., & Tech. Services $3.0 million
Top Goods Exported to China, 20161. Pulp & Paperboard Mill Products $81 million2. Marine Products $46 million3. Converted Paper Products $26 million4. Misc. Foods $8.8 million5. Pharmaceuticals & Medicines $7.2 million
State exports of goods to China, in millions
State exports of services to China, in millions
EXPORTS TO CHINA
Top Goods Export Markets, 20161. Canada $1.1 billion2. China $209 million3. Germany $203 million4. Malaysia $165 million5. Japan $88 million
38%growth in exports of goods to
China
529%growth in exports of
services to China
compared to 90% growth in exports of services to
rest of world
compared to -5% growth in exports of goods to rest of
world

© 2017 US-China Business Council • Source: Estimated by The Trade Partnership 33
Note: Full-year services export data are available only through year-end 2015
Maryland
MARYLAND’S EXPORTS TO CHINA SUPPORTED 10,700 AMERICAN JOBS IN 2015
Top Goods Export Markets, 20161. Canada $1.4 billion2. China $558 million3. Saudi Arabia $532 million4. United Kingdom $521 million5. Mexico $454 million
Top Services Export Markets, 20151. United Kingdom $1.2 billion2. Canada $986 million3. China $871 million4. Japan $742 million5. British Overseas Territories (Carib.) $649 million
Top Services Exported to China, 20151. Travel $374 million2. Education $184 million3. Mgmt. & Advisory Services $46 million4. Architect., Engin., & Tech. Services $43 million5. Trademarks $28 million
Top Goods Exported to China, 20161. Scrap Products $136 million2. Oilseeds & Grains $82 million3. Pharmaceuticals & Medicines $44 million4. Navigational & Meas. Instruments $43 million5. Basic Chemicals $37 million
State exports of services to China, in millions
EXPORTS TO CHINA
75%growth in exports of goods to China
329%growth in exports of
services to China
compared to 86% growth in exports of services to
rest of world
compared to 26% growth in exports of
goods to rest of world
State exports of goods to China, in millions

34 Source: Estimated by The Trade Partnership • © 2017 US-China Business Council
Note: Full-year services export data are available only through year-end 2015
Massachusetts
MASSACHUSETTS’ EXPORTS TO CHINA SUPPORTED 30,500 AMERICAN JOBS IN 2015
Top Goods Export Markets, 20161. Canada $3.0 billion2. Mexico $2.5 billion3. China $2.2 billion4. Switzerland $1.8 billion5. Germany $1.6 billion
Top Services Export Markets, 20151. United Kingdom $2.6 billion2. British Overseas Territories (Carib.) $2.4 billion3. Canada $2.0 billion4. China $2.0 billion5. Japan $1.6 billion
Top Services Exported to China, 20151. Education $745 million2. Travel $558 million3. Mgmt. & Advisory Services $166 million4. Royalties from Industrial Processes $108 million5. Computer Software $101 million
Top Goods Exported to China, 20161. Industrial Machinery $393 million2. Navigational & Meas. Instruments $336 million3. Medical Equipment & Supplies $176 million4. Electrical Equipment & Components $144 million5. Scrap Products $120 million
EXPORTS TO CHINA
State exports of goods to China, in billions
State exports of services to China, in billions
69%growth in exports of goods to China
435%growth in exports of
services to China
compared to 92% growth in exports of services to
rest of world
compared to 4% growth in exports of
goods to rest of world

© 2017 US-China Business Council • Source: Estimated by The Trade Partnership 35
Note: Full-year services export data are available only through year-end 2015
Michigan
MICHIGAN’S EXPORTS TO CHINA SUPPORTED 29,700 AMERICAN JOBS IN 2015
Top Goods Export Markets, 20161. Canada $23 billion2. Mexico $12 billion3. China $3.5 billion4. Germany $2.0 billion5. Japan $1.6 billion
Top Services Export Markets, 20151. Canada $1.1 billion2. China $1.1 billion3. United Kingdom $1.1 billion4. Japan $842 million5. Mexico $671 million
Top Services Exported to China, 20151. Education $341 million2. Travel $311 million3. Passenger Fares $87 million4. Architect., Engin., & Tech. Services $69 million5. Royalties from Industrial Processes $66 million
Top Goods Exported to China, 20161. Motor Vehicle Parts $1.0 billion2. Oilseeds & Grains $332 million3. Motor Vehicles $199 million4. Navigational & Meas. Instruments $154 million5. Electrical Equip. & Components $134 million
State exports of goods to China, in billions
State exports of services to China, in billions
EXPORTS TO CHINA
224%growth in exports of goods to China
419%growth in exports of
services to China
compared to 63% growth in exports of services to
rest of worldcompared to 30% growth in exports of goods to rest
of world

36 Source: Estimated by The Trade Partnership • © 2017 US-China Business Council
Note: Full-year services export data are available only through year-end 2015
Minnesota
MINNESOTA’S EXPORTS TO CHINA SUPPORTED 21,500 AMERICAN JOBS IN 2015
Top Goods Export Markets, 20161. Canada $4.0 billion2. China $2.9 billion3. Mexico $2.6 billion4. Japan $1.3 billion5. South Korea $919 million
Top Services Export Markets, 20151. United Kingdom $891 million2. Canada $864 million3. Japan $711 million4. China $644 million5. Switzerland $471 million
Top Services Exported to China, 20151. Travel $195 million2. Education $133 million3. Passenger Fares $71 million4. Royalties from Industrial Processes $50 million5. Air Freight & Port Services $32 million
Top Goods Exported to China, 20161. Oilseeds & Grains $1.2 billion2. Navigational & Meas. Instruments $243 million3. Misc. General Purpose Machinery $232 million4. Medical Equipment & Supplies $182 million5. Converted Paper Products $114 million
State exports of goods to China, in billions
State exports of services to China, in millions
EXPORTS TO CHINA
156%growth in exports of goods to China
347%growth in exports of
services to China
compared to 65% growth in exports of services to
rest of worldcompared to 14% growth in exports of
goods to rest of world

© 2017 US-China Business Council • Source: Estimated by The Trade Partnership 37
Note: Full-year services export data are available only through year-end 2015
Mississippi
MISSISSIPPI’S EXPORTS TO CHINA SUPPORTED 7,600 AMERICAN JOBS IN 2015
Top Goods Export Markets, 20161. Canada $2.2 billion2. Mexico $1.2 billion3. China $980 million4. Panama $857 million5. Guatemala $434 million
Top Services Export Markets, 20151. Canada $230 million2. China $213 million3. United Kingdom $191 million4. Mexico $166 million5. Japan $147 million
Top Services Exported to China, 20151. Travel $133 million2. Education $25 million3. Equipment Install., Maint., & Repair $16 million4. Trademarks $8.7 million5. Royalties from Industrial Processes $6.8 million
Top Goods Exported to China, 20161. Oilseeds & Grains $423 million2. Misc. Fabricated Metal Products $97 million3. Medical Equipment & Supplies $95 million4. Pulp & Paperboard Mill Products $92 million5. Semiconductors & Components $46 million
State exports of goods to China, in millions
State exports of services to China, in millions
EXPORTS TO CHINA
160%growth in exports of goods to China
495%growth in exports of
services to China
compared to 70% growth in exports of services to
rest of worldcompared to 143% growth in exports of
goods to rest of world

38 Source: Estimated by The Trade Partnership • © 2017 US-China Business Council
Note: Full-year services export data are available only through year-end 2015
Missouri
MISSOURI’S EXPORTS TO CHINA SUPPORTED 17,200 AMERICAN JOBS IN 2015
Top Goods Export Markets, 20161. Canada $5.2 billion2. Mexico $2.3 billion3. China $1.8 billion4. Japan $679 million5. Belgium $491 million
Top Services Export Markets, 20151. United Kingdom $818 million2. Canada $813 million3. China $746 million4. Japan $526 million5. British Overseas Territories (Carib.) $509 million
Top Services Exported to China, 20151. Travel $316 million2. Education $223 million3. Royalties from Industrial Processes $31 million4. Trademarks $24 million5. Credit-Related Services $17 million
Top Goods Exported to China, 20161. Oilseeds & Grains $885 million2. Pharmaceuticals & Medicines $126 million3. Meat Products $98 million4. Scrap Products $78 million5. Metal Ores $55 million
State exports of services to China, in millions
EXPORTS TO CHINA
State exports of goods to China, in billions
76%growth in exports of goods to China
compared to 9% growth in exports of
goods to rest of world
466%growth in exports of
services to China
compared to 75% growth in exports of services to
rest of world

© 2017 US-China Business Council • Source: Estimated by The Trade Partnership 39
Note: Full-year services export data are available only through year-end 2015
MONTANA’S EXPORTS TO CHINA SUPPORTED 3,000 AMERICAN JOBS IN 2015
Top Goods Export Markets, 20161. Canada $569 million2. China $223 million3. Japan $140 million4. South Korea $138 million5. Mexico $131 million
Top Services Export Markets, 20151. Canada $101 million2. China $91 million3. United Kingdom $88 million4. Mexico $69 million5. Japan $61 million
Top Services Exported to China, 20151. Travel $52 million2. Education $16 million3. Equipment Install., Maint., & Repair $5.7 million4. Trademarks $3.5 million5. Architect., Engin., & Tech. Services $3.2 million
Top Goods Exported to China, 20161. Oilseeds & Grains $110 million2. Basic Chemicals $34 million3. Industrial Machinery $29 million4. Misc. Crops $17 million5. Nonferrous Metals & Processing $13 million
State exports of goods to China, in millions
State exports of services to China, in millions
EXPORTS TO CHINA
554%growth in exports of goods
548%growth in exports of
services to China
compared to 81% growth in exports of services to
rest of world
compared to 50% growth in exports of
goods to rest of world
Montana

40 Source: Estimated by The Trade Partnership • © 2017 US-China Business Council
Note: Full-year services export data are available only through year-end 2015
Nebraska
NEBRASKA’S EXPORTS TO CHINA SUPPORTED 11,000 AMERICAN JOBS IN 2015
Top Goods Export Markets, 20161. China $1.5 billion2. Mexico $1.3 billion3. Canada $1.2 billion4. Japan $1.0 billion5. South Korea $541 million
Top Services Export Markets, 20151. Canada $212 million2. United Kingdom $187 million3. China $150 million4. Japan $123 million5. Switzerland $88 million
Top Services Exported to China, 20151. Education $47 million2. Travel $41 million3. Equipment Install., Maint., & Repair $13 million4. Royalties from Industrial Processes $12 million5. Trademarks $8.6 million
Top Goods Exported to China, 20161. Oilseeds & Grains $1.1 billion2. Meat Products $187 million3. Leather & Hide Tanning $39 million4. Nonmetallic Minerals $28 million5. Electrical Equip. & Components $21 million
State exports of goods to China, in billions
State exports of services to China, in millions
EXPORTS TO CHINA
302%growth in exports of goods to China
460%growth in exports of
services to China
compared to 75% growth in exports of services to
rest of world
compared to 67% growth in exports of goods to rest of
world

© 2017 US-China Business Council • Source: Estimated by The Trade Partnership 41
Note: Full-year services export data are available only through year-end 2015
Nevada
NEVADA’S EXPORTS TO CHINA SUPPORTED 11,100 AMERICAN JOBS IN 2015
Top Goods Export Markets, 20161. Switzerland $3.9 billion2. Canada $1.4 billion3. India $812 million4. China $589 million5. Mexico $489 million
Top Services Export Markets, 20151. Canada $978 million2. China $879 million3. United Kingdom $845 million4. Mexico $823 million5. Japan $718 million
Top Services Exported to China, 20151. Travel $688 million2. Passenger Fares $65 million3. Air Freight & Port Services $25 million4. Education $23 million5. Equipment Install., Maint., & Repair $15 million
Top Goods Exported to China, 20161. Metal Ores $187 million2. Semiconductors & Components $133 million3. Pharmaceuticals & Medicines $61 million4. Navigational & Meas. Instruments $40 million5. Misc. General Purpose Machinery $22 million
State exports of goods to China, in millions
State exports of services to China, in millions
EXPORTS TO CHINA
191%growth in exports
of goods to China 482%
growth in exports of services to China
compared to 57% growth in exports of services to
rest of world
compared to 74% growth in exports of goods to rest
of world

42 Source: Estimated by The Trade Partnership • © 2017 US-China Business Council
Note: Full-year services export data are available only through year-end 2015
New Hampshire
NEW HAMPSHIRE’S EXPORTS TO CHINA SUPPORTED 3,400 AMERICAN JOBS IN 2015
Top Goods Export Markets, 20161. Canada $547 million2. Mexico $441 million3. China $306 million4. Germany $236 million5. United Arab Emirates $207 million
Top Services Export Markets, 20151. United Kingdom $242 million2. Canada $211 million3. China $186 million4. Japan $169 million5. Switzerland $143 million
Top Services Exported to China, 20151. Travel $63 million2. Education $52 million3. Royalties from Industrial Processes $12 million4. Equipment Install., Maint., & Repair $11 million5. Computer Software $9.9 million
Top Goods Exported to China, 20161. Computer Equipment $69 million2. Metalworking Machinery $45 million3. Misc. General Purpose Machinery $21 million4. Navigational & Meas. Instruments $20 million5. Marine Products $16 million
State exports of services to China, in millions
EXPORTS TO CHINA
75%growth in exports of goods to China
366%growth in exports of
services to China
compared to 67% growth in exports of services to
rest of worldcompared to 51%
growth in exports of goods to rest of world
State exports of goods to China, in millions

© 2017 US-China Business Council • Source: Estimated by The Trade Partnership 43
Note: Full-year services export data are available only through year-end 2015
New Jersey
NEW JERSEY’S EXPORTS TO CHINA SUPPORTED 18,200 AMERICAN JOBS IN 2015
Top Goods Export Markets, 20161. Canada $6.1 billion2. Mexico $2.6 billion3. United Kingdom $1.8 billion4. Netherlands $1.6 billion5. China $1.4 billion
Top Services Export Markets, 20151. United Kingdom $2.0 billion2. Canada $1.7 billion3. Japan $1.5 billion4. China $1.3 billion5. Switzerland $1.1 billion
Top Services Exported to China, 20151. Travel $395 million2. Education $208 million3. Passenger Fares $117 million4. Royalties from Industrial Processes $97 million5. Ocean Freight & Port Services $58 million
Top Goods Exported to China, 20161. Basic Chemicals $128 million2. Computer Equipment $117 million3. Nonferrous Metals & Processing $115 million4. Pharmaceuticals & Medicines $99 million5. Scrap Products $96 million
State exports of services to China, in billions
EXPORTS TO CHINA
69%growth in exports of goods to China
225%growth in exports of
services to China
compared to 55% growth in exports of
services to rest of world
compared to 9% growth in exports of
goods to rest of world
State exports of goods to China, in billions

44 Source: Estimated by The Trade Partnership • © 2017 US-China Business Council
Note: Full-year services export data are available only through year-end 2015
New Mexico
NEW MEXICO’S EXPORTS TO CHINA SUPPORTED 2,300 AMERICAN JOBS IN 2015
Top Goods Export Markets, 20161. Mexico $1.5 billion2. China $513 million3. Israel $508 million4. Japan $256 million5. Canada $158 million
Top Services Export Markets, 20151. Canada $203 million2. United Kingdom $193 million3. China $186 million4. Japan $152 million5. Mexico $135 million
Top Services Exported to China, 20151. Travel $96 million2. Education $29 million3. Equipment Install., Maint., & Repair $11 million4. Royalties from Industrial Processes $10 million5. Operational Leasing $8.4 million
Top Goods Exported to China, 20161. Semiconductors & Components $379 million2. Medical Equipment & Supplies $27 million3. Scrap Products $23 million4. Dairy Products $14 million5. Misc. Crops $11 million
State exports of services to China, in millions
EXPORTS TO CHINA
-28%growth in exports of goods to China
367%growth in exports of
services to China
compared to 50% growth in exports of services to
rest of worldcompared to 46% growth in exports of
goods to rest of world
State exports of goods to China, in millions

© 2017 US-China Business Council • Source: Estimated by The Trade Partnership 45
Note: Full-year services export data are available only through year-end 2015
New York
NEW YORK’S EXPORTS TO CHINA SUPPORTED 57,900 AMERICAN JOBS IN 2015
Top Goods Export Markets, 20161. Canada $9.3 billion2. Hong Kong $6.4 billion3. Israel $4.8 billion4. Switzerland $4.7 billion9. China $2.7 billion
Top Services Export Markets, 20151.British Overseas Territories (Carib.) $12 billion2. United Kingdom $9.8 billion3. Canada $6.6 billion4. China $4.7 billion5. Japan $4.2 billion
Top Services Exported to China, 20151. Travel $1.5 billion2. Education $1.3 billion3. Mgmt. & Advisory Services $600 million4. Misc. Financial Services $183 million5. Credit-Related Services $162 million
Top Goods Exported to China, 20161. Scrap Products $511 million2. Navigational & Meas. Instruments $194 million3. Misc. Manufactured Commodities $169 million4. Sawmill & Wood Products $157 million5. Misc. General Purpose Machinery $124 million
EXPORTS TO CHINA
State exports of goods to China, in billions
State exports of services to China, in billions
27%growth in exports of goods to China
463%growth in exports of
services to China
compared to 97% growth in exports of services to
rest of world
compared to 21% growth in exports of
goods to rest of world
46 Source: Estimated by The Trade Partnership • © 2017 US-China Business Council
Note: Full-year services export data are available only through year-end 2015
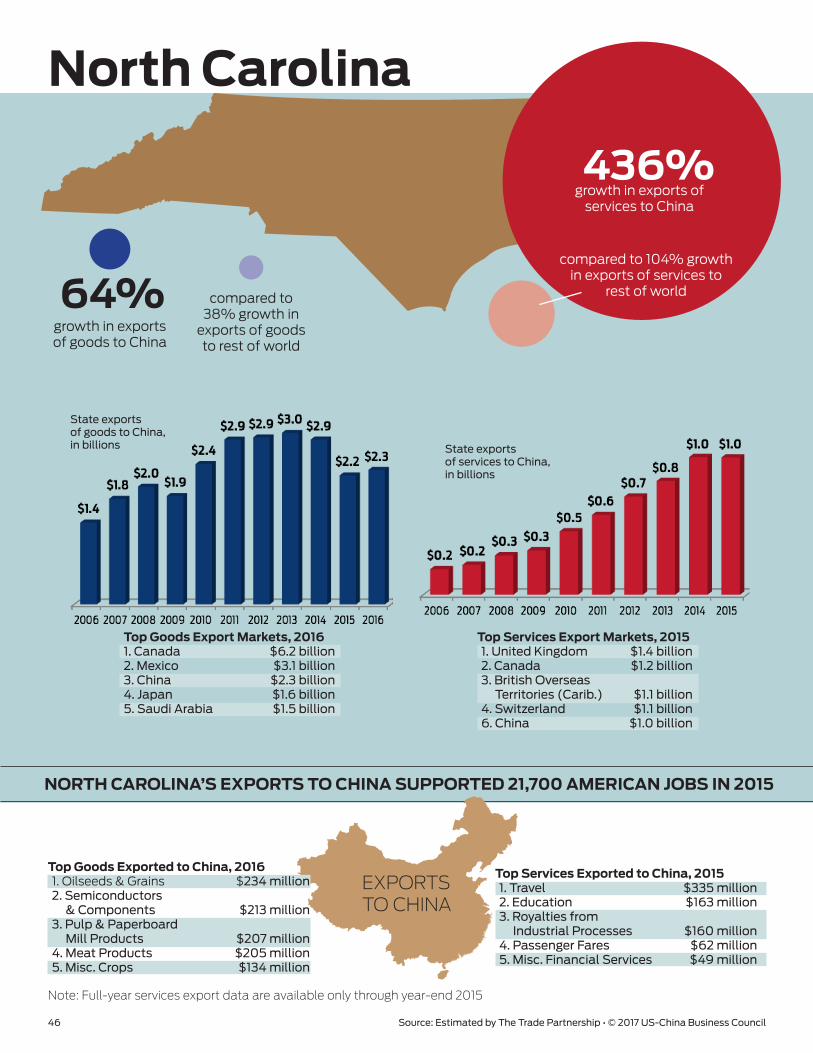
North Carolina
NORTH CAROLINA’S EXPORTS TO CHINA SUPPORTED 21,700 AMERICAN JOBS IN 2015
Top Goods Export Markets, 20161. Canada $6.2 billion2. Mexico $3.1 billion3. China $2.3 billion4. Japan $1.6 billion5. Saudi Arabia $1.5 billion
Top Services Export Markets, 20151. United Kingdom $1.4 billion2. Canada $1.2 billion3. British Overseas Territories (Carib.) $1.1 billion4. Switzerland $1.1 billion6. China $1.0 billion
Top Services Exported to China, 20151. Travel $335 million2. Education $163 million3. Royalties from Industrial Processes $160 million4. Passenger Fares $62 million5. Misc. Financial Services $49 million
Top Goods Exported to China, 20161. Oilseeds & Grains $234 million2. Semiconductors & Components $213 million3. Pulp & Paperboard Mill Products $207 million4. Meat Products $205 million5. Misc. Crops $134 million
State exports of goods to China, in billions State exports
of services to China, in billions
EXPORTS TO CHINA
64%growth in exports of goods to China
436%growth in exports of
services to China
compared to 104% growth in exports of services to
rest of worldcompared to 38% growth in
exports of goods to rest of world

© 2017 US-China Business Council • Source: Estimated by The Trade Partnership 47
Note: Full-year services export data are available only through year-end 2015
NORTH DAKOTA’S EXPORTS TO CHINA SUPPORTED 6,300 AMERICAN JOBS IN 2015
Top Goods Export Markets, 20161. Canada $3.2 billion2. China $844 million3. Mexico $462 million4. Japan $231 million5. Australia $124 million
Top Services Export Markets, 20151. Canada $104 million2. China $83 million3. United Kingdom $74 million4. Japan $49 million5. Mexico $48 million
Top Services Exported to China, 20151. Operational Leasing $21 million2. Travel $20 million3. Education $17 million4. Equipment Install., Maint., & Repair $8.6 million5. Trademarks $4.6 million
Top Goods Exported to China, 20161. Oilseeds & Grains $818 million2. Ag & Construction Machinery $14 million3. Misc. Crops $5.6 million4. Preserves & Specialty Foods $877,000 5. Misc. General Purpose Machinery $791,000
State exports of goods to China, in millions
State exports of services to China, in millions
EXPORTS TO CHINA
North Dakota
608%growth in exports of goods to China
495%growth in exports of
services to China
compared to 87% growth in exports of
services to rest of worldcompared to 118%
growth in exports of goods to rest of world

48 Source: Estimated by The Trade Partnership • © 2017 US-China Business Council
Note: Full-year services export data are available only through year-end 2015
Ohio
OHIO’S EXPORTS TO CHINA SUPPORTED 28,700 AMERICAN JOBS IN 2015
Top Goods Export Markets, 20161. Canada $19 billion2. Mexico $6.4 billion3. China $3.5 billion4. United Kingdom $1.7 billion5. Japan $1.6 billion
Top Services Export Markets, 20151. United Kingdom $1.3 billion2. Canada $1.1 billion3. China $1.1 billion4. British Overseas Territories (Carib.) $909 million5. Japan $774 million
Top Services Exported to China, 20151. Education $352 million2. Travel $315 million3. Royalties from Industrial Processes $56 million4. Equipment Install., Maint., & Repair $55 million5. Trademarks $52 million
Top Goods Exported to China, 20161. Oilseeds & Grains $898 million2. Navigational & Meas. Instruments $247 million3. Aerospace Products & Parts $246 million4. Plastics Products $178 million5. Motor Vehicle Parts $168 million
EXPORTS TO CHINA
State exports of goods to China, in billions
State exports of services to China, in millions
137%growth in exports of goods to China
382%growth in exports of
services to China
compared to 53% growth in exports of
services to rest of world
compared to 21% growth in exports of
goods to rest of world

© 2017 US-China Business Council • Source: Estimated by The Trade Partnership 49
Note: Full-year services export data are available only through year-end 2015
OKLAHOMA’S EXPORTS TO CHINA SUPPORTED 4,700 AMERICAN JOBS IN 2015
Top Goods Export Markets, 20161. Canada $1.4 billion2. Mexico $522 million3. Germany $370 million4. China $267 million5. Japan $262 million
Top Services Export Markets, 20151. Canada $360 million2. China $343 million3. United Kingdom $334 million4. Japan $255 million5. Mexico $222 million
Top Services Exported to China, 20151. Travel $112 million2. Education $88 million3. Passenger Fares $33 million4. Operational Leasing $29 million5. Equipment Install., Maint., & Repair $24 million
Top Goods Exported to China, 20161. Oilseeds & Grains $73 million2. Meat Products $23 million3. Soaps, Cleaning Agents & Toiletries $21 million4. Aerospace Products & Parts $20 million5. Misc. Crops $16 million
State exports of goods to China, in millions
State exports of services to China, in millions
EXPORTS TO CHINA
Oklahoma
114%growth in exports of goods to China 368%
growth in exports of services to China
compared to 70% growth in exports of services to
rest of world
compared to 7% growth in
exports of goods to rest of world

50 Source: Estimated by The Trade Partnership • © 2017 US-China Business Council
Note: Full-year services export data are available only through year-end 2015
OREGON’S EXPORTS TO CHINA SUPPORTED 25,800 AMERICAN JOBS IN 2015
Top Goods Export Markets, 20161. China $5.6 billion2. Malaysia $2.3 billion3. Canada $2.2 billion4. Vietnam $1.8 billion5. Japan $1.3 billion
Top Services Export Markets, 20151. Switzerland $1.1 billion2. Ireland $713 million3. Japan $627 million4. China $589 million5. United Kingdom $526 million
Top Services Exported to China, 20151. Royalties from Industrial Processes $186 million2. Education $154 million3. Travel $112 million4. Equipment Install., Maint., & Repair $24 million5. Computer Software $24 million
Top Goods Exported to China, 20161. Semiconductors & Components $3.0 billion2. Motor Vehicles $1.2 billion3. Misc. Chemical Preparations $266 million4. Industrial Machinery $263 million5. Navigational & Meas. Instruments $113 million
State exports of goods to China, in billions State exports
of services to China, in millions
EXPORTS TO CHINA
Oregon
306%growth in exports of goods to China
370%growth in exports of
services to China
compared to 103% growth in exports of
services to rest of worldcompared to 19%
growth in exports of goods to rest of world

© 2017 US-China Business Council • Source: Estimated by The Trade Partnership 51
Note: Full-year services export data are available only through year-end 2015
Pennsylvania
PENNSYLVANIA’S EXPORTS TO CHINA SUPPORTED 29,000 AMERICAN JOBS IN 2015
Top Goods Export Markets, 20161. Canada $9.8 billion2. Mexico $3.7 billion3. China $2.3 billion4. United Kingdom $2.1 billion5. Japan $1.5 billion
Top Services Export Markets, 20151. United Kingdom $2.1 billion2. Canada $1.8 billion3. China $1.7 billion4. British Overseas Territories (Carib.) $1.4 billion5. Japan $1.2 billion
Top Services Exported to China, 20151. Education $543 million2. Travel $543 million3. Mgmt. & Advisory Services $112 million4. Equipment Install., Maint., & Repair $69 million5. Architect., Engin., & Tech. Services $61 million
Top Goods Exported to China, 20161. Misc. General Purpose Machinery $246 million2. Sawmill & Wood Products $204 million3. Computer Equipment $140 million4. Basic Chemicals $125 million5. Navigational & Meas. Instruments $122 million
State exports of goods to China, in billions
State exports of services to China, in billions
EXPORTS TO CHINA
83%growth in exports of goods to China
446%growth in exports of
services to China
compared to 81% growth in exports of
services to rest of world
compared to 37% growth in exports of
goods to rest of world

52 Source: Estimated by The Trade Partnership • © 2017 US-China Business Council
Note: Full-year services export data are available only through year-end 2015
Top Services Exported to China, 20151. Travel $70 million2. Education $70 million3. Trademarks $4.9 million4. Mgmt. & Advisory Services $4.2 million5. Equipment Install., Maint., & Repair $3.4 million
Rhode Island
RHODE ISLAND’S EXPORTS TO CHINA SUPPORTED 2,400 AMERICAN JOBS IN 2015
Top Goods Export Markets, 20161. Canada $525 million2. Mexico $208 million3. China $157 million4. Dominican Republic $154 million5. Taiwan $101 million
Top Services Export Markets, 20151. China $176 million2. United Kingdom $171 million3. Canada $152 million4. British Overseas Territories (Carib.) $111 million5. Japan $109 million
State exports of goods to China, in millions
State exports of services to China, in millions
Top Goods Exported to China, 20161. Marine Products $24 million2. Basic Chemicals $23 million3. Industrial Machinery $19 million4. Nonferrous Metals & Processing $18 million5. Semiconductors & Components $8.0 million
EXPORTS TO CHINA
158%growth in exports of goods to China
446%growth in exports of
services to China
compared to 72% growth in exports of services to
rest of world
compared to 43% growth in
exports of goods to rest of world

© 2017 US-China Business Council • Source: Estimated by The Trade Partnership 53
Note: Full-year services export data are available only through year-end 2015
SOUTH CAROLINA’S EXPORTS TO CHINA SUPPORTED 25,200 AMERICAN JOBS IN 2015
Top Goods Export Markets, 20161. China $6.5 billion2. Germany $3.7 billion3. Canada $3.5 billion4. United Kingdom $2.8 billion5. Mexico $2.1 billion
Top Services Export Markets, 20151. Canada $473 million2. United Kingdom $443 million3. China $439 million4. Japan $334 million5. Mexico $330 million
Top Services Exported to China, 20151. Travel $244 million2. Education $55 million3. Equipment Install., Maint., & Repair $28 million4. Royalties from Industrial Processes $21 million5. Architect., Engin., & Tech. Services $18 million
Top Goods Exported to China, 20161. Motor Vehicles $2.5 billion2. Aerospace Products & Parts $2.3 billion3. Boilers, Tanks & Containers $181 million4. Motor Vehicle Parts $149 million5. Meat Products $139 million
State exports of goods to China, in billions
State exports of services to China, in millions
EXPORTS TO CHINA
South Carolina
890%growth in exports of goods to China
436%growth in exports of
services to China
compared to 93% growth in exports of services to
rest of world
compared to 94% growth in exports of goods to rest of world

54 Source: Estimated by The Trade Partnership • © 2017 US-China Business Council
Note: Full-year services export data are available only through year-end 2015
South Dakota
SOUTH DAKOTA’S EXPORTS TO CHINA SUPPORTED 6,000 AMERICAN JOBS IN 2015
Top Goods Export Markets, 20161. China $902 million2. Mexico $547 million3. Canada $496 million4. Japan $264 million5. South Korea $103 million
Top Services Export Markets, 20151. British Overseas Territories (Carib.) $199 million2. United Kingdom $135 million3. Canada $95 million4. China $73 million5. Japan $57 million
Top Services Exported to China, 20151. Travel $30 million2. Education $12 million3. Credit-Related Services $10 million4. Misc. Financial Services $8.1 million5. Equipment Install., Maint., & Repair $5.5 million
Top Goods Exported to China, 20161. Oilseeds & Grains $826 million2. Ag. & Construction Machinery $28 million3. Misc. Crops $9.8 million4. Meat Products $8.0 million5. Dairy Products $4.1 million
State exports of goods to China, in millions
State exports of services to China, in millions
EXPORTS TO CHINA
298%growth in exports of goods to China
533%growth in exports of
services to China
compared to 94% growth in exports of services to
rest of world
compared to 23% growth in exports of
goods to rest of world

© 2017 US-China Business Council • Source: Estimated by The Trade Partnership 55
Note: Full-year services export data are available only through year-end 2015
TENNESSEE’S EXPORTS TO CHINA SUPPORTED 18,800 AMERICAN JOBS IN 2015
Top Goods Export Markets, 20161. Canada $8.7 billion2. Mexico $4.5 billion3. China $2.4 billion4. Japan $1.8 billion5. Belgium $1.3 billion
Top Services Export Markets, 20151. United Kingdom $900 million2. Canada $844 million3. China $715 million4. Japan $547 million5. Mexico $538 million
Top Services Exported to China, 20151. Travel $378 million2. Education $93 million3. Air Freight & Port Services $50 million4. Equipment Install., Maint., & Repair $39 million5. Royalties from Industrial Processes $36 million
Top Goods Exported to China, 20161. Basic Chemicals $324 million2. Medical Equipment & Supplies $298 million3. Oilseeds & Grains $294 million4. Resins & Synthetic Fibers $230 million5. Navigational & Meas. Instruments $180 million
State exports of goods to China, in billions
State exports of services to China, in millions
EXPORTS TO CHINA
Tennessee
137%growth in exports of goods to China
390%growth in exports of
services to China
compared to 58% growth in exports of services to
rest of worldcompared to 51% growth in exports of
goods to rest of world

56 Source: Estimated by The Trade Partnership • © 2017 US-China Business Council
Note: Full-year services export data are available only through year-end 2015
TEXAS’ EXPORTS TO CHINA SUPPORTED 75,800 AMERICAN JOBS IN 2015
Top Goods Export Markets, 20161. Mexico $92 billion2. Canada $19 billion3. China $10 billion4. Brazil $7.0 billion5. South Korea $6.8 billion
Top Services Export Markets, 20151. United Kingdom $4.9 billion2. Canada $4.2 billion3. China $3.7 billion4. Japan $3.5 billion5. Switzerland $2.9 billion
Top Services Exported to China, 20151. Travel $1.0 billion2. Education $615 million3. Royalties from Industrial Processes $376 million4. Passenger Fares $349 million5. Equipment Install., Maint., & Repair $236 million
Top Goods Exported to China, 20161. Basic Chemicals $1.6 billion2. Oil & Gas $1.2 billion3. Resins & Synthetic Fibers $1.2 billion4. Semiconductors & Components $598 million5. Industrial Machinery $576 million
State exports of goods to China, in billions
State exports of services to China, in billions
EXPORTS TO CHINA
Texas
44%growth in exports of goods to China
301%growth in exports of
services to China
compared to 73% growth in exports of
services to rest of world
compared to 53% growth in exports of
goods to rest of world

© 2017 US-China Business Council • Source: Estimated by The Trade Partnership 57
Note: Full-year services export data are available only through year-end 2015
Utah
UTAH’S EXPORTS TO CHINA SUPPORTED 7,100 AMERICAN JOBS IN 2015
Top Goods Export Markets, 20161. United Kingdom $3.1 billion2. Hong Kong $1.5 billion3. Canada $1.4 billion4. Mexico $742 million5. China $630 million
Top Services Export Markets, 20151. United Kingdom $538 million2. Canada $492 million3. Japan $376 million4. China $367 million5. British Overseas Territories (Carib.) $337 million
Top Services Exported to China, 20151. Travel $118 million2. Education $62 million3. Passenger Fares $38 million4. Equipment Install., Maint., & Repair $21 million5. Computer Software $20 million
Top Goods Exported to China, 20161. Semiconductors & Components $136 million2. Navigational & Meas. Instruments $83 million3. Misc. Chemical Preparations $57 million4. Scrap Products $49 million5. Medical Equipment & Supplies $41 million
EXPORTS TO CHINA
State exports of goods to China, in millions
State exports of services to China, in millions
148%growth in exports of goods to China
361%growth in exports of
services to China
compared to 93% growth in exports of
services to rest of world
compared to 76% growth in exports of
goods to rest of world

58 Source: Estimated by The Trade Partnership • © 2017 US-China Business Council
Note: Full-year services export data are available only through year-end 2015
VERMONT’S EXPORTS TO CHINA SUPPORTED 2,000 AMERICAN JOBS IN 2015
Top Goods Export Markets, 20161. Canada $1.2 billion2. Hong Kong $350 million3. Malaysia $192 million4. China $178 million5. South Korea $154 million
Top Services Export Markets, 20151. China $88 million2. Canada $84 million3. United Kingdom $83 million4. Mexico $60 million5. Japan $60 million
Top Services Exported to China, 20151. Travel $48 million2. Education $24 million3. Trademarks $2.5 million4. Royalties from Industrial Processes $2.2 million5. Equipment Install., Maint., & Repair $2.1 million
Top Goods Exported to China, 20161. Semiconductors & Components $74 million2. Navigational & Meas. Instruments $19 million3. Sawmill & Wood Products $15 million4. Dairy Products $14 million5. Industrial Machinery $7.4 million
State exports of services to China, in millions
EXPORTS TO CHINA
Vermont
-6%growth in exports of goods to China
529%growth in exports of
services to China
compared to 59% growth in exports of services to
rest of world
compared to -24% growth in exports of goods to rest
of world
State exports of goods to China, in millions

© 2017 US-China Business Council • Source: Estimated by The Trade Partnership 59
Note: Full-year services export data are available only through year-end 2015
VIRGINIA’S EXPORTS TO CHINA SUPPORTED 17,300 AMERICAN JOBS IN 2015
Top Goods Export Markets, 20161. Canada $2.9 billion2. China $1.4 billion3. Mexico $1.1 billion4. United Kingdom $899 million5. Germany $812 million
Top Services Export Markets, 20151. United Kingdom $1.7 billion2. Canada $1.4 billion3. Japan $1.1 billion4. China $1.0 billion5. Germany $780 million
Top Services Exported to China, 20151. Travel $335 million2. Education $188 million3. Passenger Fares $88 million4. Ocean Freight & Port Services $56 million5. Architect., Engin., & Tech. Services $56 million
Top Goods Exported to China, 20161. Pulp & Paperboard Mill Products $138 million2. Meat Products $131 million3. Scrap Products $131 million4. Resins & Synthetic Fibers $121 million5. Pharmaceuticals & Medicines $102 million
State exports of goods to China, in billions State exports
of services to China, in millions
EXPORTS TO CHINA
Virginia
47%growth in exports of goods to China
256%growth in exports of
services to China
compared to 70% growth in exports of
services to rest of world
compared to 11% growth
in exports of goods to rest
of world

60 Source: Estimated by The Trade Partnership • © 2017 US-China Business Council
Note: Full-year services export data are available only through year-end 2015
WASHINGTON’S EXPORTS TO CHINA SUPPORTED 83,800 AMERICAN JOBS IN 2015
Top Goods Export Markets, 20161. China $12 billion2. Canada $6.9 billion3. Japan $5.6 billion4. United Arab Emirates $4.1 billion5. United Kingdom $3.5 billion
Top Services Export Markets, 20151. Japan $1.9 billion2. Canada $1.8 billion3. United Kingdom $1.6 billion4. China $1.3 billion5. Germany $1.1 billion
Top Services Exported to China, 20151. Travel $343 million2. Computer Software $282 million3. Education $264 million4. Passenger Fares $96 million5. Ocean Freight & Port Services $85 million
Top Goods Exported to China, 20161. Aerospace Products & Parts $8.8 billion2. Motor Vehicles $641 million3. Navigational & Meas. Instruments $393 million4. Timber & Logs $313 million5. Pulp & Paperboard Mill Products $218 million
State exports of goods to China, in billions
State exports of services to China, in billions
EXPORTS TO CHINA
Washington
179%growth in exports of goods to
China
213%growth in exports of
services to China
compared to 74% growth in exports of services to rest
of world
compared to 72% growth in exports of
goods to rest of world

© 2017 US-China Business Council • Source: Estimated by The Trade Partnership 61
Note: Full-year services export data are available only through year-end 2015
WEST VIRGINIA’S EXPORTS TO CHINA SUPPORTED 3,700 AMERICAN JOBS IN 2015
Top Goods Export Markets, 20161. Canada $1.5 billion2. China $471 million3. Brazil $269 million4. Belgium $269 million5. Netherlands $267 million
Top Services Export Markets, 20151. China $160 million2. Canada $145 million3. United Kingdom $128 million4. Japan $105 million5. Mexico $100 million
Top Services Exported to China, 20151. Travel $73 million2. Education $37 million3. Equipment Install., Maint., & Repair $15 million4. Royalties from Industrial Processes $9.9 million5. Trademarks $6.7 million
Top Goods Exported to China, 20161. Resins & Synthetic Fibers $199 million2. Sawmill & Wood Products $85 million3. Nonferrous Metals & Processing $28 million4. Basic Chemicals $22 million5. Medical Equipment & Supplies $20 million
State exports of goods to China, in millions
State exports of services to China, in millions
EXPORTS TO CHINA
West Virginia
156%growth in exports of goods to China
378%growth in exports of
services to China
compared to 61% growth in exports of
services to rest of worldcompared to 50% growth in exports of
goods to rest of world

62 Source: Estimated by The Trade Partnership • © 2017 US-China Business Council
Note: Full-year services export data are available only through year-end 2015
WISCONSIN’S EXPORTS TO CHINA SUPPORTED 14,000 AMERICAN JOBS IN 2015
Top Goods Export Markets, 20161. Canada $6.5 billion2. Mexico $3.0 billion3. China $1.7 billion4. Japan $942 million5. United Kingdom $780 million
Top Services Export Markets, 20151. Canada $526 million2. United Kingdom $462 million3. China $428 million4. Japan $398 million5. Mexico $276 million
Top Services Exported to China, 20151. Travel $160 million2. Education $116 million3. Computer Software $29 million4. Royalties from Industrial Processes $28 million5. Trademarks $25 million
Top Goods Exported to China, 20161. Navigational & Meas. Instruments $335 million2. Oilseeds & Grains $250 million3. Semiconductors & Components $71 million4. Misc. General Purpose Machinery $54 million5. Motor Vehicles $50 million
State exports of goods to China, in billions
State exports of services to China, in millions
EXPORTS TO CHINA
Wisconsin
81%growth in exports of goods to China
428%growth in exports of
services to China
compared to 69% growth in exports of services to
rest of world
compared to 20% growth in exports of
goods to rest of world

© 2017 US-China Business Council • Source: Estimated by The Trade Partnership 63
Note: Full-year services export data are available only through year-end 2015
WYOMING’S EXPORTS TO CHINA SUPPORTED 800 AMERICAN JOBS IN 2015
Top Goods Export Markets, 20161. Brazil $190 million2. Canada $185 million3. Indonesia $80 million4. Japan $66 million5. China $56 million
Top Services Export Markets, 20151. Canada $70 million2. China $55 million3. United Kingdom $50 million4. Mexico $37 million5. Japan $33 million
Top Services Exported to China, 20151. Travel $22 million2. Equipment Install., Maint., & Repair $10 million3. Operational Leasing $8.2 million4. Education $7.0 million5. Trademarks $3.8 million
Top Goods Exported to China, 20161. Basic Chemicals $29 million2. Oilseeds & Grains $15 million3. Misc. Crops $8.6 million4. Navigational & Meas. Instruments $678,000 5. Misc. Animal Productions $455,000
State exports of goods to China, in millions
State exports of services to China, in millions
EXPORTS TO CHINA
Wyoming
234%growth in exports of goods to China
296%growth in exports of
services to China
compared to 45% growth in exports of services to rest
of world
compared to 33% growth in
exports of goods to rest of world