urmila chemopharma pvt. ltd.environmentclearance.nic.in/writereaddata/eia/20062019dx...environmental...
TRANSCRIPT

ENVIRONMENTAL IMPACT ASSESSMENT REPORT
& ENVIRONMENTAL MANAGEMENT PLAN
OF
URMILA CHEMOPHARMA PVT. LTD. LOCATED AT
Plot No.: F-24, MIDC, Chincholi Industrial Area, Chincholi Village, Mohal Taluk, Solapur District, Maharashtra state
FOR
PROPOSED BULK DRUG INTERMEDIATES MANUFACTURING UNIT
Proposal for
ENVIRONMENTAL CLEARANCE Industry falls under 5(f) ‘A’ Category as per the EIA Notification, 2006
Area: 1.48 Acres (0.6 Hectares) Baseline Period: March to May, 2019
Project Proponent Mr. Lolabhattu Chinna Butchiraju Managing Director Flat No. 46, Hiramoti Tower, 04th Floor Vidigharkul, Near Hyderabad market yard Sonia Nagar, Solapur District Maharashtra State
Prepared by:
Rightsource Industrial Solutions Pvt. Ltd Plot No: 203, H. No: 5-36/203, Prashanthi Nagar, IDA, Kukatpally, Hyderabad – 500072. Ph: 040-23070602, 23075699. Email: [email protected]. NABET Accreditation No: NABET/EIA/1821/RA 0100

UNDERTAKING BY PROJECT AUTHORITIES

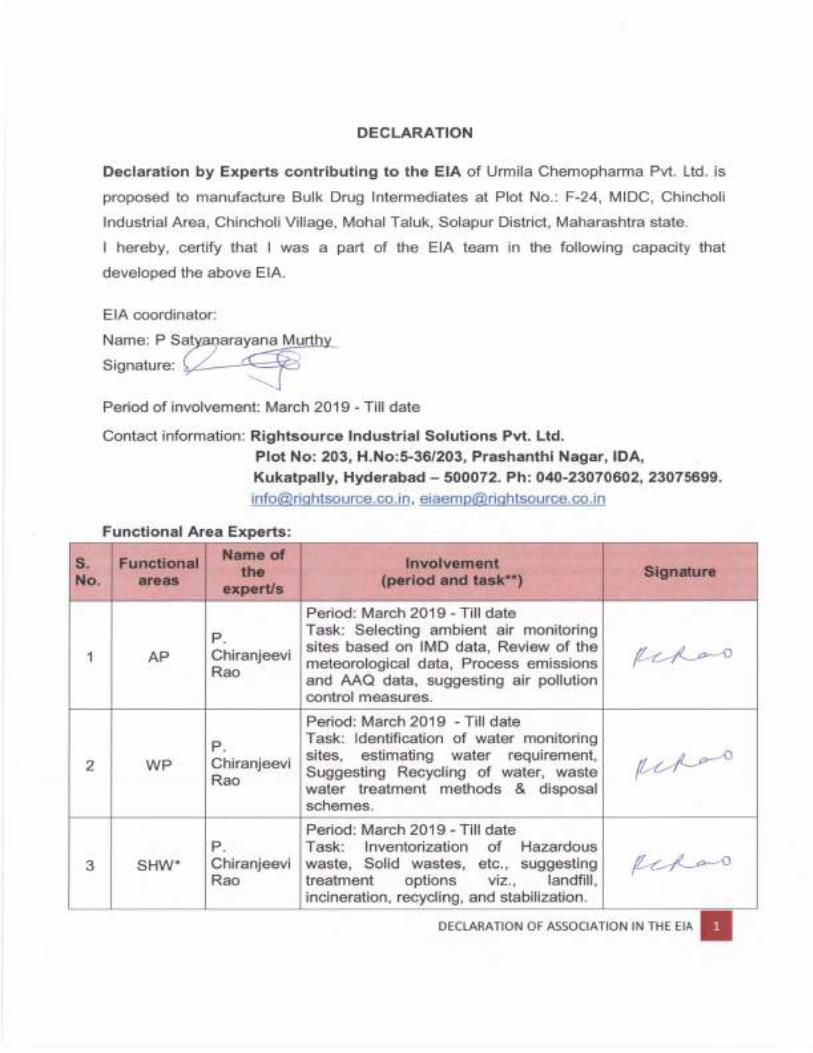
DISCLOSURE OF CONSULTANTS ENGAGED


COPY OF TERMS OF REFERENCE [TOR]
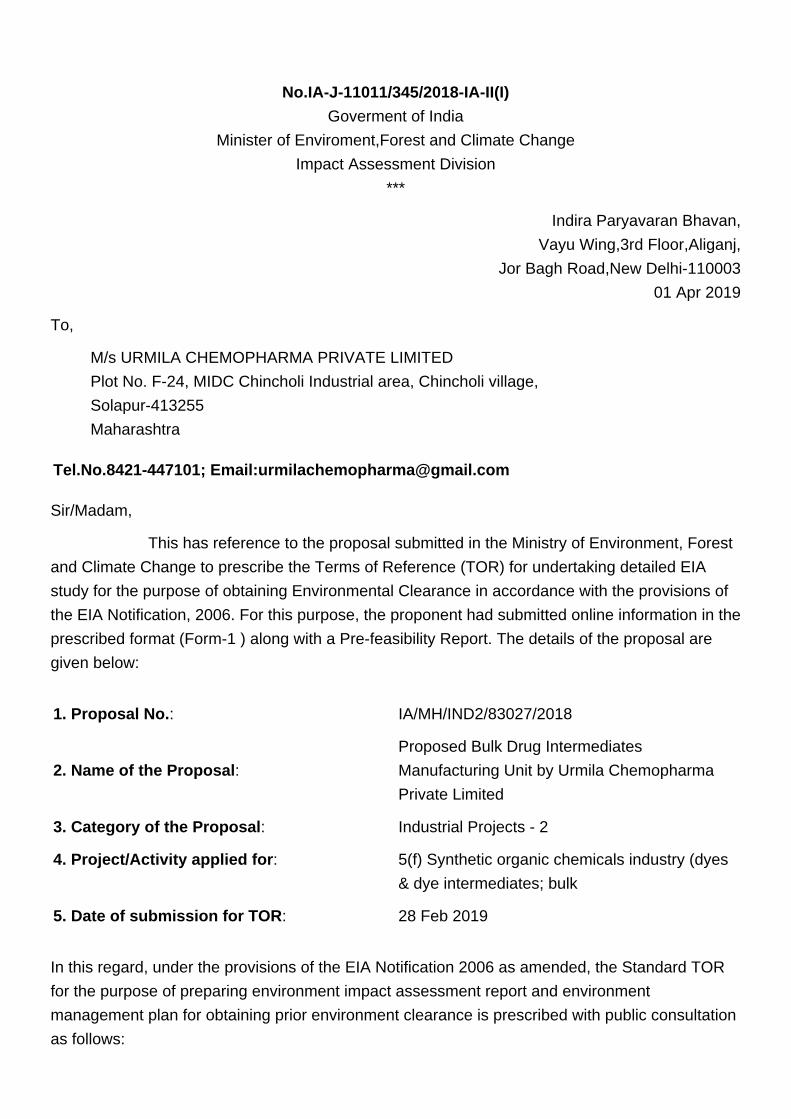
No.IA-J-11011/345/2018-IA-II(I)
Goverment of India
Minister of Enviroment,Forest and Climate Change
Impact Assessment Division
***
Indira Paryavaran Bhavan,
Vayu Wing,3rd Floor,Aliganj,
Jor Bagh Road,New Delhi-110003
01 Apr 2019
To,
M/s URMILA CHEMOPHARMA PRIVATE LIMITED
Plot No. F-24, MIDC Chincholi Industrial area, Chincholi village,
Solapur-413255
Maharashtra
Tel.No.8421-447101; Email:[email protected]
Sir/Madam,
This has reference to the proposal submitted in the Ministry of Environment, Forest
and Climate Change to prescribe the Terms of Reference (TOR) for undertaking detailed EIA
study for the purpose of obtaining Environmental Clearance in accordance with the provisions of
the EIA Notification, 2006. For this purpose, the proponent had submitted online information in the
prescribed format (Form-1 ) along with a Pre-feasibility Report. The details of the proposal are
given below:
1. Proposal No.: IA/MH/IND2/83027/2018
2. Name of the Proposal:
Proposed Bulk Drug Intermediates
Manufacturing Unit by Urmila Chemopharma
Private Limited
3. Category of the Proposal: Industrial Projects - 2
4. Project/Activity applied for: 5(f) Synthetic organic chemicals industry (dyes
& dye intermediates; bulk
5. Date of submission for TOR: 28 Feb 2019
In this regard, under the provisions of the EIA Notification 2006 as amended, the Standard TOR
for the purpose of preparing environment impact assessment report and environment
management plan for obtaining prior environment clearance is prescribed with public consultation
as follows:

STANDARD TERMS OF REFERENCE (TOR) FOR EIA/EMP REPORT FOR PROJECTS/ACTIVITIES REQUIRING ENVIRONMENT CLEARANCE
5(f):STANDARD TERMS OF REFERENCE FOR CONDUCTINGENVIRONMENT IMPACT ASSESSMENT STUDY FOR SYNTHETICORGANIC CHEMICALS INDUSTRY (DYES & DYEINTERMEDIATES; BULK DRUGS AND INTERMEDIATESEXCLUDING DRUG FORMULATIONS; SYNTHETIC RUBBERS;BASIC ORGANIC CHEMICALS, OTHER SYNTHETIC ORGANICCHEMICALS AND CHEMICAL INTERMEDIATES) ANDINFORMATION TO BE INCLUDED IN EIA/EMP REPORT
A. STANDARD TERMS OF REFERENCE
1) Executive Summary
2) Introduction
i. Details of the EIA Consultant including NABET accreditation
ii. Information about the project proponent
iii. Importance and benefits of the project
3) Project Description
i. Cost of project and time of completion.
ii. Products with capacities for the proposed project.
iii. If expansion project, details of existing products with capacities and whether adequate landis available for expansion, reference of earlier EC if any.
iv. List of raw materials required and their source along with mode of transportation.
v. Other chemicals and materials required with quantities and storage capacities
vi. Details of Emission, effluents, hazardous waste generation and their management.
vii. Requirement of water, power, with source of supply, status of approval, water balance diagram,man-power requirement (regular and contract)
viii. Process description along with major equipments and machineries, process flow sheet(quantative) from raw material to products to be provided
ix. Hazard identification and details of proposed safety systems.
x. Expansion/modernization proposals:
c. Copy of all the Environmental Clearance(s) including Amendments thereto obtained forthe project from MOEF/SEIAA shall be attached as an Annexure. A certified copy of thelatest Monitoring Report of the Regional Office of the Ministry of Environment and Forestsas per circular dated 30th May, 2012 on the status of compliance of conditions stipulatedin all the existing environmental clearances including Amendments shall be provided. In
STANDARD TERMS OF REFERENCE (TOR) FOR EIA/EMP REPORT FORPROJECTS/ACTIVITIES REQUIRING ENVIRONMENT CLEARANCE
addition, status of compliance of Consent to Operate for the ongoing Iexisting operationof the project from SPCB shall be attached with the EIA-EMP report.
d. In case the existing project has not obtained environmental clearance, reasons for nottaking EC under the provisions of the EIA Notification 1994 and/or EIA Notification2006 shall be provided. Copies of Consent to Establish/No Objection Certificate andConsent to Operate (in case of units operating prior to EIA Notification 2006, CTE andCTO of FY 2005-2006) obtained from the SPCB shall be submitted. Further, compliancereport to the conditions of consents from the SPCB shall be submitted.
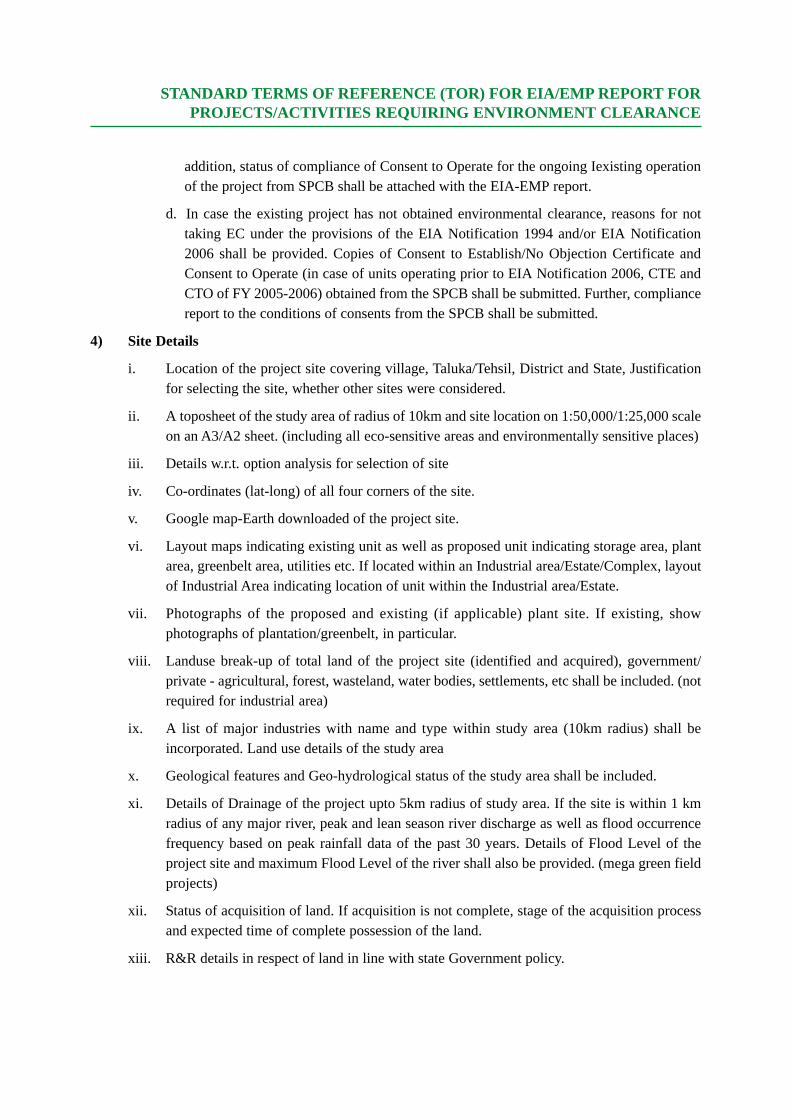
4) Site Details
i. Location of the project site covering village, Taluka/Tehsil, District and State, Justificationfor selecting the site, whether other sites were considered.
ii. A toposheet of the study area of radius of 10km and site location on 1:50,000/1:25,000 scaleon an A3/A2 sheet. (including all eco-sensitive areas and environmentally sensitive places)
iii. Details w.r.t. option analysis for selection of site
iv. Co-ordinates (lat-long) of all four corners of the site.
v. Google map-Earth downloaded of the project site.
vi. Layout maps indicating existing unit as well as proposed unit indicating storage area, plantarea, greenbelt area, utilities etc. If located within an Industrial area/Estate/Complex, layoutof Industrial Area indicating location of unit within the Industrial area/Estate.
vii. Photographs of the proposed and existing (if applicable) plant site. If existing, showphotographs of plantation/greenbelt, in particular.
viii. Landuse break-up of total land of the project site (identified and acquired), government/private - agricultural, forest, wasteland, water bodies, settlements, etc shall be included. (notrequired for industrial area)
ix. A list of major industries with name and type within study area (10km radius) shall beincorporated. Land use details of the study area
x. Geological features and Geo-hydrological status of the study area shall be included.
xi. Details of Drainage of the project upto 5km radius of study area. If the site is within 1 kmradius of any major river, peak and lean season river discharge as well as flood occurrencefrequency based on peak rainfall data of the past 30 years. Details of Flood Level of theproject site and maximum Flood Level of the river shall also be provided. (mega green fieldprojects)
xii. Status of acquisition of land. If acquisition is not complete, stage of the acquisition processand expected time of complete possession of the land.
xiii. R&R details in respect of land in line with state Government policy.
STANDARD TERMS OF REFERENCE (TOR) FOR EIA/EMP REPORT FOR PROJECTS/ACTIVITIES REQUIRING ENVIRONMENT CLEARANCE
5) Forest and wildlife related issues (if applicable):
i. Permission and approval for the use of forest land (forestry clearance), if any, andrecommendations of the State Forest Department. (if applicable)
ii. Landuse map based on High resolution satellite imagery (GPS) of the proposed site delineatingthe forestland (in case of projects involving forest land more than 40 ha)
iii. Status of Application submitted for obtaining the stage I forestry clearance along with lateststatus shall be submitted.
iv. The projects to be located within 10 km of the National Parks, Sanctuaries, Biosphere Reserves,Migratory Corridors of Wild Animals, the project proponent shall submit the map dulyauthenticated by Chief Wildlife Warden showing these features vis-à-vis the project locationand the recommendations or comments of the Chief Wildlife Warden-thereon.
v. Wildlife Conservation Plan duly authenticated by the Chief Wildlife Warden of the StateGovernment for conservation of Schedule I fauna, if any exists in the study area.
vi. Copy of application submitted for clearance under the Wildlife (Protection) Act, 1972, to theStanding Committee of the National Board for Wildlife.
6) Environmental Status
i. Determination of atmospheric inversion level at the project site and site-specific micro-meteorological data using temperature, relative humidity, hourly wind speed and directionand rainfall.
ii. AAQ data (except monsoon) at 8 locations for PM10, PM2.5, SO2, NOX, CO and otherparameters relevant to the project shall be collected. The monitoring stations shall be basedCPCB guidelines and take into account the pre-dominant wind direction, population zoneand sensitive receptors including reserved forests.
iii. Raw data of all AAQ measurement for 12 weeks of all stations as per frequency given in theNAQQM Notification of Nov. 2009 along with - min., max., average and 98% values foreach of the AAQ parameters from data of all AAQ stations should be provided as an annexureto the EIA Report.
iv. Surface water quality of nearby River (100m upstream and downstream of discharge point)and other surface drains at eight locations as per CPCB/MoEF&CC guidelines.
v. Whether the site falls near to polluted stretch of river identified by the CPCB/MoEF&CC, ifyes give details.
vi. Ground water monitoring at minimum at 8 locations shall be included.
vii. Noise levels monitoring at 8 locations within the study area.
viii. Soil Characteristic as per CPCB guidelines.
ix. Traffic study of the area, type of vehicles, frequency of vehicles for transportation of materials,additional traffic due to proposed project, parking arrangement etc.

STANDARD TERMS OF REFERENCE (TOR) FOR EIA/EMP REPORT FORPROJECTS/ACTIVITIES REQUIRING ENVIRONMENT CLEARANCE
x. Detailed description of flora and fauna (terrestrial and aquatic) existing in the study areashall be given with special reference to rare, endemic and endangered species. If Schedule-I fauna are found within the study area, a Wildlife Conservation Plan shall be prepared andfurnished.
xi. Socio-economic status of the study area.
7) Impact and Environment Management Plan
i. Assessment of ground level concentration of pollutants from the stack emission based onsite-specific meteorological features. In case the project is located on a hilly terrain, theAQIP Modelling shall be done using inputs of the specific terrain characteristics fordetermining the potential impacts of the project on the AAQ. Cumulative impact of all sourcesof emissions (including transportation) on the AAQ of the area shall be assessed. Details ofthe model used and the input data used for modelling shall also be provided. The air qualitycontours shall be plotted on a location map showing the location of project site, habitationnearby, sensitive receptors, if any.
ii. Water Quality modelling - in case of discharge in water body
iii. Impact of the transport of the raw materials and end products on the surrounding environmenthall be assessed and provided. In this regard, options for transport of raw materials andfinished products and wastes (large quantities) by rail or rail-cum road transport or conveyor-cum-rail transport shall be examined.
iv. A note on treatment of wastewater from different plant operations, extent recycled and reusedfor different purposes shall be included. Complete scheme of effluent treatment. Characteristicsof untreated and treated effluent to meet the prescribed standards of discharge under E(P)Rules.
v. Details of stack emission and action plan for control of emissions to meet standards.
vi. Measures for fugitive emission control
vii. Details of hazardous waste generation and their storage, utilization and management. Copiesof MOU regarding utilization of solid and hazardous waste in cement plant shall also beincluded. EMP shall include the concept of waste-minimization, recycle/reuse/recovertechniques, Energy conservation, and natural resource conservation.
viii. Proper utilization of fly ash shall be ensured as per Fly Ash Notification, 2009. A detailedplan of action shall be provided.
ix. Action plan for the green belt development plan in 33 % area i.e. land with not less than1,500 trees per ha. Giving details of species, width of plantation, planning schedule etc. shallbe included. The green belt shall be around the project boundary and a scheme for greeningof the roads used for the project shall also be incorporated.
x. Action plan for rainwater harvesting measures at plant site shall be submitted to harvestrainwater from the roof tops and storm water drains to recharge the ground water and also to
STANDARD TERMS OF REFERENCE (TOR) FOR EIA/EMP REPORT FOR PROJECTS/ACTIVITIES REQUIRING ENVIRONMENT CLEARANCE
use for the various activities at the project site to conserve fresh water and reduce the waterrequirement from other sources.
xi. Total capital cost and recurring cost/annum for environmental pollution control measuresshall be included.
xii. Action plan for post-project environmental monitoring shall be submitted.
xiii. Onsite and Offsite Disaster (natural and Man-made) Preparedness and Emergency ManagementPlan including Risk Assessment and damage control. Disaster management plan should belinked with District Disaster Management Plan.
8) Occupational health
i. Plan and fund allocation to ensure the occupational health & safety of all contract and casualworkers
ii. Details of exposure specific health status evaluation of worker. If the workers' health is beingevaluated by pre designed format, chest x rays, Audiometry, Spirometry, Vision testing (Far& Near vision, colour vision and any other ocular defect) ECG, during pre placement andperiodical examinations give the details of the same. Details regarding last month analyzeddata of above mentioned parameters as per age, sex, duration of exposure and departmentwise.
iii. Details of existing Occupational & Safety Hazards. What are the exposure levels of hazardsand whether they are within Permissible Exposure level (PEL). If these are not within PEL,what measures the company has adopted to keep them within PEL so that health of the workerscan be preserved,
iv. Annual report of heath status of workers with special reference to Occupational Health andSafety.
9) Corporate Environment Policy
i. Does the company have a well laid down Environment Policy approved by its Board ofDirectors? If so, it may be detailed in the EIA report.
ii. Does the Environment Policy prescribe for standard operating process / procedures to bringinto focus any infringement / deviation / violation of the environmental or forest norms /conditions? If so, it may be detailed in the EIA.
iii. What is the hierarchical system or Administrative order of the company to deal with theenvironmental issues and for ensuring compliance with the environmental clearanceconditions? Details of this system may be given.
iv. Does the company have system of reporting of non compliances / violations of environmentalnorms to the Board of Directors of the company and / or shareholders or stakeholders atlarge? This reporting mechanism shall be detailed in the EIA report
STANDARD TERMS OF REFERENCE (TOR) FOR EIA/EMP REPORT FORPROJECTS/ACTIVITIES REQUIRING ENVIRONMENT CLEARANCE
10) Details regarding infrastructure facilities such as sanitation, fuel, restroom etc. to be provided to thelabour force during construction as well as to the casual workers including truck drivers duringoperation phase.
11) Enterprise Social Commitment (ESC)
i. Adequate funds (at least 2.5 % of the project cost) shall be earmarked towards the EnterpriseSocial Commitment based on Public Hearing issues and item-wise details along with timebound action plan shall be included. Socio-economic development activities need to beelaborated upon.
12) Any litigation pending against the project and/or any direction/order passed by any Court of Lawagainst the project, if so, details thereof shall also be included. Has the unit received any noticeunder the Section 5 of Environment (Protection) Act, 1986 or relevant Sections of Air and WaterActs? If so, details thereof and compliance/ATR to the notice(s) and present status of the case.
13) 'A tabular chart with index for point wise compliance of above TOR.
B. SPECIFIC TERMS OF REFERENCEFOREIASTUDIES FOR SYNTHETICORGANIC CHEMICALS INDUSTRY (DYES & DYE INTERMEDIATES;BULK DRUGS AND INTERMEDIATES EXCLUDING DRUGFORMULATIONS; SYNTHETIC RUBBERS; BASIC ORGANICCHEMICALS, OTHER SYNTHETIC ORGANIC CHEMICALS ANDCHEMICAL INTERMEDIATES)
1. Detailsonsolvents to be used,measuresfor solventrecovery and for emissions control.
2. Details of process emissions from the proposed unit and its arrangement to control.
3. Ambient air quality data should include VOC, otherprocess-specificpollutants* like NH3*, chlorine*,HCl*, HBr*, H2S*, HF*,etc.,(*-asapplicable)
4. Work zone monitoring arrangements for hazardous chemicals.
5. Detailed effluent treatment scheme including ssegregation of effluent streams for units adopting'Zero' liquid discharge.
6. Action plan for odour control to be submitted.
7. A copy of the Memorandum of Understanding signed with cement manufacturers indicating clearlythat they co-process organic solid/hazardous waste generated.
8. Authorization/Membership for the disposal of liquid effluent in CETP and solid/hazardous waste inTSDF, if any.
9. Action plan for utilization of MEE/dryers salts.
10. Material Safety Data Sheet for all the Chemicals are being used/will be used.
11. Authorization/Membership for the disposal of solid/hazardous waste in TSDF.

STANDARD TERMS OF REFERENCE (TOR) FOR EIA/EMP REPORT FOR PROJECTS/ACTIVITIES REQUIRING ENVIRONMENT CLEARANCE
12. Details of incinerator if to be installed.
13. Risk assessment for storage and handling of hazardous chemicals/solvents. Action plan for handling& safety system to be incorporated.
14. Arrangements for ensuring health and safety of workers engaged in handling of toxic materials.
***

TOR COMPLIANCE
ToR Compliance Urmila Chemopharma Pvt. Ltd.
ToR COMPLIANCE
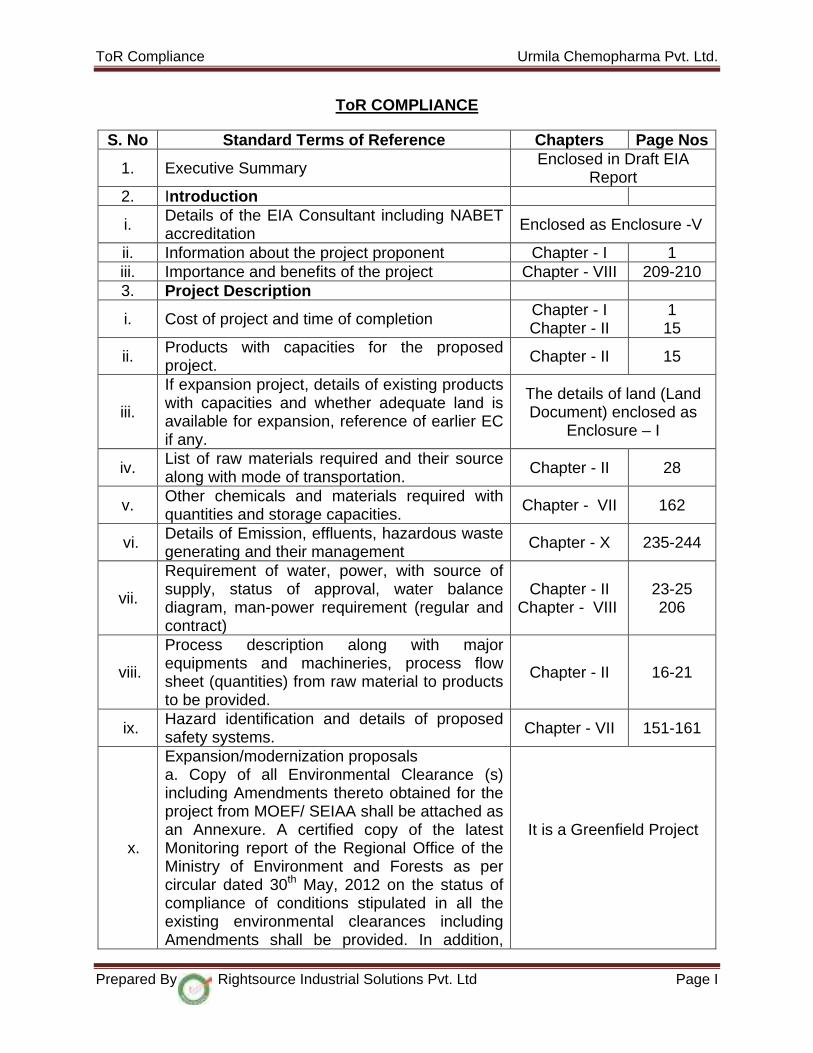
S. No Standard Terms of Reference Chapters Page Nos
1. Executive Summary Enclosed in Draft EIA Report
2. Introduction
i. Details of the EIA Consultant including NABET accreditation Enclosed as Enclosure -V
ii. Information about the project proponent Chapter - I 1 iii. Importance and benefits of the project Chapter - VIII 209-210 3. Project Description
i. Cost of project and time of completion Chapter - I Chapter - II
1 15
ii. Products with capacities for the proposed project. Chapter - II 15
iii.
If expansion project, details of existing products with capacities and whether adequate land is available for expansion, reference of earlier EC if any.
The details of land (Land Document) enclosed as
Enclosure – I
iv. List of raw materials required and their source along with mode of transportation. Chapter - II 28
v. Other chemicals and materials required with quantities and storage capacities. Chapter - VII 162
vi. Details of Emission, effluents, hazardous waste generating and their management Chapter - X 235-244
vii.
Requirement of water, power, with source of supply, status of approval, water balance diagram, man-power requirement (regular and contract)
Chapter - II Chapter - VIII
23-25 206
viii.
Process description along with major equipments and machineries, process flow sheet (quantities) from raw material to products to be provided.
Chapter - II 16-21
ix. Hazard identification and details of proposed safety systems. Chapter - VII 151-161
x.
Expansion/modernization proposals a. Copy of all Environmental Clearance (s)including Amendments thereto obtained for the project from MOEF/ SEIAA shall be attached as an Annexure. A certified copy of the latest Monitoring report of the Regional Office of the Ministry of Environment and Forests as per circular dated 30th May, 2012 on the status of compliance of conditions stipulated in all the existing environmental clearances including Amendments shall be provided. In addition,
It is a Greenfield Project
Prepared By Rightsource Industrial Solutions Pvt. Ltd Page I
ToR Compliance Urmila Chemopharma Pvt. Ltd.
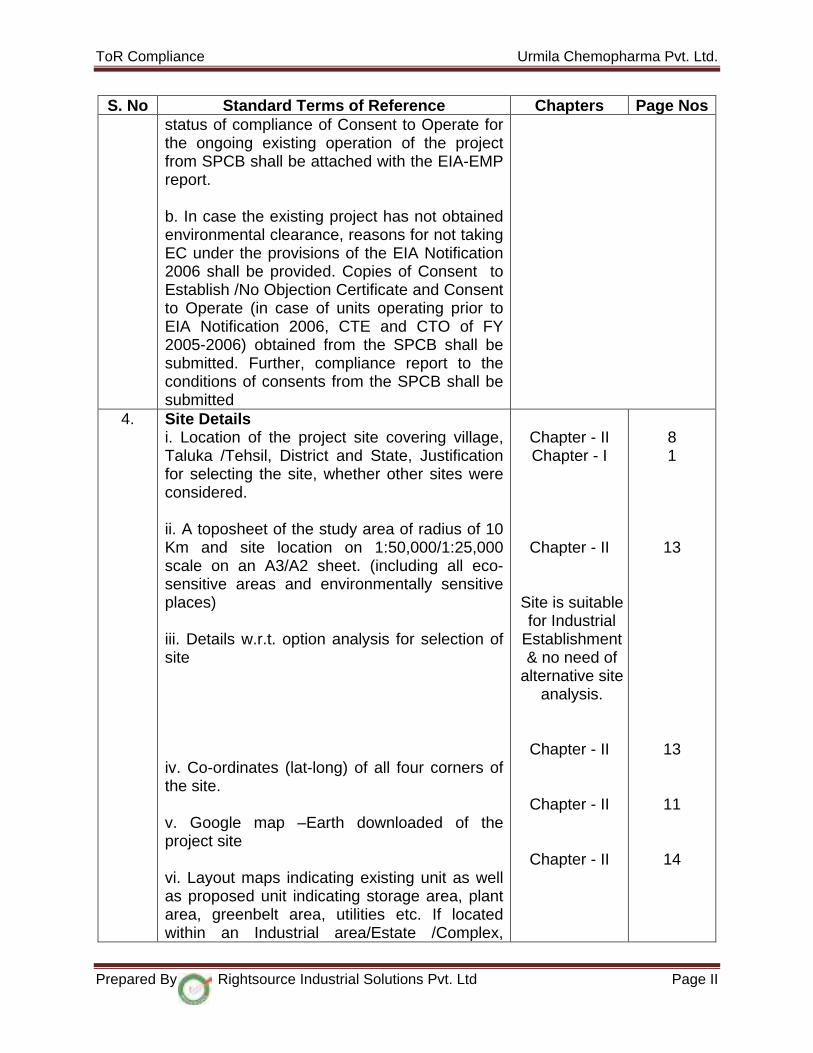
S. No Standard Terms of Reference Chapters Page Nos status of compliance of Consent to Operate for the ongoing existing operation of the project from SPCB shall be attached with the EIA-EMP report.
b. In case the existing project has not obtainedenvironmental clearance, reasons for not taking EC under the provisions of the EIA Notification 2006 shall be provided. Copies of Consent to Establish /No Objection Certificate and Consent to Operate (in case of units operating prior to EIA Notification 2006, CTE and CTO of FY 2005-2006) obtained from the SPCB shall be submitted. Further, compliance report to the conditions of consents from the SPCB shall be submitted
4. Site Detailsi. Location of the project site covering village,Taluka /Tehsil, District and State, Justification for selecting the site, whether other sites were considered.
ii. A toposheet of the study area of radius of 10Km and site location on 1:50,000/1:25,000 scale on an A3/A2 sheet. (including all eco-sensitive areas and environmentally sensitive places)
iii. Details w.r.t. option analysis for selection ofsite
iv. Co-ordinates (lat-long) of all four corners ofthe site.
v. Google map –Earth downloaded of theproject site
vi. Layout maps indicating existing unit as wellas proposed unit indicating storage area, plant area, greenbelt area, utilities etc. If located within an Industrial area/Estate /Complex,
Chapter - II Chapter - I
Chapter - II
Site is suitable for Industrial
Establishment & no need of
alternative site analysis.
Chapter - II
Chapter - II
Chapter - II
81
13
13
11
14
Prepared By Rightsource Industrial Solutions Pvt. Ltd Page II

ToR Compliance Urmila Chemopharma Pvt. Ltd.
S. No Standard Terms of Reference Chapters Page Nos layout of Industrial Area indicating location of unit within the Industrial area/Estate.
vii. Photographs of the proposed and existing (ifapplicable) plant site. If existing, show photographs of plantation /greenbelt, in particular.
viii. Land use break up of total land of theproject site (identified and acquired), government/ private-agricultural, forest, wasteland, water bodies, settlement, etc shall be included. (not required for industrial area)
ix. A list of major industries with name and typewithin study area (10 Km radius) shall be incorporated. Land use details of the study area
x. Geological features and Geo-hydrologicalstatus of the study area shall be included.
xi. Details of Drainage of the project upto 5 kmradius of study area. If the site is within 1 km radius of any major river, peak and lean season river discharge as well as flood occurrence frequency based on peak rainfall data of thee past 30 years, Details of Flood Level of the project site and maximum Flood level of the river shall also be provided. (mega green field projects)
xii. Status of acquisition of land. If acquisition isnot complete, stage of the acquisition process and expected time of complete possession of the land.
xiii. R&R details in respect of land in line withstate Government policy.
Chapter - II
Chapter - II
Chapter - I
Chapter - III
Chapter - III
Proposed land for unit was acquired by Proponent The proposed unit is established in 1.48 Acres, so R&R is not applicable
12
9
3-4
33-36
38-40
Prepared By Rightsource Industrial Solutions Pvt. Ltd Page III

ToR Compliance Urmila Chemopharma Pvt. Ltd.
S. No Standard Terms of Reference Chapters Page Nos 5. Forest and wildlife related issues
(if applicable):
i. Permission and approval for the use of forestland (forestry clearance), if any, and recommendations of the State Forest Department (if applicable)
ii. Land use map base on High resolutionsatellite imagery (GPS) of the proposed site delineating the forestland (in case of projects involving forest land more than 40 ha)
iii. Status of Application submitted for obtainingthe stage I forestry clearance along with latest status shall be submitted.
iv. The projects to be located within 10 Km ofthe National Parks, Sanctuaries, Biosphere Reserves, Migratory Corridors of Wild Animals, the project proponent shall submit the map duly authenticated by chief wildlife warden showing these features vis-à-vis the project location and the recommendations or comments of the Chief Wildlife Warden –there on.
v. Wildlife Conservation plan duly authenticatedby the chief wildlife warden of the state government for conservation of schedule 1 fauna, if any exists in the study area.
vi. Copy of application submitted for clearanceunder the wildlife (Protection) Act, 1972, to be standing committee of the National Board for Wildlife.
The project area is non- forest land.
Land use map based on satellite imaginary of the proposed site is presented in chapter - III, Page no: 84-85
Not applicable
Great Indian Bustard Sanctuary, Kondi is at a distance of 2.45 Km from the Project site. Submitted the application to get clearance from Chief Wildlife Warden and the application under process.
The Wildlife Clearance application is filed vide proposal no.FP/MH/IND/3695/2018 dated: 17.12.2018 is attached as Enclosure - IV
6. Environmental Status
i) Determination of atmospheric inversion levelat the project site and site-specific micro- meteorological data using temperature, relative humidity, hourly wind speed and direction and rainfall.
Chapter - III 42-47
Prepared By Rightsource Industrial Solutions Pvt. Ltd Page IV

ToR Compliance Urmila Chemopharma Pvt. Ltd.
S. No Standard Terms of Reference Chapters Page Nos
ii) AAQ data (except monsoon) at 8 locationsfor PM10, PM2.5, SO2, NOX, CO and other parameters relevant to the project shall be collected. The monitoring stations shall be based CPCB guidelines and take into account the pre-dominant wind direction, population zone and sensitive receptors including reserved forests.
iii) Raw data of all AAQ measurement for 12weeks of al stations as per frequency given in the NAQQM Notification of Nov. 2009 along with –min., max., average and 98% values for each of the AAQ parameters from data of all AAQ stations should be provided as an annexure to the EIA Report.
. v. iv) Surface water quality of nearby River (100m
upstream and downstream of discharge point and other surface drains at eight locations as per CPCB / MoEF&CC guidelines.
v) Whether the site falls near to polluted stretchof river identified by the CPCB/ MoEF&CC, if yes give details.
vi) Ground water monitoring at minimum at 8locations shall be included
vii) Noise levels monitoring at 8 locations withinthe study area.
viii) Soil characteristic as per CPCB guidelines.
ix) Traffic study of the area, type of vehicles,frequency of vehicles for transportation of materials, additional traffic due to proposed project, parking arrangement etc.
x) Detailed description of flora and fauna(terrestrial and aquatic) existing in the study area shall be given with special reference to rare, endemic and endangered species. If Schedule-I fauna are found within the study
Chapter - III
Chapter - III
Chapter - III
Not Applicable
Chapter - III
Chapter - III
Chapter - III
Chapter - III
Chapter - III
48-49
51-58
60-67
60-66
67-70
74-78
71-73
86-97
Prepared By Rightsource Industrial Solutions Pvt. Ltd Page V

ToR Compliance Urmila Chemopharma Pvt. Ltd.
S. No Standard Terms of Reference Chapters Page Nos area, a wildlife conservation plan shall be prepared and furnished xi) Socio-economic status of the study area.
Chapter - III
98-104 7. Impact and Environment Management Plan i) Assessment of ground level concentration of
pollutants from the stack emission based on site –specific meteorological features. In case the project is located on a hilly terrain, the AQIP Modelling shall be done using inputs of the specific terrain characteristics for determining the potential impacts of the project on the AAQ. Cumulative impact of all sources of emissions (including transportation) on the AAQ of the area shall be assessed. Details of the model used and the input data used for modeling shall also be provided. The air quality contours shall be plotted on a location map showing the location of project site, habitation nearby, sensitive receptors, if any.
ii) Water Quality modeling –in case of discharge in water body iii) Impact of the transport of the raw materials and end products on the surrounding environment hall be assessed and provided. In this regard, options for transport of raw materials and finished products and wastes (large quantities) by rail or rail-cum road transport or conveyor- cum –rail transport shall be examined. iv) A note on treatment of wastewater from different plant operations, extent recycled and reused for different purposes shall be included. Complete scheme of effluent treatment, Characteristics of untreated and treated effluent to meet the prescribed standards of discharge under E (P) Rules. v) Details of stack emission and action plan for control of emissions to meet standards vi) Measures for fugitive emission control
Chapter - IV
The proposed project has ZLD system
Chapter - X
Chapter - X Chapter- II
Chapter - X
Chapter - X
114-122
215-216
216-226 25
241-242 238
239
Prepared By Rightsource Industrial Solutions Pvt. Ltd Page VI
ToR Compliance Urmila Chemopharma Pvt. Ltd.
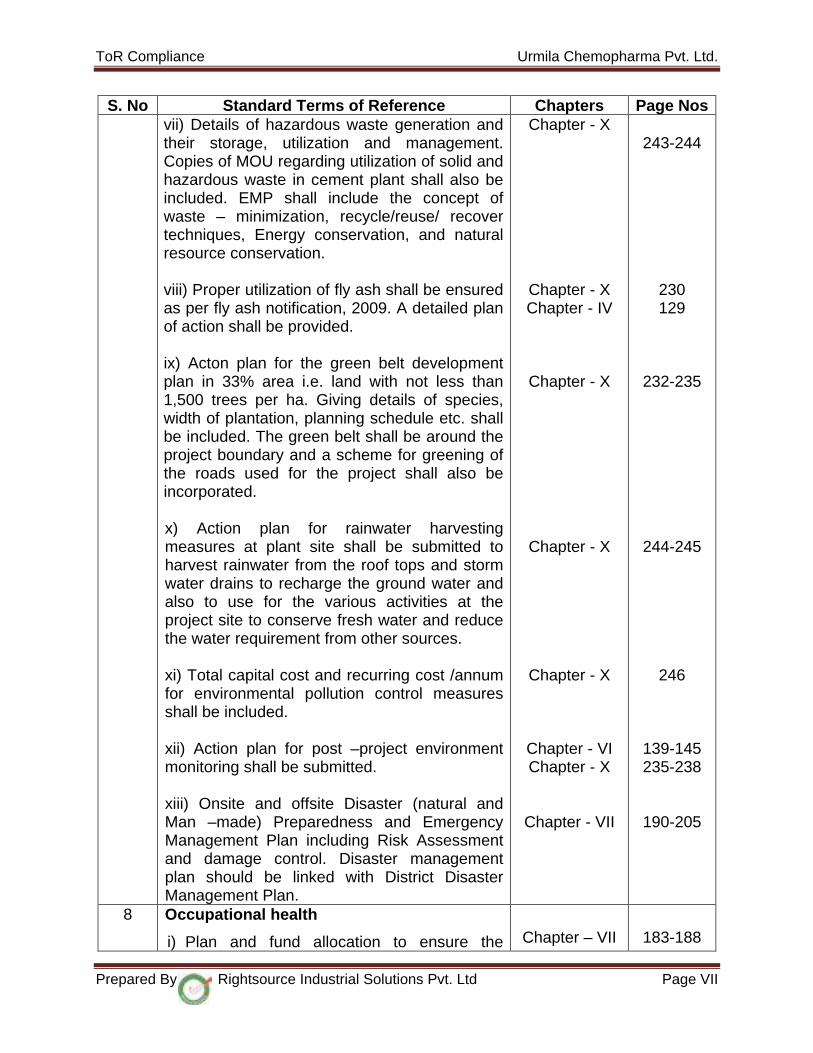
S. No Standard Terms of Reference Chapters Page Nos vii) Details of hazardous waste generation and their storage, utilization and management. Copies of MOU regarding utilization of solid and hazardous waste in cement plant shall also be included. EMP shall include the concept of waste – minimization, recycle/reuse/ recover techniques, Energy conservation, and natural resource conservation. viii) Proper utilization of fly ash shall be ensured as per fly ash notification, 2009. A detailed plan of action shall be provided. ix) Acton plan for the green belt development plan in 33% area i.e. land with not less than 1,500 trees per ha. Giving details of species, width of plantation, planning schedule etc. shall be included. The green belt shall be around the project boundary and a scheme for greening of the roads used for the project shall also be incorporated. x) Action plan for rainwater harvesting measures at plant site shall be submitted to harvest rainwater from the roof tops and storm water drains to recharge the ground water and also to use for the various activities at the project site to conserve fresh water and reduce the water requirement from other sources. xi) Total capital cost and recurring cost /annum for environmental pollution control measures shall be included. xii) Action plan for post –project environment monitoring shall be submitted. xiii) Onsite and offsite Disaster (natural and Man –made) Preparedness and Emergency Management Plan including Risk Assessment and damage control. Disaster management plan should be linked with District Disaster Management Plan.
Chapter - X
Chapter - X Chapter - IV
Chapter - X
Chapter - X
Chapter - X
Chapter - VI Chapter - X
Chapter - VII
243-244
230 129
232-235
244-245
246
139-145 235-238
190-205
8 Occupational health
i) Plan and fund allocation to ensure the
Chapter – VII
183-188
Prepared By Rightsource Industrial Solutions Pvt. Ltd Page VII
ToR Compliance Urmila Chemopharma Pvt. Ltd.
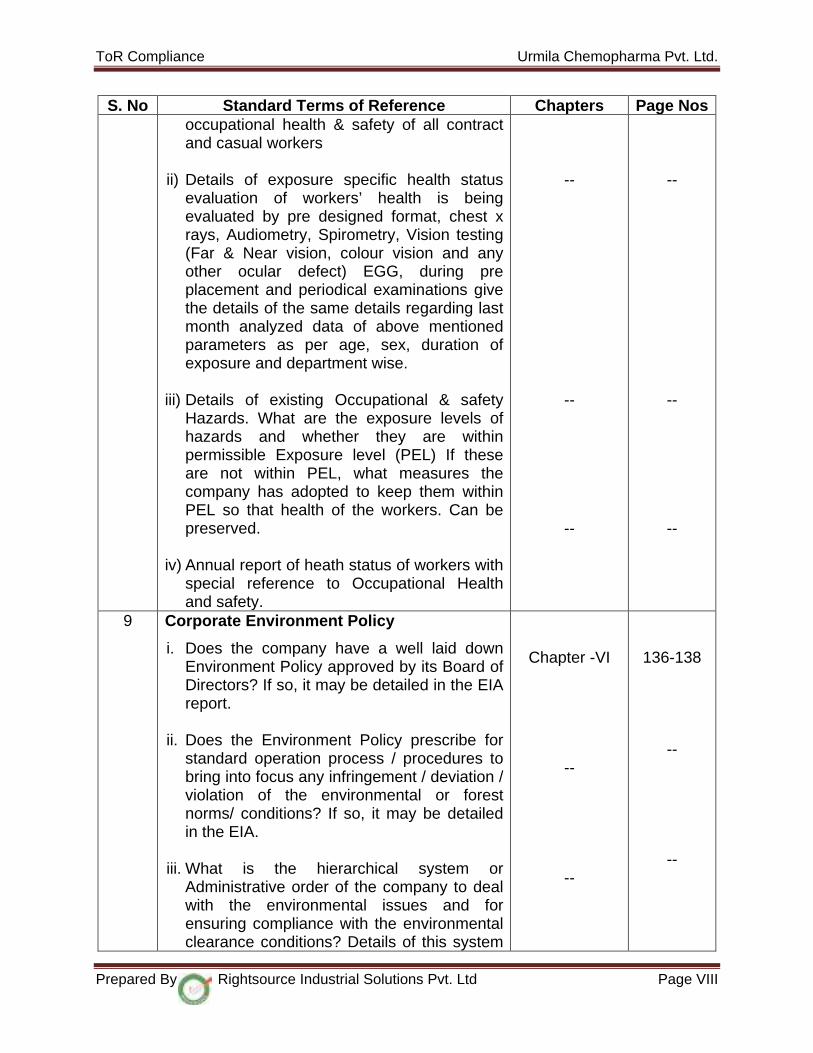
S. No Standard Terms of Reference Chapters Page Nos occupational health & safety of all contract and casual workers
ii) Details of exposure specific health status evaluation of workers’ health is being evaluated by pre designed format, chest x rays, Audiometry, Spirometry, Vision testing (Far & Near vision, colour vision and any other ocular defect) EGG, during pre placement and periodical examinations give the details of the same details regarding last month analyzed data of above mentioned parameters as per age, sex, duration of exposure and department wise.
iii) Details of existing Occupational & safety
Hazards. What are the exposure levels of hazards and whether they are within permissible Exposure level (PEL) If these are not within PEL, what measures the company has adopted to keep them within PEL so that health of the workers. Can be preserved.
iv) Annual report of heath status of workers with
special reference to Occupational Health and safety.
--
--
--
--
--
--
9 Corporate Environment Policy
i. Does the company have a well laid down Environment Policy approved by its Board of Directors? If so, it may be detailed in the EIA report.
ii. Does the Environment Policy prescribe for
standard operation process / procedures to bring into focus any infringement / deviation / violation of the environmental or forest norms/ conditions? If so, it may be detailed in the EIA.
iii. What is the hierarchical system or
Administrative order of the company to deal with the environmental issues and for ensuring compliance with the environmental clearance conditions? Details of this system
Chapter -VI
--
--
136-138
--
--
Prepared By Rightsource Industrial Solutions Pvt. Ltd Page VIII
ToR Compliance Urmila Chemopharma Pvt. Ltd.
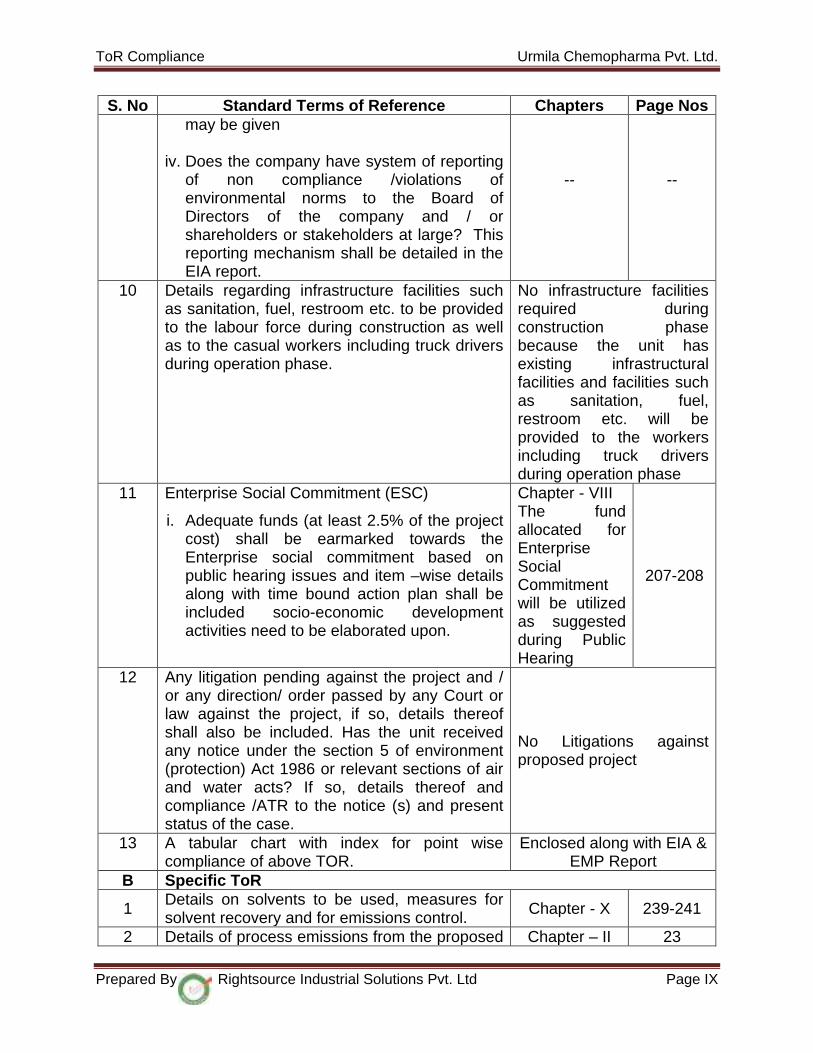
S. No Standard Terms of Reference Chapters Page Nos may be given
iv. Does the company have system of reporting of non compliance /violations of environmental norms to the Board of Directors of the company and / or shareholders or stakeholders at large? This reporting mechanism shall be detailed in the EIA report.
--
--
10 Details regarding infrastructure facilities such as sanitation, fuel, restroom etc. to be provided to the labour force during construction as well as to the casual workers including truck drivers during operation phase.
No infrastructure facilities required during construction phase because the unit has existing infrastructural facilities and facilities such as sanitation, fuel, restroom etc. will be provided to the workers including truck drivers during operation phase
11 Enterprise Social Commitment (ESC)
i. Adequate funds (at least 2.5% of the project cost) shall be earmarked towards the Enterprise social commitment based on public hearing issues and item –wise details along with time bound action plan shall be included socio-economic development activities need to be elaborated upon.
Chapter - VIII The fund allocated for Enterprise Social Commitment will be utilized as suggested during Public Hearing
207-208
12 Any litigation pending against the project and / or any direction/ order passed by any Court or law against the project, if so, details thereof shall also be included. Has the unit received any notice under the section 5 of environment (protection) Act 1986 or relevant sections of air and water acts? If so, details thereof and compliance /ATR to the notice (s) and present status of the case.
No Litigations against proposed project
13 A tabular chart with index for point wise compliance of above TOR.
Enclosed along with EIA & EMP Report
B Specific ToR
1 Details on solvents to be used, measures for solvent recovery and for emissions control. Chapter - X 239-241
2 Details of process emissions from the proposed Chapter – II 23
Prepared By Rightsource Industrial Solutions Pvt. Ltd Page IX

ToR Compliance Urmila Chemopharma Pvt. Ltd.
S. No Standard Terms of Reference Chapters Page Nos unit and its arrangement to control Chapter - X 238
3 Ambient air quality data should include VOC, NH3, SO2, HBr, CH3Cl, HCl, etc., Chapter - III 49
4 Work zone monitoring arrangements for hazardous chemicals Chapter - VII 162-171
5 Detailed effluent treatment scheme including segregation of effluent streams for units adopting ‘zero liquid discharge’.
Chapter – X 216-225
6 Action plan for odour control to be submitted. -- -- 7 A copy of the Memorandum of Understanding
signed with cement manufacturers indicating clearly that they co-process organic solid/hazardous waste generated.
Yet to get MOU from Cement Industries.
8 Authorization / Membership for the disposal of liquid effluent in CETP and solid/ hazardous waste in TSDF, If any.
Yet to get Membership from TSDF to disposal of Solid/ Hazardous waste.
9 Action plan for utilization of MEE/ dryers salts. Chapter -X 244
10 Material safety data sheet for all the chemicals are being used/ will be used.
MSDS for all the chemicals will be used and kept in plant for reference.
11 Authorization/ Membership for the disposal of solid/hazardous waste in TSDF are being used/ will be used
Yet to get Membership from TSDF to disposal of Solid/ Hazardous waste.
12 Details of incinerator if to be installed No proposal for installation of Incinerator
13 Risk assessment for storage and hazardous chemicals/solvents, Action plan for handling & safety system to be incorporated.
Chapter - VII 168-188
14 Arrangements for ensuring health and safety of workers engaged in handling of toxic materials. Chapter - VII 167-169
Prepared By Rightsource Industrial Solutions Pvt. Ltd Page X

LIST OF CONTENTS [INDEX]
Index of Draft EIA Report Urmila Chemopharma Pvt. Ltd
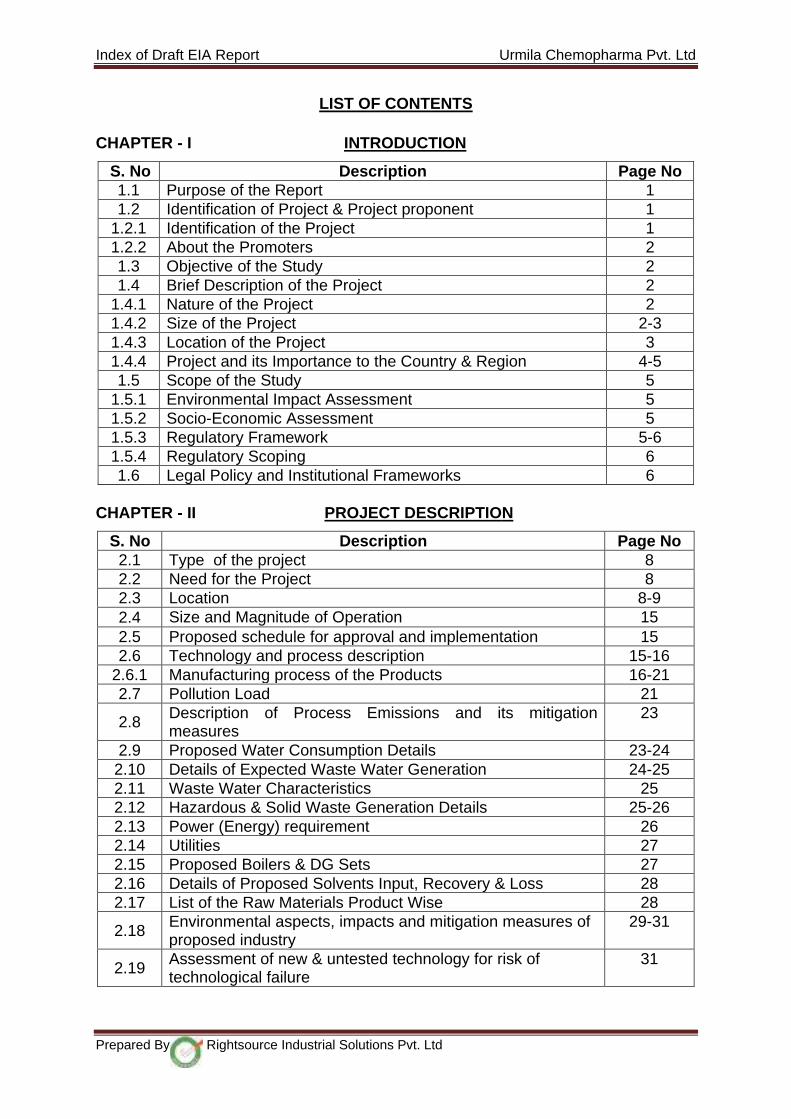
LIST OF CONTENTS
CHAPTER - I INTRODUCTION
S. No Description Page No 1.1 Purpose of the Report 1 1.2 Identification of Project & Project proponent 1
1.2.1 Identification of the Project 1 1.2.2 About the Promoters 2 1.3 Objective of the Study 2 1.4 Brief Description of the Project 2
1.4.1 Nature of the Project 2 1.4.2 Size of the Project 2-3 1.4.3 Location of the Project 3 1.4.4 Project and its Importance to the Country & Region 4-5 1.5 Scope of the Study 5
1.5.1 Environmental Impact Assessment 5 1.5.2 Socio-Economic Assessment 5 1.5.3 Regulatory Framework 5-6 1.5.4 Regulatory Scoping 6 1.6 Legal Policy and Institutional Frameworks 6
CHAPTER - II PROJECT DESCRIPTION
S. No Description Page No 2.1 Type of the project 8 2.2 Need for the Project 8 2.3 Location 8-9 2.4 Size and Magnitude of Operation 15 2.5 Proposed schedule for approval and implementation 15 2.6 Technology and process description 15-16
2.6.1 Manufacturing process of the Products 16-21 2.7 Pollution Load 21
2.8 Description of Process Emissions and its mitigation measures
23
2.9 Proposed Water Consumption Details 23-24 2.10 Details of Expected Waste Water Generation 24-25 2.11 Waste Water Characteristics 25 2.12 Hazardous & Solid Waste Generation Details 25-26 2.13 Power (Energy) requirement 26 2.14 Utilities 27 2.15 Proposed Boilers & DG Sets 27 2.16 Details of Proposed Solvents Input, Recovery & Loss 28 2.17 List of the Raw Materials Product Wise 28
2.18 Environmental aspects, impacts and mitigation measures of proposed industry
29-31
2.19 Assessment of new & untested technology for risk of technological failure
31
Prepared By Rightsource Industrial Solutions Pvt. Ltd
Index of Draft EIA Report Urmila Chemopharma Pvt. Ltd
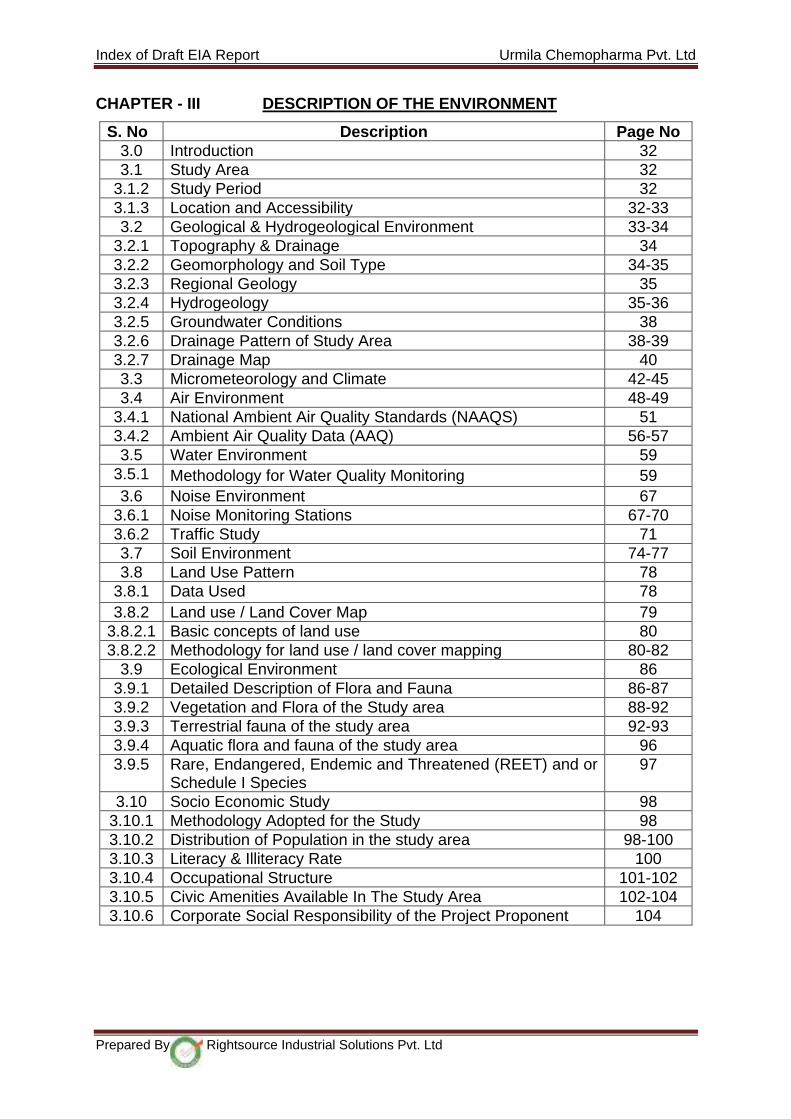
CHAPTER - III DESCRIPTION OF THE ENVIRONMENT
S. No Description Page No 3.0 Introduction 32 3.1 Study Area 32
3.1.2 Study Period 32 3.1.3 Location and Accessibility 32-33 3.2 Geological & Hydrogeological Environment 33-34
3.2.1 Topography & Drainage 34 3.2.2 Geomorphology and Soil Type 34-35 3.2.3 Regional Geology 35 3.2.4 Hydrogeology 35-36 3.2.5 Groundwater Conditions 38 3.2.6 Drainage Pattern of Study Area 38-39 3.2.7 Drainage Map 40 3.3 Micrometeorology and Climate 42-45 3.4 Air Environment 48-49
3.4.1 National Ambient Air Quality Standards (NAAQS) 51 3.4.2 Ambient Air Quality Data (AAQ) 56-57 3.5 Water Environment 59
3.5.1 Methodology for Water Quality Monitoring 59 3.6 Noise Environment 67
3.6.1 Noise Monitoring Stations 67-70 3.6.2 Traffic Study 71 3.7 Soil Environment 74-77 3.8 Land Use Pattern 78
3.8.1 Data Used 78 3.8.2 Land use / Land Cover Map 79
3.8.2.1 Basic concepts of land use 80 3.8.2.2 Methodology for land use / land cover mapping 80-82
3.9 Ecological Environment 86 3.9.1 Detailed Description of Flora and Fauna 86-87 3.9.2 Vegetation and Flora of the Study area 88-92 3.9.3 Terrestrial fauna of the study area 92-93 3.9.4 Aquatic flora and fauna of the study area 96 3.9.5 Rare, Endangered, Endemic and Threatened (REET) and or
Schedule I Species 97
3.10 Socio Economic Study 98 3.10.1 Methodology Adopted for the Study 98 3.10.2 Distribution of Population in the study area 98-100 3.10.3 Literacy & Illiteracy Rate 100 3.10.4 Occupational Structure 101-102 3.10.5 Civic Amenities Available In The Study Area 102-104 3.10.6 Corporate Social Responsibility of the Project Proponent 104
Prepared By Rightsource Industrial Solutions Pvt. Ltd
Index of Draft EIA Report Urmila Chemopharma Pvt. Ltd
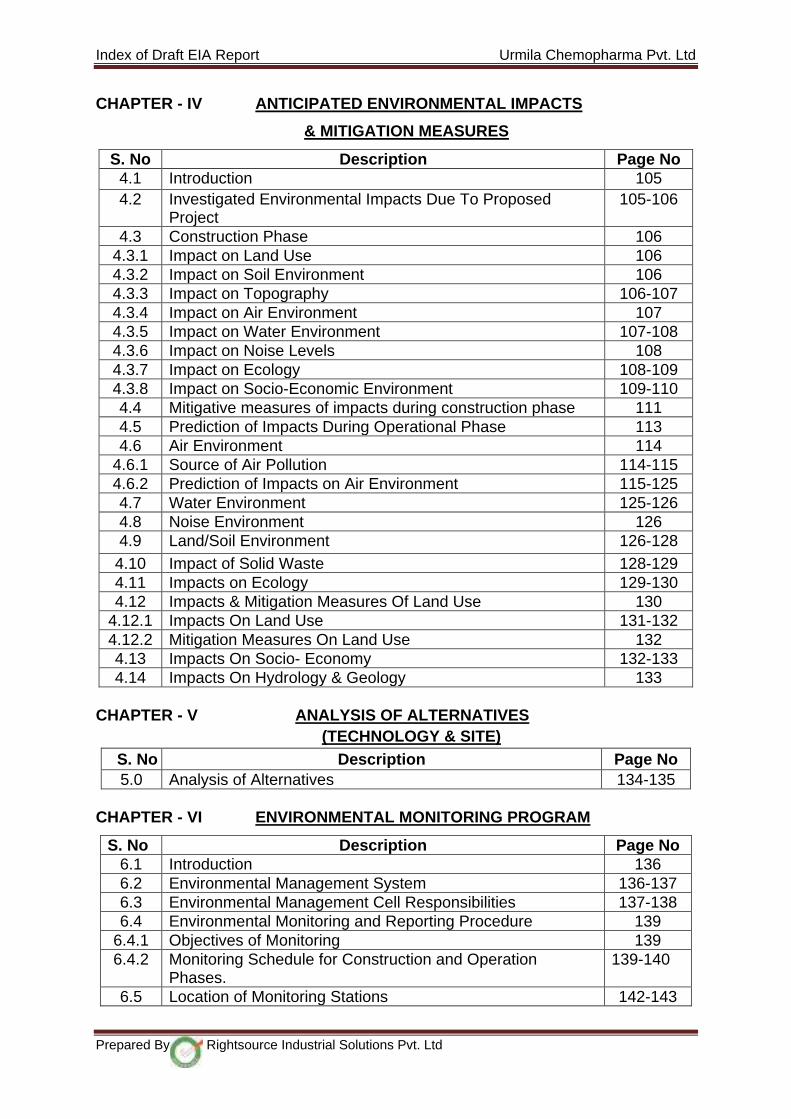
CHAPTER - IV ANTICIPATED ENVIRONMENTAL IMPACTS
& MITIGATION MEASURES
S. No Description Page No 4.1 Introduction 105 4.2 Investigated Environmental Impacts Due To Proposed
Project 105-106
4.3 Construction Phase 106 4.3.1 Impact on Land Use 106 4.3.2 Impact on Soil Environment 106 4.3.3 Impact on Topography 106-107 4.3.4 Impact on Air Environment 107 4.3.5 Impact on Water Environment 107-108 4.3.6 Impact on Noise Levels 108 4.3.7 Impact on Ecology 108-109 4.3.8 Impact on Socio-Economic Environment 109-110 4.4 Mitigative measures of impacts during construction phase 111 4.5 Prediction of Impacts During Operational Phase 113 4.6 Air Environment 114
4.6.1 Source of Air Pollution 114-115 4.6.2 Prediction of Impacts on Air Environment 115-125 4.7 Water Environment 125-126 4.8 Noise Environment 126 4.9 Land/Soil Environment 126-128 4.10 Impact of Solid Waste 128-129 4.11 Impacts on Ecology 129-130 4.12 Impacts & Mitigation Measures Of Land Use 130
4.12.1 Impacts On Land Use 131-132 4.12.2 Mitigation Measures On Land Use 132 4.13 Impacts On Socio- Economy 132-133 4.14 Impacts On Hydrology & Geology 133
CHAPTER - V ANALYSIS OF ALTERNATIVES (TECHNOLOGY & SITE)
S. No Description Page No 5.0 Analysis of Alternatives 134-135
CHAPTER - VI ENVIRONMENTAL MONITORING PROGRAM
S. No Description Page No 6.1 Introduction 136 6.2 Environmental Management System 136-137 6.3 Environmental Management Cell Responsibilities 137-138 6.4 Environmental Monitoring and Reporting Procedure 139
6.4.1 Objectives of Monitoring 139 6.4.2 Monitoring Schedule for Construction and Operation
Phases. 139-140
6.5 Location of Monitoring Stations 142-143
Prepared By Rightsource Industrial Solutions Pvt. Ltd
Index of Draft EIA Report Urmila Chemopharma Pvt. Ltd
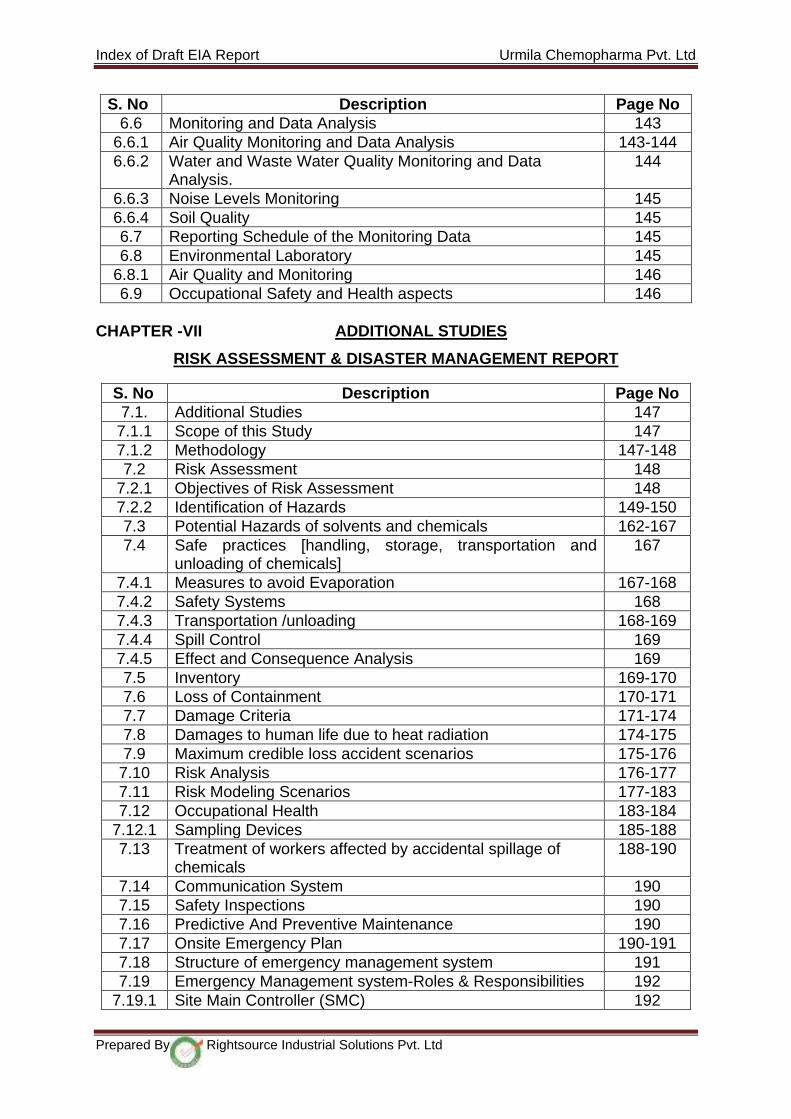
S. No Description Page No 6.6 Monitoring and Data Analysis 143
6.6.1 Air Quality Monitoring and Data Analysis 143-144 6.6.2 Water and Waste Water Quality Monitoring and Data
Analysis. 144
6.6.3 Noise Levels Monitoring 145 6.6.4 Soil Quality 145 6.7 Reporting Schedule of the Monitoring Data 145 6.8 Environmental Laboratory 145
6.8.1 Air Quality and Monitoring 146 6.9 Occupational Safety and Health aspects 146
CHAPTER -VII ADDITIONAL STUDIES
RISK ASSESSMENT & DISASTER MANAGEMENT REPORT
S. No Description Page No 7.1. Additional Studies 147
7.1.1 Scope of this Study 147 7.1.2 Methodology 147-148 7.2 Risk Assessment 148
7.2.1 Objectives of Risk Assessment 148 7.2.2 Identification of Hazards 149-150 7.3 Potential Hazards of solvents and chemicals 162-167 7.4 Safe practices [handling, storage, transportation and
unloading of chemicals] 167
7.4.1 Measures to avoid Evaporation 167-168 7.4.2 Safety Systems 168 7.4.3 Transportation /unloading 168-169 7.4.4 Spill Control 169 7.4.5 Effect and Consequence Analysis 169 7.5 Inventory 169-170 7.6 Loss of Containment 170-171 7.7 Damage Criteria 171-174 7.8 Damages to human life due to heat radiation 174-175 7.9 Maximum credible loss accident scenarios 175-176
7.10 Risk Analysis 176-177 7.11 Risk Modeling Scenarios 177-183 7.12 Occupational Health 183-184
7.12.1 Sampling Devices 185-188 7.13 Treatment of workers affected by accidental spillage of
chemicals 188-190
7.14 Communication System 190 7.15 Safety Inspections 190 7.16 Predictive And Preventive Maintenance 190 7.17 Onsite Emergency Plan 190-191 7.18 Structure of emergency management system 191 7.19 Emergency Management system-Roles & Responsibilities 192
7.19.1 Site Main Controller (SMC) 192
Prepared By Rightsource Industrial Solutions Pvt. Ltd

Index of Draft EIA Report Urmila Chemopharma Pvt. Ltd
CHAPTER - VIII PROJECT BENEFITS
S. No Description Page No 8.1 Employment Potential 206 8.2 Corporate Social Responsibility (CSR) & CER 206-208 8.3 Direct revenue earning to the National and State
exchequer 209
8.4 Improvements in the Physical Infrastructure 209 8.5 Improvements in the Social Infrastructure 209 8.6 Other Tangible Benefits 209-210
CHAPTER - IX ENVIRONMENTAL COST BENEFIT ANALYSIS
S. No Description Page No 9.0 Cost benefit analysis 211
CHAPTER - X ENVIRONMENTAL MANAGEMENT PLAN
S. No Description Page No 10.1 Introduction 212 10.2 Pre-Project Environmental Management Plan 214
10.2.1 Site Preparation 214 10.2.2 Sanitation 214 10.2.3 Noise 214
7.19.2 Incident Controller/ Deputy Incident Controller 193 7.19.3 Key Personnel’s 193 7.19.4 Essential Workers 194 7.20 Other Elements of DMP 194
7.20.1 Assembly Point 195 7.20.2 Emergency Control Center 195-196 7.20.3 Fire Services 196 7.20.4 Medical Services 197 7.20.5 Security Services 197 7.20.6 Mutual Aid 197-198 7.21 Emergency Response 198 7.22 Emergency Capabilities 198 7.23 Emergency Handling Procedures 198-200
7.23.1 Mitigation Of Environmental Impact During Fire Emergency 200-201 7.24 Declaring Major Emergency 201 7.25 Transport And Evacuation Arrangements 202 7.26 Plant Operations 202-203 7.27 Offsite Emergency Plan 203-204 7.28 Role Of The Factory Management 204
7.28.1 Role Of Local Authority 204 7.28.2 Role Of Fire Authority 205 7.28.3 Role Of Police 205 7.28.4 Role Of Health Authorities 205 7.28.5 Role Of The “Mutual Aid” Agencies 205 7.28.6 Role Of The Factory Inspectorate 205
Prepared By Rightsource Industrial Solutions Pvt. Ltd

Index of Draft EIA Report Urmila Chemopharma Pvt. Ltd
S. No Description Page No 10.2.4 Construction Equipment And Waste 214 10.2.5 Site Security 214 10.3 Environmental Management During Operation 214
10.3.1 Air Quality 214-215 10.3.1.1 Air Pollution Control / Management 215
A Stack Design 215 B Fugitive Emission from Solvents 215 C Storage and Transportation of Raw Materials 215-216
10.3.2 Noise Pollution 216 10.3.3 Water Quality 216-218
10.3.3.1 Details of ZLD system 222 10.3.3.2 The technical details of the systems are as follows 223 10.3.3.3 MEE plant configuration 223 10.3.3.4 Process description (Part - A) 223 10.3.3.5 Process description (Part - B) 224-225 10.3.3.6 Process description (Part - C) 225
10.4 Hazardous/ Solid Waste Management 227-228 10.5 EB [Ecology & Biodiversity 228 10.6 SE [Socio-Economic Aspects 228 10.7 HG [Hydrogeology, Ground Water & Water Conservation] 229-230 10.8 GEO [Geology] 231 10.9 SC [Soil Conservation] 231
10.10 RH [Risk & Hazards Management] 231-232 10.11 Greenbelt Development 232
10.11.1 Objective 232-233 10.11.2 Action Plan 233 10.12 Post Project Monitoring 235
10.12.1 Air Pollution Monitoring 235 10.12.2 Waste Water Monitoring 235 10.12.3 Ground Water Monitoring 236 10.12.4 Hazardous / Solid Waste Monitoring 236-237 10.13 Management of Public Interests 237
10.13.1 Objective 237 10.13.2 Preference To Local Population 237 10.13.3 Health Camps 237 10.13.4 Public Amenities 237 10.13.5 Public Relations 237 10.14 Water Requirement 237 10.15 Process Emission Control System 238 10.16 Fugitive Emissions 239 10.17 Solvent Management Plan 239-241 10.18 Emissions – Utilities 241 10.19 Wastewater Loads 242-243 10.20 Stage wise Effluent Characteristics 243 10.21 Hazardous & Solid Waste details 243-244 10.22 Proposed Roof Water Harvesting 244-245 10.23 Investment 246
Prepared By Rightsource Industrial Solutions Pvt. Ltd
Index of Draft EIA Report Urmila Chemopharma Pvt. Ltd
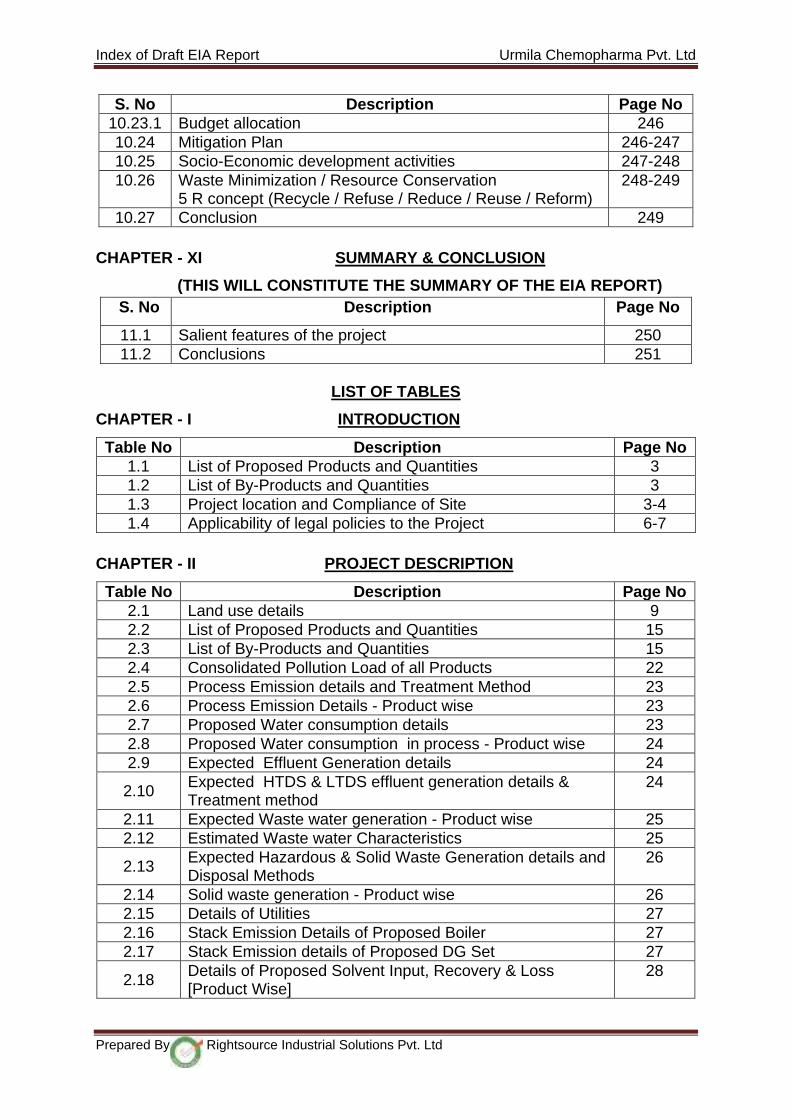
S. No Description Page No 10.23.1 Budget allocation 246 10.24 Mitigation Plan 246-247 10.25 Socio-Economic development activities 247-248 10.26 Waste Minimization / Resource Conservation
5 R concept (Recycle / Refuse / Reduce / Reuse / Reform) 248-249
10.27 Conclusion 249 CHAPTER - XI SUMMARY & CONCLUSION
(THIS WILL CONSTITUTE THE SUMMARY OF THE EIA REPORT) S. No Description Page No
11.1 Salient features of the project 250 11.2 Conclusions 251
LIST OF TABLES
CHAPTER - I INTRODUCTION
Table No Description Page No 1.1 List of Proposed Products and Quantities 3 1.2 List of By-Products and Quantities 3 1.3 Project location and Compliance of Site 3-4 1.4 Applicability of legal policies to the Project 6-7
CHAPTER - II PROJECT DESCRIPTION
Table No Description Page No 2.1 Land use details 9 2.2 List of Proposed Products and Quantities 15 2.3 List of By-Products and Quantities 15 2.4 Consolidated Pollution Load of all Products 22 2.5 Process Emission details and Treatment Method 23 2.6 Process Emission Details - Product wise 23 2.7 Proposed Water consumption details 23 2.8 Proposed Water consumption in process - Product wise 24 2.9 Expected Effluent Generation details 24
2.10 Expected HTDS & LTDS effluent generation details & Treatment method
24
2.11 Expected Waste water generation - Product wise 25 2.12 Estimated Waste water Characteristics 25
2.13 Expected Hazardous & Solid Waste Generation details and Disposal Methods
26
2.14 Solid waste generation - Product wise 26 2.15 Details of Utilities 27 2.16 Stack Emission Details of Proposed Boiler 27 2.17 Stack Emission details of Proposed DG Set 27
2.18 Details of Proposed Solvent Input, Recovery & Loss [Product Wise]
28
Prepared By Rightsource Industrial Solutions Pvt. Ltd

Index of Draft EIA Report Urmila Chemopharma Pvt. Ltd
CHAPTER - III DESCRIPTION OF THE ENVIRONMENT
Table No Description Page No
3.1 Showing drainage density based criteria by smith and Strahler 39
3.2 Showing drainage density based criteria proposed by Long Bein 39
3.3 Showing Drainage Density Based Criteria proposed by Horton 39
3.4 Climatological Summary – Solapur Region (1981-2010) 42-43 3.5 Frequency Distribution Wind Directions And Wind Speed 46
3.6 Comparison Of Primary Data (Project Site) With Secondary Data (IMD Data) 47
3.7 Ambient air quality sampling locations 48 3.8 National ambient air quality standards 51 3.9 Ambient Air Quality Results for PM10 52
3.10 Ambient Air Quality Results for PM2.5 52 3.11 Ambient Air Quality Results for SO2 53 3.12 Ambient Air Quality Results for NOx 54 3.13 Ambient Air Quality Results for CO 54 3.14 Ambient Air Quality Results for NH3 55 3.15 AAQ Monitoring Results during Summer Season 58 3.16 Ground water and Surface sampling locations 60 3.17 Ground water quality in the study area 62-63 3.18 Surface water quality the study area 64-65 3.19 Noise monitoring locations 68 3.20 Ambient noise levels within study area 70
3.21 Traffic Study At National Highway (NH) - 9 (Solapur To Pune Road) (To & From) 72-73
3.22 Soil sampling locations 74 3.23 Soil sampling analysis results 76 3.24 Standard Soil Classification 77-78 3.25 Showing the Details of Sources & the Maps Prepared 78 3.26 Showing the Topographic Maps 78 3.27 Satellite Data of National Remote Sensing Center 79 3.28 Land Use / Land Cover Statistics of the Study Area 83
3.29 Ecological Sensitivity details of the project site and its Study area of 10 Km Radius 87
3.30 List of plants found in the project area 88
3.31 List of Trees, Shrubs, Perennial Climbers and Perennial Grasses found in the Study area of the Project Site 89-91
3.32 List of vertebrates other than birds found in and around the project site 93-94
3.33 List of birds either spotted or reported from the areas in and around the project site 94-96
3.34 List of Fish Species Reported /Recorded from the Water Bodies of the Study Area 96-97
3.35 Population Distribution 99 3.36 Distribution of Literacy Rate and Illiteracy Rate in the 100-101
Prepared By Rightsource Industrial Solutions Pvt. Ltd
Index of Draft EIA Report Urmila Chemopharma Pvt. Ltd
Table No Description Page No Study Area
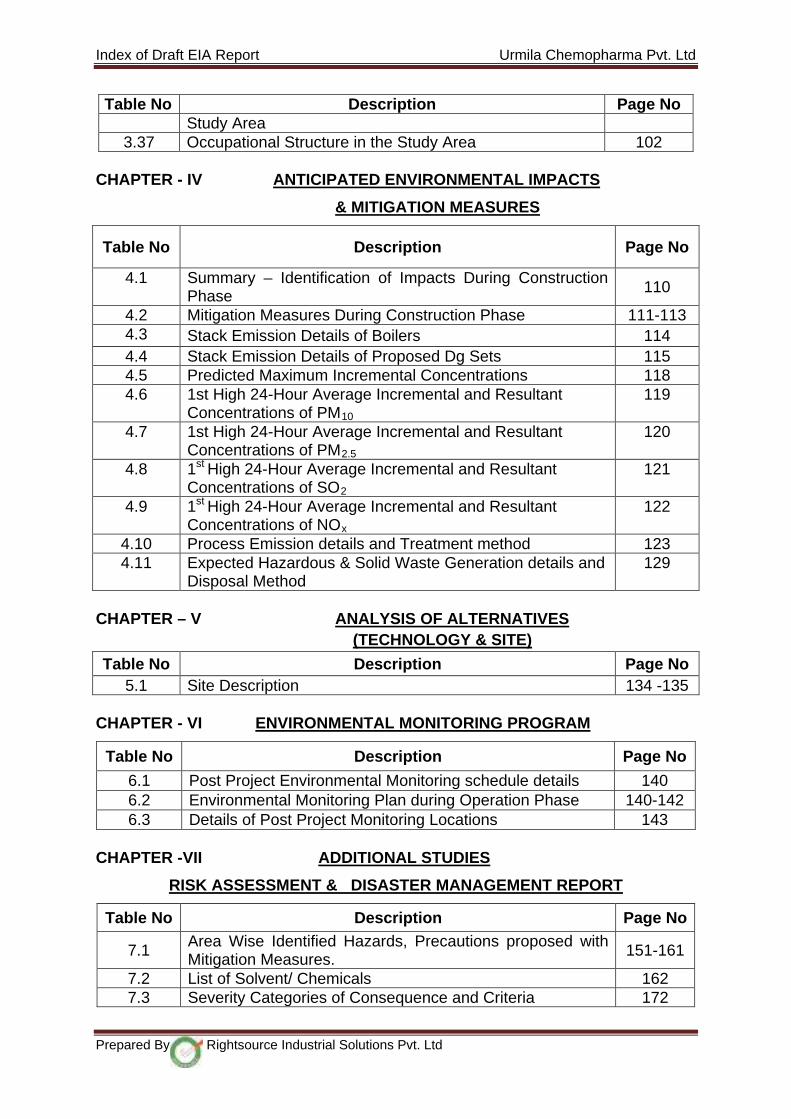
3.37 Occupational Structure in the Study Area 102 CHAPTER - IV ANTICIPATED ENVIRONMENTAL IMPACTS
& MITIGATION MEASURES
Table No Description Page No
4.1 Summary – Identification of Impacts During Construction Phase 110
4.2 Mitigation Measures During Construction Phase 111-113 4.3 Stack Emission Details of Boilers 114 4.4 Stack Emission Details of Proposed Dg Sets 115 4.5 Predicted Maximum Incremental Concentrations 118 4.6 1st High 24-Hour Average Incremental and Resultant
Concentrations of PM10 119
4.7 1st High 24-Hour Average Incremental and Resultant Concentrations of PM2.5
120
4.8 1st High 24-Hour Average Incremental and Resultant Concentrations of SO2
121
4.9 1st High 24-Hour Average Incremental and Resultant Concentrations of NOx
122
4.10 Process Emission details and Treatment method 123 4.11 Expected Hazardous & Solid Waste Generation details and
Disposal Method 129
CHAPTER – V ANALYSIS OF ALTERNATIVES (TECHNOLOGY & SITE)
Table No Description Page No 5.1 Site Description 134 -135
CHAPTER - VI ENVIRONMENTAL MONITORING PROGRAM
Table No Description Page No
6.1 Post Project Environmental Monitoring schedule details 140 6.2 Environmental Monitoring Plan during Operation Phase 140-142 6.3 Details of Post Project Monitoring Locations 143
CHAPTER -VII ADDITIONAL STUDIES
RISK ASSESSMENT & DISASTER MANAGEMENT REPORT
Table No Description Page No
7.1 Area Wise Identified Hazards, Precautions proposed with Mitigation Measures. 151-161
7.2 List of Solvent/ Chemicals 162 7.3 Severity Categories of Consequence and Criteria 172
Prepared By Rightsource Industrial Solutions Pvt. Ltd
Index of Draft EIA Report Urmila Chemopharma Pvt. Ltd
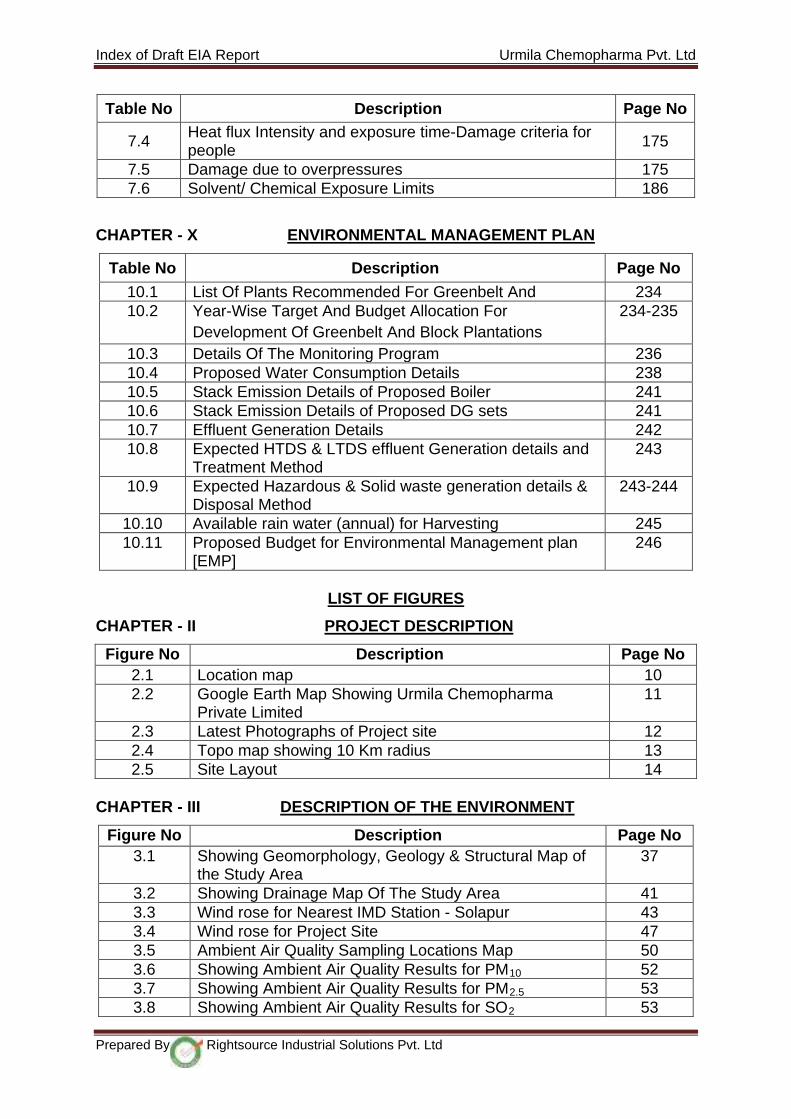
Table No Description Page No
7.4 Heat flux Intensity and exposure time-Damage criteria for people 175
7.5 Damage due to overpressures 175 7.6 Solvent/ Chemical Exposure Limits 186
CHAPTER - X ENVIRONMENTAL MANAGEMENT PLAN
Table No Description Page No
10.1 List Of Plants Recommended For Greenbelt And 234 10.2 Year-Wise Target And Budget Allocation For
Development Of Greenbelt And Block Plantations 234-235
10.3 Details Of The Monitoring Program 236 10.4 Proposed Water Consumption Details 238 10.5 Stack Emission Details of Proposed Boiler 241 10.6 Stack Emission Details of Proposed DG sets 241 10.7 Effluent Generation Details 242 10.8 Expected HTDS & LTDS effluent Generation details and
Treatment Method 243
10.9 Expected Hazardous & Solid waste generation details & Disposal Method
243-244
10.10 Available rain water (annual) for Harvesting 245 10.11 Proposed Budget for Environmental Management plan
[EMP] 246
LIST OF FIGURES
CHAPTER - II PROJECT DESCRIPTION
Figure No Description Page No 2.1 Location map 10 2.2 Google Earth Map Showing Urmila Chemopharma
Private Limited 11
2.3 Latest Photographs of Project site 12 2.4 Topo map showing 10 Km radius 13 2.5 Site Layout 14
CHAPTER - III DESCRIPTION OF THE ENVIRONMENT
Figure No Description Page No 3.1 Showing Geomorphology, Geology & Structural Map of
the Study Area 37
3.2 Showing Drainage Map Of The Study Area 41 3.3 Wind rose for Nearest IMD Station - Solapur 43 3.4 Wind rose for Project Site 47 3.5 Ambient Air Quality Sampling Locations Map 50 3.6 Showing Ambient Air Quality Results for PM10 52 3.7 Showing Ambient Air Quality Results for PM2.5 53 3.8 Showing Ambient Air Quality Results for SO2 53
Prepared By Rightsource Industrial Solutions Pvt. Ltd
Index of Draft EIA Report Urmila Chemopharma Pvt. Ltd
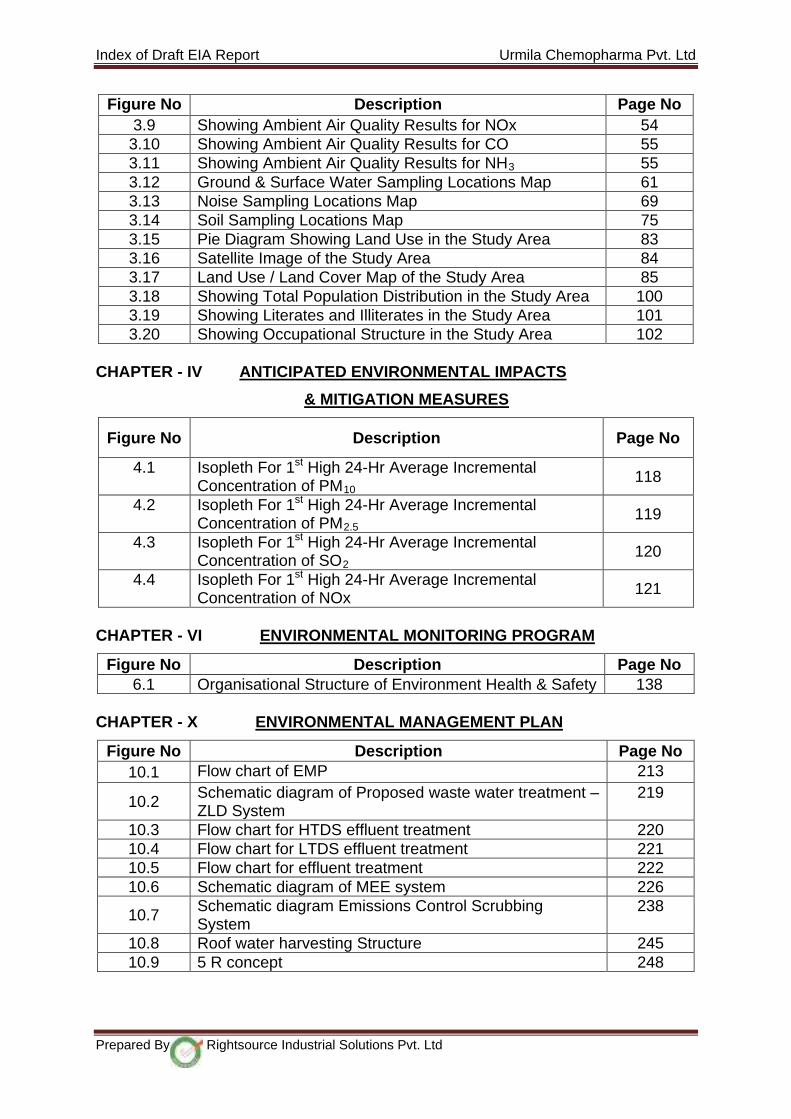
Figure No Description Page No 3.9 Showing Ambient Air Quality Results for NOx 54 3.10 Showing Ambient Air Quality Results for CO 55 3.11 Showing Ambient Air Quality Results for NH3 55 3.12 Ground & Surface Water Sampling Locations Map 61 3.13 Noise Sampling Locations Map 69 3.14 Soil Sampling Locations Map 75 3.15 Pie Diagram Showing Land Use in the Study Area 83 3.16 Satellite Image of the Study Area 84 3.17 Land Use / Land Cover Map of the Study Area 85 3.18 Showing Total Population Distribution in the Study Area 100 3.19 Showing Literates and Illiterates in the Study Area 101 3.20 Showing Occupational Structure in the Study Area 102
CHAPTER - IV ANTICIPATED ENVIRONMENTAL IMPACTS
& MITIGATION MEASURES
Figure No Description Page No
4.1 Isopleth For 1st High 24-Hr Average Incremental Concentration of PM10
118
4.2 Isopleth For 1st High 24-Hr Average Incremental Concentration of PM2.5
119
4.3 Isopleth For 1st High 24-Hr Average Incremental Concentration of SO2
120
4.4 Isopleth For 1st High 24-Hr Average Incremental Concentration of NOx 121
CHAPTER - VI ENVIRONMENTAL MONITORING PROGRAM
Figure No Description Page No 6.1 Organisational Structure of Environment Health & Safety 138
CHAPTER - X ENVIRONMENTAL MANAGEMENT PLAN
Figure No Description Page No 10.1 Flow chart of EMP 213
10.2 Schematic diagram of Proposed waste water treatment – ZLD System
219
10.3 Flow chart for HTDS effluent treatment 220 10.4 Flow chart for LTDS effluent treatment 221 10.5 Flow chart for effluent treatment 222 10.6 Schematic diagram of MEE system 226
10.7 Schematic diagram Emissions Control Scrubbing System
238
10.8 Roof water harvesting Structure 245 10.9 5 R concept 248
Prepared By Rightsource Industrial Solutions Pvt. Ltd
Index of Draft EIA Report Urmila Chemopharma Pvt. Ltd
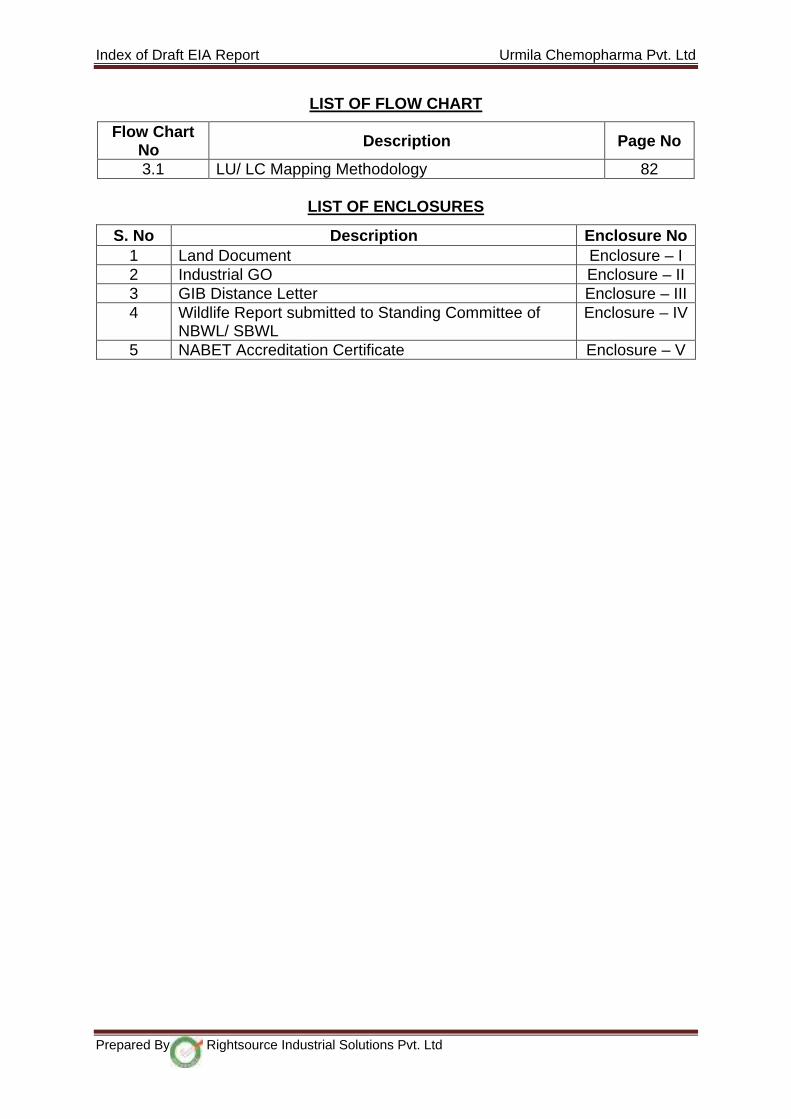
LIST OF FLOW CHART
Flow Chart No Description Page No
3.1 LU/ LC Mapping Methodology 82
LIST OF ENCLOSURES
S. No Description Enclosure No 1 Land Document Enclosure – I 2 Industrial GO Enclosure – II 3 GIB Distance Letter Enclosure – III 4 Wildlife Report submitted to Standing Committee of
NBWL/ SBWL Enclosure – IV
5 NABET Accreditation Certificate Enclosure – V
Prepared By Rightsource Industrial Solutions Pvt. Ltd

EXECUTIVE SUMMARY OF EIA REPORT

EXECUTIVE SUMMARY
OF
EIA REPORT OF
URMILA CHEMOPHARMA PVT. LTD.
For
PROPOSED BULK DRUG INTERMEDIATES MANUFACTURING UNIT
AT
Plot No.: F-24, MIDC, Chincholi Industrial Area, Chincholi Village, Mohal Taluk, Solapur District,
Maharashtra State
PREPARED BY
Rightsource Industrial Solutions Pvt. Ltd Plot No: 203, H.No:5-36/203, Prashanthi Nagar,
IDA, Kukatpally, Hyderabad – 500 072.
Ph: 040- 23070602, 23075699.
Mail: [email protected]
NABET Accreditation No. NABET/EIA/1821/RA 0100

Executive Summary of EIA Report Urmila Chemopharma Pvt. Ltd.
1. INTRODUCTION
Urmila Chemopharma Pvt. Ltd. proposed Bulk Drug Intermediates manufacturing
unit at Plot No.: F-24, MIDC, Chincholi Industrial Area, Chincholi Village, Mohal
Taluk, Solapur District, Maharashtra state.
The proposed project cost is about Rs. 2.5 Crores, which includes land cost,
construction of the buildings, equipment, machinery and greenbelt development.
As per the Office Memorandum issued by Ministry of Environment, Forest and
Climate Change, Government of India Vide No. J-11011/321/2016-IA-II (I) dt. 27th
April, 2018 noted as Public hearing is exemption for the unit “if it is located in a
Notified Industrial Area established prior to 14th September, 2006.” The proposed
project falls under Industrial park – MIDC Chincholi and it has been notified as
Industrial estate by the Government of Maharashtra State on 16.05.1988. But the
project boundary is located at a distance of 2.45 Km from Great Indian Bustard
Sanctuary (GIBS), Kondi (Gat No. 104), which is a Notified Eco- sensitive area and
satisfies the General Condition as per EIA Notification, 14th Sep, 2006. Hence, the
project comes under Category “A”.
The project proposal has granted with Standard Terms of Reference vide F. No: IA-
J-11011/345/2018-IA II (I) Dated on 01st April 2019, to carryout EIA Study. The
Environmental monitoring and analysis was carried out during the period of March to
May, 2019 and EIA Report was prepared.
The proposed project is located 2.45 Km away from the GIBS, Kondi. Hence, the
proponent has submitted the online application to get the clearance from Chief
Wildlife Warden, Proposal No. FP/MH/IND/3695/2018 dated: 17.12.2018 which is
under process.
1.1. PROJECT DESCRIPTION
The salient features of the unit are furnished below.
TABLE 1: SALIENT FEATURES OF THE PROJECT Project location Details
Latitude & Longitude Latitude: 17°46'36.51" N Longitude: 75°48'9.69" E
Climatic Conditions Annual Max Temp is 43.8 oC Annual Min Temp is 11 oC
Prepared By Rightsource Industrial Solutions Pvt. Ltd. Page 1

Executive Summary of EIA Report Urmila Chemopharma Pvt. Ltd.
2.0 PROCESS DESCRIPTION
The manufacturing process of Proposed Bulk Drug Intermediates consists of
chemical synthesis extending to stages of processing involving different type of
Normal Annual Rainfall is 742.5 mm (Source: IMD Climatalogical Normals, Solapur 1981 - 2010)
Land acquired for the plant 1.48 Acres (6000 Sq. m) Land use Industrial Land Nearest Habitation Chincholikati Village - 1.9 Km (S) Nearest Town Solapur - 13 Km (SE) Major urban Settlements Solapur – 13 Km (SE) Nearest State Highway Nearest National Highway Nearest Railway station Airport
State Highway No. 151 – 6.3 Km (E) (Solapur to Vairag Road) National Highway No. 9 – 3.3 Km (SW) (Pune to Solapur highway) Pakani Railway Station – 6 Km (SW) Solapur Airport – 21.7 Km (SE)
Major Industries near the plant site
1. HPCL Bottling Plant 2. SWI Industry 3. M/s. Srikrishna Pharmaceuticals Ltd. 4. Balaji Amines Ltd (Unit- IV) 5. Thermax Ltd. 6. Precision Camshafts Ltd. 7. Shilpa Sand Pvt. Ltd. 8. Srujana Foods Pvt. Ltd. 9. GRP Ltd. 10. M/s Lucky Aroma Industries 11. Regency Exports Pvt. Ltd. 12. Smruthi Organics Ltd. 13. Khem Solutions 14. Swastik Pipes (M/s Vardhaman Polyextrusion) 15. Rasayan Drugs Pvt. Ltd. 16. M/s Solapur Econ Recyfine 17. Lusha Print n Pack 18. Kanswa Textiles 19. Ashok Polymers Ltd. 20. Balaji amines Ltd. 21. Bang Data Forms Pvt. Ltd. 22. Niwas Spinning Mills Ltd. 23. Prabhavati Spinning Mills Ltd. 24. Volant Textile Mills Ltd.
National Parks None within 10 Km radius
Wild life sanctuary Great Indian Bustard (GIB) Wild Life Sanctuary, Kondi – 2.45 Km distance at ESE direction
Historical Places None within 10 Km radius Water Bodies within 10 km radius Sina River flowing from NW to SW direction– 6.7 Km
Prepared By Rightsource Industrial Solutions Pvt. Ltd. Page 2

Executive Summary of EIA Report Urmila Chemopharma Pvt. Ltd.
chemical reactions. Total production capacity of proposal will be 10 TPM (Given in
Table 2). The unit will take adequate control measures for storage and handling of
Raw materials and cylinders with in factory premises.
TABLE 2: LIST OF PROPOSED PRODUCTS AND QUANTITIES S. No Name of the Product Quantity in
MT/Month CAS No. Therapeutic Category
1 3,5 Dimethyl 4–Nitro pyridine – N-Oxide 5.0 14248-66-9 Omeprazole Nitro
Compound 2 3-Carbamoylmethyl-5-
Methyl-hexanoic acid 5.0 181289-15-6 Pregablin Intermediate
Total 10.0
TABLE 3: LIST OF BY-PRODUCTS AND QUANTITIES S. No Name of the Product Name of the By-Product Quantity
in Kg/Day
1 3,5 Dimethyl 4–Nitro pyridine – N-Oxide
Ammonium sulphate 696
2 3-Carbamoylmethyl-5-Methyl-hexanoic acid
Ammonium sulphate 360 Spent Sulphuric acid (40 %) 790
2.1 RESOURCE REQUIREMENT & INFRASTRUCTURE FACILITIES
A) Land Use Details:
The proposed unit is an area of 1.48 Acres (6000 Sq. m) and the land usage details
are given in below Table 4.
TABLE 4: PROPOSED LAND USE DETAILS
S. No. DESCRIPTION AREA in Sq. m AREA in ACRES AREA in % 1 Total Built up Area 768.32 0.19 12.81 2 Green Belt Area 2148.20 0.53 35.80 3 Road area 621.50 0.15 10.36 4 Open Area 2461.98 0.61 41.03
TOTAL 6000.00 1.48 100
35.8 % of Land is allotted For Green Belt Development B) Proposed Water Consumption Details
The total water requirement for the industry is 35.43 KLD will be met through MIDC
water supply.
TABLE 5: PROPOSED WATER CONSUMPTION DETAILS
S. No Purpose Water input KLD 1 Process 1.43 2 Washings 3.00 3 Boiler make up 14.00
Prepared By Rightsource Industrial Solutions Pvt. Ltd. Page 3

Executive Summary of EIA Report Urmila Chemopharma Pvt. Ltd.
S. No Purpose Water input KLD 4 Cooling tower make up 11.00 5 Scrubbing system 1.00 6 Domestic 3.00 7 Gardening 2.00
Total 35.43
C) Energy Requirement
Power requirement of proposed project will be made available through Maharashtra
State Electricity Distribution Company Limited [MSEDCL]. The power requirement of
the project will be 200 KVA.
D) Utilities:
For generation of Steam, the industry proposed to install 2.0 TPH Coal fired boiler.
The fuel requirement is 8.0 MT/Day will be met from local authorized sources.
The unit has proposed to install 1 No. x 125 KVA DG set, for usage during the power
failures.
The emission details are presented in Tables 7 & 8.
TABLE 6: DETAILS OF UTILITIES
TABLE 7: STACK EMISSION CHARACTERISTIC DETAILS OF PROPOSED BOILER Particulars Units 2.0 TPH Coal Fired Boiler
Type of Fuel -- Indian Coal with CV of 4000 kcal/kg to 5000 kcal/kg
Coal Consumption TPD 8.0 Ash Content % 35 Sulphur Content % 0.4 No. of Stacks No 1 Height of the stack m 20 Diameter of the stack m 0.3 Flue Gas Temperature oC 125 Flue Gas Velocity m/s 15 Emission Rate Particulate Matter gm/sec 0.13
S. No Description Capacities 1 Coal fired boiler 2.0 TPH 2 D. G. Set 1 No. x 125 KVA 3 Cooling Tower 1 x 150 TR 4 Electricity supply from MSEDCL 200 KVA
Fuel Consumption Details 5 Coal requirement 8.0 TPD 6 Diesel 60 Liters/ Day
Prepared By Rightsource Industrial Solutions Pvt. Ltd. Page 4
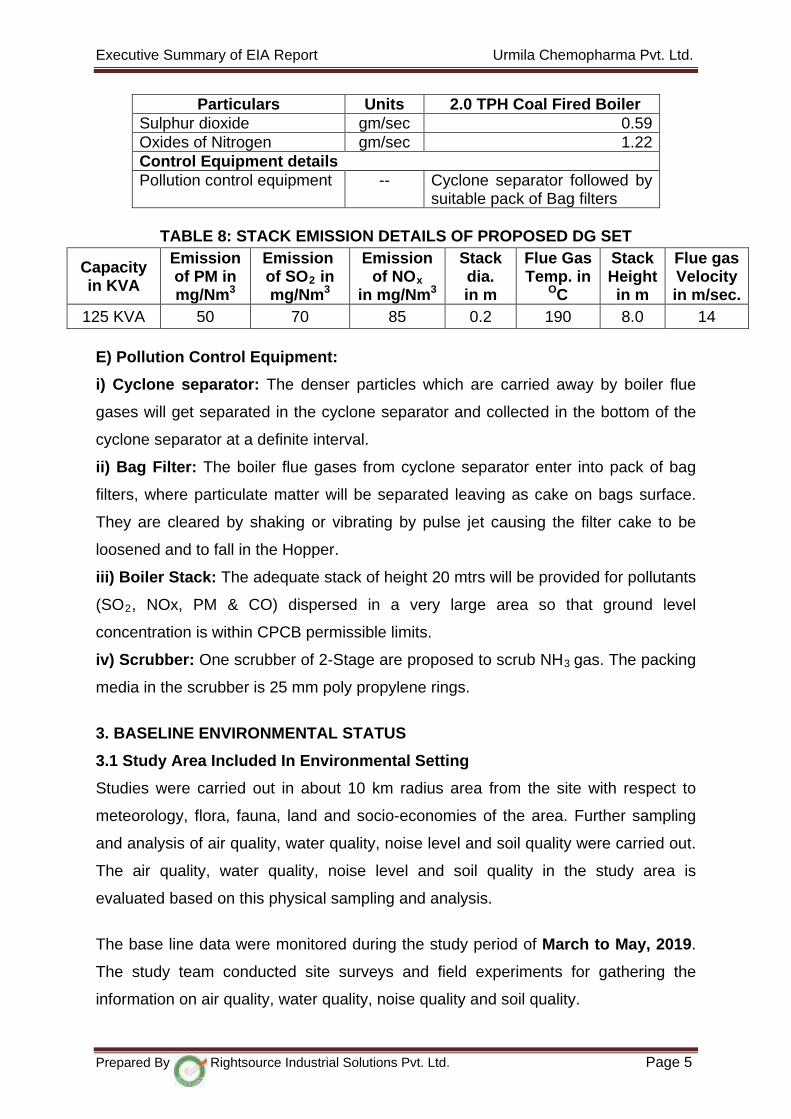
Executive Summary of EIA Report Urmila Chemopharma Pvt. Ltd.
Particulars Units 2.0 TPH Coal Fired Boiler Sulphur dioxide gm/sec 0.59 Oxides of Nitrogen gm/sec 1.22 Control Equipment details Pollution control equipment -- Cyclone separator followed by
suitable pack of Bag filters
TABLE 8: STACK EMISSION DETAILS OF PROPOSED DG SET
Capacity in KVA
Emission of PM in mg/Nm3
Emission of SO2 in mg/Nm3
Emission of NOx
in mg/Nm3
Stack dia. in m
Flue Gas Temp. in
OC
Stack Height in m
Flue gas Velocity in m/sec.
125 KVA 50 70 85 0.2 190 8.0 14
E) Pollution Control Equipment:
i) Cyclone separator: The denser particles which are carried away by boiler flue
gases will get separated in the cyclone separator and collected in the bottom of the
cyclone separator at a definite interval.
ii) Bag Filter: The boiler flue gases from cyclone separator enter into pack of bag
filters, where particulate matter will be separated leaving as cake on bags surface.
They are cleared by shaking or vibrating by pulse jet causing the filter cake to be
loosened and to fall in the Hopper.
iii) Boiler Stack: The adequate stack of height 20 mtrs will be provided for pollutants
(SO2, NOx, PM & CO) dispersed in a very large area so that ground level
concentration is within CPCB permissible limits.
iv) Scrubber: One scrubber of 2-Stage are proposed to scrub NH3 gas. The packing
media in the scrubber is 25 mm poly propylene rings.
3. BASELINE ENVIRONMENTAL STATUS
3.1 Study Area Included In Environmental Setting
Studies were carried out in about 10 km radius area from the site with respect to
meteorology, flora, fauna, land and socio-economies of the area. Further sampling
and analysis of air quality, water quality, noise level and soil quality were carried out.
The air quality, water quality, noise level and soil quality in the study area is
evaluated based on this physical sampling and analysis.
The base line data were monitored during the study period of March to May, 2019.
The study team conducted site surveys and field experiments for gathering the
information on air quality, water quality, noise quality and soil quality.
Prepared By Rightsource Industrial Solutions Pvt. Ltd. Page 5

Executive Summary of EIA Report Urmila Chemopharma Pvt. Ltd.
3.2 CLIMATE OF THE STUDY AREA
A. Temperature:
During the study period the minimum and maximum temperatures were recorded as
24 °C and 45 °C respectively.
B. Relative Humidity:
During study period at project site during study period, the relative humidity was
recorded as 55 %
C. Wind Pattern during Study Period
Dispersion of different air pollutants released into the atmosphere has significant
impacts on neighborhood air environment. The dispersion/dilution of the released
pollutant over a large area will result in considerable reduction of the concentration of
a pollutant. The dispersion in turn depends on the weather conditions like the wind
speed, wind direction, temperature, relative humidity, mixing height, cloud cover and
also the rainfall in the area.
Wind speed and direction data recorded during the study period is useful in
identifying the influence of meteorology on the air quality of the area. Wind roses on
sixteen sector basis have been drawn. Wind directions and wind speed frequency
observed during study period is given in Table 3.5 and wind rose was given in
Figure 3.4 (Chapter-3 in EIA Report)
The following observations can be made from the collected data:
• Calm period is observed to be 16.7 % during the time of monitoring.
• The predominant wind direction is W & NW.
• Other than predominant wind directions wind was blowing in SE direction.
• Average wind speed is 2.73 m/sec.
• Mostly the wind speeds are observed in the wind rose are in the range of 8.80
– 11.10 m/sec, 5.70 – 8.80 m/sec, 3.6 – 5.7 m/sec, 2.10 – 3.6 m/sec and 0.5 –
2.1 m/sec with frequency of distribution percentages of 2.9, 11, 16.4, 15.4 &
37.6 respectively.
D. Rainfall
Prepared By Rightsource Industrial Solutions Pvt. Ltd. Page 6
Executive Summary of EIA Report Urmila Chemopharma Pvt. Ltd.
Rainfall during the Study Period at the Project Site is 26.1 mm. Normal annual
rainfall is 742.5 mm. (Source: IMD Climatatological Normals, Solapur 1981 - 2010)
3.3 SAMPLING LOCATION DETAILS
Total eight locations were selected for Baseline status. Air, Water & Noise results are
presented in Table 9, 10 & 11 respectively.
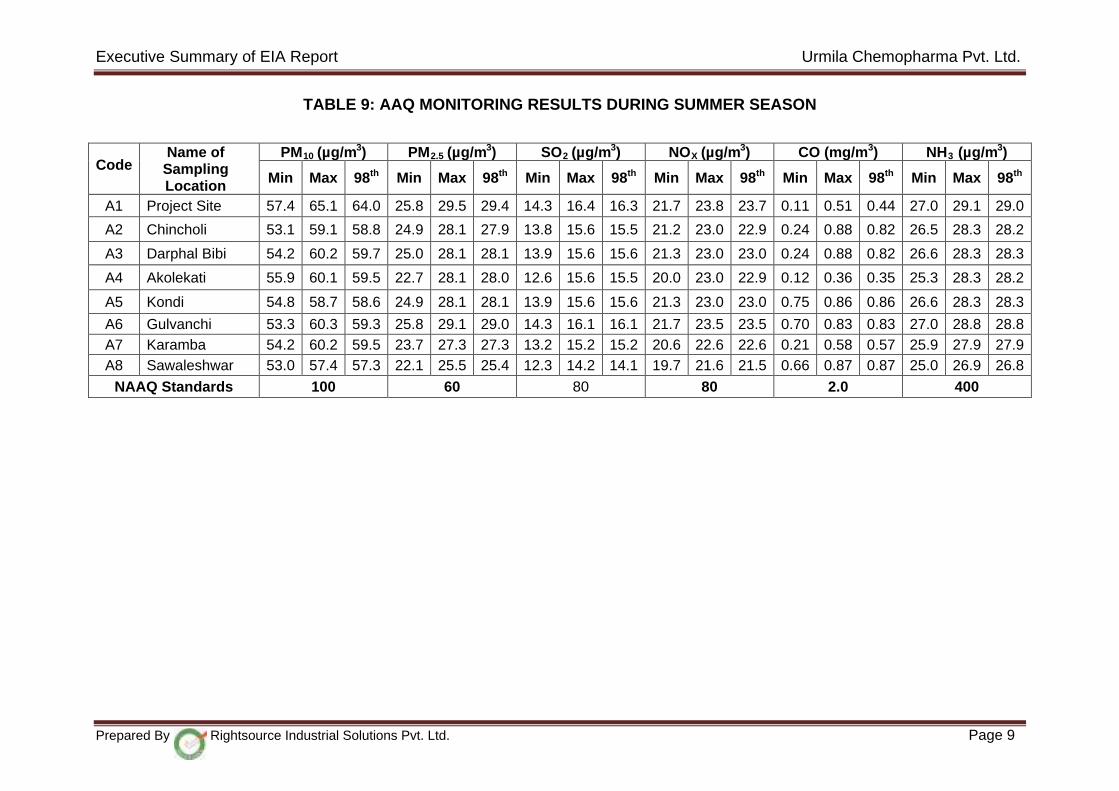
3.4 AMBIENT AIR QUALITY
The ambient air monitoring was carried out for 24 hours a day, twice a week for 12
week per location in the study area. Ambient Air Quality Monitoring (AAQM) was
carried out at eight locations during period of March to May, 2019.
1. Particulate Matter (PM10)
The maximum, minimum, average and 98th percentile concentrations for PM10 were
recorded in the study area in the range of 53.0 – 65.1 μg/ m3. The maximum 98th
Percentile concentration is 64.0 μg/ m3 were recorded at Project location. The
concentrations of PM10 are well below the CPCB standard of 100 μg/ m3.
2. Particulate Matter (PM2.5)
The CPCB Standard for concentration of PM2.5 is 60 μg/ m3. The maximum,
minimum, average and 98th percentile concentrations for Particulate Matter (PM2.5)
monitored in the study area were 22.1 – 29.5 μg/m3 respectively. Highest 98th
percentile value is 29.4 μg/ m3 was at Project location. The concentration of PM2.5 is
well below the prescribed limit of 60 μg/ m3.
3. Sulphur Dioxide (SO2)
The Minimum, maximum, average and 98th percentile value of Sulphur dioxide in the
study area from the monitored data was in the range of 12.3 – 16.4 μg/ m3.
Maximum 98th Percentile value of Sulpur dioxide is 16.3 μg/ m3 obtained at Project
location. The concentration of SO2 is well below the prescribed limit of 80 μg/ m3.
4. Oxides of Nitrogen (NOx)
Ambient air quality status monitored for oxides of nitrogen in the study area were in
the range with maximum, minimum, average and 98th percentile values between
19.7 – 23.8 μg/ m3. The maximum 98th Percentile value is 23.7 μg/ m3 was prevailing
at the time of sampling at Project location. The concentration of NOX is well below
the prescribed limit of 80 μg/ m3.
Prepared By Rightsource Industrial Solutions Pvt. Ltd. Page 7

Executive Summary of EIA Report Urmila Chemopharma Pvt. Ltd.
5. Carbon Monoxide (CO)
The maximum, minimum, average and 98th percentile concentrations for Carbon
Monoxide (CO) monitored in the study area were 0.11 – 0.88 mg/m3 respectively.
Highest 98th Percentile value is 0.87 mg/ m3 was recorded at the Sawaleshwar
location. The concentration of CO is well below the prescribed limit of 2 mg/ m3
6. Ammonia (NH3)
The maximum, minimum, average and 98th percentile concentrations for Ammonia
(NH3) monitored in the study area were in the range of 25.0 – 29.1 μg/m3
respectively. Highest 98th percentile value is 29.0 μg/ m3 was recorded at Project
location. The concentration of NH3 is well below the prescribed limit of 400 μg/ m3.
7. Volatile Organic Compounds (VOCs)
Volatile Organic Compounds (VOCs) concentration in study area was found to be
Below Detectable Limit of 1 ppm.
The ambient air quality monitoring results indicates that the overall air quality in the
study area is within permissible standards prescribed by NAAQ Standards.
Prepared By Rightsource Industrial Solutions Pvt. Ltd. Page 8
Executive Summary of EIA Report Urmila Chemopharma Pvt. Ltd.
TABLE 9: AAQ MONITORING RESULTS DURING SUMMER SEASON
Code Name of
Sampling Location
PM10 (µg/m3) PM2.5 (µg/m3) SO2 (µg/m3) NOX (µg/m3) CO (mg/m3) NH3 (µg/m3)
Min Max 98th Min Max 98th Min Max 98th Min Max 98th Min Max 98th Min Max 98th
A1 Project Site 57.4 65.1 64.0 25.8 29.5 29.4 14.3 16.4 16.3 21.7 23.8 23.7 0.11 0.51 0.44 27.0 29.1 29.0
A2 Chincholi 53.1 59.1 58.8 24.9 28.1 27.9 13.8 15.6 15.5 21.2 23.0 22.9 0.24 0.88 0.82 26.5 28.3 28.2
A3 Darphal Bibi 54.2 60.2 59.7 25.0 28.1 28.1 13.9 15.6 15.6 21.3 23.0 23.0 0.24 0.88 0.82 26.6 28.3 28.3
A4 Akolekati 55.9 60.1 59.5 22.7 28.1 28.0 12.6 15.6 15.5 20.0 23.0 22.9 0.12 0.36 0.35 25.3 28.3 28.2
A5 Kondi 54.8 58.7 58.6 24.9 28.1 28.1 13.9 15.6 15.6 21.3 23.0 23.0 0.75 0.86 0.86 26.6 28.3 28.3
A6 Gulvanchi 53.3 60.3 59.3 25.8 29.1 29.0 14.3 16.1 16.1 21.7 23.5 23.5 0.70 0.83 0.83 27.0 28.8 28.8 A7 Karamba 54.2 60.2 59.5 23.7 27.3 27.3 13.2 15.2 15.2 20.6 22.6 22.6 0.21 0.58 0.57 25.9 27.9 27.9 A8 Sawaleshwar 53.0 57.4 57.3 22.1 25.5 25.4 12.3 14.2 14.1 19.7 21.6 21.5 0.66 0.87 0.87 25.0 26.9 26.8
NAAQ Standards 100 60 80 80 2.0 400
Prepared By Rightsource Industrial Solutions Pvt. Ltd. Page 9

Executive Summary of EIA Report Urmila Chemopharma Pvt. Ltd.
3.5 WATER QUALITY
Water sampling and subsequent analysis was carried out to determine both the
groundwater and surface water quality of the study area.
Ground water & Surface water samples were collected at 8 locations in the study
area. These samples were analyzed for physical and chemical parameters to
ascertain the Baseline status in the existing surface water and ground water bodies.
TABLE 10: WATER ANALYSIS RESULTS
S. No Parameters Ground water Surface water Min Max Min Max
1 pH 7.34 8.04 7.16 8.09 2 Total dissolved solids (mg/l) 280 946 205 640 3 Total hardness (mg/l) 183 536 115 196 4 Chlorides (mg/l) 48 232 14 187 5 Fluoride (mg/l) <0.5 <0.5 <0.5 <0.5 6 Sulphates (mg/l) 16.8 120 4.6 85.5
Ground water samples collected was analyzed as per the Standard methods and
the water quality of the study area is found within the permissible limits of IS: 10500
- 2012
3.6 NOISE ENVIRONMENT
Noise level monitoring was carried out at eight locations during the period of March
to May, 2019.
Daytime Noise Levels (Lday)
Industrial Zone: The day time noise level at the Project site was 66.1 dB (A), which
is well below the permissible limits of 75 dB (A).
Residential Zone: The daytime noise levels in all the residential locations were
observed to be in the range of 40.3 dB (A) to 49.4 dB (A). The noise levels at all the
locations were below the permissible limits of 55 dB (A).
Night time Noise Levels (Lnight)
Industrial Zone: The night time noise level in the Project site was observed be 54.3
dB (A), which is well below the permissible limits of 70 dB (A).
Residential Zone: The nighttime noise levels in all the residential locations were
observed to be in the range of 32 dB (A) to 40.2 dB (A). The noise levels were below
the permissible limits of 45 dB (A) in nighttime at all the locations.
Prepared By Rightsource Industrial Solutions Pvt. Ltd. Page 10

Executive Summary of EIA Report Urmila Chemopharma Pvt. Ltd.
TABLE 11: NOISE LEVELS OF THE STUDY AREA
S. No
Name of the Location
Category of
Area/zone
Day Time in Leq dB (A)
CPCB Standard
Day Time
Night Time in
Leq dB (A)
CPCB Standard
Night time
1. Project site Industrial 66.1 75 dB (A) 54.3 70 dB (A) 2. Chincholi Residential 48.6 55 dB (A) 39.5 45 dB (A) 3. Darphal Bibi Residential 47.1 55 dB (A) 38.4 45 dB (A) 4. Akolekati Residential 49.4 55 dB (A) 40.2 45 dB (A) 5. Kondi Residential 40.3 55 dB (A) 32.0 45 dB (A) 6. Pakni Residential 42.1 55 dB (A) 33.6 45 dB (A) 7. Sawaleshwar Residential 46.4 55 dB (A) 37.1 45 dB (A) 8. Karamba Residential 45.1 55 dB (A) 36.4 45 dB (A)
3.7 SOIL ENVIRONMENT
Based on the baseline data, the soil results were found to be normal.
3.8 LAND USE/ LAND COVER OF THE STUDY AREA
Land use / Land cover map is prepared by visual interpretation of high-resolution
satellite data (Satellite Imagery Acquisition: 21-Feb-2019) and with the help of
Survey of India Topographic maps on 1: 50,000 scale. One season data is used for
the delineation of different units. The units are confirmed by the ground truth/field
visits.
TABLE 12: LAND USE / LAND COVER OF THE STUDY AREA
S. No. LAND USE AREA (Sq. km) %
1 Built- Up Land 30.458 9.7 2 Water Bodies 11.932 3.8 3 Crop Land 224.196 71.4 4 Waste Land 37.052 11.8 5 Others 10.362 3.3
TOTAL 314 100
3.9 DEMOGRAPHIC AND SOCIO-ECONOMIC PROFILE
• The total population of the study area is 63,163 in which male and female
population constitutes about 52.22 % and 47.78 % in the study area
respectively.
• The literate male and female in the study area are 23,765 and 17,438 which
implies that the percentage of literacy rate is 72.05 % with male and 57.78 %
with female respectively.
Prepared By Rightsource Industrial Solutions Pvt. Ltd. Page 11
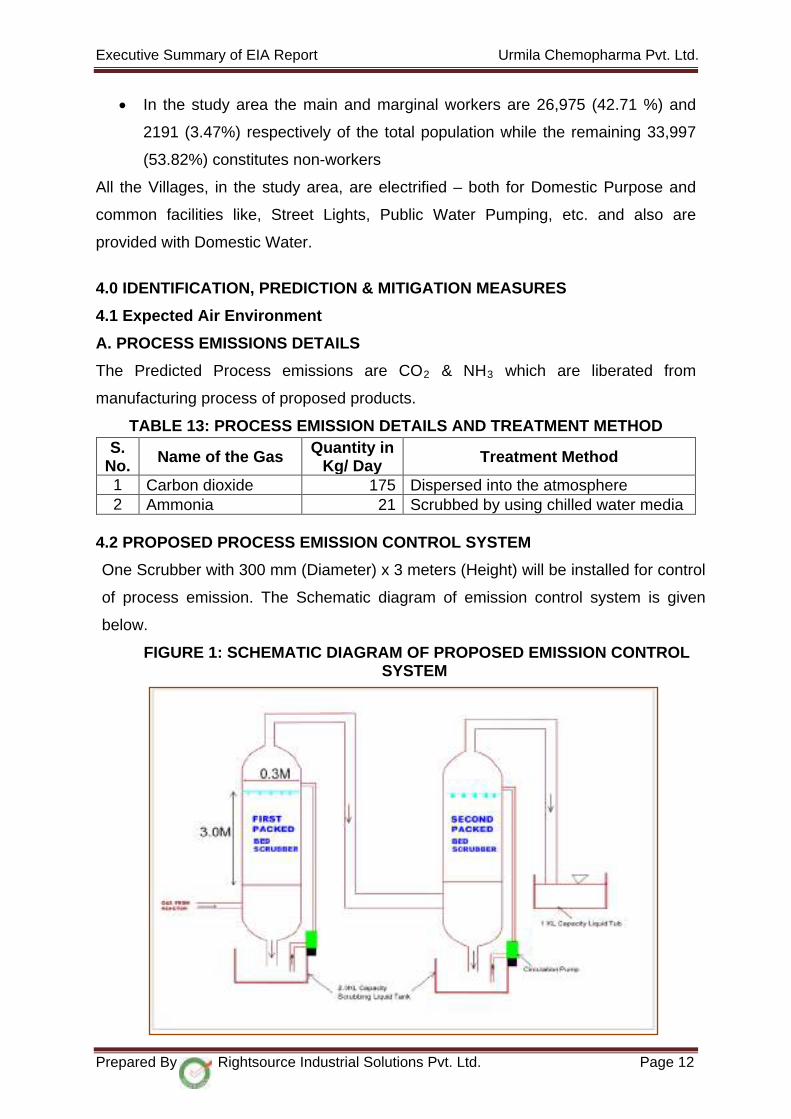
Executive Summary of EIA Report Urmila Chemopharma Pvt. Ltd.
• In the study area the main and marginal workers are 26,975 (42.71 %) and
2191 (3.47%) respectively of the total population while the remaining 33,997
(53.82%) constitutes non-workers
All the Villages, in the study area, are electrified – both for Domestic Purpose and
common facilities like, Street Lights, Public Water Pumping, etc. and also are
provided with Domestic Water.
4.0 IDENTIFICATION, PREDICTION & MITIGATION MEASURES
4.1 Expected Air Environment
A. PROCESS EMISSIONS DETAILS
The Predicted Process emissions are CO2 & NH3 which are liberated from
manufacturing process of proposed products.
TABLE 13: PROCESS EMISSION DETAILS AND TREATMENT METHOD S.
No. Name of the Gas Quantity in Kg/ Day Treatment Method
1 Carbon dioxide 175 Dispersed into the atmosphere 2 Ammonia 21 Scrubbed by using chilled water media
4.2 PROPOSED PROCESS EMISSION CONTROL SYSTEM
One Scrubber with 300 mm (Diameter) x 3 meters (Height) will be installed for control
of process emission. The Schematic diagram of emission control system is given
below.
FIGURE 1: SCHEMATIC DIAGRAM OF PROPOSED EMISSION CONTROL SYSTEM
Prepared By Rightsource Industrial Solutions Pvt. Ltd. Page 12

Executive Summary of EIA Report Urmila Chemopharma Pvt. Ltd.
B. EMISSIONS FROM BOILER
The Particulate matter generated from 2.0 TPH Boiler will be controlled by using
cyclone separator followed by bag filters. The Sulphur dioxide (SO2) and oxides of
nitrogen (NOX) from boiler will be dispersed in to atmosphere by providing adequate
stack of height 20 mtrs for effective dispersion and dilution.
The predicted ground level concentrations when added to Baseline scenario, the
overall scenario levels of PM10, PM2.5, SO2 and NOX are well within the permissible
limits as specified by NAAQ Standards.
TABLE 14: RESULTANT CONCENTRATIONS DUE TO INCREMENTAL GLC's
Pollutant Maximum Baseline
Concentration
Incremental Concentrations due to Proposed
Project
Resultant Concentration
NAAQ Standards
PM10 (μg/m3) 64.0 0.40 64.40 100 PM2.5 (μg/m3) 29.4 0.10 29.50 60 SO2 (μg/m3) 16.3 0.85 17.15 80 NOx (μg/m3) 23.7 1.55 25.25 80
4.3 Expected Effluent Water Details
The waste water generation will be 10.82 KLD which is from Process, washings,
cooling tower bleed off, Boiler blow down, Scrubber and domestic usage. The
effluent generation and its HTDS & LTDS effluent details are given in Table 15.
TABLE 15: EXPECTED EFFLUENT GENERATION DETAILS
S. No. Purpose Effluent Details KLD
1 Process 1.32 2 Washings 3.00 3 Boiler Blow down 2.00 4 Cooling tower Bleed off 1.00 5 Scrubbing system 1.00 6 Domestic 2.50
Total 10.82
Prepared By Rightsource Industrial Solutions Pvt. Ltd. Page 13
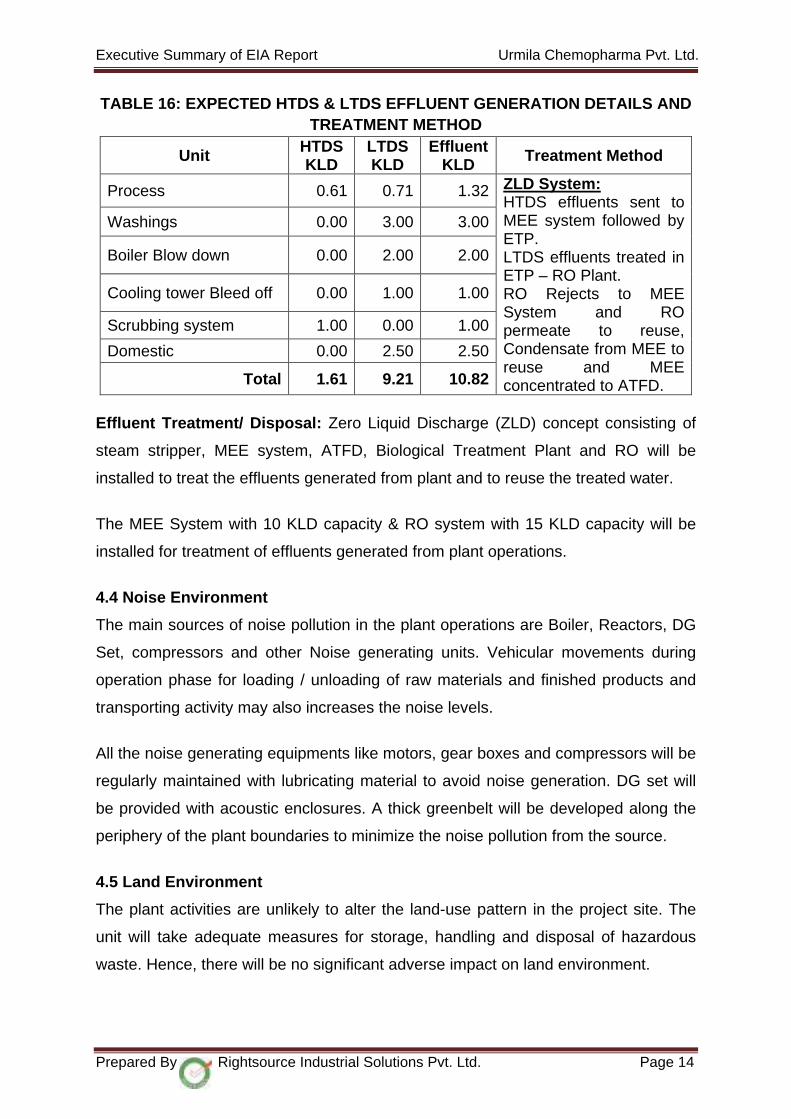
Executive Summary of EIA Report Urmila Chemopharma Pvt. Ltd.
TABLE 16: EXPECTED HTDS & LTDS EFFLUENT GENERATION DETAILS AND TREATMENT METHOD
Unit HTDS KLD
LTDS KLD
Effluent KLD Treatment Method
Process 0.61 0.71 1.32 ZLD System: HTDS effluents sent to MEE system followed by ETP. LTDS effluents treated in ETP – RO Plant. RO Rejects to MEE System and RO permeate to reuse, Condensate from MEE to reuse and MEE concentrated to ATFD.
Washings 0.00 3.00 3.00
Boiler Blow down 0.00 2.00 2.00
Cooling tower Bleed off 0.00 1.00 1.00
Scrubbing system 1.00 0.00 1.00
Domestic 0.00 2.50 2.50
Total 1.61 9.21 10.82
Effluent Treatment/ Disposal: Zero Liquid Discharge (ZLD) concept consisting of
steam stripper, MEE system, ATFD, Biological Treatment Plant and RO will be
installed to treat the effluents generated from plant and to reuse the treated water.
The MEE System with 10 KLD capacity & RO system with 15 KLD capacity will be
installed for treatment of effluents generated from plant operations.
4.4 Noise Environment
The main sources of noise pollution in the plant operations are Boiler, Reactors, DG
Set, compressors and other Noise generating units. Vehicular movements during
operation phase for loading / unloading of raw materials and finished products and
transporting activity may also increases the noise levels.
All the noise generating equipments like motors, gear boxes and compressors will be
regularly maintained with lubricating material to avoid noise generation. DG set will
be provided with acoustic enclosures. A thick greenbelt will be developed along the
periphery of the plant boundaries to minimize the noise pollution from the source.
4.5 Land Environment
The plant activities are unlikely to alter the land-use pattern in the project site. The
unit will take adequate measures for storage, handling and disposal of hazardous
waste. Hence, there will be no significant adverse impact on land environment.
Prepared By Rightsource Industrial Solutions Pvt. Ltd. Page 14
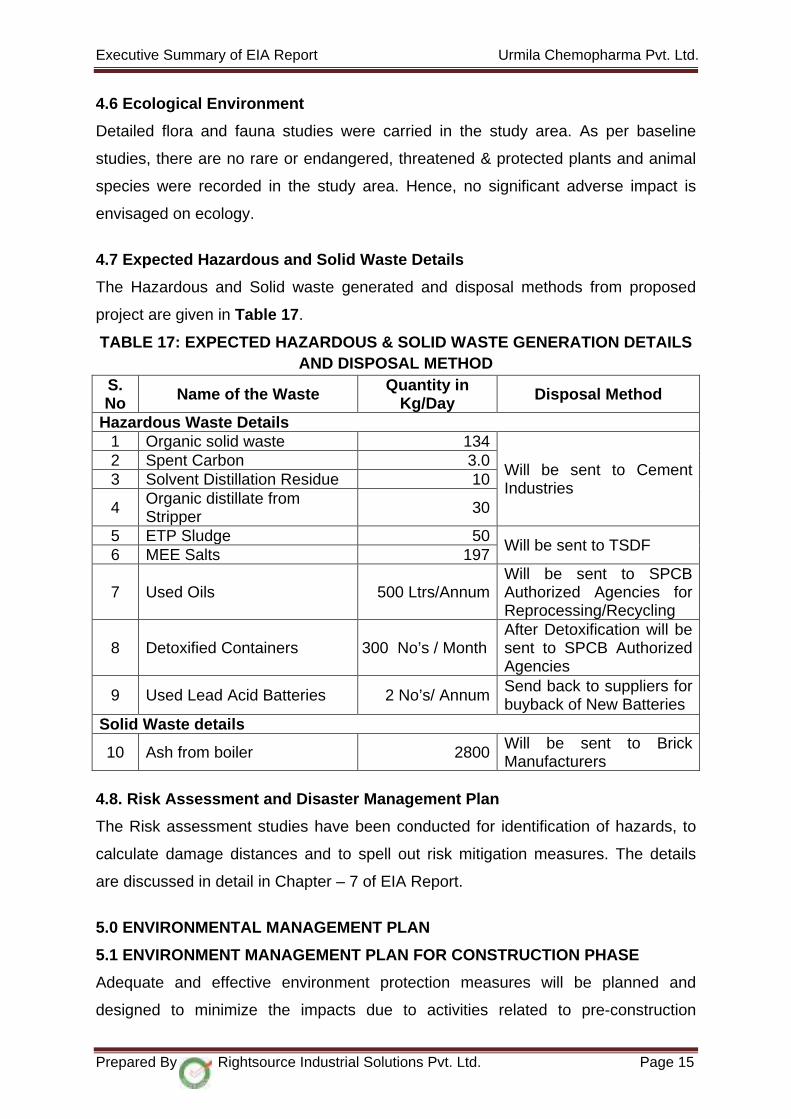
Executive Summary of EIA Report Urmila Chemopharma Pvt. Ltd.
4.6 Ecological Environment
Detailed flora and fauna studies were carried in the study area. As per baseline
studies, there are no rare or endangered, threatened & protected plants and animal
species were recorded in the study area. Hence, no significant adverse impact is
envisaged on ecology.
4.7 Expected Hazardous and Solid Waste Details
The Hazardous and Solid waste generated and disposal methods from proposed
project are given in Table 17.
TABLE 17: EXPECTED HAZARDOUS & SOLID WASTE GENERATION DETAILS AND DISPOSAL METHOD
S. No Name of the Waste Quantity in
Kg/Day Disposal Method
Hazardous Waste Details 1 Organic solid waste 134
Will be sent to Cement Industries
2 Spent Carbon 3.0 3 Solvent Distillation Residue 10
4 Organic distillate from Stripper 30
5 ETP Sludge 50 Will be sent to TSDF
6 MEE Salts 197
7 Used Oils 500 Ltrs/Annum Will be sent to SPCB Authorized Agencies for Reprocessing/Recycling
8 Detoxified Containers 300 No’s / Month After Detoxification will be sent to SPCB Authorized Agencies
9 Used Lead Acid Batteries 2 No’s/ Annum Send back to suppliers for buyback of New Batteries
Solid Waste details
10 Ash from boiler 2800 Will be sent to Brick Manufacturers
4.8. Risk Assessment and Disaster Management Plan
The Risk assessment studies have been conducted for identification of hazards, to
calculate damage distances and to spell out risk mitigation measures. The details
are discussed in detail in Chapter – 7 of EIA Report.
5.0 ENVIRONMENTAL MANAGEMENT PLAN
5.1 ENVIRONMENT MANAGEMENT PLAN FOR CONSTRUCTION PHASE
Adequate and effective environment protection measures will be planned and
designed to minimize the impacts due to activities related to pre-construction
Prepared By Rightsource Industrial Solutions Pvt. Ltd. Page 15
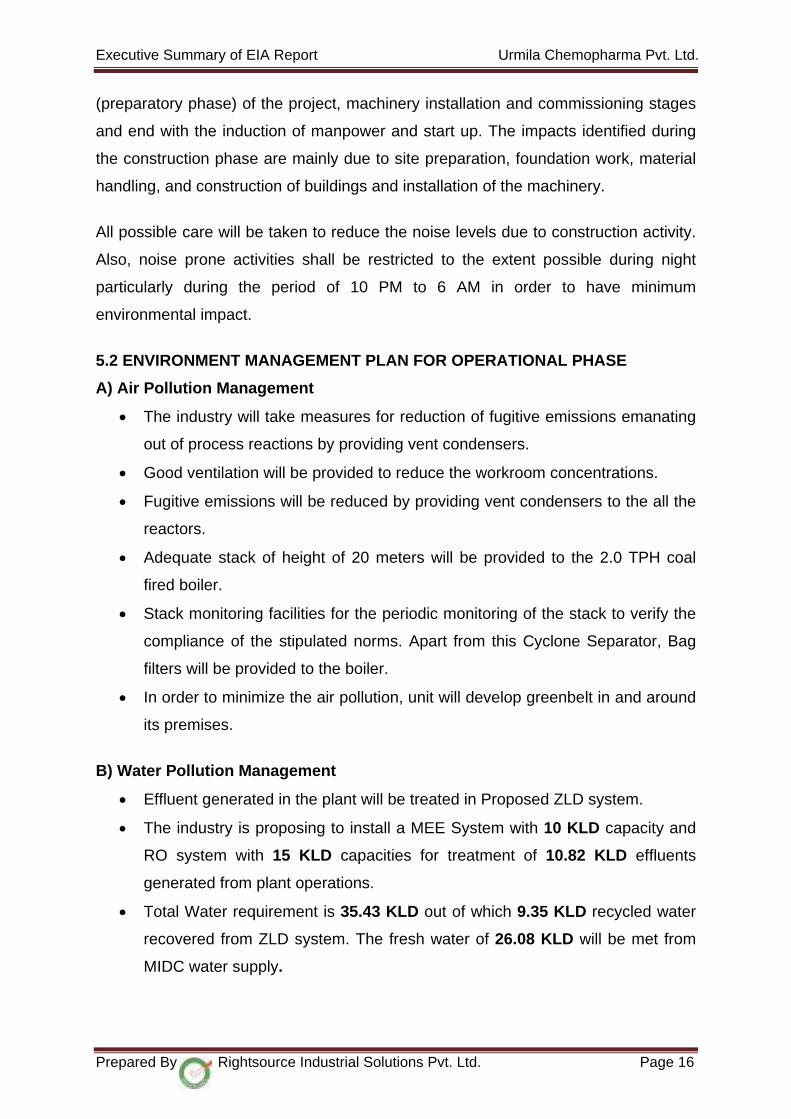
Executive Summary of EIA Report Urmila Chemopharma Pvt. Ltd.
(preparatory phase) of the project, machinery installation and commissioning stages
and end with the induction of manpower and start up. The impacts identified during
the construction phase are mainly due to site preparation, foundation work, material
handling, and construction of buildings and installation of the machinery.
All possible care will be taken to reduce the noise levels due to construction activity.
Also, noise prone activities shall be restricted to the extent possible during night
particularly during the period of 10 PM to 6 AM in order to have minimum
environmental impact.
5.2 ENVIRONMENT MANAGEMENT PLAN FOR OPERATIONAL PHASE
A) Air Pollution Management
• The industry will take measures for reduction of fugitive emissions emanating
out of process reactions by providing vent condensers.
• Good ventilation will be provided to reduce the workroom concentrations.
• Fugitive emissions will be reduced by providing vent condensers to the all the
reactors.
• Adequate stack of height of 20 meters will be provided to the 2.0 TPH coal
fired boiler.
• Stack monitoring facilities for the periodic monitoring of the stack to verify the
compliance of the stipulated norms. Apart from this Cyclone Separator, Bag
filters will be provided to the boiler.
• In order to minimize the air pollution, unit will develop greenbelt in and around
its premises.
B) Water Pollution Management
• Effluent generated in the plant will be treated in Proposed ZLD system.
• The industry is proposing to install a MEE System with 10 KLD capacity and
RO system with 15 KLD capacities for treatment of 10.82 KLD effluents
generated from plant operations.
• Total Water requirement is 35.43 KLD out of which 9.35 KLD recycled water
recovered from ZLD system. The fresh water of 26.08 KLD will be met from
MIDC water supply.
Prepared By Rightsource Industrial Solutions Pvt. Ltd. Page 16

Executive Summary of EIA Report Urmila Chemopharma Pvt. Ltd.
• Unit is proposed to recharge ground water through roof water harvesting pits
in the project area and rain water harvesting pits outside plant area wherever
possible to balance the water table.
• Use of high-pressure hoses for cleaning the floor and process equipment to
reduce the amount of wastewater generated during washings.
C) Noise Pollution Management
• Noise suppression measures such as enclosures, buffers and / or protective
measures will be provided, if required.
• Extensive oiling, lubrication and preventive maintenance will be carried out for
the machineries and equipments to reduce noise generation.
• Greenbelt Development.
D) Hazardous & Solid Waste Management
To reduce the quantity of hazardous & solid waste generation as well as possible
contamination of land (soil) due to spillages / leaks from the plant operations,
following Mitigation measures are proposed:
• There will not be any leakages / spillage from the raw-materials storage.
• The generated Hazardous waste will be stored on floor with suitable packing
and this dedicated area will be covered with the roof.
• The records on quantity of hazardous waste generation and disposal will be
maintained for each category and possibilities will be explored for
minimization and reuse.
E) Green Belt
Greenbelt will be developed in an area of 0.53 Acres (2148.2 Sq. m). The industry
will spend 3.0 Lakhs as capital cost for planting of samplings. Lists of plants suitable
for greenbelt as per the local agro climatic conditions are given in the EIA Report.
F) Solvent Recovery
Solvents will be recovered up to 95% using distillation column and necessary cooling
condensers.
Prepared By Rightsource Industrial Solutions Pvt. Ltd. Page 17

Executive Summary of EIA Report Urmila Chemopharma Pvt. Ltd.
5.3 ENVIRONMENT MANAGEMENT CELL
Urmila Chemopharma Pvt. Ltd. will provide dedicated Environmental Management
Cell with experienced staff to look after the proper environmental management of the
plant including operation & maintenance of all pollution control facilities.
5.4 ENVIRONMENT MONITORING PROGRAM
Regular monitoring of environmental parameters is of immense importance to
assess the status of environment during project operation. The regular monitoring
will be carried out with the MoEF&CC Registered / NABL Accredited Laboratory.
6.0 PROPOSED ROOF WATER HARVESTING
Roof top rainwater harvesting is one of the appropriate options for augmenting
ground water recharge/ storage in this industry.
The following table gives expected quantity of rain water harvesting using buildings
Roof top.
TABLE 18: AVAILABLE RAINWATER (ANNUAL) FOR HARVESTING
Description Area (m2) Rainfall (m/Annum)
Runoff coefficient
Total Rainwater (m3/Annum)
Roof Area 768.32 0.7425 0.8 456.4 Total available rainwater (in m3/annum) 456
FIGURE 2: PROPOSED ROOF WATER HARVESTING STRUCTURE
Prepared By Rightsource Industrial Solutions Pvt. Ltd. Page 18
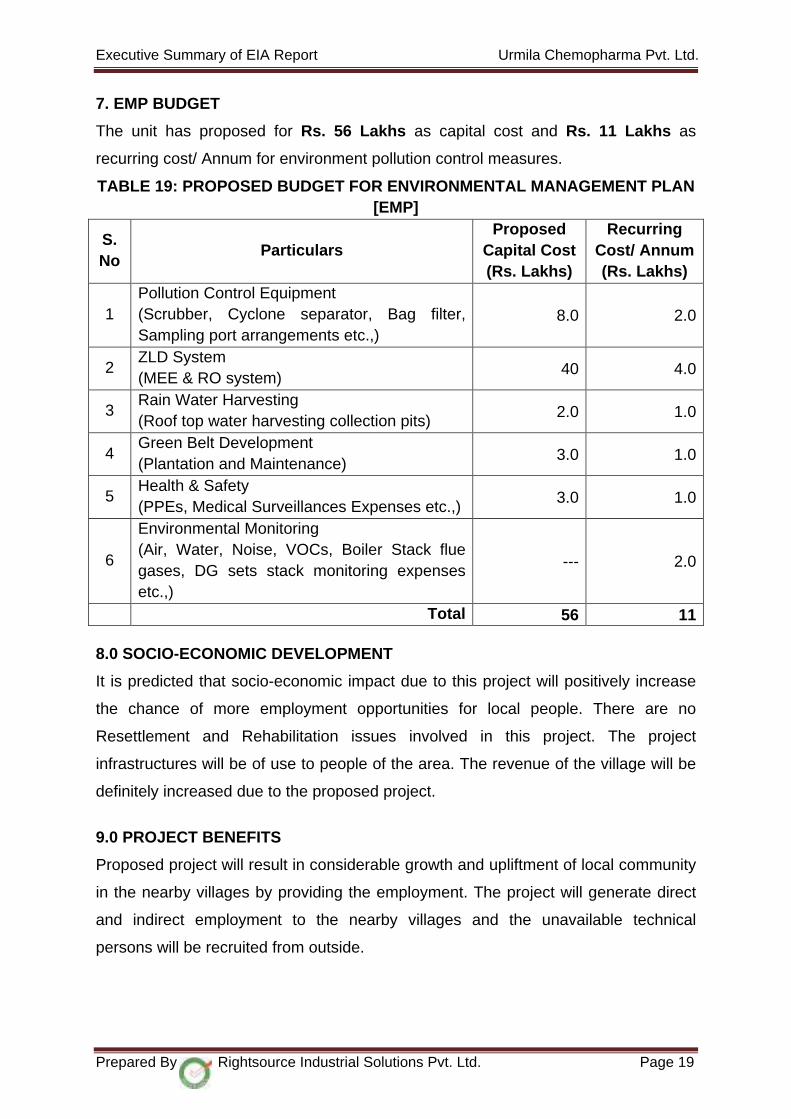
Executive Summary of EIA Report Urmila Chemopharma Pvt. Ltd.
7. EMP BUDGET
The unit has proposed for Rs. 56 Lakhs as capital cost and Rs. 11 Lakhs as
recurring cost/ Annum for environment pollution control measures.
TABLE 19: PROPOSED BUDGET FOR ENVIRONMENTAL MANAGEMENT PLAN [EMP]
S. No
Particulars Proposed
Capital Cost (Rs. Lakhs)
Recurring Cost/ Annum (Rs. Lakhs)
1 Pollution Control Equipment (Scrubber, Cyclone separator, Bag filter, Sampling port arrangements etc.,)
8.0 2.0
2 ZLD System (MEE & RO system)
40 4.0
3 Rain Water Harvesting (Roof top water harvesting collection pits) 2.0 1.0
4 Green Belt Development (Plantation and Maintenance)
3.0 1.0
5 Health & Safety (PPEs, Medical Surveillances Expenses etc.,)
3.0 1.0
6
Environmental Monitoring (Air, Water, Noise, VOCs, Boiler Stack flue gases, DG sets stack monitoring expenses etc.,)
--- 2.0
Total 56 11
8.0 SOCIO-ECONOMIC DEVELOPMENT
It is predicted that socio-economic impact due to this project will positively increase
the chance of more employment opportunities for local people. There are no
Resettlement and Rehabilitation issues involved in this project. The project
infrastructures will be of use to people of the area. The revenue of the village will be
definitely increased due to the proposed project.
9.0 PROJECT BENEFITS
Proposed project will result in considerable growth and upliftment of local community
in the nearby villages by providing the employment. The project will generate direct
and indirect employment to the nearby villages and the unavailable technical
persons will be recruited from outside.
Prepared By Rightsource Industrial Solutions Pvt. Ltd. Page 19
Executive Summary of EIA Report Urmila Chemopharma Pvt. Ltd.
Urmila Chemopharma Pvt. Ltd. has committed to implement all the pollution
control measures to protect the surrounding environment – adapting Zero-Liquid-
Discharge System for all its Effluents, by controlling process emissions and Safe-
Disposal of all Solid Wastes – generated either as process wastes or packing
wastes.
The project can definitely improve the regional, state and national economy.
Industrial growth is an indication of all-round Socio-Economic Development – by
generating local Employment and Business Opportunities. The implementation of
this project will definitely improve the physical and social infrastructure of the
surrounding area.
Prepared By Rightsource Industrial Solutions Pvt. Ltd. Page 20
10.0 CONCLUSION

CHAPTER -I
INTRODUCTION

EIA Report Urmila Chemopharma Pvt. Ltd.
CHAPTER- I
INTRODUCTION
1.1 PURPOSE OF THE REPORT
As per the EIA Notification dated 14th September 2006 and its amendments from time to
time, the project falls under 5(f) “A” category and requires Environmental Clearance. Urmila
Chemopharma Pvt. Ltd. engaged the services of Rightsource Industrial Solutions Pvt. Ltd,
Hyderabad to prepare and submit the necessary documents.
As per the Office Memorandum issued by Ministry of Environment, Forest and Climate
Change, Government of India vide No. J-11011/321/2016-IA-II (I) dt. 27th April, 2018 noted
as Public hearing is exemption for the unit “if it is located in a Notified Industrial Area
established prior to 14th September, 2006.” Urmila Chemopharma Pvt. Ltd. located in
Industrial park – MIDC Chincholi and it has been notified as Industrial estate by the
Government of Maharashtra State on 16.05.1988. But the project boundary is located at a
distance of 2.45 Km from Great Indian Bustard Sanctuary (GIBS), Kondi (Gat No. 104),
which is a Notified Eco- sensitive area and satisfies the General Condition as per EIA
Notification, 14th Sep, 2006. Hence, the project comes under Category “A”.
The project proposal has granted with Standard Terms of Reference F. No: IA-J-
11011/345/2018-IA II (I) Dated on 01st April 2019, to carryout EIA Study. The
Environmental monitoring and analysis was carried out during the period of March to May,
2019 and EIA Report was prepared.
The proposed project is located 2.45 Km away from the GIBS, Kondi. Hence, the proponent
has submitted the online application to get the clearance from Chief Wildlife Warden,
Proposal No. FP/MH/IND/3695/2018 dated: 17.12.2018 which is under process.
1.2 IDENTIFICATION OF PROJECT & PROJECT PROPONENT
1.2.1 IDENTIFICATION OF THE PROJECT
Urmila Chemopharma Pvt. Ltd. has registered office located at Flat No. 46, Hiramoti
Tower, 04th Floor, Vidigharkul, Near Hyderabad market yard, Sonia Nagar, Solapur District
– 413 005, Maharashtra State. Industry proposed a Bulk Drug Intermediates Manufacturing
Unit at Plot No.: F-24, MIDC, Chincholi Industrial Area, Chincholi Village, Mohal Taluk,
Solapur District, Maharashtra state.
Prepared By Rightsource Industrial Solutions Pvt. Ltd. Chapter - I Page 1
EIA Report Urmila Chemopharma Pvt. Ltd.
The manufacturing unit is in an area of 1.48 Acres (6000 Sq. m). The proposed project cost
is about Rs. 2.5 Crores will be used for constructing building, Equipments & misc.
1.2.2 ABOUT THE PROMOTERS
Shri Chinna Butchiraju Lolabhattu is a Managing Director, studied B. Sc Chemistry and
having 25 years experience in Chemical Industry.
1.3 OBJECTIVE OF THE STUDY
The objective of the study is to carry out Environmental Impact Assessment (EIA) for the
proposed project to meet the Environmental compliances laid down by the Ministry of
Environment, Forest and Climate Change (MoEF&CC) Government of India.
The study would include the description of project setting, appraisal of project activities and
assessment of adverse impacts related to the location, design, construction and operation
of the project. Environmental Management Plan (EMP) will be prepared that includes
mitigation measures, including evaluation of alternatives to reduce or mitigate/eliminate the
impacts that likely to cause most significant environmental burdens. As per the above
notification the industry seeks Environment Clearance from MoEF&CC, GoI, New Delhi.
Preparation of Environmental Impact Assessment Report (EIA) based on one season
(Three Months) data, which would be used as management planning tool for better
Environmental Management by suggesting control measures to avoid pollution problems
arising out of the project. The report will include a detailed Environmental Management
Plan (EMP). The study will be carried out incorporating all the details and requirements of
State Pollution Control Board (SPCB) and Ministry of Ministry of Environment, Forest and
Climatic Change as per their requirements.
1.4 BRIEF DESCRIPTION OF THE PROJECT
1.4.1 NATURE OF THE PROJECT
Urmila Chemopharma Pvt. Ltd. has proposed a Bulk Drug Intermediates manufacturing
unit, which falls under 5(f) “A” category of Synthetic Organic Chemicals Industry as per EIA
Notification, 2006 and its amendment thereof and requires Environmental Clearance.
1.4.2 SIZE OF THE PROJECT
The industry proposed a manufacturing unit in an area of 1.48 Acres (6000 Sq. m). The
proposed project cost is about Rs. 2.5 Crores, which includes land cost, construction of the
buildings, equipment, machinery and greenbelt development.
Prepared By Rightsource Industrial Solutions Pvt. Ltd. Chapter - I Page 2

EIA Report Urmila Chemopharma Pvt. Ltd.
Urmila Chemopharma Pvt. Ltd. is proposed for manufacture the below mention products
with manufacturing capacity of 10 TPM. The list of proposed products is shown in Table
1.1.
TABLE 1.1: LIST OF PROPOSED PRODUCTS AND QUANTITIES
S. No
Name of the Product Quantity in MT/Month CAS No. Therapeutic Category
1 3,5 Dimethyl- 4-Nitropyridine N-Oxide 5.0 14248-66-9 Omeprazole Nitro
Compound Intermediate
2 3-Carbamoylmethyl-5-Methylhexanoic acid 5.0 181289-15-
6 Pregablin Intermediate
Total 10.0
TABLE 1.2: LIST OF BY-PRODUCTS AND QUANTITIES S. No
Name of the Product
Name of the By-Product
Quantity in Kg/Day
1 3,5 Dimethyl- 4-Nitropyridine N-Oxide
Ammonium sulphate 696
2 3-Carbamoylmethyl-5-Methylhexanoic acid
Ammonium sulphate 360 Spent Sulphuric acid (40%) 790
1.4.3 LOCATION OF THE PROJECT
Urmila Chemopharma Pvt. Ltd proposed Bulk Drug Intermediates Manufacturing Unit at
Plot No.: F-24, MIDC, Chincholi Industrial Area, Chincholi Village, Mohal Taluk, Solapur
District, Maharashtra state.
TABLE 1.3: PROJECT LOCATION AND COMPLIANCE OF SITE
Project location Details
Latitude & Longitude Latitude: 17°46'36.51" N Longitude: 75°48'9.69" E
Climatic Conditions
Annual Max Temp is 43.8 oC Annual Min Temp is 11 oC Normal Annual Rainfall is 742.5 mm (Source: IMD Climatalogical Normals, Solapur 1981 - 2010)
Land acquired for the plant 1.48 Acres (6000 Sq. m) Land use Industrial Land Nearest Habitation Chincholi Village - 1.9 Km (S) Nearest Town Solapur - 13 Km (SE) Major urban Settlements Solapur – 13 Km (SE) Nearest State Highway Nearest National Highway Nearest Railway station
State Highway No. 151 – 6.3 Km (E) (Solapur to Vairag Road) National Highway No. 9 – 3.3 Km (SW) (Solapur to Pune highway) Pakani Railway Station – 6 Km (SW)
Prepared By Rightsource Industrial Solutions Pvt. Ltd. Chapter - I Page 3
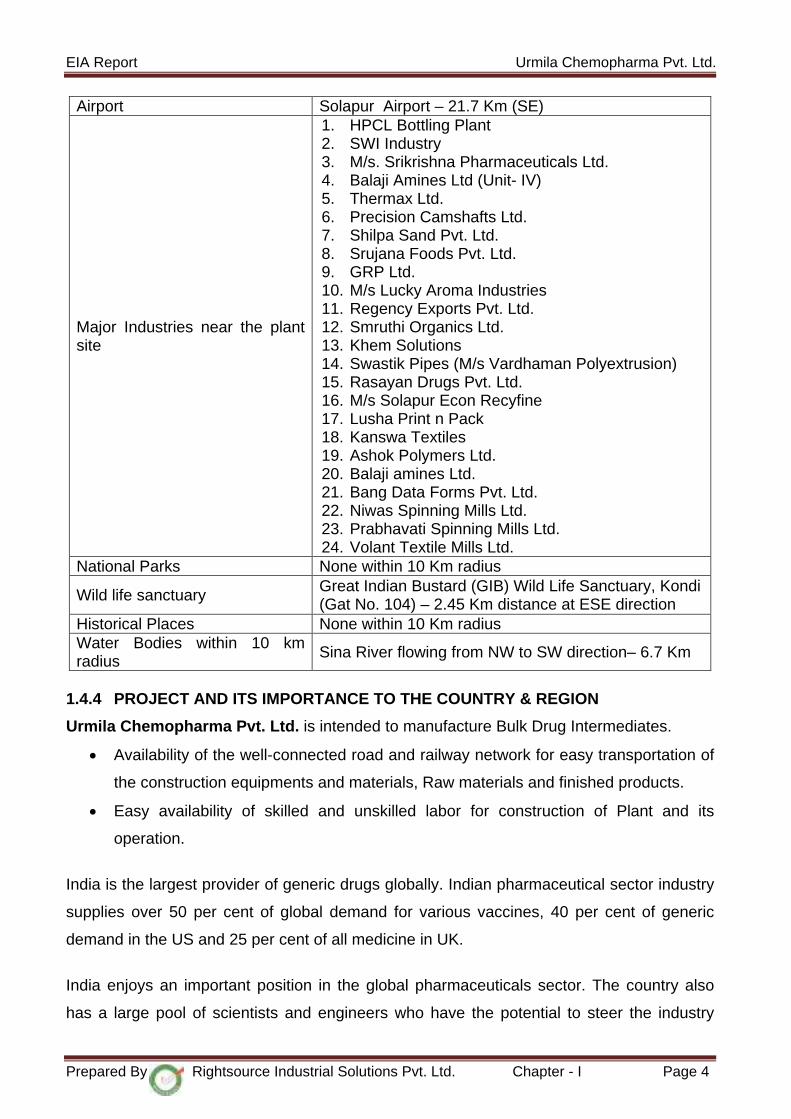
EIA Report Urmila Chemopharma Pvt. Ltd.
1.4.4 PROJECT AND ITS IMPORTANCE TO THE COUNTRY & REGION
Urmila Chemopharma Pvt. Ltd. is intended to manufacture Bulk Drug Intermediates.
• Availability of the well-connected road and railway network for easy transportation of
the construction equipments and materials, Raw materials and finished products.
• Easy availability of skilled and unskilled labor for construction of Plant and its
operation.
India is the largest provider of generic drugs globally. Indian pharmaceutical sector industry
supplies over 50 per cent of global demand for various vaccines, 40 per cent of generic
demand in the US and 25 per cent of all medicine in UK.
India enjoys an important position in the global pharmaceuticals sector. The country also
has a large pool of scientists and engineers who have the potential to steer the industry
Airport Solapur Airport – 21.7 Km (SE)
Major Industries near the plant site
1. HPCL Bottling Plant 2. SWI Industry 3. M/s. Srikrishna Pharmaceuticals Ltd. 4. Balaji Amines Ltd (Unit- IV) 5. Thermax Ltd. 6. Precision Camshafts Ltd. 7. Shilpa Sand Pvt. Ltd. 8. Srujana Foods Pvt. Ltd. 9. GRP Ltd. 10. M/s Lucky Aroma Industries 11. Regency Exports Pvt. Ltd. 12. Smruthi Organics Ltd. 13. Khem Solutions 14. Swastik Pipes (M/s Vardhaman Polyextrusion) 15. Rasayan Drugs Pvt. Ltd. 16. M/s Solapur Econ Recyfine 17. Lusha Print n Pack 18. Kanswa Textiles 19. Ashok Polymers Ltd. 20. Balaji amines Ltd. 21. Bang Data Forms Pvt. Ltd. 22. Niwas Spinning Mills Ltd. 23. Prabhavati Spinning Mills Ltd. 24. Volant Textile Mills Ltd.
National Parks None within 10 Km radius
Wild life sanctuary Great Indian Bustard (GIB) Wild Life Sanctuary, Kondi (Gat No. 104) – 2.45 Km distance at ESE direction
Historical Places None within 10 Km radius Water Bodies within 10 km radius Sina River flowing from NW to SW direction– 6.7 Km
Prepared By Rightsource Industrial Solutions Pvt. Ltd. Chapter - I Page 4
EIA Report Urmila Chemopharma Pvt. Ltd.
ahead to an even higher level. Presently over 80 per cent of the antiretroviral drugs used
globally to combat AIDS (Acquired immune Deficiency Syndrome) are supplied by Indian
pharmaceutical firms.
The pharmaceutical sector was valued at US$ 33 billion in 2017. The country’s
pharmaceutical industry is expected to expand at a CAGR of 22.4 per cent over 2015-20 to
reach US$ 55 billion India’s pharmaceutical exports stood at US$ 17.27 billion in FY18 and
have reached US$ 10.80 billion in FY19 (up to October 2018). India’s generics market has
shown an immense potential for future growth.
1.5 SCOPE OF THE STUDY
1.5.1 ENVIRONMENTAL IMPACT ASSESSMENT
To assess the impact of the project on Land use, Ambient Air Quality, Water Quality,
Noise levels, Ecology & Biodiversity, Hydrology & Geology, and Socio- economic
status of area.
To prepare Environmental Management Plan (EMP) for mitigating adverse impacts
due to proposed project.
Collection and testing of water sources and soil.
To prepare environmental monitoring plan for operational phase.
Greenbelt development.
1.5.2 SOCIO-ECONOMIC ASSESSMENT
This Study Report covers Population, Gender Ratio, Rural & Semi-Urban Demographic
Distribution, Literacy Rate and Social Amenities available in the study Area like, Transport,
Sanitation, Drinking Water, Medical & Health Facilities, Employment Rate and other
Developmental Indices of Villages falling within the 10 Km radius of the Proposed Project
site.
1.5.3 REGULATORY FRAMEWORK
The MoEF & CC, CPCB and SPCBs together form the regulatory and administrative core of
the sector. Legislation for environmental protection in India for chemical industry is mainly
EIA Notification- 2006, Water (Prevention & Control of Pollution) Act -1974, Air (Prevention
& Control of Pollution) Act, 1981, Water (Prevention and Control of Pollution) Cess Act,
1977, Hazardous Waste (Management, Handling and Trans boundary Movement) Rules,
2016, amended time to time etc are major Act/rules/notification applicable to industry.
Prepared By Rightsource Industrial Solutions Pvt. Ltd. Chapter - I Page 5

EIA Report Urmila Chemopharma Pvt. Ltd.
1.5.4 REGULATORY SCOPING
Obtaining Consent for Establishment & Consent for Operation from State
Pollution control board.
1.6 LEGAL POLICY AND INSTITUTIONAL FRAMEWORKS
The principal environmental regulatory authority is the Ministry of Environment, Forest and
Climatic Change (MoEF&CC), New Delhi which formulates environmental policies and
accords environmental clearances for different projects. Table 1.4 highlights the relevant
environmental legislations applicable to this project.
TABLE 1.4: APPLICABILITY OF LEGAL POLICIES TO THE PROJECT
S. No Legal frame work coordinating
authority Objectives of the policy Applicability
to the project
Environmental Legality
1 Water (Prevention and Control of pollution) Act, 1974
SPCB
Prohibits the discharge of pollutants into water bodies beyond a given standard, and lays down penalties for non-compliance
Applicable
2
Water (Prevention and Control of Pollution) Cess Act, 1977
SPCB
Provides for a levy and collection of a cess on water consumed by industries and local authorities
Applicable
3 Air (Prevention and Control of Pollution) Act, 1981
SPCB Provides means for the control and abatement of air pollution.
Applicable
4
The Air (Prevention and Control of Pollution) Rules, 1982
SPCB
Defined the procedures for conducting meetings of the boards, the powers of the presiding officers, decision-making etc
Applicable
5 Public Liability Insurance Act, 1991
Director of Factories
An act to provide for public liability insurance for the purpose of providing immediate relief to the persons affected by accident occurring while handling any hazardous substance and for matters connected herewith or incidental thereto
Applicable
6
Environment (Protection) Act, 1986 (EPA) followed by
Ministry of Environment, Forest and Climatic
Ensure that appropriate measures are taken to conserve and protect the Environment before
Applicable
Prepared By Rightsource Industrial Solutions Pvt. Ltd. Chapter - I Page 6

EIA Report Urmila Chemopharma Pvt. Ltd.
S. No Legal frame work coordinating
authority Objectives of the policy Applicability
to the project
amendment in May 1994 (Schedule-I)
Change (MoEF&CC)
commencement of operations.
7
Environmental Impact Assessment Notification no. S.O. 1533
MoEF&CC
Under its ambit various industries are liable to opt for Environmental clearance from MoEF&CC by providing EIA report
Applicable
8 The Environment (Protection) Rules, 1986
CPCB
Lay down the procedures for setting standards of emission or discharge of environmental pollutants
Applicable
9
The Hazardous Wastes management (Management and Handling) Rules, 1989 and amended in 2000
SPCB
Procedure for inventory, control, handling and disposal of hazardous waste. Provide for setting up of disposal sites/landfill sites design, operation and closure
Applicable
10 Solid Waste Management Rules, 2016
SPCB Procedure for management and handling of solid wastes Applicable
11
Batteries (Management and Handling) Amendment Rules, 2010
SPCB
To ensure that the used batteries are collected back as per the schedule against new batteries
Applicable
12 E- Waste (Management Rules), 2016
SPCB
Procedure to recovery/and/or reuse of useful material from waste electrical and electronic equipment
Applicable
13 The Wildlife (Protection) Act, 1972
NBWL/ SBWL
Under its ambit various industries under NP/WL Sanctuary, the industries are within 10 Km from the Wildlife Sanctuary are required to submit the application for clearance from Chief Wildlife Warden by providing Bio-diversity Impact Assessment report along with supporting documents.
Applicable
Prepared By Rightsource Industrial Solutions Pvt. Ltd. Chapter - I Page 7

PROJECT DESCRIPTION
CHAPTER -II
EIA Report Urmila Chemopharma Pvt. Ltd.
CHAPTER-II
PROJECT DESCRIPTION
2.1 TYPE OF THE PROJECT
Urmila Chemopharma Pvt. Ltd. is proposed a Bulk Drug Intermediates
Manufacturing Unit at Plot No.: F-24, MIDC, Chincholi Industrial Area, Chincholi
Village, Mohal Taluk, Solapur District, Maharashtra state.
The industry proposes to manufacturing unit in an area of 1.48 Acres (6000 Sq. m).
The Industry is having its registered office at Flat No. 46, Hiramoti Tower, 04th Floor,
Vidigharkul, Near Hyderabad market yard, Sonia Nagar, Solapur District – 413 005,
Maharashtra State
The proposed project cost is about Rs. 2.5 Crores, which includes Land cost,
construction of the buildings, equipments, machinery and greenbelt development.
2.2 NEED FOR THE PROJECT
India’s healthcare sector, one of the fastest growing sectors, is expected to advance
at a compounded annual growth rate (CAGR) of 17 per cent to reach USD$ 250
billion by 2020. The pharmaceutical sector was valued at US$ 33 billion in 2017. The
country’s pharmaceutical industry is expected to expand at a CAGR of 22.4 per cent
over 2015-20 to reach US$ 55 billion India’s pharmaceutical exports stood at US$
17.27 billion in FY18 and have reached US$ 10.80 billion in FY19 (up to October
2018). India’s generics market has shown an immense potential for future growth.
Hence, the proponent has decided to proposed Bulk drugs & Intermedaite industry in
this location keeping in view of Low cost manpower, Semi–skilled and un-skilled
labor availability.
2.3 LOCATION
The proposed site is located at Plot No.: F-24, MIDC, Chincholi Industrial Area,
Chincholi Village, Mohal Taluk, Solapur District, Maharashtra state. It has good
connectivity and infrastructure availability. National Highway - 9 is at a distance of
3.3 Km (SW); the proposed site is located about 1.9 Km from Chicholikati. The
Pakani Railway Station is at distance of 6.0 Km (SW). Solapur Airport is about 21.7
Km from the project site.
Prepared By Rightsource Industrial Solutions Pvt. Ltd. Chapter - II Page 8
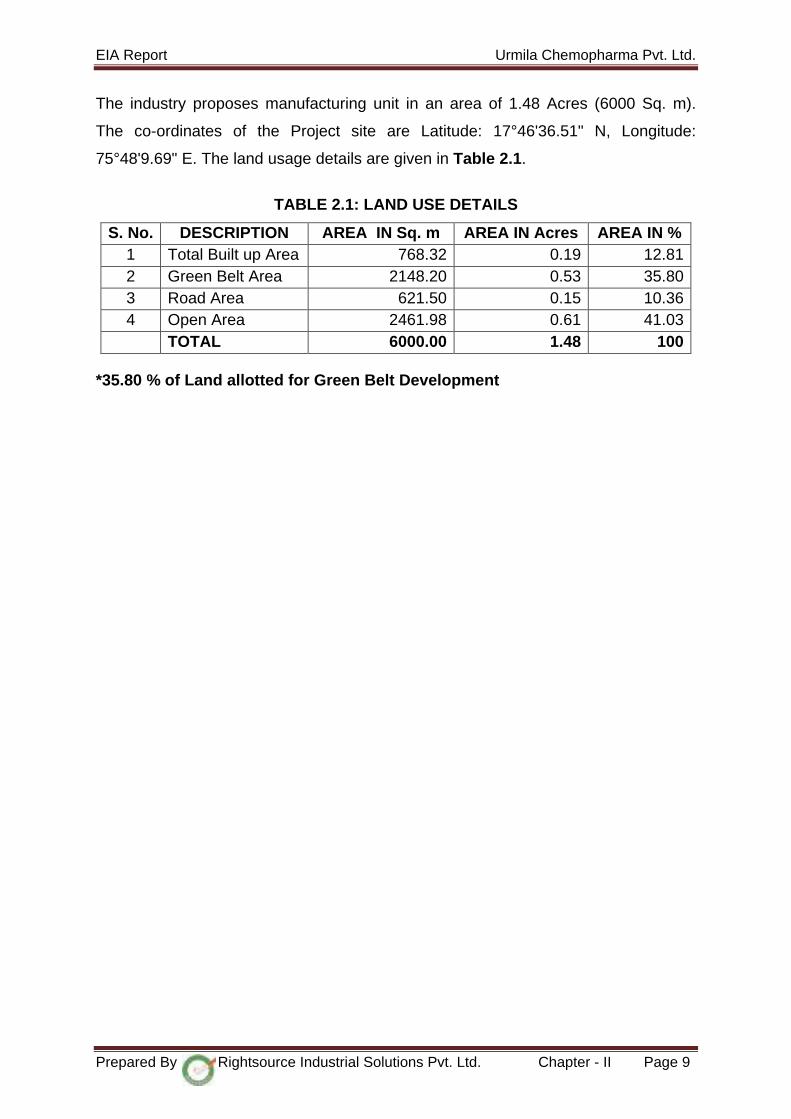
EIA Report Urmila Chemopharma Pvt. Ltd.
The industry proposes manufacturing unit in an area of 1.48 Acres (6000 Sq. m).
The co-ordinates of the Project site are Latitude: 17°46'36.51" N, Longitude:
75°48'9.69" E. The land usage details are given in Table 2.1.
TABLE 2.1: LAND USE DETAILS
S. No. DESCRIPTION AREA IN Sq. m AREA IN Acres AREA IN % 1 Total Built up Area 768.32 0.19 12.81 2 Green Belt Area 2148.20 0.53 35.80 3 Road Area 621.50 0.15 10.36 4 Open Area 2461.98 0.61 41.03
TOTAL 6000.00 1.48 100
*35.80 % of Land allotted for Green Belt Development
Prepared By Rightsource Industrial Solutions Pvt. Ltd. Chapter - II Page 9

EIA Report Urmila Chemopharma Pvt. Ltd.
FIGURE 2.1: LOCATION MAP
Urmila Chemopharma Private Limited
Prepared By Rightsource Industrial Solutions Pvt. Ltd. Chapter - II Page 10

EIA Report Urmila Chemopharma Pvt. Ltd.
FIGURE 2.2: GOOGLE EARTH MAP SHOWING URMILA CHEMOPHARMA PRIVATE LIMITED
Prepared By Rightsource Industrial Solutions Pvt. Ltd. Chapter - II Page 11

EIA Report Urmila Chemopharma Pvt. Ltd.
FIGURE 2.3: LATEST PHOTOGRAPHS OF PROJECT SITE
Prepared By Rightsource Industrial Solutions Pvt. Ltd. Chapter - II Page 12
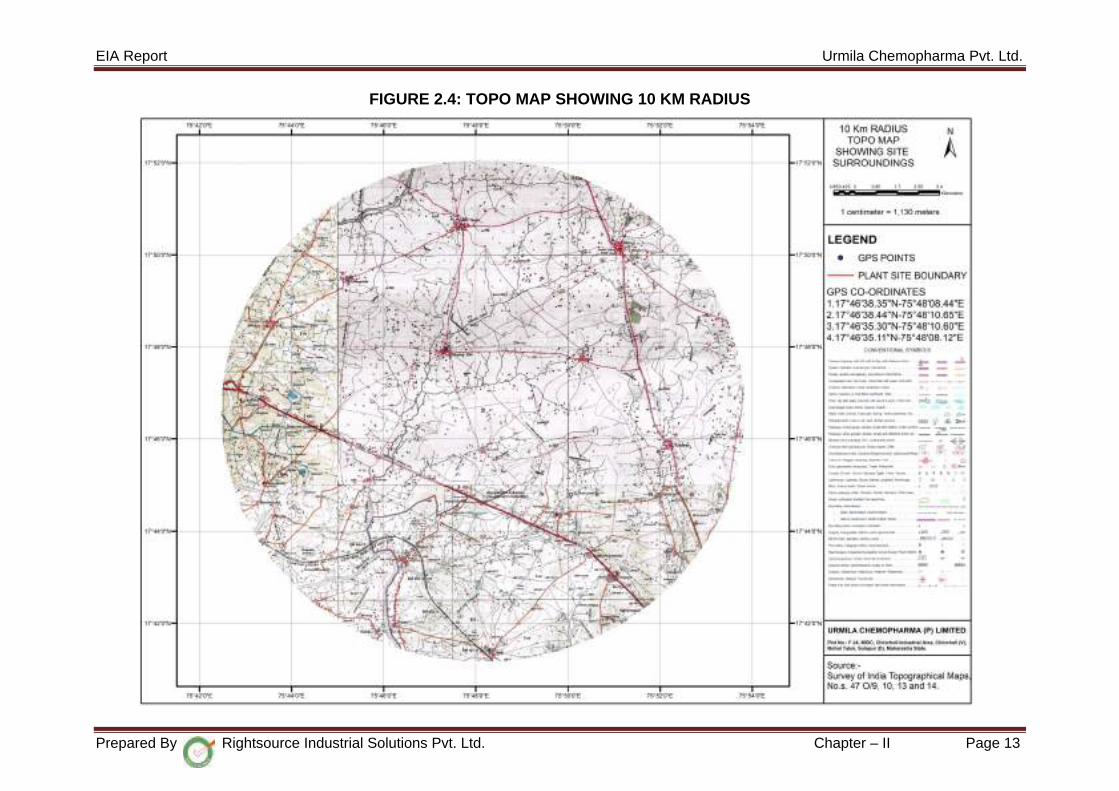
EIA Report Urmila Chemopharma Pvt. Ltd.
FIGURE 2.4: TOPO MAP SHOWING 10 KM RADIUS
Prepared By Rightsource Industrial Solutions Pvt. Ltd. Chapter – II Page 13

EIA Report Urmila Chemopharma Pvt. Ltd.
FIGURE 2.5: SITE LAYOUT
Prepared By Rightsource Industrial Solutions Pvt. Ltd. Chapter – II Page 14
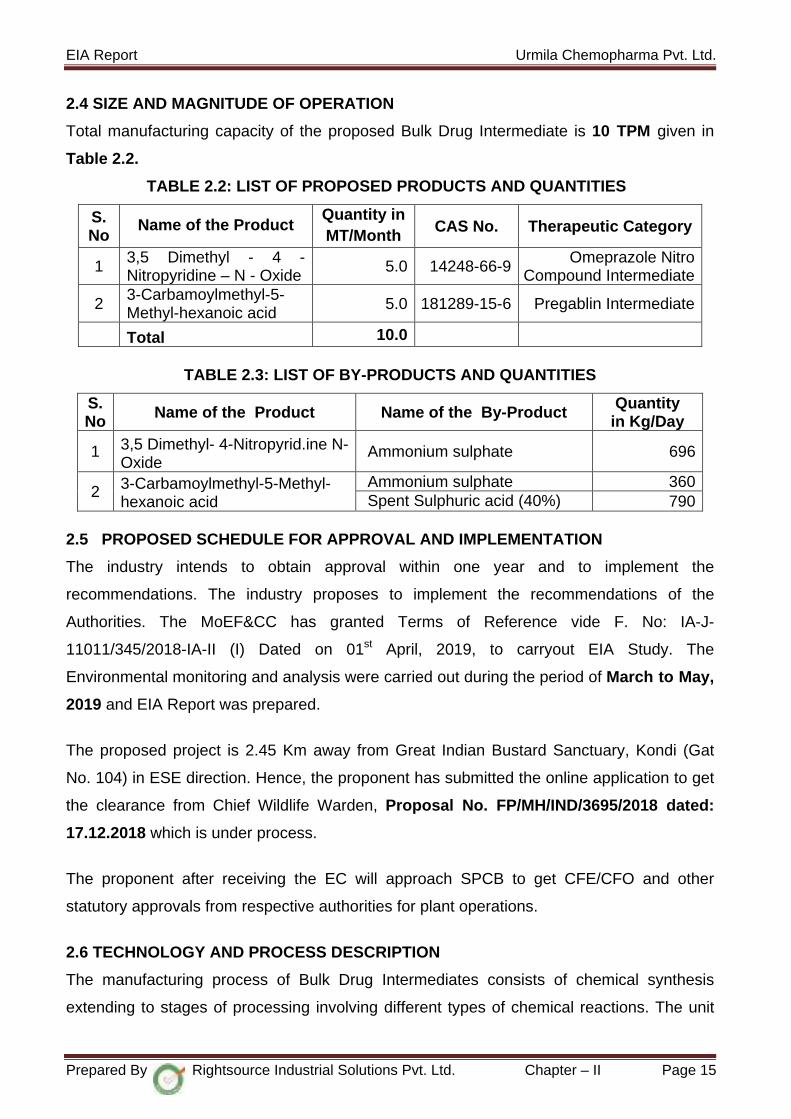
EIA Report Urmila Chemopharma Pvt. Ltd.
2.4 SIZE AND MAGNITUDE OF OPERATION
Total manufacturing capacity of the proposed Bulk Drug Intermediate is 10 TPM given in
Table 2.2.
TABLE 2.2: LIST OF PROPOSED PRODUCTS AND QUANTITIES
S. No
Name of the Product Quantity in MT/Month CAS No. Therapeutic Category
1 3,5 Dimethyl - 4 - Nitropyridine – N - Oxide 5.0 14248-66-9 Omeprazole Nitro
Compound Intermediate
2 3-Carbamoylmethyl-5-Methyl-hexanoic acid 5.0 181289-15-6 Pregablin Intermediate
Total 10.0
TABLE 2.3: LIST OF BY-PRODUCTS AND QUANTITIES
S. No Name of the Product Name of the By-Product Quantity
in Kg/Day
1 3,5 Dimethyl- 4-Nitropyrid.ine N-Oxide
Ammonium sulphate 696
2 3-Carbamoylmethyl-5-Methyl-hexanoic acid
Ammonium sulphate 360 Spent Sulphuric acid (40%) 790
2.5 PROPOSED SCHEDULE FOR APPROVAL AND IMPLEMENTATION
The industry intends to obtain approval within one year and to implement the
recommendations. The industry proposes to implement the recommendations of the
Authorities. The MoEF&CC has granted Terms of Reference vide F. No: IA-J-
11011/345/2018-IA-II (I) Dated on 01st April, 2019, to carryout EIA Study. The
Environmental monitoring and analysis were carried out during the period of March to May,
2019 and EIA Report was prepared.
The proposed project is 2.45 Km away from Great Indian Bustard Sanctuary, Kondi (Gat
No. 104) in ESE direction. Hence, the proponent has submitted the online application to get
the clearance from Chief Wildlife Warden, Proposal No. FP/MH/IND/3695/2018 dated:
17.12.2018 which is under process.
The proponent after receiving the EC will approach SPCB to get CFE/CFO and other
statutory approvals from respective authorities for plant operations.
2.6 TECHNOLOGY AND PROCESS DESCRIPTION
The manufacturing process of Bulk Drug Intermediates consists of chemical synthesis
extending to stages of processing involving different types of chemical reactions. The unit
Prepared By Rightsource Industrial Solutions Pvt. Ltd. Chapter – II Page 15
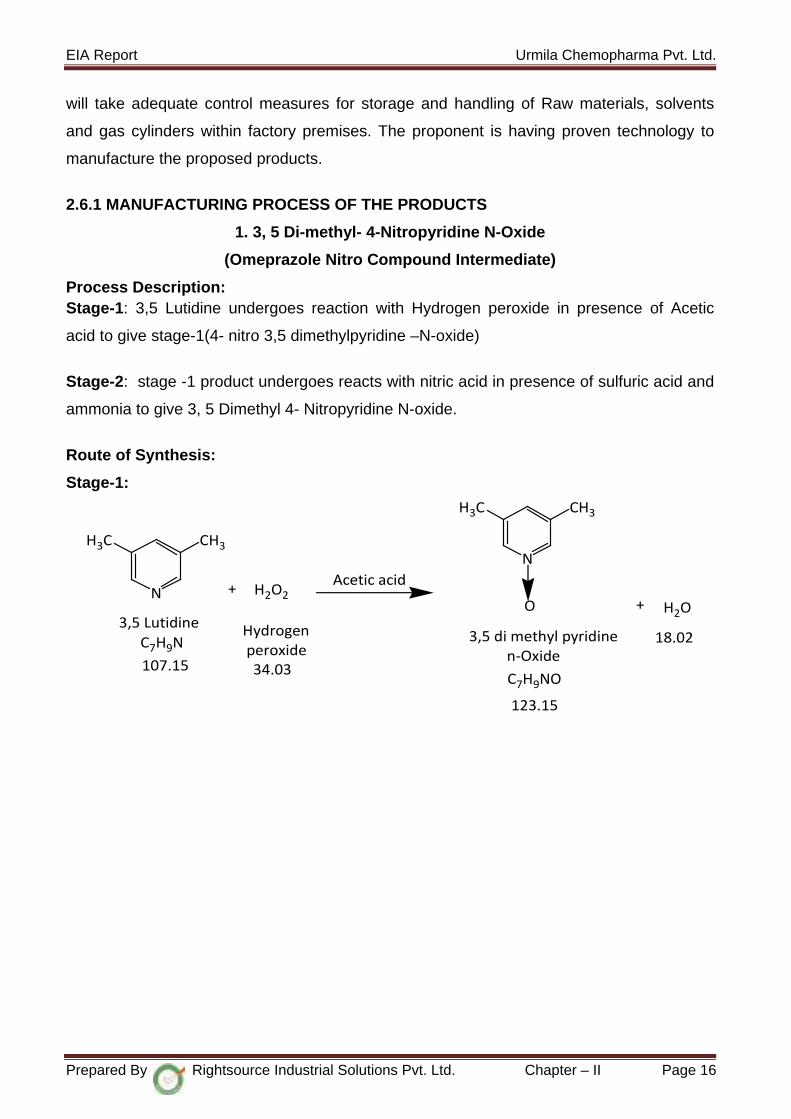
EIA Report Urmila Chemopharma Pvt. Ltd.
will take adequate control measures for storage and handling of Raw materials, solvents
and gas cylinders within factory premises. The proponent is having proven technology to
manufacture the proposed products.
2.6.1 MANUFACTURING PROCESS OF THE PRODUCTS
1. 3, 5 Di-methyl- 4-Nitropyridine N-Oxide
(Omeprazole Nitro Compound Intermediate)
Process Description: Stage-1: 3,5 Lutidine undergoes reaction with Hydrogen peroxide in presence of Acetic
acid to give stage-1(4- nitro 3,5 dimethylpyridine –N-oxide)
Stage-2: stage -1 product undergoes reacts with nitric acid in presence of sulfuric acid and
ammonia to give 3, 5 Dimethyl 4- Nitropyridine N-oxide.
Route of Synthesis:
Stage-1:
N
CH3H3CN
CH3H3C
3,5 LutidineO
3,5 di methyl pyridine n-Oxide
C7H9N107.15
123.15
C7H9NO
+ H2O2
34.03
Hydrogen peroxide
+ H2O
18.02
Acetic acid
Prepared By Rightsource Industrial Solutions Pvt. Ltd. Chapter – II Page 16

EIA Report Urmila Chemopharma Pvt. Ltd.
Stage-2:
N
CH3H3C
O3,5 Dimethyl pyridine n-Oxide
123.15C7H9NO
+
+
HNO3 H2SO4+
Nitric Acid Sulfuric acid
63.01 98.08
N
CH3H3C
O
NO2
(NH4)2SO4 +
3,5 Dimethyl-4-nitro pyridine n-Oxide
168.15
C7H8N2O3
Ammonium Sulphate
132.14
+ 2NH3
34.06
Ammonia
18.02
H2O
Flow Chart:
Stage-1
Stage-2
3,5 Lutidine Hydrogen peroxide (50%)Acetic acid
Acetic acid Recovery
Stage-1Nitric acid (72%)Sulphuric acid Ammonia
Effluent water
3, 5 Dimethyl 4-Nitro pyridine N-Oxide
Material Balance:
Material balance of 3, 5 Dimethyl 4-Nitro pyridine N-Oxide (Omeprazole Nitro Compound Intermediate)
Stage-1 Batch Size: 500.00 Kg
Name of the input Quantity in Kg
Name of the out put Quantity In Kg
3,5 Lutidine 394.00 Stage-1 407.00 Hydrogen peroxide (50%) 300.00 Acetic acid Recovery 285.00 Acetic acid 300.00 Acetic acid loss 6.00
Prepared By Rightsource Industrial Solutions Pvt. Ltd. Chapter – II Page 17
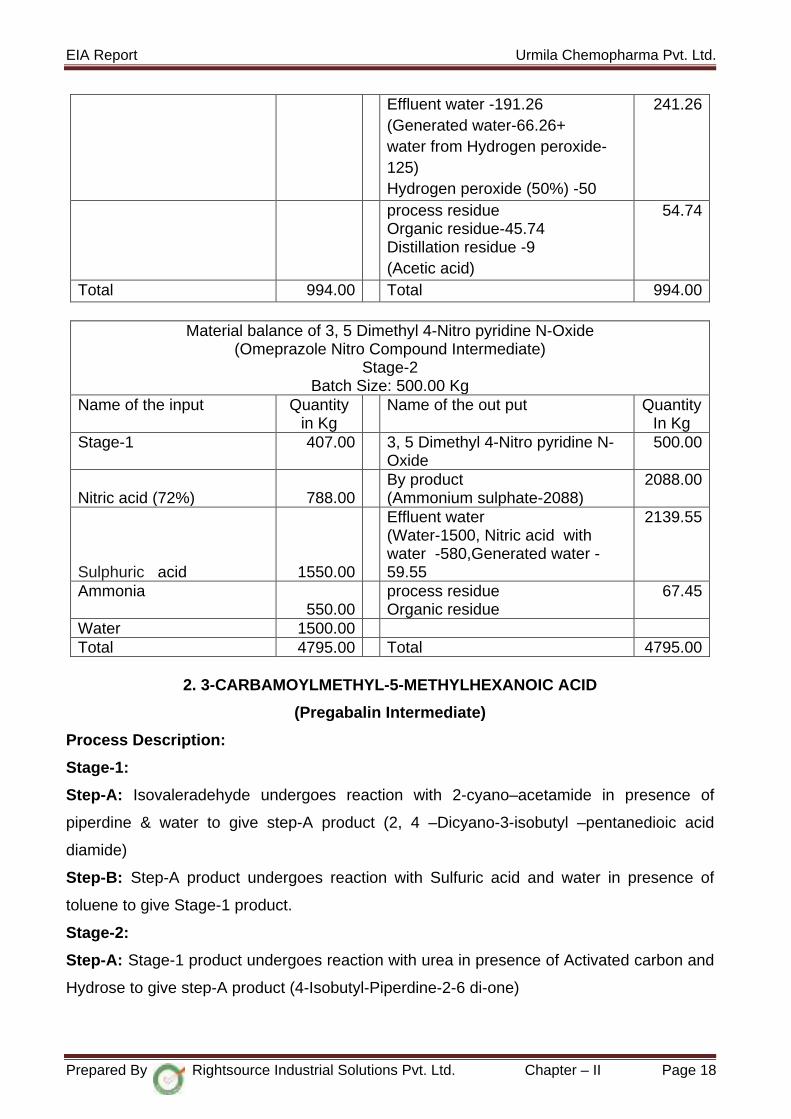
EIA Report Urmila Chemopharma Pvt. Ltd.
Effluent water -191.26 (Generated water-66.26+ water from Hydrogen peroxide-125) Hydrogen peroxide (50%) -50
241.26
process residue Organic residue-45.74 Distillation residue -9 (Acetic acid)
54.74
Total 994.00 Total 994.00
Material balance of 3, 5 Dimethyl 4-Nitro pyridine N-Oxide (Omeprazole Nitro Compound Intermediate)
Stage-2 Batch Size: 500.00 Kg
Name of the input Quantity in Kg
Name of the out put Quantity In Kg
Stage-1 407.00 3, 5 Dimethyl 4-Nitro pyridine N-Oxide
500.00
Nitric acid (72%) 788.00 By product
(Ammonium sulphate-2088) 2088.00
Sulphuric acid 1550.00
Effluent water (Water-1500, Nitric acid with water -580,Generated water -59.55
2139.55
Ammonia 550.00
process residue Organic residue
67.45
Water 1500.00 Total 4795.00 Total 4795.00
2. 3-CARBAMOYLMETHYL-5-METHYLHEXANOIC ACID
(Pregabalin Intermediate)
Process Description:
Stage-1:
Step-A: Isovaleradehyde undergoes reaction with 2-cyano–acetamide in presence of
piperdine & water to give step-A product (2, 4 –Dicyano-3-isobutyl –pentanedioic acid
diamide)
Step-B: Step-A product undergoes reaction with Sulfuric acid and water in presence of
toluene to give Stage-1 product.
Stage-2:
Step-A: Stage-1 product undergoes reaction with urea in presence of Activated carbon and
Hydrose to give step-A product (4-Isobutyl-Piperdine-2-6 di-one)
Prepared By Rightsource Industrial Solutions Pvt. Ltd. Chapter – II Page 18

EIA Report Urmila Chemopharma Pvt. Ltd.
Step-B: Step-A product undergoes reaction with Sodium hydroxide and Hydrochloric acid
in presence of EDTA to give 3-Carbamoylmethyl-5-methylhexanoic acid.
Route of Synthesis: Stage-1: Step-A:
Isovaleradehyde
+
NC
H2N OCN
NH2
O
C11H16N4O2
236.27
2,4-Dicyano-3-isobutyl-pentanedioic acid
diamideC5H10O
86.13C3H4N2O
2 X 84.08=168.16
Piperdine & water + H2O
18.02
H3C
CH3
H
O O
NH2
N
2-Cyano-acetamide
Step-B:
NC
H2N OCN
NH2
O
C11H16N4O2
236.27
2,4-Dicyano-3-isobutyl-pentanedioic acid
diamide
HO O
OH
O
+
3-Isobutyl-pentanedioic acid
C9H16O4
188.22
+ 2 (NH4)2SO42 H2SO4
196.16
6H2O
+ 2CO2
88.02
108.09
+ Toluene
2 X132.14=264.28
Stage-2 Step-A
HO O
OH
O
3-Isobutyl-pentanedioic acid
C9H16O4
188.22
NH
OO
4-Isobutyl-piperidine-2,6-dione
+
C9H15NO2
169.22
+
H2O
18.02
Urea
NH2
O
H2N
CH4N2O
60.06
NH3
17.03+ CO2
44.01
+
Activated carbon
Hydrose
Prepared By Rightsource Industrial Solutions Pvt. Ltd. Chapter – II Page 19

EIA Report Urmila Chemopharma Pvt. Ltd.
Step-B
Flow Chart:
Stage-1
Stage-2
Isovaleraldehyde CyanocetamidePiperdineSulphuric acid Toluene
Toluene Recovery
Stage-1Urea Activated carbon EDTA Hydrose Sodium hydroxide Hydrochloric acid (32%)Water 3-carbamoylmethyl-5-
methylhexanoic acid
Effluent water
Material Balance
Material balance of 3-carbamoylmethyl-5-methylhexanoic acid (Pregabalin Intermediate) Stage-1
Batch Size: 500.00 Kg Name of the input Quantity
in Kg Name of the out put Quantity
In Kg Isovaleraldehyde 354.00 Stage-1 696.00 2-Cyano acetamide 691.14 Toluene recovery 960.00 Piperdine 15.00 Toluene loss 20.00
Sulphuric acid 1750.00
By product (Ammonium sulphate-1080 Spent Sulphuric acid(40%)-2370
3457.00
Toluene 1000.00 Process Emission 361.76
NH
OO
4-Isobutyl-piperidine-2,6-dione
OHO
O
NH2
C9H15NO2
169.22
3-Carbamoylmethyl-5-methyl-hexanoic acid
C9H17NO3
187.24
NaOH+ + HCl
40.00 36.46
NaCl+
58.44
Water
EDTA
Prepared By Rightsource Industrial Solutions Pvt. Ltd. Chapter – II Page 20

EIA Report Urmila Chemopharma Pvt. Ltd.
Carbon dioxide -361.76 water
1800.00 Process residue Organic impurities -80.38, ,piperdine-15 Distillation residue -20
115.38
Total 5610.14 Total 5610.14
Material balance of 3-carbamoylmethyl-5-methylhexanoic acid (Pregabalin Intermediate) Stage-2
Batch Size: 500.00 Kg Name of the input Quantity
in Kg Name of the out put Quantity
In Kg Stage-1 696.00 3-Carbamoylmethyl-5
methylhexanoic acid 500.00
Urea 222.00
Effluent water (Water-1000, EDTA-1, Hydrose-1, Sodium chloride-216.10, Water from hydrochloric acid -295.18, Generated water-66.60)
1579.88
Activated carbon 10.00 Process emission (Ammonia-62.91, Carbon dioxide-162.72)
225.63
EDTA 1.00 Spent carbon 10.00 Hydrose 1.00 Process residue
(organic residue) 194.49
Sodium hydroxide 150.00 Hydrochloric acid (32%) 430.00 Water 1000.00 Total 2510 Total 2510
2.7 POLLUTION LOAD
Pollution load and generation of waste per day from all the proposed products is given in
below Table 2.4
Prepared By Rightsource Industrial Solutions Pvt. Ltd. Chapter – II Page 21
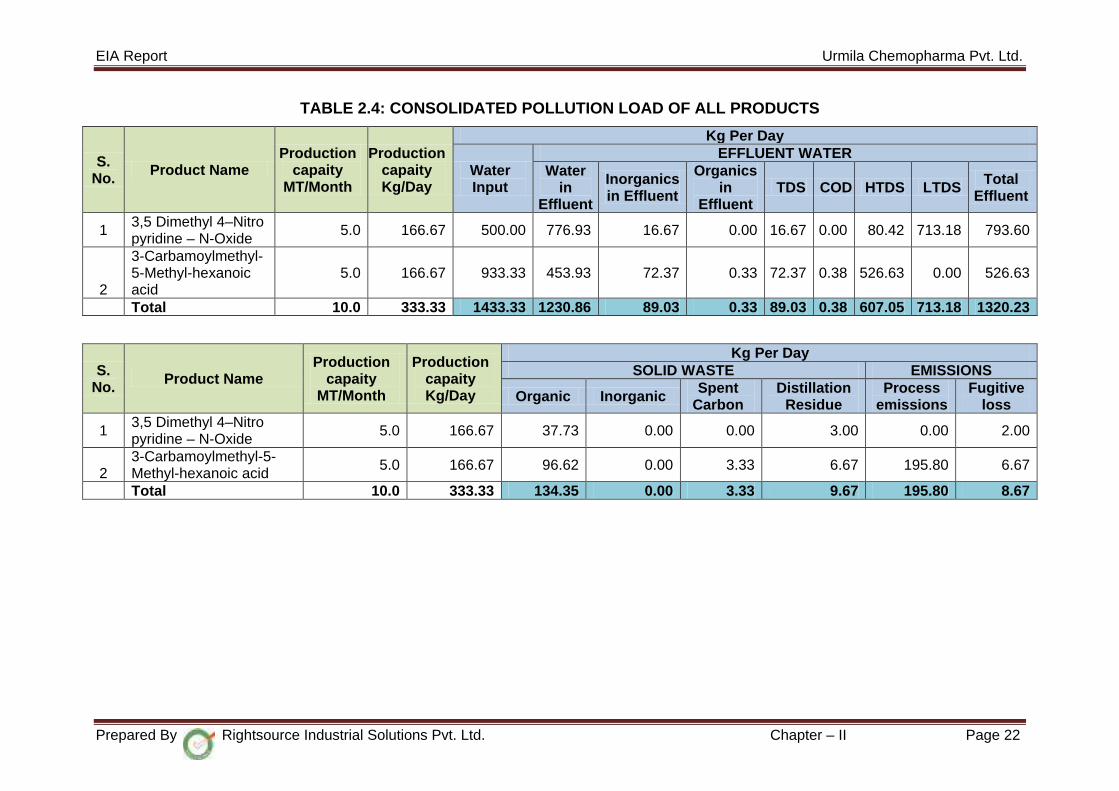
EIA Report Urmila Chemopharma Pvt. Ltd.
TABLE 2.4: CONSOLIDATED POLLUTION LOAD OF ALL PRODUCTS
S. No. Product Name
Production capaity
MT/Month
Production capaity Kg/Day
Kg Per Day
Water Input
EFFLUENT WATER Water
in Effluent
Inorganics in Effluent
Organics in
Effluent TDS COD HTDS LTDS Total
Effluent
1 3,5 Dimethyl 4–Nitro pyridine – N-Oxide
5.0 166.67 500.00 776.93 16.67 0.00 16.67 0.00 80.42 713.18 793.60
2
3-Carbamoylmethyl-5-Methyl-hexanoic acid
5.0 166.67 933.33 453.93 72.37 0.33 72.37 0.38 526.63 0.00 526.63
Total 10.0 333.33 1433.33 1230.86 89.03 0.33 89.03 0.38 607.05 713.18 1320.23
S. No. Product Name
Production capaity
MT/Month
Production capaity Kg/Day
Kg Per Day SOLID WASTE EMISSIONS
Organic Inorganic Spent Carbon
Distillation Residue
Process emissions
Fugitive loss
1 3,5 Dimethyl 4–Nitro pyridine – N-Oxide 5.0 166.67 37.73 0.00 0.00 3.00 0.00 2.00
2 3-Carbamoylmethyl-5-Methyl-hexanoic acid 5.0 166.67 96.62 0.00 3.33 6.67 195.80 6.67
Total 10.0 333.33 134.35 0.00 3.33 9.67 195.80 8.67
Prepared By Rightsource Industrial Solutions Pvt. Ltd. Chapter – II Page 22
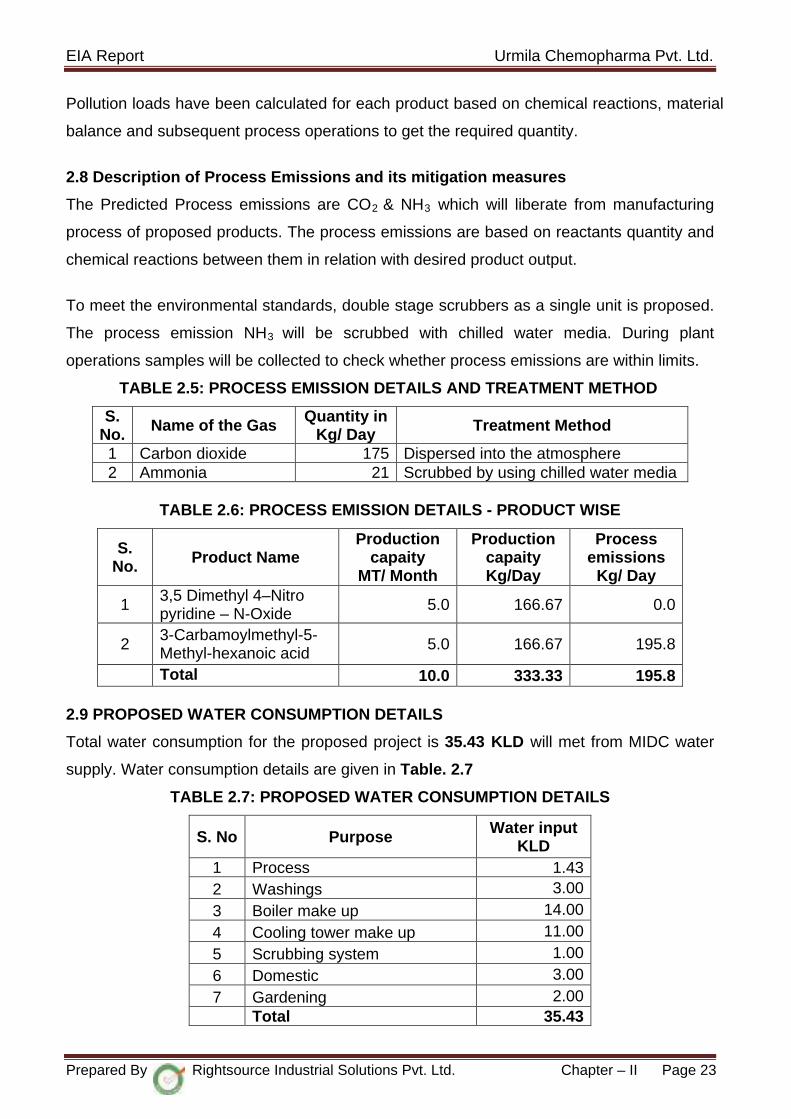
EIA Report Urmila Chemopharma Pvt. Ltd.
Pollution loads have been calculated for each product based on chemical reactions, material
balance and subsequent process operations to get the required quantity.
2.8 Description of Process Emissions and its mitigation measures
The Predicted Process emissions are CO2 & NH3 which will liberate from manufacturing
process of proposed products. The process emissions are based on reactants quantity and
chemical reactions between them in relation with desired product output.
To meet the environmental standards, double stage scrubbers as a single unit is proposed.
The process emission NH3 will be scrubbed with chilled water media. During plant
operations samples will be collected to check whether process emissions are within limits.
TABLE 2.5: PROCESS EMISSION DETAILS AND TREATMENT METHOD
S. No. Name of the Gas Quantity in
Kg/ Day Treatment Method
1 Carbon dioxide 175 Dispersed into the atmosphere 2 Ammonia 21 Scrubbed by using chilled water media
TABLE 2.6: PROCESS EMISSION DETAILS - PRODUCT WISE
S. No. Product Name
Production capaity
MT/ Month
Production capaity Kg/Day
Process emissions
Kg/ Day
1 3,5 Dimethyl 4–Nitro pyridine – N-Oxide 5.0 166.67 0.0
2 3-Carbamoylmethyl-5-Methyl-hexanoic acid 5.0 166.67 195.8
Total 10.0 333.33 195.8 2.9 PROPOSED WATER CONSUMPTION DETAILS
Total water consumption for the proposed project is 35.43 KLD will met from MIDC water
supply. Water consumption details are given in Table. 2.7
TABLE 2.7: PROPOSED WATER CONSUMPTION DETAILS
S. No Purpose Water input KLD
1 Process 1.43 2 Washings 3.00 3 Boiler make up 14.00 4 Cooling tower make up 11.00 5 Scrubbing system 1.00 6 Domestic 3.00 7 Gardening 2.00
Total 35.43
Prepared By Rightsource Industrial Solutions Pvt. Ltd. Chapter – II Page 23

EIA Report Urmila Chemopharma Pvt. Ltd.
Recovered water 9.35 KLD from ZLD system is reused.
Total Fresh water reuirement = 35.43 – 9.35
= 26.08 KLD
The fresh water requirement of 26.08 KLD will be met from MIDC water supply.
TABLE 2.8: PROPOSED WATER CONSUMPTION IN PROCESS – PRODUCT WISE
S. No. Product Name
Production capaity
MT/Month
Production capaity Kg/Day
Water Input
Kg/Day
1 3,5Dimethyl 4–Nitro pyridine – N-Oxide 5.0 166.67 500.00
2 3-Carbamoylmethyl-5-Methyl-hexanoic acid 5.0 166.67 933.33
Total 10.0 333.33 1433.33 2.10 DETAILS OF EXPECTED WASTE WATER GENERATION
TABLE 2.9: EXPECTED EFFLUENT GENERATION DETAILS
S.No Purpose Effluent Details KLD
1 Process 1.32 2 Washings 3.00 3 Boiler Blow down 2.00 4 Cooling tower Bleed off 1.00 5 Scrubbing system 1.00 6 Domestic 2.50
Total 10.82
TABLE 2.10: EXPECTED HTDS & LTDS EFFLUENT GENERATION DETAILS & TREATMENT METHOD
Unit HTDS KLD
LTDS KLD
Effluent KLD Treatment Method
Process 0.61 0.71 1.32 ZLD System: HTDS effluents sent to MEE system followed by BTP. LTDS effluents treated in BTP – RO Plant. RO Rejects to MEE System and RO permeate to reuse, Condensate from MEE to reuse and MEE concentrate to ATFD.
Washings 0.00 3.00 3.00
Boiler Blow down 0.00 2.00 2.00
Cooling tower Bleed off 0.00 1.00 1.00
Scrubbing system 1.00 0.00 1.00
Domestic 0.00 2.50 2.50
Total 1.61 9.21 10.82 .
Prepared By Rightsource Industrial Solutions Pvt. Ltd. Chapter – II Page 24

EIA Report Urmila Chemopharma Pvt. Ltd.
The generations of process effluent water HTDS & LTDS and its characteristics are based
on reactants quantity and chemical reactions between them in relation with desired product
output.
The Boiler & Cooling towers blow down water will have TDS & COD less than 5000 mg/l
and scrubbing solution will have TDS more than 5000 mg/L. Floor washings and equipment
washings will have TDS less than 5000 mg/L.
TABLE 2.11 EXPECTED WASTEWATER GENERATION - PRODUCT WISE
S. No. Product Name
Production capaity
MT/ Month
Production capaity Kg/ Day
Total Effluent Kg/ Day
1 3,5Dimethyl 4–Nitro pyridine – N-Oxide 5.0 166.67 793.60
2 3-Carbamoylmethyl-5-Methyl-hexanoic acid 5.0 166.67 526.63
Total 10.0 333.33 1320.23
2.11 WASTE WATER CHARACTERISTICS
TABLE 2.12: ESTIMATED WASTEWATER CHARACTERISTICS
*We are going to achieve zero discharge system.
The effluent water characteristics before treatment are based on calculations. The effluent
water after passing through Stripper, MEE, Biological treatment plant & RO plant the
expected results after treatment are given in the above Table 2.12.
2.12 HAZARDOUS & SOLID WASTE GENERATION DETAILS
The Hazardous & Solid waste generated and disposal methods from proposed project are
given below.
TABLE 2.13: EXPECTED HAZARDOUS & SOLID WASTE GENERATION DETAILS AND DISPOSAL METHOD
S. No Parameters Unit Results
Before treatment
After treatment*
1. pH -- 8.0-9.0 6.5-8.5 2. HTDS mg/L 1,46,660 <500 3. LTDS mg/L <5000 <500 4. COD mg/L 290 <250 5. Oil & Grease mg/L 15-25 <10.0
Prepared By Rightsource Industrial Solutions Pvt. Ltd. Chapter – II Page 25

EIA Report Urmila Chemopharma Pvt. Ltd.
S. No Name of the Waste Quantity in Kg/Day Disposal Method
Hazardous Waste Details 1 Organic solid waste 134
Will be sent to Cement Industries
2 Spent Carbon 3.0 3 Solvent Distillation Residue 10 4 Organic distillate from Stripper 30 5 ETP Sludge 50
Will be sent to TSDF 6 MEE Salts 197
7 Used Oils 500 Ltrs/Annum Will be sent to SPCB Authorized Agencies for Reprocessing/Recycling
8 Detoxified Containers 300 No’s / Month After Detoxification will be sent to SPCB Authorized Agencies
9 Used Lead Acid Batteries 2 No’s/ Annum Send back to suppliers for buyback of New Batteries
Solid Waste details
10 Ash from boiler 2800 Will be sent to Brick Manufacturers
The expected quantities which are given in the above table based on calculations of each
product material balance. The ash from boiler is based on ash percentage in the coal. The
used oils and used lead acid batteries quantities are based on usage of respective
equipment. The container liners & containers are based on various packing of raw
materials.
TABLE 2.14: SOLID WASTE GENERATION – PRODUCT WISE
S. No. Product Name
Production capaity Kg/ Day
Organic Kg/ Day
Inorganic Kg/ Day
Total Soild waste
Kg/ Day 1 3,5Dimethyl 4–Nitro
pyridine – N-Oxide 166.67 37.73 0.00 37.73
2 3-Carbamoylmethyl-5-Methyl-hexanoic acid 166.67 96.62 0.00 96.62
Total 333.33 134.35 0.00 134.35 2.13 POWER (ENERGY) REQUIREMENT
Power requirement of proposed project will be made available through Maharashtra State
Electricity Distribution Company Limited [MSEDCL]. The power requirement of project will
be 200 KVA.
D.G. set of 125 KVA is proposed to install, to meet the emergency power requirement of the
plant.
Prepared By Rightsource Industrial Solutions Pvt. Ltd. Chapter – II Page 26
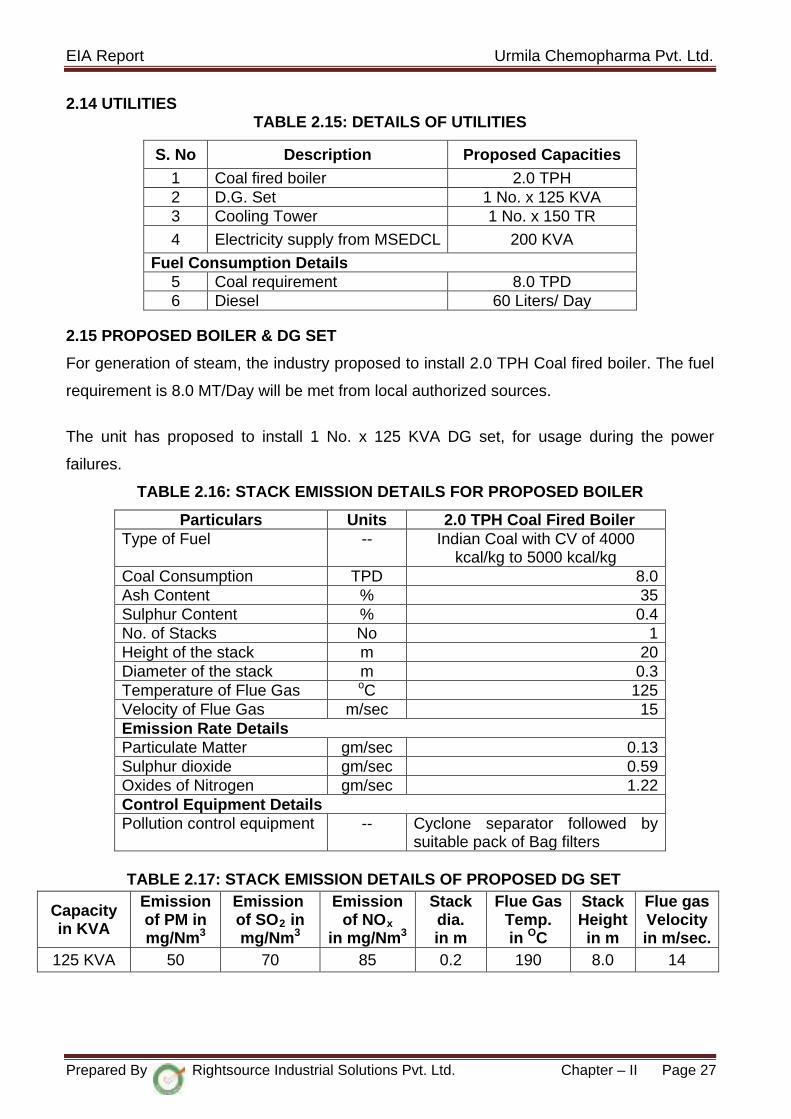
EIA Report Urmila Chemopharma Pvt. Ltd.
2.14 UTILITIES
TABLE 2.15: DETAILS OF UTILITIES
2.15 PROPOSED BOILER & DG SET
For generation of steam, the industry proposed to install 2.0 TPH Coal fired boiler. The fuel
requirement is 8.0 MT/Day will be met from local authorized sources.
The unit has proposed to install 1 No. x 125 KVA DG set, for usage during the power
failures.
TABLE 2.16: STACK EMISSION DETAILS FOR PROPOSED BOILER
Particulars Units 2.0 TPH Coal Fired Boiler Type of Fuel -- Indian Coal with CV of 4000
kcal/kg to 5000 kcal/kg Coal Consumption TPD 8.0 Ash Content % 35 Sulphur Content % 0.4 No. of Stacks No 1 Height of the stack m 20 Diameter of the stack m 0.3 Temperature of Flue Gas oC 125 Velocity of Flue Gas m/sec 15 Emission Rate Details Particulate Matter gm/sec 0.13 Sulphur dioxide gm/sec 0.59 Oxides of Nitrogen gm/sec 1.22 Control Equipment Details Pollution control equipment -- Cyclone separator followed by
suitable pack of Bag filters
TABLE 2.17: STACK EMISSION DETAILS OF PROPOSED DG SET
Capacity in KVA
Emission of PM in mg/Nm3
Emission of SO2 in mg/Nm3
Emission of NOx
in mg/Nm3
Stack dia. in m
Flue Gas Temp. in OC
Stack Height in m
Flue gas Velocity in m/sec.
125 KVA 50 70 85 0.2 190 8.0 14
S. No Description Proposed Capacities 1 Coal fired boiler 2.0 TPH 2 D.G. Set 1 No. x 125 KVA 3 Cooling Tower 1 No. x 150 TR
4 Electricity supply from MSEDCL 200 KVA
Fuel Consumption Details 5 Coal requirement 8.0 TPD 6 Diesel 60 Liters/ Day
Prepared By Rightsource Industrial Solutions Pvt. Ltd. Chapter – II Page 27
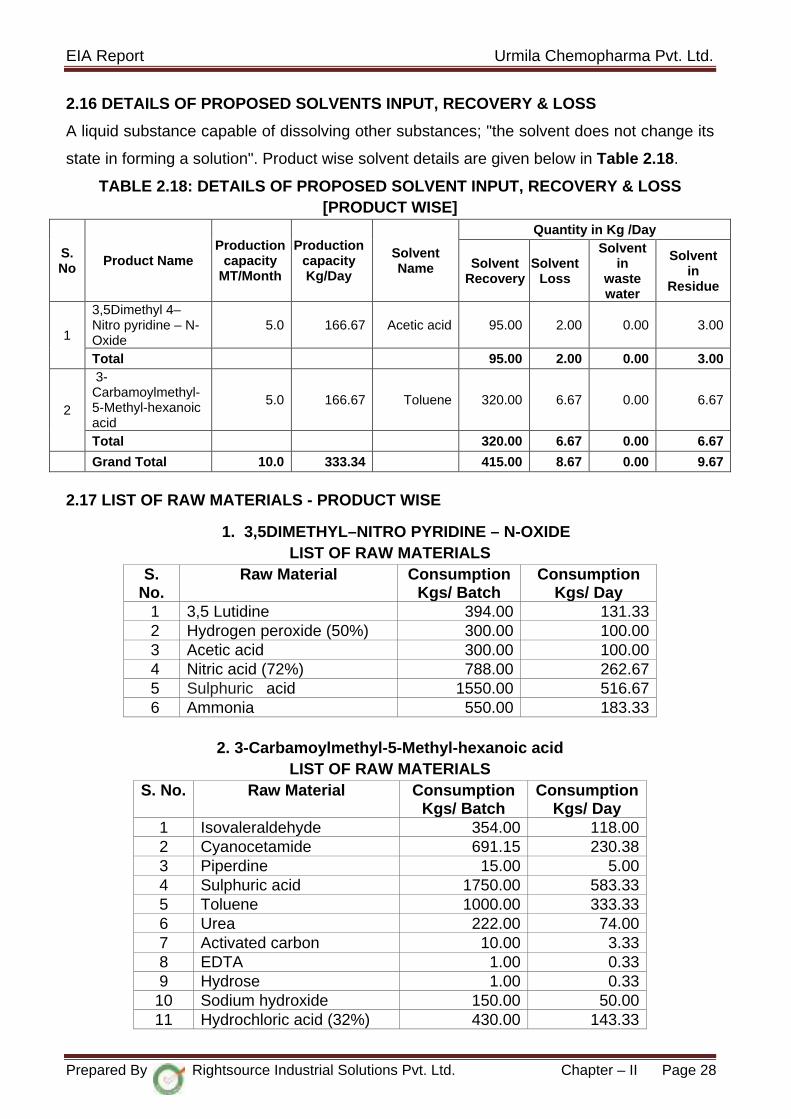
EIA Report Urmila Chemopharma Pvt. Ltd.
2.16 DETAILS OF PROPOSED SOLVENTS INPUT, RECOVERY & LOSS
A liquid substance capable of dissolving other substances; "the solvent does not change its
state in forming a solution". Product wise solvent details are given below in Table 2.18.
TABLE 2.18: DETAILS OF PROPOSED SOLVENT INPUT, RECOVERY & LOSS [PRODUCT WISE]
S. No Product Name
Production capacity
MT/Month
Production capacity Kg/Day
Solvent Name
Quantity in Kg /Day
Solvent Recovery
Solvent Loss
Solvent in
waste water
Solvent in
Residue
1
3,5Dimethyl 4–Nitro pyridine – N-Oxide
5.0 166.67 Acetic acid 95.00 2.00 0.00 3.00
Total 95.00 2.00 0.00 3.00
2
3-Carbamoylmethyl-5-Methyl-hexanoic acid
5.0 166.67 Toluene 320.00 6.67 0.00 6.67
Total 320.00 6.67 0.00 6.67
Grand Total 10.0 333.34 415.00 8.67 0.00 9.67
2.17 LIST OF RAW MATERIALS - PRODUCT WISE
1. 3,5DIMETHYL–NITRO PYRIDINE – N-OXIDE LIST OF RAW MATERIALS
S. No.
Raw Material Consumption Kgs/ Batch
Consumption Kgs/ Day
1 3,5 Lutidine 394.00 131.33 2 Hydrogen peroxide (50%) 300.00 100.00 3 Acetic acid 300.00 100.00 4 Nitric acid (72%) 788.00 262.67 5 Sulphuric acid 1550.00 516.67 6 Ammonia 550.00 183.33
2. 3-Carbamoylmethyl-5-Methyl-hexanoic acid
LIST OF RAW MATERIALS S. No. Raw Material Consumption
Kgs/ Batch Consumption
Kgs/ Day 1 Isovaleraldehyde 354.00 118.00 2 Cyanocetamide 691.15 230.38 3 Piperdine 15.00 5.00 4 Sulphuric acid 1750.00 583.33 5 Toluene 1000.00 333.33 6 Urea 222.00 74.00 7 Activated carbon 10.00 3.33 8 EDTA 1.00 0.33 9 Hydrose 1.00 0.33
10 Sodium hydroxide 150.00 50.00 11 Hydrochloric acid (32%) 430.00 143.33
Prepared By Rightsource Industrial Solutions Pvt. Ltd. Chapter – II Page 28
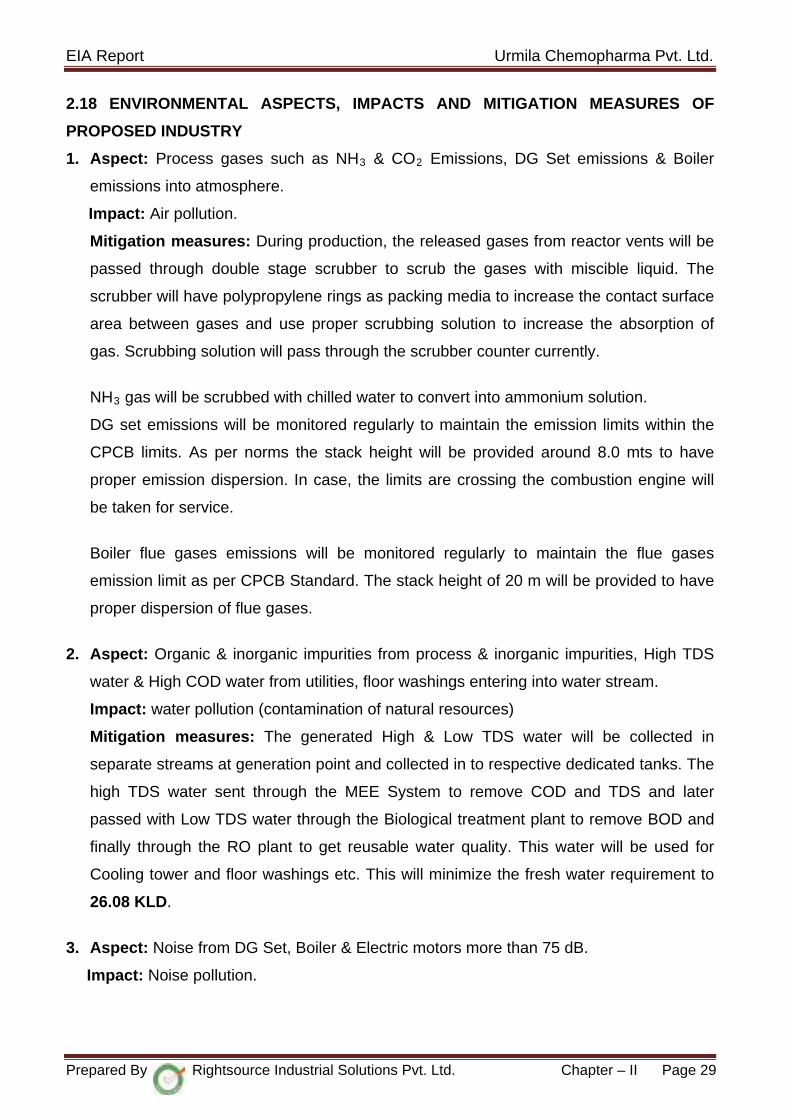
EIA Report Urmila Chemopharma Pvt. Ltd.
2.18 ENVIRONMENTAL ASPECTS, IMPACTS AND MITIGATION MEASURES OF
PROPOSED INDUSTRY
1. Aspect: Process gases such as NH3 & CO2 Emissions, DG Set emissions & Boiler
emissions into atmosphere.
Impact: Air pollution.
Mitigation measures: During production, the released gases from reactor vents will be
passed through double stage scrubber to scrub the gases with miscible liquid. The
scrubber will have polypropylene rings as packing media to increase the contact surface
area between gases and use proper scrubbing solution to increase the absorption of
gas. Scrubbing solution will pass through the scrubber counter currently.
NH3 gas will be scrubbed with chilled water to convert into ammonium solution.
DG set emissions will be monitored regularly to maintain the emission limits within the
CPCB limits. As per norms the stack height will be provided around 8.0 mts to have
proper emission dispersion. In case, the limits are crossing the combustion engine will
be taken for service.
Boiler flue gases emissions will be monitored regularly to maintain the flue gases
emission limit as per CPCB Standard. The stack height of 20 m will be provided to have
proper dispersion of flue gases.
2. Aspect: Organic & inorganic impurities from process & inorganic impurities, High TDS
water & High COD water from utilities, floor washings entering into water stream.
Impact: water pollution (contamination of natural resources)
Mitigation measures: The generated High & Low TDS water will be collected in
separate streams at generation point and collected in to respective dedicated tanks. The
high TDS water sent through the MEE System to remove COD and TDS and later
passed with Low TDS water through the Biological treatment plant to remove BOD and
finally through the RO plant to get reusable water quality. This water will be used for
Cooling tower and floor washings etc. This will minimize the fresh water requirement to
26.08 KLD.
3. Aspect: Noise from DG Set, Boiler & Electric motors more than 75 dB.
Impact: Noise pollution.
Prepared By Rightsource Industrial Solutions Pvt. Ltd. Chapter – II Page 29

EIA Report Urmila Chemopharma Pvt. Ltd.
Mitigation measure: DG set will have acoustic enclosure and drives will have proper
maintenance to minimize vibrations and internal parts will be servicing to minimize the
sound pollution.
4. Aspect: Spillages of chemicals during loading /unloading, Solvents spillages at storage
tanks, spillage of Oils from DG Set & Air compressor/ Refrigeration compressor on to
the ground.
Impact: Soil pollution.
Mitigation measure: To avoid any spillage of chemicals the working area of loading &
unloading area is barricaded and the floor will be made with acid proof tiling with a slope
towards a small pit so as to collect the spilled chemicals in the dedicated pit. This results
in avoiding the spillage of chemicals on to the ground.
Effluent water will be transferred through the dedicated pipe lines from plant to BTP
plant. This will eliminate soil contamination with effluent water.
Each solvent storage tank area will have dyke wall and the floor will have cement
concrete with slope towards a pit. Hence, spillage of solvent will be avoided on the
ground.
The DG set /Air compressor/ refrigeration compressor area will be placed in Utilities
building with cement concrete floor. The filling and draining of Oils from respective
equipment will be done by trained technical person to avoid any spillage of oil on to the
floor/ ground.
5. Aspect: Improper Storage of hazardous waste (organic waste, inorganic waste, spent
carbon) results in leakage/ Spillage on to the ground.
Impact: Soil pollution
Mitigation measure: The hazardous waste in containers will be stored in dedicated
area as per its category with proper flooring having slope towards a pit to collect any
spilled material. The entire area will be barricaded with a dyke wall and only authorized
personnel will be allowed to do operations in storage area. This avoids soil pollution.
6. Aspect: Establishment of industry may release gases emissions, effluent water leakage
to surrounding areas.
Impact: 1. Flora & Fauna, Water Bodies, Agriculture & Human habitation.
Prepared By Rightsource Industrial Solutions Pvt. Ltd. Chapter – II Page 30

EIA Report Urmila Chemopharma Pvt. Ltd.
2. The positive impact is generation of employment to skilled & unskilled people
of nearby villages and economic development.
Mitigation measure: The gaseous emissions will be released into the atmosphere after
pollution control measures taken. The industry will have dedicated effluent treatment
(MEE, Biological treatment plant, RO system) to achieve Zero Liquid Discharge system.
This will eliminate effluent leakage to surrounding area of the plant.
7. Aspect: Improper Storage of Flammable chemicals Toluene causing leakage of
flammable chemical.
Impact: Presence of ignition source catches fire, risk to plant personnel due to thermal
radiation, release of CO, CO2 and toxic gases in to the atmosphere and global warming.
Mitigation measure: Each solvent storage tank will have dyke to contain entire
contents. This will avoid leakage of solvent to the outside of dyke wall. The tanks will be
monitored regularly for any corrosion at valve joints, valve gland leakages. The storage
tanks will have fire alarm system. In case if it catches fire, it will be extinguished with
DCP, fire extinguishers and fire hydrant water. This will minimize the thermal radiation
and release of CO, CO2 and toxic gases to the atmosphere. The solvent/ chemical
storage tanks provided with vent condensers by circulated chilled water will minimize the
loss of chemical/ solvent in the storage tank.
The industry will conserve rain water by adopting rain water harvesting system in the plant
to the tune of 457 m3/ annum.
2.19 ASSESSMENT OF NEW & UNTESTED TECHNOLOGY FOR RISK OF
TECHNOLOGICAL FAILURE
No new or untested technology will be used in the proposed project but the manufacturing
process may be altered for better yields after successful lab tests and R&D.
Prepared By Rightsource Industrial Solutions Pvt. Ltd. Chapter – II Page 31
DESCRIPTION OF THE ENVIRONMENT
CHAPTER -III
EIA Report Urmila Chemopharma Pvt. Ltd.
CHAPTER-III
DESCRIPTION OF THE ENVIRONMENT
3.0 INTRODUCTION
Baseline data generation is a part of the Environmental Impact Assessment study, which
helps to evaluate the predicted impacts on the various environmental attributes in the study
area by using scientifically developed and widely accepted environmental impact
assessment methodologies. This further helps in preparing an Environment Management
Plan (EMP) outlining the measures for improving the environmental quality and scope for
future improvements for environmentally sustainable development. The baseline
environmental study also helps to identify the critical environmental attributes, which are
required to be monitored after implementation of the project.
This chapter illustrates the description of the existing environmental status of the study
area with reference to the prominent environmental attributes. The existing environmental
setting is considered to adjudge the baseline conditions which are described with respect
to climate, hydro-geological aspects, atmospheric conditions, water quality, soil quality,
vegetation pattern, ecology, socio-economic profile, landuse, places of archaeological
importance etc.
3.1 STUDY AREA
Urmila Chemopharma Pvt. Ltd. proposed to Bulk drug Intermediates manufacturing unit
is located at Plot No.: F-24, MIDC, Chincholi Industrial Area, Chincholi Village, Mohal
Taluk, Solapur District, Maharashtra state
3.1.2 Study Period
The baseline data was collected for the study area during the period of March to May,
2019.
3.1.3 Location and Accessibility
The existing and proposed industry is located at MIDC, Chincholi Industrial Area Northwest
of Solapur at the intersection of N 17° 46' 36.51" - E 75° 48' 09.69” (Map Datum: WGS-84,
Precision: ±3 m) at an altitude of + 470 m above MSL and the location is depicted on Key
cum Location Plan and Google Map are given in Chapter –II (Page No. 10 & 11). The
project site falls on SOI Toposheet No.’s 47 O/13.
Prepared By Rightsource Industrial Solutions Pvt. Ltd. Chapter – III Page 32
EIA Report Urmila Chemopharma Pvt. Ltd.
The existing industry has excellent accessibility from Mumbai the State capital and Solapur
the District Headquarters. The project area is accessible by road from Mumbai by travelling
385 Kms southeast on NH-65 to reach Pakani and take a detour to north east (Left turn)
and from Solapur travel 18 Kms on NH-65 and take a detour to NE (Right Turn) near
Pakani to reach the project location. Nearest Railway Station is Pakani Railway Station is
6.0 Kms SW of Project Site. Solapur Airport is 21.7 Kms SE of project site. Solapur has all
the infrastructural facilities like High School, College, Health Center, Post & Telegraph and
Banking Facilities.
3.2 Geological & Hydrogeological Environment
Scope and Methodology
In any given environment the occurrence and movement of ground water and its quality
and quantity is chiefly controlled and governed by many factors such as geographical set-
up, climate and rainfall conditions, hydrological features, topography, soil characteristics,
the nature and thickness of underlying rock formations and other related aspects that
prevail in an area. Therefore the study envisages indentifying the existing ground water
conditions comprising both quality and potential within the project site and its
neighborhood, relating the projected utilization for the production, identifying the likely
impacts on surface and ground water resources and indicating mitigation measures. In
order to accomplish the proposed objective of the study, the scope and methodology
adopted is as follows:
Collection of the relevant data contained in the EIA and EMP Reports, from the
reports and maps of Central Ground Water Board (CGWB), Geological Survey of
India (GSI) and Indian Meterological Department (IMD) other Institutions and
Departments.
Identify Inter- related and Inter – dependent key factors that play vital role in the
occurrence of ground water its quality and potential.
Identify surface water resources in the project site and its catchment area.
Assess the ground water resource potential in the catchment area of the project
site.
Bring out various events and processes that comprise the project activity.
Identify the site specific environmental issues and mitigation measures and
Compile a consolidated, comprehensive and meaningful report of the Project site
and its catchment area.
Prepared By Rightsource Industrial Solutions Pvt. Ltd. Chapter – III Page 33

EIA Report Urmila Chemopharma Pvt. Ltd.
Initially the data and scientific information available in the EIA and EMP reports and reports
of Central Ground Water Board have been collected. Subsequently field investigation was
carried out to study surface rock outcrops, geological cross sections in the road cuttings
and open wells. Inventory of wells representing the Project area and Study area was
carried out and Hydrogeological data of about 12 wells was collected. Water levels were
recorded in the bore wells in the Project area and Study area.
The inventoried well data showed that the depth to water level ranging between 15-40 m
below ground level.
Information already available and the data collected during the survey is collated and
analyzed to comprehend the overall ground water situation in the area. An attempt is made
to predict the likely changes that could occur on account of withdrawal of groundwater by
the proposed bulk drug industry and certain mitigation measures have been indicated to
avoid adverse effect on the ground water environment.
3.2.1 TOPOGRAPHY & DRAINAGE
The site is a part of Plateau weathered sloping South at an altitude of + 470 m MSL. The
project area and Study area has good network of streams and tanks. All the streams are
ephemeral in nature and carry water during monsoon period. Most of the tanks were
observed to be dry and few tanks have little water that caters to needs of drinking water to
animals. Drainage pattern observed is sub- parallel and to some extent Dendritic near the
vicinity of major rivers. Nannaj Odha and Sina River are the major rivers draining the
Project area and Study area. The Project area and Study area is falling in Sina catchment
area.
3.2.2 Geomorphology and Soil Type
The district is comprised of Bhima sub-basin and has undulating topography. The elevation
in the district is ranges from 400 to 600m Above Mean Sea Level. The district is typically
characterized by the morphology of Deccan basaltic flows. The major rivers flowing in the
district are the Bhima, The Sina, The Man and The Bhargavati Rivers. The Sina and The
Man River’s are the tributaries of the Bhima and the Bhogawati River is tributary of Sina.
Dendritic drainage has been observed only in the vicinity of major Rivers where alluvial
deposits or thick soil cover is present. However all the streams and Rivers which flow in
the district are effluent in nature.
Prepared By Rightsource Industrial Solutions Pvt. Ltd. Chapter – III Page 34
EIA Report Urmila Chemopharma Pvt. Ltd.
The soil prevailing in Solapur district is mainly derived from Deccan basalts. The soil of the
district is underlain by partially decomposed basaltic rock locally known as “Murum” which
overlies parent rock. Due to more of less complete absence of leaching, the soils are base-
saturated. The lime reserve in the soil is fairly high (3.5 to 10%). The soils exhibit varying
degrees of erosion and truncated profile is a common occurrence. The soils can be broadly
classified in the four main categories on the basis of depth and structure.
Vary shallow with depth less than 7.5 cm.
Shallow soils between 7.5 to 22.5 cm depths.
Medium deep soils between 22.5 and 90 cm depths.
Deep soils with depth more than 90 cm.
3.2.3 Regional Geology
The area exposes ten Basaltic Lava Flows of Diveghat Formation belonging to Sahyadri
Group of Deccan Traps (Upper Cretaceous to Lower Eocene). These lava flows on
account of differential weathering give rise to undulating relief. Alluvium is confined to
major Rivers. There are no evidences of any structural disturbances like folding and
faulting. However, Few joints were observed in the Study area area.
Stratigraphy of the Area:
Alluvium - Quaternary
Basalt Flows (Diveghat Formation) Sahyadri Group Upper Cretaceous to Eocene
(Ten Flows) (Deccan Traps)
Local Geology: The area is occupied by single litho unit Basalt of Deccan Traps.
3.2.4 Hydrogeology
The entire Solapur District is occupied by lava flows of Deccan Basalt formation, Which
constitute the main rock formation of the district. The important Water bearing formations
are Deccan Trap basalt and Alluvium.
Groundwater in Deccan Traps mostly occurs in the weathered and fractured parts down to
10-15 m depth bgl. At places potential zones are encountered at deeper levels in the form
of fractures and inter flow zones which are generally confined down to 60-80 mts in the
district. The weathered portions of both vesicular and massive units have better porosity
and permeability. Intensity of weathering is less in hilly regions of the district while it is
Prepared By Rightsource Industrial Solutions Pvt. Ltd. Chapter – III Page 35

EIA Report Urmila Chemopharma Pvt. Ltd.
higher in plain areas. The yield of dug wells tapping phreatic aquifer ranges between 18-
150 Cum/day, which have 1-12 mts depth range. The above wells are generally drilled
down to 40-60 mts tapping weathered and fractured vesicular zones, these wells have a
discharge of 120 -150 lpm. It is noticed and reported that the yields of wells drastically get
reduced in summer months beginning from March up to June end.
The width of the streams is narrow and follows the weak planes within the hard rock
formations. A geomorphology, geology and structural map of the area around the proposed
plant is shown in Figure 3.1.
LIST OF WELLS INVENTORIED S.
No. Location Type of Well Geo-Coordinates DTWL/TD
(mts)
1 Near to Project Site BW N 17° 46' 39.37" E 75° 48' 10.45” Dry/90
2 Chincholi BW N 17° 45' 35.64" E 75° 48' 01.94” 35/114
3 Darphal Bibi BW N 17° 47' 36.98" E 75° 47' 24.46” 26/110
4 Akola BW N 17° 47' 48.98" E 75° 49' 53.93” 20/65
5 Kondi BW N 17° 44' 28.31" E 75° 49' 41.97” 22/80
6 Gulvanchi BW N 17° 44' 55.30" E 75° 52' 03.07” 20/55
7 Karamba BW N 17° 46' 02.8" E 75° 51' 47.82” 45/140
8 Sawaleshwar BW N 17° 45' 11.00" E 75° 45' 35.43” 16/90
9 SW of Darphal Bibi BW N 17° 46' 38.11" E 75° 46' 12.77” 32/130
10 Arjunsondi BW N 17° 45' 10.73" E 75° 43' 38.05” 26/120
11 Ran Masle BW N 17° 50' 45.35" E 75° 47' 31.88” Dry/120
12 Savantvadi BW N 17° 49' 13.78" E 75° 48' 39.39” 28/110
Prepared By Rightsource Industrial Solutions Pvt. Ltd. Chapter – III Page 36

EIA Report Urmila Chemopharma Pvt. Ltd.
FIGURE 3.1: SHOWING GEOMORPHOLOGY, GEOLOGY & STRUCTURAL MAP OF THE STUDY AREA
Prepared By Rightsource Industrial Solutions Pvt. Ltd. Chapter – III Page 37
EIA Report Urmila Chemopharma Pvt. Ltd.
3.2.5 Groundwater Conditions
Groundwater occurs under water table conditions in shallow aquifer and semi- confined to
confined conditions in fractured zones (Deeper Aquifers). The fractured jointed vesicular
basalt and massive basalt when overlain by red bole bed of considerable thickness
develops semi confined to confined conditions. Hence, the red bole bed acts as a confining
layer. The red bole bed being clayey in nature also acts as a good barrier for the
downward movement of water. The weathered and jointed zone of massive basalt unit and
vesicular basalt unit constitute the unconfined aquifer, which are generally tapped by dug
wells. The semi confined to confined aquifers is tapped by dug cum bore well and bore
wells. Twelve bore wells were inventoried in the Project area and Study area area to
assess the groundwater conditions. The depth to water levels was found to be 15- 36 m
during pre monsoon while in summer it is reported between 20-40 m with yield ranges of
50 – 150 lpm. The quality of water is found to be potable.
The proposed area is categorized as safe by the Central Groundwater Board and scope for
development & stage of groundwater is 60%. MIDC Supplies water to the industry. The
Management already adopted roof top harvesting of monsoon by constructing artificial
recharge pit. The industry enclosure has vast open space which itself acts as natural
recharge pit. However, the artificial recharge structures which might be taken up by the
Management in consultation with local government authorities.
3.2.6 Drainage Pattern of Study Area
Dendritic drainage indicates homogenous rocks, the trellis, rectangular and parallel
drainage patterns indicate structural and lithological controls. The coarse drainage texture
indicates highly porous and permeable rock formations; whereas fine drainage texture is
more common in less pervious formations. Weathering profile controls of ground water and
above all discharge of surface water along the major streams and rivers. Fractured pattern
and other structural features control drainage pattern in hard rocks. Slope / gradient of
area coupled with drainage density decide the weathering profile. These two factors
synthesized with rainfall (of a given area) provide information on the ground water potential
(weathering profile, structural factors) and discharge of surface water along streams.
Weathering profile increases groundwater potential, slope/gradient together with runoff
controls the thickness of weathered zone. Major faults, lineaments sometimes connects
two are more watersheds (Drainage Basins) and act as conduits (Interconnecting channel
Prepared By Rightsource Industrial Solutions Pvt. Ltd. Chapter – III Page 38
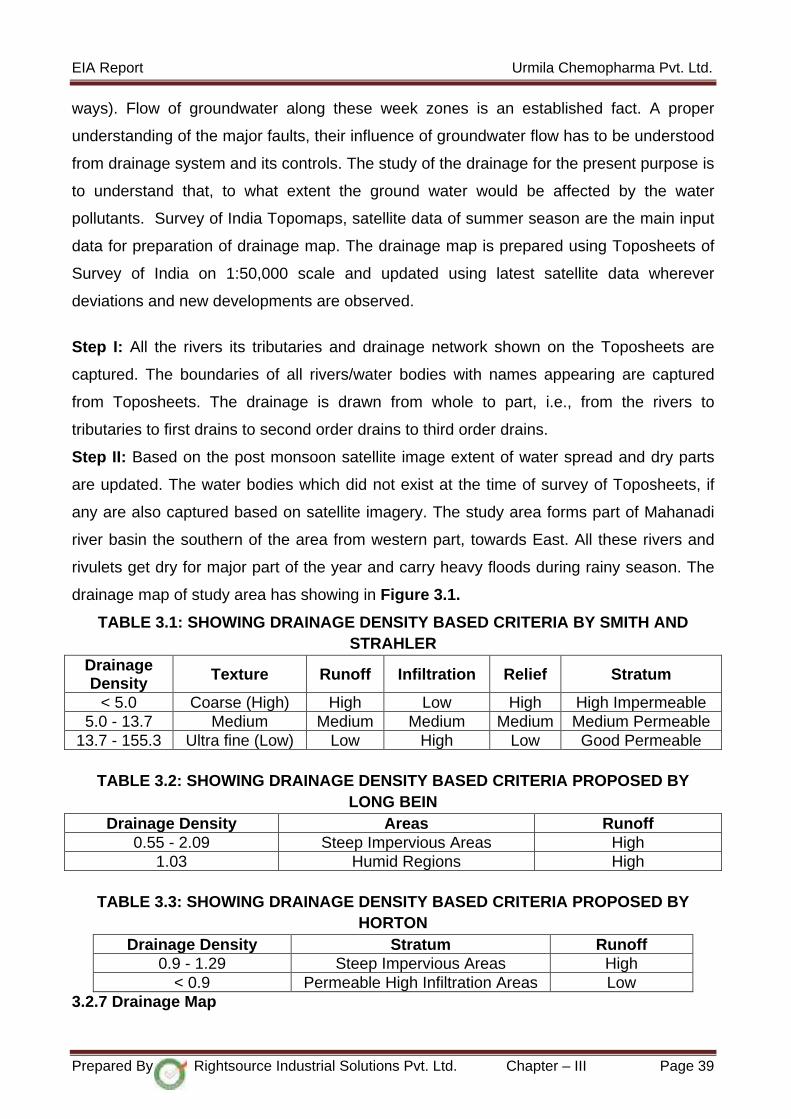
EIA Report Urmila Chemopharma Pvt. Ltd.
ways). Flow of groundwater along these week zones is an established fact. A proper
understanding of the major faults, their influence of groundwater flow has to be understood
from drainage system and its controls. The study of the drainage for the present purpose is
to understand that, to what extent the ground water would be affected by the water
pollutants. Survey of India Topomaps, satellite data of summer season are the main input
data for preparation of drainage map. The drainage map is prepared using Toposheets of
Survey of India on 1:50,000 scale and updated using latest satellite data wherever
deviations and new developments are observed.
Step I: All the rivers its tributaries and drainage network shown on the Toposheets are
captured. The boundaries of all rivers/water bodies with names appearing are captured
from Toposheets. The drainage is drawn from whole to part, i.e., from the rivers to
tributaries to first drains to second order drains to third order drains.
Step II: Based on the post monsoon satellite image extent of water spread and dry parts
are updated. The water bodies which did not exist at the time of survey of Toposheets, if
any are also captured based on satellite imagery. The study area forms part of Mahanadi
river basin the southern of the area from western part, towards East. All these rivers and
rivulets get dry for major part of the year and carry heavy floods during rainy season. The
drainage map of study area has showing in Figure 3.1.
TABLE 3.1: SHOWING DRAINAGE DENSITY BASED CRITERIA BY SMITH AND STRAHLER
Drainage Density Texture Runoff Infiltration Relief Stratum
< 5.0 Coarse (High) High Low High High Impermeable 5.0 - 13.7 Medium Medium Medium Medium Medium Permeable
13.7 - 155.3 Ultra fine (Low) Low High Low Good Permeable
TABLE 3.2: SHOWING DRAINAGE DENSITY BASED CRITERIA PROPOSED BY LONG BEIN
Drainage Density Areas Runoff 0.55 - 2.09 Steep Impervious Areas High
1.03 Humid Regions High
TABLE 3.3: SHOWING DRAINAGE DENSITY BASED CRITERIA PROPOSED BY HORTON
Drainage Density Stratum Runoff 0.9 - 1.29 Steep Impervious Areas High
< 0.9 Permeable High Infiltration Areas Low 3.2.7 Drainage Map
Prepared By Rightsource Industrial Solutions Pvt. Ltd. Chapter – III Page 39
EIA Report Urmila Chemopharma Pvt. Ltd.
This Draingae map consists of all water bodies, rivers, tributaries, perennial & ephemeral
streams, reservoirs, tanks, ponds and the entire drainage network from first order
originating in the area to the last order joining the rivers, tributaries and tanks based on
topography. Understanding the importance of drainage depends on the purpose and the
objective of the project. For the present study purpose the following factors have to be
understood and extracted from the study of the drainage pattern. Drainage network helps
in delineation of watersheds. Drainage density and type of drainage gives information
related to runoff, infiltration relief and permeability.
Prepared By Rightsource Industrial Solutions Pvt. Ltd. Chapter – III Page 40
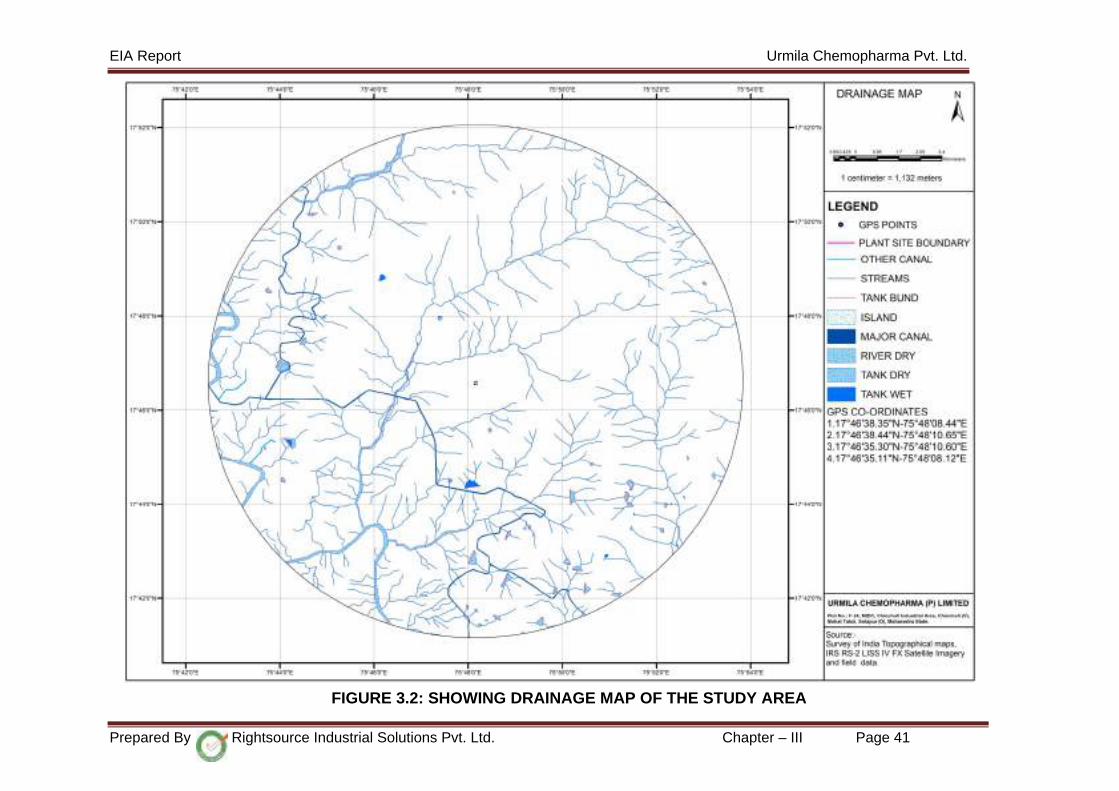
EIA Report Urmila Chemopharma Pvt. Ltd.
FIGURE 3.2: SHOWING DRAINAGE MAP OF THE STUDY AREA
Prepared By Rightsource Industrial Solutions Pvt. Ltd. Chapter – III Page 41

EIA Report Urmila Chemopharma Pvt. Ltd.
3.3 Micrometeorology and Climate
Meteorological Data from Nearest IMD Station:
Meteorological Data from the nearest Indian Meteorological Department (IMD)
station located to project site is Solapur. The Climatological data for Solapur (17°
40’N and 75° 54’E), published by the IMD, based on daily observations at 08:30 and
17:30 hour IST for a 30 year period, is presented in the following sections on the
meteorological conditions of the region.
As per the Climatological data the observations drawn for the study area during
study period (March to May) are given below:
• Daily maximum temperature is 40.2°C and daily minimum temperature of
21.7°C were recorded in the months of March, April & May respectively.
• Maximum and minimum relative humidity of 64% and 23% were recorded in
the months of March, April & May respectively.
• Maximum and minimum Mean wind speed is 5.8 kmph (161 m/s) and 4.0
kmph (1.11 m/s) were recorded in the months of March, April & May
respectively.
• Annual average highest temperature is 43.8°C and the Annual average lowest
temperature is 11.0°C.
• Average Annual rainfall recorded is 742.5 mm.
Climatological Summary
The monthly variations of the relevant meteorological parameters are given in Table
3.5.
TABLE 3.4: CLIMATOLOGICAL SUMMARY – SOLAPUR REGION (1981-2010)
Month Temp (oC) Rainfall
(mm)
Relative Humidity
(%)
Station Level
Pressure (hPa)
Mean Wind Speed
(KMPH)
Predominant Wind Directions
Daily Max.
Daily Min. Total No. of
days 08:30 17:30 08:30 17:30 08:30 17:30
Jan 31.3 16.3 6.0 0.4 65 31 961.3 957.4 4.0 E & SE SE & E
Feb 34.2 18.1 2.3 0.3 53 26 960 955.8 4.0 SE, E & N SE, W, NW & N
Mar 37.7 21.7 7.9 0.7 47 23 958.4 953.7 4.0 N & SE W & NW
Apr 40.1 24.6 14.8 1.4 51 23 956.5 951.3 4.6 N, NW & W
W, NW & N
May 40.2 25.1 33.4 2.7 64 27 954.5 949.5 5.8 W & NW W & NW June 34.9 23.4 120.4 7.2 77 49 952.3 948.5 6.2 W & SW W & SW July 31.9 22.5 121 8.0 81 58 952.2 949.1 6.1 W & SW W & SW Aug 31.2 22.0 134 8.7 81 58 953.3 949.9 5.4 W & SW W & SW
Prepared By Rightsource Industrial Solutions Pvt. Ltd. Chapter – III Page 42

EIA Report Urmila Chemopharma Pvt. Ltd.
Month Temp (oC) Rainfall
(mm)
Relative Humidity
(%)
Station Level
Pressure (hPa)
Mean Wind Speed
(KMPH)
Predominant Wind Directions
Daily Max.
Daily Min. Total No. of
days 08:30 17:30 08:30 17:30 08:30 17:30
Sept 31.9 21.9 177 9.0 81 53 955.5 915.5 4.4 W, NW & SW
W, NW & SW
Oct 32.7 20.7 96.2 5.1 72 42 958.1 954.2 4.0 NE & E NE, E & N
Nov 31.8 18.1 22.4 1.4 65 36 960.4 956.6 4.2 E, NE & SE E & NE
Dec 30.8 15.8 7.0 0.5 66 34 961.8 957.9 3.8 E, SE & NE
FIGURE 3.3: WIND ROSE FOR NEAREST IMD STATION - SOLAPUR
(PERIOD: Summer Season)
WIND ROSE (IMD – SOLAPUR) 8.30 Hrs WIND ROSE (IMD – SOLAPUR) 17.30 Hrs
Meteorological Data for Project Site:
The meteorological data recorded during the study period is very useful for proper
interpretation of the baseline information as well as for input to prediction models for
air quality dispersion. Historical data on meteorological parameters will also play an
important role in identifying general meteorological regime of the region.
Automatic weather station was installed in the project site at about 10 m above the
ground level. On-site monitoring was undertaken for various meteorological variables
in order to record the site-specific data. Data was recorded every hour continuously
from March to May, 2019.
Prepared By Rightsource Industrial Solutions Pvt. Ltd. Chapter – III Page 43
EIA Report Urmila Chemopharma Pvt. Ltd.
The critical weather elements that influence air pollution are wind speed, wind
direction, temperature, which together determines atmosphere stability. The details
of the temperature, relative humidity and rainfall observed during study period
(March to May, 2019) are given below.
A. Temperature:
During the study period the minimum and maximum temperatures were recorded as
24 °C and 45 °C respectively.
B. Relative Humidity:
During study period at project site, the relative humidity was recorded as 55 %
C. Rainfall
Rainfall during the Study Period at the Project Site is 26.1 mm. Normal annual
rainfall is 742.5 mm. (Source: IMD Climatatological Normals, Solapur 1981 - 2010)
D. Wind pattern
Dispersion of different air pollutants released into the atmosphere has significant
impacts on neighborhood air environment. The dispersion/dilution of the released
pollutant over a large area will result in considerable reduction of the concentration of
a pollutant. The dispersion in turn depends on the weather conditions like the wind
speed, wind direction, temperature, relative humidity, mixing height, cloud cover and
also the rainfall in the area.
Wind speed and direction data recorded during the study period is useful in
identifying the influence of meteorology on the air quality of the area. Wind roses on
sixteen sector basis have been drawn. Wind directions and wind speed frequency
observed during study period is given in Table 3.5 and wind rose are given in Figure
3.2.
The following observations can be made from the collected data:
• Calm period is observed to be 16.7 % during the time of monitoring.
• The predominant wind direction is W & NW.
• Other than predominant wind directions wind was blowing in SE direction.
• Average wind speed is 2.73 m/sec.
Prepared By Rightsource Industrial Solutions Pvt. Ltd. Chapter – III Page 44
EIA Report Urmila Chemopharma Pvt. Ltd.
• Mostly the wind speeds are observed in the wind rose are in the range of 8.80
– 11.10 m/sec, 5.70 – 8.80 m/sec, 3.6 – 5.7 m/sec, 2.10 – 3.6 m/sec and 0.5 –
2.1 m/sec with frequency of distribution percentages of 2.9, 11, 16.4, 15.4 &
37.6 respectively.
Prepared By Rightsource Industrial Solutions Pvt. Ltd. Chapter – III Page 45

EIA Report Urmila Chemopharma Pvt. Ltd.
TABLE 3.5: FREQUENCY DISTRIBUTION WIND DIRECTIONS AND WIND SPEED
S. No Wind Directions Wind Classes (m/sec) 0.5 - 2.1 2.1 - 3.6 3.6 - 5.7 5.7 - 8.8 8.8 - 11.1 >= 11.1 Total (%)
1 N 348.75 - 11.25 2.8 1.3 1.6 1.0 0.1 0.0 6.8 2 NNE 11.25 - 33.75 2.3 0.3 0.8 0.7 0.0 0.0 4.1 3 NE 33.75 - 56.25 0.0 0.0 0.0 0.0 0.0 0.0 0.0 4 ENE 56.25 - 78.75 1.8 0.6 0.9 0.8 0.2 0.0 4.3 5 E 78.75 - 101.25 3.9 1.8 1.3 0.5 0.0 0.0 7.5 6 ESE 101.25 - 123.75 0.9 0.4 0.2 0.2 0.0 0.0 1.7 7 SE 123.75 - 146.25 4.5 1.3 1.9 1.4 0.5 0.0 9.6 8 SSE 146.25 - 168.75 0.5 0.3 0.5 0.5 0.0 0.0 1.9 9 S 168.75 - 191.25 1.3 1.6 1.0 0.2 0.0 0.0 4.1 10 SSW 191.25 - 213.75 1.0 0.1 0.1 0.0 0.0 0.0 1.2 11 SW 213.75 - 236.25 0.8 0.5 0.5 0.0 0.0 0.0 1.8 12 WSW 236.25 - 258.75 1.8 0.7 0.5 0.2 0.1 0.0 3.4 13 W 258.75 - 281.25 8.9 2.7 3.1 2.2 0.8 0.0 17.6 14 WNW 281.25 - 303.75 1.6 0.7 1.3 1.7 1.0 0.0 6.2 15 NW 303.75 - 326.25 5.5 3.1 2.7 1.6 0.2 0.0 13.1 16 NNW 326.25 - 348.75 0.0 0.0 0.0 0.0 0.0 0.0 0.0
Sub-Total 37.6 15.4 16.4 11.0 2.9 0.0 83.3 Calms 16.7 Missing/ Incomplete 0 Total 100
Prepared By Rightsource Industrial Solutions Pvt. Ltd. Chapter – III Page 46
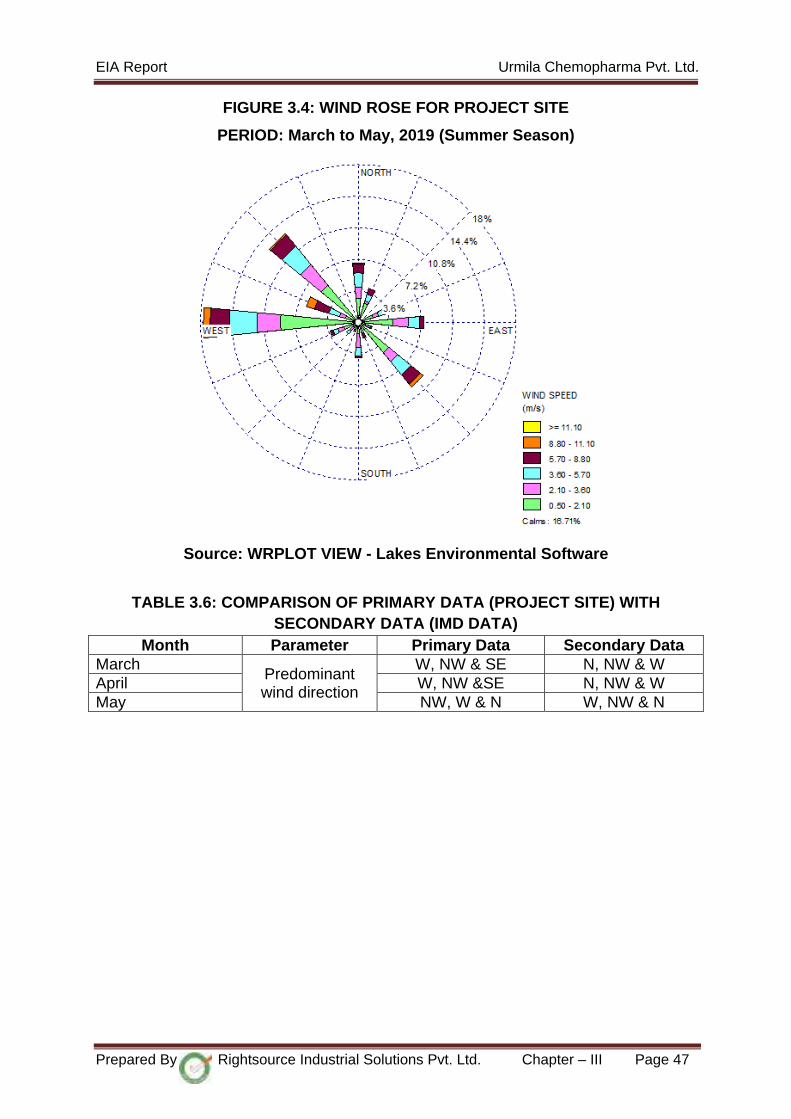
EIA Report Urmila Chemopharma Pvt. Ltd.
FIGURE 3.4: WIND ROSE FOR PROJECT SITE
PERIOD: March to May, 2019 (Summer Season)
Source: WRPLOT VIEW - Lakes Environmental Software
TABLE 3.6: COMPARISON OF PRIMARY DATA (PROJECT SITE) WITH SECONDARY DATA (IMD DATA)
Month Parameter Primary Data Secondary Data March
Predominant wind direction
W, NW & SE N, NW & W April W, NW &SE N, NW & W May NW, W & N W, NW & N
Prepared By Rightsource Industrial Solutions Pvt. Ltd. Chapter – III Page 47

EIA Report Urmila Chemopharma Pvt. Ltd.
3.4 AIR ENVIRONMENT
The ambient air quality with respect to the study area of 10 km radius around the
plant site forms the baseline information. The various sources of air pollution in the
region are industrial, traffic and rural activities. This will also be useful for assessing
the conformity to standards of the ambient air quality during the plant operation. The
study area represents mostly rural environment.
The baseline status of the ambient air quality has been assessed through a
scientifically designed ambient air quality monitoring network. The design of
monitoring network in the air quality surveillance programme has been based on the
following considerations:
Meteorological conditions on synoptic scale.
Topography of the study area.
Representation of plant site.
Influence of the existing sources (if any) are to be kept at minimum.
Inclusion of major distinct villages to collect the baseline status.
Representation of down wind direction.
Representation of upwind direction.
Representation of cross sectional distribution in the down wind direction.
The ambient air quality monitoring was carried out in accordance with National
Ambient Air Quality Standards (NAAQS) of CPCB. Ambient Air Quality Monitoring
(AAQM) was carried out at eight locations for 2 days per week for 12 weeks during
study period and the locations are shown in Figure 3.5. The locations of the different
stations with respect to its distance and direction from project site are shown in
Table 3.7.
TABLE 3.7: AMBIENT AIR QUALITY SAMPLING LOCATIONS
Code Name of Sampling Location Distance (km) w.r.t Project
Direction w.r.t Project
A1 Project Site - - A2 Chincholi 1.8 South A3 Darphal Bibi 2.5 NNW
A4 Akolekati 3.9 NE A5 Kondi 4.2 SSE A6 Gulvanchi 7.4 ESE A7 Karamba 6.9 East
A8 Sawaleshwar 5.2 WSW
Prepared By Rightsource Industrial Solutions Pvt. Ltd. Chapter – III Page 48

EIA Report Urmila Chemopharma Pvt. Ltd.
The monitoring was carried out for a three month period (March to May, 2019) at a
frequency of twice a week at each station adopting a continuous 24- hour schedule.
The following parameters were monitored in the study area :
• Particulate Matter (PM10) • Particulate Matter (PM2.5) • Sulphur Dioxide (SO2) • Oxides of Nitrogen (NOx) • Carbon Monoxide (CO) • Ammonia (NH3) • Volitail Organic Compounds (VOC)
Prepared By Rightsource Industrial Solutions Pvt. Ltd. Chapter – III Page 49

EIA Report Urmila Chemopharma Pvt. Ltd.
FIGURE 3.5: AMBIENT AIR QUALITY SAMPLING LOCATIONS MAP
Prepared By Rightsource Industrial Solutions Pvt. Ltd. Chapter – III Page 50
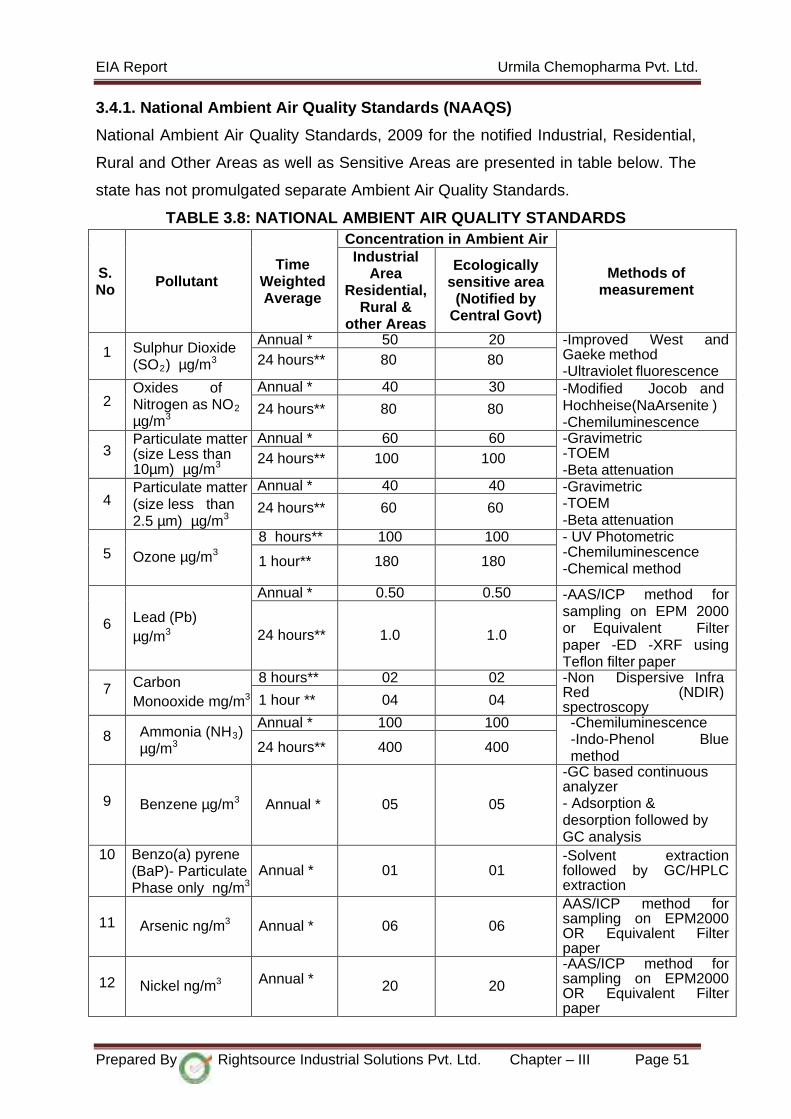
EIA Report Urmila Chemopharma Pvt. Ltd.
3.4.1. National Ambient Air Quality Standards (NAAQS)
National Ambient Air Quality Standards, 2009 for the notified Industrial, Residential,
Rural and Other Areas as well as Sensitive Areas are presented in table below. The
state has not promulgated separate Ambient Air Quality Standards.
TABLE 3.8: NATIONAL AMBIENT AIR QUALITY STANDARDS
S. No Pollutant
Time Weighted Average
Concentration in Ambient Air
Methods of measurement
Industrial Area
Residential, Rural &
other Areas
Ecologically sensitive area
(Notified by Central Govt)
1 Sulphur Dioxide (SO2) µg/m3
Annual * 50 20 -Improved West and Gaeke method -Ultraviolet fluorescence
24 hours** 80 80
2 Oxides of Nitrogen as NO2 µg/m3
Annual * 40 30 -Modified Jocob and Hochheise(NaArsenite ) -Chemiluminescence
24 hours** 80 80
3 Particulate matter (size Less than 10µm) µg/m3
Annual * 60 60 -Gravimetric -TOEM -Beta attenuation
24 hours** 100 100
4 Particulate matter (size less than 2.5 µm) µg/m3
Annual * 40 40 -Gravimetric -TOEM -Beta attenuation
24 hours** 60 60
5 Ozone µg/m3 8 hours** 100 100 - UV Photometric
-Chemiluminescence -Chemical method 1 hour** 180 180
6 Lead (Pb) µg/m3
Annual * 0.50 0.50 -AAS/ICP method for sampling on EPM 2000 or Equivalent Filter paper -ED -XRF using Teflon filter paper
24 hours** 1.0 1.0
7 Carbon Monooxide mg/m3
8 hours** 02 02 -Non Dispersive Infra Red (NDIR) spectroscopy 1 hour ** 04 04
8 Ammonia (NH3) µg/m3
Annual * 100 100 -Chemiluminescence -Indo-Phenol Blue method
24 hours** 400 400
9 Benzene µg/m3 Annual * 05 05
-GC based continuous analyzer - Adsorption & desorption followed by GC analysis
10 Benzo(a) pyrene (BaP)- Particulate Phase only ng/m3
Annual * 01 01 -Solvent extraction followed by GC/HPLC extraction
11 Arsenic ng/m3 Annual * 06 06
AAS/ICP method for sampling on EPM2000 OR Equivalent Filter paper
12 Nickel ng/m3 Annual * 20 20
-AAS/ICP method for sampling on EPM2000 OR Equivalent Filter paper
Prepared By Rightsource Industrial Solutions Pvt. Ltd. Chapter – III Page 51

EIA Report Urmila Chemopharma Pvt. Ltd.
G.S.No.826 (E) dated 16th November, 2009. Vide letter no. F. No. Q-15017/43/2007-CPW. *Average Arithmetic mean of minimum 104 measurements in a year taken for a week 24 hourly at uniform interval. **24 hourly/8 hourly values should meet 98 percent of the time in a year.
TABLE 3.9: AMBIENT AIR QUALITY RESULTS FOR PM10
Location Name Minimum Maximum Average 98th Percentile
NAAQ Standards
Project Site 57.4 65.1 59.9 64.0 100 Chincholi 53.1 59.1 56.4 58.8 100 Darphal Bibi 54.2 60.2 57.2 59.7 100 Akolekati 55.9 60.1 57.1 59.5 100 Kondi 54.8 58.7 56.6 58.6 100 Gulvanchi 53.3 60.3 56.0 59.3 100 Karamba 54.2 60.2 56.2 59.5 100 Sawaleshwar 53.0 57.4 55.2 57.3 100
FIGURE 3.6: SHOWING AMBIENT AIR QUALITY RESULTS FOR PM10
TABLE 3.10: AMBIENT AIR QUALITY RESULTS FOR PM2.5
Location Minimum Maximum Average 98th
Percentile NAAQ
Standards Project Site 25.8 29.5 27.8 29.4 60 Chincholi 24.9 28.1 26.2 27.9 60 Darphal Bibi 25.0 28.1 26.5 28.1 60 Akolekati 22.7 28.1 26.1 28.0 60 Kondi 24.9 28.1 26.1 28.1 60 Gulvanchi 25.8 29.1 27.4 29.0 60 Karamba 23.7 27.3 26.0 27.3 60 Sawaleshwar 22.1 25.5 23.8 25.4 60
Prepared By Rightsource Industrial Solutions Pvt. Ltd. Chapter – III Page 52
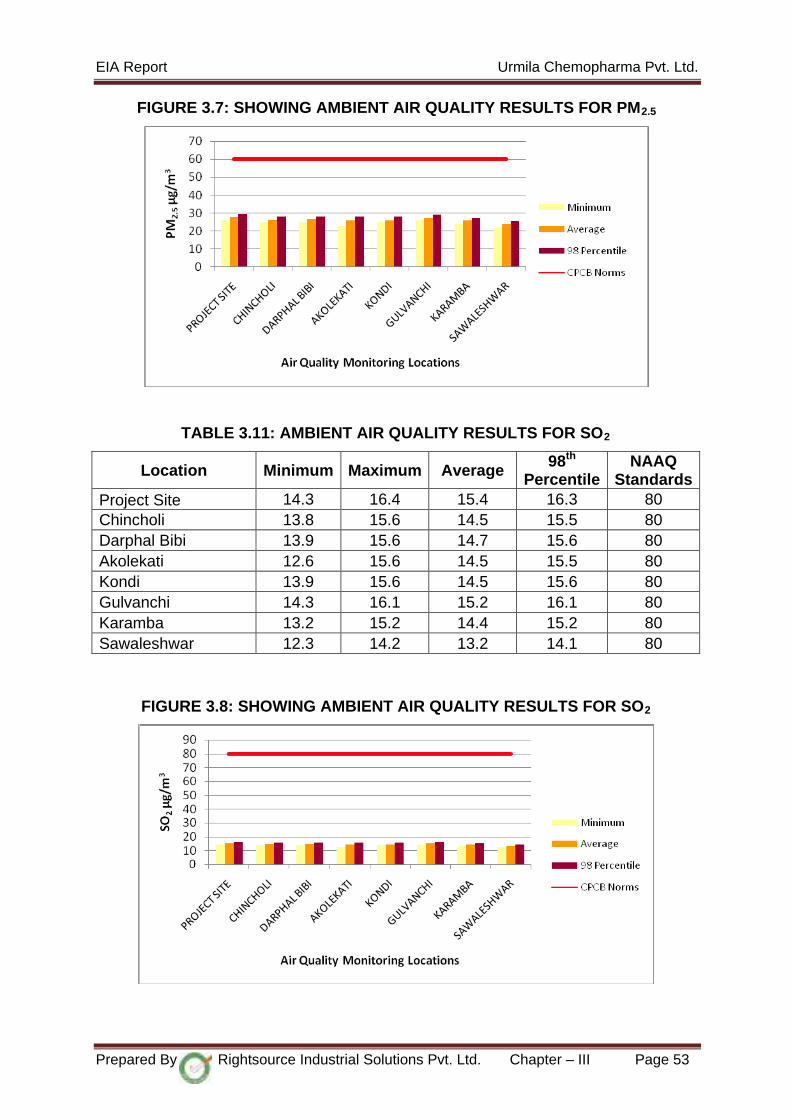
EIA Report Urmila Chemopharma Pvt. Ltd.
FIGURE 3.7: SHOWING AMBIENT AIR QUALITY RESULTS FOR PM2.5
TABLE 3.11: AMBIENT AIR QUALITY RESULTS FOR SO2
Location Minimum Maximum Average 98th
Percentile NAAQ
Standards Project Site 14.3 16.4 15.4 16.3 80 Chincholi 13.8 15.6 14.5 15.5 80 Darphal Bibi 13.9 15.6 14.7 15.6 80 Akolekati 12.6 15.6 14.5 15.5 80 Kondi 13.9 15.6 14.5 15.6 80 Gulvanchi 14.3 16.1 15.2 16.1 80 Karamba 13.2 15.2 14.4 15.2 80 Sawaleshwar 12.3 14.2 13.2 14.1 80
FIGURE 3.8: SHOWING AMBIENT AIR QUALITY RESULTS FOR SO2
Prepared By Rightsource Industrial Solutions Pvt. Ltd. Chapter – III Page 53
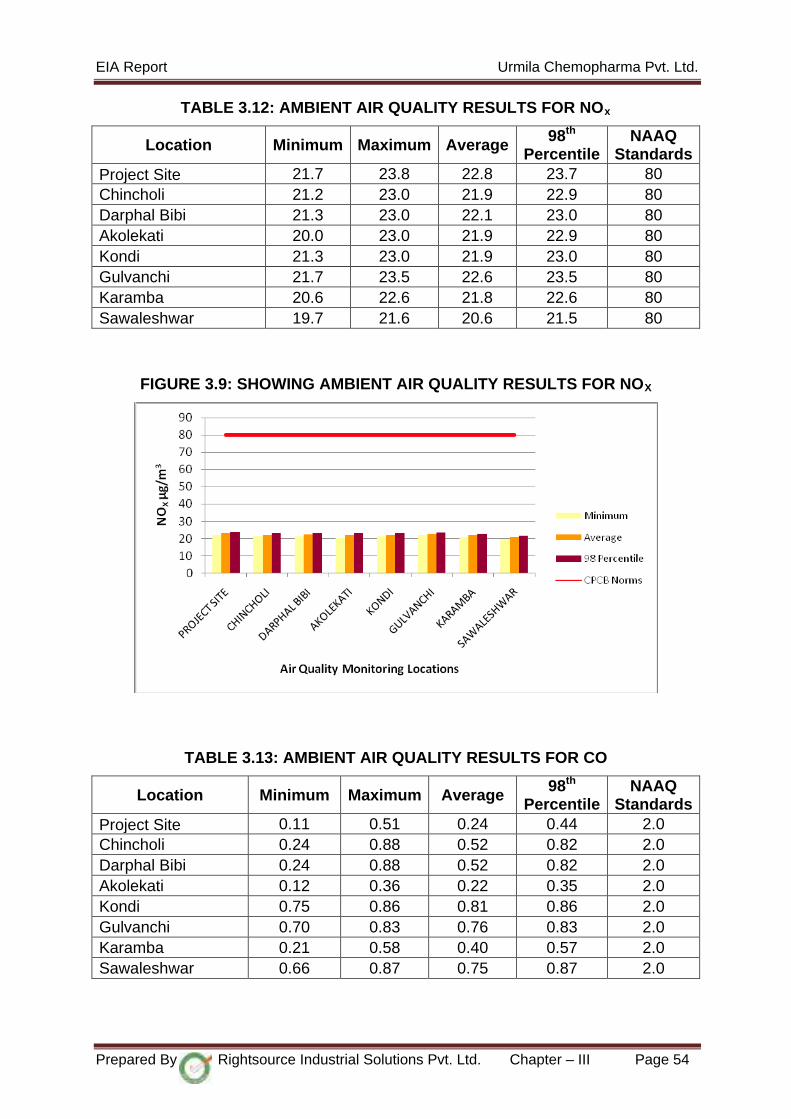
EIA Report Urmila Chemopharma Pvt. Ltd.
TABLE 3.12: AMBIENT AIR QUALITY RESULTS FOR NOx
Location Minimum Maximum Average 98th
Percentile NAAQ
Standards Project Site 21.7 23.8 22.8 23.7 80 Chincholi 21.2 23.0 21.9 22.9 80 Darphal Bibi 21.3 23.0 22.1 23.0 80 Akolekati 20.0 23.0 21.9 22.9 80 Kondi 21.3 23.0 21.9 23.0 80 Gulvanchi 21.7 23.5 22.6 23.5 80 Karamba 20.6 22.6 21.8 22.6 80 Sawaleshwar 19.7 21.6 20.6 21.5 80
FIGURE 3.9: SHOWING AMBIENT AIR QUALITY RESULTS FOR NOX
TABLE 3.13: AMBIENT AIR QUALITY RESULTS FOR CO
Location Minimum Maximum Average 98th
Percentile NAAQ
Standards Project Site 0.11 0.51 0.24 0.44 2.0 Chincholi 0.24 0.88 0.52 0.82 2.0 Darphal Bibi 0.24 0.88 0.52 0.82 2.0 Akolekati 0.12 0.36 0.22 0.35 2.0 Kondi 0.75 0.86 0.81 0.86 2.0 Gulvanchi 0.70 0.83 0.76 0.83 2.0 Karamba 0.21 0.58 0.40 0.57 2.0 Sawaleshwar 0.66 0.87 0.75 0.87 2.0
Prepared By Rightsource Industrial Solutions Pvt. Ltd. Chapter – III Page 54
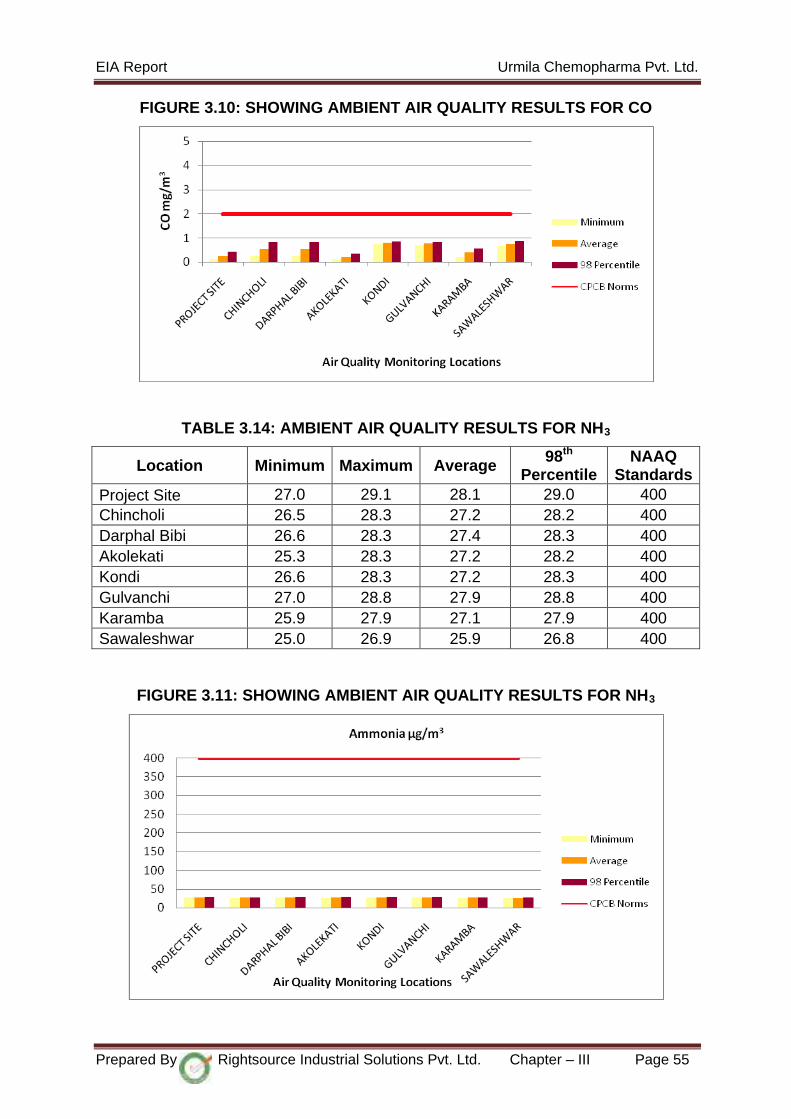
EIA Report Urmila Chemopharma Pvt. Ltd.
FIGURE 3.10: SHOWING AMBIENT AIR QUALITY RESULTS FOR CO
TABLE 3.14: AMBIENT AIR QUALITY RESULTS FOR NH3
Location Minimum Maximum Average 98th
Percentile NAAQ
Standards Project Site 27.0 29.1 28.1 29.0 400 Chincholi 26.5 28.3 27.2 28.2 400 Darphal Bibi 26.6 28.3 27.4 28.3 400 Akolekati 25.3 28.3 27.2 28.2 400 Kondi 26.6 28.3 27.2 28.3 400 Gulvanchi 27.0 28.8 27.9 28.8 400 Karamba 25.9 27.9 27.1 27.9 400 Sawaleshwar 25.0 26.9 25.9 26.8 400
FIGURE 3.11: SHOWING AMBIENT AIR QUALITY RESULTS FOR NH3
Prepared By Rightsource Industrial Solutions Pvt. Ltd. Chapter – III Page 55
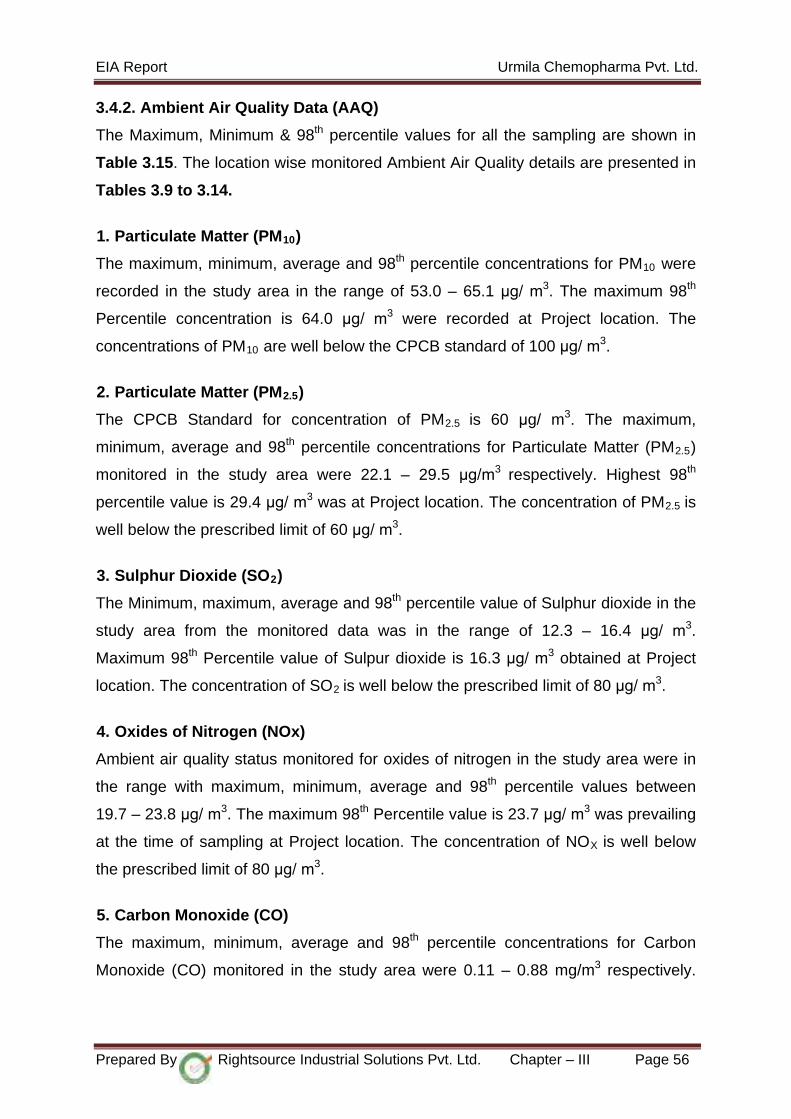
EIA Report Urmila Chemopharma Pvt. Ltd.
3.4.2. Ambient Air Quality Data (AAQ)
The Maximum, Minimum & 98th percentile values for all the sampling are shown in
Table 3.15. The location wise monitored Ambient Air Quality details are presented in
Tables 3.9 to 3.14.
1. Particulate Matter (PM10)
The maximum, minimum, average and 98th percentile concentrations for PM10 were
recorded in the study area in the range of 53.0 – 65.1 μg/ m3. The maximum 98th
Percentile concentration is 64.0 μg/ m3 were recorded at Project location. The
concentrations of PM10 are well below the CPCB standard of 100 μg/ m3.
2. Particulate Matter (PM2.5)
The CPCB Standard for concentration of PM2.5 is 60 μg/ m3. The maximum,
minimum, average and 98th percentile concentrations for Particulate Matter (PM2.5)
monitored in the study area were 22.1 – 29.5 μg/m3 respectively. Highest 98th
percentile value is 29.4 μg/ m3 was at Project location. The concentration of PM2.5 is
well below the prescribed limit of 60 μg/ m3.
3. Sulphur Dioxide (SO2)
The Minimum, maximum, average and 98th percentile value of Sulphur dioxide in the
study area from the monitored data was in the range of 12.3 – 16.4 μg/ m3.
Maximum 98th Percentile value of Sulpur dioxide is 16.3 μg/ m3 obtained at Project
location. The concentration of SO2 is well below the prescribed limit of 80 μg/ m3.
4. Oxides of Nitrogen (NOx)
Ambient air quality status monitored for oxides of nitrogen in the study area were in
the range with maximum, minimum, average and 98th percentile values between
19.7 – 23.8 μg/ m3. The maximum 98th Percentile value is 23.7 μg/ m3 was prevailing
at the time of sampling at Project location. The concentration of NOX is well below
the prescribed limit of 80 μg/ m3.
5. Carbon Monoxide (CO)
The maximum, minimum, average and 98th percentile concentrations for Carbon
Monoxide (CO) monitored in the study area were 0.11 – 0.88 mg/m3 respectively.
Prepared By Rightsource Industrial Solutions Pvt. Ltd. Chapter – III Page 56

EIA Report Urmila Chemopharma Pvt. Ltd.
Highest 98th Percentile value is 0.87 mg/ m3 was recorded at the Sawaleshwar
location. The concentration of CO is well below the prescribed limit of 2.0 mg/ m3
6. Ammonia (NH3)
The maximum, minimum, average and 98th percentile concentrations for Ammonia
(NH3) monitored in the study area were in the range of 25.0 – 29.1 μg/m3
respectively. Highest 98th percentile value is 29.0 μg/ m3 was recorded at Project
location. The concentration of NH3 is well below the prescribed limit of 400 μg/ m3.
7. Volatile Organic Compounds (VOCs)
Volatile Organic Compounds (VOCs) concentration in study area was found to be
Below Detectable Limit of 1 ppm.
The ambient air quality monitoring results indicates that the overall air quality in the
study area is within permissible standards prescribed by NAAQ Standards.
Prepared By Rightsource Industrial Solutions Pvt. Ltd. Chapter – III Page 57
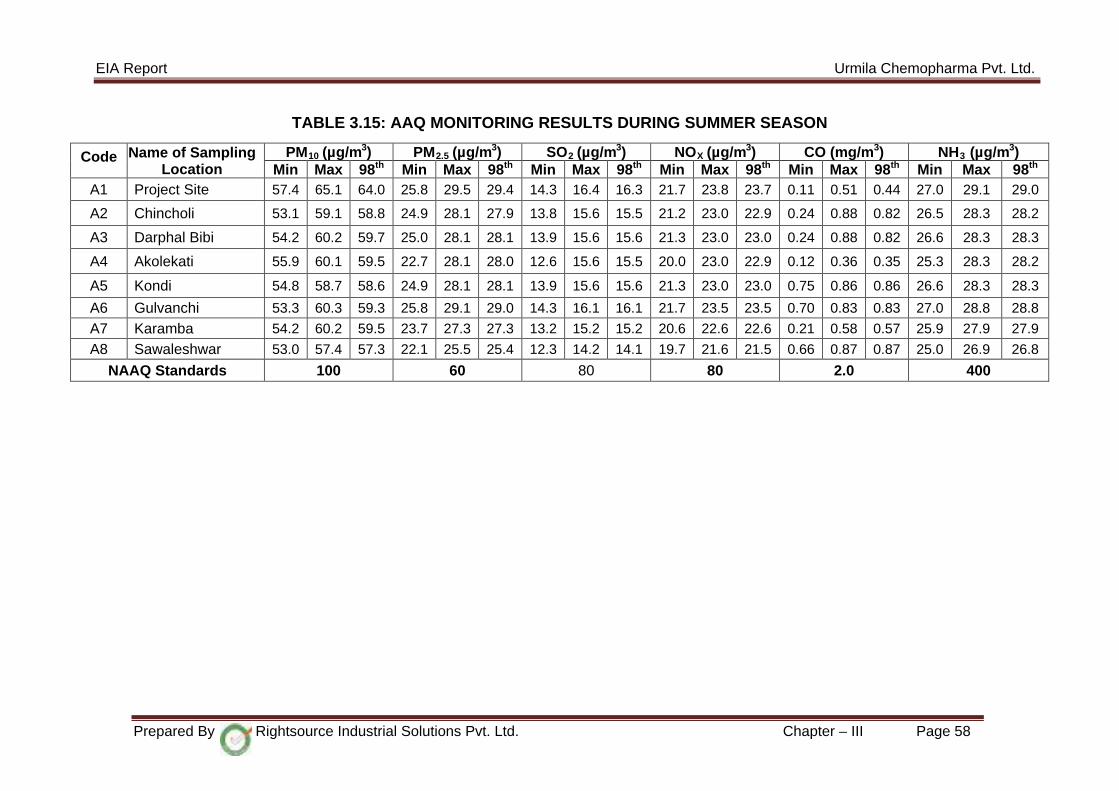
EIA Report Urmila Chemopharma Pvt. Ltd.
TABLE 3.15: AAQ MONITORING RESULTS DURING SUMMER SEASON
Code Name of Sampling Location
PM10 (µg/m3) PM2.5 (µg/m3) SO2 (µg/m3) NOX (µg/m3) CO (mg/m3) NH3 (µg/m3) Min Max 98th Min Max 98th Min Max 98th Min Max 98th Min Max 98th Min Max 98th
A1 Project Site 57.4 65.1 64.0 25.8 29.5 29.4 14.3 16.4 16.3 21.7 23.8 23.7 0.11 0.51 0.44 27.0 29.1 29.0
A2 Chincholi 53.1 59.1 58.8 24.9 28.1 27.9 13.8 15.6 15.5 21.2 23.0 22.9 0.24 0.88 0.82 26.5 28.3 28.2
A3 Darphal Bibi 54.2 60.2 59.7 25.0 28.1 28.1 13.9 15.6 15.6 21.3 23.0 23.0 0.24 0.88 0.82 26.6 28.3 28.3
A4 Akolekati 55.9 60.1 59.5 22.7 28.1 28.0 12.6 15.6 15.5 20.0 23.0 22.9 0.12 0.36 0.35 25.3 28.3 28.2
A5 Kondi 54.8 58.7 58.6 24.9 28.1 28.1 13.9 15.6 15.6 21.3 23.0 23.0 0.75 0.86 0.86 26.6 28.3 28.3
A6 Gulvanchi 53.3 60.3 59.3 25.8 29.1 29.0 14.3 16.1 16.1 21.7 23.5 23.5 0.70 0.83 0.83 27.0 28.8 28.8
A7 Karamba 54.2 60.2 59.5 23.7 27.3 27.3 13.2 15.2 15.2 20.6 22.6 22.6 0.21 0.58 0.57 25.9 27.9 27.9
A8 Sawaleshwar 53.0 57.4 57.3 22.1 25.5 25.4 12.3 14.2 14.1 19.7 21.6 21.5 0.66 0.87 0.87 25.0 26.9 26.8
NAAQ Standards 100 60 80 80 2.0 400
Prepared By Rightsource Industrial Solutions Pvt. Ltd. Chapter – III Page 58
EIA Report Urmila Chemopharma Pvt. Ltd.
3.5 WATER ENVIRONMENT
Water sampling and subsequent analysis were carried out to determine both the
groundwater and surface water quality of the study area.
Selected water quality parameters of ground water resources and surface water
resources within 10 km radius of the study area has been studied for assessing the
quality of water.
3.5.1 Methodology for Water Quality Monitoring
Ground water sources and surface water sources covering 10 km radial distance
were examined for physico-chemical, heavy metals and bacteriological parameters
in order to assess the effect of industrial and other activities on ground water and
surface water. The samples were analyzed as per the procedures specified in
'Standard Methods for the Examination of Water and Wastewater' published by
American Public Health Association (APHA).
Samples for chemical analysis were collected in polyethylene carboys. Samples for
bacteriological analysis were collected in sterilized glass bottles. Selected
physicochemical and bacteriological parameters have been analyzed for projecting
the existing water quality status in the study area. Parameters like pH and
temperature were analyzed at the time of sample collection.
The details of surface and ground water sampling locations are given in Table 3.16
and sampling locations of ground water quality and surface quality monitoring are
shown in Figure 3.12. The physico - chemical characteristics of the ground water
samples and surface water samples are presented in the Tables 3.17 & 3.18.
Prepared By Rightsource Industrial Solutions Pvt. Ltd. Chapter – III Page 59
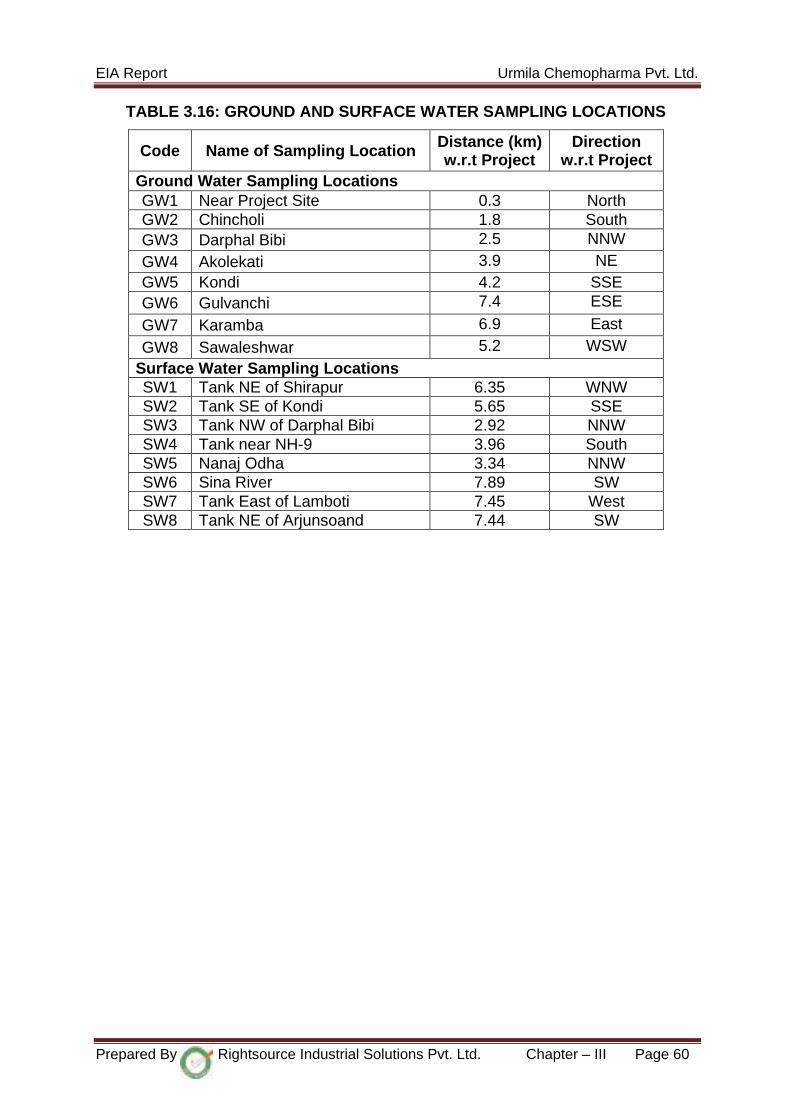
EIA Report Urmila Chemopharma Pvt. Ltd.
TABLE 3.16: GROUND AND SURFACE WATER SAMPLING LOCATIONS
Code Name of Sampling Location Distance (km) w.r.t Project
Direction w.r.t Project
Ground Water Sampling Locations GW1 Near Project Site 0.3 North GW2 Chincholi 1.8 South GW3 Darphal Bibi 2.5 NNW GW4 Akolekati 3.9 NE GW5 Kondi 4.2 SSE GW6 Gulvanchi 7.4 ESE
GW7 Karamba 6.9 East
GW8 Sawaleshwar 5.2 WSW Surface Water Sampling Locations SW1 Tank NE of Shirapur 6.35 WNW SW2 Tank SE of Kondi 5.65 SSE SW3 Tank NW of Darphal Bibi 2.92 NNW SW4 Tank near NH-9 3.96 South SW5 Nanaj Odha 3.34 NNW SW6 Sina River 7.89 SW SW7 Tank East of Lamboti 7.45 West SW8 Tank NE of Arjunsoand 7.44 SW
Prepared By Rightsource Industrial Solutions Pvt. Ltd. Chapter – III Page 60
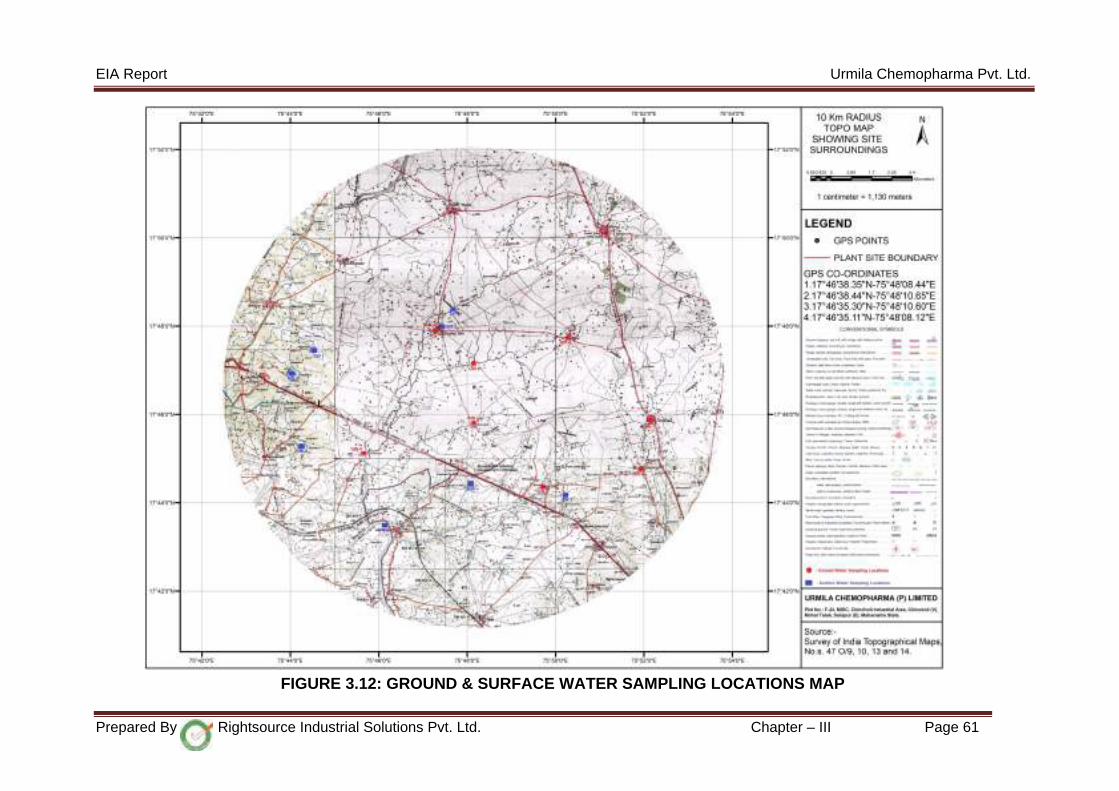
EIA Report Urmila Chemopharma Pvt. Ltd.
FIGURE 3.12: GROUND & SURFACE WATER SAMPLING LOCATIONS MAP
Prepared By Rightsource Industrial Solutions Pvt. Ltd. Chapter – III Page 61

EIA Report Urmila Chemopharma Pvt. Ltd.
TABLE 3.17: GROUND WATER QUALITY IN THE STUDY AREA
S. No Parameter Method Unit GW1 GW2 GW3 GW4 IS 10500 Limits
Acceptable Permissible 1 pH APHA 22nd Edition 4500 H+ B -- 7.53 7.34 7.46 7.70 6.5-8.5 No Relaxation 2 Color APHA 22nd Edition 2120 B CU <1.0 < 1.0 <1.0 <1.0 5 15
3 Total Dissolved Solids APHA 22nd Edition 2540 C mg/l 765 842 420 712 500 2000
4 Total Alkalinity (as CaCO3) APHA 22nd Edition 2320 B mg/l 350 390 230 340 200 600 5 Total Hardness (as CaCO3) APHA 22nd Edition 2340 C mg/l 356 377 217 346 200 600 6 Calcium (as Ca ) APHA 22nd Edition 3500 Ca B mg/l 75.0 72.0 42.5 64.2 75 200 7 Magnesium (as Mg) APHA 22nd Edition 3500-Mg B mg/l 41.0 48.0 25.4 45.0 30 100 8 Sulphate (as SO4) APHA 22nd Edition 4500 SO4 E mg/l 62.0 120.0 16.8 56.8 200 400 9 Chloride (as Cl) APHA 22nd Edition 4500 Cl- B mg/l 102 182 48 150 250 1000 10 Lead as Pb APHA 22nd Edition 3111B mg/l < 0.01 < 0.01 < 0.01 < 0.01 0.01 No Relaxation
11 Cadmium as Cd APHA 22nd Edition 3111B mg/l <0.01 < 0.01 < 0.01 < 0.01 0.003 No Relaxation
12 Total Chromium as Cr APHA 22nd Edition 3111B mg/l <0.05 < 0.05 < 0.05 < 0.05 0.05 No Relaxation 13 Copper as Cu APHA 22nd Edition 3111B mg/l < 0.01 < 0.01 < 0.01 < 0.01 0.05 1.5 14 Zinc as Zn APHA 22nd Edition 3111B mg/l < 0.5 < 0.5 < 0.5 < 0.5 5 15 15 Nickel as Ni APHA 22nd Edition 3111B mg/l <0.01 < 0.01 < 0.01 < 0.01 0.02 No Relaxation 16 Fluorides as F APHA 22nd Edition 4500 F- D mg/l < 0.5 < 0.5 < 0.5 < 0.5 1 1.5 17 Aluminium as Al APHA 22nd Edition 3500 Al B mg/l <0.03 < 0.03 < 0.03 < 0.03 0.03 0.2 18 Boron as B APHA 22nd Edition 4500 B B mg/l <0.2 <0.2 <0.2 <0.2 0.5 1 19 Manganese as Mn APHA 22nd Edition 3111B mg/l <0.02 <0.02 < 0.02 < 0.02 0.1 0.3 20 Iron as Fe APHA 22nd Edition 3500 Fe B mg/l < 0.05 < 0.05 < 0.05 < 0.05 0.3 No Relaxation 21 Nitrate Nitrogen APHA 22nd Edition 4500 NO3 B mg/l 4.5 5.8 4.9 3.8 45 No Relaxation 22 Sodium as Na APHA 22nd Edition 3500 Na B mg/l 96.5 164 39.5 142 -- -- 23 Potassium as K APHA 22nd Edition 3500 K B mg/l < 5.0 <5.0 <5.0 <5.0 -- -- 24 Odour APHA 22nd Edition 2150 B -- Agreeable Agreeable Agreeable Agreeable -- --
25 Electrical Conductivity APHA 22nd Edition 2510 B μmho/cm 1125 1295 692 1095 -- --
26 Phosphorus as P APHA 22nd Edition 4500 P C mg/l 0.85 1.80 0.74 0.55 -- --
Prepared By Rightsource Industrial Solutions Pvt. Ltd. Chapter – III Page 62
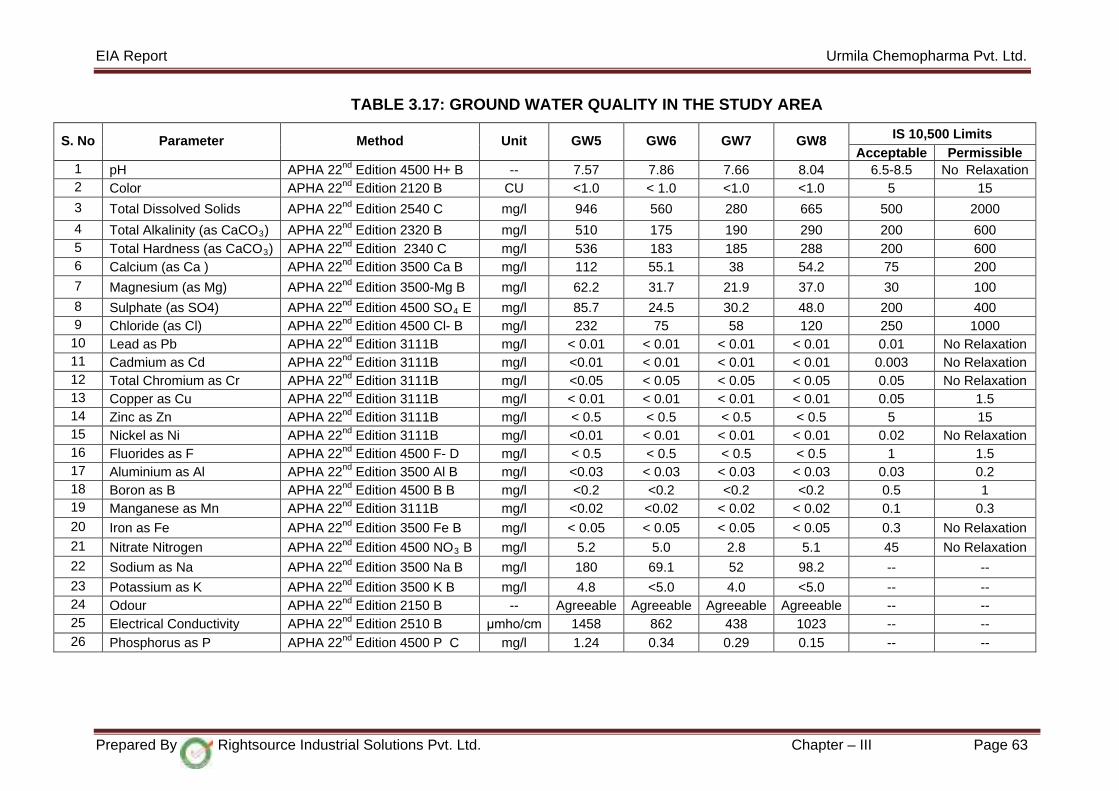
EIA Report Urmila Chemopharma Pvt. Ltd.
TABLE 3.17: GROUND WATER QUALITY IN THE STUDY AREA
S. No Parameter Method Unit GW5 GW6 GW7 GW8 IS 10,500 Limits Acceptable Permissible
1 pH APHA 22nd Edition 4500 H+ B -- 7.57 7.86 7.66 8.04 6.5-8.5 No Relaxation 2 Color APHA 22nd Edition 2120 B CU <1.0 < 1.0 <1.0 <1.0 5 15
3 Total Dissolved Solids APHA 22nd Edition 2540 C mg/l 946 560 280 665 500 2000
4 Total Alkalinity (as CaCO3) APHA 22nd Edition 2320 B mg/l 510 175 190 290 200 600 5 Total Hardness (as CaCO3) APHA 22nd Edition 2340 C mg/l 536 183 185 288 200 600 6 Calcium (as Ca ) APHA 22nd Edition 3500 Ca B mg/l 112 55.1 38 54.2 75 200 7 Magnesium (as Mg) APHA 22nd Edition 3500-Mg B mg/l 62.2 31.7 21.9 37.0 30 100 8 Sulphate (as SO4) APHA 22nd Edition 4500 SO4 E mg/l 85.7 24.5 30.2 48.0 200 400 9 Chloride (as Cl) APHA 22nd Edition 4500 Cl- B mg/l 232 75 58 120 250 1000 10 Lead as Pb APHA 22nd Edition 3111B mg/l < 0.01 < 0.01 < 0.01 < 0.01 0.01 No Relaxation 11 Cadmium as Cd APHA 22nd Edition 3111B mg/l <0.01 < 0.01 < 0.01 < 0.01 0.003 No Relaxation 12 Total Chromium as Cr APHA 22nd Edition 3111B mg/l <0.05 < 0.05 < 0.05 < 0.05 0.05 No Relaxation 13 Copper as Cu APHA 22nd Edition 3111B mg/l < 0.01 < 0.01 < 0.01 < 0.01 0.05 1.5 14 Zinc as Zn APHA 22nd Edition 3111B mg/l < 0.5 < 0.5 < 0.5 < 0.5 5 15 15 Nickel as Ni APHA 22nd Edition 3111B mg/l <0.01 < 0.01 < 0.01 < 0.01 0.02 No Relaxation 16 Fluorides as F APHA 22nd Edition 4500 F- D mg/l < 0.5 < 0.5 < 0.5 < 0.5 1 1.5 17 Aluminium as Al APHA 22nd Edition 3500 Al B mg/l <0.03 < 0.03 < 0.03 < 0.03 0.03 0.2 18 Boron as B APHA 22nd Edition 4500 B B mg/l <0.2 <0.2 <0.2 <0.2 0.5 1 19 Manganese as Mn APHA 22nd Edition 3111B mg/l <0.02 <0.02 < 0.02 < 0.02 0.1 0.3 20 Iron as Fe APHA 22nd Edition 3500 Fe B mg/l < 0.05 < 0.05 < 0.05 < 0.05 0.3 No Relaxation 21 Nitrate Nitrogen APHA 22nd Edition 4500 NO3 B mg/l 5.2 5.0 2.8 5.1 45 No Relaxation 22 Sodium as Na APHA 22nd Edition 3500 Na B mg/l 180 69.1 52 98.2 -- -- 23 Potassium as K APHA 22nd Edition 3500 K B mg/l 4.8 <5.0 4.0 <5.0 -- -- 24 Odour APHA 22nd Edition 2150 B -- Agreeable Agreeable Agreeable Agreeable -- -- 25 Electrical Conductivity APHA 22nd Edition 2510 B μmho/cm 1458 862 438 1023 -- -- 26 Phosphorus as P APHA 22nd Edition 4500 P C mg/l 1.24 0.34 0.29 0.15 -- --
Prepared By Rightsource Industrial Solutions Pvt. Ltd. Chapter – III Page 63
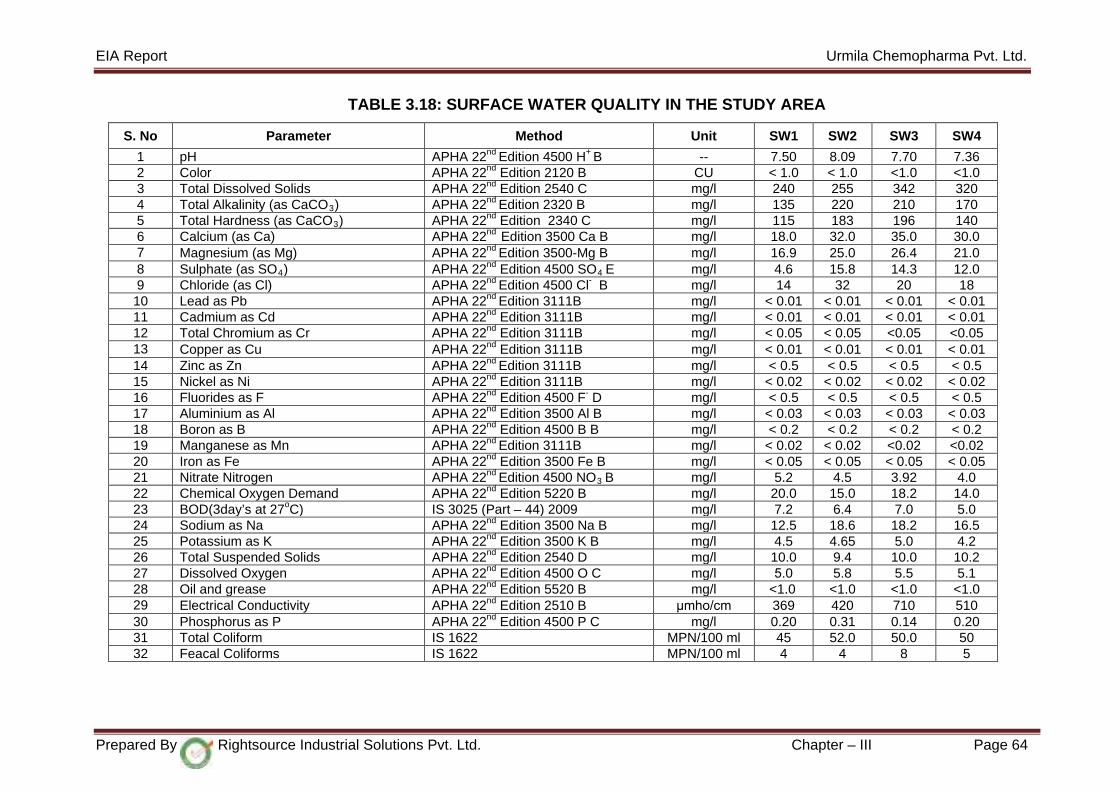
EIA Report Urmila Chemopharma Pvt. Ltd.
TABLE 3.18: SURFACE WATER QUALITY IN THE STUDY AREA
S. No Parameter Method Unit SW1 SW2 SW3 SW4
1 pH APHA 22nd Edition 4500 H+ B -- 7.50 8.09 7.70 7.36 2 Color APHA 22nd Edition 2120 B CU < 1.0 < 1.0 <1.0 <1.0 3 Total Dissolved Solids APHA 22nd Edition 2540 C mg/l 240 255 342 320 4 Total Alkalinity (as CaCO3) APHA 22nd Edition 2320 B mg/l 135 220 210 170 5 Total Hardness (as CaCO3) APHA 22nd Edition 2340 C mg/l 115 183 196 140 6 Calcium (as Ca) APHA 22nd Edition 3500 Ca B mg/l 18.0 32.0 35.0 30.0 7 Magnesium (as Mg) APHA 22nd Edition 3500-Mg B mg/l 16.9 25.0 26.4 21.0 8 Sulphate (as SO4) APHA 22nd Edition 4500 SO4 E mg/l 4.6 15.8 14.3 12.0 9 Chloride (as Cl) APHA 22nd Edition 4500 Cl- B mg/l 14 32 20 18 10 Lead as Pb APHA 22nd Edition 3111B mg/l < 0.01 < 0.01 < 0.01 < 0.01 11 Cadmium as Cd APHA 22nd Edition 3111B mg/l < 0.01 < 0.01 < 0.01 < 0.01 12 Total Chromium as Cr APHA 22nd Edition 3111B mg/l < 0.05 < 0.05 <0.05 <0.05 13 Copper as Cu APHA 22nd Edition 3111B mg/l < 0.01 < 0.01 < 0.01 < 0.01 14 Zinc as Zn APHA 22nd Edition 3111B mg/l < 0.5 < 0.5 < 0.5 < 0.5 15 Nickel as Ni APHA 22nd Edition 3111B mg/l < 0.02 < 0.02 < 0.02 < 0.02 16 Fluorides as F APHA 22nd Edition 4500 F- D mg/l < 0.5 < 0.5 < 0.5 < 0.5 17 Aluminium as Al APHA 22nd Edition 3500 Al B mg/l < 0.03 < 0.03 < 0.03 < 0.03 18 Boron as B APHA 22nd Edition 4500 B B mg/l < 0.2 < 0.2 < 0.2 < 0.2 19 Manganese as Mn APHA 22nd Edition 3111B mg/l < 0.02 < 0.02 <0.02 <0.02 20 Iron as Fe APHA 22nd Edition 3500 Fe B mg/l < 0.05 < 0.05 < 0.05 < 0.05 21 Nitrate Nitrogen APHA 22nd Edition 4500 NO3 B mg/l 5.2 4.5 3.92 4.0 22 Chemical Oxygen Demand APHA 22nd Edition 5220 B mg/l 20.0 15.0 18.2 14.0 23 BOD(3day’s at 27oC) IS 3025 (Part – 44) 2009 mg/l 7.2 6.4 7.0 5.0 24 Sodium as Na APHA 22nd Edition 3500 Na B mg/l 12.5 18.6 18.2 16.5 25 Potassium as K APHA 22nd Edition 3500 K B mg/l 4.5 4.65 5.0 4.2 26 Total Suspended Solids APHA 22nd Edition 2540 D mg/l 10.0 9.4 10.0 10.2 27 Dissolved Oxygen APHA 22nd Edition 4500 O C mg/l 5.0 5.8 5.5 5.1 28 Oil and grease APHA 22nd Edition 5520 B mg/l <1.0 <1.0 <1.0 <1.0 29 Electrical Conductivity APHA 22nd Edition 2510 B μmho/cm 369 420 710 510 30 Phosphorus as P APHA 22nd Edition 4500 P C mg/l 0.20 0.31 0.14 0.20 31 Total Coliform IS 1622 MPN/100 ml 45 52.0 50.0 50 32 Feacal Coliforms IS 1622 MPN/100 ml 4 4 8 5
Prepared By Rightsource Industrial Solutions Pvt. Ltd. Chapter – III Page 64

EIA Report Urmila Chemopharma Pvt. Ltd.
TABLE 3.18: SURFACE WATER QUALITY IN THE STUDY AREA
S. No Parameter Method Unit SW5 SW6 SW7 SW8 1 pH APHA 22nd Edition 4500 H+ B -- 7.30 7.50 7.16 7.43 2 Color APHA 22nd Edition 2120 B CU < 1.0 < 1.0 <1.0 <1.0 3 Total Dissolved Solids APHA 22nd Edition 2540 C mg/l 210 205 428 640 4 Total Alkalinity (as CaCO3) APHA 22nd Edition 2320 B mg/l 170 100 150 200 5 Total Hardness (as CaCO3) APHA 22nd Edition 2340 C mg/l 163 117 156 193 6 Calcium (as Ca ) APHA 22nd Edition 3500 Ca B mg/l 30.0 29 30.5 28.0 7 Magnesium (as Mg) APHA 22nd Edition 3500-Mg B mg/l 21.5 10.9 19.4 30.0 8 Sulphate (as SO4) APHA 22nd Edition 4500 SO4 E mg/l 31.0 34.0 63.1 85.5 9 Chloride (as Cl) APHA 22nd Edition 4500 Cl- B mg/l 48 52 116 187 10 Lead as Pb APHA 22nd Edition 3111B mg/l < 0.01 < 0.01 < 0.01 < 0.01 11 Cadmium as Cd APHA 22nd Edition 3111B mg/l < 0.01 < 0.01 < 0.01 < 0.01 12 Total Chromium as Cr APHA 22nd Edition 3111B mg/l < 0.05 < 0.05 <0.05 <0.05 13 Copper as Cu APHA 22nd Edition 3111B mg/l < 0.01 < 0.01 < 0.01 < 0.01 14 Zinc as Zn APHA 22nd Edition 3111B mg/l < 0.5 < 0.5 < 0.5 < 0.5 15 Nickel as Ni APHA 22nd Edition 3111B mg/l < 0.02 < 0.02 < 0.02 < 0.02 16 Fluorides as F APHA 22nd Edition 4500 F- D mg/l < 0.5 < 0.5 < 0.5 < 0.5 17 Aluminium as Al APHA 22nd Edition 3500 Al B mg/l < 0.03 < 0.03 < 0.03 < 0.03 18 Boron as B APHA 22nd Edition 4500 B B mg/l < 0.2 < 0.2 < 0.2 < 0.2 19 Manganese as Mn APHA 22nd Edition 3111B mg/l < 0.02 < 0.02 <0.02 <0.02 20 Iron as Fe APHA 22nd Edition 3500 Fe B mg/l < 0.05 < 0.05 < 0.05 < 0.05 21 Nitrate Nitrogen APHA 22nd Edition 4500 NO3 B mg/l 3.28 5.2 5.0 5.6 22 Chemical Oxygen Demand APHA 22nd Edition 5220 B mg/l 16.0 12.0 18 25.0 23 BOD(3day’s at 27oC) IS 3025 (Part – 44) 2009 mg/l 6.4 4.8 7.0 10.2 24 Sodium as Na APHA 22nd Edition 3500 Na B mg/l 42.0 44.0 89.0 168 25 Potassium as K APHA 22nd Edition 3500 K B mg/l 5.0 4.65 5.68 5.7 26 Total Suspended Solids APHA 22nd Edition 2540 D mg/l 10.1 10.3 10.0 10.2 27 Dissolved Oxygen APHA 22nd Edition 4500 O C mg/l 5.1 5.3 5.5 5.0 28 Oil and grease APHA 22nd Edition 5520 B mg/l <1.0 <1.0 <1.0 <1.0 29 Electrical Conductivity APHA 22nd Edition 2510 B μmho/cm 410 325 680 952 30 Phosphorus as P APHA 22nd Edition 4500 P C mg/l 0.14 0.11 0.16 0.10 31 Total Coliform IS 1622 MPN/100 ml 49 45 50 48 32 Feacal Coliforms IS 1622 MPN/100 ml 6 5 7 7
Prepared By Rightsource Industrial Solutions Pvt. Ltd. Chapter – III Page 65
EIA Report Urmila Chemopharma Pvt. Ltd.
A. Summary of Groundwater Samples within 10 Km Radius
• pH of the ground water samples collected was in the range between 7.34 –
8.04. All samples are below acceptable limits. Only drinking water samples
have fixed pH limit which is 6.5 -8.5 as per IS 10500-2012.
• The acceptable limits for total dissolved solids as per IS: 10500-2012 are 500
mg/l whereas the permissible limits in absence of alternate source are 2000
mg/l, beyond this palatability decreases and may cause gastro intestinal
irritation. Total dissolved solids in the ground water samples were in the range
between 280 – 946 mg/l. Two samples are below acceptable limit, six other
samples are above acceptable limit but below the permissible limit of 2000
mg/l.
• In the ground water samples collected from the study area, the Total hardness
was found to vary between 183 – 536 mg/l. All samples are well within the
permissible limit of 600 mg/l.
• The acceptable limit for chloride is 250 mg/l as per IS: 10500 whereas the
permissible limit of the same is 1000 mg/l beyond this limit taste, corrosion and
palatability are affected. The Chlorides concentration was found to vary
between 48 - 232 mg/l. All samples are below the acceptable limit.
• Fluoride is the other important parameter, which has the acceptable limit of 1
mg/l and permissible limit of 1.5 mg/l. Fluoride concentration in all samples are
found to be below acceptable limits.
• The Sulphates concentration was found to vary between 16.8 – 120 mg/l. All
the samples was found well within acceptable limit of 200 mg/l.
Ground water samples collected from eight locations within 10 km radius from the
plant site & analyzed as per standard methods of water and wastewater analysis
(APHA).
The water quality of the study area was found within the permissible limits of
IS10500 for parameters TDS, Total hardness, Sulphate, Chloride and Fluoride.
B. Summary of Surface Water Samples within 10 km Radius:
• pH of the water samples collected was in the range between 7.16 – 8.09.
• Total dissolved solids in the samples were in the range between 205 – 640
mg/l.
• Total hardness was found to be in the range of 115 – 196 mg/l.
Prepared By Rightsource Industrial Solutions Pvt. Ltd. Chapter – III Page 66
EIA Report Urmila Chemopharma Pvt. Ltd.
• Chlorides concentration was found to vary between 14 – 187 mg/l.
• Fluoride concentration was <0.5 mg/l.
• Sulphates concentration was found to vary between 4.6 – 85.5 mg/l.
3.6. NOISE ENVIRONMENT
Noise, often defined as unwanted sound, interferes with speech communication,
causes annoyance, distracts from work, and disturbs sleep thus deteriorating quality
of human environment. Noise levels in the study area have therefore been
measured, at selected points, to provide the baseline data to describe the existing
situation.
Measured noise levels displayed as a function of time provides a useful scheme for
describing the acoustical climate of a community. Noise levels records at each
station with a time interval of about one hour are computed for equivalent noise
levels. Equivalent noise level is a single number descriptor for describing time
varying noise levels.
3.6.1 Noise Monitoring Stations
In order to assess the noise levels in the study area, monitoring was carried out at
eight different locations within 10 km radius of the study area. The noise monitoring
locations are shown in Figure 3.13 and distances & directions of monitoring location
mentioned in Table 3.19. Noise levels were recorded and computed for equivalent
noise levels for day-equivalent, night-equivalent & day-night equivalent.
Sound Pressure Levels (SPL) measurements were recorded at eight locations. The
readings were taken for every hour for 24-hrs. The day noise levels have been
monitored during 6 am to 10 pm and night noise levels during 10 pm to 6 am at all
the locations covered in the study area.
The noise recording stations and the summary of the minimum, maximum, day -
equivalent, night - equivalent and day-night equivalent values computed for various
location in the study area is given in Table 3.20.
Prepared By Rightsource Industrial Solutions Pvt. Ltd. Chapter – III Page 67

EIA Report Urmila Chemopharma Pvt. Ltd.
TABLE 3.19: NOISE MONITORING LOCATIONS
Code Name of Sampling Location
Distance (km) w.r.t Project
Direction w.r.t Project
N1 Project Site - - N2 Chincholi 1.8 South N3 Darphal Bibi 2.5 NNW
N4 Akolekati 3.9 NE
N5 Kondi 4.2 SSE N6 Pakni 5.4 SSW
N7 Sawaleshwar 5.2 WSW
N8 Karamba 6.9 East
Prepared By Rightsource Industrial Solutions Pvt. Ltd. Chapter – III Page 68
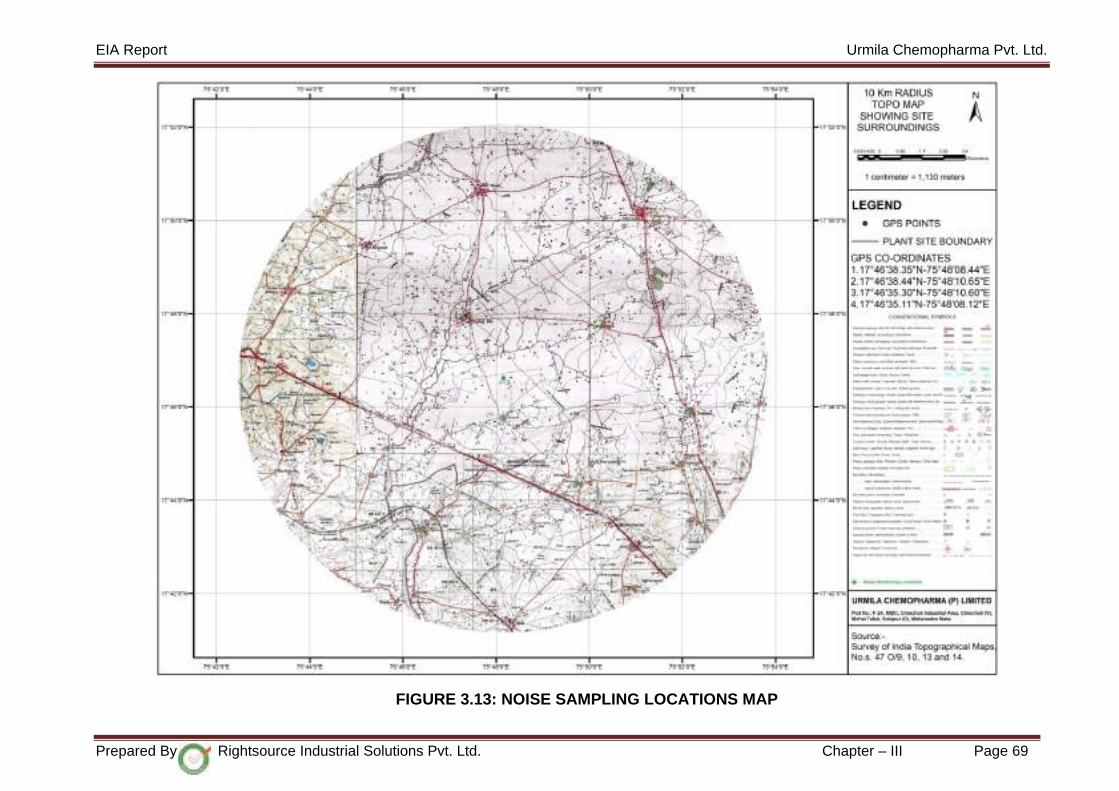
EIA Report Urmila Chemopharma Pvt. Ltd.
FIGURE 3.13: NOISE SAMPLING LOCATIONS MAP
Prepared By Rightsource Industrial Solutions Pvt. Ltd. Chapter – III Page 69
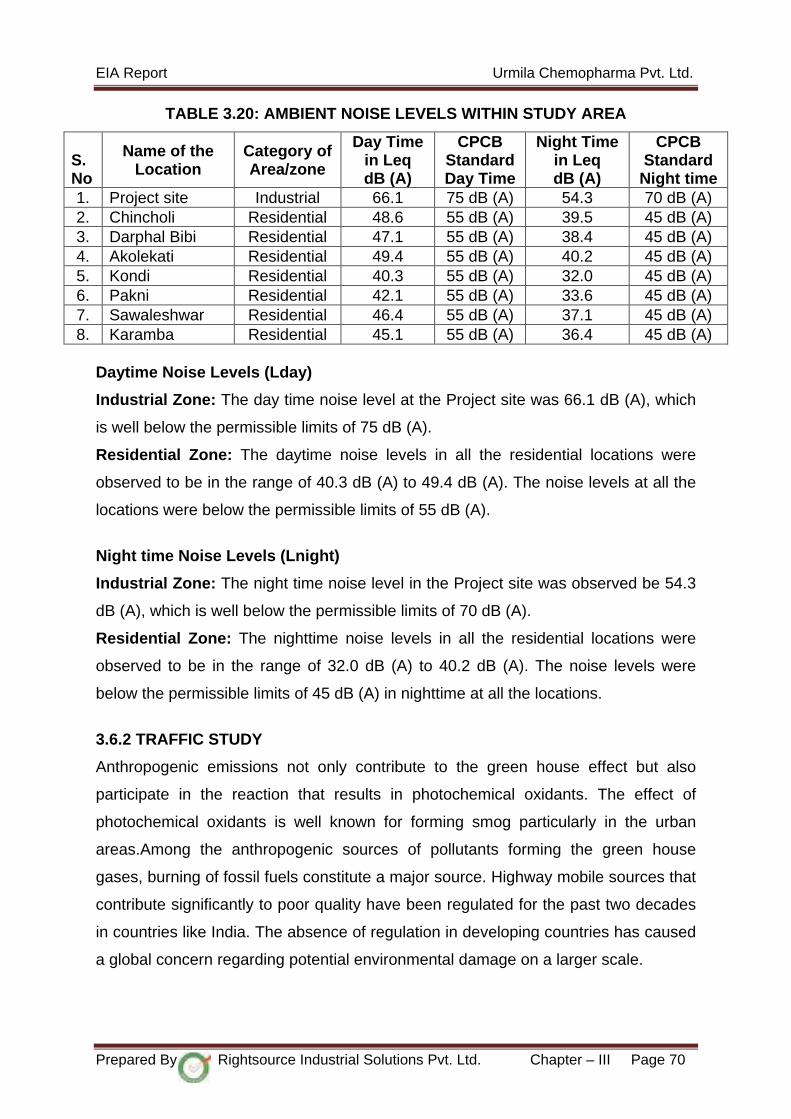
EIA Report Urmila Chemopharma Pvt. Ltd.
TABLE 3.20: AMBIENT NOISE LEVELS WITHIN STUDY AREA
S. No
Name of the Location
Category of Area/zone
Day Time in Leq dB (A)
CPCB Standard Day Time
Night Time in Leq dB (A)
CPCB Standard Night time
1. Project site Industrial 66.1 75 dB (A) 54.3 70 dB (A) 2. Chincholi Residential 48.6 55 dB (A) 39.5 45 dB (A) 3. Darphal Bibi Residential 47.1 55 dB (A) 38.4 45 dB (A) 4. Akolekati Residential 49.4 55 dB (A) 40.2 45 dB (A) 5. Kondi Residential 40.3 55 dB (A) 32.0 45 dB (A) 6. Pakni Residential 42.1 55 dB (A) 33.6 45 dB (A) 7. Sawaleshwar Residential 46.4 55 dB (A) 37.1 45 dB (A) 8. Karamba Residential 45.1 55 dB (A) 36.4 45 dB (A)
Daytime Noise Levels (Lday)
Industrial Zone: The day time noise level at the Project site was 66.1 dB (A), which
is well below the permissible limits of 75 dB (A).
Residential Zone: The daytime noise levels in all the residential locations were
observed to be in the range of 40.3 dB (A) to 49.4 dB (A). The noise levels at all the
locations were below the permissible limits of 55 dB (A).
Night time Noise Levels (Lnight)
Industrial Zone: The night time noise level in the Project site was observed be 54.3
dB (A), which is well below the permissible limits of 70 dB (A).
Residential Zone: The nighttime noise levels in all the residential locations were
observed to be in the range of 32.0 dB (A) to 40.2 dB (A). The noise levels were
below the permissible limits of 45 dB (A) in nighttime at all the locations.
3.6.2 TRAFFIC STUDY
Anthropogenic emissions not only contribute to the green house effect but also
participate in the reaction that results in photochemical oxidants. The effect of
photochemical oxidants is well known for forming smog particularly in the urban
areas.Among the anthropogenic sources of pollutants forming the green house
gases, burning of fossil fuels constitute a major source. Highway mobile sources that
contribute significantly to poor quality have been regulated for the past two decades
in countries like India. The absence of regulation in developing countries has caused
a global concern regarding potential environmental damage on a larger scale.
Prepared By Rightsource Industrial Solutions Pvt. Ltd. Chapter – III Page 70

EIA Report Urmila Chemopharma Pvt. Ltd.
The traffic survey was carried out on the NH-9 (Solapur to Pune Road) which is 3.3
km (SW) to the Project site. Vehicular traffic counts were performed on either side of
the studied roads to provide background values of traffic density, and correlate such
data to the levels of air pollution along the road. Vehicular traffic on these roads
included heavy vehicle, light vehicle, three wheelers, and two wheelers. The
additional traffic due to the project would also occur in this time duration only. A
summary of the data is presented in Table 3.21.
Prepared By Rightsource Industrial Solutions Pvt. Ltd. Chapter – III Page 71
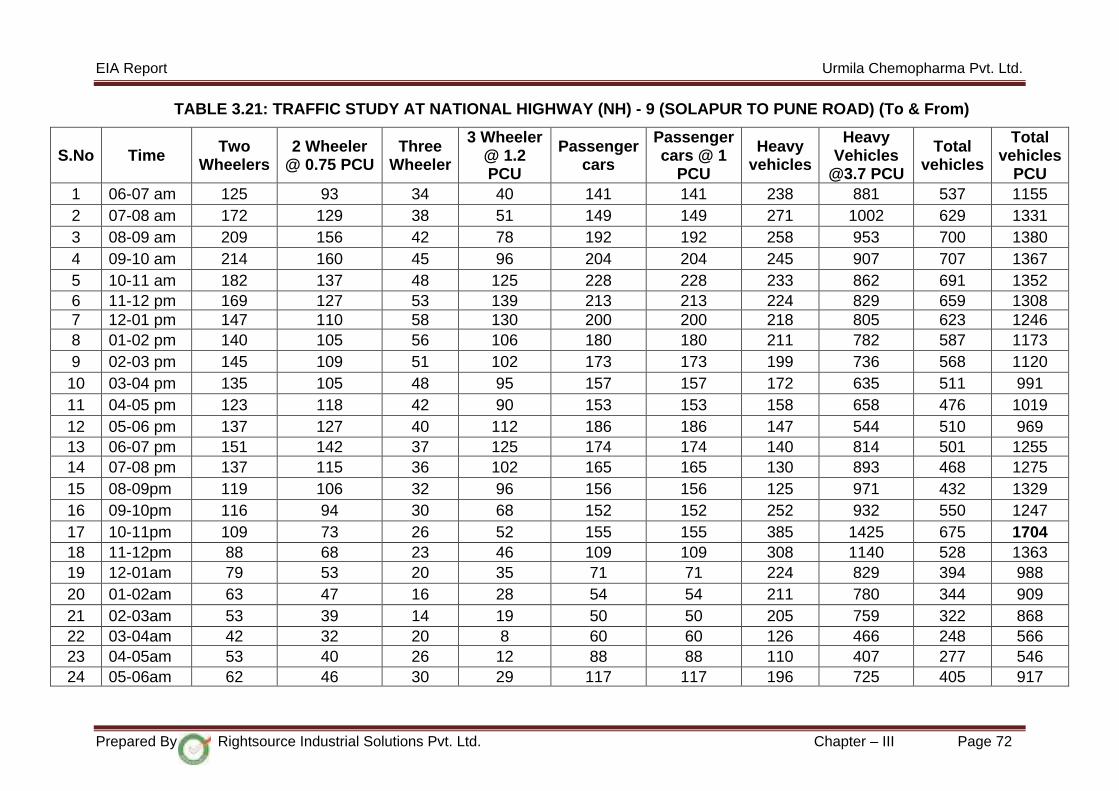
EIA Report Urmila Chemopharma Pvt. Ltd.
TABLE 3.21: TRAFFIC STUDY AT NATIONAL HIGHWAY (NH) - 9 (SOLAPUR TO PUNE ROAD) (To & From)
S.No Time Two Wheelers
2 Wheeler @ 0.75 PCU
Three Wheeler
3 Wheeler @ 1.2 PCU
Passenger cars
Passenger cars @ 1
PCU
Heavy vehicles
Heavy Vehicles
@3.7 PCU
Total vehicles
Total vehicles
PCU 1 06-07 am 125 93 34 40 141 141 238 881 537 1155 2 07-08 am 172 129 38 51 149 149 271 1002 629 1331 3 08-09 am 209 156 42 78 192 192 258 953 700 1380 4 09-10 am 214 160 45 96 204 204 245 907 707 1367 5 10-11 am 182 137 48 125 228 228 233 862 691 1352 6 11-12 pm 169 127 53 139 213 213 224 829 659 1308 7 12-01 pm 147 110 58 130 200 200 218 805 623 1246 8 01-02 pm 140 105 56 106 180 180 211 782 587 1173 9 02-03 pm 145 109 51 102 173 173 199 736 568 1120 10 03-04 pm 135 105 48 95 157 157 172 635 511 991 11 04-05 pm 123 118 42 90 153 153 158 658 476 1019 12 05-06 pm 137 127 40 112 186 186 147 544 510 969 13 06-07 pm 151 142 37 125 174 174 140 814 501 1255 14 07-08 pm 137 115 36 102 165 165 130 893 468 1275 15 08-09pm 119 106 32 96 156 156 125 971 432 1329 16 09-10pm 116 94 30 68 152 152 252 932 550 1247 17 10-11pm 109 73 26 52 155 155 385 1425 675 1704 18 11-12pm 88 68 23 46 109 109 308 1140 528 1363 19 12-01am 79 53 20 35 71 71 224 829 394 988 20 01-02am 63 47 16 28 54 54 211 780 344 909 21 02-03am 53 39 14 19 50 50 205 759 322 868 22 03-04am 42 32 20 8 60 60 126 466 248 566 23 04-05am 53 40 26 12 88 88 110 407 277 546 24 05-06am 62 46 30 29 117 117 196 725 405 917
Prepared By Rightsource Industrial Solutions Pvt. Ltd. Chapter – III Page 72

EIA Report Urmila Chemopharma Pvt. Ltd.
The highest peak observed during 10 pm to 11 pm (worst Scenario) PCU/hr 1704 Total width of the Road in meters (Arterial Road) 24 Carrying capacity of the road (the road is 4 lane Divided 2 way road) As per IRC:106-1990 (PCU’s per hour) 3600 Existing V/C Ratio 0.47
LOS=Level of Service (Existing) V/C LOS Performance
0.0-0.2 A Excellent 0.2-0.4 B Very Good 0.4-0.6 C Good 0.6-0.8 D Fair/Average 0.8-1.0 E Poor
1.0 & above F Very Poor Note: *As per IRC Guidelines 1990
The traffic survey was carried out on the NH-9 (Solapur to Pune Road) which is 3.3 Km (SW) to the Project site. The details of the
vehicles movement recorded. From the study it is observed that there is no major impact on traffic due to the proposed project.
Prepared By Rightsource Industrial Solutions Pvt. Ltd. Chapter – III Page 73
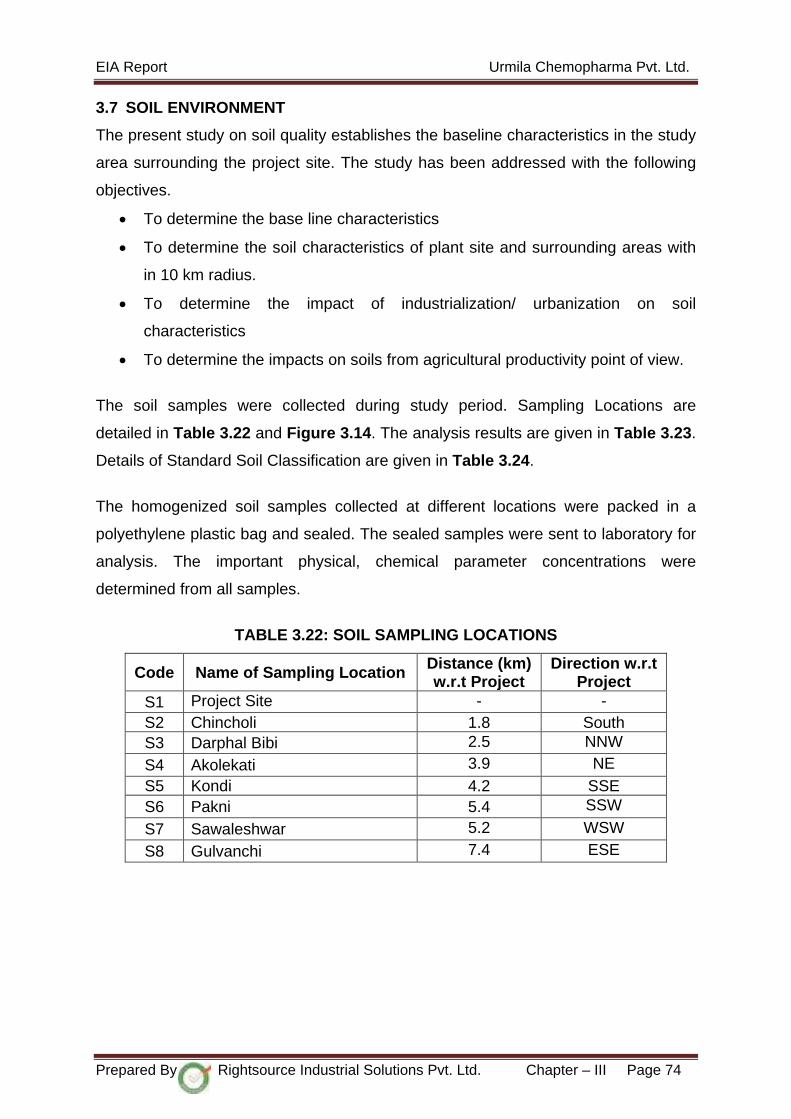
EIA Report Urmila Chemopharma Pvt. Ltd.
3.7 SOIL ENVIRONMENT
The present study on soil quality establishes the baseline characteristics in the study
area surrounding the project site. The study has been addressed with the following
objectives.
• To determine the base line characteristics
• To determine the soil characteristics of plant site and surrounding areas with
in 10 km radius.
• To determine the impact of industrialization/ urbanization on soil
characteristics
• To determine the impacts on soils from agricultural productivity point of view.
The soil samples were collected during study period. Sampling Locations are
detailed in Table 3.22 and Figure 3.14. The analysis results are given in Table 3.23.
Details of Standard Soil Classification are given in Table 3.24.
The homogenized soil samples collected at different locations were packed in a
polyethylene plastic bag and sealed. The sealed samples were sent to laboratory for
analysis. The important physical, chemical parameter concentrations were
determined from all samples.
TABLE 3.22: SOIL SAMPLING LOCATIONS
Code Name of Sampling Location Distance (km) w.r.t Project
Direction w.r.t Project
S1 Project Site - - S2 Chincholi 1.8 South S3 Darphal Bibi 2.5 NNW
S4 Akolekati 3.9 NE S5 Kondi 4.2 SSE S6 Pakni 5.4 SSW
S7 Sawaleshwar 5.2 WSW
S8 Gulvanchi 7.4 ESE
Prepared By Rightsource Industrial Solutions Pvt. Ltd. Chapter – III Page 74

EIA Report Urmila Chemopharma Pvt. Ltd.
FIGURE 3.14: SOIL SAMPLING LOCATIONS MAP
Prepared By Rightsource Industrial Solutions Pvt. Ltd. Chapter – III Page 75
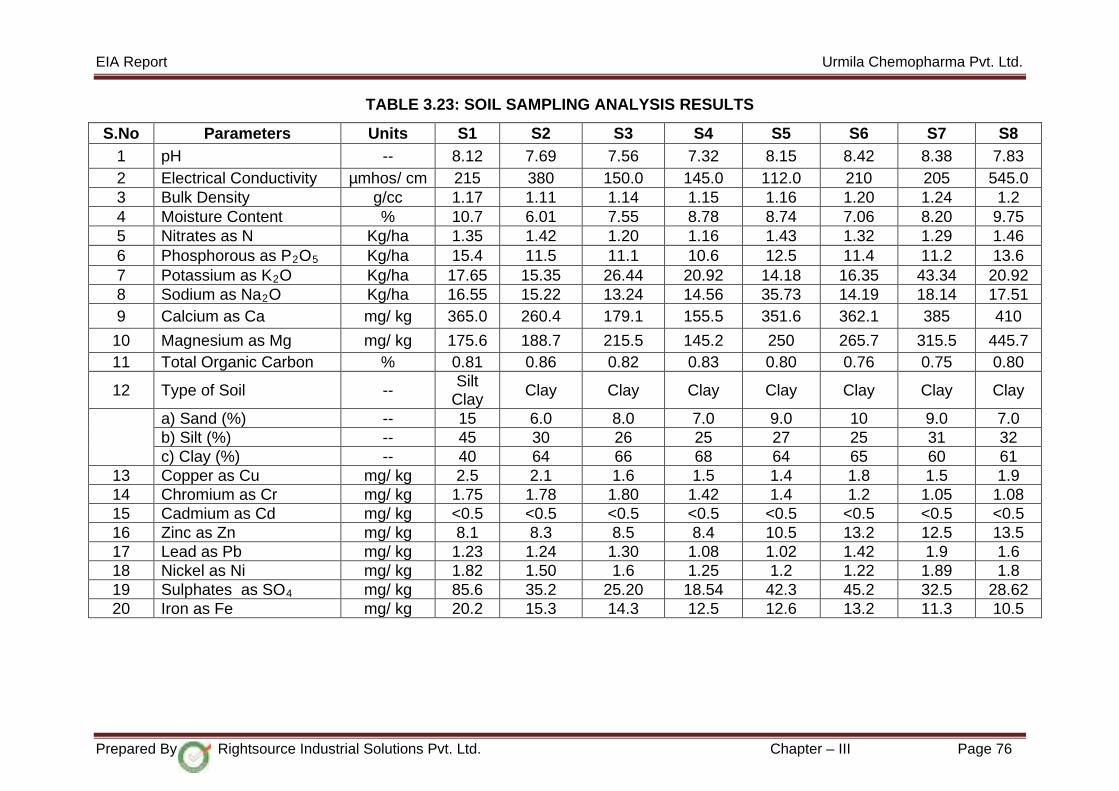
EIA Report Urmila Chemopharma Pvt. Ltd.
TABLE 3.23: SOIL SAMPLING ANALYSIS RESULTS
S.No Parameters Units S1 S2 S3 S4 S5 S6 S7 S8 1 pH -- 8.12 7.69 7.56 7.32 8.15 8.42 8.38 7.83 2 Electrical Conductivity µmhos/ cm 215 380 150.0 145.0 112.0 210 205 545.0 3 Bulk Density g/cc 1.17 1.11 1.14 1.15 1.16 1.20 1.24 1.2 4 Moisture Content % 10.7 6.01 7.55 8.78 8.74 7.06 8.20 9.75 5 Nitrates as N Kg/ha 1.35 1.42 1.20 1.16 1.43 1.32 1.29 1.46 6 Phosphorous as P2O5 Kg/ha 15.4 11.5 11.1 10.6 12.5 11.4 11.2 13.6 7 Potassium as K2O Kg/ha 17.65 15.35 26.44 20.92 14.18 16.35 43.34 20.92 8 Sodium as Na2O Kg/ha 16.55 15.22 13.24 14.56 35.73 14.19 18.14 17.51 9 Calcium as Ca mg/ kg 365.0 260.4 179.1 155.5 351.6 362.1 385 410
10 Magnesium as Mg mg/ kg 175.6 188.7 215.5 145.2 250 265.7 315.5 445.7 11 Total Organic Carbon % 0.81 0.86 0.82 0.83 0.80 0.76 0.75 0.80
12 Type of Soil -- Silt Clay Clay Clay Clay Clay Clay Clay Clay
a) Sand (%) -- 15 6.0 8.0 7.0 9.0 10 9.0 7.0 b) Silt (%) -- 45 30 26 25 27 25 31 32 c) Clay (%) -- 40 64 66 68 64 65 60 61
13 Copper as Cu mg/ kg 2.5 2.1 1.6 1.5 1.4 1.8 1.5 1.9 14 Chromium as Cr mg/ kg 1.75 1.78 1.80 1.42 1.4 1.2 1.05 1.08 15 Cadmium as Cd mg/ kg <0.5 <0.5 <0.5 <0.5 <0.5 <0.5 <0.5 <0.5 16 Zinc as Zn mg/ kg 8.1 8.3 8.5 8.4 10.5 13.2 12.5 13.5 17 Lead as Pb mg/ kg 1.23 1.24 1.30 1.08 1.02 1.42 1.9 1.6 18 Nickel as Ni mg/ kg 1.82 1.50 1.6 1.25 1.2 1.22 1.89 1.8 19 Sulphates as SO4 mg/ kg 85.6 35.2 25.20 18.54 42.3 45.2 32.5 28.62 20 Iron as Fe mg/ kg 20.2 15.3 14.3 12.5 12.6 13.2 11.3 10.5
Prepared By Rightsource Industrial Solutions Pvt. Ltd. Chapter – III Page 76
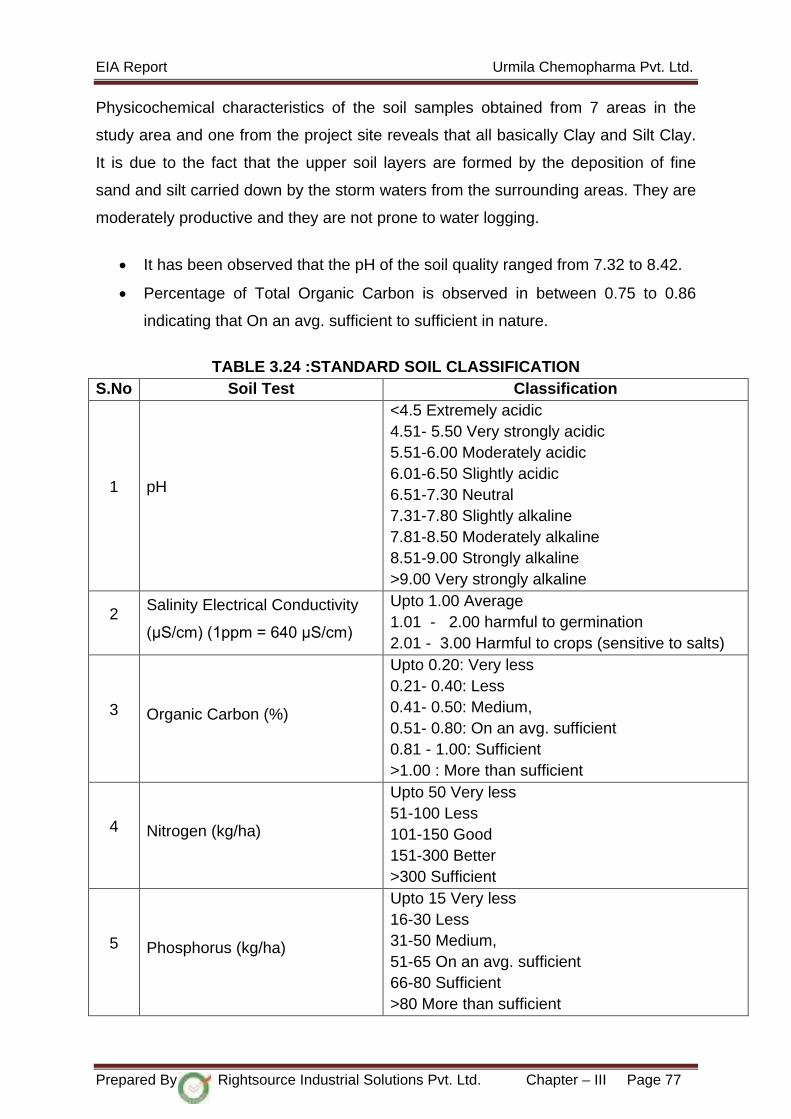
EIA Report Urmila Chemopharma Pvt. Ltd.
Physicochemical characteristics of the soil samples obtained from 7 areas in the
study area and one from the project site reveals that all basically Clay and Silt Clay.
It is due to the fact that the upper soil layers are formed by the deposition of fine
sand and silt carried down by the storm waters from the surrounding areas. They are
moderately productive and they are not prone to water logging.
• It has been observed that the pH of the soil quality ranged from 7.32 to 8.42.
• Percentage of Total Organic Carbon is observed in between 0.75 to 0.86
indicating that On an avg. sufficient to sufficient in nature.
TABLE 3.24 :STANDARD SOIL CLASSIFICATION
S.No Soil Test Classification
1 pH
<4.5 Extremely acidic 4.51- 5.50 Very strongly acidic 5.51-6.00 Moderately acidic 6.01-6.50 Slightly acidic 6.51-7.30 Neutral 7.31-7.80 Slightly alkaline 7.81-8.50 Moderately alkaline 8.51-9.00 Strongly alkaline >9.00 Very strongly alkaline
2 Salinity Electrical Conductivity
(μS/cm) (1ppm = 640 μS/cm)
Upto 1.00 Average 1.01 - 2.00 harmful to germination 2.01 - 3.00 Harmful to crops (sensitive to salts)
3 Organic Carbon (%)
Upto 0.20: Very less 0.21- 0.40: Less 0.41- 0.50: Medium, 0.51- 0.80: On an avg. sufficient 0.81 - 1.00: Sufficient >1.00 : More than sufficient
4 Nitrogen (kg/ha)
Upto 50 Very less 51-100 Less 101-150 Good 151-300 Better >300 Sufficient
5 Phosphorus (kg/ha)
Upto 15 Very less 16-30 Less 31-50 Medium, 51-65 On an avg. sufficient 66-80 Sufficient >80 More than sufficient
Prepared By Rightsource Industrial Solutions Pvt. Ltd. Chapter – III Page 77
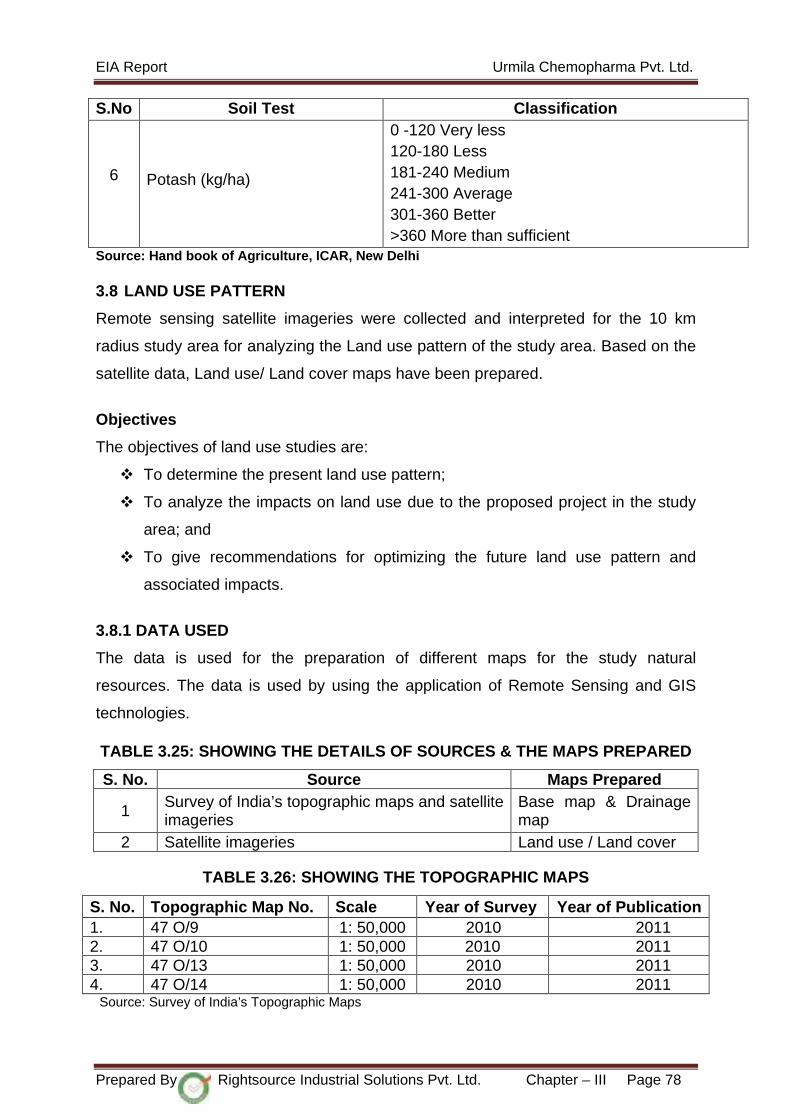
EIA Report Urmila Chemopharma Pvt. Ltd.
S.No Soil Test Classification
6 Potash (kg/ha)
0 -120 Very less 120-180 Less 181-240 Medium 241-300 Average 301-360 Better >360 More than sufficient
Source: Hand book of Agriculture, ICAR, New Delhi 3.8 LAND USE PATTERN
Remote sensing satellite imageries were collected and interpreted for the 10 km
radius study area for analyzing the Land use pattern of the study area. Based on the
satellite data, Land use/ Land cover maps have been prepared.
Objectives
The objectives of land use studies are:
To determine the present land use pattern;
To analyze the impacts on land use due to the proposed project in the study
area; and
To give recommendations for optimizing the future land use pattern and
associated impacts.
3.8.1 DATA USED
The data is used for the preparation of different maps for the study natural
resources. The data is used by using the application of Remote Sensing and GIS
technologies.
TABLE 3.25: SHOWING THE DETAILS OF SOURCES & THE MAPS PREPARED
S. No. Source Maps Prepared
1 Survey of India’s topographic maps and satellite imageries
Base map & Drainage map
2 Satellite imageries Land use / Land cover
TABLE 3.26: SHOWING THE TOPOGRAPHIC MAPS
S. No. Topographic Map No. Scale Year of Survey Year of Publication 1. 47 O/9 1: 50,000 2010 2011 2. 47 O/10 1: 50,000 2010 2011 3. 47 O/13 1: 50,000 2010 2011 4. 47 O/14 1: 50,000 2010 2011 Source: Survey of India’s Topographic Maps
Prepared By Rightsource Industrial Solutions Pvt. Ltd. Chapter – III Page 78
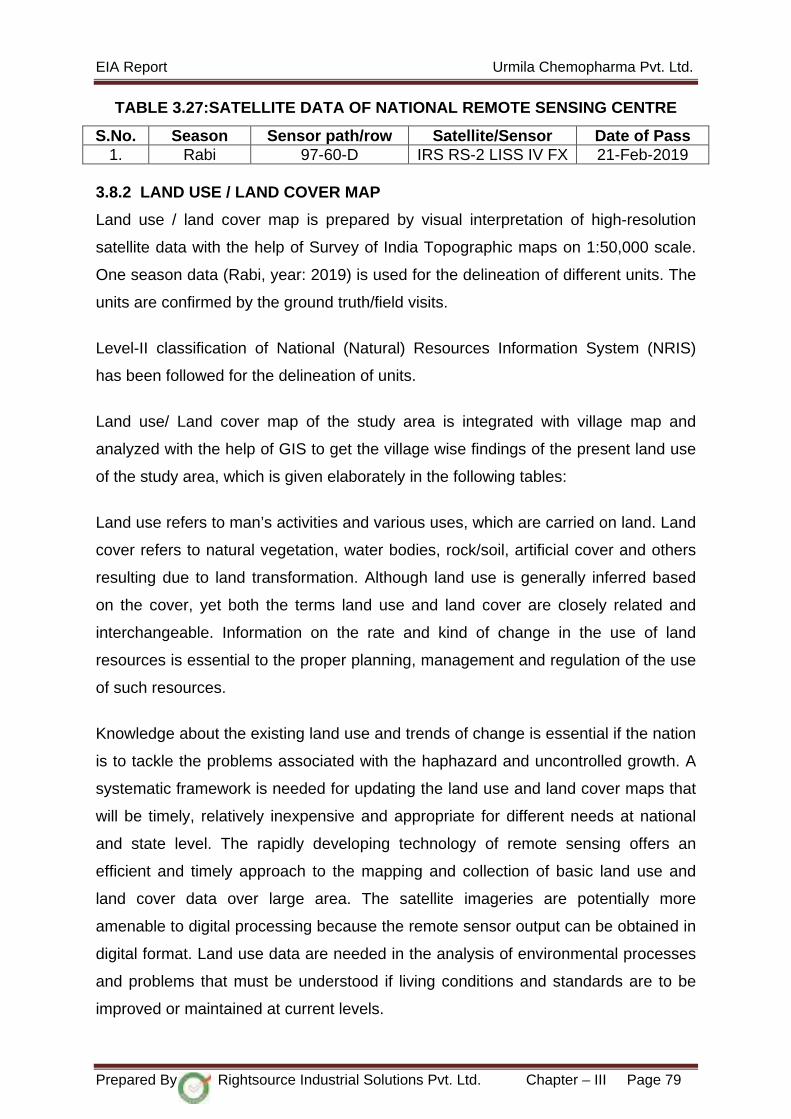
EIA Report Urmila Chemopharma Pvt. Ltd.
TABLE 3.27:SATELLITE DATA OF NATIONAL REMOTE SENSING CENTRE
S.No. Season Sensor path/row Satellite/Sensor Date of Pass 1. Rabi 97-60-D IRS RS-2 LISS IV FX 21-Feb-2019
3.8.2 LAND USE / LAND COVER MAP
Land use / land cover map is prepared by visual interpretation of high-resolution
satellite data with the help of Survey of India Topographic maps on 1:50,000 scale.
One season data (Rabi, year: 2019) is used for the delineation of different units. The
units are confirmed by the ground truth/field visits.
Level-II classification of National (Natural) Resources Information System (NRIS)
has been followed for the delineation of units.
Land use/ Land cover map of the study area is integrated with village map and
analyzed with the help of GIS to get the village wise findings of the present land use
of the study area, which is given elaborately in the following tables:
Land use refers to man’s activities and various uses, which are carried on land. Land
cover refers to natural vegetation, water bodies, rock/soil, artificial cover and others
resulting due to land transformation. Although land use is generally inferred based
on the cover, yet both the terms land use and land cover are closely related and
interchangeable. Information on the rate and kind of change in the use of land
resources is essential to the proper planning, management and regulation of the use
of such resources.
Knowledge about the existing land use and trends of change is essential if the nation
is to tackle the problems associated with the haphazard and uncontrolled growth. A
systematic framework is needed for updating the land use and land cover maps that
will be timely, relatively inexpensive and appropriate for different needs at national
and state level. The rapidly developing technology of remote sensing offers an
efficient and timely approach to the mapping and collection of basic land use and
land cover data over large area. The satellite imageries are potentially more
amenable to digital processing because the remote sensor output can be obtained in
digital format. Land use data are needed in the analysis of environmental processes
and problems that must be understood if living conditions and standards are to be
improved or maintained at current levels.
Prepared By Rightsource Industrial Solutions Pvt. Ltd. Chapter – III Page 79

EIA Report Urmila Chemopharma Pvt. Ltd.
3.8.2.1 Basic Concepts of Land Use
Clawson has given nine major ideas or concepts about land. These are:
Location or the relation of a specific parcel of land to the poles, the equator,
and the major oceans and landmasses. There is also relationship between
various tracts of land, as well as a political location.
Activity on the land, for what purpose this piece of land or tract is used.
Natural qualities of land, including its surface and subsurface characteristics
and its vegetative cover.
Improvements to and on the land. This is closely related to the activity.
Intensity of land use or amount of activity per unit area.
Land tenure, i.e. who owns the land, which uses it.
Land prices, land market activity and credit as applied to land.
Interrelations between activities on the land and other economic and social
activities.
Interrelations in the use between different tracts of land.
3.8.2.2 Methodology for land use / land cover mapping
The land use / land cover map is prepared by adopting the interpretation techniques
of the image in conjunction with collateral data such as Survey of India topographical
maps and census records. Image classification can be done by using visual
interpretation techniques and digital classification using any of the image processing
software. For the present study, ERDAS 9.1 version software is used for
preprocessing, rectification, enhancements and classifying the satellite data for
preparation of land use land cover map for assessing and monitoring the temporal
changes in land use land cover and land developmental activities.
The imagery is interpreted and ground checked for corrections. The final map is
prepared after field check. Flow chart showing the methodology adopted is given in
the different land use / land cover categories in the study area has been carried out
based on the NRSC land use / land cover classification system.
For analysis and interpretation, and preparation of LU / LC map, two types of data
are needed:
1. Basic data 2. Ground data
Prepared By Rightsource Industrial Solutions Pvt. Ltd. Chapter – III Page 80
EIA Report Urmila Chemopharma Pvt. Ltd.
1. Basic data includes:
Fused data of LISS IV
Toposheets on 1 : 50,000
Local knowledge
Area map on any scale to transfer details
Reports and other literature of the study area
2. Ground data: Ground data is very much essential to verify and to increase the
accuracy of the interpreted classes and also to minimize the field work.
Data analysis: For analysis and interpretation of satellite data, the study can be
divided into three parts:
• Preliminary work
• Field work
• Post field work
A. Preliminary work includes:
• to see the limitation of satellite data
• to lay down the criteria for land use classification to be adopted
• to fix the size of mapping units, which depends upon the scale
• interpretation of different land use/land cover classes
• demarcation of doubtful areas
• preparation of field land use/land cover map
B. Field work:
• Type of ground data to be collected
• Selection of sample area for final classification
• Checking of doubtful areas
• Change in land use/ land cover due to wrong identification, fresh
development, nomenclature.
• General verification
C. Post field work:
• Reinterpretation or analysis or correction of doubtful areas
• Transfer of details on base map
• Marginal information
Prepared By Rightsource Industrial Solutions Pvt. Ltd. Chapter – III Page 81
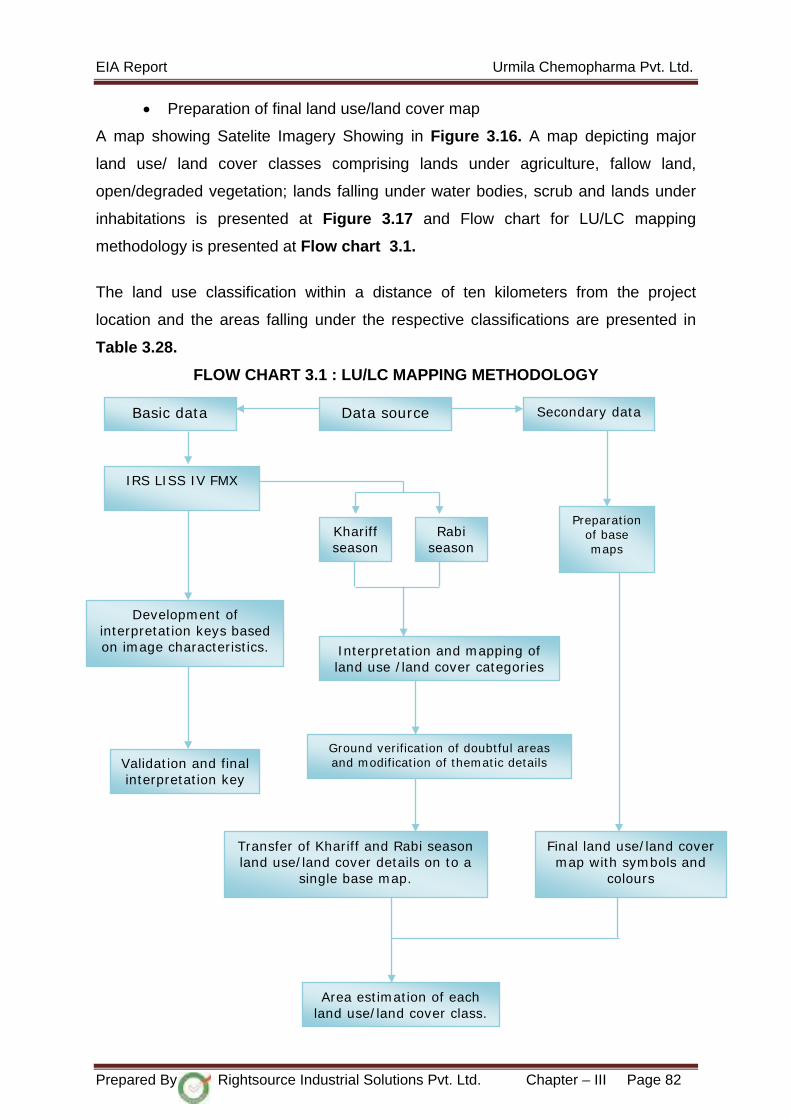
EIA Report Urmila Chemopharma Pvt. Ltd.
• Preparation of final land use/land cover map
A map showing Satelite Imagery Showing in Figure 3.16. A map depicting major
land use/ land cover classes comprising lands under agriculture, fallow land,
open/degraded vegetation; lands falling under water bodies, scrub and lands under
inhabitations is presented at Figure 3.17 and Flow chart for LU/LC mapping
methodology is presented at Flow chart 3.1.
The land use classification within a distance of ten kilometers from the project
location and the areas falling under the respective classifications are presented in
Table 3.28.
FLOW CHART 3.1 : LU/LC MAPPING METHODOLOGY
Basic data
Data source
IRS LISS IV FMX
Khariff season
Rabi season
Preparation of base maps
Interpretation and mapping of land use /land cover categories
Ground verification of doubtful areas and modification of thematic details
Transfer of Khariff and Rabi season land use/land cover details on to a
single base map.
Area estimation of each land use/land cover class.
Final land use/land cover map with symbols and
colours
Development of interpretation keys based on image characteristics.
Validation and final interpretation key
Secondary data
Prepared By Rightsource Industrial Solutions Pvt. Ltd. Chapter – III Page 82

EIA Report Urmila Chemopharma Pvt. Ltd.
TABLE 3.28: LAND USE / LAND COVER STATISTICS OF THE STUDY AREA
FIGURE 3.15: PIE DIAGRAM SHOWING LAND USE THE IN STUDY AREA
S. No. LANDUSE AREA (Sq. km) %
1. BUILT- UP LAND A. Settlements/ University B. Industrial area
9.106
21.352
2.9
6.8 2. WATERBODIES
A. Tank / River /Major canal etc.
11.932
3.8 3. CROP LAND
A. Single crop B. Double crop C. Plantation
134.706 86.664
2.826
42.9 27.6 0.9
4. WASTELANDS A. Land with scrub B. Land without scrub C. Sheet rock area
21.352 11.304
4.396
6.8 3.6 1.4
5. OTHERS A. Bird Sanctuary
10.362
3.3
TOTAL 314 100
Prepared By Rightsource Industrial Solutions Pvt. Ltd. Chapter – III Page 83

EIA Report Urmila Chemopharma Pvt. Ltd.
FIGURE 3.16: SATELLITE IMAGE OF THE STUDY AREA
Prepared By Rightsource Industrial Solutions Pvt. Ltd. Chapter – III Page 84

EIA Report Urmila Chemopharma Pvt. Ltd.
FIGURE 3.17: LAND USE / LAND COVER MAP OF THE STUDY AREA
Prepared By Rightsource Industrial Solutions Pvt. Ltd. Chapter – III Page 85

EIA Report Urmila Chemopharma Pvt. Ltd.
3.9 ECOLOGICAL ENVIRONMENT
Ecological studies are one of the important aspects of Environmental Impact
Assessment with a view to conserve environmental quality and biodiversity.
Ecological systems show complex inter-relationships between biotic and abiotic
components including dependence, competition and mutualism. Biotic components
comprise of both plant and animal communities, which interact not only within and
between themselves but also with the biotic components viz. physical and chemical
components of the environment.
Generally, biological communities are good indicators of climatic and edaphic
factors. Studies on biological aspects of ecosystems are important in Environmental
Impact Assessment for safety of natural flora and fauna. The biological environment
includes terrestrial and aquatic ecosystems.
Objectives of Ecological Studies
The present study was undertaken with the following objectives to assess both
terrestrial and aquatic habitats of the study area
To assess the nature and distribution of vegetation in and around the project site
• To assess the flora & fauna in the study area;
• To ascertain the migratory routes of fauna, presence of breeding grounds and
sensitive habitats in the study area, if any;
• To assess the presence of protected areas in the study area;
• To review the information from secondary sources and discuss the issues of
concern with the relevant authority and stakeholders;
• Impact prediction based on primary and secondary data sources to formulate
mitigation measures.
3.9.1 Detailed Description of Flora and Fauna
According to the Forest and Wildlife Department, the project site is located at an
aerial distance of 2.45 Km from the Great Indian Bustard Sanctuary (GIBS), Solapur.
The GIBS is one of those exclusive places in India which is the home to the Great
Indian Bustard (Ardeotis nigriceps). The GIBS was established in 1979 and it
spreads across an original area of 8,469 Sq Kms. This vast grassland attracts a few
migratory birds, along with the Great Indian Bustard. Also, the sanctuary has a good
Prepared By Rightsource Industrial Solutions Pvt. Ltd. Chapter – III Page 86
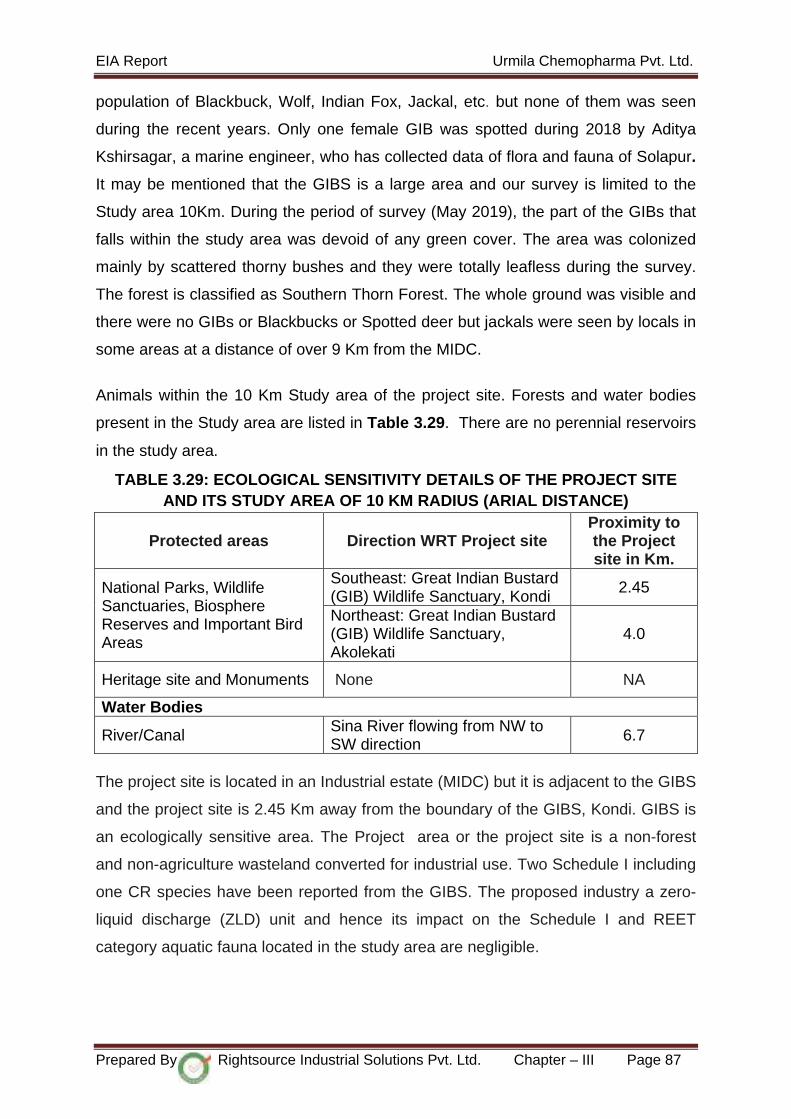
EIA Report Urmila Chemopharma Pvt. Ltd.
population of Blackbuck, Wolf, Indian Fox, Jackal, etc. but none of them was seen
during the recent years. Only one female GIB was spotted during 2018 by Aditya
Kshirsagar, a marine engineer, who has collected data of flora and fauna of Solapur.
It may be mentioned that the GIBS is a large area and our survey is limited to the
Study area 10Km. During the period of survey (May 2019), the part of the GIBs that
falls within the study area was devoid of any green cover. The area was colonized
mainly by scattered thorny bushes and they were totally leafless during the survey.
The forest is classified as Southern Thorn Forest. The whole ground was visible and
there were no GIBs or Blackbucks or Spotted deer but jackals were seen by locals in
some areas at a distance of over 9 Km from the MIDC.
Animals within the 10 Km Study area of the project site. Forests and water bodies
present in the Study area are listed in Table 3.29. There are no perennial reservoirs
in the study area.
TABLE 3.29: ECOLOGICAL SENSITIVITY DETAILS OF THE PROJECT SITE AND ITS STUDY AREA OF 10 KM RADIUS (ARIAL DISTANCE)
Protected areas Direction WRT Project site Proximity to the Project site in Km.
National Parks, Wildlife Sanctuaries, Biosphere Reserves and Important Bird Areas
Southeast: Great Indian Bustard (GIB) Wildlife Sanctuary, Kondi 2.45
Northeast: Great Indian Bustard (GIB) Wildlife Sanctuary, Akolekati
4.0
Heritage site and Monuments None NA
Water Bodies
River/Canal Sina River flowing from NW to SW direction 6.7
The project site is located in an Industrial estate (MIDC) but it is adjacent to the GIBS
and the project site is 2.45 Km away from the boundary of the GIBS, Kondi. GIBS is
an ecologically sensitive area. The Project area or the project site is a non-forest
and non-agriculture wasteland converted for industrial use. Two Schedule I including
one CR species have been reported from the GIBS. The proposed industry a zero-
liquid discharge (ZLD) unit and hence its impact on the Schedule I and REET
category aquatic fauna located in the study area are negligible.
Prepared By Rightsource Industrial Solutions Pvt. Ltd. Chapter – III Page 87

EIA Report Urmila Chemopharma Pvt. Ltd.
3.9.2 Vegetation and Flora of the Project area
Project area which is going to take the direct impacts of the proposed development
and it is the area which is owned by the project proponent and hence it is under his
control for implementation of EMP.
The project site is levelled and filled with transported soil. Owing to the clearance,
levelling and filling, most of the original and natural flora of the Project area was lost.
A list of plants found in the project site during the survey is given in Table 3.30.
TABLE 3.30: LIST OF PLANTS FOUND IN THE PROJECT SITE Scientific name Common or Local name Family Acacia leucophloea Safed Babul Mimosaceae Acacia nilotica Kala Babul Mimosaceae Calotropis procera Mandara / Rui / Aak Asclepiadaceae Capparis decidua Karel / Bare Caper Capparaceae Cassia auriculata Tarwad / Tanner’s Cassia Caesalpiniaceae Morinda pubescens Indian Mulberry Rubiaceae Prosopis juliflora Mesquite Mimosaceae Senna uniflora Single-leaf Senna Caesalpiniaceae Tephrosia purpurea Sharpankha / sarponk Fabaceae
Vegetation and flora of the Study area:
As summarized in Table 3.29, there are reserved forests within the 10 Km Study
area of the project and the GIBS is located in the same forest. Other than GIBS,
there no Wildlife Sanctuaries or National Parks or Biosphere reserves or other eco-
sensitive areas. The croplands were devoid of any vegetation cover owing to dry, hot
summer during the survey period. The flora of the Study area is represented mainly
by cultivated avenue trees and tropical thorn forests / scrub jungles. Many
ornamental shrubs and fruit trees were grown within the premises of the industries in
MIDC.
Forest vegetation and flora of the Study area
Great Indian Bustard Sanctuary (GIBS), established in 1979as the Jawaharlal Nehru
Bustard Sanctuary is a wildlife sanctuary for the great Indian bustard (Ardeotis
nigriceps) at Nannaj, near Solapur, Maharashtra, India is located in a drought-prone
and semi-arid rewgion. It is a part of the Kathiawar-Gir dry deciduous forests eco
region. The forest is an open tropical thorn forest. The species found in the GIBS
include Acacia leucophloea, Acacia nilotica,Prosopis juliflora, Albizia lebbeck,
Prepared By Rightsource Industrial Solutions Pvt. Ltd. Chapter – III Page 88

EIA Report Urmila Chemopharma Pvt. Ltd.
Gliricidia sepium, Dalbergia sissoo, Azadirachta indica, Hardwickia binata, Sapindus
emarginatus, Cassia auriculata , Capparis decidua, Morinda pubescens, Lantana
camara, Rhus mysorensis along with prominent grasses like a Aristida stocksii,
Chrysopogon fulvus, Heteropogon contortusand Melanocenchris jacquemontii,
Gliricidia sepium, Azadirachta indica, Azadirachta indica, Hardwickia binata,
Sapindus emarginatus, Bauhinia racemosaand Albizia lebbeck have been planted in
the forest gaps.
The forests of the study area can be classified under two sub groups namely 5A -
Southern tropical dry deciduous forests and 6A-Southern tropical thorn forests,as per
the classification of Champion and Seth (1968). They are mainly dry deciduous and
have scrub type vegetation. Thorny plants occur and tend to increase in proportion
with heavy grazing, to which most of the area is subjected. Prosopis juliflorawas the
easily the most abundant, dominant and widespread bush in all vacant sites in the
study area. A list of Trees, Shrubs and perennial climbers found in the Study area
are given in Table 3.31.
TABLE 3.31: LIST OF TREES, SHRUBS, PERENNIAL CLIMBERS AND PERENNIAL GRASSES FOUND IN THE STUDY AREA OF THE PROJECT SITE Botanical name Common / local name Family Acacia auriculiformis Australian wattle Mimosaceae Acacia catechu Khair Mimosaceae Acacia leucophloea Safed babul Mimosaceae Acacia nilotica Kala babul Mimosaceae Agave americana Agave Agavaceae Albizia lebbeck Siris Mimosaceae Alstonia scholaris Saptaparni Apocynaceae Annona squamosa Custard Apple / Seethaphal Annonaceae Anthocephalus cadamba Kadamb Rubiaceae Araucaria columnaris Christmas tree Araucariaceae
Aristida stocksii* Endemic to western part of peninsular India *
Poaceae
Artocarpus heterophyllus Jackfruit Moraceae Azadirachta indica Neem Meliaceae Bauhinia purpurea Kaniar / Purple Orchid Tree Caesalpiniaceae Bauhinia variegata Kanaraj / Kavidara/Kanchan Caesalpiniaceae Borassus flabellifer Taad / Toddy Palm Arecaceae Callistemon lanceolatus Indian bottle brush Tree Myrtaceae Calotropis gigantea Safed Aaak Asclepiadaceae
Prepared By Rightsource Industrial Solutions Pvt. Ltd. Chapter – III Page 89

EIA Report Urmila Chemopharma Pvt. Ltd.
Botanical name Common / local name Family Calotropis procera Mandara / Rui / Aak Asclepiadaceae Capparis decidua Karel / Bare Caper Capparaceae Carissa spinarum Karonda / Karvand Apocynaceae Cassia auriculata Tarwad / Tanners Cassia Caesalpiniaeae Cassia fistula Golden shower / Amaltas Caesalpiniaceae Cassia siamea Siamese Cassia / Kassod Caesalpiniaceae Chromolaena odorata Saim weed Asteraceae Chrysopogon fulvus Karni / Tugori Poaceae Citrua aurantifolia Orange Rutaceae Citrus limonum Lemon Rutaceae Citrus sinensis Sweet orange Rutaceae Cocos nucifera Coconut Arecaceae Combretum ovalifolium Rangoon creeper Combretaceae Dalbergia sissoo Sissoo Fabaceae Delonix regia Gulmohar Caesalpiniaceae Dendrocalamus strictus Bamboo Poaceae Dodonaea viscosa Lutchmi / Hop Bush Sapindaceae Erythrina variegata Pangara / Indian Coral Tree Fabaceae Erythrina suberosa Pangara / Corky Coral Tree Fabaceae Erythroxylon monogynum Red cedar Erythroxylaceae Eucalyptus tereticornis Eucalyptus Myrtaceae Euphorbia nivulia Malekalli Euphorbiaceae Ficus racemosa Cluster fig Moraceae Ficus benghalensis Banyan Tree Moraceae Ficus benjamina Weeping fig Moraceae Ficus hispida Hairy Fig Moraceae Ficus religiosa Peepal Tree / Bodhi Moraceae Gliricidia sepium Mexican Lilac Fabaceae Gmelina arborea Gamhar Verbenaceae Grevillea robusta Silver Oak Proteaceae Grewia tenax White Crossberry Tiliaceae Hardwickia binata Kamara / Anjan Caesalpiniaceae Heteropogon contortus Black Spear grass Poaceae Holoptelea integrifolia Ainasadada / Indian Elm Ulmaceae Ipomoea carnea Besharam Convolvulaceae Jacaranda mimosifolia Neeli Gulmohur Mimosaceae Jatropha curcas Jamal Ghota / Physic Nut Euphorbiaceae Jatropha gossypifolia Ratanjoti / Bellyache Bush Euphorbiaceae Kigelia pinnata Sausage Tree / Balam Khira Bignoniaceae Lagerstroemia speciosa Pride of India / Jarul Lythraceae Lantana camara Lantana / Tantani Verbenaceae
Prepared By Rightsource Industrial Solutions Pvt. Ltd. Chapter – III Page 90

EIA Report Urmila Chemopharma Pvt. Ltd.
Botanical name Common / local name Family Lodhopogon tridenta (Xenostegia tridentata)
Morga / Arrow leaf morning glory
Convolvulaceae
Mangifera indica Mango Anacardiaceae Manilkara zapota Sapota / Chikoo Sapotaceae Maytenus emarginata Henkal Celastraceae Melanocenchris jacquemontii
Desert black millet Poaceae
Melia dubia Malabar Neem Meliaceae Millingtonia hortensis Kaval Nimb / Indian Cork Tree Bignoniaceae Mimusops elengi Maulsari / Spanish Cherry Sapotaceae Morinda pubescens Indian Mulberry Rubiaceae Muntingia calabura Singapore Cherry Muntingiaceae Peltophorum pterocarpum Copper Pod / Peela Gulmohar Caesalpiniaceae Phoenix sylvestris Date Palm / Jungli Khajur Arecaceae Phyllanthus emblica Amla / Aonla Phyllanthaceae
Pithecellobium dulce Vilayatichinch / Manila Tamarind
Mimosaceae
Plumeria alba White Frangipani / Golenchi Apocynacae Plumeria rubra Red Frangipani / Golenchi Apocynacae Polyalthia longifolia Ashok / Devdar Annonaceae Polyalthia pendula Ashok / Devdar Annonaceae Pongamia pinnata Karanj Fabaceae Prosopis juliflora Mesquite Mimosaceae Prosopis spicigera Khejri Mimosaceae Psidium guajava Guava Myrtaceace Punica granatum Pomeganate Punicaceae Rhus mysorensis Ambone / Mysore Sumac Anacardiaceae Samanea saman Rain Tree Mimosaceae Sapindus emarginatus Soap nut tree Sapindaceae Sarcostemma acidium Leafless East Indian Wine Asclepiadaceae Spathodea campanulata African Tulip Tree / Rugtoora Bignoniaceae Syzygium cumini Jamun Myrtaceae Tamarindus indica Tamarind / Imli Caesalpiniaceae Tectona grandis Sagavan Verbenaceae Terminalia arjuna Arjun Combretaceae Terminalia catappa Almond Combretaceae Thespesia populnea Paras Pipal / Indian Tulip Tree Malvaceae Ziziphus mauritiana Ber /Indan Plum Rhamnaceae Ziziphus oenoplia Burgi / Jackal jujube Rhamnaceae Ziziphus rugosa Toran / Wild jujube Rhamnaceae
Prepared By Rightsource Industrial Solutions Pvt. Ltd. Chapter – III Page 91
EIA Report Urmila Chemopharma Pvt. Ltd.
Most of the annual herbs and therophytes had completed their life cycle and
withered away. Hence, no green herbs / annuals could be noticed in the study area.
3.9.3 Terrestrial fauna of the study area
The study area includes the project site, the MIDC, the GIBS and the adjacent
wastelands and croplands. The study area extends up to 10 Km radius from the
project area. The whole area except the MIDC was more like a arid or semiarid
region. As the animals, especially vertebrates and the winged invertebrates move
from place to place in search of food, shelter, mate or other biological needs,
separate lists for Project area and Study area are not desirable. The study area is
subjected to anthropogenic disturbances and biotic pressures of grazing. According
to the Forest and Wildlife Department, the project site is located at an aerial distance
of 2.45 Km from the Great Indian Bustard Sanctuary (GIBS), Kondi. The GIBS is one
of those exclusive places in India which is the home to the Great Indian Bustard
(Ardeotis nigriceps). Great Indian Bustard (Ardeotis nigriceps) belonging to Schedule
I of the Indian Wildlife (Protection) Act, is a critically endangered (CR) bird while the
Blackbuck (Antilope cervicapra) and the Indian Wolf (Canis lupus pallipes or Canis
indica) do belong to any of the REET categories (they are included under the LC
category) of the IUCN (vide IUCN SSC Antelope Specialist Group 2017. Antilope
cervicapra. The IUCN Red List of Threatened Species 2017) though this is placed in
Schedule I of the Indian Wildlife (Protection) Act. Both are reported from the GIBS
only whose boundary is adjacent to the boundary of the MIDC.
Other than the GIBS, there are no other Sanctuaries, National Parks, Tiger Reserve
or Biosphere Reserve or Elephant Corridor or other protected areas within 10 Km of
radius from project area. The Great Indian Bustard, Blackbuck, Wolf, Indian Fox and
Jackal have been reported from the GIBS. Among the birds, Indian Bush lark,
Shrikes, Bush Quails, Buzzards, Francolins, Doves, Babblers, and Owls have been
reported.
It is evident from the available records, reports and circumstantial evidence that the
entire study area including the project and study areas were free from any animals
except the GIBS. Among the Mammals, only Squirrels, Mongoose, Rats, Bandicoots
and Rabbits were noticed during the survey. Monkeys were also rare. Among the
reptiles, Lizards, Garden lizards were common. No snake was seen during the
Prepared By Rightsource Industrial Solutions Pvt. Ltd. Chapter – III Page 92
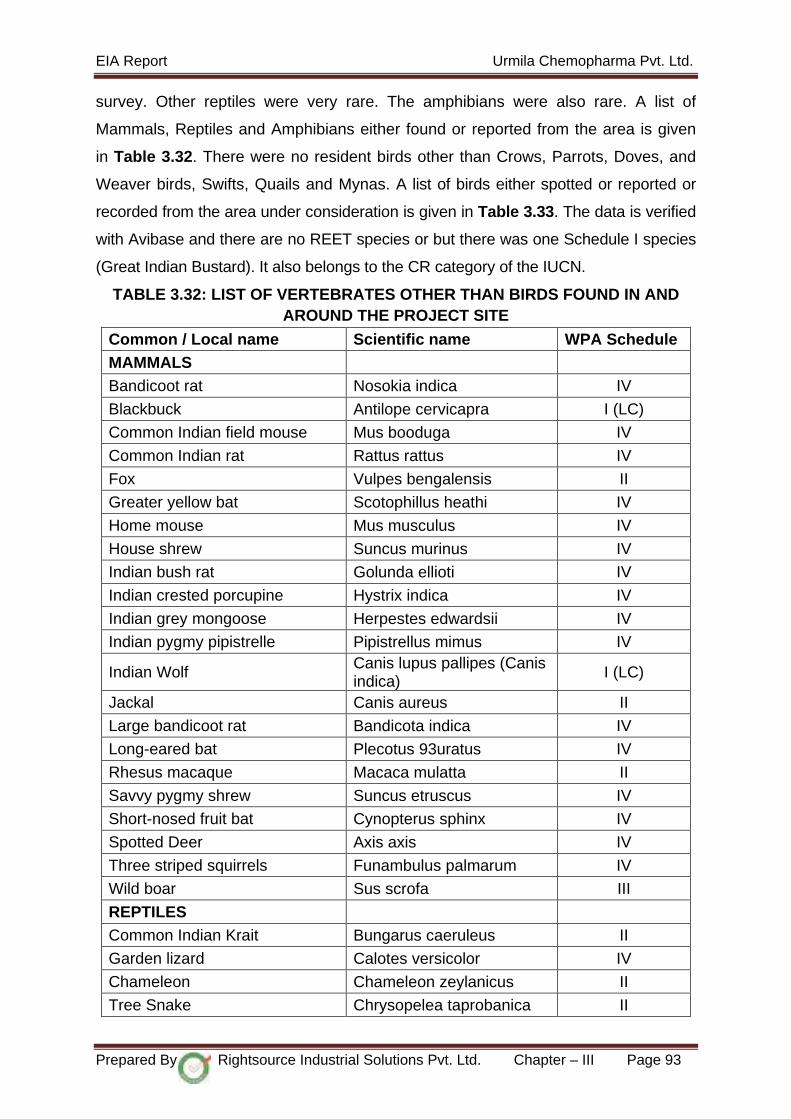
EIA Report Urmila Chemopharma Pvt. Ltd.
survey. Other reptiles were very rare. The amphibians were also rare. A list of
Mammals, Reptiles and Amphibians either found or reported from the area is given
in Table 3.32. There were no resident birds other than Crows, Parrots, Doves, and
Weaver birds, Swifts, Quails and Mynas. A list of birds either spotted or reported or
recorded from the area under consideration is given in Table 3.33. The data is verified
with Avibase and there are no REET species or but there was one Schedule I species
(Great Indian Bustard). It also belongs to the CR category of the IUCN.
TABLE 3.32: LIST OF VERTEBRATES OTHER THAN BIRDS FOUND IN AND AROUND THE PROJECT SITE
Common / Local name Scientific name WPA Schedule MAMMALS
Bandicoot rat Nosokia indica IV
Blackbuck Antilope cervicapra I (LC)
Common Indian field mouse Mus booduga IV
Common Indian rat Rattus rattus IV
Fox Vulpes bengalensis II
Greater yellow bat Scotophillus heathi IV
Home mouse Mus musculus IV
House shrew Suncus murinus IV
Indian bush rat Golunda ellioti IV
Indian crested porcupine Hystrix indica IV
Indian grey mongoose Herpestes edwardsii IV
Indian pygmy pipistrelle Pipistrellus mimus IV
Indian Wolf Canis lupus pallipes (Canis indica)
I (LC)
Jackal Canis aureus II
Large bandicoot rat Bandicota indica IV
Long-eared bat Plecotus 93uratus IV
Rhesus macaque Macaca mulatta II
Savvy pygmy shrew Suncus etruscus IV
Short-nosed fruit bat Cynopterus sphinx IV
Spotted Deer Axis axis IV
Three striped squirrels Funambulus palmarum IV
Wild boar Sus scrofa III
REPTILES
Common Indian Krait Bungarus caeruleus II
Garden lizard Calotes versicolor IV
Chameleon Chameleon zeylanicus II
Tree Snake Chrysopelea taprobanica II
Prepared By Rightsource Industrial Solutions Pvt. Ltd. Chapter – III Page 93

EIA Report Urmila Chemopharma Pvt. Ltd.
Common / Local name Scientific name WPA Schedule Whip Snake Dryphis nasutus II
Saw scaled viper Echis carinatus II
Common skink Eutropis carinata IV
Indian star tortoise Geochelone elegans II
Indian wall lizard Hemidactylus flaviviridis IV
Cobra Naja naja II
Rat snake Ptyas mucosa II
Blind Snake Typhlops diardii IV
Slender Blind Snake Typhlops porrectus II
Russell’s viper Vipera russseli II
AMPHIBIANS
Common Indian Toad Duttaphrynus melanostictus IV
Green pond frog Euphlyctis hexadactylus IV
Indian Bull Frog Hoplobatrachus tigerinus IV
Common tree frog Polypedates maculatus IV
Indian Burrowing frog Sphaerotheca breviceps IV
TABLE 3.33: LIST OF BIRDS EITHER SPOTTED OR REPORTED FROM THE AREAS IN AND AROUND THE PROJECT SITE
Scientific Name Common Name Family WPA Schedule
Accipiter badius Shikra Accipitridae IV
Acridotheres tristis Common myna Sturnidae IV
Aegithinia tiphia Common Iora Irenidae IV
Alcedo atthis Smallblue kingfisher Alcedinidae IV
Ardeotis nigriceps Great Indian Bustard Otididae I (CR)
Athene brama Spotted owlet Noctuidae IV
Bubulcus ibis Cattle Egret Ardeidae IV
Ceryle rudis Lesser pied Kingfisher Alcedinidae IV
Columba livia Blue rock pigeon Columbidae IV
Coracias benghalensis Indian roller Coraciidae IV
Corvus splendens House crow Corvidae V
Dendrocitta vagabunda
Indian tree pie Corvidae IV
Dicaeum erythrorhynchos
Tickell’s flower pecker Dicaeidae IV
Dicrurus macrocercus Black drongo Dicruridae IV
Egretta garzetta Little egret Ardeidae IV
Prepared By Rightsource Industrial Solutions Pvt. Ltd. Chapter – III Page 94
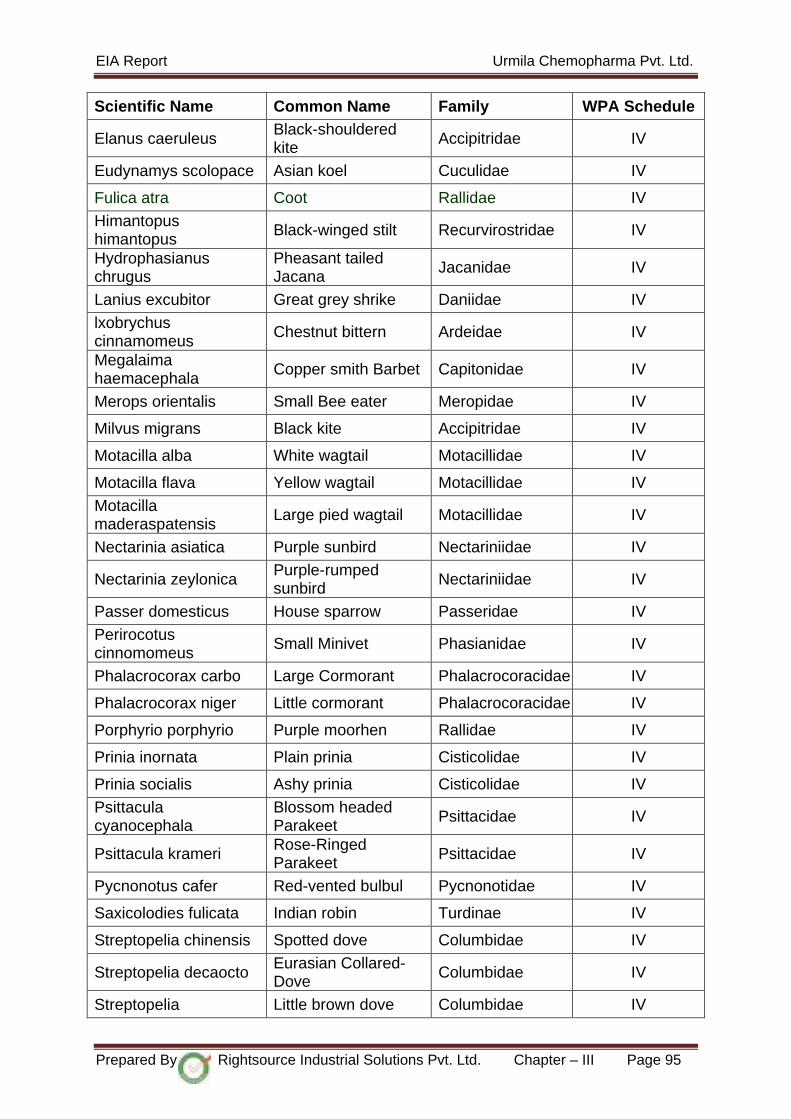
EIA Report Urmila Chemopharma Pvt. Ltd.
Scientific Name Common Name Family WPA Schedule
Elanus caeruleus Black-shouldered kite Accipitridae IV
Eudynamys scolopace Asian koel Cuculidae IV
Fulica atra Coot Rallidae IV
Himantopus himantopus
Black-winged stilt Recurvirostridae IV
Hydrophasianus chrugus
Pheasant tailed Jacana Jacanidae IV
Lanius excubitor Great grey shrike Daniidae IV
lxobrychus cinnamomeus
Chestnut bittern Ardeidae IV
Megalaima haemacephala
Copper smith Barbet Capitonidae IV
Merops orientalis Small Bee eater Meropidae IV
Milvus migrans Black kite Accipitridae IV
Motacilla alba White wagtail Motacillidae IV
Motacilla flava Yellow wagtail Motacillidae IV
Motacilla maderaspatensis
Large pied wagtail Motacillidae IV
Nectarinia asiatica Purple sunbird Nectariniidae IV
Nectarinia zeylonica Purple-rumped sunbird Nectariniidae IV
Passer domesticus House sparrow Passeridae IV
Perirocotus cinnomomeus
Small Minivet Phasianidae IV
Phalacrocorax carbo Large Cormorant Phalacrocoracidae IV
Phalacrocorax niger Little cormorant Phalacrocoracidae IV
Porphyrio porphyrio Purple moorhen Rallidae IV
Prinia inornata Plain prinia Cisticolidae IV
Prinia socialis Ashy prinia Cisticolidae IV
Psittacula cyanocephala
Blossom headed Parakeet Psittacidae IV
Psittacula krameri Rose-Ringed Parakeet Psittacidae IV
Pycnonotus cafer Red-vented bulbul Pycnonotidae IV
Saxicolodies fulicata Indian robin Turdinae IV
Streptopelia chinensis Spotted dove Columbidae IV
Streptopelia decaocto Eurasian Collared-Dove Columbidae IV
Streptopelia Little brown dove Columbidae IV
Prepared By Rightsource Industrial Solutions Pvt. Ltd. Chapter – III Page 95
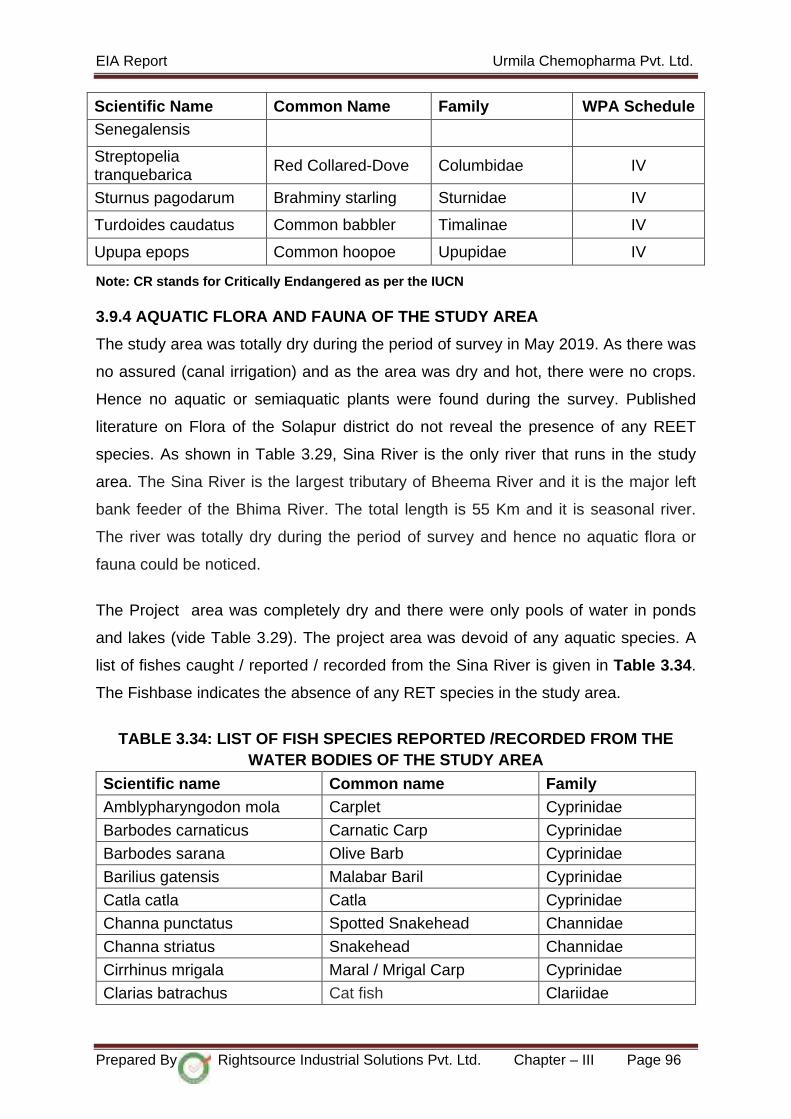
EIA Report Urmila Chemopharma Pvt. Ltd.
Scientific Name Common Name Family WPA Schedule Senegalensis
Streptopelia tranquebarica
Red Collared-Dove Columbidae IV
Sturnus pagodarum Brahminy starling Sturnidae IV
Turdoides caudatus Common babbler Timalinae IV
Upupa epops Common hoopoe Upupidae IV
Note: CR stands for Critically Endangered as per the IUCN 3.9.4 AQUATIC FLORA AND FAUNA OF THE STUDY AREA
The study area was totally dry during the period of survey in May 2019. As there was
no assured (canal irrigation) and as the area was dry and hot, there were no crops.
Hence no aquatic or semiaquatic plants were found during the survey. Published
literature on Flora of the Solapur district do not reveal the presence of any REET
species. As shown in Table 3.29, Sina River is the only river that runs in the study
area. The Sina River is the largest tributary of Bheema River and it is the major left
bank feeder of the Bhima River. The total length is 55 Km and it is seasonal river.
The river was totally dry during the period of survey and hence no aquatic flora or
fauna could be noticed.
The Project area was completely dry and there were only pools of water in ponds
and lakes (vide Table 3.29). The project area was devoid of any aquatic species. A
list of fishes caught / reported / recorded from the Sina River is given in Table 3.34.
The Fishbase indicates the absence of any RET species in the study area.
TABLE 3.34: LIST OF FISH SPECIES REPORTED /RECORDED FROM THE
WATER BODIES OF THE STUDY AREA
Scientific name Common name Family Amblypharyngodon mola Carplet Cyprinidae
Barbodes carnaticus Carnatic Carp Cyprinidae
Barbodes sarana Olive Barb Cyprinidae
Barilius gatensis Malabar Baril Cyprinidae
Catla catla Catla Cyprinidae
Channa punctatus Spotted Snakehead Channidae
Channa striatus Snakehead Channidae
Cirrhinus mrigala Maral / Mrigal Carp Cyprinidae
Clarias batrachus Cat fish Clariidae
Prepared By Rightsource Industrial Solutions Pvt. Ltd. Chapter – III Page 96
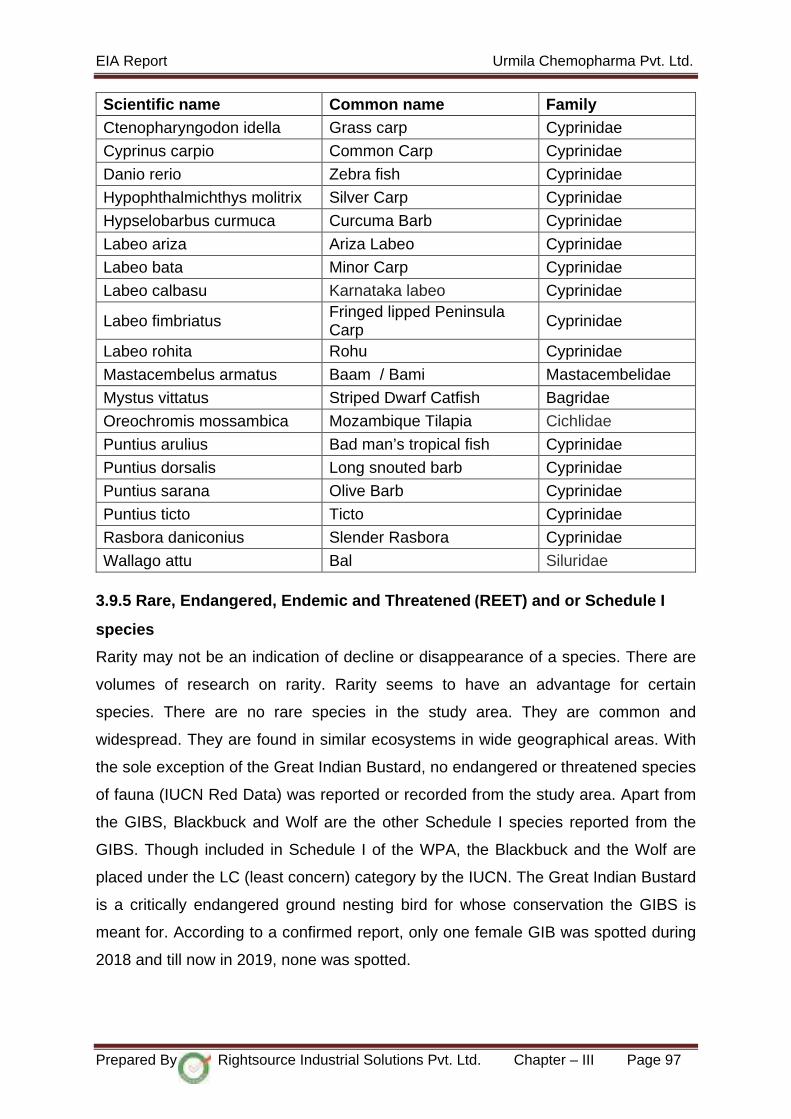
EIA Report Urmila Chemopharma Pvt. Ltd.
Scientific name Common name Family Ctenopharyngodon idella Grass carp Cyprinidae
Cyprinus carpio Common Carp Cyprinidae
Danio rerio Zebra fish Cyprinidae
Hypophthalmichthys molitrix Silver Carp Cyprinidae
Hypselobarbus curmuca Curcuma Barb Cyprinidae
Labeo ariza Ariza Labeo Cyprinidae
Labeo bata Minor Carp Cyprinidae
Labeo calbasu Karnataka labeo Cyprinidae
Labeo fimbriatus Fringed lipped Peninsula Carp Cyprinidae
Labeo rohita Rohu Cyprinidae
Mastacembelus armatus Baam / Bami Mastacembelidae
Mystus vittatus Striped Dwarf Catfish Bagridae
Oreochromis mossambica Mozambique Tilapia Cichlidae
Puntius arulius Bad man’s tropical fish Cyprinidae
Puntius dorsalis Long snouted barb Cyprinidae
Puntius sarana Olive Barb Cyprinidae
Puntius ticto Ticto Cyprinidae
Rasbora daniconius Slender Rasbora Cyprinidae
Wallago attu Bal Siluridae 3.9.5 Rare, Endangered, Endemic and Threatened (REET) and or Schedule I
species
Rarity may not be an indication of decline or disappearance of a species. There are
volumes of research on rarity. Rarity seems to have an advantage for certain
species. There are no rare species in the study area. They are common and
widespread. They are found in similar ecosystems in wide geographical areas. With
the sole exception of the Great Indian Bustard, no endangered or threatened species
of fauna (IUCN Red Data) was reported or recorded from the study area. Apart from
the GIBS, Blackbuck and Wolf are the other Schedule I species reported from the
GIBS. Though included in Schedule I of the WPA, the Blackbuck and the Wolf are
placed under the LC (least concern) category by the IUCN. The Great Indian Bustard
is a critically endangered ground nesting bird for whose conservation the GIBS is
meant for. According to a confirmed report, only one female GIB was spotted during
2018 and till now in 2019, none was spotted.
Prepared By Rightsource Industrial Solutions Pvt. Ltd. Chapter – III Page 97

EIA Report Urmila Chemopharma Pvt. Ltd.
3.10 SOCIO ECONOMIC STUDY
The socio- economic aspects of people in the 10 km radius of the plant site at Plot
No.: F-24, MIDC, Chincholi Industrial Area, Chincholi Village, Mohal Taluk, Solapur
District, Maharashtra state was analyzed. The socio-economic data forms the basis
for developing a suitable enterprise social responsibility plan to address the needs of
the population.
3.10.1 Methodology Adopted for the Study
The methodology adopted for the study mainly includes review of published
secondary data (Primary Census Abstract of Census-2011) with respect to
population, density, household size, sex ratio, literacy rate and occupational
structure for 10 Km radius study area.
3.10.2 Distribution of Population in the study area
As per 2011 census the study area consists of 63,163 persons inhabited in the study
area of 10 Km radial distance from the periphery of the project. The distribution of
population in the study area is given in Table 3.35.
Prepared By Rightsource Industrial Solutions Pvt. Ltd. Chapter – III Page 98

EIA Report Urmila Chemopharma Pvt. Ltd.
TABLE 3.35: POPULATION DISTRIBUTION
S. No Village Name Total population
Male Population
Female Population
0-6 Y Male Population
0-6 Y Female Population
0-6 Y Total Population
1 Morvanchi 1551 799 752 213 116 97 2 Shirapur 3039 1551 1488 351 173 178 3 Lamboti 2637 1450 1187 336 177 159 4 Chincholi 2785 1457 1328 425 225 200 5 Sawaleshwar 3948 2053 1895 551 267 284 6 ArjunSond 1944 1013 931 232 116 116 7 Mundhewadi 744 385 359 89 52 37 8 Pophali 1432 744 688 206 106 100 9 Wirwade Kh 439 236 203 67 40 27
10 Ranmasle 3777 1973 1804 440 236 204 11 Nannaj 7587 3880 3707 1025 545 480 12 Akolekati 3430 1772 1658 441 227 214 13 Darfal (Bibi) 7106 3664 3442 1034 539 495 14 Karamba 3228 1682 1546 380 204 176 15 Gulwanchi 2607 1354 1253 358 192 166 16 Kondi 6819 3602 3217 974 536 438 17 Khed 1157 572 585 154 75 79 18 Pakani 3905 2215 1690 415 225 190 19 Shivani 930 473 457 118 63 55 20 Hiraj 3136 1607 1529 460 241 219 21 Kegaon 962 501 461 147 81 66 Total 63163 32983 30180 8416 4436 3980
(Source: Hand Book of Statistics, Solapur District, 2011 and Census data 2011)
Prepared By Rightsource Industrial Solutions Pvt. Ltd. Chapter – III Page 99
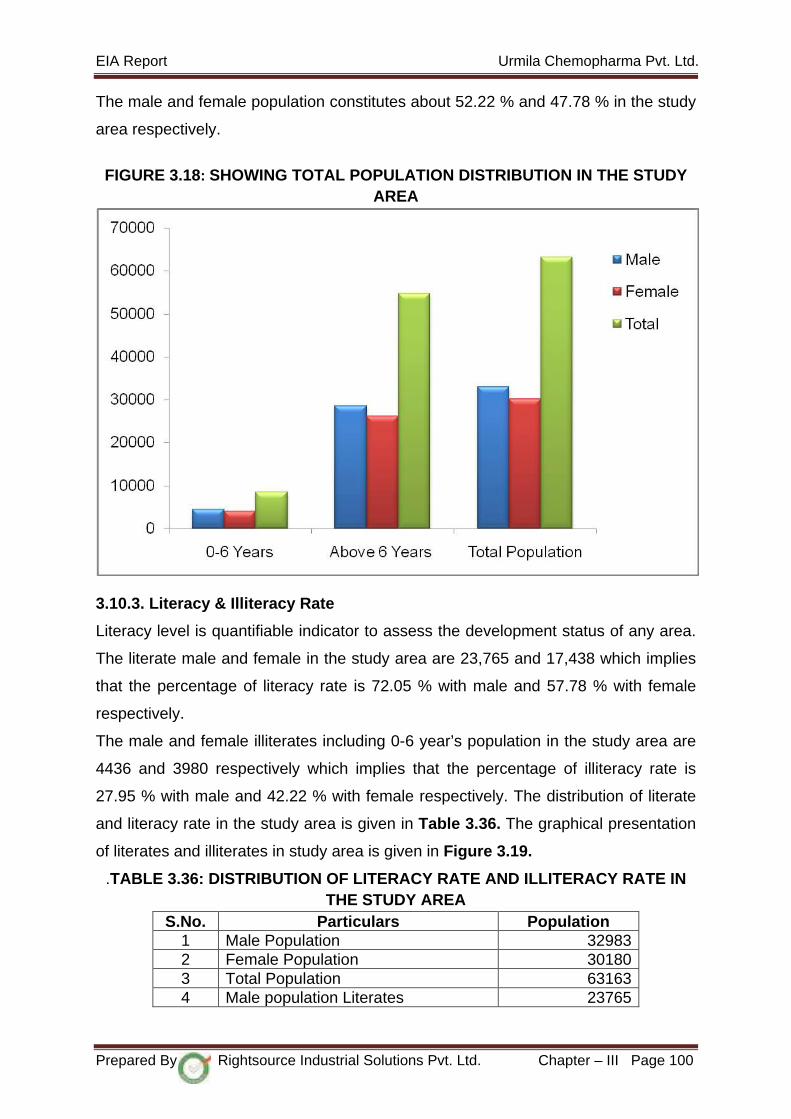
EIA Report Urmila Chemopharma Pvt. Ltd.
The male and female population constitutes about 52.22 % and 47.78 % in the study
area respectively.
FIGURE 3.18: SHOWING TOTAL POPULATION DISTRIBUTION IN THE STUDY AREA
3.10.3. Literacy & Illiteracy Rate
Literacy level is quantifiable indicator to assess the development status of any area.
The literate male and female in the study area are 23,765 and 17,438 which implies
that the percentage of literacy rate is 72.05 % with male and 57.78 % with female
respectively.
The male and female illiterates including 0-6 year’s population in the study area are
4436 and 3980 respectively which implies that the percentage of illiteracy rate is
27.95 % with male and 42.22 % with female respectively. The distribution of literate
and literacy rate in the study area is given in Table 3.36. The graphical presentation
of literates and illiterates in study area is given in Figure 3.19.
.TABLE 3.36: DISTRIBUTION OF LITERACY RATE AND ILLITERACY RATE IN THE STUDY AREA
S.No. Particulars Population 1 Male Population 32983 2 Female Population 30180 3 Total Population 63163 4 Male population Literates 23765
Prepared By Rightsource Industrial Solutions Pvt. Ltd. Chapter – III Page 100

EIA Report Urmila Chemopharma Pvt. Ltd.
S.No. Particulars Population 5 Male population illiterates 9218 6 Male population Literates % 72.05 7 Male population Illiterates % 27.95 8 Female population Literates 17438 9 Female population Illiterates 12742 10 Female population Literates % 57.78 11 Female population Illiterates % 42.22
(Source: Hand Book of Statistics, Solapur District, 2011 and Census data 2011)
FIGURE 3.19: SHOWING LITERATES AND ILLITERATES IN THE STUDY AREA
3.10.4. Occupational Structure
The occupational structure of residents of work participation rate in the study area is
studied with reference to main workers, marginal workers and non workers. The
main workers include 10 categories of workers defined by the Census Department
consisting of cultivators, agricultural laborers, those engaged in live-stock, forestry,
fishing, mining and quarrying; manufacturing, processing and repairs in household
industry; and other than household industry, construction, trade and commerce,
transport and communication and other services.
The marginal workers are those workers engaged in some work for a period of less
than six months during the reference year prior to the census survey. The non-
workers include those engaged in unpaid household duties, students, retired
persons, dependents, beggars, vagrants etc.; institutional inmates or all other non-
workers who do not fall under the above categories.
Occupational pattern of the concerned study area is recorded to assess skills of
people.
Prepared By Rightsource Industrial Solutions Pvt. Ltd. Chapter – III Page 101

EIA Report Urmila Chemopharma Pvt. Ltd.
Occupational pattern also helps in identifying dominating economic activity in the
area. In the study area the main and marginal workers are 26,975 (42.71 %) and
2191 (3.47%) respectively of the total population while the remaining 33,997
(53.82%) constitutes non-workers.
TABLE 3.37: OCCUPATIONAL STRUCTURE IN THESTUDY AREA S.No. Parameter Total Male Female
1 Main Workers 26975 17435 9540 2 Marginal Workers 2191 845 1346 3 Non-Workers 33997 14703 19294
Total Population 63163 32983 30180
(Source: Hand Book of Statistics, Solapur District, 2011 and Census data 2011)
FIGURE 3.20: SHOWING OCCUPATIONAL STRUCTURE IN THE STUDY AREA
3.10.5 Civic Amenities Available In The Study Area
The proposed project is coming up, at ‘Chicholikati’ Village, Mohal Taluk, Solapur
District, Maharashtra state – where the basic social amenities like Education,
Emergency Medicare, Drinking-Water, Communications, Roads and Power supply
are readily available.
As for Educational facilities, they are available either within the Village or Major
Village & Semi-Urban Centre, Solapur Town to almost all the populations of the
Study Area.
Prepared By Rightsource Industrial Solutions Pvt. Ltd. Chapter – III Page 102

EIA Report Urmila Chemopharma Pvt. Ltd.
A) Power and Energy:
All Villages, in the Project Study Area, are electrified – both for common facilities like,
Street Lights, Public Water Pumping, etc. and also almost all houses are electrified
for home lighting, while LPG, Kerosene Oil and in some cases Waste Agri-Waste,
Fallen Firewood, Cow Dung Cakes, etc. are used for cooking purpose.
B) Health and Medical Facilities:
Most Villages have Visiting ANMs / Health Counseling-cum-Primary Health Care
Mobile Units or PHCs (Primary Health Centers). For Maternity and Specialist Care &
basic Diagnostics, adequate facilities are available at ‘Solapur City’, which is at a
distance of 14 Km., ‘Solapur’, which is the District Head Quarters is at a distance of
14 Km. from the proposed project site. And for Critical and Advanced Medicare &
Diagnostics, local communities visit Solapur.
Also Ambulance is available on 108 for emergencies to evacuate patients of serious
health condition/s to the Multi-Specialty Hospitals – both Government & Private –
located in Solapur.
C) Tele-Communications:
Telecommunication facility in the Project Study Area is adequate; BSNL Electronic
Telephone Exchange is available and BSNL Mobile / BSNL Landline/ Airtel /
Vodafone/ Idea/ Reliance are very effective and are available to almost everyone, in
the Project Study Area.
D) Local Administration & Law:
While all the Villages and Hamlets, attached to any Village do have ‘Village
Panchayats’ duly elected by the local electorates to assure Sanitation, Local Law &
Order and to coordinate with various Government Departments & Other Agencies,
concerned for local Sanitation, General Hygiene, Immunisation, Nutrition
Programmes, Enhancement of Literacy Levels and Crime / Law & Order as well as
all Central and State Governmental Developmental Projects.
E) Other Administrative Issues:
They are further supported by the Office of the Mandal Revenue Officer / Revenue
Divisional Officer (R.D.O.) sit at Solapur (14 Km) which is also the District Head
Quarters.
Prepared By Rightsource Industrial Solutions Pvt. Ltd. Chapter – III Page 103
EIA Report Urmila Chemopharma Pvt. Ltd.
F) Transportation & Other Important Facilities:
The nearest Police Station, the Fire Station and Bus Station are located at Solapur
and there are also Bus-Stations or Bus-Stops at almost all Villages & Hamlets to all
major Towns & Cities.
3.10.6 Corporate Social Responsibility of the Project Proponent
Apart from Corporate Social Responsibility (CSR) Budget, the project
proponent is advised to provide employment to the Qualified, Semi-Literate,
Un-Skilled, Women & Physically Handicapped from the Local Area as a
compensation for operating in cluster of Villages / Hamlets. Similarly, the
Qualified Local Area people should be preferred over others.
It is also advised that Project Proponent acts ethically & transparently in all its
dealings pertaining to the operations and pollution discharges of the Plant for
the local communities to become confident of the otherwise skeptical about
Chemical & Drug Manufacturing activities in the area due to the possible
pollution of the Air, Water & Soil.
Prepared By Rightsource Industrial Solutions Pvt. Ltd. Chapter – III Page 104
ANTICIPATED ENVIRONMENTAL IMPACTS
& MITIGATION MEASURES
CHAPTER -IV
EIA Report Urmila Chemopharma Pvt. Ltd.
CHAPTER - IV
ANTICIPATED ENVIRONMENTAL IMPACTS
& MITIGATION MEASURES
4.1 INTRODUCTION
Environment and development should be considered as mutually Complementary,
interdependent and an instrument of reinforcing the quality of life. Environmental
Impact Assessment (EIA) is the important aspect of overall environmental
management strategy and an important tool for sustainable development. It identifies
major impacts of Industrial and associated activities on environment and provides
guideline to prepare the necessary control measure termed as Environmental
Management Plan (EMP).
The identified impacts for various components of environment viz., Air, Noise, Water,
Land, Socio-Economy, etc. are presented herewith. EIA is an activity or an attempt
to identify, predict, evaluate and communicate the likely environmental impacts of the
activity/project on the environment.
Based on results [Baseline Data] of prediction and evaluation, pollution abatement
and control measures in order to mitigate the adverse impacts on the environment
are delineated in an Environmental Management Plan
The proposed project is likely to create impact on the environment in two distinct
phases:
• During the construction phase, which may be temporary and short term; and
• During the operation phase that would have long-term effects.
4.2. INVESTIGATED ENVIRONMENTAL IMPACTS DUE TO PROPOSED
PROJECT
The environmental impact assessment is accomplished by identification and
prediction of impacts and their assessment. Potential impacts of proposed project on
various environmental attributes given below are predicted;
• Air environment
• Water resources and quality
• Noise levels
• Land use
Prepared By Rightsource Industrial Solutions Pvt. Ltd. Chapter – IV Page 105

EIA Report Urmila Chemopharma Pvt. Ltd.
• Soil quality
• Solid waste
• Terrestrial and aquatic ecology
• Demography and socio-economics.
• Hydrology & Geology
4.3. CONSTRUCTION PHASE
During the construction phase, the activities which are likely to contribute to impact
on various environmental components which are temporary in nature are site
clearing, leveling, construction of various structures of Drug manufacturing activities,
lying of internal roads, erection of equipment etc.
The construction activities will be confined within the project area of 1.48 acres.
The environmental impacts and management plan during construction phase are
detailed below.
4.3.1 IMPACT ON LAND USE
Presently land is using for industrial purpose. No major changes in land use pattern
will occur due to the project activities.
4.3.2 IMPACT ON SOIL ENVIRONMENT
The activities of proposed project will be confined within the site premises. During
construction works, top soil generated from various activities like excavation etc. will
be stored and preserved to use it during restoration period as far as possible.
The construction activities will result in loss of topsoil and earthen material to some
extent in the plant premises. However, it is proposed to use the soil and earthen
material in greenbelt development.
No solid or hazardous waste will be generated during construction thus no impact on
soil environment is likely.
4.3.3 IMPACT ON TOPOGRAPHY
The proposed site is barren land and during the construction phase there would be
proper leveling of the proposed site. There is no additional stress expected due to
Prepared By Rightsource Industrial Solutions Pvt. Ltd. Chapter – IV Page 106
EIA Report Urmila Chemopharma Pvt. Ltd.
this project activity on topography and soil strategy of the project site and its
surroundings.
Since it is a new project, changes occur in topography due to excavation of soil in
the proposed project area and construction of buildings and facilities. During
construction, excavated soil will be restored to its original shape. Thus the impact
during the construction is reversible, for short term and insignificant.
4.3.4 IMPACT ON AIR ENVIRONMENT
The sources of air emissions during construction phase will be due to development
of site, emissions from vehicles used for transportation of men and materials and
emission from construction equipment’s. These activities are likely to result in
emission of SO2, NO2, CO and Particulate matter. However, the quantity of these
will be very negligible and that too only for a very short period. Hence no adverse
impact on air quality is likely to occur.
4.3.5 IMPACT ON WATER ENVIRONMENT
No surface water body is located in the vicinity of the project site; hence project
related impact on water environment would mainly be limited to the groundwater
resources. The potential impacts during construction phases are assessed based on
the various activities.
● Improper disposal of construction debris may lead to off-site contamination of
water resources.
● Unaccounted disposal of domestic wastewater from temporary labour camps.
● Spillage of oil and grease from the vehicle maintenance activity and wastewater
stream generated from activities, such as vehicles washing and maintenance.
Site Workshop:
The repair and maintenance of equipments/ vehicles at site would generate waste
containing oil and grease. The wastewater stream would also be generated from
vehicle washing. The impact can be mitigated to a great extent by installing oil and
grease traps during construction phase.
Prepared By Rightsource Industrial Solutions Pvt. Ltd. Chapter – IV Page 107
EIA Report Urmila Chemopharma Pvt. Ltd.
Construction of Roads and Parking Areas:
The impact from the road construction depends on both the construction practices
and the type of material used. Construction waste of electrical installation, painting
and flooring may create significant impact. This type of waste would be stock piled
and disposed off to authorized vendor.
Development of the proposed site could lead to stockpiling and excavation activity on
site, thereby causing erosion of base soil. The run-off from the site may contain high
quantity of suspended solids (SS). The impact of runoff may not be very significant
except during rainy season. Further, construction of garland drains will reduce the
runoff from the stockpiles
Domestic Wastewater generated during construction, which will be collected in
sewage collection tank [septic tank].
The contamination of groundwater might occur due to the irrational disposal of liquid
wastes. The overall impact on water environment during construction phase due to
proposed project is likely to be short term and insignificant. There seems no impact
on the water environment of the study area.
4.3.6 IMPACT ON NOISE LEVELS
Noise will be generated due to construction traffic for loading and unloading,
fabrication and handling of equipment and materials are likely to cause an increase
in the ambient noise levels. The areas affected are those close to the site. However,
the noise will be temporary and will be restricted mostly to daytime.
4.3.7 IMPACT ON ECOLOGY
Prediction of impacts is based both on the direct and indirect; short-term as well as
long-term; irreversible and irreversible impacts that are most likely to occur owing to
the proposed industrial activity during establishment and operation. The ecological
factors that are considered most significant as far as the impact on flora and fauna
are concerned:
1. Whether there shall be any reduction in species diversity
2. Whether there shall be any habitat loss or fragmentation
Prepared By Rightsource Industrial Solutions Pvt. Ltd. Chapter – IV Page 108
EIA Report Urmila Chemopharma Pvt. Ltd.
3. Whether there shall be any additional risk or threat to the rare or endangered
or endemic or threatened (REET) species
4. Whether there shall be any impairment of ecological functions such as (i)
disruption of food chains, (ii) decline in species population and or (iii)
alterations in predator-prey relationships.
As stated earlier, there is no REET plant or animal species in the project area, and
hence no REET species is going to be lost on account of the proposed product
manufacturing by the industry. The plants list given in Table 3.30 chapter - 3 are
going to be lost during the development of the greenbelt. As there are no REET
species, the proposed changes in the project are not going to pose any threat to the
flora and fauna of the project area as these species are very common and of
widespread occurrence. As mentioned repeatedly, one bird (GIB) and two mammals
(Blackbuck and Wolf) of Schedule I have been reported from the GIBS. But only the
GIB belongs to the REET (CR) category of the IUCN. The proposed industry is a
ZLD unit and hence it is not going to discharge any treated or untreated effluents.
Hence, it is not going to have any direct or indirect impacts on the Schedule I / REET
species that are most likely to occur in the study area of the project site. No direct or
indirect damage is expected to the flora and fauna of the Study area. Further, as
there are no rare or endangered or endemic or threatened (REET) terrestrial animal
species within the project area, the project does not pose any direct threat to the
flora and fauna of the study area. As the industry is required to operate and maintain
the emissions within the limits specified by the CPCB / MSPCB, the effects of the
industry on the flora and fauna of the Study area may be negligible. Neither the
storm water nor the effluent water nor any other kind of rain or waste water from the
industry shall get in to the water resources. Further, the greenbelt is going to be
developed in 35.8% of the total project area. Hence, the anticipated environmental
impacts on the flora and fauna of the study area are negligible and easily reversible.
It is not going to create any kind of environmental stress to the local flora and fauna.
4.3.8 IMPACT ON SOCIO-ECONOMIC ENVIRONMENT
Due to proposed project there is no major negative impact on socio economic
environment. The proposed project will requires a workforce of 100 persons during
plant operations. Thus industrial activity will boost up the commercial and
economical status of the locality to some extent. And, the overall impacts on socio-
Prepared By Rightsource Industrial Solutions Pvt. Ltd. Chapter – IV Page 109

EIA Report Urmila Chemopharma Pvt. Ltd.
economic environment due to the proposed project are positive in nature and accrue
to the community on the long-terms basis.
TABLE 4.1: SUMMARY – IDENTIFICATION OF IMPACTS DURING
CONSTRUCTION PHASE
S. No Components Aspect Potential Impacts
1 Topography & Geology
Site development No significant adverse Impacts
2 Soil Construction activity leading to topsoil removal and erosion.
Minor negative impact
3 Land use & Aesthetics
Land development Positive impact
4 Water Quality
• Surface runoff from project site
• Oil/ fuel and waste spills • Improper debris disposal • Discharge of sewage
from labour camp.
Short term, but no significant negative impact
5 Ambient Air Quality
Dust emissions from site preparation, excavation, material handling and other construction activities at site.
Short term minor negative impact inside the site premises. No negative impact outside the site.
6 Noise Noise generated from construction activities, operation of construction equipment and traffic.
Short term minor negative impact near noise generation sources inside premises. No significant impact on ambient noise levels at sensitive receptors.
7 Ecology Flora and Fauna
Habitat disturbance during construction activity.
Short term minor negative impact
8 Socio - economy
Increased job opportunity. Economy related to semiskilled expected to boom.
Short term positive impact by employment generation
9 Traffic Pattern
Haul Truck movement and possibility of traffic congestion outside site on Sector Road
Minor negative impact
10 Solid Waste Waste will be generated from construction activities
Proper disposal plan will be implemented. No adverse impact
Prepared By Rightsource Industrial Solutions Pvt. Ltd. Chapter – IV Page 110
EIA Report Urmila Chemopharma Pvt. Ltd.
4.4. MITIGATIVE MEASURES OF IMPACTS DURING CONSTRUCTION PHASE
Mitigative measures of identified impacts during construction phase are listed in
tabular form.
TABLE 4.2: MITIGATION MEASURES DURING CONSTRUCTION PHASE S. No
Components Impacts Mitigative Measures
1 Topography & Geology
No significant adverse Impacts
Construction will be carried out within the site premises; therefore no change will occur in land use pattern as well as there will not be any significant Topographical change. However, temporary change in top layer of soil will be occurred but the construction activity will help in fixation of soil thereby reducing the soil erosion
2
Land/ Soil
Short term minor negative impact due to change in top layer of soil
The earthen material generated during excavations and site grading periods, will be properly dumped and slope stabilization shall be taken. The topsoil generated during construction shall be preserved and reused for plantations
Greenbelt development will have significant impact in reduction of the soil erosion
3 Ambient Air Quality
Sort term negative impacts because of dust emission due to site cleaning, road laying, earthwork, transportation & construction
The emissions will be temporary and confined within proposed project site boundary. It is not expected to contribute significantly to the ambient air quality However, the unit will take following measures for control of dust emissions: • Use of plastic cover sheet while
transporting construction material at site
• Storage of sand and other such dispersible material by covering with tarpaulin sheet
• Storage of sand and other such dispersible material by covering with tarpaulin sheet
• Keeping minimum inventory/stock of sand and other such dispersible
material at site • The heights, from which materials
Prepared By Rightsource Industrial Solutions Pvt. Ltd. Chapter – IV Page 111
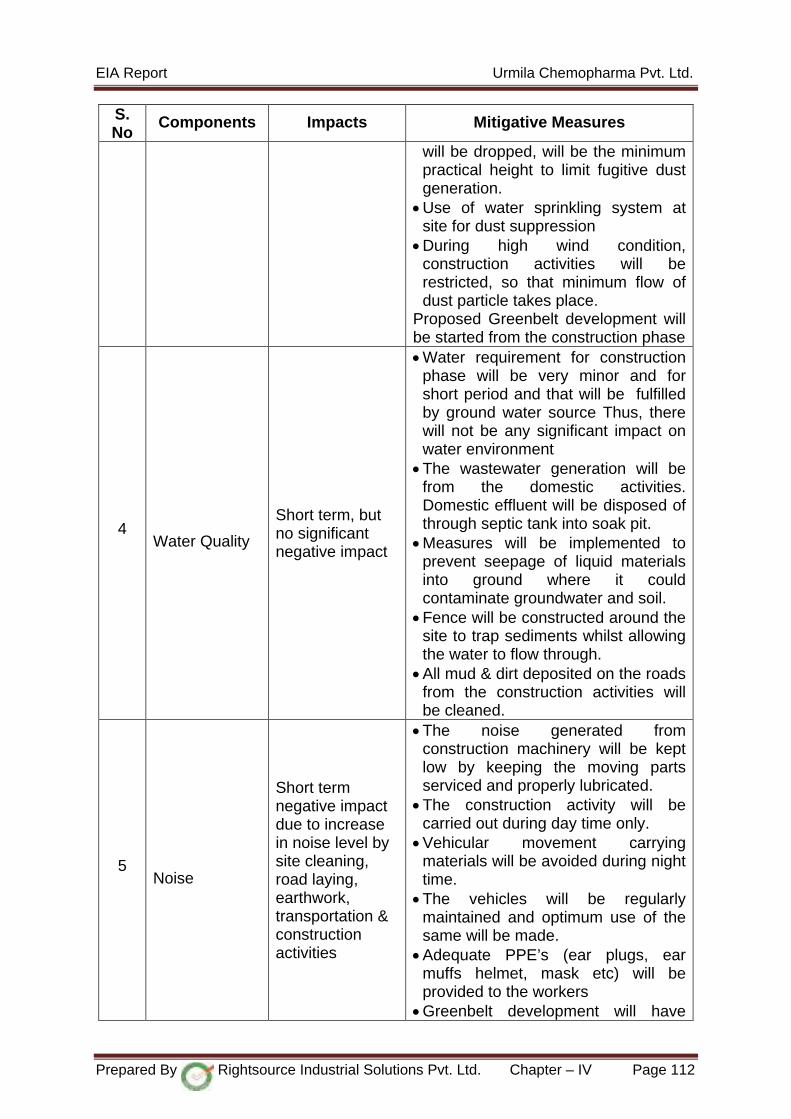
EIA Report Urmila Chemopharma Pvt. Ltd.
S. No
Components Impacts Mitigative Measures
will be dropped, will be the minimum practical height to limit fugitive dust generation.
• Use of water sprinkling system at site for dust suppression
• During high wind condition, construction activities will be restricted, so that minimum flow of dust particle takes place.
Proposed Greenbelt development will be started from the construction phase
4 Water Quality
Short term, but no significant negative impact
• Water requirement for construction phase will be very minor and for short period and that will be fulfilled by ground water source Thus, there will not be any significant impact on water environment
• The wastewater generation will be from the domestic activities. Domestic effluent will be disposed of through septic tank into soak pit.
• Measures will be implemented to prevent seepage of liquid materials into ground where it could contaminate groundwater and soil.
• Fence will be constructed around the site to trap sediments whilst allowing the water to flow through.
• All mud & dirt deposited on the roads from the construction activities will be cleaned.
5 Noise
Short term negative impact due to increase in noise level by site cleaning, road laying, earthwork, transportation & construction activities
• The noise generated from construction machinery will be kept low by keeping the moving parts serviced and properly lubricated.
• The construction activity will be carried out during day time only.
• Vehicular movement carrying materials will be avoided during night time.
• The vehicles will be regularly maintained and optimum use of the same will be made.
• Adequate PPE’s (ear plugs, ear muffs helmet, mask etc) will be provided to the workers
• Greenbelt development will have
Prepared By Rightsource Industrial Solutions Pvt. Ltd. Chapter – IV Page 112
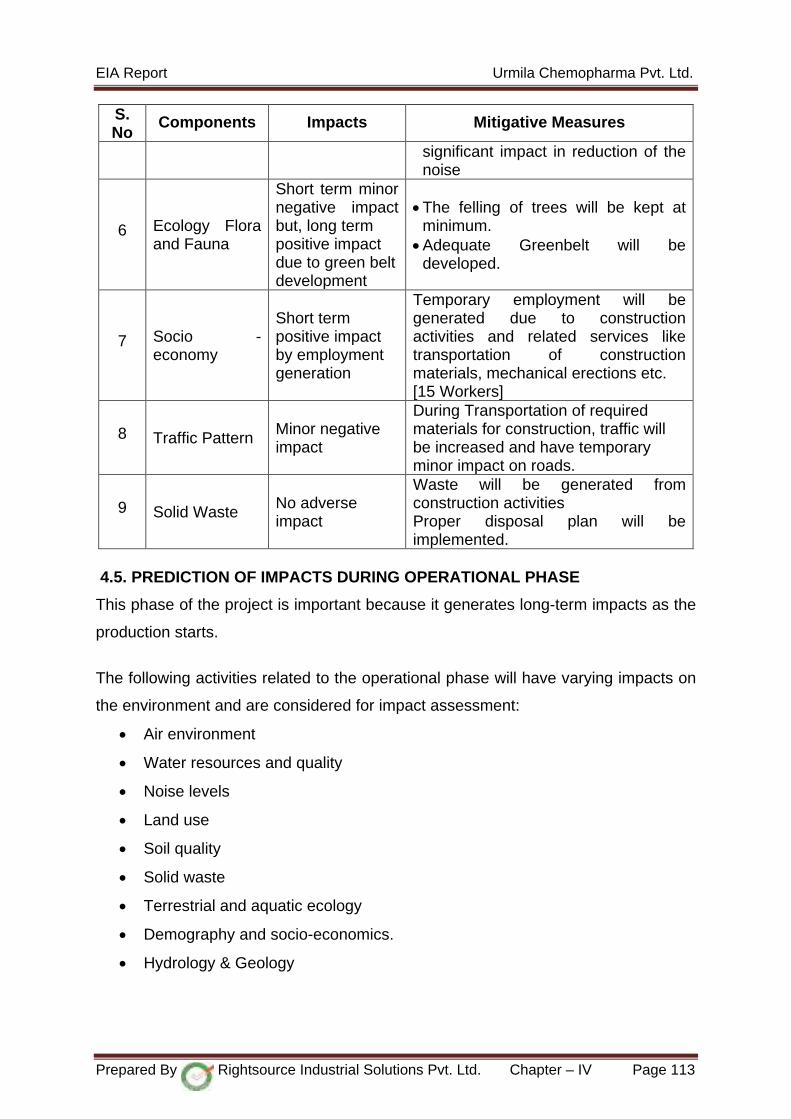
EIA Report Urmila Chemopharma Pvt. Ltd.
S. No
Components Impacts Mitigative Measures
significant impact in reduction of the noise
6 Ecology Flora and Fauna
Short term minor negative impact but, long term positive impact due to green belt development
• The felling of trees will be kept at minimum.
• Adequate Greenbelt will be developed.
7 Socio - economy
Short term positive impact by employment generation
Temporary employment will be generated due to construction activities and related services like transportation of construction materials, mechanical erections etc. [15 Workers]
8 Traffic Pattern Minor negative impact
During Transportation of required materials for construction, traffic will be increased and have temporary minor impact on roads.
9 Solid Waste No adverse impact
Waste will be generated from construction activities Proper disposal plan will be implemented.
4.5. PREDICTION OF IMPACTS DURING OPERATIONAL PHASE
This phase of the project is important because it generates long-term impacts as the
production starts.
The following activities related to the operational phase will have varying impacts on
the environment and are considered for impact assessment:
• Air environment
• Water resources and quality
• Noise levels
• Land use
• Soil quality
• Solid waste
• Terrestrial and aquatic ecology
• Demography and socio-economics.
• Hydrology & Geology
Prepared By Rightsource Industrial Solutions Pvt. Ltd. Chapter – IV Page 113

EIA Report Urmila Chemopharma Pvt. Ltd.
4.6 AIR ENVIRONMENT
The impacts on air quality from project depend on various factors like design
capacity, configuration, process technology, raw material, fuel to be used, air
pollution control measures, operation and maintenance. Apart from the above, other
activities associated with transportation of fuel, raw materials and finished products,
storage facilities and material handling within the plant premises may also contribute
to air pollution.
4.6.1 Source of Air Pollution
The operational phase activities are expected to have long - term impacts on the air
quality. The main sources from project are detailed below.
A. Flue gas Emissions
Boilers and DG set are the two main sources of emissions from the plant. Industry
proposed to install 2.0 TPH Coal fired boiler.
The industry is proposed to install 1 x 125 KVA DG Set during power failures.
PM, SO2 and NOx are the main air pollutants generated from the boiler and DG set.
The emissions from the boiler stack and DG Set Stack are given in Table 4.3 & 4.4.
TABLE 4.3: STACK EMISSION DETAILS OF PROPOSED BOILER
Particulars Units 2.0 TPH Coal fired Boiler
Type of Fuel -- Indian Coal with CV of 4000 kcal/kg to 5000 kcal/kg
Coal Consumption TPD 8.0 Ash Content % 35 Sulphur Content % 0.4 No. of Stacks No 1 Height of stack m 20 Diameter of Stack m 0.3 Temperature of Flue Gas oC 125 Velocity of Flue Gas m/s 15 Emission Rate Particular Matter as PM (After APCE) gm/sec 0.13
Sulphur dioxide gm/sec 0.59 Oxides of Nitrogen gm/sec 1.22 Control Equipment Air Pollution control equipment (APCE) -- Cyclone separator followed by
suitable pack of Bag filters
Prepared By Rightsource Industrial Solutions Pvt. Ltd. Chapter – IV Page 114

EIA Report Urmila Chemopharma Pvt. Ltd.
TABLE 4.4: STACK EMISSION DETAILS OF PROPOSED DG SET
Capacity in KVA
Emission of PM in mg/Nm3
Emission of SO2 in mg/Nm3
Emission of NOx
in mg/Nm3
Stack dia. in m
Flue Gas Temp. in
OC
Stack Height in m
Flue gas Velocity in m/sec.
125 KVA 50 70 85 0.2 190 8.0 14
B. Process Emissions
The Predicted Process emissions are
• CO2 [Carbon dioxide] – Pollutant
• NH3 [Ammonia] – Pollutant
The above mentioned emissions will liberate from the manufacturing process of
proposed products. The process emissions are based on reactants quantity and
chemical reactions between them in relation with desired product output.
C. Fugitive emission
The main sources of fugitive emissions from project are
• Storage & Handling of raw materials
• Storage & Handling of Solvents.
• During reaction period
• During Product filtrations & Finished operations
The raw materials will be stored in PP bags, Fibre drums and HDPE drums in
elevated flat from under the roof. Bulk quantities will be stored in storage tanks with
vent condensers to avoid the fugitive emissions. Solvents are handled in closed
conditions thereby reducing the losses in the form of evaporation.
4.6.2 Prediction of Impacts on Air Environment
The objective of dispersion modeling is to predict the ground level concentration
during the operation of plant and its impact on ambient air quality of the area.
Air quality assessment is done by integrating the measurement techniques and
modeling tools. The air modeling tools are routinely used in the environmental impact
assessments, risk analysis, emergency planning, and source apportionment studies.
Recent strategies for air pollution control in industries have largely neglected the
emission reduction measures which are the prime polluting sources. To accomplish
this, various air dispersion models have been developed and used worldwide so far
for different applications under different scenarios. The Gaussian plume model is a
Prepared By Rightsource Industrial Solutions Pvt. Ltd. Chapter – IV Page 115
EIA Report Urmila Chemopharma Pvt. Ltd.
standard approach for studying the transport of pollutants due to turbulent diffusion
and advection by the wind. Applications of such models have been made mandatory.
In this study, the AERMOD (the American Meteorological Society/Environmental
Protection Agency Regulatory Model Improvement Committee’s Dispersion Model,
Gaussian dispersion model is selected to predict the ground level concentrations
(GLC’s) of Particulate Matter (PM10) µg/m3, Particulate Matter (PM2.5) µg/m3, Sulphur
dioxide (SO2) µg/m3 and oxides of nitrogen (NOx) µg/m3 from point source emissions
will be investigated in the study area.
Methodology
Prediction of GLC values are made by using AERMOD software approved by U.S.
Environmental Protection Agency (USEPA) and has adopted it as its regulatory
model since 2005. In point source emissions, the stacks are subjected to plume rise
which again is dependent on force of buoyancy and momentum. The higher is the
plume rise or stack, the lesser will be ground level concentrations (GLC’s).The
emissions when released into the atmosphere are subjected to transportation,
dispersion, transformation, and fall out and wash out and finally reach the ground
level at a particular distance and concentrations. The relationship between the
source of emissions and its magnitude with the ground level concentrations (GLC’s)
at receptor points is governed by air dispersion models which take into the account
by the source strength, plume rise, atmospheric stability, mixing height, wind
velocity, terrain and other meteorological conditions. The comparison between the
predicted and field sampled downwind concentrations for PM10, PM2.5, SO2 & NOX
(µg/m3) will be carried out in this study to predict the average downwind ground level
concentrations (GLC’s)
For the present modeling, it is assumed that the emissions from the existing sources
are already captured in the baseline monitoring therefore only the emissions from the
proposed new sources are considered
Data Used for Computation
Stack emissions data have been used for prediction of short-term incremental GLC
values of PM10, PM2.5, SO2 & NOx using the meteorological data collected at site
during the March to May, 2019. Details of the data used for computations are given
below:
Prepared By Rightsource Industrial Solutions Pvt. Ltd. Chapter – IV Page 116

EIA Report Urmila Chemopharma Pvt. Ltd.
The details of estimated stack emissions are given in Table 4.3 & 4.4.
Meteorological Data
The meteorological data recorded continuously during the month of March to May,
2019, on hourly basis. AERMOD model requires hourly surface data values for wind
speed, wind direction, temperature, relative humidity and cloud cover. Both data files
for the surface and profile files were then used to generate the meteorological file
required by the AERMOD dispersion model using the AERMET meteorological pre-
processor. This AERMET has three stages to process the data. The first stage
extracts meteorological data and assesses data quality through a series of quality
assessment checks. The second stage merges all data available for 24-hour periods
and writes these data together in a single intermediate file. The third and final stage
reads the merged meteorological data and estimates the necessary boundary layer
parameters for dispersion calculations by AERMOD.
Mixing height
Mixing Height (MH) is the vertical extent through which the contaminant plume can
be mixed. Forecasting of mixing height is done with the aid of the vertical
temperature profile. The MH is a function of stability. In unstable air the MH is higher
and in stable air the MH is lower. With a lower MH, there is a smaller volume of air in
which the pollutant can be dispersed, resulting in higher concentrations in the
ambient environment. There is a seasonal variation of MH. During summer daylight
hours, MH can be few thousand feet whereas for winter it can be a few hundred feet.
It varies also in the course of a day. It is lowest at night and increases during the
day. As site specific mixing heights were not available, mixing heights based on IMD
publication, “Atlas of Hourly Mixing Height and Assimilative Capacity of Atmosphere
in India”, has been considered to establish the worst case scenario. Secondary
information has been used to determine the mixing height over the study region for
the study period (March to May, 2019) and it varies from 90 - 2350 meters (IMD).
Dispersion Modeling Results
The 1st high – 24 hourly average ground level concentration (GLC) values from plant
have been computed for PM10, PM2.5, SO2 & NOx considering topographical
features around the plant and applicable stability classes. The maximum 24 hourly
average GLC values for PM10, PM2.5, SO2 & NOx from plant are given in Table 4.5.
Prepared By Rightsource Industrial Solutions Pvt. Ltd. Chapter – IV Page 117
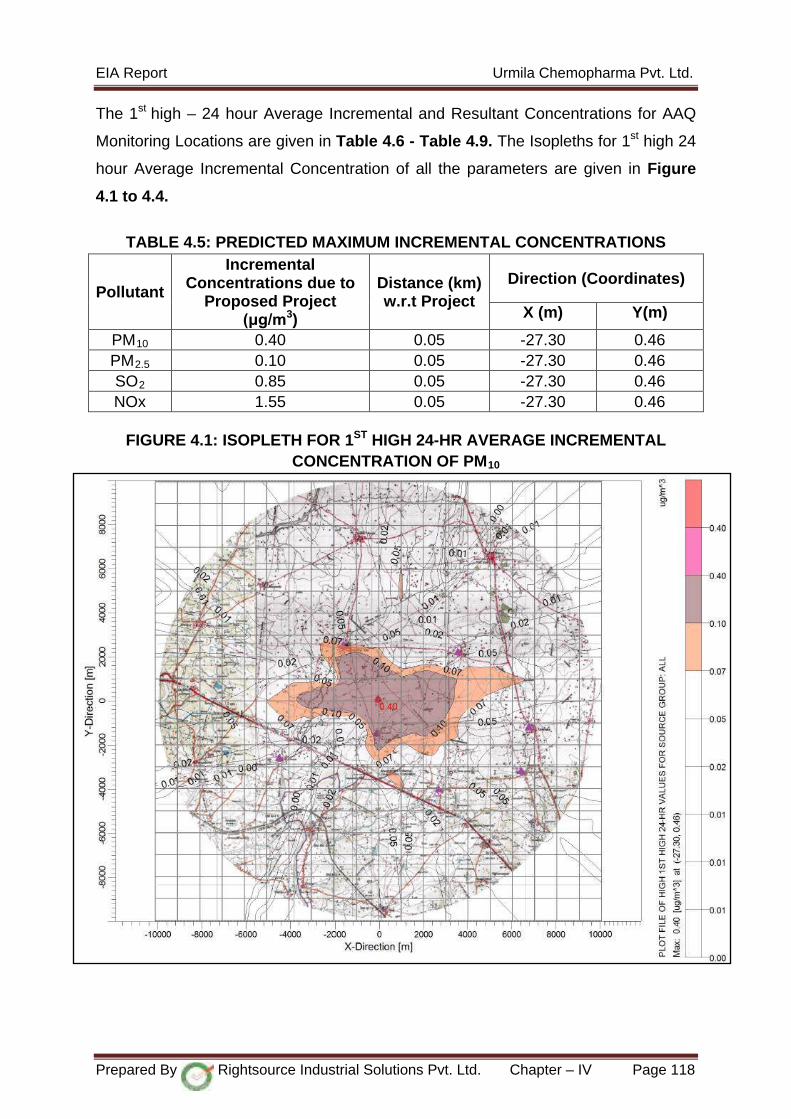
EIA Report Urmila Chemopharma Pvt. Ltd.
The 1st high – 24 hour Average Incremental and Resultant Concentrations for AAQ
Monitoring Locations are given in Table 4.6 - Table 4.9. The Isopleths for 1st high 24
hour Average Incremental Concentration of all the parameters are given in Figure
4.1 to 4.4.
TABLE 4.5: PREDICTED MAXIMUM INCREMENTAL CONCENTRATIONS
Pollutant
Incremental Concentrations due to
Proposed Project (μg/m3)
Distance (km) w.r.t Project
Direction (Coordinates)
X (m) Y(m)
PM10 0.40 0.05 -27.30 0.46 PM2.5 0.10 0.05 -27.30 0.46 SO2 0.85 0.05 -27.30 0.46 NOx 1.55 0.05 -27.30 0.46
FIGURE 4.1: ISOPLETH FOR 1ST HIGH 24-HR AVERAGE INCREMENTAL
CONCENTRATION OF PM10
Prepared By Rightsource Industrial Solutions Pvt. Ltd. Chapter – IV Page 118
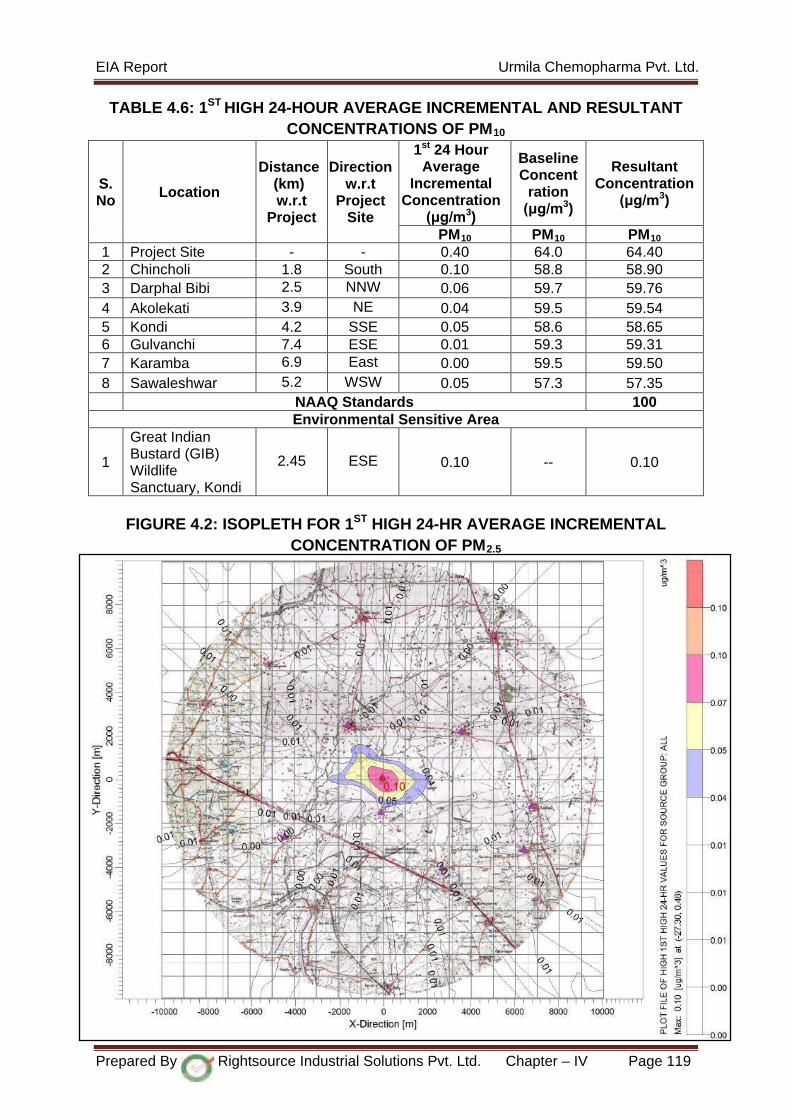
EIA Report Urmila Chemopharma Pvt. Ltd.
TABLE 4.6: 1ST HIGH 24-HOUR AVERAGE INCREMENTAL AND RESULTANT CONCENTRATIONS OF PM10
S. No Location
Distance (km) w.r.t
Project
Direction w.r.t
Project Site
1st 24 Hour Average
Incremental Concentration
(μg/m3)
Baseline Concent
ration (μg/m3)
Resultant Concentration
(μg/m3)
PM10 PM10 PM10 1 Project Site - - 0.40 64.0 64.40 2 Chincholi 1.8 South 0.10 58.8 58.90 3 Darphal Bibi 2.5 NNW 0.06 59.7 59.76 4 Akolekati 3.9 NE 0.04 59.5 59.54 5 Kondi 4.2 SSE 0.05 58.6 58.65 6 Gulvanchi 7.4 ESE 0.01 59.3 59.31 7 Karamba 6.9 East 0.00 59.5 59.50 8 Sawaleshwar 5.2 WSW 0.05 57.3 57.35 NAAQ Standards 100
Environmental Sensitive Area
1
Great Indian Bustard (GIB) Wildlife Sanctuary, Kondi
2.45 ESE 0.10 -- 0.10
FIGURE 4.2: ISOPLETH FOR 1ST HIGH 24-HR AVERAGE INCREMENTAL
CONCENTRATION OF PM2.5
Prepared By Rightsource Industrial Solutions Pvt. Ltd. Chapter – IV Page 119
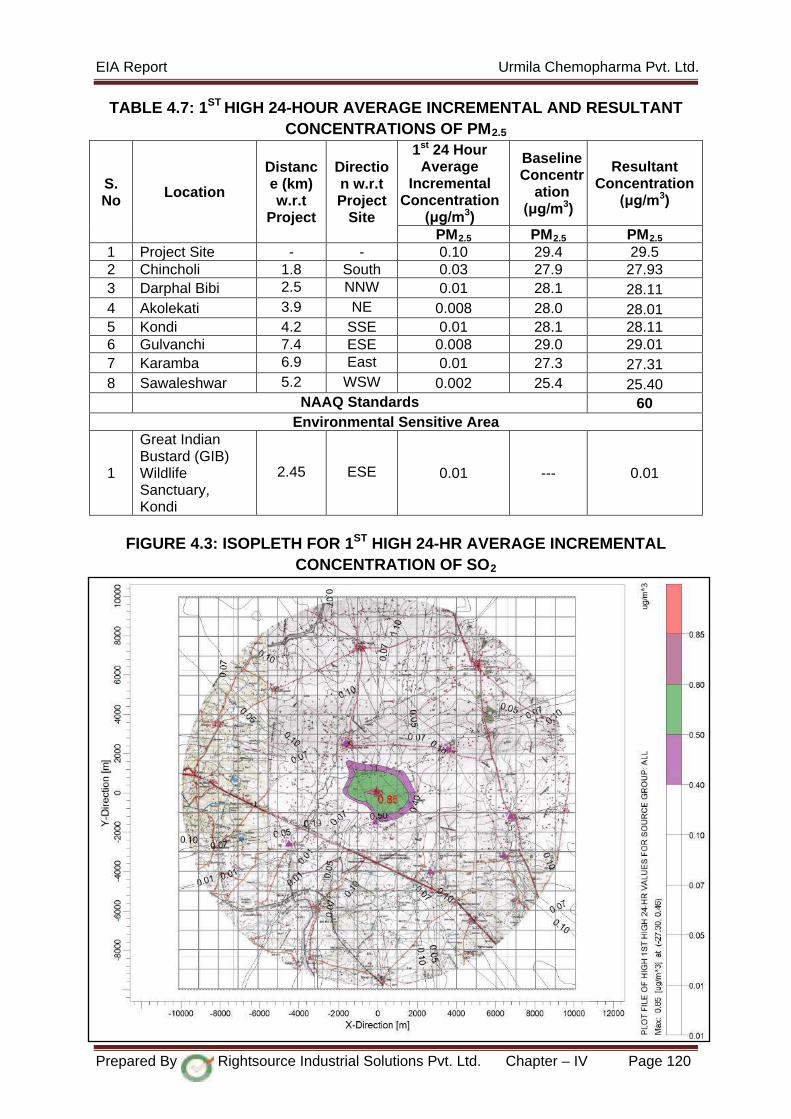
EIA Report Urmila Chemopharma Pvt. Ltd.
TABLE 4.7: 1ST HIGH 24-HOUR AVERAGE INCREMENTAL AND RESULTANT CONCENTRATIONS OF PM2.5
S. No Location
Distance (km) w.r.t
Project
Direction w.r.t Project
Site
1st 24 Hour Average
Incremental Concentration
(μg/m3)
Baseline Concentr
ation (μg/m3)
Resultant Concentration
(μg/m3)
PM2.5 PM2.5 PM2.5 1 Project Site - - 0.10 29.4 29.5 2 Chincholi 1.8 South 0.03 27.9 27.93 3 Darphal Bibi 2.5 NNW 0.01 28.1 28.11 4 Akolekati 3.9 NE 0.008 28.0 28.01 5 Kondi 4.2 SSE 0.01 28.1 28.11 6 Gulvanchi 7.4 ESE 0.008 29.0 29.01 7 Karamba 6.9 East 0.01 27.3 27.31 8 Sawaleshwar 5.2 WSW 0.002 25.4 25.40 NAAQ Standards 60
Environmental Sensitive Area
1
Great Indian Bustard (GIB) Wildlife Sanctuary, Kondi
2.45 ESE 0.01 --- 0.01
FIGURE 4.3: ISOPLETH FOR 1ST HIGH 24-HR AVERAGE INCREMENTAL
CONCENTRATION OF SO2
Prepared By Rightsource Industrial Solutions Pvt. Ltd. Chapter – IV Page 120
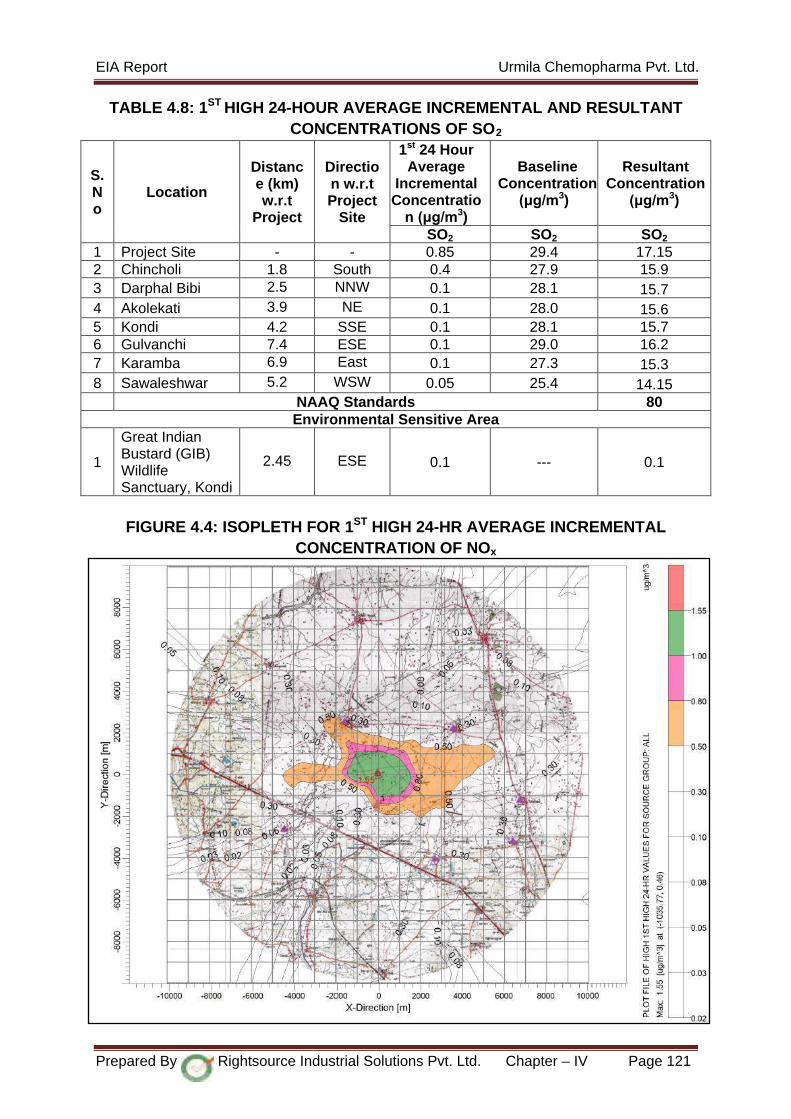
EIA Report Urmila Chemopharma Pvt. Ltd.
TABLE 4.8: 1ST HIGH 24-HOUR AVERAGE INCREMENTAL AND RESULTANT CONCENTRATIONS OF SO2
S. No
Location
Distance (km) w.r.t
Project
Direction w.r.t Project
Site
1st 24 Hour Average
Incremental Concentratio
n (μg/m3)
Baseline Concentration
(μg/m3)
Resultant Concentration
(μg/m3)
SO2 SO2 SO2 1 Project Site - - 0.85 29.4 17.15 2 Chincholi 1.8 South 0.4 27.9 15.9 3 Darphal Bibi 2.5 NNW 0.1 28.1 15.7 4 Akolekati 3.9 NE 0.1 28.0 15.6 5 Kondi 4.2 SSE 0.1 28.1 15.7 6 Gulvanchi 7.4 ESE 0.1 29.0 16.2 7 Karamba 6.9 East 0.1 27.3 15.3 8 Sawaleshwar 5.2 WSW 0.05 25.4 14.15 NAAQ Standards 80
Environmental Sensitive Area
1
Great Indian Bustard (GIB) Wildlife Sanctuary, Kondi
2.45 ESE 0.1 --- 0.1
FIGURE 4.4: ISOPLETH FOR 1ST HIGH 24-HR AVERAGE INCREMENTAL
CONCENTRATION OF NOx
Prepared By Rightsource Industrial Solutions Pvt. Ltd. Chapter – IV Page 121

EIA Report Urmila Chemopharma Pvt. Ltd.
TABLE 4.9: 1ST HIGH 24-HOUR AVERAGE INCREMENTAL AND RESULTANT CONCENTRATIONS OF NOx
S. No Location
Distance (km) w.r.t
Project
Direction w.r.t Project
Site
1st 24 Hour Average
Incremental Concentratio
n (μg/m3)
Baseline Concentrat
ion (μg/m3)
Resultant Concentration
(μg/m3)
NOx NOx NOx 1 Project Site - - 1.0 23.7 24.7 2 Chincholi 1.8 South 0.6 22.9 23.5 3 Darphal Bibi 2.5 NNW 0.5 23.0 23.5 4 Akolekati 3.9 NE 0.3 22.9 23.2 5 Kondi 4.2 SSE 0.3 23.0 23.3 6 Gulvanchi 7.4 ESE 0.01 23.5 23.51 7 Karamba 6.9 East 0.01 22.6 22.61 8 Sawaleshwar 5.2 WSW 0.05 21.5 21.55 NAAQ Standards 80
Environmental Sensitive Area
1
Great Indian Bustard (GIB) Wildlife Sanctuary, Kondi
2.45 ESE 0.5 -- 0.5
MITIGATION MEASURES
The industry will take measures for reduction of fugitive emissions emanating out of
process reactions by adopting the following:
• The industry will take measures for reduction of process emissions emanating
out of process reactions by connecting reaction vessel vent to the scrubbing
system.
• Good ventilation will be provided to reduce the workroom concentrations.
• Fugitive emissions will be reduced by providing vent condensers to the all the
reactors and Storage tanks
• Adequate stack height of 20 mtrs will be provided to the 2.0 TPH Coal fired
boiler respectively.
• Stack monitoring facilities for the periodic monitoring of the stack to verify the
compliance of the stipulated norms. Apart from this Cyclone Separator, Bag
filters will be provided to the boiler.
Prepared By Rightsource Industrial Solutions Pvt. Ltd. Chapter – IV Page 122

EIA Report Urmila Chemopharma Pvt. Ltd.
TABLE 4.10: PROCESS EMISSION DETAILS AND TREATMENT METHOD S.
No. Name of the Gas Quantity in Kg/ Day Treatment Method
1 Carbon dioxide 175 Dispersed into the atmosphere
2 Ammonia 21 Scrubbed by using chilled water media
In order to minimize the air pollution, unit will develop greenbelt in and around its
premises.
ODOR CONTROL
The chance of odours within premises is mainly due to
Raw materials
• Storage / Handling
• Transportation of raw materials
Process
• Raw materials transportation
• During reaction
• Drying
Storage / Handling Storage
• Industry will provide adequate and proper storage facilities for all the raw
materials and finished products.
• Corrosive substances will be stored away from the moisture.
• Solid raw material will be stored in covered area and Liquid raw material will
be stored in closed Horizontal / Vertical tanks.
• Hazardous chemicals and solid wastes will be stored away from other plant
activities.
• The storage yard of chemicals will be isolated and it will be equipped with all
necessary measures to control odours.
Handling
• All the raw materials and finished products will be handled as per the standard
practice.
• For proper handling, company will adapt good housekeeping technology to
entire shed.
• To avoid any leakage or spillage of chemicals from all storage tanks, third
party will inspects transfer lines, valves, fittings and every joint periodically.
Prepared By Rightsource Industrial Solutions Pvt. Ltd. Chapter – IV Page 123

EIA Report Urmila Chemopharma Pvt. Ltd.
Transportation of Raw materials
• All the necessary precautions will be taken while carrying out transport of the
above materials as per the Hazardous Rules of transportation.
• The vehicles for transportation of raw materials and products will be parked at
specified loading facilities where there will be a provision of fire extinguishers.
• The finished product will be transported by road, rail and ship route in closed
containers.
Other sources of odour nuisance are as follows
Leaks from pressurized process equipment generally occur through valves, pipe
connection, mechanical seals or related equipment.
Control measures
• To minimize & control leaks at process facilities operators carry out regular
leak detection test and repair activities.
• Routine inspections of process equipment with gas detectors can be used to
identify leaks & estimate the leak rate in order to decide an appropriate
corrective action.
• Proper routine maintenance of equipment reduces the likelihood of leaks.
• Solvents will be transferred through the closed pipe line system.
Cleaner production practices
Process vessels:
• Liquid raw material will be charged by pumping and closed loops and dosing
will be done by metering system to avoid odour.
• Double mechanical seals will be provided to the process vessels having
agitator for reduction of odour and leakages.
Storage tanks
• Storage tanks for products as well as raw materials will be fitted with
appropriate control devices [Condensers with chilled water circulation
systems] to avoid possible odours / leakages.
House keeping
• Keep work areas clean.
• Keep aisles clear.
• Keep exits and entrances clear.
Prepared By Rightsource Industrial Solutions Pvt. Ltd. Chapter – IV Page 124

EIA Report Urmila Chemopharma Pvt. Ltd.
• Use proper waste collection containers.
• Cleanup spills and leaks off’s any type quickly and properly.
• Follow up preventive predictive maintenance.
4.7 WATER ENVIRONMENT
With respect to water environment; three aspects are considered in EIA, availability
& Requirement of fresh water, Wastewater generation and its disposal.
Water Requirement
The total water requirement for the proposed project is 35.43 KLD will be met from
Maharashtra Industrial Development Corporation (MIDC) water supply.
The unit will procure water from private water suppliers through tankers in case of
non-availability of main water source.
Waste water generation
Total effluent generation is 10.82 KLD, which is from process, scrubbers, boiler blow
down, cooling tower bleed off, domestic and washing activities. The HTDS waste
water of 1.61 KLD from Process and scrubbers. LTDS waste water of 9.21 KLD
including cooling tower bleed off, process, boiler blow down, domestic sewage and
washings.
Disposal of Effluent – ZLD System
Utilities waste water taken along with Vapour Condensate from MEE & ATFD for
Biological Effluent Treatment plant. Treated effluent from BTP sent to RO and RO
permeate water is recycled and RO rejects are sent to MEE followed by ATFD for
evaporation. Evaporation salts collected and sent to TSDF. MEE & ATFD vapour
condensate reused along with RO permeate.
MITIGATION MEASURES
• Effluent generated in the plant will be will be treated in Proposed ZLD system.
• The industry is proposing to install a MEE System with 10 KLD capacity and
RO system with 15 KLD capacities for treatment of 10.82 KLD effluents
generated from plant operations.
• Total Water requirement is 35.43 KLD will be met from MIDC Water supply.
Prepared By Rightsource Industrial Solutions Pvt. Ltd. Chapter – IV Page 125

EIA Report Urmila Chemopharma Pvt. Ltd.
• The leakages of oil spills from machinery shall be collected in leak proof
barrels and then disposed off to SPCB authorized dealers.
• The groundwater levels need to be monitored with setting up of piezometers
in the study area.
• Unit is proposed to recharge ground water through roof water harvesting pits
in the project area and rain water harvesting pits outside plant area wherever
possible to balance the water table.
• Minimization of water use providing drip system for gardening.
• Use of high-pressure hoses for cleaning the floor and process equipment to
reduce the amount of wastewater generated during washings.
• Conjunctive use of groundwater.
4.8 NOISE ENVIRONMENT
PREDICTION OF IMPACT
Identification of potential impacts on noise environment from the proposed project is
as important as other components of the environment. The main sources of noise
pollution are Boiler, Reactors, DG Set, Air compressors, and other Noise generating
units. Vehicular movements during operation phase for loading / unloading of raw
materials and finished products and transporting activity may also increase noise
level. Noise levels in the ambient air are well within the permissible limits given by
the National Ambient Noise level standards as confirmed during baseline study. Leq
values of the noise levels within the plant premises will be kept less than 75 – 70 dB
[A] [during day time and night time which will be within the permissible limit.
MITIGATION MEASURES
To minimize the noise pollution the unit proposes the following noise control
measures,
• Noise suppression measures such as enclosures, exhaust mufflers, buffers
and / or abatement measures that will be implemented.
• Employees will be provided with earplugs or earmuffs.
• Extensive oiling, lubrication and preventive maintenance will be carried out for
the machineries and equipments to reduce noise generation.
• Green Belt Development.
Prepared By Rightsource Industrial Solutions Pvt. Ltd. Chapter – IV Page 126

EIA Report Urmila Chemopharma Pvt. Ltd.
4.9. LAND/ SOIL ENVIRONMENT
IDENTIFICATION OF IMPACTS
Infrastructural development for the proposed project as well as subsequent
developments in the nearby area may change the land use pattern of area.
The impact on land and soil environment may be due to effluent disposal, chemical
and hazardous waste storage & handling. Spillage of chemicals during loading,
unloading and transfer, leakage of pumps, flange leakage in pipelines may create
soil/ land contamination.
PREDICTION OF IMPACTS
• The Proposed project will be carried out within the acquired land premises; there
will not be any change in land use pattern, forest cover or vegetation in
surrounding area. Moreover, electricity, water, roads, all basic amenities and
infrastructure are already available in the area.
• There will not be any disposal of untreated effluent on land. Industrial wastewater
will be properly treated and reuse in various activities within the premises.
• Spillage of chemicals during loading, unloading and transfer, leakage of pumps,
flange leakage in pipelines may create soil/land contamination. However, the
regular maintenance of pumps and flange connections in the pipelines will be
carried out and proper care will be taken while loading, unloading and transfer of
materials to avoid any soil/land contamination.
MITIGATION MEASURES
• During operational phase, the chances of any enhanced soil erosion are not
anticipated. But improper disposal of toxic wastes and accidental spillages of
toxic chemicals can pose a serious threat to the soil, ground and surface waters.
But the chances of such events cannot be quantified and predicted. Since the
industry is expected all rules and regulations relating to the use, handling and
disposal of all toxic and hazardous chemicals, no additional safety methods are
required especially to prevent contamination of soil.
• Liberal use of locally available farmyard manure will be used for the plants in the
greenbelt and block plantations for improving the productivity, fertility and health
of soils.
Prepared By Rightsource Industrial Solutions Pvt. Ltd. Chapter – IV Page 127
EIA Report Urmila Chemopharma Pvt. Ltd.
• In case of any spillage, the same will be collected and treated in ETP. The unit
will provide an adequate designated storage area with impervious flooring system
and roof cover with leachate collection system for the storage of hazardous
wastes.
• Leachate, if any will be collected and and treated in ETP. Thus, there will not be
any chances of contamination of soil due to the storage of chemicals and
hazardous waste.
• The hazardous waste generated will be stored and handle as per the Hazardous
Wastes (Management, Handling and Transboundary Movement) Rules, 2016.
• The project does not have any impact on the soils beyond the boundaries of the
project site. Physicochemical characteristics of the soil samples obtained from 7
areas in the study area and one from the project site reveals that all basically
Clay and Silty Clay in nature.
4.10 IMPACT OF SOLID WASTE
The details of hazardous waste to be generated from the proposed project, is
mentioned at Chapter -2. The current practice of storage of generated hazardous
waste, in a closed room having an impervious bottom, and disposed of as per the
prescribed guidelines will be continued for the generation of hazardous waste.
Hence, the impact due to the same will be negligible as the handling of hazardous
waste to be generated will be disposed as per guidelines. The details of Solid &
Hazardous waste details are shown in below Table. The ash from boiler will be used
in the brick manufacturing unit. The ash of 0.5 µm to 45 µm will be used in the
cement manufacturing as a filler material, stabilization of soft soils, mineral filler in
asphaltic concrete, floor and metal castings etc.
MITIGATION MEASURES
To reduce the quantity of solid and hazardous waste generation as well as possible
contamination of land (soil) due to spillages / leaks from the plant operations,
following
Mitigation measures can be implemented:
• There will not be any leakages / spillage from the raw-materials storage and
from the storage of generated effluent from the project.
Prepared By Rightsource Industrial Solutions Pvt. Ltd. Chapter – IV Page 128

EIA Report Urmila Chemopharma Pvt. Ltd.
• The generated Hazardous waste will be stored on floor with suitable packing
and this dedicated area will be covered with the roof.
• The records on quantity of hazardous waste generation and disposal will be
maintained for each category and possibilities will be explored for
minimization and reuse.
• Classification of waste, Collection, Storage, Transportation, & disposed/sale
to authorized recycler or re-user.
• Data Management and Reporting
• Personnel Training
• Hazardous & Solid Waste Generation and Disposal method.
TABLE 4.11: EXPECTED HAZARDOUS & SOLID WASTE GENERATION DETAILS AND DISPOSAL METHOD
S. No Name of the Waste Quantity in
Kg/Day Disposal Method
Hazardous Waste Details 1 Organic solid waste 134
Will be sent to Cement Industries
2 Spent Carbon 3.0 3 Solvent Distillation Residue 10 4 Organic distillate from Stripper 30 5 ETP Sludge 50
Will be sent to TSDF 6 MEE Salts 197
7 Used Oils 500 Ltrs/Annum Will be sent to SPCB Authorized Agencies for Reprocessing/Recycling
8 Detoxified Containers 300 No’s / Month After Detoxification will be sent to SPCB Authorized Agencies
9 Used Lead Acid Batteries 2 No’s/ Annum Send back to suppliers for buyback of New Batteries
Solid Waste details
10 Ash from boiler 2800 Will be sent to Brick Manufacturers
4.11 IMPACTS ON ECOLOGY
Prediction of impacts is based both on the direct and indirect; short-term as well as
long-term; irreversible and irreversible impacts that are most likely to occur owing to
the industrial activity during establishment and operation. The ecological factors that
Prepared By Rightsource Industrial Solutions Pvt. Ltd. Chapter – IV Page 129
EIA Report Urmila Chemopharma Pvt. Ltd.
are considered most significant as far as the impact on flora and fauna are
concerned:
1. Whether there shall be any reduction in species diversity.
2. Whether there shall be any habitat loss or fragmentation.
3. Whether there shall be any risk or threat to the rare or endangered or
endemic or threatened (REET) species.
4. Whether there shall be any impairment of ecological functions such as (i)
disruption of food chains, (ii) decline in species population and or (iii)
alterations in predator-prey relationships.
NEGATIVE IMPACTS
As there is change in the land use and land cover on account of the proposed
project, the proposed action is not going to have any direct and significant negative
impacts of flora and fauna or biodiversity.
MOST PROBABLE SCENARIO
As stated earlier, it is a new project there will be change in the land use and land
cover within the project site. No damage is going to be done to the existing green
cover within the project site. Except for a few weeds, there are only cultivated plants
and no RET species in the project area. No species is going to be lost on account
of the proposed project. No direct or indirect damage is expected to the flora and
fauna of the Study area. Further, as there are no rare or endangered or
endemic or threatened (REET) species, the project does not pose any threat to
the flora and fauna of the study area. As the industry is required to operate
and maintain the emissions and effluents within the limits specified by the CPCB /
SPCB, the effects of the industry on the flora and fauna of the Study area may be
negligible. Neither the storm water nor the effluent water nor any other kind of rain
or waste water from the industry shall get in to the drinking water resources.
MITIGATION MEASURES
Extensive plantation and green area development of 0.53 Acres (2148.2 Sq. m) is
planned in the proposed project along with landscaping. This is hereby ensured that
the mostly indigenous/ local plants will be planted all around the periphery of the
project area and along the compound wall sides. Plantations would be of large leaf
Prepared By Rightsource Industrial Solutions Pvt. Ltd. Chapter – IV Page 130

EIA Report Urmila Chemopharma Pvt. Ltd.
trees that provide adequate shade and are semi evergreen to evergreen. Various
native and indigenous trees would be planted for mitigation purpose.
4.12 IMPACTS & MITIGATION MEASURES OF LAND USE
4.12.1 IMPACTS ON LAND USE
An effort has been made to identify various environmental, social and ecological
impacts due to proposed project during construction and operation phases
considering present environmental scenario as baseline.
Quantification of Impacts
With the establishment of the proposed project the following changes take place w.r.t
land use within the study area.
• Total land in possession is 1.48 acres. Out of this Greenbelt is 0.53 acres and
Rest is industrial use
• Land Use of 1.48 acres (0.6 Ha.) of land envisaged for the proposed project
will change from Single crop to industrial use.
• Pucca road is available up to the site. No separate road will be laid. Width of
the road will be increased from 5 m to 10m which is very marginal.
• No township is proposed as part of the project. Hence no increase in
habitation area.
• It can be concluded that there will be no increase in an industrial area already
the site is in an existing designated industrial area. Corresponding mitigation
measures will be taken care of the adverse impacts.
4.12.2 MITIGATION MEASURES ON LAND USE
i) Water Bodies
There is a major canal passing with in the 10 kilometers radius from west to South. It
is a recently updated and visible in the satellite imagery. As it is so far away (i.e.
More than 5 Kms) from the industrial site. As it is an existing industrial area and the
unit is going to establish ZLD system, hence there is no impact on the water body by
the proposed activity.
ii) Agriculture
As the single crop and Double crop land is identified nearby the industrial area. As
the present land use by the proposed industrial site is an existing industrial site and
Prepared By Rightsource Industrial Solutions Pvt. Ltd. Chapter – IV Page 131

EIA Report Urmila Chemopharma Pvt. Ltd.
located in a designated industrial area, as the industry is going to establish ZLD
system and there is no adverse impact on surrounding crop land.
iii) Change in Topography of the Land & on Drainage Pattern
As the proposed site is already in the industrial use and located in an Industrial area,
hence there is no topographical change as well as no impact on drainage pattern.
4.13 IMPACTS ON SOCIO- ECONOMY
During the erection phase short term direct or indirect employment will be
generated. Project Proponent shall give first preference to the Local people wherever
found suitable for all the jobs in the plant operations. Economic status of the local
people will improve due to the increased employment & business opportunities,
thereby, making a positive impact to the Local Economy. Educational, medical and
housing facilities in the study area will considerably improve. Thus, the proposed
project will have significant positive impact on the socio-economic environment.
MITIGATION MEASURES
• Due to proposed activity the employment generation will be around 65
persons including, skilled, semi-skilled & unskilled labour and office staff.
Local qualified personnel can be employed.
• Under CSR & CER Budget, the proponent has allotted 10 Lakhs to take up
Environment & welfare activities.
4.14 IMPACTS ON HYDROLOGY & GEOLOGY
• The proposed project activity does not have any impact on Geology as the
project process does not involve any breaking of ground except grading of
land for infrastructure development. The project area is over Basalt.
• The generation of ash from the industry will have sedimentation affect over
the wind ward side on the soil regime as well as the study area over a period
of time affecting the Green cover/ plantation thereby affecting the growth of
plants / crops.
• The chemically loaded waste water leakage from the industry will adversely
affect the soil, surface and groundwater.
MITIGATION MEASURES
Prepared By Rightsource Industrial Solutions Pvt. Ltd. Chapter – IV Page 132
EIA Report Urmila Chemopharma Pvt. Ltd.
• There is no pumping of ground water on site and the entire water requirement
is met from the MIDC supply as the industry is located in notified Industrial
Park.
• The management is suggested to harvest the roof top water by constructing
water harvesting pit.
• The spillage of chemicals is to be totally avoided at the storage site for
possible contamination with the groundwater.
• Ash generation and storage will be monitored closely to avoid leakages and
will be disposed safely to the brick manufacturing industries and infrastructure
projects.
• The ash spreading in and around the plant will be avoided by storing under
closed conditions at dedicated place till it is disposed to users. The prevention
suggested is not to allow the waste water leakage from the industry by
implementing proper storage tanks for wastewater collection system.
Prepared By Rightsource Industrial Solutions Pvt. Ltd. Chapter – IV Page 133

ANALYSIS OF ALTERNATIVES
(TECHNOLOGY & SITE)
CHAPTER -V
EIA Report Urmila Chemopharma Pvt. Ltd.
CHAPTER – V
ANALYSIS OF ALTERNATIVES
(TECHNOLOGY & SITE)
5.0 ANALYSIS OF ALTERNATIVES
This chapter deals with the criteria for site selection and process technology in the
proposed project by assessment of alternatives and comprehensive comparison of all
potential impacts, both direct and indirect and cumulative, on the environment. The goal
of evaluating alternatives is to find the most effective way of meeting the need and
purpose of the proposal.
Urmila Chemopharma Pvt. Ltd. is proposed to Bulk Drug Intermediates manufacturing
unit at Plot No.: F-24, MIDC, Chincholi Industrial Area, Chincholi Village, Mohal Taluk,
Solapur District, Maharashtra state in an area of 1.48 acres (6000 Sq. m) based on
these factors Practicability, Feasibility, Relevance, Reasonable & Viability.
TABLE 5.1: SITE DESCRIPTION
Project location Details
Latitude & Longitude Latitude: 17°46'36.51" N Longitude: 75°48'9.69" E
Climatic Conditions
Annual Max Temp is 43.8 0C Annual Min Temp is 11 0C Normal Annual Rainfall is 742.5 mm (Source: IMD Climatatological Normals, Solapur 1981 - 2010)
Land acquired for the plant 1.48 Acres (6000 Sq. m) Land use Industrial use Nearest Habitation Chincholi Village - 1.9 Km (S) Major urban Settlements Solapur - 13 Km (SE) Nearest State Highway
Nearest National Highway
Nearest Railway station
Airport
State Highway No. 151 – 6.3 Km (E) (Solapur to Vairag Road)
National Highway No. 9 – 3.3 Km (SW) (Solapur to Pune highway)
Pakani Railway Station – 6 Km (SW)
Solapur Airport – 21.7 Km (SE) Interstate boundary None within 10 Km radius National Parks None within 10 Km radius Wild life sanctuary Great Indian Bustard (GIB) Wild Life Sanctuary, Kondi
Prepared By Rightsource Industrial Solutions Pvt. Ltd. Chapter - V Page 134
EIA Report Urmila Chemopharma Pvt. Ltd.
The proposed project site is identified based on the following considerations:
• Land acquired for proposed Project is 1.48 Acres (6000 Sq. m), topographically
the area is generally plain, with gentle slope.
• Proximity of National Highways and railways stations, for transport of raw
materials and manufactured products.
• Availability of infrastructure facilities.
• Well connected with road networks.
The location of the site have distinct advantages such as accessibility to Road, Rail,
Electricity, Ground water and other facilities which are adequate for the proposed
project and hence, no alternate sites were considered.
5.2. SELECTION OF PROCESS TECHNOLOGY
• Proposed to manufacture bulk drug intermediates.
• All the products will be manufactured on a batch basis.
• The products are categorized on similarity in process or therapeutic usage.
• Bulk Drug substances typically consist of structurally complex organic chemical
compounds which are manufactured via a series of intermediate steps and
reactions under precise process conditions.
The drug intermediates are manufactured by:
• Chemical synthesis
• Isolation / recovery from natural sources and /or
• Combination of above
In the proposed project, resource availability may limit the range of alternatives in a
particular context. Bulk drug Intermediates will be manufactured using proven Chemical
synthesis technology; hence no alternative technology has been analyzed thus, no new
or untested technology will be used.
(Gat No. 104) – 2.45 Km distance at ESE direction Water Bodies within 10 km radius Sina River flowing from NW to SW direction– 6.7 Km
Prepared By Rightsource Industrial Solutions Pvt. Ltd. Chapter - V Page 135

ENVIRONMENTAL MONITORING PROGRAM
CHAPTER -VI
EIA Report Urmila Chemopharma Pvt. Ltd.
CHAPTER – VI
ENVIRONMENTAL MONITORING PROGRAM
6.1 INTRODUCTION
Regular monitoring of environmental parameters is of immense importance to assess
the status of environment during plant in operation. With the knowledge of baseline
conditions, the monitoring programme will serve as an indicator for any deterioration in
environmental quality due to operation of the expansion project, to enable taking up
suitable mitigatory steps in time to safeguard the environment. Monitoring is as
important as that of control of pollution since efficiency of control measures can only be
determined by monitoring.
The baseline study is carried out for summer season. Hence, post project monitoring
programme of the environmental parameters is essential to take into account the
changes in the environmental quality to ascertain the following:
• State of Pollution within the plant site and in its vicinity.
• Generate data for predictive or corrective purpose in respect of pollution.
• Examine the efficiency of air pollution control system adopted at the site.
• To assess environmental impacts.
Monitoring will be carried out at the site as per the norms of CPCB.
Environmental Monitoring Programme will be conducted for various environmental
components as per conditions stipulated in Environmental Clearance Letter issued by
MoEF&CC & Consent to Operate issued by SPCB. Six monthly compliance reports will
be submitted on regular basis, to MoEF&CC, Regional Office, Maharashtra on 1st of
June & 1st of December. Quarterly compliance Report for conditions stipulated in
Consent to Operate will be submitted to SPCB on regular basis.
6.2 ENVIRONMENTAL MANAGEMENT SYSTEM
In order to maintain the environmental quality within the standards, regular monitoring of
various environmental components is necessary. The company will establish full-
fledged Environmental Management Cell (EMC) reporting directly to Plant Manager for
Prepared By Rightsource Industrial Solutions Pvt. Ltd. Chapter – VI Page 136
EIA Report Urmila Chemopharma Pvt. Ltd.
environmental monitoring and control. The EMC team will takes care of pollution
monitoring aspects and implementation of control measures.
A group of qualified and efficient engineers with technicians is deputed for maintenance,
up keeping and monitoring the pollution control equipment, to keep them in working at
the best of their efficiencies. For effective and consistent functioning of the plant, the
Environment Management System (EMS) at the site will be strengthened further with
the following:
• Environmental management cell covering EHS (Environment, Health & Safety) team
• Environmental Monitoring
• Personnel Training
• Regular Environmental Audits and Corrective Action Plan
• Documentation – Standard Operating Procedures, Environmental Management Plans
and other records.
6.3 ENVIRONMENTAL MANAGEMENT CELL RESPONSIBILITIES
It is necessary to have a permanent organizational set up charged with the task of
ensuring its effective implementation of mitigation measures and to conduct
environmental monitoring. The major duties and responsibilities of Environmental
Management Cell (EMC) will be as under:
• To implement the Environmental Management Plan (EMP)
• To ensure regulatory compliance with all relevant rules and regulations
• To ensure regular operation and maintenance of pollution control devices
• To minimize environmental impacts of operations by strict adherence to the EMP
• To initiate environmental monitoring as per approved schedule
• Review and interpretation of monitored results and corrective measures with
reference to prescribed standards
• Maintain documentation of good environmental practices and applicable
environmental laws for ready reference.
• Maintain environment related records.
Prepared By Rightsource Industrial Solutions Pvt. Ltd. Chapter – VI Page 137
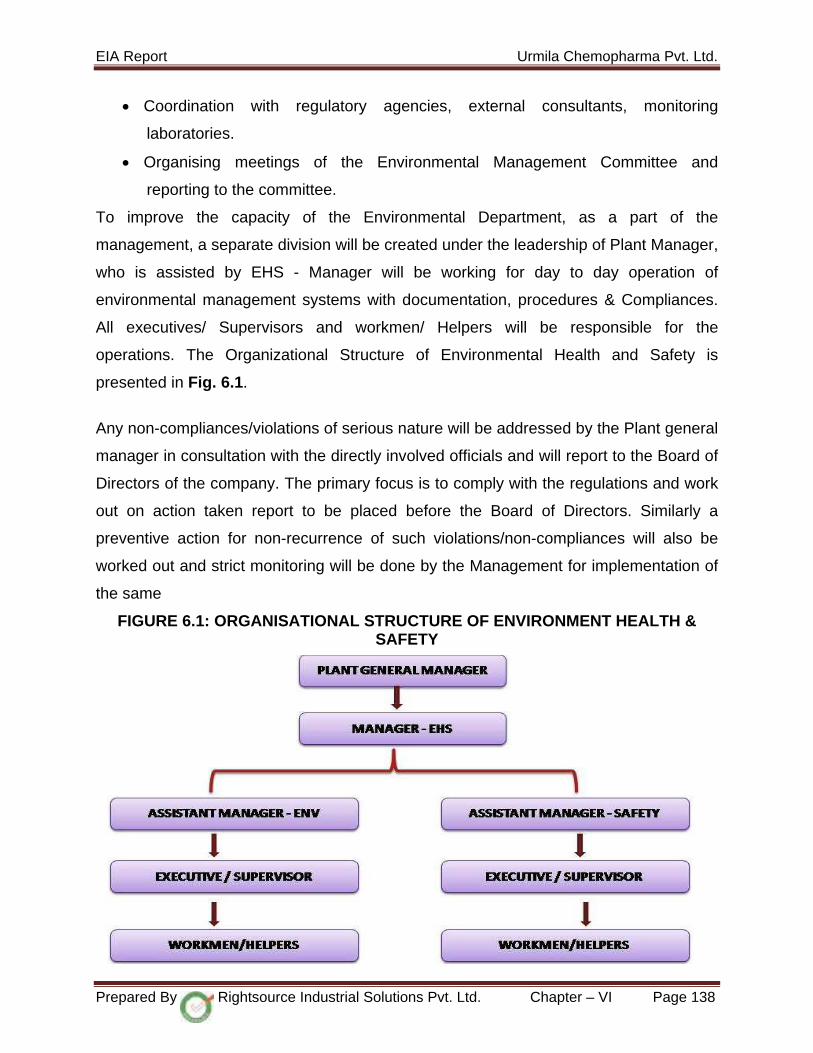
EIA Report Urmila Chemopharma Pvt. Ltd.
• Coordination with regulatory agencies, external consultants, monitoring
laboratories.
• Organising meetings of the Environmental Management Committee and
reporting to the committee.
To improve the capacity of the Environmental Department, as a part of the
management, a separate division will be created under the leadership of Plant Manager,
who is assisted by EHS - Manager will be working for day to day operation of
environmental management systems with documentation, procedures & Compliances.
All executives/ Supervisors and workmen/ Helpers will be responsible for the
operations. The Organizational Structure of Environmental Health and Safety is
presented in Fig. 6.1.
Any non-compliances/violations of serious nature will be addressed by the Plant general
manager in consultation with the directly involved officials and will report to the Board of
Directors of the company. The primary focus is to comply with the regulations and work
out on action taken report to be placed before the Board of Directors. Similarly a
preventive action for non-recurrence of such violations/non-compliances will also be
worked out and strict monitoring will be done by the Management for implementation of
the same
FIGURE 6.1: ORGANISATIONAL STRUCTURE OF ENVIRONMENT HEALTH & SAFETY
Prepared By Rightsource Industrial Solutions Pvt. Ltd. Chapter – VI Page 138
EIA Report Urmila Chemopharma Pvt. Ltd.
6.4 ENVIRONMENTAL MONITORING AND REPORTING PROCEDURE
Monitoring may take the form of direct measurement and recording of quantitative
information, such as concentrations of discharges, emissions and wastes, for
measurement against corporate or statutory standards, consent limits or targets. It may
also require measurement of ambient environmental quality in the vicinity of a site using
ecological/ biological, physical and chemical indicators. Monitoring may include socio-
economic interaction, through local liaison activities or even assessment of complaints.
Monitoring will also be required to meet compliance with statutory and corporate
requirements. Finally, monitoring results will provide the basis for auditing.
6.4.1 OBJECTIVES OF MONITORING
The objectives of environmental post-project monitoring are to
• Verify effectiveness of planning decisions
• Measure effectiveness of operational procedures
• Confirm statutory and corporate compliance and
• Identify unexpected changes.
6.4.2 MONITORING SCHEDULE FOR CONSTRUCTION AND OPERATION PHASES
Environmental monitoring schedules of Urmila Chemopharma Pvt. Ltd. are prepared
covering various phases of project advancement, such as construction and operation
phases.
Construction Phase
The proposed project envisages setting up of buildings and machinery, establishment of
production and storage facilities. The construction activities are expected to last for
about one year. As there are no major construction activities for the plant, simple and
generic environmental monitoring measures that need to be undertaken during project
construction stage.
Operation Phase
During operation stage of the project, air emissions from process areas, Boilers and DG
sets. The following attributes which meet regular monitoring based on the environmental
setting and nature of project activities are listed below:
• Source emissions and ambient air quality monitoring.
Prepared By Rightsource Industrial Solutions Pvt. Ltd. Chapter – VI Page 139

EIA Report Urmila Chemopharma Pvt. Ltd.
• Work zone monitoring for VOCs/ solvents in air.
• Ground water levels and ground water quality in bore wells.
• Hazardous and Solid waste characterization (Process hazardous waste, ash,
ETP sludge, used and waste oils).
• Soil quality testing.
• Noise level monitoring (equipment and machinery noise levels, occupational
exposures and ambient noise levels) and
• Ecological preservation and afforestation.
Monitoring Schedule: Details of the Post Project Environmental Monitoring schedule,
which will be undertaken for various environmental components, are detailed below:
TABLE 6.1: POST PROJECT ENVIRONMENTAL MONITORING SCHEDULE DETAILS
S. No. Description Frequency of Monitoring 1 Ambient Air Quality at Plant site Once in a month 2 Water Quality Monthly Basis 3 Noise Level Monitoring Monthly Basis 4 Soil Quality Once in six months
5 Stack Monitoring (Process stack, Boiler & DG set) Once in a month
Methodology Adopted: Post project monitoring will be carried out as per conditions
stipulated in Environmental Clearance Letter issued by MoEF&CC, Consent issued by
concerned State PCB as well as according to CPCB guidelines. The plant site
and the area lying within 10 km radius from the plant site is considered as Study
area. In the Study area, due to project activities slight impact may be observed and
that too is occasionally monitored to understand the impact on the surroundings.
TABLE 6.2: ENVIRONMENTAL MONITORING PLAN DURING OPERATION PHASE
S. No Potential Impact Action to be Followed
Parameters for Monitoring
Frequency of Monitoring
1 Air Emissions
Stack emissions from process stacks to be optimized and monitored
Gaseous emissions (CO2 & NH3 as applicable)
Monthly with recommended methods of CPCB
Stack emissions from Boiler, DG sets to be monitored
Gaseous emissions (PM, SO2, HC,
Monthly with recommended methods of CPCB
Prepared By Rightsource Industrial Solutions Pvt. Ltd. Chapter – VI Page 140
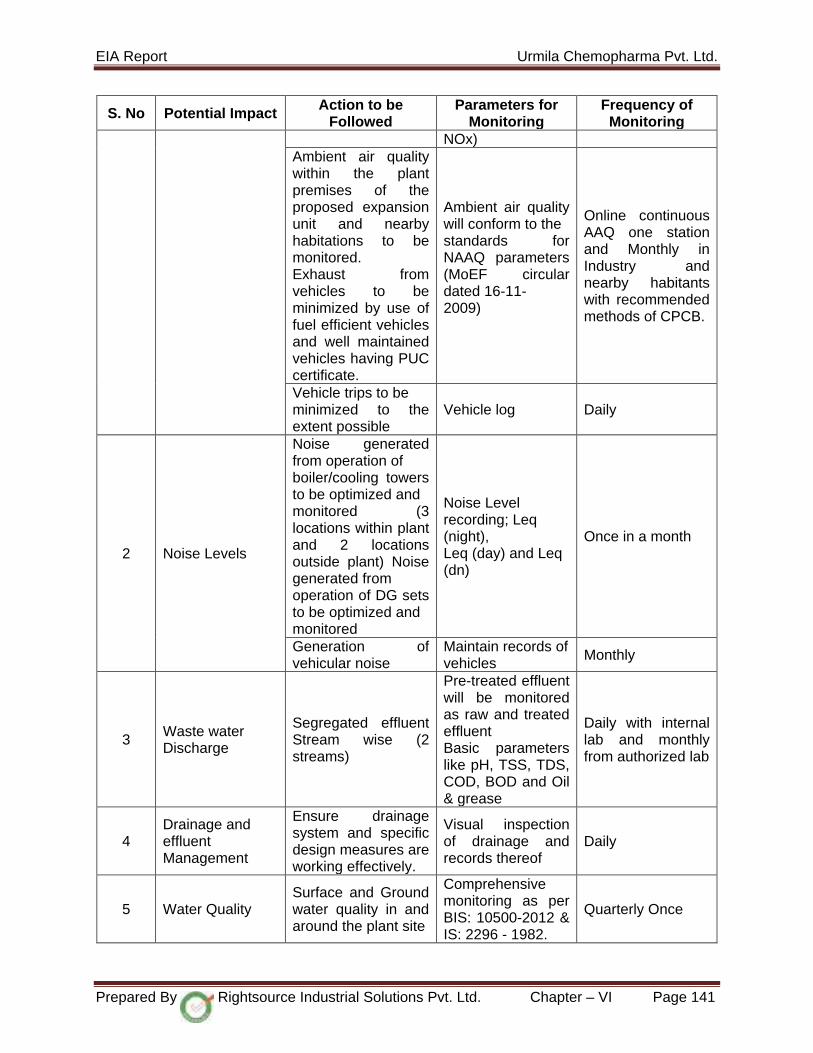
EIA Report Urmila Chemopharma Pvt. Ltd.
S. No Potential Impact Action to be Followed
Parameters for Monitoring
Frequency of Monitoring
NOx) Ambient air quality within the plant premises of the proposed expansion unit and nearby habitations to be monitored. Exhaust from vehicles to be minimized by use of fuel efficient vehicles and well maintained vehicles having PUC certificate.
Ambient air quality will conform to the standards for NAAQ parameters (MoEF circular dated 16-11- 2009)
Online continuous AAQ one station and Monthly in Industry and nearby habitants with recommended methods of CPCB.
Vehicle trips to be minimized to the extent possible
Vehicle log Daily
2 Noise Levels
Noise generated from operation of boiler/cooling towers to be optimized and monitored (3 locations within plant and 2 locations outside plant) Noise generated from operation of DG sets to be optimized and monitored
Noise Level recording; Leq (night), Leq (day) and Leq (dn)
Once in a month
Generation of vehicular noise
Maintain records of vehicles Monthly
3 Waste water Discharge
Segregated effluent Stream wise (2 streams)
Pre-treated effluent will be monitored as raw and treated effluent Basic parameters like pH, TSS, TDS, COD, BOD and Oil & grease
Daily with internal lab and monthly from authorized lab
4 Drainage and effluent Management
Ensure drainage system and specific design measures are working effectively.
Visual inspection of drainage and records thereof
Daily
5 Water Quality Surface and Ground water quality in and around the plant site
Comprehensive monitoring as per BIS: 10500-2012 & IS: 2296 - 1982.
Quarterly Once
Prepared By Rightsource Industrial Solutions Pvt. Ltd. Chapter – VI Page 141
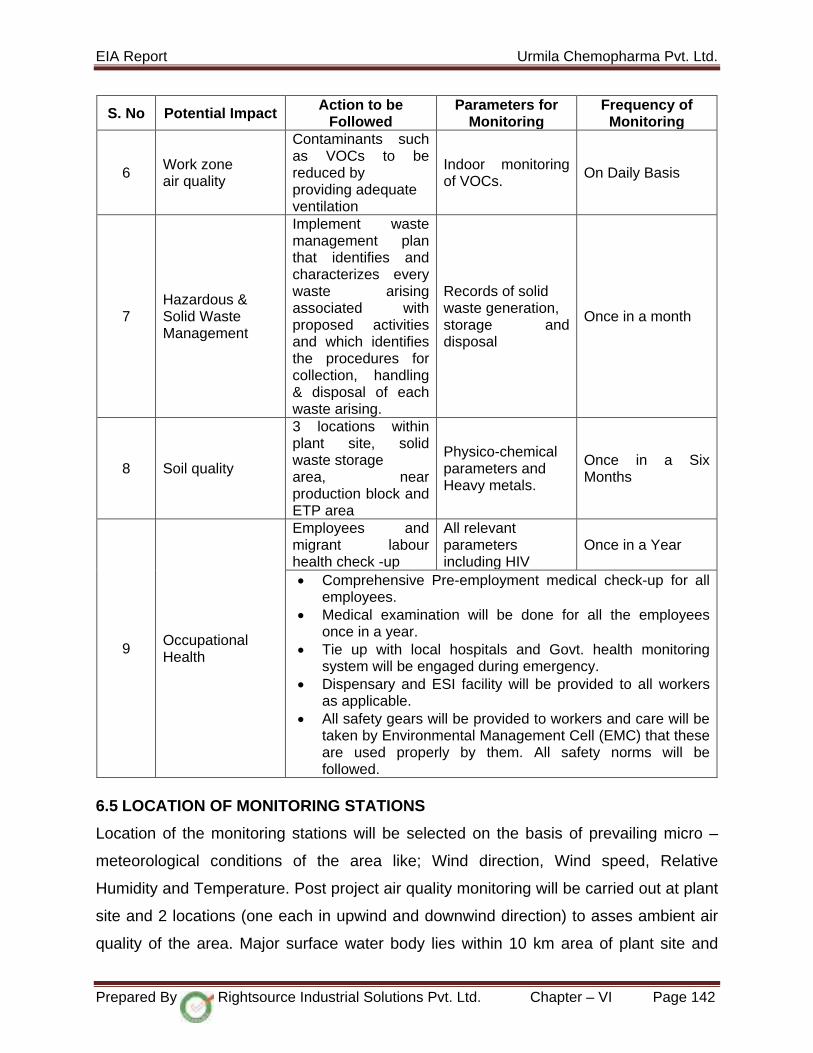
EIA Report Urmila Chemopharma Pvt. Ltd.
S. No Potential Impact Action to be Followed
Parameters for Monitoring
Frequency of Monitoring
6 Work zone air quality
Contaminants such as VOCs to be reduced by providing adequate ventilation
Indoor monitoring of VOCs. On Daily Basis
7 Hazardous & Solid Waste Management
Implement waste management plan that identifies and characterizes every waste arising associated with proposed activities and which identifies the procedures for collection, handling & disposal of each waste arising.
Records of solid waste generation, storage and disposal
Once in a month
8 Soil quality
3 locations within plant site, solid waste storage area, near production block and ETP area
Physico-chemical parameters and Heavy metals.
Once in a Six Months
9 Occupational Health
Employees and migrant labour health check -up
All relevant parameters including HIV
Once in a Year
• Comprehensive Pre-employment medical check-up for all employees.
• Medical examination will be done for all the employees once in a year.
• Tie up with local hospitals and Govt. health monitoring system will be engaged during emergency.
• Dispensary and ESI facility will be provided to all workers as applicable.
• All safety gears will be provided to workers and care will be taken by Environmental Management Cell (EMC) that these are used properly by them. All safety norms will be followed.
6.5 LOCATION OF MONITORING STATIONS
Location of the monitoring stations will be selected on the basis of prevailing micro –
meteorological conditions of the area like; Wind direction, Wind speed, Relative
Humidity and Temperature. Post project air quality monitoring will be carried out at plant
site and 2 locations (one each in upwind and downwind direction) to asses ambient air
quality of the area. Major surface water body lies within 10 km area of plant site and
Prepared By Rightsource Industrial Solutions Pvt. Ltd. Chapter – VI Page 142
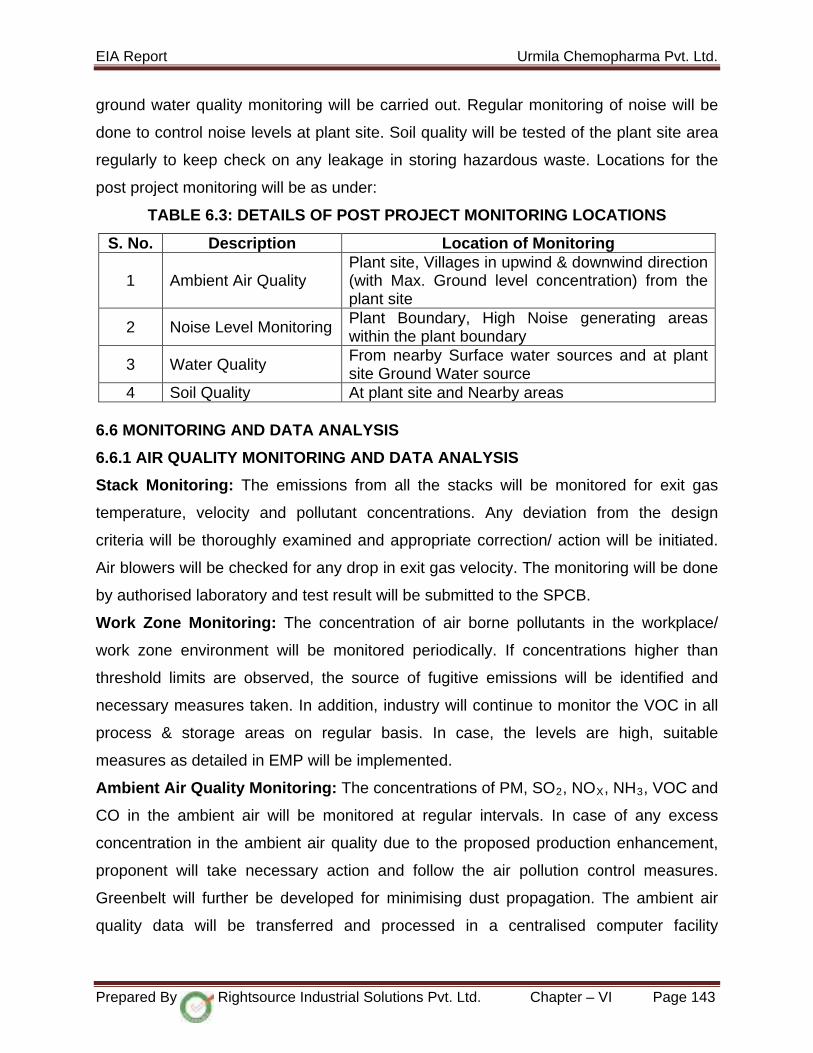
EIA Report Urmila Chemopharma Pvt. Ltd.
ground water quality monitoring will be carried out. Regular monitoring of noise will be
done to control noise levels at plant site. Soil quality will be tested of the plant site area
regularly to keep check on any leakage in storing hazardous waste. Locations for the
post project monitoring will be as under:
TABLE 6.3: DETAILS OF POST PROJECT MONITORING LOCATIONS
S. No. Description Location of Monitoring
1 Ambient Air Quality Plant site, Villages in upwind & downwind direction (with Max. Ground level concentration) from the plant site
2 Noise Level Monitoring Plant Boundary, High Noise generating areas within the plant boundary
3 Water Quality From nearby Surface water sources and at plant site Ground Water source
4 Soil Quality At plant site and Nearby areas 6.6 MONITORING AND DATA ANALYSIS
6.6.1 AIR QUALITY MONITORING AND DATA ANALYSIS
Stack Monitoring: The emissions from all the stacks will be monitored for exit gas
temperature, velocity and pollutant concentrations. Any deviation from the design
criteria will be thoroughly examined and appropriate correction/ action will be initiated.
Air blowers will be checked for any drop in exit gas velocity. The monitoring will be done
by authorised laboratory and test result will be submitted to the SPCB.
Work Zone Monitoring: The concentration of air borne pollutants in the workplace/
work zone environment will be monitored periodically. If concentrations higher than
threshold limits are observed, the source of fugitive emissions will be identified and
necessary measures taken. In addition, industry will continue to monitor the VOC in all
process & storage areas on regular basis. In case, the levels are high, suitable
measures as detailed in EMP will be implemented.
Ambient Air Quality Monitoring: The concentrations of PM, SO2, NOX, NH3, VOC and
CO in the ambient air will be monitored at regular intervals. In case of any excess
concentration in the ambient air quality due to the proposed production enhancement,
proponent will take necessary action and follow the air pollution control measures.
Greenbelt will further be developed for minimising dust propagation. The ambient air
quality data will be transferred and processed in a centralised computer facility
Prepared By Rightsource Industrial Solutions Pvt. Ltd. Chapter – VI Page 143

EIA Report Urmila Chemopharma Pvt. Ltd.
equipped with required software. Trend and statistical analysis will be carried out as per
the CPCB guidelines.
6.6.2 WATER AND WASTEWATER QUALITY MONITORING AND DATA ANALYSIS
To ensure a strict control over the water consumption, flow meters will be installed for
existing and proposed facilities for all major inlets in expansion. All leakages will be
identified and rectified. In addition, periodic water audits will be conducted to explore
possibility of water conservation.
Industry will analyse the basic parameters and the procedures prescribed in "Standard
Methods for Examination of Water and Wastewater" prepared and published jointly by
American Public Health Association (APHA), American Water Works Association
(AWWA) will be followed for all the parameters of monitoring. As per the CPCB
guidelines, industry will be installed the online sensors in the treated effluent for pH,
Conductivity, DO with night vision cameras.
Surface and Ground water Monitoring: The monitoring of surface and ground water is
the most important tool to know the variations from the baseline study. This is
indispensable as it provides detection of the presence of waste constituents in ground
water in case of leachate migration. In this project, chances are very less for leachate
as the total effluent is segregated and is sent to ETP – ZLD and the treated effluent will
be reused in cooling tower. The water samples from the nearby surface water bodies
and bore well water will be analysed for relevant parameters as per monitoring program.
Records of analysis will be documented.
Monitoring of Waste water Streams: All the segregated wastewater streams will be
regularly measured for flow rate, physico-chemical, nutrient & demand parameters. The
monitoring will be carried out from stream wise wastewater, raw and treated effluent
characteristics of ETP before recycling it into utilities. These data will be documented
and compared against the design performance values of ETPs for necessary corrective
action/ measures.
Prepared By Rightsource Industrial Solutions Pvt. Ltd. Chapter – VI Page 144

EIA Report Urmila Chemopharma Pvt. Ltd.
The ETP will be operated and maintained by existing & additional skilled and dedicated
personnel. Daily log sheets for no. of hours of the ETP operation, chemicals, electrical
and steam consumption; effluent monitored parameters with their results, etc. will
continue to be maintained.
6.6.3 NOISE LEVELS MONITORING
Noise levels in the work zone environment such as boiler house, cooling tower area,
and DG set will be monitored. The frequency will be once in a month in the work zone.
Audiometric tests will be conducted periodically for the employees working close to the
high noise sources.
6.6.4 SOIL QUALITY
Soil quality will be tested for the parameters given in schedule for every six months.
6.7 REPORTING SCHEDULES OF THE MONITORING DATA
It is proposed that voluntary reporting of environmental performance with reference to
the EMP will be undertaken. The environmental monitoring department will co-ordinate
all monitoring programmes at site and data thus generated will be regularly furnished to
the State regulatory agency. The frequency of reporting will be on monthly basis to the
local state PCB officials and six monthly reports to Regional Office of MoEF&CC. The
Environmental Audit reports will be prepared for the entire year of operations and will be
regularly submitted to regulatory authorities in Form-V Environmental Statement.
6.8 ENVIRONMENTAL LABORATORY
Environmental laboratory will be well-equipped analytical instruments and consumable
items for monitoring of environmental parameters at the site. Alternatively, monitoring
will be continued to be outsourced to a recognized/approved laboratory. The equipment
and consumable items will be made available at the site for environmental monitoring.
The sampling is done as per the standard procedures laid down by IS: 2488. The
equipment’s will be analysed in the Environmental Laboratory are Heating Mantle,
Digital conductivity meter, Digital pH Meter, COD Digestion Apparatus, BOD Incubator,
Hot air oven, Muffle Furnace, Thermometer, Microprocessor based conductivity meter,
Prepared By Rightsource Industrial Solutions Pvt. Ltd. Chapter – VI Page 145
EIA Report Urmila Chemopharma Pvt. Ltd.
Microprocessor based pH Stat Analyzer, Electronic Balance, Hot Plate, Mechanical
Balance, Hand Held DO meter, Hand Held Turbidity meter, Magnetic Stirrer and
consumables, chemicals and Glassware.
6.8.1. AIR QUALITY MONITORING
Proposed: Manual AAQ monitoring stations – 3 Nos., on monthly basis third party
monitoring will be done by NABL / MoEF&CC authorised laboratory and the test report
will be verified for any deviation in air quality standards for corrective actions and the
test reports will be submitted to the respective SPCB.
6.9. OCCUPATIONAL SAFETY AND HEALTH ASPECTS
All the preventive and corrective actions of environmental impacts to protect the health
of all the employees from any possible occupational health problems, the periodical
medical and health checkups of all the employees will be done to assess the any
occupational health problems.
Prepared By Rightsource Industrial Solutions Pvt. Ltd. Chapter – VI Page 146

ADDITIONAL STUDIES
CHAPTER -VII

EIA Report Urmila Chemopharma Pvt. Ltd.
CHAPTER – VII
ADDITIONAL STUDIES
[RISK ASSESSMENT & DISASTER MANAGEMENT]
Urmila Chemopharma Pvt. Ltd. is proposed to establish a Bulk Drug Intermediates
manufacturing unit at Plot No.: F-24, MIDC, Chincholi Industrial Area, Chincholi
Village, Mohal Taluk, Solapur District, Maharashtra state and is covered under
Category- A of the EIA Notification – 2006.
7.1 ADDITIONAL STUDIES
In order to support the environment impact assessment and environment
management plan, following additional studies have been included in this report.
• Risk Assessment
• Disaster management plan
• Occupational Health
7.1.1 SCOPE OF THIS STUDY
The QRA (Quantitative Risk Assessment) study has been conducted considering the
Terms of References (ToR) given for Environment Clearance (EC) by SEAC
Committee, GoI, New Delhi.
The study has been carried out with a view to comply ToR points with respect to Risk
assessment.
7.1.2 Methodology
The following parameters are considered to prepare Quantitative Risk Assessment.
1. Discussions were held with Plant officials on proposed individual safety
systems of plant operations.
2. Hazard Identification exercise in coordination with plant officials was
conducted taking into consideration the proposed storage of Hazardous
Chemicals/ Solvents, operating parameters and proposed safety systems.
3. Containment failure scenarios related to flammable chemicals & hazardous
chemicals have been considered for Risk Assessment and consequences in
detail. Thus, this study is mainly oriented towards acute risks rather than
chronic risks.
Prepared By Rightsource Industrial Solutions Pvt. Ltd. Chapter – VII Page 147

EIA Report Urmila Chemopharma Pvt. Ltd.
4. Discussed on proposed Raw materials Hazards and their Risks in handling.
7.2 Risk Assessment
Urmila Chemopharma Private Limited will handle various chemicals, some of which
are hazardous in nature by virtue of their intrinsic chemical properties or their
operating temperatures or pressures or a combination of them. Fire, explosion, toxic
release or combinations of them are the hazards associated with industrial plants
using hazardous chemicals. More comprehensive and systematic methods have
been adopted in Hazard Identification and Quantitative Risk Assessment to improve
upon the integrity, reliability and safety of the plants. The same has been discussed
in detail under their respective headings.
7.2.1 Objectives of Risk Assessment
Risk analysis follows an extensive hazard analysis. It involves the identification and
assessment of risks the neighboring populations are exposed to as a result of
hazards present. This requires a thorough knowledge of failure probability, credible
accident scenario, vulnerability of population etc., much of this information is difficult
to get or generate. Consequently, the risk analysis is often confined to maximum
credible accident studies.
The risk assessment process is primarily based on likelihood of occurrence of the
risks identified and their possible hazard consequences particularly being evaluated
through hypothetical accident scenarios. With respect to the proposed project, major
risks are leaks from storage tanks, rupture of Pipelines, Spillages from containers
during transfer operations and Storage in the Ware house have been assessed. Risk
associated with the flammable chemicals storages have been determined semi-
quantitatively as the product of likelihood/probability and severity/consequence by
using order of magnitude data (Risk ranking = severity/consequence factor X
likelihood/probability factor). Significance of such project related risks have been
established through their classification as high, medium, low, very low depending
upon risk ranking.
It provides basis for:
• The type and nature of its on-site and off-site emergency plan
• The types of safety measures required
Prepared By Rightsource Industrial Solutions Pvt. Ltd. Chapter – VII Page 148
EIA Report Urmila Chemopharma Pvt. Ltd.
7.2.2 IDENTIFICATION OF HAZARDS
• Hazard identification is carried out to ascertain the controls required and
available in order to mitigate the risk of exposure to the hazards. This would
be substantially helpful in overcoming costly errors and prolonged delays that
may be caused due to the design changes that may be required on a later
date.
• Hazard assessment in the proposed plant is carried out examining the Liquid
chemicals storage in the ware house such as Nitric acid, Ammonia, Acetic
acid and Flammable liquid chemical such as Toluene. This is to find out the
adequate facilities in place to overcome the Risks of exposure to the Hazards.
Following are the Hazards identified in proposed plant activities:
• Fire Hazards due to Flammable chemicals leakage from storage Containers,
pipe line ruptures during transfer of material which may get ignited due to any
spark.
• Fire hazard due to leakage of flammable chemicals from transfer pumps gland
leaks.
• Spillage/Leakage of Hazardous chemicals -Toluene, Sulfuric acid, Acetic acid,
Ammonia which leads to Air pollution, Water pollution and Soil pollution
The exposure to hazards depends upon the concentration of hazard, Frequency and
duration. The exposure to hazard could be controlled by reducing either the
concentration of hazard, frequency or duration.
After a critical analysis of the chemicals propose to use, stored and for products to
manufacture a defined safe operating procedures will be in place with safety and
mitigation measures to overcome the hazards.
The exposure to the hazard could be controlled by implementing the following:
• Engineering controls at the source
• Environmental controls that remove the hazard from the environment
Inspection of solvent transfer pipeline, Acid transfer lines & Ammonia gas conveying
lines once in a month.
Prepared By Rightsource Industrial Solutions Pvt. Ltd. Chapter – VII Page 149
EIA Report Urmila Chemopharma Pvt. Ltd.
Earthing to all storage tanks and providing jumpers to transfer pipelines to have
continuity of earthing.
• Providing suitable personal protective equipment
• Employing experienced trained personnel in handling of Acids, Ammonia and
flammable liquid chemical such as Toluene.
All the proposed process reactors will have temperature control and pressure control
system for process as well as suitable Rupture disc followed by a safety valve to
avoid explosion due to excess pressure.
Prepared By Rightsource Industrial Solutions Pvt. Ltd. Chapter – VII Page 150

EIA Report Urmila Chemopharma Pvt. Ltd.
TABLE 7.1: AREA WISE IDENTIFIED HAZARDS, PRECAUTIONS PROPOSED WITH MITIGATION MEASURES
S. No. AREA IDENTIFIED
HAZARD
SEVERITY & NO. OF
PERSONS EXPOSED
PRECAUTIONS PROPOSED MITIGATION MEASURES
1] Raw Material Storage area
Spillage of chemicals
Low to medium & 4 persons
1. Approved layout as per legal requirements.
2. Flame proof electrical fittings will be installed
3. Chemicals will be stored in safe Containers with secondary containment to prevent spillages.
4. Storage quantity is limited 5. Storage area will be well ventilated
by a forced air ventilation system. 6. Material will be accessed only by
authorized personnel using mechanized systems
7. Double door entry to ensure a clean atmosphere.
8. Showers will be provided for decontamination.
9. Personnel will be provided with full body protection suits and nose masks to prevent exposure to chemicals.
10. Fire hydrant system with hydrant points with hose reels and nozzles
1. Area will be cordoned off. 2. Information will be passed to
Emergency control center is informed.
3. Information will be given to the declarer of emergency on the scale of Leakage.
4. Emergency Response teams will be kept on alert for swift response.
5. All hot works being carried out in the surrounding areas will be stopped
6. Personnel working in the area will be evacuated.
7. Spilled powders will be collected using vacuum cleaners.
8. The spillage will be cleared and the area is made fit work
9. In case of liquid chemical spillage, the container will be shifted from ware house to the outside for arresting the leakage and transferring the contents to another
Prepared By Rightsource Industrial Solutions Pvt. Ltd. Chapter - VII Page 151

EIA Report Urmila Chemopharma Pvt. Ltd.
S. No. AREA IDENTIFIED
HAZARD
SEVERITY & NO. OF
PERSONS EXPOSED
PRECAUTIONS PROPOSED MITIGATION MEASURES
will be installed to mitigate fire hazards
11. Fire extinguishers will be deployed adequately
12. Fully fledged medical center will be arranged
13. Periodical occupational health checks will be done to personnel working in the area to Access health effects, if any.
14. Liquid chemicals such as Acetic acid, H2SO4, Ammonia will be stored in dedicated area.
Solid chemicals will be stored in dedicated area. Solid and liquid chemicals will not be stored in the same area.
vessel depends on situation. The area where leakage is occurred will be neutralized if necessary and cleaned. The warehouse will have good ventilation so as to minimize the concentration of respective chemical in the working area.
2] Solvents Storage area
Fire, Flammable area of vapor cloud
Medium to High & 2 persons
1. Storage facility will be provided in isolated area to have natural ventilation
2. Flameproof electrical fittings to be allowed in storage area to prevent any fire hazard.
3. No electrical gadgets or items
1. Area will be cordoned off. 2. No Hot work will be carried out in
the vicinity to prevent accidental spread of fire.
3. Personnel working in the area will be evacuated
4. Emergency control center will be
Prepared By Rightsource Industrial Solutions Pvt. Ltd. Chapter - VII Page 152
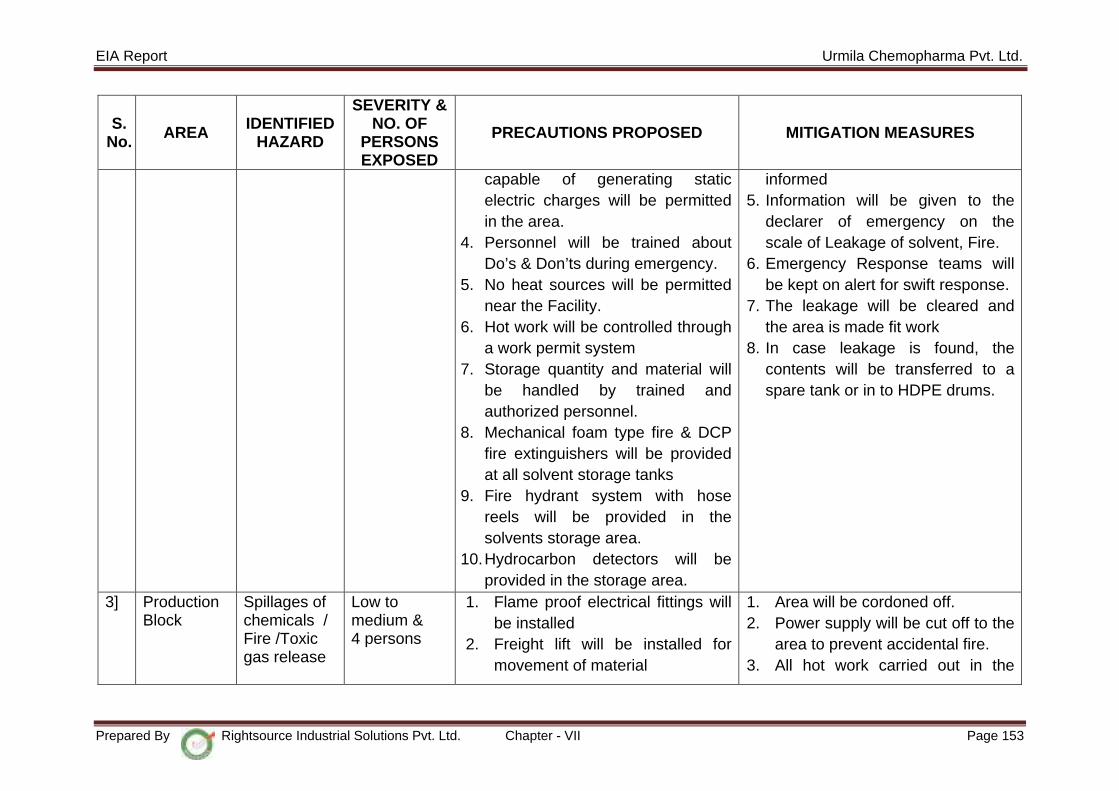
EIA Report Urmila Chemopharma Pvt. Ltd.
S. No. AREA IDENTIFIED
HAZARD
SEVERITY & NO. OF
PERSONS EXPOSED
PRECAUTIONS PROPOSED MITIGATION MEASURES
capable of generating static electric charges will be permitted in the area.
4. Personnel will be trained about Do’s & Don’ts during emergency.
5. No heat sources will be permitted near the Facility.
6. Hot work will be controlled through a work permit system
7. Storage quantity and material will be handled by trained and authorized personnel.
8. Mechanical foam type fire & DCP fire extinguishers will be provided at all solvent storage tanks
9. Fire hydrant system with hose reels will be provided in the solvents storage area.
10. Hydrocarbon detectors will be provided in the storage area.
informed 5. Information will be given to the
declarer of emergency on the scale of Leakage of solvent, Fire.
6. Emergency Response teams will be kept on alert for swift response.
7. The leakage will be cleared and the area is made fit work
8. In case leakage is found, the contents will be transferred to a spare tank or in to HDPE drums.
3] Production Block
Spillages of chemicals / Fire /Toxic gas release
Low to medium & 4 persons
1. Flame proof electrical fittings will be installed
2. Freight lift will be installed for movement of material
1. Area will be cordoned off. 2. Power supply will be cut off to the
area to prevent accidental fire. 3. All hot work carried out in the
Prepared By Rightsource Industrial Solutions Pvt. Ltd. Chapter - VII Page 153

EIA Report Urmila Chemopharma Pvt. Ltd.
S. No. AREA IDENTIFIED
HAZARD
SEVERITY & NO. OF
PERSONS EXPOSED
PRECAUTIONS PROPOSED MITIGATION MEASURES
3. Material will be stored at production blocks in safe containers for batch charging with secondary containment to prevent Spillages.
4. Earthing and bonding will be carried out for all reactor vessels and pipelines
5. Nitrogen lines will be provided to reaction vessel to create inert atmosphere inside the reactor to avoid fire and explosion
6. Work permit system will be implemented for hazard assessment in case of any hot work / work at elevated places.
7. Manufacturing area will be ventilated by a Forced air ventilation system to prevent formation of flammable mixture.
8. Fire hydrant system with hydrant points with hose reels and nozzles will be installed to mitigate fire hazards
vicinity will be stopped. 4. Emergency control center will be
informed. 5. Information will be given to the
declarer of emergency on the scale of spillage / fire/Toxic gas release
6. Emergency Response teams will be kept on alert for swift response.
7. Personnel working in the area will be evacuated.
8. Scrubber will be kept in operating condition with caustic scrubbing solution
9. Fire hydrant system will be put in use.
10. If situation beyond control information will be given to Inspector of factories, police, fire department for their assistance.
Prepared By Rightsource Industrial Solutions Pvt. Ltd. Chapter - VII Page 154

EIA Report Urmila Chemopharma Pvt. Ltd.
S. No. AREA IDENTIFIED
HAZARD
SEVERITY & NO. OF
PERSONS EXPOSED
PRECAUTIONS PROPOSED MITIGATION MEASURES
Production block
Ammonia Toxic gas release
8 persons
9. Fire extinguishers will be deployed adequately
10. Emergency exit door will be provided to each floor for safe escape in case of emergency
11. Eye wash fountain / Body shower will be provided for decontamination at each floor.
12. Limit switches will be provided for centrifuges for safe operation.
13. Nitrogen purging will be arranged for each Centrifuge to prevent formation of explosive flammable mixture.
14. Each reactor will be connected to a scrubber to neutralize or decrease the pressure in case sudden rise in pressure.
Material will be transferred to reactor by experienced operating personnel under mild negative pressure to avoid release of fumes to atmosphere
1. Scrubber will be kept in operating
condition with cooled water circulation during transfer of the material.
Prepared By Rightsource Industrial Solutions Pvt. Ltd. Chapter - VII Page 155
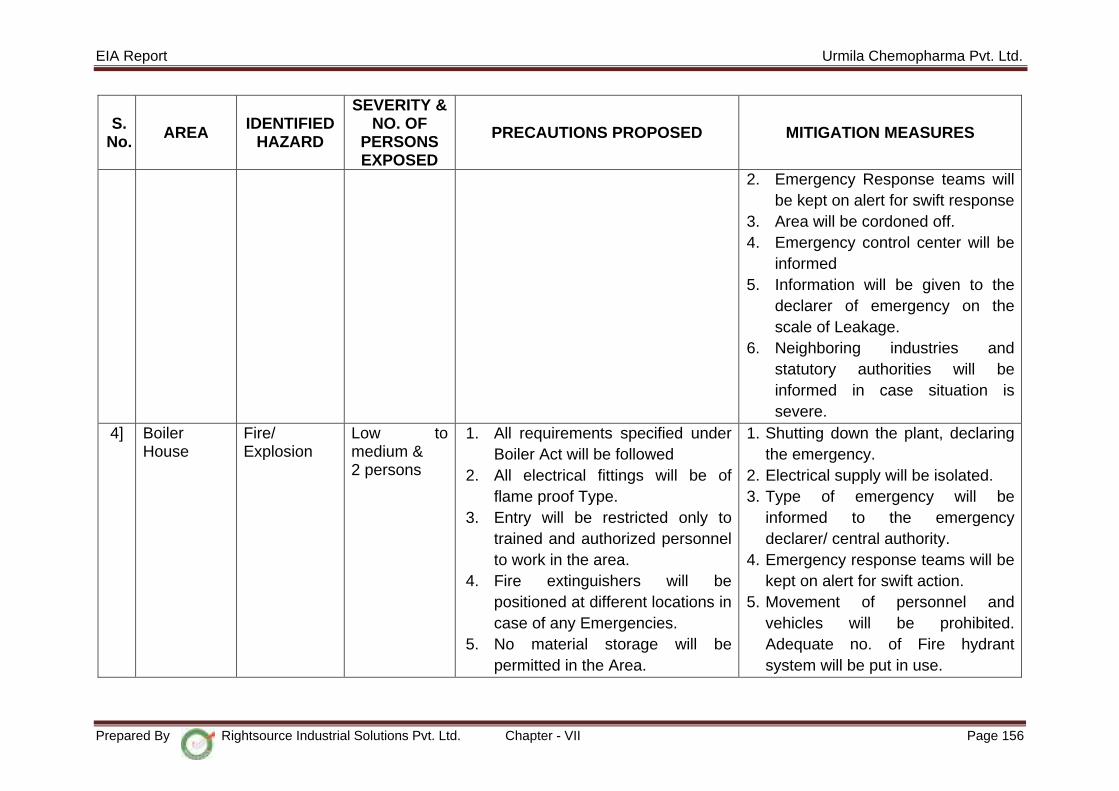
EIA Report Urmila Chemopharma Pvt. Ltd.
S. No. AREA IDENTIFIED
HAZARD
SEVERITY & NO. OF
PERSONS EXPOSED
PRECAUTIONS PROPOSED MITIGATION MEASURES
2. Emergency Response teams will be kept on alert for swift response
3. Area will be cordoned off. 4. Emergency control center will be
informed 5. Information will be given to the
declarer of emergency on the scale of Leakage.
6. Neighboring industries and statutory authorities will be informed in case situation is severe.
4] Boiler House
Fire/ Explosion
Low to medium & 2 persons
1. All requirements specified under Boiler Act will be followed
2. All electrical fittings will be of flame proof Type.
3. Entry will be restricted only to trained and authorized personnel to work in the area.
4. Fire extinguishers will be positioned at different locations in case of any Emergencies.
5. No material storage will be permitted in the Area.
1. Shutting down the plant, declaring the emergency.
2. Electrical supply will be isolated. 3. Type of emergency will be
informed to the emergency declarer/ central authority.
4. Emergency response teams will be kept on alert for swift action.
5. Movement of personnel and vehicles will be prohibited. Adequate no. of Fire hydrant system will be put in use.
Prepared By Rightsource Industrial Solutions Pvt. Ltd. Chapter - VII Page 156

EIA Report Urmila Chemopharma Pvt. Ltd.
S. No. AREA IDENTIFIED
HAZARD
SEVERITY & NO. OF
PERSONS EXPOSED
PRECAUTIONS PROPOSED MITIGATION MEASURES
6. Auto level controller for Water and high temperature alarms will be provided.
7. Water hardness will be checked on shift wise.
8. Area will be well ventilated and illuminated for safe working.
9. 24 x 7 manning of the area is done for monitoring of operation.
10. All maintenance /repair works will be carried out after issuing work permits and under constant supervision of experts.
11. Periodical cleaning of soot in furnace to prevent formation of explosive mixtures.
12. Checking of boiler internals as per given schedule to prevent Accidents.
13. Signage’s will be displayed to inform personnel about the hazards present in the area
5] Diesel Generator
Noise & Fire Low & 1 person
1. Noise abatement through modular acoustic paneling of D. G. set
1. Information will be given to Emergency control center.
Prepared By Rightsource Industrial Solutions Pvt. Ltd. Chapter - VII Page 157
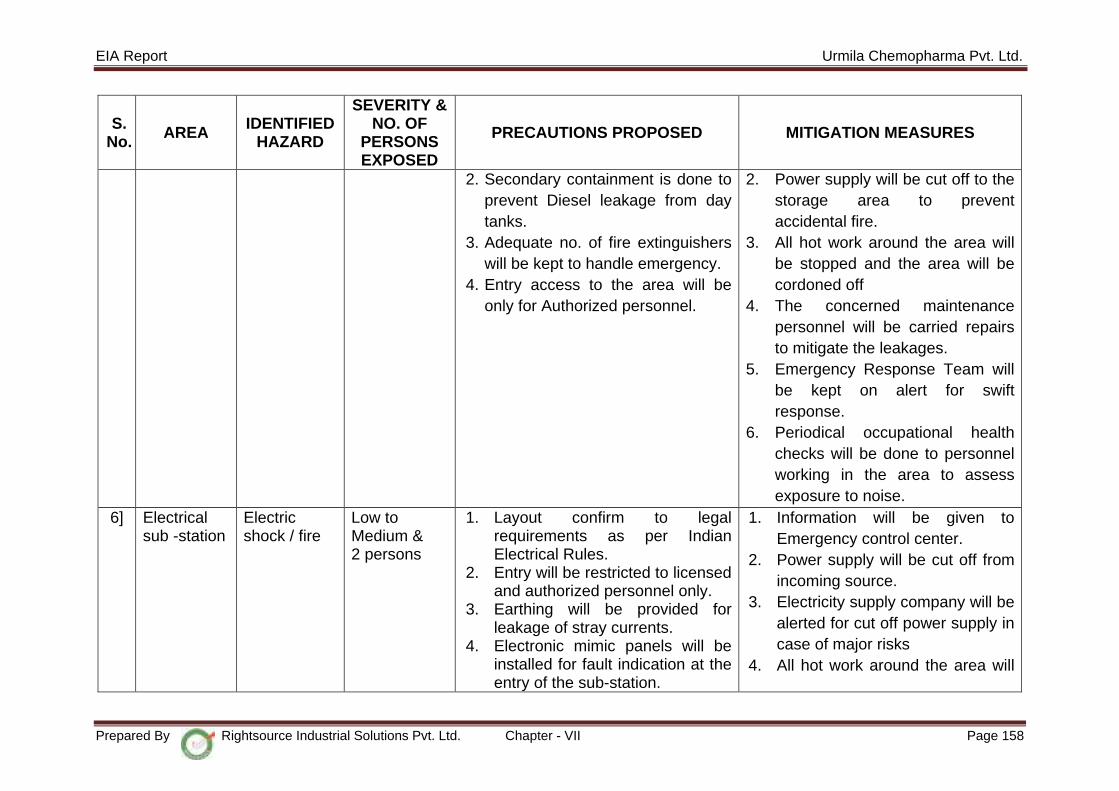
EIA Report Urmila Chemopharma Pvt. Ltd.
S. No. AREA IDENTIFIED
HAZARD
SEVERITY & NO. OF
PERSONS EXPOSED
PRECAUTIONS PROPOSED MITIGATION MEASURES
2. Secondary containment is done to prevent Diesel leakage from day tanks.
3. Adequate no. of fire extinguishers will be kept to handle emergency.
4. Entry access to the area will be only for Authorized personnel.
2. Power supply will be cut off to the storage area to prevent accidental fire.
3. All hot work around the area will be stopped and the area will be cordoned off
4. The concerned maintenance personnel will be carried repairs to mitigate the leakages.
5. Emergency Response Team will be kept on alert for swift response.
6. Periodical occupational health checks will be done to personnel working in the area to assess exposure to noise.
6] Electrical sub -station
Electric shock / fire
Low to Medium & 2 persons
1. Layout confirm to legal requirements as per Indian Electrical Rules.
2. Entry will be restricted to licensed and authorized personnel only.
3. Earthing will be provided for leakage of stray currents.
4. Electronic mimic panels will be installed for fault indication at the entry of the sub-station.
1. Information will be given to Emergency control center.
2. Power supply will be cut off from incoming source.
3. Electricity supply company will be alerted for cut off power supply in case of major risks
4. All hot work around the area will
Prepared By Rightsource Industrial Solutions Pvt. Ltd. Chapter - VII Page 158
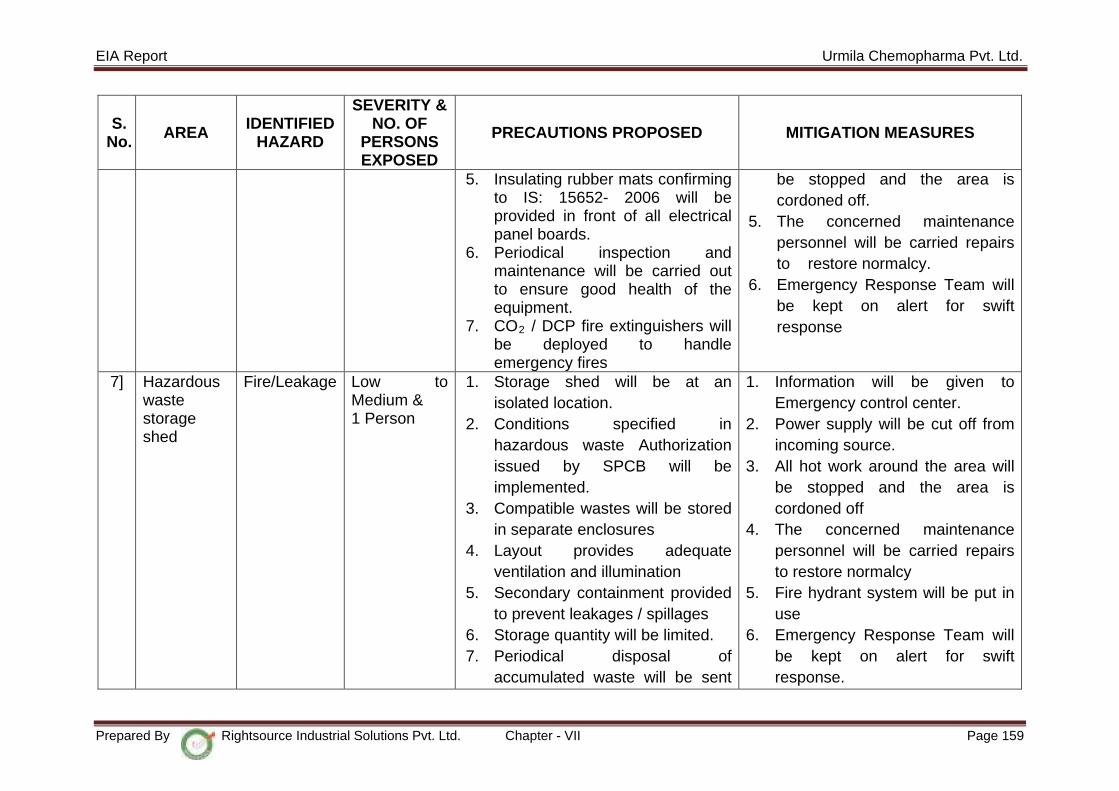
EIA Report Urmila Chemopharma Pvt. Ltd.
S. No. AREA IDENTIFIED
HAZARD
SEVERITY & NO. OF
PERSONS EXPOSED
PRECAUTIONS PROPOSED MITIGATION MEASURES
5. Insulating rubber mats confirming to IS: 15652- 2006 will be provided in front of all electrical panel boards.
6. Periodical inspection and maintenance will be carried out to ensure good health of the equipment.
7. CO2 / DCP fire extinguishers will be deployed to handle emergency fires
be stopped and the area is cordoned off.
5. The concerned maintenance personnel will be carried repairs to restore normalcy.
6. Emergency Response Team will be kept on alert for swift response
7] Hazardous waste storage shed
Fire/Leakage
Low to Medium & 1 Person
1. Storage shed will be at an isolated location.
2. Conditions specified in hazardous waste Authorization issued by SPCB will be implemented.
3. Compatible wastes will be stored in separate enclosures
4. Layout provides adequate ventilation and illumination
5. Secondary containment provided to prevent leakages / spillages
6. Storage quantity will be limited. 7. Periodical disposal of
accumulated waste will be sent
1. Information will be given to Emergency control center.
2. Power supply will be cut off from incoming source.
3. All hot work around the area will be stopped and the area is cordoned off
4. The concerned maintenance personnel will be carried repairs to restore normalcy
5. Fire hydrant system will be put in use
6. Emergency Response Team will be kept on alert for swift response.
Prepared By Rightsource Industrial Solutions Pvt. Ltd. Chapter - VII Page 159

EIA Report Urmila Chemopharma Pvt. Ltd.
S. No. AREA IDENTIFIED
HAZARD
SEVERITY & NO. OF
PERSONS EXPOSED
PRECAUTIONS PROPOSED MITIGATION MEASURES
to authorize landfills. 8. Flame proof electrical fittings will
be installed to prevent fire / explosion hazards
9. Eye wash / body shower will be provided for decontamination in case of spillage on body parts.
10. PPE box will be equipped with gum boots, splash proof safety goggles, aprons for use during handling of chemicals.
11. Access to the area will be restricted to authorize personnel only.
12. Fire hydrant point with hose reels will be provided for fire mitigation
7. Support of external agencies will be sought in case situation poses major risks and is not controllable by in-house infrastructure
Prepared By Rightsource Industrial Solutions Pvt. Ltd. Chapter - VII Page 160
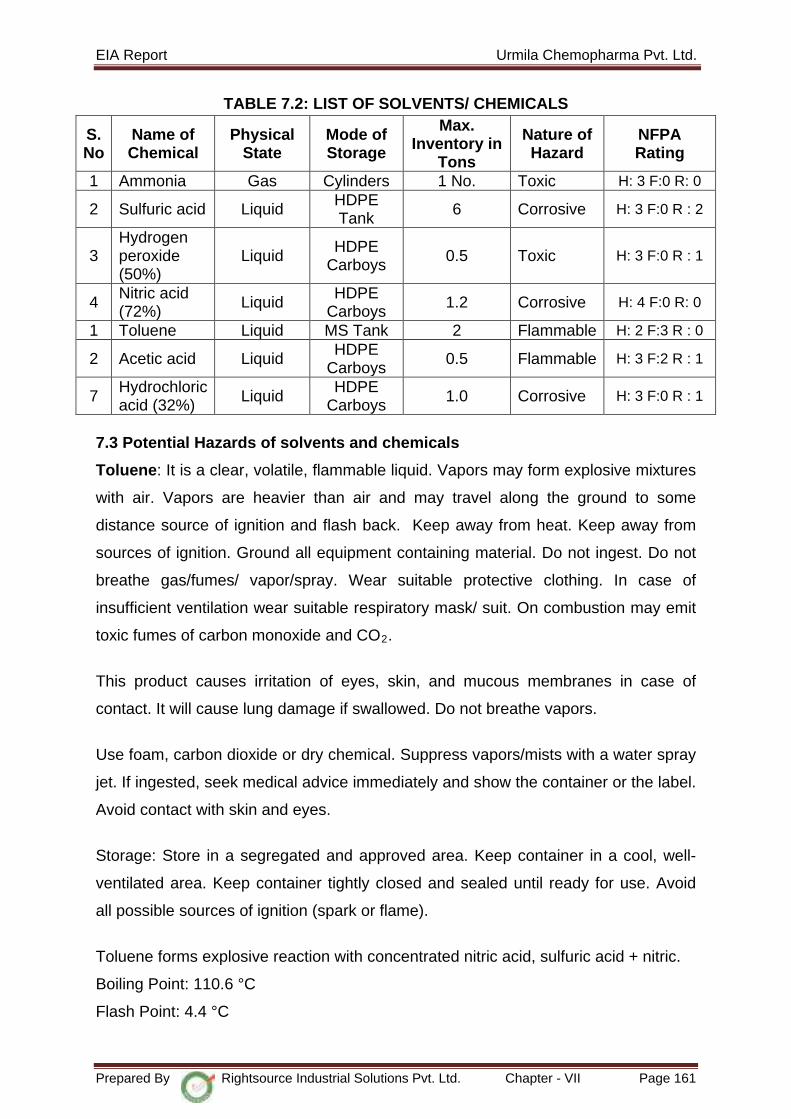
EIA Report Urmila Chemopharma Pvt. Ltd.
TABLE 7.2: LIST OF SOLVENTS/ CHEMICALS
S. No
Name of Chemical
Physical State
Mode of Storage
Max. Inventory in
Tons
Nature of Hazard
NFPA Rating
1 Ammonia Gas Cylinders 1 No. Toxic H: 3 F:0 R: 0
2 Sulfuric acid Liquid HDPE Tank 6 Corrosive H: 3 F:0 R : 2
3 Hydrogen peroxide (50%)
Liquid HDPE Carboys 0.5 Toxic H: 3 F:0 R : 1
4 Nitric acid (72%) Liquid HDPE
Carboys 1.2 Corrosive H: 4 F:0 R: 0
1 Toluene Liquid MS Tank 2 Flammable H: 2 F:3 R : 0
2 Acetic acid Liquid HDPE Carboys 0.5 Flammable H: 3 F:2 R : 1
7 Hydrochloric acid (32%) Liquid HDPE
Carboys 1.0 Corrosive H: 3 F:0 R : 1
7.3 Potential Hazards of solvents and chemicals
Toluene: It is a clear, volatile, flammable liquid. Vapors may form explosive mixtures
with air. Vapors are heavier than air and may travel along the ground to some
distance source of ignition and flash back. Keep away from heat. Keep away from
sources of ignition. Ground all equipment containing material. Do not ingest. Do not
breathe gas/fumes/ vapor/spray. Wear suitable protective clothing. In case of
insufficient ventilation wear suitable respiratory mask/ suit. On combustion may emit
toxic fumes of carbon monoxide and CO2.
This product causes irritation of eyes, skin, and mucous membranes in case of
contact. It will cause lung damage if swallowed. Do not breathe vapors.
Use foam, carbon dioxide or dry chemical. Suppress vapors/mists with a water spray
jet. If ingested, seek medical advice immediately and show the container or the label.
Avoid contact with skin and eyes.
Storage: Store in a segregated and approved area. Keep container in a cool, well-
ventilated area. Keep container tightly closed and sealed until ready for use. Avoid
all possible sources of ignition (spark or flame).
Toluene forms explosive reaction with concentrated nitric acid, sulfuric acid + nitric.
Boiling Point: 110.6 °C
Flash Point: 4.4 °C
Prepared By Rightsource Industrial Solutions Pvt. Ltd. Chapter - VII Page 161

EIA Report Urmila Chemopharma Pvt. Ltd.
Flammable Limits: LOWER: 1.1% UPPER: 7.1%
Acetic acid:
Above 39 °C explosive vapor/ air mixtures may be formed. Risk of fire and explosion
on contact with strong oxidants. It is flammable.
Above 39 °C use a closed system, ventilation and explosion-proof electrical
equipment. Remove all ignition sources.
Personal protection: chemical protection suit including self-contained breathing
apparatus. Do NOT let this chemical enter the environment. Collect leaking liquid in
sealable containers.
Cautiously neutralize spilled liquid with sodium carbonate only under the
responsibility of an expert.
Effects of short-term exposure: The substance is corrosive to the eyes, skin and
respiratory tract. Corrosive on ingestion. Inhalation may cause lung edema.
Protective Clothing:
Skin: Wear appropriate personal protective clothing to prevent skin contact.
Eyes: Wear appropriate eye protection to prevent eye contact.
Wash skin: The worker should immediately wash the skin when it becomes
contaminated.
Remove: Work clothing that becomes wet or significantly contaminated should be
removed and replaced.
Provide: Eyewash fountains should be provided in areas where there is any
possibility that workers could be exposed to the substance; this is irrespective of the
recommendation involving the wearing of eye protection.
Sulfuric acid:
Water Reaction
Reaction with water is negligible unless acid strength is above 70% then heat from
hydrolysis is extreme, may cause severe burns
Fire Hazard
It is highly reactive and capable of igniting finely-divided combustible materials on
contact. When heated, it emits highly toxic fumes. Avoid heat; water and organic
materials. Sulfuric acid is explosive or incompatible with an enormous array of
Prepared By Rightsource Industrial Solutions Pvt. Ltd. Chapter - VII Page 162
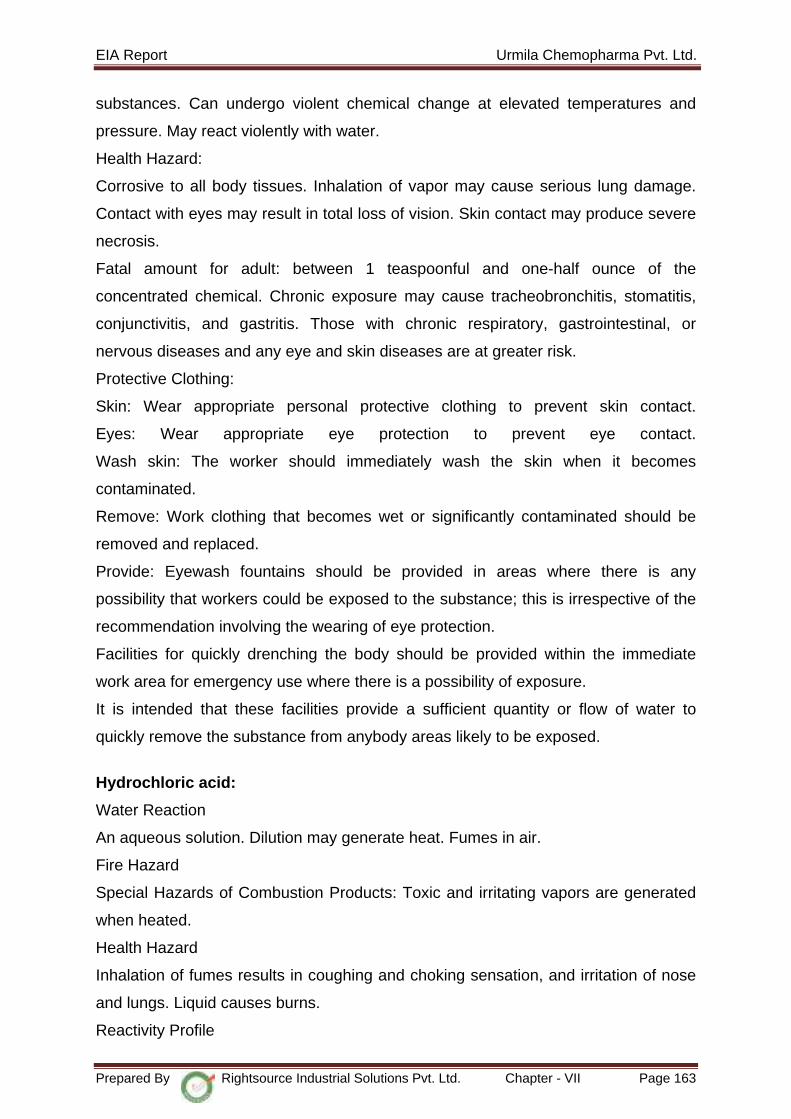
EIA Report Urmila Chemopharma Pvt. Ltd.
substances. Can undergo violent chemical change at elevated temperatures and
pressure. May react violently with water.
Health Hazard:
Corrosive to all body tissues. Inhalation of vapor may cause serious lung damage.
Contact with eyes may result in total loss of vision. Skin contact may produce severe
necrosis.
Fatal amount for adult: between 1 teaspoonful and one-half ounce of the
concentrated chemical. Chronic exposure may cause tracheobronchitis, stomatitis,
conjunctivitis, and gastritis. Those with chronic respiratory, gastrointestinal, or
nervous diseases and any eye and skin diseases are at greater risk.
Protective Clothing:
Skin: Wear appropriate personal protective clothing to prevent skin contact.
Eyes: Wear appropriate eye protection to prevent eye contact.
Wash skin: The worker should immediately wash the skin when it becomes
contaminated.
Remove: Work clothing that becomes wet or significantly contaminated should be
removed and replaced.
Provide: Eyewash fountains should be provided in areas where there is any
possibility that workers could be exposed to the substance; this is irrespective of the
recommendation involving the wearing of eye protection.
Facilities for quickly drenching the body should be provided within the immediate
work area for emergency use where there is a possibility of exposure.
It is intended that these facilities provide a sufficient quantity or flow of water to
quickly remove the substance from anybody areas likely to be exposed.
Hydrochloric acid:
Water Reaction
An aqueous solution. Dilution may generate heat. Fumes in air.
Fire Hazard
Special Hazards of Combustion Products: Toxic and irritating vapors are generated
when heated.
Health Hazard
Inhalation of fumes results in coughing and choking sensation, and irritation of nose
and lungs. Liquid causes burns.
Reactivity Profile
Prepared By Rightsource Industrial Solutions Pvt. Ltd. Chapter - VII Page 163
EIA Report Urmila Chemopharma Pvt. Ltd.
Hydrochloric Acid is an aqueous solution of hydrogen chloride, an acidic gas. Reacts
exothermically with organic bases (amines, amides) and inorganic bases (oxides and
hydroxides of metals)
Reacts exothermically with carbonates (including limestone and building materials
containing limestone) and hydrogen carbonates to generate carbon dioxide
Reacts with sulfides, carbides, borides, and phosphates to generate toxic or
flammable gases
Reacts with many metals (including aluminum, zinc, calcium, magnesium, iron, tin
and all of the alkali metals) to generate flammable hydrogen gas
Protective Clothing: Skin: If chemical is in solution wear appropriate personal protective clothing to
prevent skin contact and to prevent skin from becoming frozen from contact with the
liquid or from contact with vessels containing the liquid.
Eyes: Wear appropriate eye protection to prevent eye contact with the liquid that
could result in burns or tissue damage from frostbite.
Wash skin: If the chemical is in solution, the worker should immediately wash the
skin when it becomes contaminated.
Remove: If chemical is in solution, work clothing that becomes wet or significantly
contaminated should be removed and replaced.
Provide: Eyewash fountains should be provided (when chemical is in solution) in
areas where there is any possibility that workers could be exposed to the substance;
this is irrespective of the recommendation involving the wearing of eye protection.
Facilities for quickly drenching the body should be provided (when chemical is in
solution) within the immediate work area for emergency use where there is a
possibility of exposure. It is intended that these facilities provide a sufficient quantity
or flow of water to quickly remove the substance from anybody areas likely to be
exposed.
Quick drench facilities and/or eyewash fountains should be provided within the
immediate work area for emergency use where there is any possibility of exposure to
liquids that are extremely cold or rapidly evaporating.
Nitric Acid:
Specific Hazards Arising from the Chemical Thermal decomposition can lead to
release of irritating gases and vapors.
The product causes burns of eyes, skin and mucous membranes.
Prepared By Rightsource Industrial Solutions Pvt. Ltd. Chapter - VII Page 164

EIA Report Urmila Chemopharma Pvt. Ltd.
Oxidizer: Contact with combustible/organic material may cause fire.
Hazardous Combustion Products Nitrogen oxides (NOx)
Thermal decomposition can lead to release of irritating gases and vapors
Protective Equipment and Precautions for Firefighters As in any fire, wear self-
contained breathing apparatus pressure.
Handling: Use only under a chemical fume hood. Wear personal protective
equipment. Do not get in eyes, on skin, or on clothing. Do not ingest. Do not breathe
vapors or spray mist. Keep away from clothing and other combustible materials.
Storage: Keep containers tightly closed in a cool, well-ventilated place.
Do not store near combustible materials.
Ammonia:
Appearance: Colorless gas
Main Routes of Exposure: Inhalation, Skin contact, Eye contact.
Inhalation: VERY TOXIC. Can cause severe irritation of the nose and throat. Can
cause life-threatening accumulation of fluid in the lungs (pulmonary edema).
Symptoms may include coughing, shortness of breath, difficult breathing and
tightness in the chest. Symptoms may develop hours after exposure and are made
worse by physical effort. Long-term damage may result from a severe short-term
exposure.
Skin Contact: CORROSIVE. The gas irritates or burns the skin. Permanent scarring
can result. Direct contact with the liquefied gas can chill or freeze the skin (frostbite).
Symptoms of more severe frostbite include a burning sensation and stiffness. The
skin may become waxy white or yellow. Blistering, tissue death and infection may
develop in severe cases.
Eye Contact: CORROSIVE. The gas irritates or burns the eyes. Permanent damage
including blindness can result. Direct contact with the liquefied gas can freeze the
eye. Permanent eye damage or blindness can result.
Flammable Properties: FLAMMABLE GAS. High airborne concentrations can be
ignited and pose a significant fire and explosion hazard, especially in a confined
space. A large and intense energy source is necessary to ignite ammonia gas.
Suitable Extinguishing Media: Carbon dioxide, dry chemical powder, appropriate
foam, water spray or fog.
Hazards: Heat from fire can cause a rapid build-up of pressure inside cylinders.
Explosive rupture and a sudden release of large amounts of gas may result. Cylinder
Prepared By Rightsource Industrial Solutions Pvt. Ltd. Chapter - VII Page 165
EIA Report Urmila Chemopharma Pvt. Ltd.
may rocket. In a fire, the following hazardous materials may be generated:
flammable hydrogen.
Eye/Face Protection: Wear chemical safety goggles. A face shield (with safety
goggles) is necessary.
Skin Protection: Wear chemical protective clothing e.g. gloves, aprons, boots.
Hydrogen peroxide (50%):
It is a clear colorless liquid and oxidizing agent.
Water Soluble
Contact with organic substances may cause fire or explosion. Contact with metals,
metallic ions, alkalis, reducing agents and organic matter (such as alcohols or
terpenes) may produce self-accelerated thermal decomposition.
On decomposition product releases oxygen which may intensify fire.
Health Hazard
Strong irritant to skin, eyes, and mucous membranes
Boiling Point: 114 °C
Protective Clothing:
Skin: Wear appropriate personal protective clothing to prevent skin contact.
Eyes: Wear appropriate eye protection to prevent eye contact.
Wash skin: The worker should immediately wash the skin when it becomes
contaminated.
Remove: Work clothing that becomes wet or significantly contaminated should be
removed and replaced.
Provide: Eyewash fountains should be provided in areas where there is any
possibility that workers could be exposed to the substance; this is irrespective of the
recommendation involving the wearing of eye protection.
7.4 SAFE PRACTICES [HANDLING, STORAGE, TRANSPORTATION AND
UNLOADING OF CHEMICALS]
Liquid Raw materials will be transferred from the drums to the day tank situated at
the production block with the help of leak proof drum pumps / AODD pumps
/Vacuum .From day tank to process reactor unloading is by gravity.
7.4.1 Measures to Avoid Evaporation
All liquid chemicals/solvents stored in containers will be tightly closed.
Prepared By Rightsource Industrial Solutions Pvt. Ltd. Chapter - VII Page 166

EIA Report Urmila Chemopharma Pvt. Ltd.
Will Keep away from heat, sparks and flame
Will Keep away from sources of ignition
Ammonia will be stored in well ventilated area away from combustibles, oxidizable
materials etc.
7.4.2 Safety Systems
• Designated areas with proper indication & safety signs
• Double earthling systems for process reactors
• Flame proof transferring pumps for all flammable chemicals
• Pressure Gauges and temperature gauges on each reactor
• Safety valve & Rupture disc on each process reactor.
• Well ventilated warehouse with suitable fire extinguishers will be used for
storage of liquid chemicals.
7.4.3 TRANSPORTATION / UNLOADING
Highly inflammable chemicals will be transported by road. Therefore, adequate
safety precautions for transportation will be followed. During transportation of
hazardous chemicals, MSDS & TREM card will be provided to driver. As per Motor
Vehicle Rules, PESO rules and Factory Rules all safety precautions will be followed
during transportation of hazardous chemicals.
The following safety precautions are suggested during transportation of toxic,
inflammable and corrosive chemicals in tankers, while loading and unloading,
transportation and meeting the emergencies arising out of leakages and spillages of
hazardous materials:
• The name of the chemical along with pictorial sign denoting the dangerous
goods should be marked on the vehicle and the packing material.
• The name of the transporter, his address and telephone number should be
clearly written on the road tanker and on the vehicle.
• Only trained drivers and cleaners should transport hazardous chemicals.
• The Tanker / Vehicle should be checked for its fitness and safe condition
before loading.
Prepared By Rightsource Industrial Solutions Pvt. Ltd. Chapter - VII Page 167
EIA Report Urmila Chemopharma Pvt. Ltd.
• During loading and unloading, the tanker/vehicle should be braked and
isolated against any movement, while loading/unloading, use safety
appliances.
• Park the vehicle at designated place.
• Stop the engine.
• Check-up spark arrester.
• Provide earthing to tanker securely.
• Ensure that fireman is available near the place with proper equipment‘s.
• Connect the piping properly
• Before start unloading, check that, there should not be any leakage.
• In case of leakage, immediately attend the leakages & rectify it.
• After unloading is over, close the lid properly.
• Vehicle to be started only after removal of all pipelines connected with tanker.
7.4.4 SPILL CONTROL
• For all chemicals spill control procedures will be displayed. Spillage shall be
controlled as per concerned spill control procedure.
• Like any spilled materials to contain, absorb spilled liquid by dry absorbent
clay or vermiculite.
• Collect most of the contaminated absorbent with shovel for further
disposal/incineration.
• If material spills directly on the ground, dig up and remove saturated soil for
disposal/incineration.
7.4.5 EFFECT AND CONSEQUENCE ANALYSIS
• In the plant handling and storage of hazardous chemicals such as Sulfuric
acid, Ammonia, Nitric acid, Acetic acid and flammable chemical Toluene are
the main hazards and Risks arising in handling of such chemicals and its
consequences.
• If Flammable chemicals are released into the atmosphere, they may cause
damage due to resulting fires or vapor clouds.
7.4.6 INVENTORY
• Inventory analysis is commonly used in understanding the relative hazards
and short listing of release scenarios.
Prepared By Rightsource Industrial Solutions Pvt. Ltd. Chapter - VII Page 168
EIA Report Urmila Chemopharma Pvt. Ltd.
• Inventory plays an important role in regard to the potential hazard.
• Larger the inventory of a vessel or a system, larger the quantity of potential
release.
• The potential vapor release [source strength] depends upon the quantity of
liquid release, the properties of the materials and the operating conditions
[pressure, temperature].
• If all these influencing parameters are combined into a matrix and vapor
source strength estimated for each release case, a ranking should become a
credible exercise.
7.4.7 LOSS OF CONTAINMENT
• Plant inventory can get discharged to environment due to Loss of
Containment.
• Certain features of materials to be handled at the plant need to the clearly
understood to firstly list out all significant release cases and then to short list
release scenarios for a detailed examination.
• Liquid release can be either instantaneous or continuous.
• Failure of a vessel leading to an instantaneous outflow assumes the sudden
appearance of such a major crack that practically all of the contents above the
crack shall be released in a very short time.
• The more likely event is the case of liquid release from a hole in a pipe
connected the vessel. The flow rate will depend on the size of the hole as well
as on the pressure, which is present, in front of the hole, prior to the accident.
Such pressure is basically dependent on the pressure head in the vessel.
• The vaporization of released liquid depends on the vapor pressure and
weather conditions.
In the study the largest potential hazard inventories have been considered for its
consequence Risk estimation how vulnerable the organization is to a specific
incident consequence.
There are a number of hazards that are present at the proposed project site that may
result in injury to people or a fatality in more serious cases. This study is only
concerned with ‘major hazards’, which are as follows:
• Pool fires, Vapor cloud explosion;
Prepared By Rightsource Industrial Solutions Pvt. Ltd. Chapter - VII Page 169

EIA Report Urmila Chemopharma Pvt. Ltd.
• Toxic vapor release
Pool Fires
If a liquid release has time to form a pool and is then ignited before the pool
Evaporates or drains away, then a pool fire results.
Because they are less well aerated, pool fires tend to have lower flame temperatures
and produce lower levels of thermal radiation than some other types of fire (such as
jet fires); however, this means that they will produce more smoke. Although a pool
fire can still lead to structural failure of items within the flame, this will take several
times longer than in a jet fire.
A burning liquid pool can spread along a horizontal surface or run down a vertical
surface to give a running fire. Due to the presence of kerbs, slopes, drains and other
obstacles; pool fire areas and directions can be unpredictable.
Vapour Cloud Explosion
The facility presently stores and also plans to store highly flammable Chemical
Toluene for a maximum credible loss scenario the release of such chemical is likely
to form a vapor cloud. If the cloud encounters an ignition source, the parts of the
cloud where the concentration is within the flammable range will burn and may in
some situations, also create an explosive force (blast wave). The effects of an
explosion, defined by blast overpressure, can be significant.
In most VCEs the expanding flame front travels more slowly than the pressure
Wave; this type of explosion is called a deflagration and the maximum Overpressure
is determined by the expansion ratio of the burning gases. If the flame front travels
fast enough to coincide with the pressure wave then the explosion is called a
detonation and very severe overpressures can be produced. Detonation is most
likely to occur with more reactive gases such as hydrogen.
Toxic vapor release:
Toxic vapor release due to Ammonia leakage the affected area, warehouse will have
more airborne concentration of Ammonia.
7.5 DAMAGE CRITERIA
In consequence analysis, it is made of a number of calculation models to estimate
the physical effects of an accident [spill of hazardous material] and to predict the
Prepared By Rightsource Industrial Solutions Pvt. Ltd. Chapter - VII Page 170

EIA Report Urmila Chemopharma Pvt. Ltd.
damage [lethality, injury, material destruction] of the effects. The calculations can
roughly be divided in three major groups.
• Determination of the source strength parameters;
• Determination of the consequential effects;
• Determination of the damage or damage distances.
TABLE 7.3: SEVERITY CATEGORIES OF CONSEQUENCE AND CRITERIA
Consequence Ranking Criteria Definition
Catastrophic 5 Multiple fatalities/permanent total disability Major 4 Single fatality/permanent total disability
Moderate 3 Short term hospitalization & rehabilitation leading to recovery
Minor 2 Medical treatment injuries Insignificant 1 First Aid treatment
Risk Evaluation
Based on ranking of likelihood and frequencies, each identified hazard has been
evaluated based on the likelihood of occurrence and the magnitude of
consequences. The significance of the risk is expressed as the product of likelihood
and the consequence of the risk event, expressed as follows:
Significance = Likelihood X Consequence
The below table illustrates all possible product results for the five likelihood and
consequence categories while the next table assigns risk significance criteria in three
regions that identify the limit of risk acceptability.
Depending on the position of the intersection of a column with a row in the risk
matrix, hazard prone activities have been classified as low, medium and high thereby
qualifying for a set of risk reduction / mitigation strategies.
Risk Matrix
Likelihood Consequence Frequent Probable Unlikely Remote Improbable
5 4 3 2 1 Catastrophic 5 25 20 15 10 5 Major 4 20 16 12 8 4 Moderate 3 15 12 9 6 3 Minor 2 10 8 6 4 2 Insignificant 1 5 4 3 2 1
Prepared By Rightsource Industrial Solutions Pvt. Ltd. Chapter - VII Page 171
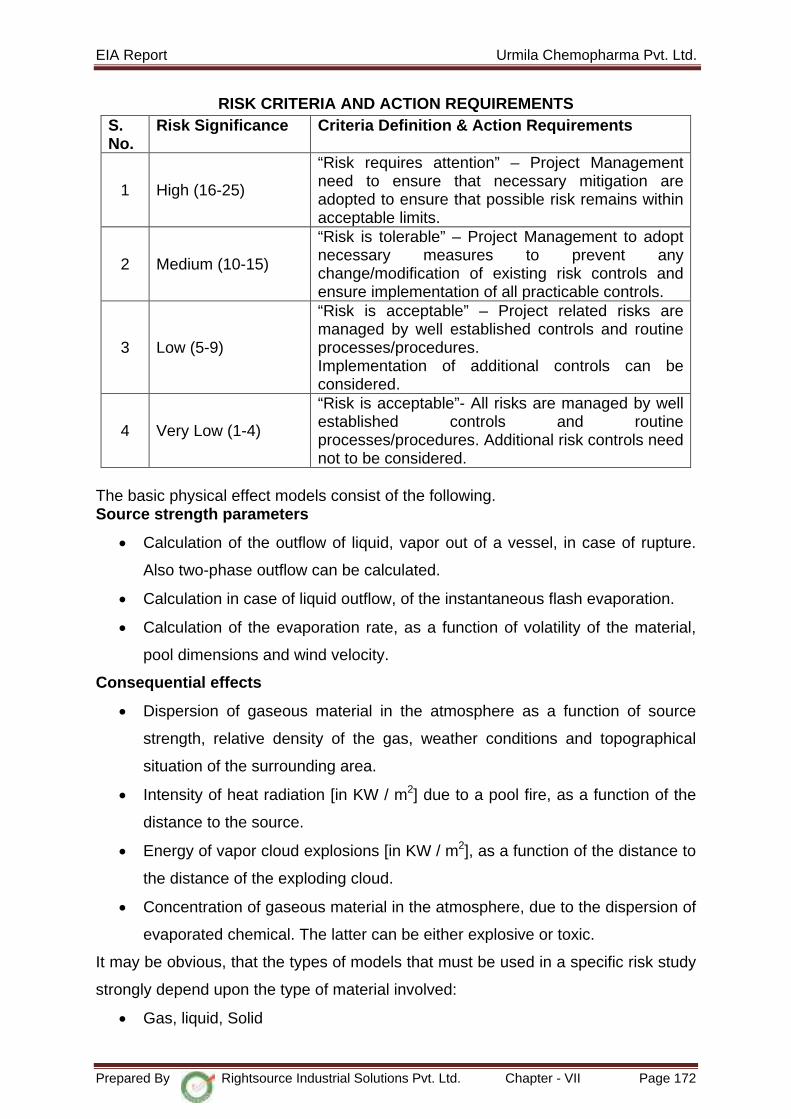
EIA Report Urmila Chemopharma Pvt. Ltd.
RISK CRITERIA AND ACTION REQUIREMENTS S. No.
Risk Significance Criteria Definition & Action Requirements
1 High (16-25)
“Risk requires attention” – Project Management need to ensure that necessary mitigation are adopted to ensure that possible risk remains within acceptable limits.
2 Medium (10-15)
“Risk is tolerable” – Project Management to adopt necessary measures to prevent any change/modification of existing risk controls and ensure implementation of all practicable controls.
3 Low (5-9)
“Risk is acceptable” – Project related risks are managed by well established controls and routine processes/procedures. Implementation of additional controls can be considered.
4 Very Low (1-4)
“Risk is acceptable”- All risks are managed by well established controls and routine processes/procedures. Additional risk controls need not to be considered.
The basic physical effect models consist of the following. Source strength parameters
• Calculation of the outflow of liquid, vapor out of a vessel, in case of rupture.
Also two-phase outflow can be calculated.
• Calculation in case of liquid outflow, of the instantaneous flash evaporation.
• Calculation of the evaporation rate, as a function of volatility of the material,
pool dimensions and wind velocity.
Consequential effects
• Dispersion of gaseous material in the atmosphere as a function of source
strength, relative density of the gas, weather conditions and topographical
situation of the surrounding area.
• Intensity of heat radiation [in KW / m2] due to a pool fire, as a function of the
distance to the source.
• Energy of vapor cloud explosions [in KW / m2], as a function of the distance to
the distance of the exploding cloud.
• Concentration of gaseous material in the atmosphere, due to the dispersion of
evaporated chemical. The latter can be either explosive or toxic.
It may be obvious, that the types of models that must be used in a specific risk study
strongly depend upon the type of material involved:
• Gas, liquid, Solid
Prepared By Rightsource Industrial Solutions Pvt. Ltd. Chapter - VII Page 172
EIA Report Urmila Chemopharma Pvt. Ltd.
• Inflammable, explosive, toxic products
• Stored at high/low temperatures or pressure.
Selection of Damage Criteria
• The damage criteria give the relation between extent of the physical effects
(exposure) and the percentage of the people that will be killed or injured due
to those effects
• The knowledge about these relations depends strongly on the exposure. For
instance, much more is known about the damage caused by heat radiation,
than about the damage due to toxic exposure, and for these toxic effects, the
knowledge differs strongly between different materials.
In consequence analysis studies, in principle three types of exposure to hazardous
effects are distinguished:
• Heat radiation from pool fire
• Explosion
• Toxic effect from toxic materials or toxic combustion products.
Heat Radiation
The consequence caused by exposure to heat radiation is a function of:
• The radiation energy onto the human body [KW / m2]
• The exposure duration [sec]
• The protection of the skin tissue [clothed or naked body]
7.6 DAMAGES TO HUMAN LIFE DUE TO HEAT RADIATION
Injuries to People —Definition of Burn Degrees
First Degree: A mild level of skin burn affecting the epidermis, with persistent
redness but no formation of blisters. More severe first - degree burns will produce
some pain, but no permanent damage. Flaking or scaling of the outer skin layer will
occur several days after exposure.
Second Degree: An intermediate level of skin burn characterized by the formation of
blisters. The blister depth may be shallow (epidermis), with only the surface layers of
the skin damaged, or more severe with nearly the full depth of the skin destroyed
(epidermis and dermis).
Third Degree: Deep burns characterized by the destruction of all skin layers and by
charring. The underlying tissue may also be damaged.
Prepared By Rightsource Industrial Solutions Pvt. Ltd. Chapter - VII Page 173
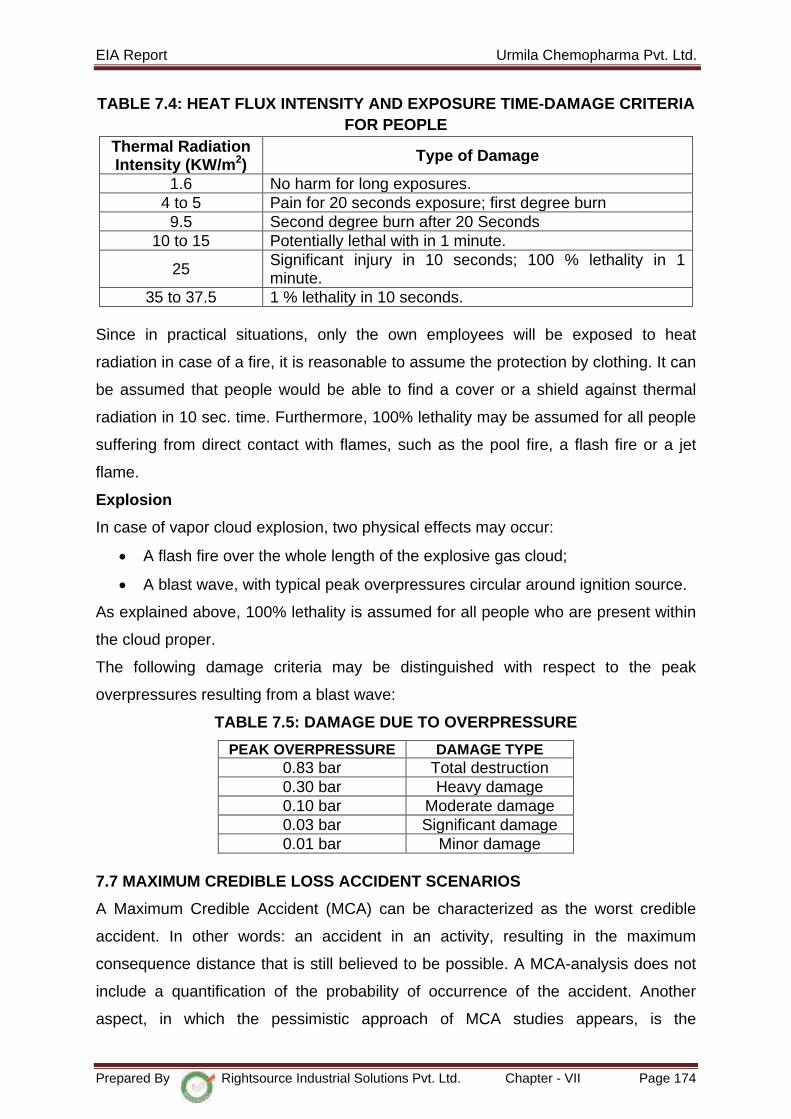
EIA Report Urmila Chemopharma Pvt. Ltd.
TABLE 7.4: HEAT FLUX INTENSITY AND EXPOSURE TIME-DAMAGE CRITERIA FOR PEOPLE
Thermal Radiation Intensity (KW/m2) Type of Damage
1.6 No harm for long exposures. 4 to 5 Pain for 20 seconds exposure; first degree burn 9.5 Second degree burn after 20 Seconds
10 to 15 Potentially lethal with in 1 minute.
25 Significant injury in 10 seconds; 100 % lethality in 1 minute.
35 to 37.5 1 % lethality in 10 seconds. Since in practical situations, only the own employees will be exposed to heat
radiation in case of a fire, it is reasonable to assume the protection by clothing. It can
be assumed that people would be able to find a cover or a shield against thermal
radiation in 10 sec. time. Furthermore, 100% lethality may be assumed for all people
suffering from direct contact with flames, such as the pool fire, a flash fire or a jet
flame.
Explosion
In case of vapor cloud explosion, two physical effects may occur:
• A flash fire over the whole length of the explosive gas cloud;
• A blast wave, with typical peak overpressures circular around ignition source.
As explained above, 100% lethality is assumed for all people who are present within
the cloud proper.
The following damage criteria may be distinguished with respect to the peak
overpressures resulting from a blast wave:
TABLE 7.5: DAMAGE DUE TO OVERPRESSURE
PEAK OVERPRESSURE DAMAGE TYPE 0.83 bar Total destruction 0.30 bar Heavy damage 0.10 bar Moderate damage 0.03 bar Significant damage 0.01 bar Minor damage
7.7 MAXIMUM CREDIBLE LOSS ACCIDENT SCENARIOS
A Maximum Credible Accident (MCA) can be characterized as the worst credible
accident. In other words: an accident in an activity, resulting in the maximum
consequence distance that is still believed to be possible. A MCA-analysis does not
include a quantification of the probability of occurrence of the accident. Another
aspect, in which the pessimistic approach of MCA studies appears, is the
Prepared By Rightsource Industrial Solutions Pvt. Ltd. Chapter - VII Page 174
EIA Report Urmila Chemopharma Pvt. Ltd.
atmospheric condition that is used for dispersion calculations. The Maximum
Credible Loss (MCL) scenarios have been developed for the Facility. The MCL
cases considered, attempt to include the worst “Credible” incidents-what constitutes
a credible incident is always subjective. Nevertheless, guidelines have evolved over
the years and based on basic engineering judgment, the cases have been found to
be credible and modeling for assessing vulnerability zones is prepared accordingly.
The objective of the study is Emergency planning, hence only holistic & conservative
assumptions are used for obvious reasons. Hence, though the outcomes may look
pessimistic, the planning for emergency concept should be borne in mind whilst
interpreting the results.
In Consequence analysis, geographical location of the source of potential release
plays an important role. Consideration of a large number of scenarios in the same
geographical location serves little purpose if the dominant scenario has been
identified and duly considered.
The Consequence Analysis has been done for selected scenarios. The details of
software used for MCA analysis are described below.
• A computer based version ALOHA is used to calculate toxic and Thermal
radiation effect of the accidental release of liquid chemicals within the plant
area.
• ALOHA models key hazards-toxicity, flammability, thermal radiation (Heat),
and over pressure (expansion blast force)-related to chemical releases that
result in toxic gas dispersion, fire and/or explosion
7.8 RISK ANALYSIS
Risk Analysis –Ammonia/Nitric acid/Acetic acid/Solvent -Toluene
The main hazard Toxic gas release associated with the storage and handling of
Ammonia gas with respect to the proposed Unit.
Hazards associated with the storage and handlings of Flammable chemicals
Solvent-Toluene is pool fire and VCE’s resulting from the ignition of released
material. The hazards may be realized during drums handling and leaks/failures in
the storage containers and ancillary equipment such as transfer pumps, metering
equipment, etc. all of which can release significant quantities of flammable material
or toxic material on failure.
Prepared By Rightsource Industrial Solutions Pvt. Ltd. Chapter - VII Page 175
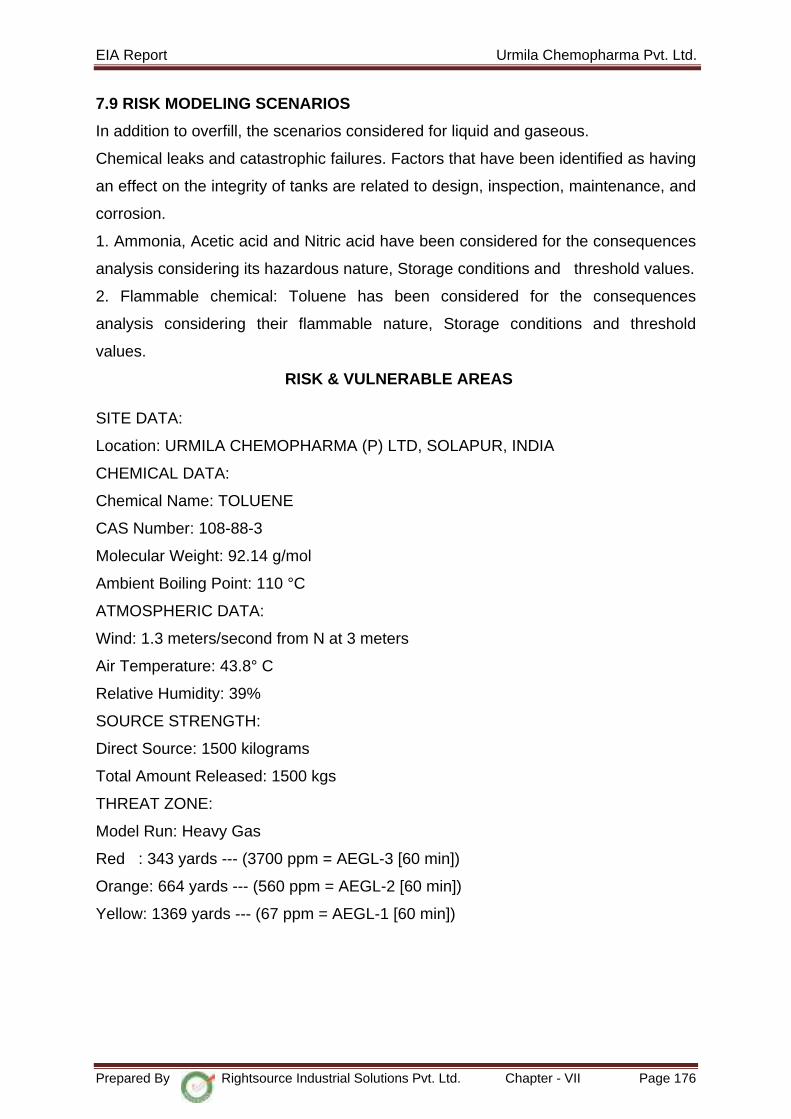
EIA Report Urmila Chemopharma Pvt. Ltd.
7.9 RISK MODELING SCENARIOS
In addition to overfill, the scenarios considered for liquid and gaseous.
Chemical leaks and catastrophic failures. Factors that have been identified as having
an effect on the integrity of tanks are related to design, inspection, maintenance, and
corrosion.
1. Ammonia, Acetic acid and Nitric acid have been considered for the consequences
analysis considering its hazardous nature, Storage conditions and threshold values.
2. Flammable chemical: Toluene has been considered for the consequences
analysis considering their flammable nature, Storage conditions and threshold
values.
RISK & VULNERABLE AREAS
SITE DATA:
Location: URMILA CHEMOPHARMA (P) LTD, SOLAPUR, INDIA
CHEMICAL DATA:
Chemical Name: TOLUENE
CAS Number: 108-88-3
Molecular Weight: 92.14 g/mol
Ambient Boiling Point: 110 °C
ATMOSPHERIC DATA:
Wind: 1.3 meters/second from N at 3 meters
Air Temperature: 43.8° C
Relative Humidity: 39%
SOURCE STRENGTH:
Direct Source: 1500 kilograms
Total Amount Released: 1500 kgs
THREAT ZONE:
Model Run: Heavy Gas
Red : 343 yards --- (3700 ppm = AEGL-3 [60 min])
Orange: 664 yards --- (560 ppm = AEGL-2 [60 min])
Yellow: 1369 yards --- (67 ppm = AEGL-1 [60 min])
Prepared By Rightsource Industrial Solutions Pvt. Ltd. Chapter - VII Page 176
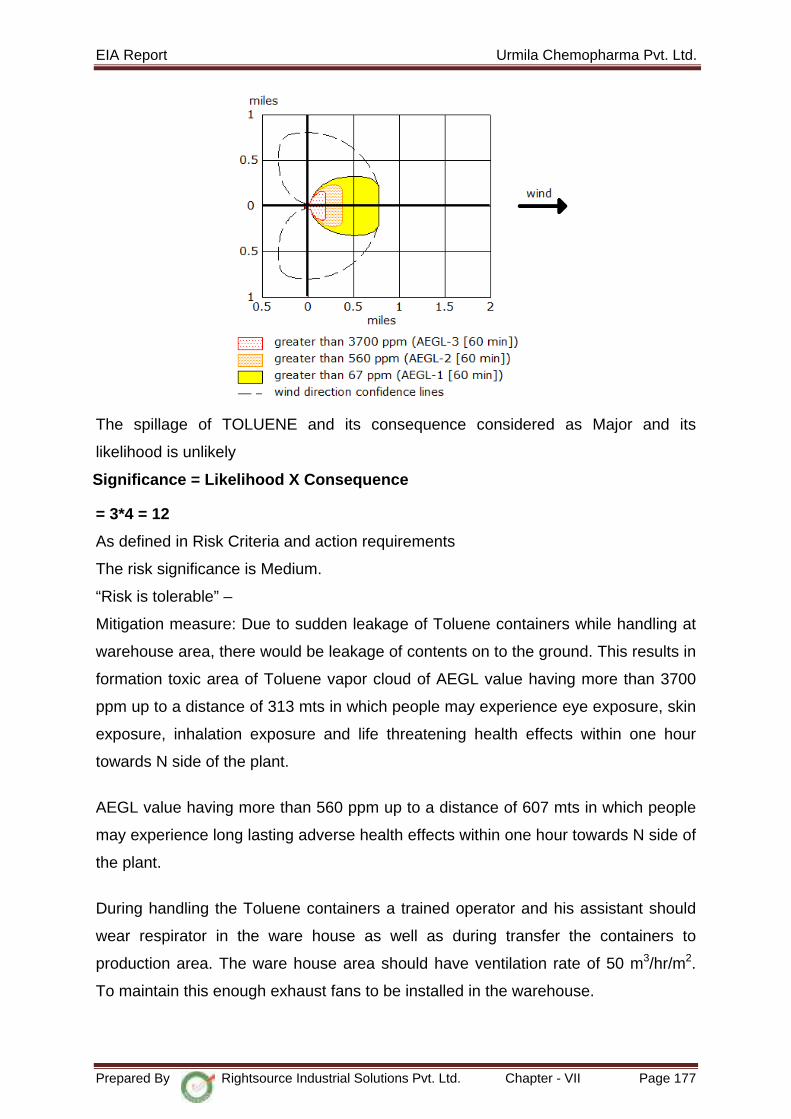
EIA Report Urmila Chemopharma Pvt. Ltd.
The spillage of TOLUENE and its consequence considered as Major and its
likelihood is unlikely
Significance = Likelihood X Consequence
= 3*4 = 12
As defined in Risk Criteria and action requirements
The risk significance is Medium.
“Risk is tolerable” –
Mitigation measure: Due to sudden leakage of Toluene containers while handling at
warehouse area, there would be leakage of contents on to the ground. This results in
formation toxic area of Toluene vapor cloud of AEGL value having more than 3700
ppm up to a distance of 313 mts in which people may experience eye exposure, skin
exposure, inhalation exposure and life threatening health effects within one hour
towards N side of the plant.
AEGL value having more than 560 ppm up to a distance of 607 mts in which people
may experience long lasting adverse health effects within one hour towards N side of
the plant.
During handling the Toluene containers a trained operator and his assistant should
wear respirator in the ware house as well as during transfer the containers to
production area. The ware house area should have ventilation rate of 50 m3/hr/m2.
To maintain this enough exhaust fans to be installed in the warehouse.
Prepared By Rightsource Industrial Solutions Pvt. Ltd. Chapter - VII Page 177

EIA Report Urmila Chemopharma Pvt. Ltd.
CHEMICAL DATA:
Chemical Name: TOLUENE
CAS Number: 108-88-3
Molecular Weight: 92.14 g/mol
Ambient Boiling Point: 110° C
ATMOSPHERIC DATA:
Wind: 1.3 meters/second from N at 3 meters
Air Temperature: 43.8° C
Relative Humidity: 39%
SOURCE STRENGTH:
Direct Source: 1500 kilograms
Total Amount Released: 1500 KGS
THREAT ZONE:
Threat Modeled: Overpressure (blast force) from vapor cloud explosion
Type of Ignition: ignited by spark or flame
Level of Congestion: congested
Model Run: Heavy Gas
Orange: 237 yards --- (3.5 psi = serious injury likely)
Yellow: 289 yards --- (1.0 psi = shatters glass)
The spillage of TOLUENE and its consequence considered as Major and its
likelihood is unlikely
Significance = Likelihood X Consequence
=3*4 =12
Prepared By Rightsource Industrial Solutions Pvt. Ltd. Chapter - VII Page 178

EIA Report Urmila Chemopharma Pvt. Ltd.
As defined in Risk Criteria and action requirements
The risk significance is Medium.
“Risk is tolerable” –
Mitigation measure: Due to sudden leakage of Toluene containers while handling at
warehouse area, there would be leakage of contents on to the ground. These results
in formation Vapor cloud of Toluene and incase due to any spark the cloud will get
ignited and vapor cloud explosion will occur in the N side of the plant.
The peak over pressure value having more than 3.5 psi will cause serious injuries to
the workmen up to a distance of 216 mts towards North side of the plant
The peak over pressure value having more than 1.0 psi will shatter the glass up to a
distance of 264 mts towards N side of the plant.
During handling the Toluene containers a trained operator and his assistant should
wear respirator in the ware house as well as during transfer the containers to
production area. The ware house area should have ventilation rate of 50 m3/hr/m2.
To maintain this enough exhaust fans to be installed in the warehouse. This will
avoid vapor cloud explosion.
CHEMICAL DATA:
Chemical Name: AMMONIA
CAS Number: 7664-41-7
Molecular Weight: 17.03 g/mol
Ambient Boiling Point: -34.5° C
ATMOSPHERIC DATA:
Wind: 1.3 meters/second from N at 3 meters
Air Temperature: 43.8° C
Relative Humidity: 39%
SOURCE STRENGTH:
Direct Source: 50 kilograms
Total Amount Released: 50 kgs
THREAT ZONE:
Model Run: Gaussian
Red : 88 yards --- (1100 ppm = AEGL-3 [60 min])
Orange: 231 yards --- (160 ppm = AEGL-2 [60 min])
Yellow: 471 yards --- (30 ppm = AEGL-1 [60 min])
Prepared By Rightsource Industrial Solutions Pvt. Ltd. Chapter - VII Page 179
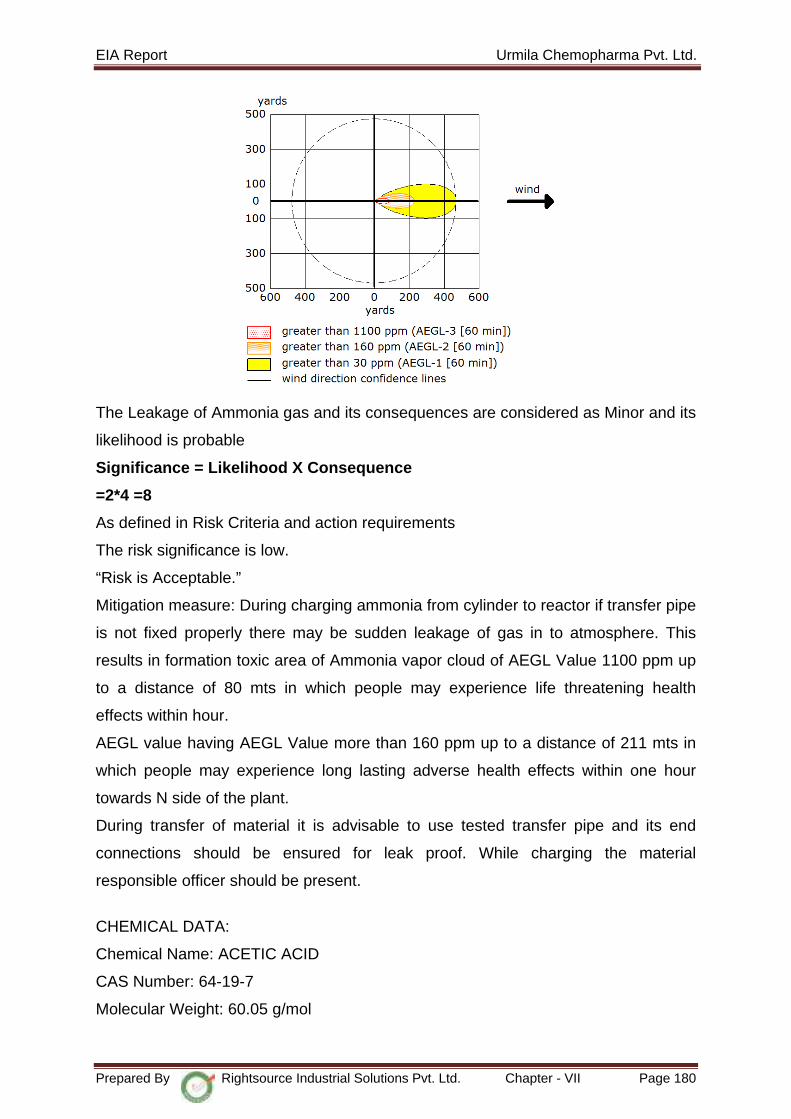
EIA Report Urmila Chemopharma Pvt. Ltd.
The Leakage of Ammonia gas and its consequences are considered as Minor and its
likelihood is probable
Significance = Likelihood X Consequence
=2*4 =8
As defined in Risk Criteria and action requirements
The risk significance is low.
“Risk is Acceptable.”
Mitigation measure: During charging ammonia from cylinder to reactor if transfer pipe
is not fixed properly there may be sudden leakage of gas in to atmosphere. This
results in formation toxic area of Ammonia vapor cloud of AEGL Value 1100 ppm up
to a distance of 80 mts in which people may experience life threatening health
effects within hour.
AEGL value having AEGL Value more than 160 ppm up to a distance of 211 mts in
which people may experience long lasting adverse health effects within one hour
towards N side of the plant.
During transfer of material it is advisable to use tested transfer pipe and its end
connections should be ensured for leak proof. While charging the material
responsible officer should be present.
CHEMICAL DATA:
Chemical Name: ACETIC ACID
CAS Number: 64-19-7
Molecular Weight: 60.05 g/mol
Prepared By Rightsource Industrial Solutions Pvt. Ltd. Chapter - VII Page 180
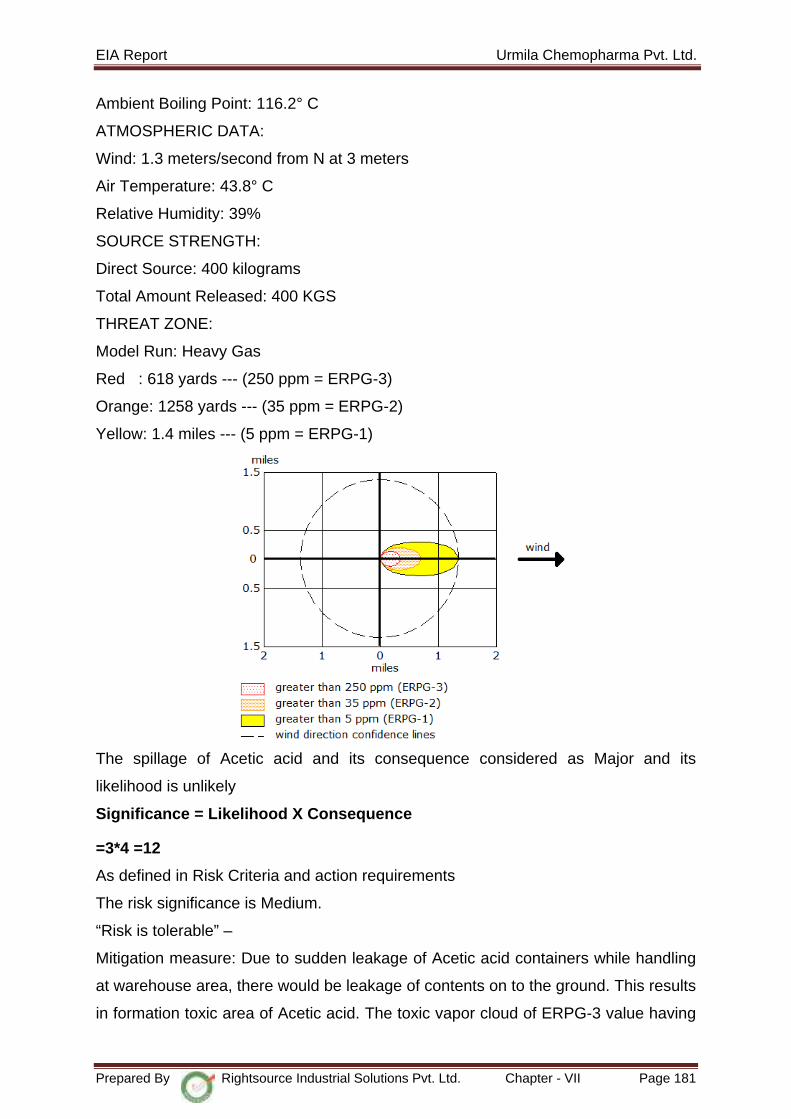
EIA Report Urmila Chemopharma Pvt. Ltd.
Ambient Boiling Point: 116.2° C
ATMOSPHERIC DATA:
Wind: 1.3 meters/second from N at 3 meters
Air Temperature: 43.8° C
Relative Humidity: 39%
SOURCE STRENGTH:
Direct Source: 400 kilograms
Total Amount Released: 400 KGS
THREAT ZONE:
Model Run: Heavy Gas
Red : 618 yards --- (250 ppm = ERPG-3)
Orange: 1258 yards --- (35 ppm = ERPG-2)
Yellow: 1.4 miles --- (5 ppm = ERPG-1)
The spillage of Acetic acid and its consequence considered as Major and its
likelihood is unlikely
Significance = Likelihood X Consequence
=3*4 =12
As defined in Risk Criteria and action requirements
The risk significance is Medium.
“Risk is tolerable” –
Mitigation measure: Due to sudden leakage of Acetic acid containers while handling
at warehouse area, there would be leakage of contents on to the ground. This results
in formation toxic area of Acetic acid. The toxic vapor cloud of ERPG-3 value having
Prepared By Rightsource Industrial Solutions Pvt. Ltd. Chapter - VII Page 181
EIA Report Urmila Chemopharma Pvt. Ltd.
more than 250 ppm up to a distance of 565 mts in which people may experience eye
exposure, skin exposure, inhalation exposure and life threatening health effects
within one hour towards N side of the plant
ERPG-2 value having more than 35 ppm up to a distance of 1150 mts in which
people may experience Irreversible or other serious Health effects within one hour
towards N side of the plant.
During handling the Acetic acid containers a trained operator and his assistant
should wear respirator in the ware house as well as during transfer the containers to
production area. The ware house area should have ventilation rate of 50 m3/hr/m2.
To maintain this enough exhaust fans to be installed in the warehouse.
7.10 OCCUPATIONAL HEALTH
Hazardous and toxic substances will be defined as those chemicals present in the
work place which are capable of causing harm.
• For handling hazardous chemicals and to take care of employee’s health, and
predictive maintenance looking to the nature of hazardous chemicals being
handled/processed. All the equipments in the plant areas shall be inspected /
tested by an outside agency.
• The various safety equipments like breathing apparatus and critical
instrumentation will be provided on various equipments are inspected and tested
frequently to ensure their operability all the time. Besides, all the first aid, fire
fighting devices will be inspected, tested and maintained by a competent third
party and kept all the time in ready to use condition.
• Health of all the employees in plant area will be monitored by outside physician.
If any abnormality is found necessary treatment is also being given time to time.
Necessary history cards, records will be maintained which is up-dated time to
time.
Common Hazards
• Physical such as ventilation, poor illumination, noise, extreme temperature,
humidity and radiation.
• Biological such as variety of pathogenic bacteria and parasites.
• Chemical due to hazardous gases and dusts.
• Ergonomic.
Prepared By Rightsource Industrial Solutions Pvt. Ltd. Chapter - VII Page 182
EIA Report Urmila Chemopharma Pvt. Ltd.
Industrial Hygiene Monitoring
• Industrial hygiene monitoring is to be located and identify source of exposure in
the workplace so that they can be corrected and to quantify the exposure of
employees to chemicals in the air.
• Air monitoring is conducted by industrial hygienists or other trained personnel.
Occupational Health Monitoring System
A. Air samples
Locations of samples – air samples are generally collected in one or three locations:
• At the breathing zone of the worker [Personal sample]
• In the general room air [Area sample]
• At the operation which is generating the hazardous substance [Area sample]
Lengths of samples – Air samples are generally collected for two lengths of time.
• Grab samples [instantaneous] measure conditions at one moment in time and
can be linked to a still photograph. They give only a picture of conditions at one
place at one instant in time.
• Continuous Samples [range from twenty minutes to 8 – 10 Hours].These is
used to evaluate all day exposure by a series of continuous samples.
B. Other sampling methods
Bulk samples
Bulk samples will be collected from settled dust in the work place or from drums or
bags. Their purpose is to analyze and identify the substances present. For example,
bulk samples are used to analyze the percent of asbestos in insulation, dust &
Chemical Powder. Usually, a substance which is greater than one percent of bulk
sample is considered a concern.
Wipe Samples
Wipe samples will be used when skin absorption or ingestion is a suspected route of
exposure. The purpose is to show whether skin, respirators, clothing, lunch rooms,
lockers, etc. are contaminated.
It can show which surfaces are clean and which are contaminated. It can also show
if some surfaces are more contaminated than others.
Prepared By Rightsource Industrial Solutions Pvt. Ltd. Chapter - VII Page 183

EIA Report Urmila Chemopharma Pvt. Ltd.
7.10.1 Sampling Devices
The general principle of sampling is to collect an amount of a contaminant onto a
medium from a known quantity of air.
Air samples will be collected using small pumps to suck air from the workroom. The
pump is attached by tubing to a sampling device which contains the sampling
medium; for example a glass tube containing charcoal.
The sampling method will be used depends on the physical form of the substance:
DUSTS –The sampling device is a filter of plastic or paper in s holder:
VAPORS –The sampling device is a glass tube containing activated charcoal
as a medium.
GASES –The sampling device is a bubbler containing a fluid medium to
dissolved or react with the gas
The collected samples will be sent to a laboratory where the amount of the
substance on the sampling medium [filter, tube, etc.] is measured.
In some cases air monitoring will be conducted by using direct reading instrument
such as a monitoring for carbon monoxide these instruments can measure the
amount of a contaminant in the air immediately without being sent to a laboratory.
• PELs [Permissible Exposure Limits] – these are legal’s limits which have been
established by OSHA.
• Recommended PELs – also reference to as RELs [Recommended Exposure
Limits] often these values are based on more recent scientific information than
the legal PELs enforced by OSHA.
• TLVs [Threshold Limit Values] – These are exposure limits put out by a
nongovernmental group, the ACGIH [American Conference of Governmental
Industrial Hygienists].
• IDLH [Immediate Dangerous to Life or Health] limits are prescribed by NIOSH
[National Institute of Occupational Safety and Health]
• PAC [Protective action criteria] for Hazardous chemicals prescribed by
Emergency management issues special interest group, UNITED STATES.
• AEGL [Acute exposure guideline levels] values given by U.S. Environmental
protection agency.
Prepared By Rightsource Industrial Solutions Pvt. Ltd. Chapter - VII Page 184
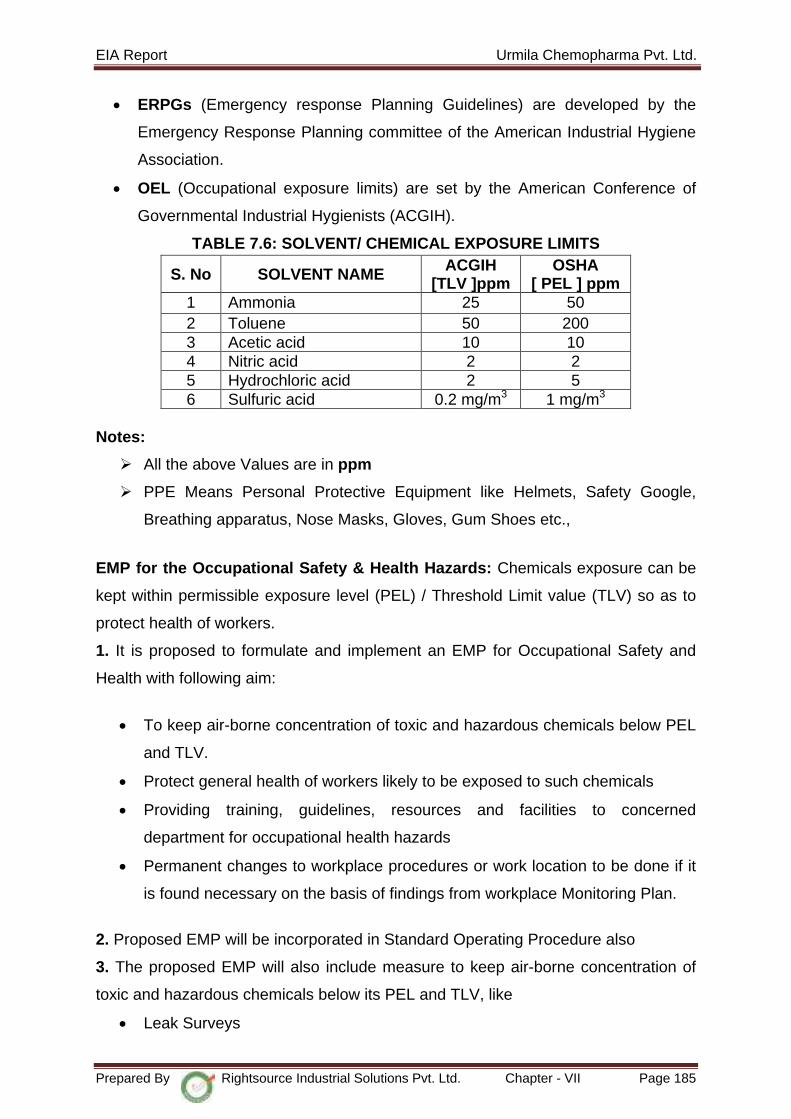
EIA Report Urmila Chemopharma Pvt. Ltd.
• ERPGs (Emergency response Planning Guidelines) are developed by the
Emergency Response Planning committee of the American Industrial Hygiene
Association.
• OEL (Occupational exposure limits) are set by the American Conference of
Governmental Industrial Hygienists (ACGIH).
TABLE 7.6: SOLVENT/ CHEMICAL EXPOSURE LIMITS
S. No SOLVENT NAME ACGIH [TLV ]ppm
OSHA [ PEL ] ppm
1 Ammonia 25 50 2 Toluene 50 200 3 Acetic acid 10 10 4 Nitric acid 2 2 5 Hydrochloric acid 2 5 6 Sulfuric acid 0.2 mg/m3 1 mg/m3
Notes:
All the above Values are in ppm
PPE Means Personal Protective Equipment like Helmets, Safety Google,
Breathing apparatus, Nose Masks, Gloves, Gum Shoes etc.,
EMP for the Occupational Safety & Health Hazards: Chemicals exposure can be
kept within permissible exposure level (PEL) / Threshold Limit value (TLV) so as to
protect health of workers.
1. It is proposed to formulate and implement an EMP for Occupational Safety and
Health with following aim:
• To keep air-borne concentration of toxic and hazardous chemicals below PEL
and TLV.
• Protect general health of workers likely to be exposed to such chemicals
• Providing training, guidelines, resources and facilities to concerned
department for occupational health hazards
• Permanent changes to workplace procedures or work location to be done if it
is found necessary on the basis of findings from workplace Monitoring Plan.
2. Proposed EMP will be incorporated in Standard Operating Procedure also
3. The proposed EMP will also include measure to keep air-borne concentration of
toxic and hazardous chemicals below its PEL and TLV, like
• Leak Surveys
Prepared By Rightsource Industrial Solutions Pvt. Ltd. Chapter - VII Page 185

EIA Report Urmila Chemopharma Pvt. Ltd.
• Separate storage for toxic chemicals
• Exhaust Ventilation
• Proper illumination
• Close processes to avoid spills and exposures
• On-line detectors toxic chemical like Anhydrous Ammonia
• Atomization of process operations to hazards of manual handling of chemicals
• Supply of proper PPEs like Air mask, Breathing canisters, Decontamination
procedure for empty drums and carboys.
• Regular maintenance program for pumps, equipment, instruments handling
toxic and corrosive chemicals
• Display of warning boards
• Training to persons handling toxic and corrosive chemicals.
.4. Workplace Monitoring Plan
• It is proposed that a Workplace Monitoring Plan to be prepared &
implemented accordingly.
• Each workplace must be evaluated to identify potential hazards from toxic
substances or harmful physical agents. Air-borne concentration of toxic
chemicals will be measured and record will be kept.
• The current state-of-the-art exposure measurement model is as follows: For
purposes of measuring worker exposure across a single shift it is sufficient to
place a reasonably accurate exposure measuring device near the worker’s
area, within the worker’s breathing zone, and have it operate for nearly the full
shift. Client has been proposed to study the exposure data when the plant is
operative.
5. Health Evaluation of Workers
• It is proposed that management will devise a plan to check and evaluate the
exposure specific health status evaluation of workers.
• Workers will be checked for physical fitness with special reference to the
possible health hazards likely to be present, where he/she is being expected
to work before being employed for that purpose. Basic examinations like
1. Liver Function tests
2. Chest X-ray
Prepared By Rightsource Industrial Solutions Pvt. Ltd. Chapter - VII Page 186

EIA Report Urmila Chemopharma Pvt. Ltd.
3. Audiometry
4. Spirometry Vision testing (Far & Near vision, color vision and any other
ocular defect)
5. ECG, etc. will be carried out.
However, the parameters and frequency of such examination will be decided in
consultation with Factory Medical Officer.
• While in work, all the workers will be periodically examined for the health with
specific reference to the hazards which they are likely to be exposed to during
work. Health evaluation will be carried out considering the bodily functions
likely to be affected during work. The parameters and frequency of such
examination will be decided in consultation with Factory Medical Officer. Plan
of monthly and yearly report of the health status of workers with special
reference to Occupational Health and Safety, will be maintained.
7.11 TREATMENT OF WORKERS AFFECTED BY ACCIDENTAL SPILLAGE OF CHEMICALS [Interim First Aid for General Injuries & Wounds]
Interim First Aid is essential in many injuries while injured waits for trained personnel
to arrive.
BLEEDING • Apply direct pressure on the wound with a clean dressing.
• If bleeding continues and you do not suspect a fracture, elevate the wound
above the victim’s heart and continue to apply direct pressure.
• If bleeding continues, apply pressure at a pressure point.
• Maintain body temperature.
• Do not use a tourniquet unless this is a serious amputation.
BREATHING PROBLEMS • Move victim to fresh air if smoke or dangerous gases are present.
• Otherwise, do not move victim.
• If victim loses consciousness, call doctor
• Never enter into a room with toxic gases released -call without protection
UNCONSCIOUS VICTIM • Move victim to fresh air if smoke or dangerous gases exist.
• Begin rescue breathing- is First Aid trained ahead of time
• Never enter into a room where toxic gases released
Prepared By Rightsource Industrial Solutions Pvt. Ltd. Chapter - VII Page 187
EIA Report Urmila Chemopharma Pvt. Ltd.
CHEMICAL BURNS • Have victim remain under a safety shower or flush skin with an available
water source for 15-30 minutes.
• Remove all contaminated clothing and jewellery.
• Cover burns with dry, loose dressings.
• Wash all clothing thoroughly before wearing it again.
ACID BURNS • In case of acid burn, the operators with all possible speed gets under a safety
shower and use the full flow of water. A small amount of water will incase
severity of the burn Water should be used until all traces of acid have been
washed from the burn. Alkaline solutions are not needed; if used at all they
will use only after all acid has been washed from the burn, it may to treat in
the same manner as a heat burn.
CHEMICAL INGESTIONS • Never enter into a room where toxic gases released, without protection
• Do not give victim any food or liquids without specific advice from physician.
EYE INJURIES FROM CHEMICALS • Get victim to a safety shower or eye wash immediately.
• Never enter into a room where toxic gases released
• Flush eye for 15-30 minutes with both lids held open. Keep the injured eye
lower than the uninjured eye.
• Keep the eyelids open hold fingers at top and bottom of the eyeball. Wrap a
bandage loosely around both eyes.
SAFE OPERATING PROCEDURES • Safe operating procedures will be available for all materials, operations and
equipment.
• The workers will be informed of consequences of failure to observe the safe
operating procedures.
• Safe operating procedures will be formulated and updated, specific to process
& equipment and distributed to concerned plant personnel.
• Safety procedures will be prepared and displayed meticulously in Telugu and
English languages.
FIRE PROTECTION • Well-designed pressured hydrant system comprising with jockey pump,
electrical & diesel pumps, hydrant, monitor etc. Will be installed at the plant.
Prepared By Rightsource Industrial Solutions Pvt. Ltd. Chapter - VII Page 188
EIA Report Urmila Chemopharma Pvt. Ltd.
• The fire fighting system and equipment will be tested and maintained as per
OISD-117 standard.
• Heat and smoke detectors will be provided at the plant and warehouse
(solvent storage area) and calibrated.
STATIC ELECTRICITY • All equipment and Storage tanks / Containers of flammable chemicals are will
be bounded and earthed properly.
• Electrical pits will be maintained clean and covered.
• Electrical continuity for earthing circuits shall be maintained.
• Periodic inspections shall be done for earth pits and record will be maintained.
7.12 COMMUNICATION SYSTEM
Communication facilities will be checked periodically for its proper functioning.
7.13 SAFETY INSPECTIONS
The system will be initiated for checklist based routine safety inspection and internal
audit of the plant. Safety inspection team will be formed from various disciplines and
departments.
7.14 PREDICTIVE AND PREVENTIVE MAINTENANCE
Predictive and preventive maintenance schedule will be followed in religious manner.
ELECTRICAL SAFETY
• Insulation pad at HT panels will be replaced at regular interval.
• Housekeeping in MCC room will be kept proper for safe working conditions.
COLOUR CODING SYSTEM
Colour coding for piping and utility lines are will be followed in accordance with IS:
2379:1990.
DISASTER MANAGEMENT PLAN
ONSITE EMERGENCY PLAN
OFFSITE EMERGENCY PLAN
7.15 ONSITE EMERGENCY PLAN
The details of Onsite emergency plan system are discussed in the following sections
Prepared By Rightsource Industrial Solutions Pvt. Ltd. Chapter - VII Page 189
EIA Report Urmila Chemopharma Pvt. Ltd.
DEFINING THE NATURE / LEVEL OF EMERGENCY
The levels of emergency can be classified in three categories
LEVEL-1
The leakage or emergency which is confinable the plant, premises. It may be due to-
• Small fire in the plant
• Low toxic gas release for short duration.
• Collapsing of equipment that do not affect outside premises.
LEVEL-2
The emergency which is confinable within the factory premises. It may arise due to
• Major fire inside the factory premises.
• Medium scale explosion confined to the factory premises.
• Heavy toxic/flammable gas leakage for short duration.
LEVEL-3
The emergency which is not confinable within the factory premises and general
public in the vicinity likely to be affected. It may arise due to
• Explosion of high magnitude affecting the adjacent area
• Heavy/profuse leakage of toxic/flammable gases for a long duration.
7.16 STRUCTURE OF EMERGENCY MANAGEMENT SYSTEM
The company will develop an emergency management team. The management
structure includes the following personnel
• Site main Controllers
• Incident Controllers and Deputy Incident Controllers
• Key Personnel’s
• Essential Workers
The other elements of Disaster management plan are
• Assembly points
• Emergency control center
• Fire control center
• Medical arrangements
• Other arrangements
Prepared By Rightsource Industrial Solutions Pvt. Ltd. Chapter - VII Page 190

EIA Report Urmila Chemopharma Pvt. Ltd.
7.17 EMERGENCY MANAGEMENT SYSTEM – ROLES & RESPONSIBILITIES
Roles and responsibilities of the responsible persons are described.
7.17.1 SITE MAIN CONTROLLER [SMC]
PLANT HEAD will be the site main controller. In absence of PLANT HEAD, EHS
HEAD will act as a SMC.
His task will be to co-ordinate all internal and external activities from the emergency
control centre at main security gate from where all operations will be directed. He
shall:
• Immediately on being informed of the emergency and its location, will arrive
at the scene and handle the situation.
• Relieve the incident controller from responsible of the main controller
• Co-ordinate to avail services from external agencies like fire brigade,
hospitals etc. is called for, following the declaration of major emergency. If
necessary, major installations in the vicinity may also be informed of the
situation.
• Exercise direct operational control of the unaffected section of the plant.
• In consultation with the advisory team, expedite the shutting down of
loading/unloading operations of tankers and if necessary, instruct the
supervisor/security/personnel to evacuate tankers.
• Ensure that all employees are evacuated from the affected area and the
casualties, if any, are given necessary medical attention. Instruct P&A
Assistant/security for rushing casualties to hospitals if required.
• Liaise with fire and police officials, pollution control board officials and other
statutory bodies and advise them of all possible consequence effects
outside the premises.
• Arrange for relief of personnel when emergency is prolonged
• Issue authorized statement or press release to the news –media
• Ensure preservation of evidence for enquiries to be conducted by statutory
authorities.
• Authorize the sounding of “All Clear” and “Evacuation Siren”
• Arrange for obtaining the head-count of all personnel within the premises
and cross-checking with the data from records available for no. of persons
within the premise.
Prepared By Rightsource Industrial Solutions Pvt. Ltd. Chapter - VII Page 191
EIA Report Urmila Chemopharma Pvt. Ltd.
7.17.2 INCIDENT CONTROLLER/ DEPUTY INCIDENT CONTROLLER
Role of Incident Controller [Plant Manager/ Shift in Charge]: He is the shift supervisor
of the plant. Assume the role of the incident controller and take charge of the
situation. Keep the SMC informed of the situation from time to time.
1. Proceed to the scene of emergency and assess the situation
2. Direct all operation within the affected area with the following priorities
• Safety of personnel
• Minimize damage to property and loss of material
• Arrange for rescue of trapped workers and those in a state of shock
• Get all non-essential persons safely evacuated after stopping all the
engineering/hot jobs.
• Set up a communication system with the main control center at the main
security gate through telephone or messenger system.
• Pending arrival of the main controller, direct the shutting down and
evacuation of the site
• Report all developments to the main controller
• Preserve all evidence for use in the subsequent enquiry.
• Intimate to the Emergency Control Center (Main Security Gate) the head
count of plant.
7.17.3 KEY PERSONNEL’S
• Key Personnel are required to provide and to implement the decisions made
by the SMC in the light of information received on the developing situation at
the time of emergency.
• As necessary, they will decide the actions needed to shut down plants,
evacuate personnel, carryout emergency engineering work, arrange for
supplies of equipment, utilities, carryout environment monitoring, provide
catering facilities, liaise with police, fire brigade and other local authorities,
relative of casualties, hospital, press & neighboring industries
• Action at assembly points, outside shelters and mutual aid center under the
direction of the SMC.
• All the key personnel and other called in so to assist shall report to the ECC.
• They shall be available at any time on duty or on call or on holiday.
Prepared By Rightsource Industrial Solutions Pvt. Ltd. Chapter - VII Page 192
EIA Report Urmila Chemopharma Pvt. Ltd.
7.17.4 ESSENTIAL WORKERS
A task force of essential trained workers [Expert’s team] is available to get the work
done by the Incident controller and the SMC. Such work will include:
• Fire fighting and spill control till a FIRE BRIGADE takes the charge
• To help FIRE BRIGADE and MUTUAL AID teams, if it is so required
• Shutting down plant and making it safe
• Emergency engineering work e.g. isolating equipments, material process,
providing temporary by pass lines, safe transfer of materials, urgent repairing
or replacement, electrical work, etc
• Provision of emergency power, water, lighting, instruments, equipments,
materials, etc
• Movement of equipment, special vehicle and transport to or from the scene of
the accident.
• Search, evacuation, rescue and welfare.
• The injured is given First Aid.
• Moving tankers or other vehicles from area of risk.
• Carrying out atmospheric test and pollution control.
• Manning of assembly points to record the arrival of evacuated personnel.
Manning for outside shelters and welfare of evacuated persons there.
• Assistance at causalities reception areas to record details of causalities.
• Assistance at communication centers to handle outgoing and incoming calls
and to act as messengers if necessary.
• Manning of works entrances in liaison with the police to direct emergency
vehicles entering the work. To control traffic leaving the works and to turn
away or make alternative safe arrangements for visitors for visitors,
contractors and other traffic arriving at the works.
• Inform neighboring factories and the public as directed by the Site Main
Controller.
• Any special help required.
7.18 OTHER ELEMENTS OF DMP
There are some other elements of DMP which are described as follows:
Prepared By Rightsource Industrial Solutions Pvt. Ltd. Chapter - VII Page 193

EIA Report Urmila Chemopharma Pvt. Ltd.
7.18.1 ASSEMBLY POINT
Assembly points are those locations where the persons who are not connected with
emergency operations can await either for further instructions or for rescue transport
and rehabilitation. Presently outside the plant area is considered as such assembly
points, taking into consideration of the size of the plant facilities. As the location of
security gate is far off the Assembly Point is not vulnerable for emergencies.
• The affected & vulnerable plants, all non-essential workers [who are not
assigned any emergency duty] will be evacuated from the area & they shall
report to specified Assembly point.
• Assembly Point shall be located at a safe place, well away from area of risk
and least affected by the down wind direction.
• To ensure that workers do not have to approach the affected area to reach
the Assembly point proper location and numbers have been marked at
Assembly point.
• Each Assembly Point is manned by a nominated person to record the names
and dept.
• At each Assembly point duties of in - charge shall be displayed in brief.
• Before reaching an Assembly point or subsequently, if it is required to pass
through an affected area or due to presence of toxic substances, suitable
PPE’s including respirators, helmet etc., are issued & made available with
workers.
7.18.2 EMERGENCY CONTROL CENTER
The Emergency Control Center is the place or room from where the operations to
handle the emergency are directed and coordinated. Main Control Room has been
earmarked / identified as the Emergency Control Room. Fire Control Room shall be
earmarked / identified as the alternative Emergency Control Room to be operated in
case of unfavorable wind direction. Adequate Telecommunication System is
available in the Emergency Control Room.
The ECC center has been equipped with the following facilities.
1. Internal and external telephone including STD facility
2. Telephone directory
3. Factory layout plan
4. Map of the area
Prepared By Rightsource Industrial Solutions Pvt. Ltd. Chapter - VII Page 194

EIA Report Urmila Chemopharma Pvt. Ltd.
5. Employee blood group and their address
6. Messengers / Runners for sending messages
7. Adequate numbers of PPE’s
8. Telephone nos. of mutual aid centers, Statutory authorities & Hospitals
7.18.3 FIRE SERVICES
Fire Fighting, Gas leak Control and Rescue operation
A] Role of Manager [Fire and Safety/shift in-charge]
• Manager- Fire and Safety/ Shift In-charge will be the only person to direct
the fire fighting and emergency operation.
• Keep the constant touch with the chief emergency controller.
• Direct the crew members to the scene of emergency and arrange
replenishment of man power/equipment/extinguishing media etc.
B] Fire and Safety officer
• On being notified about the location of fire/gas leakage immediately
proceed to the scene of incident with fire tender and crew.
• Position the fire tender in upwind direction.
• Decide his line of action in consultation with incident controller and take
appropriate measures to handle the emergency.
• Assessing the severity of the incident immediately report to emergency
controller about the gravity of the situation.
• He will assess the extra requirement required if any from the neighboring
industry.
C] Fire Crew Members
• On hearing fire alarm, emergency siren they shall immediately report to
control room and proceed to the scene of emergency and work under the
direction of shift fire & safety officer.
• The personal availability at the scene of incident to be made optimize.
D] Emergency Squad Members
• On hearing Emergency Siren ,they shall immediately report to site main
controller, safety in charge or incident controller
• They shall combat the emergency situation as per the direction of site main
controller, Safety In- charge or Incident controller
• They shall help for safe evacuation
Prepared By Rightsource Industrial Solutions Pvt. Ltd. Chapter - VII Page 195
EIA Report Urmila Chemopharma Pvt. Ltd.
7.18.4 MEDICAL SERVICES
A] Role of Chief Medical Officer/Medical Officer
• He will contact immediately to chief emergency controller
• He will render necessary treatment as first aid center and hospital.
• He will arrange for hospitalization and treatment at outside hospitals if
required.
• He will mobilize extra medical assistance from outside if necessary.
• He will make arrangement for treating public if necessary.
B] Role of other Medical staff
• As directed by medical officers.
7.18.5 SECURITY SERVICES
Role of H.O.D. (Security) / Security Officers
• Receive message from the observer
• Initiate the emergency siren to declare the emergency
• Announce on the public address system
• Arrange to close all the gates and stop traffic
• Keep vehicle/ambulance ready and keep track of casualty sent to hospital
during off hours
• Ensure that unauthorized persons/vehicles do not enter the premises
• Organize the positioning and transport of vehicles near the main gate
• Depute security guard for controlling traffic at the scene of emergency
• Call up for additional help from the outside agency like fire brigade,
hospitals during off hours.
Role of Security Guard
• On hearing emergency siren contact security officer and work under his
directions
7.18.6 MUTUAL AID
In emergency situations, resources over and above those available at the works may
be needed. Emergency Coordinator would be contacting neighboring factories for
help. A survey of industries who can come to help and also the help, they can extend
is done as mentioned below.
Prepared By Rightsource Industrial Solutions Pvt. Ltd. Chapter - VII Page 196
EIA Report Urmila Chemopharma Pvt. Ltd.
• The help would be in the form of technical manpower, medical aid,
transport for rescue and Rehabilitation, fire fighting, additional special
protective wear or any other help as the case may be.
• Manager – Fire & Safety who is Emergency Coordinator is assigned with
this responsibility and he would maintain liaison during non-emergency
period and ensure co-operation
• Similarly, the help required from civil administration, in respect of medical
aid, transport, law and order, rehabilitation etc. are identified and liaison is
established with Mandal Revenue Officer and Police Officials.
7.19 EMERGENCY RESPONSE
Concept of operations deals with the possible steps associated with an emergency
response assuming the most severe emergency scenario. This includes:
• Accident initiation and rising of alarm
• Accident evaluation and emergency declaration
• Off site and external agency notification
• Implementation of onsite response actions
• Implementation of protective actions and evacuations
• Co-ordination of response action with external agencies
• Management of emergency resources
• Recovery and facilitate re-entry procedures
7.20 EMERGENCY CAPABILITIES
The primary emergency response facilities comprise with emergency control center
upon declaration of emergency, the main security gate office will become the
Emergency Control Center [ECC]. The ECC is located in a low /minimal risk zone of
the plant.
7.21 EMERGENCY HANDLING PROCEDURES
Action plan
• On hearing emergency declaration siren and announcement on public
address system, all key persons will rush to their nominated location and
start actions.
• The main controller will continuously assess the situation by taking
feedback from the incident controller. He will consult the advisory team
Prepared By Rightsource Industrial Solutions Pvt. Ltd. Chapter - VII Page 197
EIA Report Urmila Chemopharma Pvt. Ltd.
members to get essential information if required but if does not required to
take help from advisory team; he can assign other jobs to advisory team.
• Once the emergency is brought under control, Main Controller will inform to
security to give “ALL CLEAR” siren and announce on Public Address
System about termination of emergency.
In the case the emergency assumes off site dimensions and cannot be controlled,
then if the chief controller with his advisory team decides to evacuate the plant, he
will instruct the security to sound “EVACUATION SIREN”
Procedure in case emergency tends to have off site implications
• As per the sire plan and wind direction at the time of emergency, the likely
affected area will be identified and population within will estimated.
• The police will be informed so that in-coming traffic on highway can be
controlled from both the ends. The police force will be helpful in
evacuation of villages, factories or other public places in the vicinity
• The fire brigade will be informed and ambulance will be called and kept
ready to meet any eventuality.
• Neighboring factories will be communicated for sending help.
• Statutory authorities such as factory inspector, district collector and others
concerned to be intimated.
Procedure for salvage operations
• The salvage operation will be carried out under the guidance of the main
controller, his advisory team and incident controller.
They will conduct accident investigation; assess the damages-the clock by security
supervisors.
During emergency, the main controller and his advisory-team will confirm:
• Layout of facility, equipment and storages, displayed on table and wall
• Availability and location of personal protective equipment
• Self-contained breathing apparatus sets and the spare cylinders
• External telephone with direct dialing and STD facilities/Mobile phone
• Internal telephone
• List of important internal and external telephone numbers displayed on
table and wall.
• Transport facility
Prepared By Rightsource Industrial Solutions Pvt. Ltd. Chapter - VII Page 198

EIA Report Urmila Chemopharma Pvt. Ltd.
• Extra copies of plant layout for marking during emergency
• General stationary like paper, pencil etc.
• Nominal roll and address of all employees with contract telephone no’s
and blood group
• List of first aiders and emergency squad members
• Details of all contractors and their employees.
• Details of meteorological information during different seasons such as
wind speed, direction, temperature, humidity etc.
The location of ECC, Assembly point, availability of first aid boxes, fire extinguishers,
PPE should be marked onsite.
7.21.1 MITIGATION OF ENVIRONMENTAL IMPACT DURING FIRE EMERGENCY
• In case of fire, prevent contact of fire with flammable material or prevent
of fire by other means
• Use water or suitable fire extinguisher to extinguish fire
• Contain the contaminated water or any other liquid to prevent it going to
soil or drain and divert it to ETP storage tank. If required treat it before
sending to ETP tank.
• Any solid waste generated should be collected, stored and send to TSDF
site.
• During fire emergency use necessary PPE.
• Bottom valve failure: mitigation of environment impact during failure of
between valves or tank failure.
• In case of material coming out of the bottom valve shall be contained
inside the dyke wall and will be transferred to HDPE plastic drum by help
of pump/piping.
• In case of acid spillage after pumping shall be neutralized and waste shall
be cleaned with help of water and send the water to ETP.
• The failed bottom valve shall be replaced or repaired and restart. After
tank is empty valve will be repaired, or replaced. In case of leakage form
tank body tank will be repaired.
• Preventions of failure: preventive maintenance of bottom value shall be
carried out as per schedule. To prevent any leakage from tank body,
thickness checking shall be same as per schedule.
Prepared By Rightsource Industrial Solutions Pvt. Ltd. Chapter - VII Page 199
EIA Report Urmila Chemopharma Pvt. Ltd.
• In case of bottom value failure or heavy leakages from tank body material
in the tank shall be transferred to the HDPE drums, by running the pump.
• Preventions of failure: preventive maintenance of bottom valve shall be
carried out as per schedule. To prevent any leakage from tank body,
thickness checking shall be same as per schedule.
• In case of any material leaching the soil it shall be neutralized and
washed with water.
RAISING THE ALARM
• Emergency alarm shall be raised in the event of an emergency.
• Any person noticing an unusual occurrence, fire, toxic or corrosive
substance leakage etc. shall inform the concerned department/section
head/shift in charge immediately and try to control/contain the incident.
• Departmental head/shift in charge will immediately go to the site of
incident, assess the situation and initiate the action to “blow the
emergency Alarm” by telephoning the main gate to security officer/Asst,
security officer/Security supervisor.
• In case of telephone failure a messenger will be sent running to main gate
to inform.
Details of siren are given below
Siren codes • Declaration of emergency: - A long short wailing siren for one minute will
mean that there is an emergency within the premises.
• All clear siren: - A long siren for one minute will mean that the emergency
declared is under control, i.e. all clear. This siren code will mean All clear,
normal condition.
• Evacuation siren: - A long short wailing siren for 3 [three] minutes, will
mean that emergency declared cannot be controlled. Hence all persons in
the premises will evacuate as per the plan.
7.22 DECLARING MAJOR EMERGENCY
Major emergency may be declared after sufficient thought because it activates many
agencies and the nominated persons to declare major emergencies.
Prepared By Rightsource Industrial Solutions Pvt. Ltd. Chapter - VII Page 200
EIA Report Urmila Chemopharma Pvt. Ltd.
7.23 TRANSPORT AND EVACUATION ARRANGEMENTS
• Arrangements shall be made for the transport and evacuation of persons in
case of any emergency situation arises in the factory.
• Those employees who have own vehicles will make arrangements to shift the
injured.
7.24 PLANT OPERATIONS
1. ROLE OF HOD • He will take plant related decisions, which will facilitate the fire fighting
operation.
2. PLANT EMPLOYEES They shall:
• On heaving the siren, report to plant supervisor
• Do as directed by plant supervisor
• Stop all hot works
• Remove unwanted persons from the affected area to the “Assembly Point
“near main security gate viz visitors, guests
• Stop all non-essential operations
3. NON-PLANT EMPLOYEES On hearing the siren, shall stop their work assemble at “Assembly Point” near main
security gate along with guests and visitors.
4. TELEPHONE MESSAGES Telephone operator has to pay vital role in case of emergency. After hearing the
siren/ hooter, he/ she should inform to all key personnel immediately on phone. He/
she should receiving be very sharp, precise, attentive and quick in & noticing the
message.
5. MOCK DRILL In spite of detailed training, it may be necessary to try out whether, the OSEP works
out and will there be any difficulties in execution of such plan. In order to evaluate
the plan and its effectives of meeting the objective of the OSEP, occasional mock
drills are contemplated. After a few pre- informed mock drills, few un-informed mock
drills would be taken. All this is to familiarize the employees with the concept and
procedures and to see their response. These scheduled and unscheduled mock
drills would be conducted during shift change, public holidays, in night shifts etc, to
Prepared By Rightsource Industrial Solutions Pvt. Ltd. Chapter - VII Page 201

EIA Report Urmila Chemopharma Pvt. Ltd.
improve preparedness. Emergency Coordinator [EHS] is responsible for organizing
planned and unplanned mock drills.
Two types of Mock drills are in practice. They are
1. Announced-Once in 3 months
2. Unannounced –Once in 6 months.
Mock drill observation
Mock drill observation team is constituted and they note down the action of various
coordinators in chronological order. The time of arrival of each coordinator and their
duties are detailed in a note. Immediately after mock drill, the advisory team and
emergency coordinators meet and review the mock drill records in chronological
order and take note of corrective action. The record of this meeting note is circulated
for compliance of concerned.
Role of Mock drill observers
• Note readings of plant instruments • Meteorological conditions • Time of emergency declaration and time when the personnel responded /
reported • Ambulance reported and time when additional vehicles reported • Collect information description of the event, estimated quantity of the gas
release, fire, contamination and effected levels at various locations, injuries and equipment damage.
7.25 OFFSITE EMERGENCY PLAN
“If the accident is such that its affects inside the factory are uncontrollable and it
may spread outside the factory premise, it is called as “OFFSITE EMERGENCY”
FLOWCHART FOR OFFSITE EMERGENCY PLAN
Prepared By Rightsource Industrial Solutions Pvt. Ltd. Chapter - VII Page 202
EIA Report Urmila Chemopharma Pvt. Ltd.
The Offsite emergency plan is made based on events, which could affect people and
Environment outside the premises. The off site plan is largely a matter of ensuring
the co-ordination of proposed services and their readiness as far as possible, for the
specific hazards and problems, which may arise in as incident. Briefly two main
purposes of the plan are as under:
To provide the local district authorities, police, fire brigade, doctors etc. the basic
Information of risk and environmental impact assessment and to appraise them of
the consequences and the protection / prevention measures and control plans and to
seek their help to communicate with the public in case of major emergency.
To assist with the district authorities, while preparing the Offsite emergency plan of
the district or particular area. We will make our key personnel and others fully aware
about this off-site emergency plan. The function of the offsite plans are as under:
Structure of the offsite emergency plan includes the following:-
• Organizational set up-Incident controller /Site main controller, Key personnel,
etc
• Communication facilities - List of important telephones
• Specialized emergency equipment - Firefighting equipment
• Specialized Knowledge - Trained people
• Voluntary Organization - Details of organization
• Chemical information - MSDS of hazardous substances
• Meteorological information - Weather condition such as Wind velocity, Wind
Speed, Humidity, Temperature etc
• Humanitarian arrangement - Transport, First aid and Ambulance
7.26 ROLE OF THE FACTORY MANAGEMENT
The Onsite and Offsite plans are come together so that the emergency services are
call upon at the appropriate time and are provided with accurate information and a
correct assessment of situation.
7.26.1 ROLE OF LOCAL AUTHORITY
Generally the duty to prepare the off-site plan lies with the local authority. They may
have appointed an Emergency Planning Officer (EPO) to prepare whole range of
different emergency within the local authority area.
Prepared By Rightsource Industrial Solutions Pvt. Ltd. Chapter - VII Page 203
EIA Report Urmila Chemopharma Pvt. Ltd.
7.26.2 ROLE OF FIRE AUTHORITY
The control of a fire is normally the responsibility of the senior fire brigade officer who
would take over the handling of fire from the Incident Controller on arrival at the site.
7.26.3 ROLE OF POLICE
The overall control of an emergency is normally assumed by the police with a senior
officer designated as emergency coordinating officer. Formal duties of the police
during emergency include protection of life and property and controlling traffic
movements.
7.26.4 ROLE OF HEALTH AUTHORITIES
Health authorities, including doctors, surgeons, hospitals, ambulances etc. have a
vital role to play following a major accident and they should form an integral part of
the emergency plan. Major off site incidents are likely to require medical equipments
and facilities in addition to those available locally.
7.26.5 ROLE OF THE “MUTUAL AID” AGENCIES
Some types of mutual aids are available from the neighboring factories, as per need,
as a part of the onsite and Offsite emergency plan.
7.26.6 ROLE OF THE FACTORY INSPECTORATE
In the event of an accident, the factory inspector will assist the District Emergency
Authority for information and help in getting mutual aid from neighboring factories.
Unit maintains the records of details of emergency occur, corrective preventive
measures taken and in future the same practice will be continued. Unit will be
displayed the details like list of assembly points, name of the persons involve in the
safety team like Site Controller, Incident controller etc.
Prepared By Rightsource Industrial Solutions Pvt. Ltd. Chapter - VII Page 204

PROJECT BENEFITS
CHAPTER -VIII

EIA Report Urmila Chemopharma Pvt. Ltd.
.CHAPTER – VIII
PROJECT BENEFITS
The proposed project will become beneficial to the surrounding area or community in
terms of employment, social development and other benefits as described hereunder;
8.1 EMPLOYMENT POTENTIAL
The proposed project has employment potential for skilled (16 persons), semi-skilled (7
persons) and unskilled (42 persons). The preference will be given to local population for
employment; this will increase the employment opportunity in the surrounding area.
Indirect employment is also bound to be generated to provide day-to-day needs and
services to the work force and industrial activity. This will also increase the demand for
essential daily utilities in the local market. The employed people will be benefited
financially.
8.2 CORPORATE SOCIAL RESPONSIBILITY (CSR) & CORPORATE
ENVIRONMENT RESPONSIBILITY (CER)
Urmila Chemopharma Pvt. Ltd. not only carries out business but also understands
obligations towards the society. Unit will employ people from the nearby villages for the
proposed expansion project. The wages paid to direct and indirect workforce in the
proposed expansion project will fulfill their monetary requirements, which in turn leads to
socio economic development in the surrounding villages. The Project proponent is well
aware of the obligations towards the society and to fulfill the social obligations. Unit will
also try to generate maximum indirect employment in the nearby villages by appointing
local contractors during operation phase.
Unit will be contributing reasonably as part of their CSR & CER activities. Unit will spend
about 2% for CSR & 2% for CER activities like potable water supply & educational aid
and conduct medical camps & Self Help Skill Training to the nearby villages. CSR
activities identified and planned at present are described below Table.
Prepared By Rightsource Industrial Solutions Pvt. Ltd. Chapter - VIII Page 205
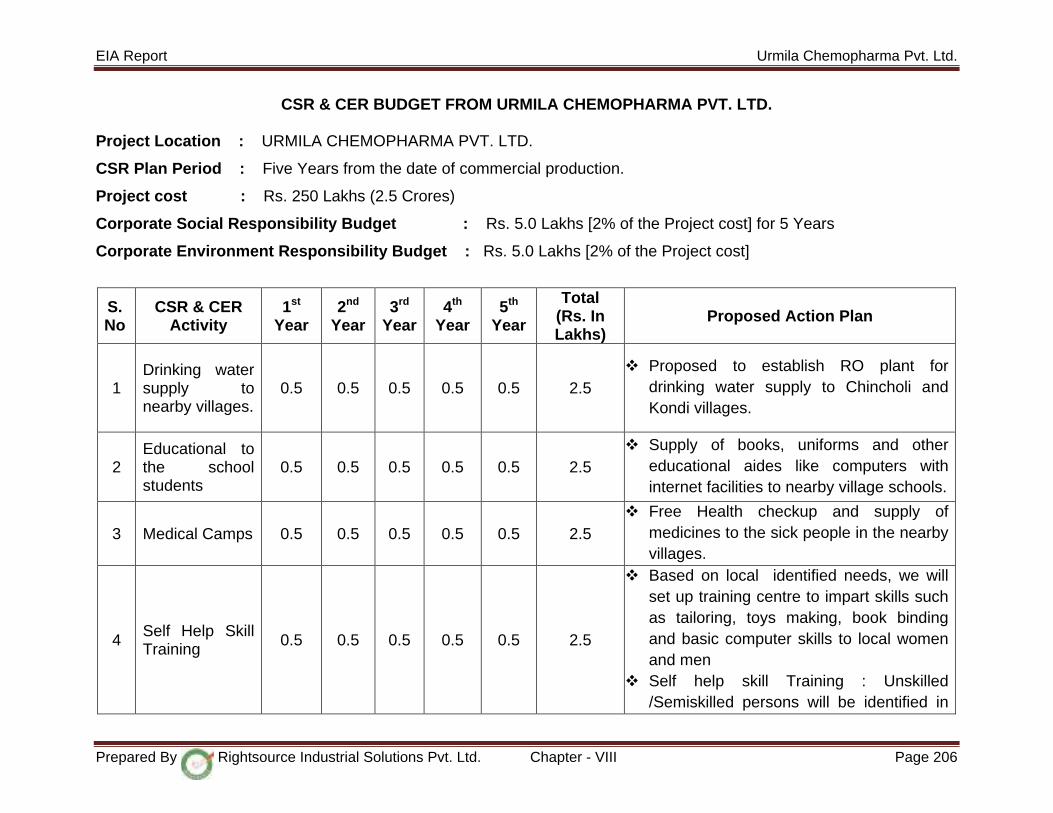
EIA Report Urmila Chemopharma Pvt. Ltd.
CSR & CER BUDGET FROM URMILA CHEMOPHARMA PVT. LTD. Project Location : URMILA CHEMOPHARMA PVT. LTD.
CSR Plan Period : Five Years from the date of commercial production.
Project cost : Rs. 250 Lakhs (2.5 Crores)
Corporate Social Responsibility Budget : Rs. 5.0 Lakhs [2% of the Project cost] for 5 Years
Corporate Environment Responsibility Budget : Rs. 5.0 Lakhs [2% of the Project cost]
S. No
CSR & CER Activity
1st Year
2nd Year
3rd Year
4th Year
5th Year
Total (Rs. In Lakhs)
Proposed Action Plan
1 Drinking water supply to nearby villages.
0.5 0.5 0.5 0.5 0.5 2.5 Proposed to establish RO plant for
drinking water supply to Chincholi and Kondi villages.
2 Educational to the school students
0.5 0.5 0.5 0.5 0.5 2.5 Supply of books, uniforms and other
educational aides like computers with internet facilities to nearby village schools.
3 Medical Camps 0.5 0.5 0.5 0.5 0.5 2.5 Free Health checkup and supply of
medicines to the sick people in the nearby villages.
4 Self Help Skill Training 0.5 0.5 0.5 0.5 0.5 2.5
Based on local identified needs, we will set up training centre to impart skills such as tailoring, toys making, book binding and basic computer skills to local women and men
Self help skill Training : Unskilled /Semiskilled persons will be identified in
Prepared By Rightsource Industrial Solutions Pvt. Ltd. Chapter - VIII Page 206

EIA Report Urmila Chemopharma Pvt. Ltd.
S. No
CSR & CER Activity
1st Year
2nd Year
3rd Year
4th Year
5th Year
Total (Rs. In Lakhs)
Proposed Action Plan
villages and given necessary training as per industry requirement and we will absorb the personnel in industry as and when need arises
Total CSR & CER Budget 2.0 2.0 2.0 2.0 2.0 10.0
Prepared By Rightsource Industrial Solutions Pvt. Ltd. Chapter - VIII Page 207
EIA Report Urmila Chemopharma Pvt. Ltd.
8.3 DIRECT REVENUE EARNING TO THE NATIONAL AND STATE EXCHEQUER
This project will contribute additional revenue to the Central & State exchequer in the
form of Central GST & State GST. Thus, the proposed project will help the Government
by paying taxes from time to time, which is a part of revenue and thus, will help in
developing the area. Demand of the proposed products in foreign market is also
significant, which will boost the export potential of the company as well as country.
Export oriented units plays vital role in development of economy as well as local
physical infrastructure for further boosting of industrial development with sustainable
approach as the industries need to maintain good environment & safety environment to
get better foreign market.
8.4 IMPROVEMENTS IN THE PHYSICAL INFRASTRUCTURE
The project site is equipped with sufficient infrastructural facilities including drinking
water, toilets, sanitation facilities, power, easily accessible approach roads, public
transport, communication, etc. Hence no major benefit to the public infrastructure is
anticipated due to the proposed project.
8.5 IMPROVEMENTS IN THE SOCIAL INFRASTRUCTURE
The proposed project will have many employment & trade opportunities from the
inception of the operational activities. Thus, these considerable employment & trade
opportunities will eventually result in appreciable economic benefits to the local people
& businesses/ contractors and helps to improve in the social infrastructure.
8.6 OTHER TANGIBLE BENEFITS
The proposed project will have many employment & trade opportunities with the
inception of the construction activities. Thus, these considerable employment & trade
opportunities will eventually result in appreciable economic benefits to the local people
& businesses/contractors. The country shall also benefit from increase in excise and
GST. Foreign exchange earnings from exports are envisaged to increase. Beside of the
economic benefits, the general social & cultural development of the area is anticipated
at least due to the CSR activities planned by the company. The CSR activities to be
planned by the company can be considerably beneficial for Education, Self Help Skill
Prepared By Rightsource Industrial Solutions Pvt. Ltd. Chapter - VIII Page 208

EIA Report Urmila Chemopharma Pvt. Ltd.
Training & Environment, assistance to the disabled people etc. These all together with
the economic benefits of the proposed project will result in further benefits in terms of
the literacy level, primary and middle level education and on health facilities. A new
awareness generated can also have benefits to the social pattern. The long-term
implications of this change can be definitely considered as progressive.
Prepared By Rightsource Industrial Solutions Pvt. Ltd. Chapter - VIII Page 209

ENVIRONMENT COST BENEFIT ANALYSIS
CHAPTER -IX
EIA Report Urmila Chemopharma Pvt. Ltd.
CHAPTER - IX
ENVIRONMENT COST BENEFIT ANALYSIS
9.0 COST BENEFIT ANALYSIS
During the scoping stage; no recommendation of environmental cost benefit analysis is
suggested by the appraisal committee.
Prepared By Rightsource Industrial Solutions Pvt. Ltd Chapter – IX Page 210

ENVIRONMENTAL MANAGEMENT PLAN
CHAPTER -X
EIA Report Urmila Chemopharma Pvt. Ltd.
CHAPTER – X
ENVIRONMENT MANAGEMENT PLAN
10.1 INTRODUCTION
Environmental Management Plan reflects the commitment of the management to
protect the environment within and outside the industrial premises. An environmental
management plan is required for formulation and monitoring of environmental
protection measures during and after construction / Modification and commissioning
of the projects. Hence, the construction and operational phase is considered for
outlining the Environmental Management Plan for the said industry. The plan
indicates the details as to how various measures have been taken by the industry to
mitigate the pollutants generated due to its operations.
The Potential Environmental Impacts from the construction and operational activities
of the industry are summarized below.
A. Construction / Modification Phase:
• Site preparation, sanitation, noise, construction equipment & waste and site
security.
B. Operation Phase:
• Air pollution due to emission of Particulate Matter, Sulphur dioxide, Nitrogen
oxide from the boiler stack and D. G. Set.
• Gaseous emissions from process leading to workroom air pollution.
• Noise pollution due to noise generating equipment operation.
• Disposal of effluent generated due to plant operations.
• Disposal of Solid Wastes generated due to the plant operation.
Prepared By Rightsource Industrial Solutions Pvt. Ltd. Chapter – X Page 211

EIA Report Urmila Chemopharma Pvt. Ltd.
FIGURE 10.1: FLOW CHART OF EMP
IDENTIFICATION OF THE
POTENTIAL IMPACTS
RECOMMENDED MITIGATION
MEASURES
DESCRIPTION OF MONITORING PROGRAM
• ENSURE COMPLIANCE WITH RELEVANT STANDARDS AND RESIDUAL IMPACTS
ALLOCATION OF RESOURCES AND RESPONSIBILITIES FOR
PLAN IMPLEMENTATION
IMPLEMENTATION SCHEDULE AND REPORTING
PROCEDURES
CONTINGENCY PLAN WHEN IMPACTS ARE GREATER THAN
EXPECTED
Prepared By Rightsource Industrial Solutions Pvt. Ltd. Chapter – X Page 212
EIA Report Urmila Chemopharma Pvt. Ltd.
10.2 PRE- PROJECT ENVIRONMENTAL MANAGEMENT PLAN
Construction related impacts
The industry is proposed Bulk Drug Intermediates manufacturing unit. The potential
for environment pollution during the construction is obviously considerably less than
when the plant is in operation. The following factors require control during the
construction phase.
10.2.1 Site Preparation
The leveling operation will involve stockpiling of backfill materials. All the disturbed
slopes shall be stabilized with grass cover and dust nuisance controlled.
10.2.2 Sanitation
The site will be provided with sufficient and suitable toilet facilities with proper
hygiene for construction workers. Adequate potable water supply will be provided for
onsite workers.
10.2.3 Noise
The total noise effect in the vicinity during construction stage will be negligible in the
site and the site is far away from the nearest human habitation.
10.2.4 Construction Equipment and Waste
It will be ensured that construction related vehicles are properly maintained to
minimize exhaust emissions. Combustible waste will be burnt in a controlled manner.
Other wastes will be disposed off in to a dedicated dump. Spent liquid waste if any
arising from chemical treatment of built-up portions for termite etc., will be correctly
neutralized and disposed off.
10.2.5 Site Security
The site will be secured by fencing and manned at entry points. 10.3. ENVIRONMENTAL MANAGEMENT DURING OPERATION
10.3.1 AIR QUALITY
The emissions from boiler & D. G. Set are the sources likely to contribute to air
pollution. Adequate measures are being taken to minimize the impacts of these
emissions on the environment.
Prepared By Rightsource Industrial Solutions Pvt. Ltd. Chapter – X Page 213
EIA Report Urmila Chemopharma Pvt. Ltd.
The baseline data collected during the study period indicate that all seven pollutants
namely PM2.5, PM10, SO2, NOX, CO, NH3 and VOCs.
The industry proposed to install 2.0 TPH Coal fired boiler for generation of steam.
The fuel requirement of 8.0 TPD will be met from local authorized sources.
DG set is proposed to install 1 x 125 KVA for usage during the power failures.
10.3.1.1 AIR POLLUTION CONTROL / MANAGEMENT
Following are the proposed pollution control schemes and which will be used to
minimize and control the emission of air pollutants as well as their effective
dispersion into the atmosphere.
A. Stack Design
The stack of height 20 mtrs with controlling equipment (cyclone separator followed
by Bag Filters) will be provided for the coal fired boiler with the approximate flue gas
exit velocity of 15 m/s ensures proper dispersion of the flue gas into atmosphere.
This design will ensure the ground level concentration of the pollutants to comply
with the ambient air quality standards.
DG Set Stack emission controlled by providing adequate stacks height to disperse
into atmosphere and maintain the air pollutants within the limits prescribed by CPCB.
B. Fugitive Emissions from Solvents
Various types of solvents will be used in the proposed Bulk Drug Intermediates
manufacturing process. The solvents will be stored in drums and Bulk quantities will
be stored in storage tanks with vent condensers. These are handled in closed
conditions thereby reducing the losses in the form of evaporation. The industry will
take measures for reduction of fugitive emissions by providing Chilled brine
circulation to the condensers, which ensures the recovery of 95% and also controlled
by closed operations and handling methods. Good ventilation will be provided to
reduce the workroom concentrations. The reactor generating solvent vapors will be
connected to condensers with receivers.
C. Storage and Transportation of Raw Materials
The Raw materials / chemicals will be received in Fiber drums, HDPE drums, PP
bags by trucks. The same will be stored in ware house under lock & key
Prepared By Rightsource Industrial Solutions Pvt. Ltd. Chapter – X Page 214
EIA Report Urmila Chemopharma Pvt. Ltd.
arrangement. The handling of chemicals & solvents in a closed loop system will be
avoided leakages/ spillages. Providing proper roads for transportation to control Dust
and VOCs in air can be minimized by developing Greenbelt in and around the plant
premises.
10.3.2 NOISE POLLUTION
All the equipment in the plant would be designed as per the requirement of CPCB
standards.
NOISE ENVIRONMENT
Compressors, Boiler and DG set will be the major noise generating units in the plant,
of which generator will be functioning only at the time of power failure. There is no
need for the workers to be near the DG set & compressor units continuously. The
Generator sets will be placed in acoustic enclosures to maintain the noise levels as
permitted by CPCB.
NOISE POLLUTION CONTROL / MANAGEMENT
• The noise levels in the work place environment will be monitored periodically
and if necessary action will be taken in the form of regular maintenance
schedule to reduce noise and vibration in generating sources.
• The effects of the vibrations coming out of the base of the body over the
surrounding civil structures are minimized by providing Damping pads/Resilient
mounting at the time of installation.
• Under the general health check up scheme as per factory act, the workers will
however be checked up for any Noise induced Hearing Loss (NIHL) by a trained
ENT Doctor.
10.3.3 WATER QUALITY
Water is essentially used in Process, Boiler and cooling tower along with domestic
purpose. The total water required for the plant operations will be met from Surface
Water source.
WATER POLLUTION CONTROL / MANAGEMENT
The effluent generation is from process, boiler blow down, cooling tower bleed off,
Scrubbing System, washings and Domestic usages.
Prepared By Rightsource Industrial Solutions Pvt. Ltd. Chapter – X Page 215
EIA Report Urmila Chemopharma Pvt. Ltd.
• The unit will provide proper wastewater collection and Treatment methods to
treat the trade effluent in the plant premises.
• Process effluent will be segregated based on COD & TDS concentration and
collected separately by gravity from all sources into a collection Pit.
• Collected waste water will be pumped in to the above ground level tanks
separately.
• The industry by opting ZLD treatment system to recover water for recycle and
reuse for plant operations and to conserve the scarce resource of water.
Treatment system
• The effluent will be neutralized, the HTDS/ HCOD effluent will be sent to
steam stripping Column for collection of Organic distillate which is mixed in
the waste water stream. After stripping, effluent will be sent to Multi Effect
Evaporation System; Stripped Organics collected and sent to cement industry/
TSDF incinerator.
• The concentrate from the MEE System will be sent to ATFD and salts from
the ATFD will be collected and sent to TSDF for safe disposal.
• The LTDS effluent along with MEE / ATFD condensate will be sent to
Biological treatment, treated effluent sent to RO for water recovery.
• The RO permeate will be reused and RO reject will be sent to MEE followed
by ATFD for further evaporation. MEE condensate collected along with RO
permeates for reuse. Salts from ATFD collected and sent to TSDF.
• All the treatment tanks etc. is constructed only with acid proof tiles and 1.5 to
2.5 meters above the ground Level.
• Roof Water Harvesting System will be put in practice to recharge the ground
water.
Strategic Control / Management • Minimizing water usage.
• Segregation and collection of effluent for proper treatment and to minimize waste generation at treatment facility and to recover water for recycle and reuse.
• Reducing the water consumption for the process by way of developing the
process and operation methods.
• Prepare SOPs for handling and treatment of effluent water.
• Minimize spillage and leakage of effluent to avoid Land pollution.
Prepared By Rightsource Industrial Solutions Pvt. Ltd. Chapter – X Page 216
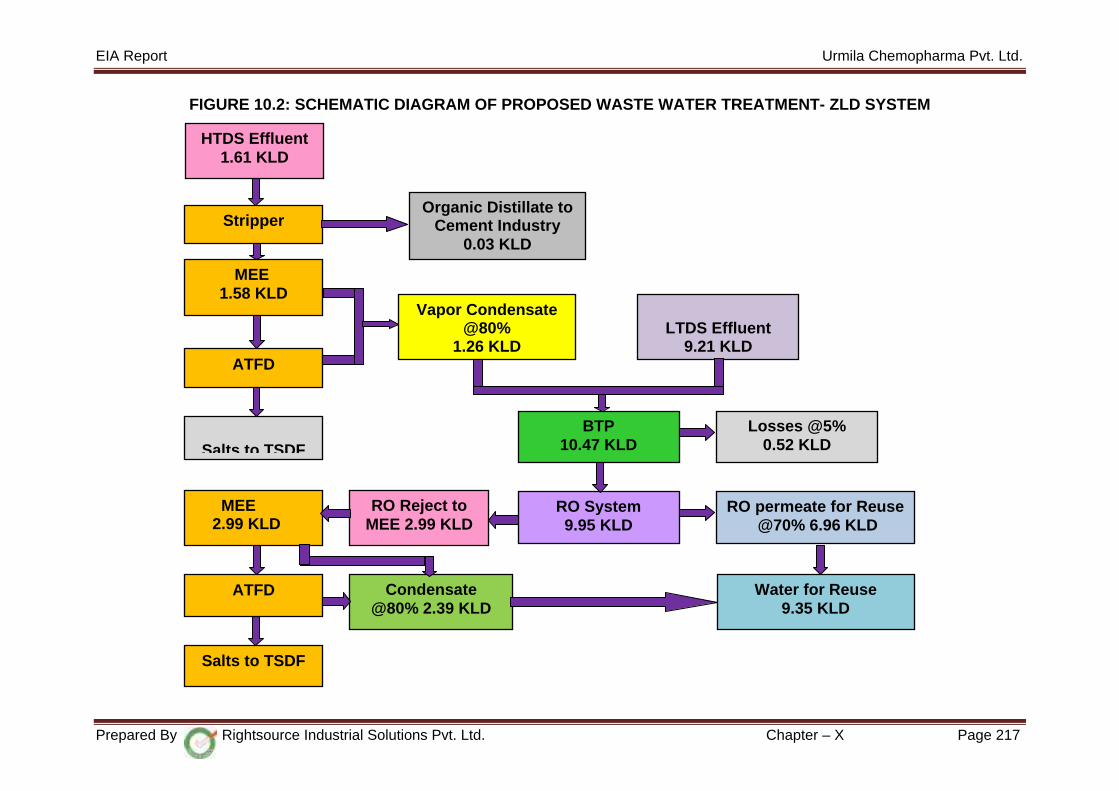
EIA Report Urmila Chemopharma Pvt. Ltd.
FIGURE 10.2: SCHEMATIC DIAGRAM OF PROPOSED WASTE WATER TREATMENT- ZLD SYSTEM
Salts to TSDF
Stripper
MEE 1.58 KLD
ATFD
Salts to TSDF
Organic Distillate to Cement Industry
0.03 KLD
Vapor Condensate @80%
1.26 KLD LTDS Effluent
9.21 KLD
BTP 10.47 KLD
Losses @5% 0.52 KLD
MEE 2.99 KLD
ATFD
RO System 9.95 KLD
RO permeate for Reuse @70% 6.96 KLD
RO Reject to MEE 2.99 KLD
Condensate @80% 2.39 KLD
Water for Reuse 9.35 KLD
HTDS Effluent 1.61 KLD
Prepared By Rightsource Industrial Solutions Pvt. Ltd. Chapter – X Page 217
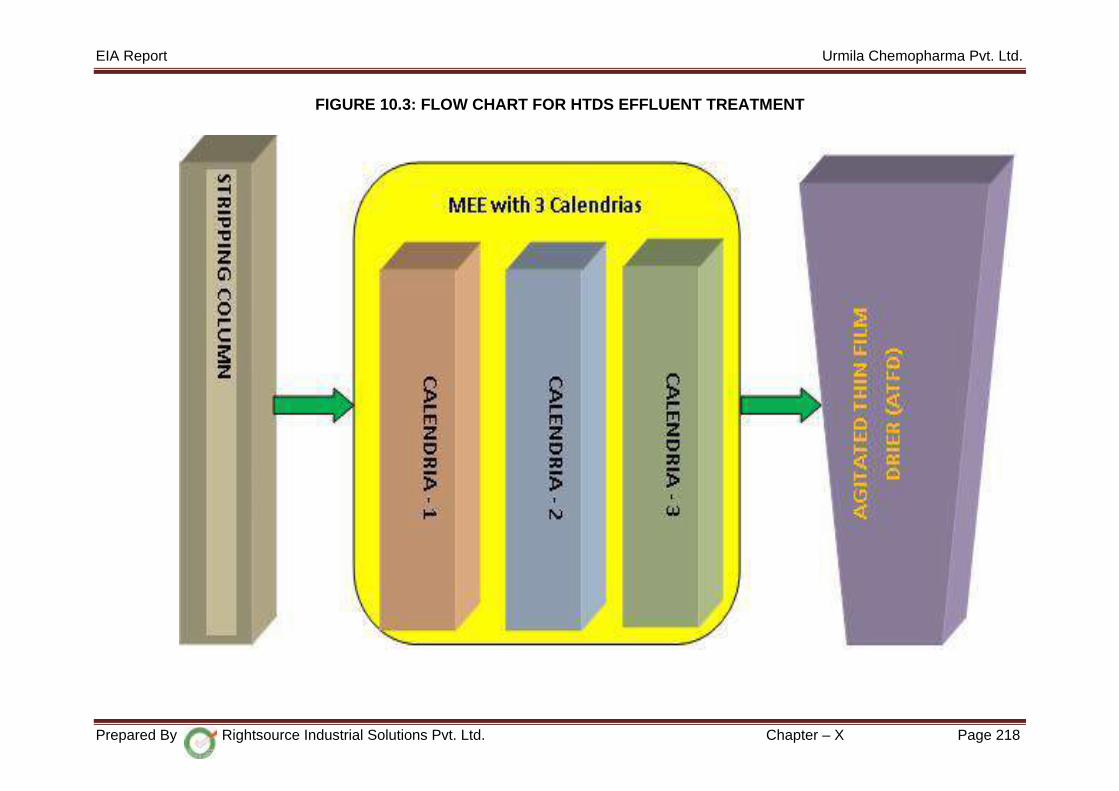
EIA Report Urmila Chemopharma Pvt. Ltd.
FIGURE 10.3: FLOW CHART FOR HTDS EFFLUENT TREATMENT
Prepared By Rightsource Industrial Solutions Pvt. Ltd. Chapter – X Page 218
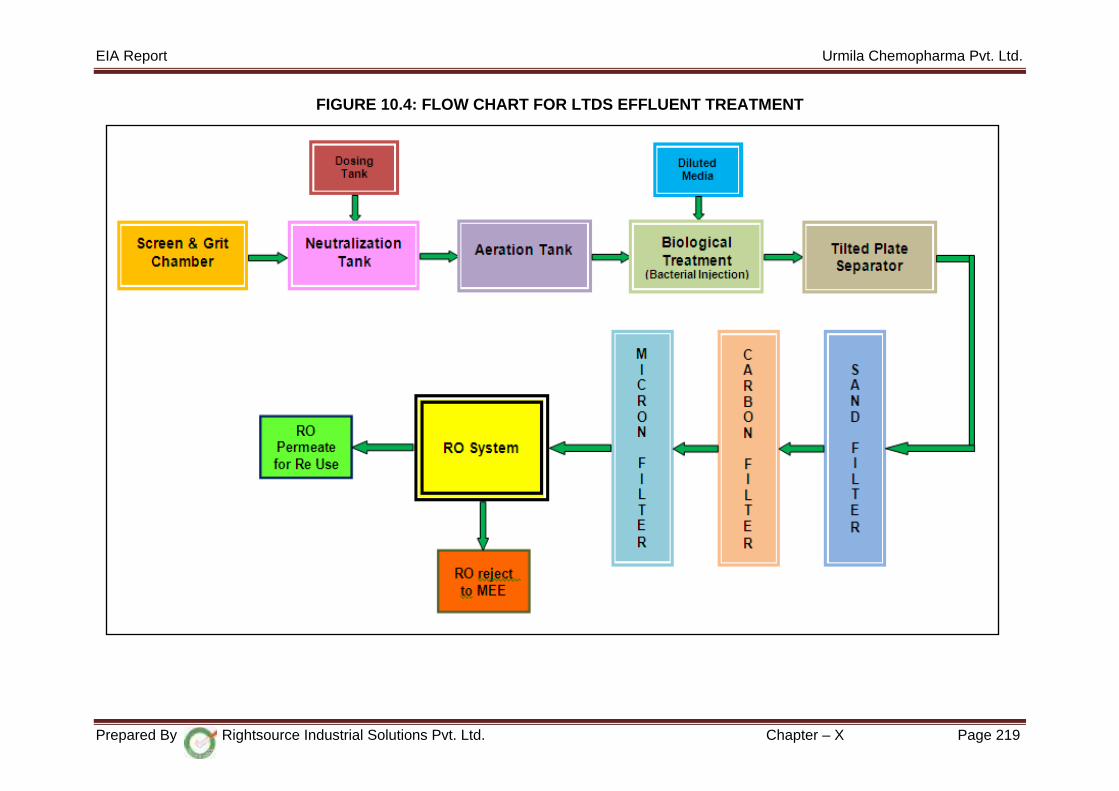
EIA Report Urmila Chemopharma Pvt. Ltd.
FIGURE 10.4: FLOW CHART FOR LTDS EFFLUENT TREATMENT
Prepared By Rightsource Industrial Solutions Pvt. Ltd. Chapter – X Page 219

EIA Report Urmila Chemopharma Pvt. Ltd.
10.3.3.1 DETAILS OF ZLD SYSTEM
All the effluent generated from the plant are collected in the Effluent collection pits
and from those pits effluent will be pumped to the above ground storage tanks
through the closed HDPE pipe lines. All these effluent collection pits are lined with
acid proof tiling or HDPE lining.
The Industry will construct the above ground storage tanks to store the collected
effluent from various streams. The tanks consist of 6 Compartments and are used to
store the HTDS in two compartments and LTDS in four compartments effluents
separately. These tanks can accumulate more than 4 days generation of effluent.
The HTDS effluent consists of COD will be sent to the Stripping Column for the
removal of same and thereafter the effluent will be sent to the MEE system which
consists of 3 Calendrias and the condensate will be collected. The concentrate will
be sent to ATFD for separation of salts. The condensate collected from MEE &
ATFD sent to ETP for treatment. The salts generated from the ATFD will be stored &
disposed to TSDF for secure Land Fill.
Now, the Condensate water from the MEE system along with the LTDS effluent will
be sent to the BTP system for the removal of BOD etc., The BTP system consists of
Aeration and Clarification. After this the treated effluent from biological system is
passed through the Sand Filter, Carbon Filter and Micron Filters and finally sent to
RO System.
70% water recovered as RO permeates. Remaining 30% reject water will be sent to
MEE followed by ATFD system for Evaporation. In this ZLD treatment we can
recover 70% of the water for recycle and reuse in the plant Utilities.
FIGURE 10.5: FLOW CHART FOR EFFLUENT TREATMENT
Effluent Type Treatment Flow
HTDS
Collection Equalization & neutralization Stripper MEE ATFD TSDF MEE/ATFD Condensate sent to Biological Treatment followed by RO.
LTDS
Collection BTP (Biological Treatment) Sand Filter Carbon Filter Cartridge Filter RO Plant RO Reject to MEE. RO Permeate for Re-usage.
Prepared By Rightsource Industrial Solutions Pvt. Ltd. Chapter – X Page 220

EIA Report Urmila Chemopharma Pvt. Ltd.
10.3.3.2 THE TECHNICAL DETAILS OF THE SYSTEMS ARE AS FOLLOWS:
MEE System Capacity: 10 KLD
RO System Capacity: 15 KLD
10.3.3.3 MEE PLANT CONFIGURATION
Part – A: Stripper Unit with Flash Condenser, Re boiler and Recirculation Pump
Part–B: Triple Effect Forced Circulation Evaporation Plant with Thermo
Compressor, Required Equipment & Components.
Part – C: Agitated Thin Film Dryer
10.3.3.4 PROCESS DESCRIPTION (Part – A)
1. Feed will enter to the series of Pre heaters of Evaporator P4, P3, P2 and then
P1 using Feed Pump. From Discharge of Feed Pump Feed will be heated
through Series of Pre heater using Vapour from Jacket of respective
Calendria. Feed will be heated to the boiling point and will enter to the
recirculation loop of Stripper.
2. Recirculation Loop of Stripper will comprise of Flash Vessel, Recirculation
Pump and Re boiler.
3. Feed coming out from Pre heater of Evaporation Plant will re-circulated
through boiler and heated up using Steam.
4. Heated Feed will allow flashing in Flash Vessel and by flashing high volatiles
and Water will convert to vapour. Vapour will travel from bottom to top of
Stripping column where feed liquid will flow from top to bottom. Random
packing inside the stripping column provide mass transfer surface to vapor
liquid interface.
5. Rich organic vapour with some water vapour will come out from the top of
Stripper column. This vapour will be condensed in Flash Condenser at the top
of Stripper column.
6. Condensed organic rich liquid will be collected in Reflux pot from condenser.
From Reflux pot partly it will be withdraw according to the desired Water
Vapour/ Organic ratio and remaining will enter to the column as reflux.
Prepared By Rightsource Industrial Solutions Pvt. Ltd. Chapter – X Page 221

EIA Report Urmila Chemopharma Pvt. Ltd.
10.3.3.5 PROCESS DESCRIPTION (Part - B)
1. From Discharge of Stripper recirculation Pump feed will enter to the
Evaporation Plant. Feed will enter to the Evaporation Plant from Discharge of
recirculation pump of Stripper.
2. First Effect is a Forced Circulation Type comprising of Calendria-1, Vapour
Separator-1 and Recirculation Pump– 1. Liquid will re-circulate continuously a
through Calendria Tubes at high velocity and will get heated using Heat of
Condensation of First Effect Jacket. This Heated Mass will allow flashing in
Vapour Separator and Water Vapour being generated.
3. This Flash Vapour will partly recompressed to the Jacket of First Effect using
Thermo compressor which will convert high pressure motive steam to low
pressure and will create suction and take part of the water vapour from
Vapour Separator -1.
4. Condensate from Jacket of First Effect will travel to 2nd Effect using pressure
difference available between these two Jackets.
5. Concentrate will be coming out from 1st Effect will be sent to Balance Tank -1
which will be placed between 1st and 2nd Effect.
6. Second Effect also is a Forced Circulation Type comprising of Calendria-2,
Vapour Separator-2 and Recirculation Pump– 2. Liquid will re-circulate
continuously a through Calendria Tubes at high velocity and will get heated
using Heat of Condensation of Second Effect Jacket. This Heated Mass will
allow flashing in Vapour Separator and Water Vapour being generated.
7. Concentrate coming out from 2nd Effect will be below saturation level and
there will not be any crystallization takes place in 2nd effect.
8. This Heated Mass will allow flashing in Vapour Separator and Water Vapour
being generated.
9. Concentrate will be coming out from 2nd Effect will be sent to Balance Tank -2
which will be placed between 2nd and 3rd Effect
10. Condensate coming out from 3rd Effect Jacket is a mixture of Steam utilized in
Thermo compressor and Evaporated Water Vapour from 2nd and 3rd effect.
Condensate will be taken out from plant using Condensate Outlet Pump and
send for Storage.
11. Concentrate from Evaporation will be taken out from the Plant using
Concentrate Outlet Pump and send to ATFD.
Prepared By Rightsource Industrial Solutions Pvt. Ltd. Chapter – X Page 222
EIA Report Urmila Chemopharma Pvt. Ltd.
12. Water Vapour from Last Effect will be condensed in surface type condenser
using Cooling Water as condensing media. Steam Jet Ejectors/ Water ring
Vacuum Pump will maintain vacuum in the plant back to the condenser.
10.3.3.6 PROCESS DESCRIPTION (Part - C)
1. Feed Pump will be gear/ roto type pump to handle viscous Feed. Feed will not
required to preheat as it will come at 85-90 Deg C from the tank. Feed will
enter to the Vertical ATFD first for initial evaporation. Feed will splash to the
Heat Transfer Surface of ATFD using liquid distributor.
2. V-ATFD will be a hollow cylindrical Jacketed Vessel having Agitator and
specially designed Scrapper blades to wipe out the Surface of ATFD all the
time to keep it clean. This will maintain consistent performance of ATFD for a
long time.
3. ATFD Scrapper will rotate at medium RPM using Gear Box for reduction of
RPM which will be govern by Variable Frequency Drive.
4. ATFD Heat Transfer Surface will be heated through Steam in Jacket. Vapour
outlet will be connected with Entrainment Separator to avoid product
contamination in Condensate. Vapor will be condensed in Condenser and
Negative draft will be maintained by Water Ring Vacuum Pump.
5. Product coming out from bottom of Vertical ATFD. Steam will be applied in
Jacket of same to allow the product dry.
Prepared By Rightsource Industrial Solutions Pvt. Ltd. Chapter – X Page 223
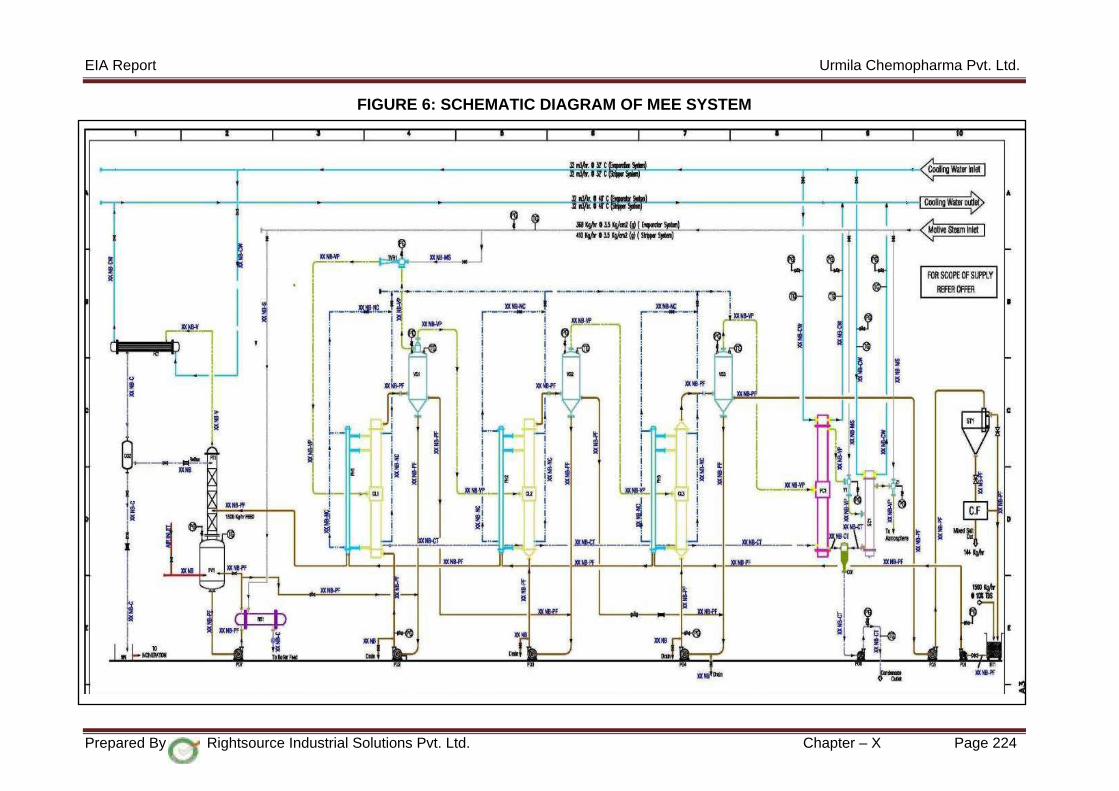
EIA Report Urmila Chemopharma Pvt. Ltd.
FIGURE 6: SCHEMATIC DIAGRAM OF MEE SYSTEM
Prepared By Rightsource Industrial Solutions Pvt. Ltd. Chapter – X Page 224

EIA Report Urmila Chemopharma Pvt. Ltd.
10.4 HAZARDOUS & SOLID WASTE MANAGEMENT
Generation of hazardous & Solid Wastes
The hazardous & solid waste generation from process, spent carbon, used oils, ETP
sludge, Evaporation Salts, ash from boiler; will be sent to TSDF/ Cement plants/
Brick manufacturers as per respective waste category.
Resource Conservation / Waste Minimization
The unit will also implement the concept of waste minimization circle including:
• Volatiles in the by-products will be condensed and reused.
• Volatile raw materials will be separated by rectification and these can be
recycled into process.
• Good House Keeping practices make the system easier and less costly.
Some of these are as follows:
Solid wastes e.g. powders, spills, etc. in process, and packaging will be
separately collected and disposed off instead of allowing these to join
effluent streams. This will reduce load and increase the efficiency of
treatment system.
• Search for future recycling schemes and evaluate their worth and
implement such schemes wherever a promise of economic feasibility
exists.
Discarded Container / Barrels/ Liners Management
• Discarded containers/ barrels/ liners will be kept at a designated place
with paved surface.
• These will be decontaminated (washed/ cleaned) and stored in the
designated area in scrap yard. Washed water sent to BTP.
• These will be sold to the actual users/ recyclers as per the Hazardous
Waste (Management, Handling and Transboundary Movement) Rules,
2016.
• The record of discarded containers/ barrels/ liners stored in scrap yard
shall be maintained and also, inventory of their selling to the registered
recyclers shall be maintained. The same shall be reviewed by the HSE
Department of the project.
Prepared By Rightsource Industrial Solutions Pvt. Ltd. Chapter – X Page 225
EIA Report Urmila Chemopharma Pvt. Ltd.
Handling of Solid Waste and Hazardous Waste
• The solid wastes and hazardous wastes will be packed in double lined
PP bags and stored in dedicated area. As and when sufficient stock is
accumulated, Organic Waste will be sent to Cement Industry for
incineration and Inorganic waste will be sent to TSDF for further
treatment and safe land fill.
• Industry will enter into an agreement with concerned Hazardous Waste
Management unit.
10.5 EB [ECOLOGY & BIODIVERSITY]
The project activity does not require tree cutting. Also, the study zone does not have
any ecologically sensitive location and hence, the plant activities are not expected to
have any impact on ecology and biodiversity.
Air emissions, liquid effluent disposal and solid waste generation are likely to have
some impact on terrestrial ecosystems. However there will be no net increase in air
pollution. Proponent will develop greenbelt around 35.8 % of its total area.
Management
• Raw material dispensing stations will be equipped with vacuum duct
hoods with top cover.
• All tanks vents being used for storage flammable chemicals will be
connected to respective condensers to avoid VOCs in the plant area.
10.6 SE [SOCIO-ECONOMIC ASPECTS]
This project will have positive impacts on Socio-Economic Environment.
Positive impacts
• Direct employment generation potential of the project will be for about 65
persons, wherein the first preference will be given to the Qualified People from
within the Study Area.
• Various modes of indirect employment i.e. providing Conveyance,
Transportation, Goods and Services will also increase.
• Overall improvement in quality of life of people of the study area will increase.
Prepared By Rightsource Industrial Solutions Pvt. Ltd. Chapter – X Page 226

EIA Report Urmila Chemopharma Pvt. Ltd.
10.7 HG [HYDROGEOLOGY, GROUND WATER & WATER CONSERVATION]
The entire Solapur District is occupied by lava flows of Deccan Basalt formation,
which constitute the main rock formation of the district. The important Water bearing
formations are Deccan Trap basalt and Alluvium.
Groundwater in Deccan Traps mostly occurs in the weathered and fractured parts
down to 10-15 m depth bgl. At places potential zones are encountered at deeper
levels in the form of fractures and inter flow zones which are generally confined
down to 60-80 mts in the district. The weathered portions of both vesicular and
massive units have better porosity and permeability. Intensity of weathering is less in
hilly regions of the district while it is higher in plain areas. The yield of dug wells
tapping phreatic aquifer ranges between 18-150 Cum/day, which have 1-12 mts
depth range. The above wells are generally drilled down to 40-60 mts tapping
weathered and fractured vesicular zones, these wells have a discharge of 120 -150
lpm. It is noticed and reported that the yields of wells drastically get reduced in
summer months beginning from March up to June end.
The width of the streams is narrow and follows the weak planes within the hard rock
formations.
Ground Water Conditions
Groundwater occurs under water table conditions in shallow aquifer and semi-
confined to confined conditions in fractured zones (Deeper Aquifers). The fractured
jointed vesicular basalt and massive basalt when overlain by red bole bed of
considerable thickness develops semi confined to confined conditions. Hence, the
red bole bed acts as a confining layer. The red bole bed being clayey in nature also
acts as a good barrier for the downward movement of water. The weathered and
jointed zone of massive basalt unit and vesicular basalt unit constitute the
unconfined aquifer, which are generally tapped by dug wells. The semi confined to
confined aquifers is tapped by dug cum bore well and bore wells. Twelve bore wells
were inventoried in the project and study area to assess the groundwater
conditions. The depth to water levels was found to be 15- 36 m during pre monsoon
while in summer it is reported between 20-40 m with yield ranges of 50 – 150 lpm.
The quality of water is found to be potable.
Prepared By Rightsource Industrial Solutions Pvt. Ltd. Chapter – X Page 227
EIA Report Urmila Chemopharma Pvt. Ltd.
The proposed area is categorized as safe by the Central Groundwater Board and
scope for development & stage of groundwater is 60%. MIDC Supplies water to the
industry. The Management already adopted roof top harvesting of monsoon by
constructing artificial recharge pit. The industry enclosure has vast open space which
itself acts as natural recharge pit. However, the artificial recharge structures are
depicted on EMP Map Plate-5 which might be taken up by the Management in
consultation with local government authorities.
Possible Impacts on Ground water & Mitigation
• The proposed project activity does not have any impact on Geology as the
project process does not involve any breaking of ground except grading of
land for infrastructure development. The project area is over Basalt.
• The generation of ash from the industry will have sedimentation affect over
the wind ward side on the soil regime as well as the study area over a period
of time affecting the Green cover/ plantation thereby affecting the growth of
plants / crops.
• The chemically loaded waste water leakage from the industry will adversely
affect the soil, surface and groundwater.
• There is no pumping of ground water on site and the entire water requirement
is met from the MIDC supply as the industry is located in notified Industrial
Park.
• The management is suggested to harvest the roof top water by constructing
water harvesting pit.
• The spillage of chemicals is to be totally avoided at the storage site for
possible contamination with the groundwater.
• Ash generation and storage will be monitored closely to avoid leakages and
will be disposed safely to the brick manufacturing industries and infrastructure
projects.
• The ash spreading in and around the plant will be avoided by storing under
closed conditions at dedicated place till it is disposed to users. The prevention
suggested is not to allow the waste water leakage from the industry by
implementing proper storage tanks for wastewater collection system.
Prepared By Rightsource Industrial Solutions Pvt. Ltd. Chapter – X Page 228
EIA Report Urmila Chemopharma Pvt. Ltd.
10.8 GEO [GEOLOGY]
The area exposes ten Basaltic Lava Flows of Diveghat Formation belonging to
Sahyadri Group of Deccan Traps (Upper Cretaceous to Lower Eocene). These lava
flows on account of differential weathering give rise to undulating relief. Alluvium is
confined to major Rivers. There are no evidences of any structural disturbances like
folding and faulting. However, Few joints were observed in the study area.
Stratigraphy of the Area:
Alluvium - Quaternary
Basalt Flows (Diveghat Formation) Sahyadri Group Upper Cretaceous to Eocene
(Ten Flows) (Deccan Traps)
Local Geology: The area is occupied by single litho unit Basalt of Deccan Traps.
10.9 SC [SOIL CONSERVATION]
The site is already isolated from the adjacent area by a compound wall. There is a
gentle gradient from west to the east. As the site located in a dry semiarid region
there are no chances of flooding or water logging. Natural drainage pattern shall be
maintained by retaining the present slope. Runoff water shall be diverted to the
greenbelt for percolation, soil and nutrient retention. The greenbelt area shall be kept
at lower level than the rest of the area in order to divert the rain water to the
greenbelt for trees and percolation. Suspended solids as well as the dissolved solids
shall be trapped in the greenbelt plots in which trees are grown. The plant litter shall
also be used as mulch and as organic fertilizer. Thus, it is proposed to integrate
greenbelt development with soil, nutrient and water conservation and rain water
harvesting. Farmyard manure and compost shall be applied liberally to enhance
porosity of the soil.
Top soil: Entire topsoil is going to be used within the project site for leveling.
Physicochemical characteristics of the soil samples obtained from 7 areas in the
study area and one from the project site reveals that all basically Clay and Silt Clay
10.10 RH [RISK & HAZARDS MANAGEMENT]
All the provisions as per the Factories act, 1948 manufacture, storage and import
of hazardous chemicals [MSIHC] Rules, 1989 and amendments thereafter and
Prepared By Rightsource Industrial Solutions Pvt. Ltd. Chapter – X Page 229
EIA Report Urmila Chemopharma Pvt. Ltd.
also, the Hazardous Waste (Management, Handling and Transboundary
Movement) Rules, 2016 will be followed.
Work environment monitoring as well as noise monitoring will be carried out on
regular interval through third party.
Following hazards may occur during the operation.
• Fire Hazards
• Chemicals handling and Storage
• Road accidents
• Process hazards
• Health hazards
Following procedures will be followed for effective management of any disaster in
the plant.
• Identification of Hazards and Risk assessment
• Identification of persons at risk
• Mitigation measures to minimize or elimination of Risk
• Disaster management plan
10.11 GREENBELT DEVELOPMENT
10.11.1 OBJECTIVE
The purpose of a green belt around the plant site is to capture the fugitive emissions
emanating from Plant operations, attenuate the noise generated and improve the
aesthetics.
Environmental protection has been considered as an important domain for industrial
and other developmental activities in India. Ministry of Environment, Forest and
Climate Change (MoEF&CC) has taken several policy initiatives and promoted
integration of environmental concerns in developmental projects. One such initiative
is the notification on Environmental Impact Assessment (EIA) of developmental
projects issued in 1994 and further revised notification in year 2006 under the
provisions of Environment (Protection) Act, 1986 EIA Guidance Manual for building,
construction, townships and area development projects proactively talks about the
importance of greenbelts in such projects.
Greenbelt in India refers to a Study area created beyond which industrial activity may
not be carried on. This concept has developed through a long line of cases and
Prepared By Rightsource Industrial Solutions Pvt. Ltd. Chapter – X Page 230
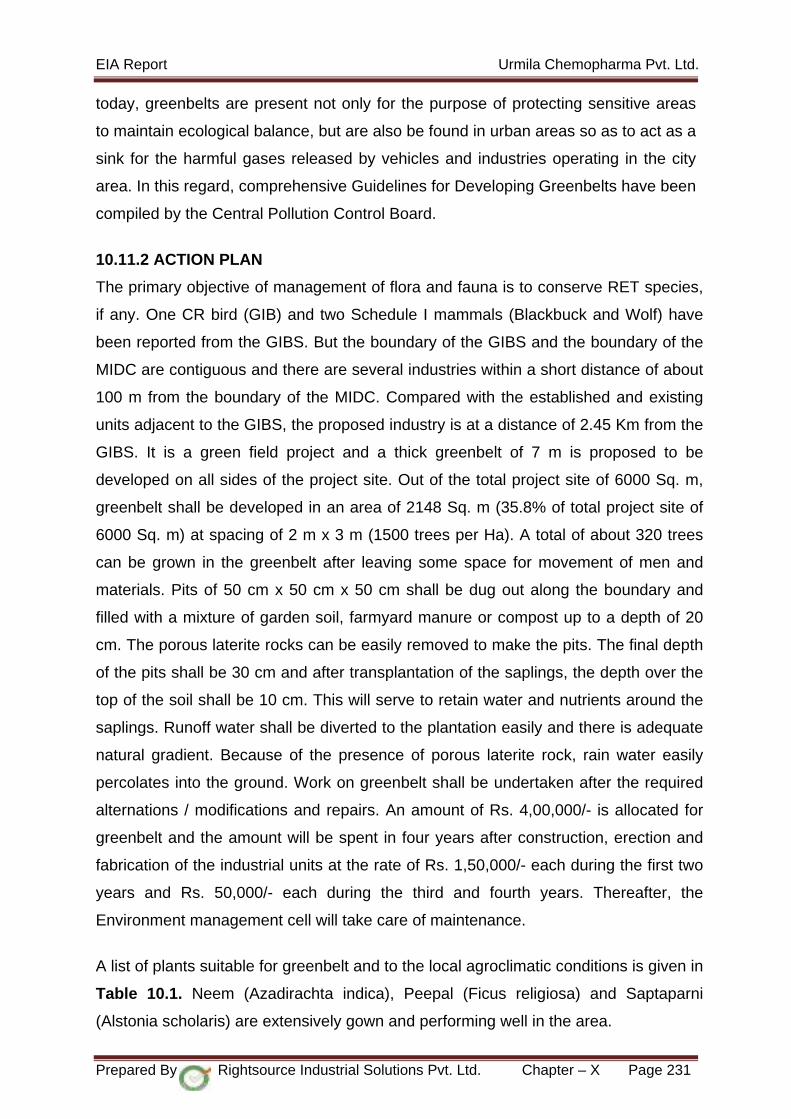
EIA Report Urmila Chemopharma Pvt. Ltd.
today, greenbelts are present not only for the purpose of protecting sensitive areas
to maintain ecological balance, but are also be found in urban areas so as to act as a
sink for the harmful gases released by vehicles and industries operating in the city
area. In this regard, comprehensive Guidelines for Developing Greenbelts have been
compiled by the Central Pollution Control Board.
10.11.2 ACTION PLAN
The primary objective of management of flora and fauna is to conserve RET species,
if any. One CR bird (GIB) and two Schedule I mammals (Blackbuck and Wolf) have
been reported from the GIBS. But the boundary of the GIBS and the boundary of the
MIDC are contiguous and there are several industries within a short distance of about
100 m from the boundary of the MIDC. Compared with the established and existing
units adjacent to the GIBS, the proposed industry is at a distance of 2.45 Km from the
GIBS. It is a green field project and a thick greenbelt of 7 m is proposed to be
developed on all sides of the project site. Out of the total project site of 6000 Sq. m,
greenbelt shall be developed in an area of 2148 Sq. m (35.8% of total project site of
6000 Sq. m) at spacing of 2 m x 3 m (1500 trees per Ha). A total of about 320 trees
can be grown in the greenbelt after leaving some space for movement of men and
materials. Pits of 50 cm x 50 cm x 50 cm shall be dug out along the boundary and
filled with a mixture of garden soil, farmyard manure or compost up to a depth of 20
cm. The porous laterite rocks can be easily removed to make the pits. The final depth
of the pits shall be 30 cm and after transplantation of the saplings, the depth over the
top of the soil shall be 10 cm. This will serve to retain water and nutrients around the
saplings. Runoff water shall be diverted to the plantation easily and there is adequate
natural gradient. Because of the presence of porous laterite rock, rain water easily
percolates into the ground. Work on greenbelt shall be undertaken after the required
alternations / modifications and repairs. An amount of Rs. 4,00,000/- is allocated for
greenbelt and the amount will be spent in four years after construction, erection and
fabrication of the industrial units at the rate of Rs. 1,50,000/- each during the first two
years and Rs. 50,000/- each during the third and fourth years. Thereafter, the
Environment management cell will take care of maintenance.
A list of plants suitable for greenbelt and to the local agroclimatic conditions is given in
Table 10.1. Neem (Azadirachta indica), Peepal (Ficus religiosa) and Saptaparni
(Alstonia scholaris) are extensively gown and performing well in the area.
Prepared By Rightsource Industrial Solutions Pvt. Ltd. Chapter – X Page 231
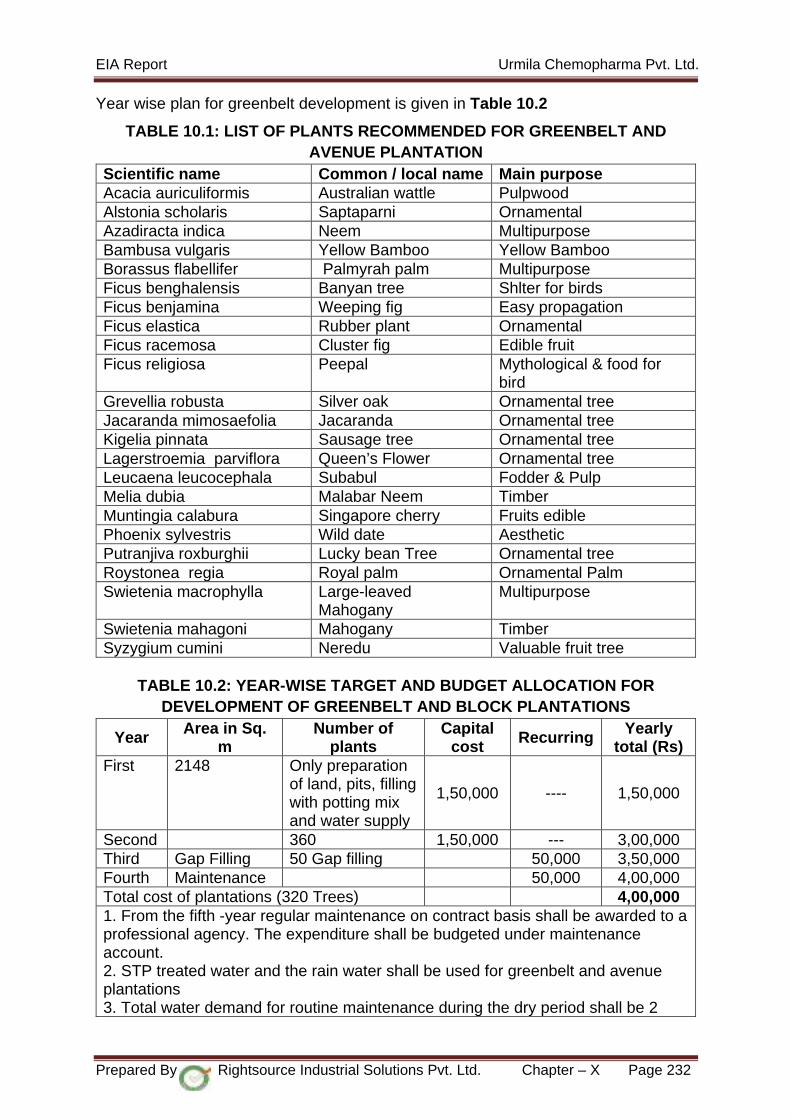
EIA Report Urmila Chemopharma Pvt. Ltd.
Year wise plan for greenbelt development is given in Table 10.2
TABLE 10.1: LIST OF PLANTS RECOMMENDED FOR GREENBELT AND AVENUE PLANTATION
Scientific name Common / local name Main purpose Acacia auriculiformis Australian wattle Pulpwood Alstonia scholaris Saptaparni Ornamental Azadiracta indica Neem Multipurpose Bambusa vulgaris Yellow Bamboo Yellow Bamboo Borassus flabellifer Palmyrah palm Multipurpose Ficus benghalensis Banyan tree Shlter for birds Ficus benjamina Weeping fig Easy propagation Ficus elastica Rubber plant Ornamental Ficus racemosa Cluster fig Edible fruit Ficus religiosa Peepal Mythological & food for
bird Grevellia robusta Silver oak Ornamental tree Jacaranda mimosaefolia Jacaranda Ornamental tree Kigelia pinnata Sausage tree Ornamental tree Lagerstroemia parviflora Queen’s Flower Ornamental tree Leucaena leucocephala Subabul Fodder & Pulp Melia dubia Malabar Neem Timber Muntingia calabura Singapore cherry Fruits edible Phoenix sylvestris Wild date Aesthetic Putranjiva roxburghii Lucky bean Tree Ornamental tree Roystonea regia Royal palm Ornamental Palm Swietenia macrophylla Large-leaved
Mahogany Multipurpose
Swietenia mahagoni Mahogany Timber Syzygium cumini Neredu Valuable fruit tree
TABLE 10.2: YEAR-WISE TARGET AND BUDGET ALLOCATION FOR DEVELOPMENT OF GREENBELT AND BLOCK PLANTATIONS
Year Area in Sq. m
Number of plants
Capital cost Recurring Yearly
total (Rs) First 2148 Only preparation
of land, pits, filling with potting mix and water supply
1,50,000 ---- 1,50,000
Second 360 1,50,000 --- 3,00,000 Third Gap Filling 50 Gap filling 50,000 3,50,000 Fourth Maintenance 50,000 4,00,000 Total cost of plantations (320 Trees) 4,00,000 1. From the fifth -year regular maintenance on contract basis shall be awarded to aprofessional agency. The expenditure shall be budgeted under maintenance account. 2. STP treated water and the rain water shall be used for greenbelt and avenueplantations 3. Total water demand for routine maintenance during the dry period shall be 2
Prepared By Rightsource Industrial Solutions Pvt. Ltd. Chapter – X Page 232
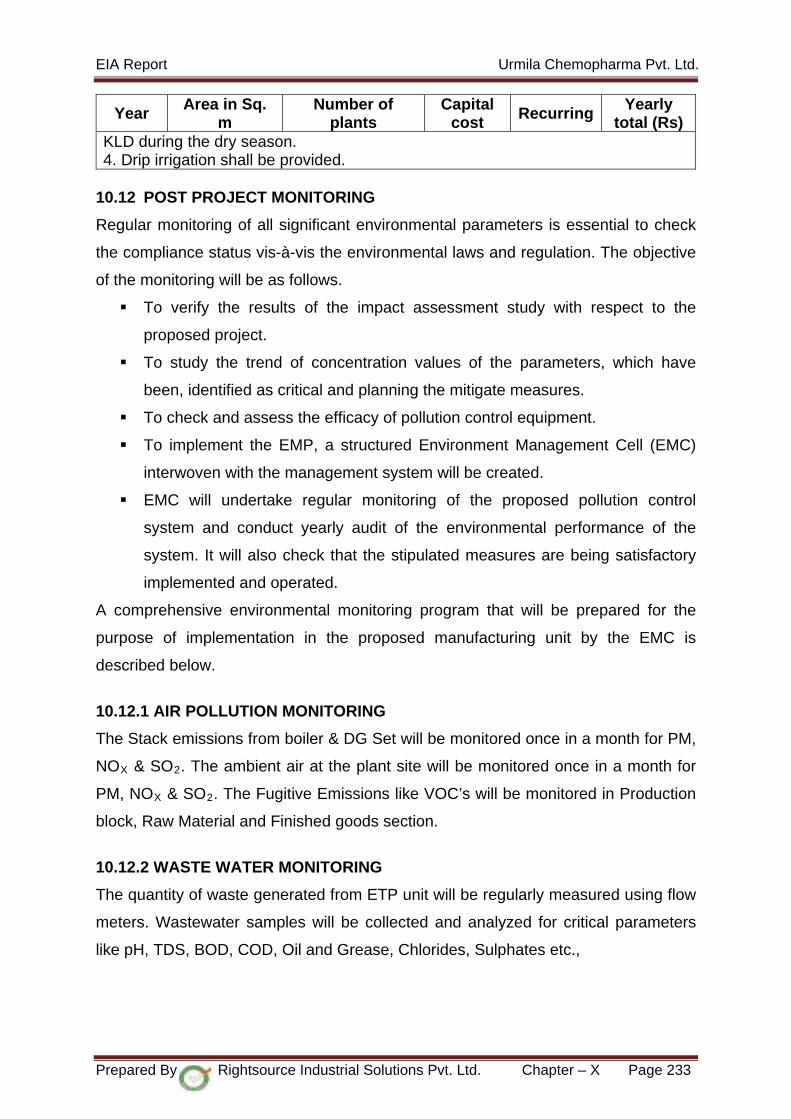
EIA Report Urmila Chemopharma Pvt. Ltd.
Year Area in Sq. m
Number of plants
Capital cost Recurring Yearly
total (Rs) KLD during the dry season. 4. Drip irrigation shall be provided.
10.12 POST PROJECT MONITORING
Regular monitoring of all significant environmental parameters is essential to check
the compliance status vis-à-vis the environmental laws and regulation. The objective
of the monitoring will be as follows.
To verify the results of the impact assessment study with respect to the
proposed project.
To study the trend of concentration values of the parameters, which have
been, identified as critical and planning the mitigate measures.
To check and assess the efficacy of pollution control equipment.
To implement the EMP, a structured Environment Management Cell (EMC)
interwoven with the management system will be created.
EMC will undertake regular monitoring of the proposed pollution control
system and conduct yearly audit of the environmental performance of the
system. It will also check that the stipulated measures are being satisfactory
implemented and operated.
A comprehensive environmental monitoring program that will be prepared for the
purpose of implementation in the proposed manufacturing unit by the EMC is
described below.
10.12.1 AIR POLLUTION MONITORING
The Stack emissions from boiler & DG Set will be monitored once in a month for PM,
NOX & SO2. The ambient air at the plant site will be monitored once in a month for
PM, NOX & SO2. The Fugitive Emissions like VOC’s will be monitored in Production
block, Raw Material and Finished goods section.
10.12.2 WASTE WATER MONITORING
The quantity of waste generated from ETP unit will be regularly measured using flow
meters. Wastewater samples will be collected and analyzed for critical parameters
like pH, TDS, BOD, COD, Oil and Grease, Chlorides, Sulphates etc.,
Prepared By Rightsource Industrial Solutions Pvt. Ltd. Chapter – X Page 233
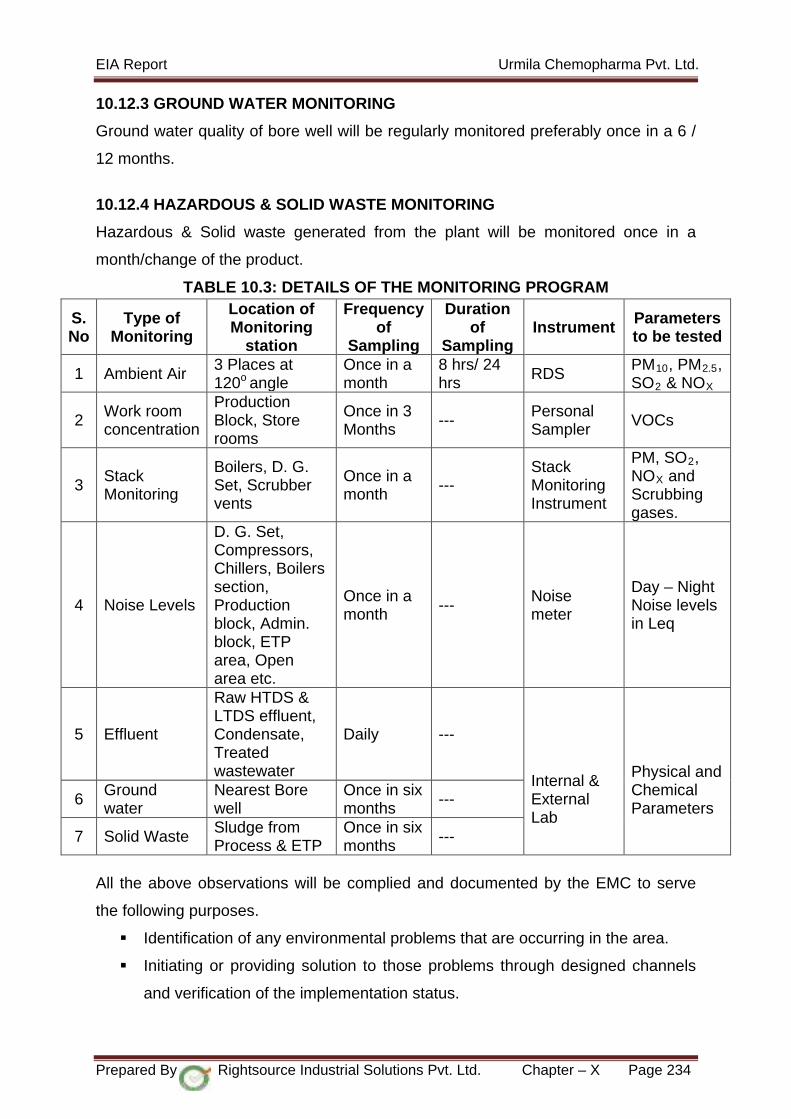
EIA Report Urmila Chemopharma Pvt. Ltd.
10.12.3 GROUND WATER MONITORING
Ground water quality of bore well will be regularly monitored preferably once in a 6 /
12 months.
10.12.4 HAZARDOUS & SOLID WASTE MONITORING
Hazardous & Solid waste generated from the plant will be monitored once in a
month/change of the product.
TABLE 10.3: DETAILS OF THE MONITORING PROGRAM
S. No
Type of Monitoring
Location of Monitoring
station
Frequency of
Sampling
Duration of
Sampling Instrument Parameters
to be tested
1 Ambient Air 3 Places at 120o angle
Once in a month
8 hrs/ 24 hrs RDS PM10, PM2.5,
SO2 & NOX
2 Work room concentration
Production Block, Store rooms
Once in 3 Months --- Personal
Sampler VOCs
3 Stack Monitoring
Boilers, D. G. Set, Scrubber vents
Once in a month ---
Stack Monitoring Instrument
PM, SO2, NOX and Scrubbing gases.
4 Noise Levels
D. G. Set, Compressors, Chillers, Boilers section, Production block, Admin. block, ETP area, Open area etc.
Once in a month --- Noise
meter
Day – Night Noise levels in Leq
5 Effluent
Raw HTDS & LTDS effluent, Condensate, Treated wastewater
Daily ---
Internal & External Lab
Physical and Chemical Parameters 6 Ground
water Nearest Bore well
Once in six months ---
7 Solid Waste Sludge from Process & ETP
Once in six months ---
All the above observations will be complied and documented by the EMC to serve
the following purposes.
Identification of any environmental problems that are occurring in the area.
Initiating or providing solution to those problems through designed channels
and verification of the implementation status.
Prepared By Rightsource Industrial Solutions Pvt. Ltd. Chapter – X Page 234
EIA Report Urmila Chemopharma Pvt. Ltd.
Controlling activities inside the plant, until the environmental problem is
corrected.
Suitably responds to emergency situations.
The industry will engage recognized laboratories to carry out all necessary
monitoring parameters. Qualified staff will be appointed for the purpose of Operation
and maintenance of the pollution control facilities. Stand-by facilities are provided to
all the facilities so as to ensure fail proof treatment.
10.13 MANAGEMENT OF PUBLIC INTERESTS
10.13.1 OBJECTIVE
To assure the neighboring communities that the promoters and management have
high consideration for the welfare of this region, the following commitments are made
by the project promoters.
10.13.2 PREFERENCE TO LOCAL POPULATION
For the recruitment of semi-skilled and unskilled workers preference will be given for
the local people.
10.13.3 HEALTH CAMPS
Health camps will be organized along with the local administration and voluntary
organizations like Red Cross, Rotary Club etc., in the surrounding villages.
10.13.4 PUBLIC AMENITIES
The management will support the local administration with funds and other forms of
assistance for the development of public amenities in this region.
10.13.5 PUBLIC RELATIONS
The management will set up a public relations office to maintain to good line of
communication between the management and the public on matters of
environmental concern.
10.14 WATER REQUIREMENT
The total water requirement for the industry is 35.43 KLD will be met through MIDC
water supply.
Prepared By Rightsource Industrial Solutions Pvt. Ltd. Chapter – X Page 235
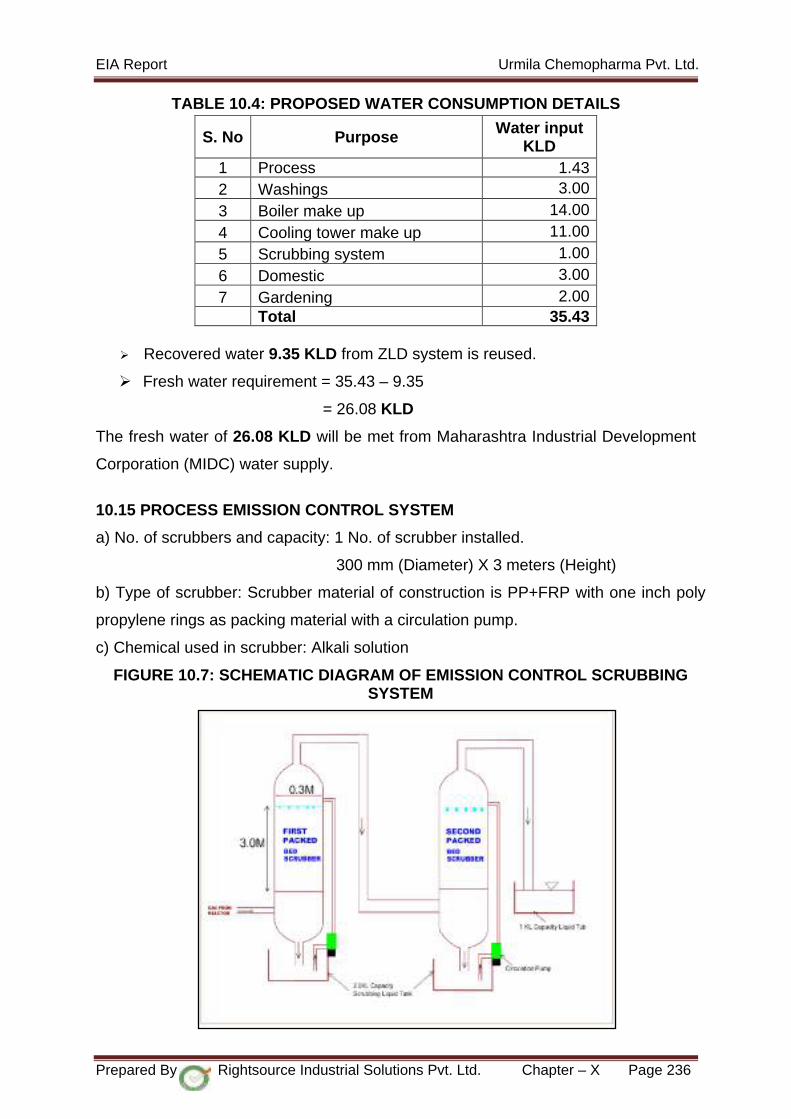
EIA Report Urmila Chemopharma Pvt. Ltd.
TABLE 10.4: PROPOSED WATER CONSUMPTION DETAILS
S. No Purpose Water input KLD
1 Process 1.43 2 Washings 3.00 3 Boiler make up 14.00 4 Cooling tower make up 11.00 5 Scrubbing system 1.00 6 Domestic 3.00 7 Gardening 2.00
Total 35.43
Recovered water 9.35 KLD from ZLD system is reused.
Fresh water requirement = 35.43 – 9.35
= 26.08 KLD
The fresh water of 26.08 KLD will be met from Maharashtra Industrial Development
Corporation (MIDC) water supply.
10.15 PROCESS EMISSION CONTROL SYSTEM
a) No. of scrubbers and capacity: 1 No. of scrubber installed.
300 mm (Diameter) X 3 meters (Height)
b) Type of scrubber: Scrubber material of construction is PP+FRP with one inch poly
propylene rings as packing material with a circulation pump.
c) Chemical used in scrubber: Alkali solution
FIGURE 10.7: SCHEMATIC DIAGRAM OF EMISSION CONTROL SCRUBBINGSYSTEM
Prepared By Rightsource Industrial Solutions Pvt. Ltd. Chapter – X Page 236

EIA Report Urmila Chemopharma Pvt. Ltd.
10.16 FUGITIVE EMISSIONS
Various types of solvents will be used in the manufacturing process. The solvents
will be stored in storage tanks with vent condensers. These are handled in closed
conditions. The industry will take measures for reduction of fugitive emissions by
providing chilled brine circulation to the condensers which, ensures the recovery of
95%. Good ventilation will be provided to reduce the workroom concentrations. The
reactor generating solvent vapors will be connected to condensers with reflux
system. Dyke walls will be provided to the solvent storage tanks. The solvent like
Toluene will be recovered up to 95% by using distillation and the remaining 5% will
be the loss.
10.17 SOLVENT MANAGEMENT PLAN
Solvent management consists of the following:
• Unloading
• Storage
• Handling / transferring
• Process / Reaction
• Recovery
i) Unloading
Solvents are received in drums / tankers
Drums
• Before unloading the drums from the truck, check the drums condition.
• Drums may be MS or HDPE Carboys
• Drums / barrels will be unloaded from the vehicles onto the unloading platform
by using the drum lifter provided for the purpose. Under no circumstances
drums shall be dropped or rolled on the ground or on any other material
• Carboys will not be dropped or allowed to strike against each other and shall
be unloaded on the pallets
• Personal protective equipments like safety goggles, hand gloves, PVC aprons
and safety shoes will be used while handling chemicals.
Road tankers
• Security will ensure that vehicle personnel shall not carry any match box /
lighters
Prepared By Rightsource Industrial Solutions Pvt. Ltd. Chapter – X Page 237
EIA Report Urmila Chemopharma Pvt. Ltd.
• The store personnel, has to check the paper work before unloading to confirm
that the correct chemical received as well as discharged into the dedicated
tank.
• Barriers and flags should be positioned to warn personnel at the unloading.
• Brakes should be set and the wheels chocked.
• The truck should be earthed.
• Tanker should be kept under inert gas flushing through vent while unloading
• Make sure that the inert gas valve remains open during the entire unloading
period of delivery is by gravity or by pumping.
• Connect the flexible hose to the tanker and to the transfer pump
• Check liquid level gauge on storage tank to ensure liquid is being transferred
• When tanker is empty, stop pump and close valves on tanker, close valves in
transfer line.
[For flammable material, stop inert gas purge]
• Disconnect flexible hose and put into proper catch container to ensure no
product is lost on to the ground.
• Remove choked warning signs, earthing and switch locks
• Read storage tank liquid level gauge and record reading
ii) Storage/ handling/ transferring
Storage Tanks
• 2 or 3 Square meter condenser [depends on solvent volatility] with cooling
water circulation is connected to each solvent storage tank to prevent solvent
vapors escaping from tank surface in to atmosphere. The condensed solvent
will go to respective tank. This results in recovery of solvent and prevention of
VOCs into the atmosphere.
• The solvent pump which is having mechanical seal will be used for
transferring the solvent to the Day Tank of the respective reactor as and when
required. The entire solvent transfer takes place in a closed system. There is
no manual handling.
The above management will results in recovery of solvent more than or equal to
95%.
Prepared By Rightsource Industrial Solutions Pvt. Ltd. Chapter – X Page 238
EIA Report Urmila Chemopharma Pvt. Ltd.
Drums
• As and when required the solvent drums in closed condition will be transferred
to the respective reactor.
• By using AODD pump the solvent will be transferred in to the reactor. Hence,
there is no loss of solvent during transfer.
iii) Reaction /Recovery
• During reaction stage the solvent vapors will be sent to a primary condenser
having cooling water circulation and later to secondary condenser having
temperature < 50 C chilled brine circulation.
• Above system will eliminate solvent losses during reaction stage and recovery
will be the maximum extent possible.
The above management will results in recovery of solvent more than or equal to 95%.
Solvents
• Solvent drums will be stored in ware house below 25 ⁰C
• As and when required the solvent drums in closed condition will be transferred
to the respective reactor. By using AODD pump the solvent will be transferred
in to the reactor. Hence, there is no loss of solvent during transfer.
• During reaction stage the solvent vapors will be sent to two primary
condensers which are arranged in parallel having cooling water circulation
followed by a secondary condenser having brine circulation at temperature of
5 ⁰C.
System will eliminate solvent losses during reaction and recovery will be the
maximum extent possible.
The above management will results in recovery of solvent more than or equal to
95%.
10.18 EMISSIONS – UTILITIES
For generation of Steam, the industry proposed to install 2.0 TPH Coal fired boiler.
The total fuel requirement is 8.0 TPD will be met from local authorized sources.
The unit is proposed to install 1 x 125 KVA DG set for usage during the power
failures.
The emission details are presented in below Table 10.5 & 10.6.
Prepared By Rightsource Industrial Solutions Pvt. Ltd. Chapter – X Page 239
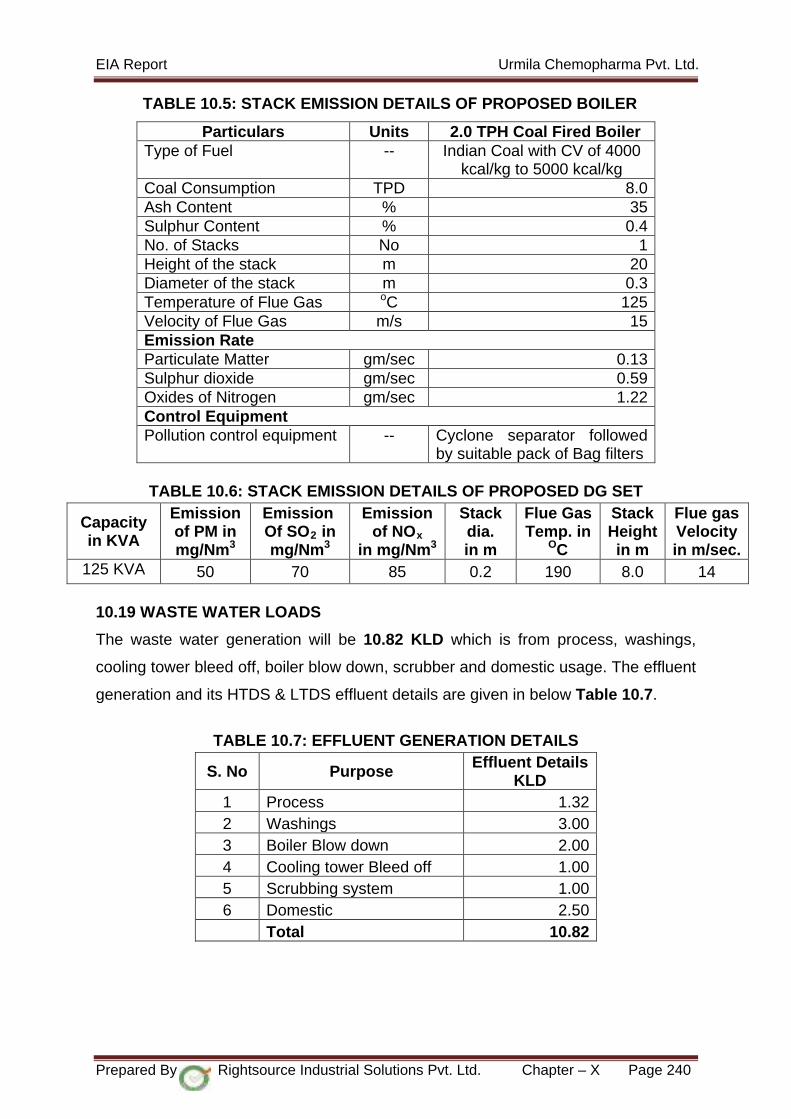
EIA Report Urmila Chemopharma Pvt. Ltd.
TABLE 10.5: STACK EMISSION DETAILS OF PROPOSED BOILER
Particulars Units 2.0 TPH Coal Fired Boiler Type of Fuel -- Indian Coal with CV of 4000
kcal/kg to 5000 kcal/kg Coal Consumption TPD 8.0 Ash Content % 35 Sulphur Content % 0.4 No. of Stacks No 1 Height of the stack m 20 Diameter of the stack m 0.3 Temperature of Flue Gas oC 125 Velocity of Flue Gas m/s 15 Emission Rate Particulate Matter gm/sec 0.13 Sulphur dioxide gm/sec 0.59 Oxides of Nitrogen gm/sec 1.22 Control Equipment Pollution control equipment -- Cyclone separator followed
by suitable pack of Bag filters
TABLE 10.6: STACK EMISSION DETAILS OF PROPOSED DG SET
Capacity in KVA
Emission of PM in mg/Nm3
Emission Of SO2 in mg/Nm3
Emission of NOx
in mg/Nm3
Stack dia. in m
Flue Gas Temp. in
OC
Stack Height in m
Flue gas Velocity in m/sec.
125 KVA 50 70 85 0.2 190 8.0 14
10.19 WASTE WATER LOADS
The waste water generation will be 10.82 KLD which is from process, washings,
cooling tower bleed off, boiler blow down, scrubber and domestic usage. The effluent
generation and its HTDS & LTDS effluent details are given in below Table 10.7.
TABLE 10.7: EFFLUENT GENERATION DETAILS
S. No Purpose Effluent Details KLD
1 Process 1.32 2 Washings 3.00 3 Boiler Blow down 2.00 4 Cooling tower Bleed off 1.00 5 Scrubbing system 1.00 6 Domestic 2.50
Total 10.82
Prepared By Rightsource Industrial Solutions Pvt. Ltd. Chapter – X Page 240
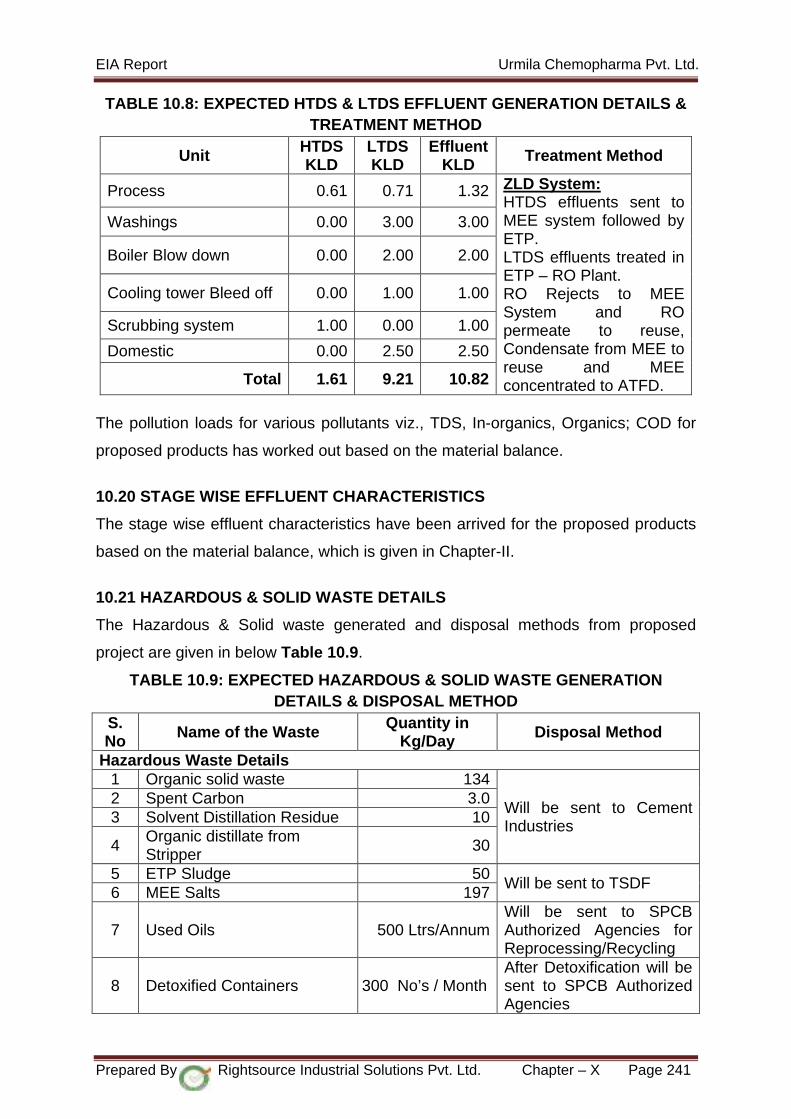
EIA Report Urmila Chemopharma Pvt. Ltd.
TABLE 10.8: EXPECTED HTDS & LTDS EFFLUENT GENERATION DETAILS & TREATMENT METHOD
Unit HTDS KLD
LTDS KLD
Effluent KLD Treatment Method
Process 0.61 0.71 1.32 ZLD System: HTDS effluents sent to MEE system followed by ETP. LTDS effluents treated in ETP – RO Plant. RO Rejects to MEE System and RO permeate to reuse, Condensate from MEE to reuse and MEE concentrated to ATFD.
Washings 0.00 3.00 3.00
Boiler Blow down 0.00 2.00 2.00
Cooling tower Bleed off 0.00 1.00 1.00
Scrubbing system 1.00 0.00 1.00
Domestic 0.00 2.50 2.50
Total 1.61 9.21 10.82
The pollution loads for various pollutants viz., TDS, In-organics, Organics; COD for
proposed products has worked out based on the material balance.
10.20 STAGE WISE EFFLUENT CHARACTERISTICS
The stage wise effluent characteristics have been arrived for the proposed products
based on the material balance, which is given in Chapter-II.
10.21 HAZARDOUS & SOLID WASTE DETAILS
The Hazardous & Solid waste generated and disposal methods from proposed
project are given in below Table 10.9.
TABLE 10.9: EXPECTED HAZARDOUS & SOLID WASTE GENERATION DETAILS & DISPOSAL METHOD
S. No Name of the Waste Quantity in
Kg/Day Disposal Method
Hazardous Waste Details 1 Organic solid waste 134
Will be sent to Cement Industries
2 Spent Carbon 3.0 3 Solvent Distillation Residue 10
4 Organic distillate from Stripper 30
5 ETP Sludge 50 Will be sent to TSDF
6 MEE Salts 197
7 Used Oils 500 Ltrs/Annum Will be sent to SPCB Authorized Agencies for Reprocessing/Recycling
8 Detoxified Containers 300 No’s / Month After Detoxification will be sent to SPCB Authorized Agencies
Prepared By Rightsource Industrial Solutions Pvt. Ltd. Chapter – X Page 241

EIA Report Urmila Chemopharma Pvt. Ltd.
S. No Name of the Waste Quantity in
Kg/Day Disposal Method
9 Used Lead Acid Batteries 2 No’s/ Annum Send back to suppliers for buyback of New Batteries
Solid Waste details
10 Ash from boiler 2800 Will be sent to Brick Manufacturers
Hazardous & Solid waste will be segregated. Detoxified containers, HDPE Drums/
Bags will be stored in the covered and raised platform with Leachate collection
system and disposed to authorized parties. Non- incinerable solid waste will be
disposed to TSDF for secured landfill.
The Hazardous & solid waste will be disposed off through 7-copy manifest system
within 90 days from the generation. All records will be maintained properly.
10.22 PROPOSED ROOF WATER HARVESTING
To augment the declining ground water levels and water harvesting is the need of
the hour.
Rainwater harvesting is a mechanism involved in collecting, storing and using. A
rainwater harvesting system comprises various stages – flow of rainwater through
pipes or drains, filtration and storage in tanks for reuse or recharge. There are five
components in rainwater harvesting namely catchment, conveyance, filtration,
storage and recharge.
Roof top area is considered for harvesting rainwater for this project and other areas
are excluded due to possibility of chemical contamination. Roof top rainwater
harvesting is one of the appropriate options for augmenting ground water recharge/
storage in urban areas where natural recharge is considerably reduced due to
increased urban activities and not much land is available for implementing any other
artificial recharge measure. Roof top rainwater harvesting can supplement domestic
requirements in rural areas as well.
Design of Roof Water Harvesting Structure
Quantity of Rain water collection and recharging depends upon
Average rainfall
Catchment area
Prepared By Rightsource Industrial Solutions Pvt. Ltd. Chapter – X Page 242

EIA Report Urmila Chemopharma Pvt. Ltd.
Run-off coefficient
Infiltration rate
Evapo Transpiration
Porosity
Permeability
Generally used Rain water harvesting structures are like Recharge Pits, Invert Well,
Surface storage pond (where areas are large and Optimum rainfall), Check Dams,
Nalla Bunds.
The rain water from the Roof top will be collected through PVC pipes and transferred
to the proposed roof water harvesting pits through steps of eliminating suspended
particles, oil & grease through finally to the ground.
Since the area of harvesting is small the above parameters are not studied in detail
and only applicability as to conserve and harvest the available quantum is
considered and suitable structure suggested Based on IMD Climatological Normal,
Solapur 1981-2010.
Normal Annual Rainfall = 742.5 mm (0.7425 m)
TABLE 10.10: AVAILABLE RAINWATER (ANNUAL) FOR HARVESTING
Description Area (m2) Rainfall
(m/Annum) Runoff
coefficient Total Rainwater
(m3/Annum) Roof Area 768.32 0.7425 0.8 456.4
Total available rainwater (in m3/annum) 456 Details of Roof water harvesting pits:
Size of pits 8m x 4m x 3m
Size of Bore 350 mm dia.
Size of pipe 150 mm dia.
Prepared By Rightsource Industrial Solutions Pvt. Ltd. Chapter – X Page 243
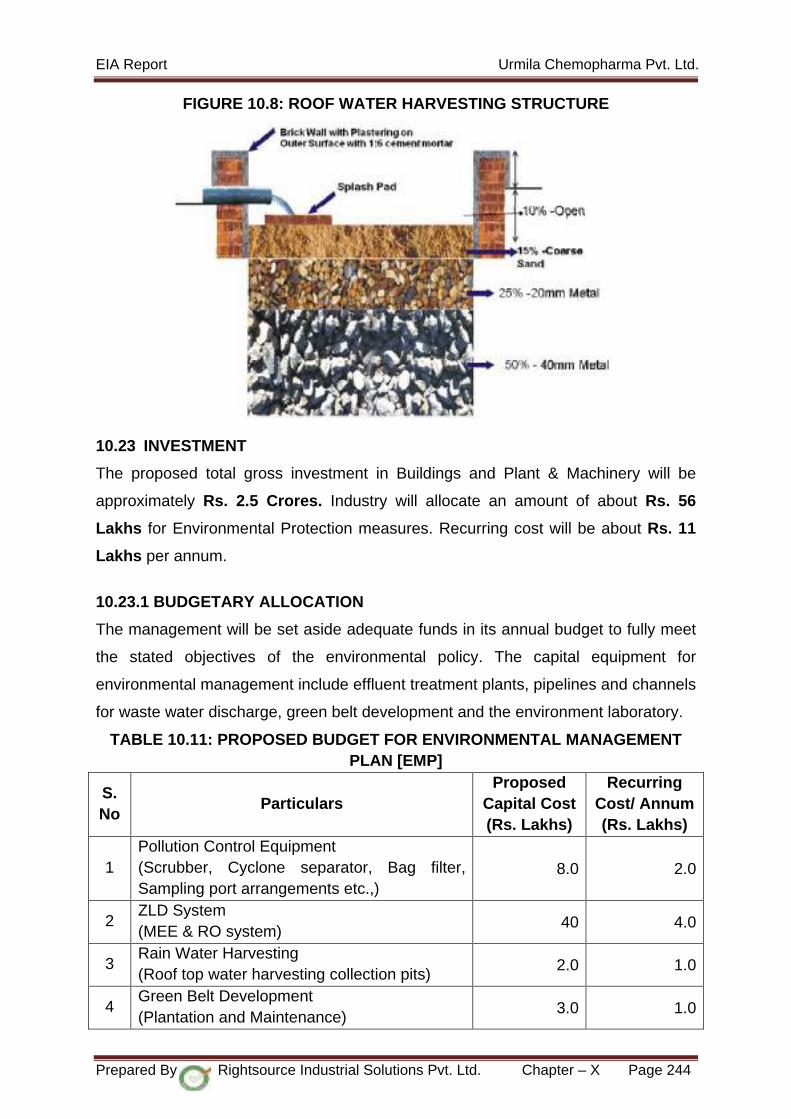
EIA Report Urmila Chemopharma Pvt. Ltd.
FIGURE 10.8: ROOF WATER HARVESTING STRUCTURE
10.23 INVESTMENT
The proposed total gross investment in Buildings and Plant & Machinery will be
approximately Rs. 2.5 Crores. Industry will allocate an amount of about Rs. 56
Lakhs for Environmental Protection measures. Recurring cost will be about Rs. 11
Lakhs per annum.
10.23.1 BUDGETARY ALLOCATION
The management will be set aside adequate funds in its annual budget to fully meet
the stated objectives of the environmental policy. The capital equipment for
environmental management include effluent treatment plants, pipelines and channels
for waste water discharge, green belt development and the environment laboratory.
TABLE 10.11: PROPOSED BUDGET FOR ENVIRONMENTAL MANAGEMENT PLAN [EMP]
S. No
Particulars Proposed
Capital Cost (Rs. Lakhs)
Recurring Cost/ Annum (Rs. Lakhs)
1 Pollution Control Equipment (Scrubber, Cyclone separator, Bag filter, Sampling port arrangements etc.,)
8.0 2.0
2 ZLD System (MEE & RO system)
40 4.0
3 Rain Water Harvesting (Roof top water harvesting collection pits)
2.0 1.0
4 Green Belt Development (Plantation and Maintenance)
3.0 1.0
Prepared By Rightsource Industrial Solutions Pvt. Ltd. Chapter – X Page 244
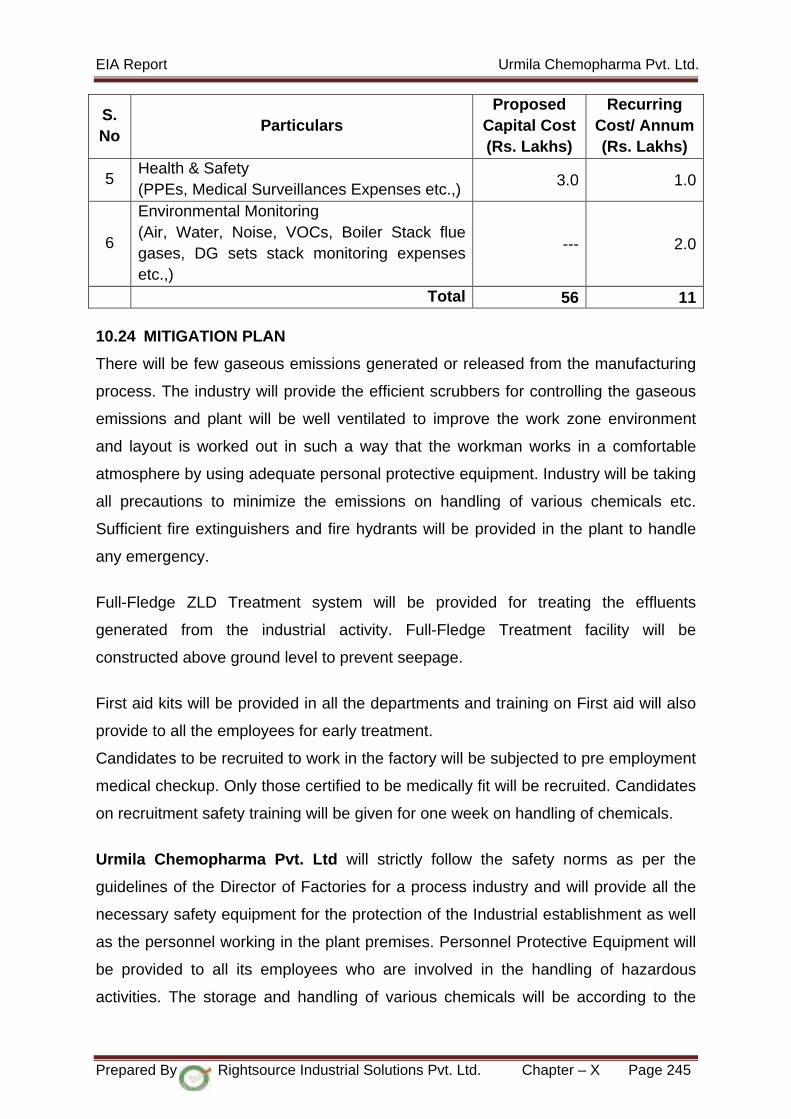
EIA Report Urmila Chemopharma Pvt. Ltd.
S. No
Particulars Proposed
Capital Cost (Rs. Lakhs)
Recurring Cost/ Annum (Rs. Lakhs)
5 Health & Safety (PPEs, Medical Surveillances Expenses etc.,)
3.0 1.0
6
Environmental Monitoring (Air, Water, Noise, VOCs, Boiler Stack flue gases, DG sets stack monitoring expenses etc.,)
--- 2.0
Total 56 11 10.24 MITIGATION PLAN
There will be few gaseous emissions generated or released from the manufacturing
process. The industry will provide the efficient scrubbers for controlling the gaseous
emissions and plant will be well ventilated to improve the work zone environment
and layout is worked out in such a way that the workman works in a comfortable
atmosphere by using adequate personal protective equipment. Industry will be taking
all precautions to minimize the emissions on handling of various chemicals etc.
Sufficient fire extinguishers and fire hydrants will be provided in the plant to handle
any emergency.
Full-Fledge ZLD Treatment system will be provided for treating the effluents
generated from the industrial activity. Full-Fledge Treatment facility will be
constructed above ground level to prevent seepage.
First aid kits will be provided in all the departments and training on First aid will also
provide to all the employees for early treatment.
Candidates to be recruited to work in the factory will be subjected to pre employment
medical checkup. Only those certified to be medically fit will be recruited. Candidates
on recruitment safety training will be given for one week on handling of chemicals.
Urmila Chemopharma Pvt. Ltd will strictly follow the safety norms as per the
guidelines of the Director of Factories for a process industry and will provide all the
necessary safety equipment for the protection of the Industrial establishment as well
as the personnel working in the plant premises. Personnel Protective Equipment will
be provided to all its employees who are involved in the handling of hazardous
activities. The storage and handling of various chemicals will be according to the
Prepared By Rightsource Industrial Solutions Pvt. Ltd. Chapter – X Page 245

EIA Report Urmila Chemopharma Pvt. Ltd.
norms of MSDS and the Inspector of Factories. Personnel involved in the production
will be provided with protective clothing, helmets, goggles, masks, gloves, etc.
These handling operations will be carried out under the strict supervision of the
trained and highly skilled personnel. Supervision will be provided to ensure the
usage of these PPE’s. Necessary fire fighting facilities like extinguishers, sand
buckets, etc. will be provided to meet the on-site emergencies. A detailed On-site
Emergency plan will be prepared and implemented comply the provisions of
Factories Act. An agreement with a nearest hospital for treating the employees due
to unforeseen emergencies will be entered into.
10.25 SOCIO-ECONOMIC DEVELOPMENT ACTIVITIES
Socio-Economic Development activities will be implementing in coordination with the
NGOs, Village Panchayats and other Governmental Entities.
A. SOCIAL ACTIVITIES:
• Health check up camps and Medical facilities to Infants and senior citizens,
free medicine supply etc., will be provide on regular basis.
• Help Implement and Run a Safe Drinking Water in Chincholi village where the
project site is located to facilitate Healthy Water for both Drinking & Cooking
Purposes.
• Contribution towards any development activity useful for village development.
B. ECONOMIC ACTIVITIES:
• The company will give preference to the local people for employment.
• The company will be giving contract works like civil, machine repair,
transportation, canteen, etc. to the local people / parties.
• The proposed project will create jobs for at least 65 persons.
10.26 WASTE MINIMIZATION / RESOURCE CONSERVATION 5 R Concept
(Recycle / Refuse / Reduce / Reuse / Reform)
In our company, the 5R, representing five environment-conscious words starting with
the letter R, has been adopted as a keyword for environmental activities. The five
environment-conscious words include the three R words of the 3R, the keyword for
establishing a recycling-oriented society, and two additional words that are "Refuse"
and "Reform".
Prepared By Rightsource Industrial Solutions Pvt. Ltd. Chapter – X Page 246
EIA Report Urmila Chemopharma Pvt. Ltd.
Refuse: Avoid purchase of environmentally burdensome materials whenever possible Reduce: Reduce waste material Reuse: Reuse waste material without processing Reform: Reuse materials in a different form Recycle: Reuse materials as resources We will achieve the above concept; all efforts will be made by the industry to carryout
R&D on the isolated by-products / wastes
FIGURE 10.9: 5 R CONCEPTS
The units shall also implement the waste minimization circle including:
• Good House Keeping: Proper housekeeping practices make the system
easier and less costly.
• Roof water harvesting system shall be adopted to reduce the fresh water
requirement.
• Cleaner production technology may be adopted for the resource conservation
and pollution control.
10.27 CONCLUSION
The industrialization plays an important role in their development process. The
countries with rapidly growing industrial sector were able to manage the
development problems particularly employment, poverty and inequality. The
Industrial development as legitimate objective to solve economic and social
problems, therefore project Management have appropriately decided to setup a
manufacturing unit. The infrastructure like roads, water and regular supply of power
are available at the project site. Availability of adequate skilled, semi-skilled man
power at reasonable salaries and wages, local amenities at reasonable cost, has
Prepared By Rightsource Industrial Solutions Pvt. Ltd. Chapter – X Page 247
EIA Report Urmila Chemopharma Pvt. Ltd.
encouraged the technocrat. Importantly, the helping hand extended to the most
experienced and reputed person in the bulk drugs manufacturing industrial belt, by
the state Government in meeting the needs of the aspirant.
The likely adverse effects due to the operations of the unit are marginal. More over
the residential area is far away. However, the effective implementation of the
recommended Environment Management Plan and Monitoring Program, by which all
the negative effects on the environment, will be minimized.
Prepared By Rightsource Industrial Solutions Pvt. Ltd. Chapter – X Page 248
SUMMARY & CONCLUSION [SUMMARY OF EIA REPORT]
CHAPTER -XI
EIA Report Urmila Chemopharma Pvt. Ltd.
CHAPTER – XI
PROJECT SUMMARY & CONCLUSIONS
Urmila Chemopharma Pvt. Ltd. is proposed Bulk Drug Intermediates manufacturing
unit with the manufacturing capacity of 10 TPM respectively.
11.1 SALIENT FEATURES OF THE PROJECT
S. No
Contents Details
1 Name of the Project:
Urmila Chemopharma Pvt. Ltd. Plot No.: F-24, MIDC, Chincholi Industrial Area, Chincholi Village, Mohal Taluk, Solapur District, Maharashtra state.
2 Details of Applicant
Mr. Lolabhattu Chinna Butchiraju (Managing Director) Office Address: Flat No. 46, Hiramoti Tower, 04th Floor, Vidigharkul, Near Hyderabad market yard, Sonia Nagar, Solapur District – 413 005, Maharashtra State
3 Status
Urmila Chemopharma Pvt. Ltd. is proposed Bulk Drug Intermediates manufacturing unit at Plot No.: F-24, MIDC, Chincholi Industrial Area, Chincholi Village, Mohal Taluk, Solapur District, Maharashtra state.
4 Type of Land & Status Industrial Land Proposed Land: 1.48 Acres (6000 Sq. m)
5 Capital Investment of the Project, Rs. in Crores
2.5 Crores
6 Capital cost for EMP, Rs. in Lakhs
56 Lakhs
7 Recurring cost/ Annum for EMP, Rs. in Lakhs
11 Lakhs
8 Employment opportunity 65 persons
9 Green belt Development It is envisaged to develop greenbelt on all sides of the industry in an area of about 0.53 Acres (2148.2 Sq. m).
10 Pollution control measures adopted
Flue gas emission control Adequate stack of height of 20 mts are provided for wider dispersion of pollutants.
Prepared By Rightsource Industrial Solutions Pvt. Ltd. Chapter -XI Page 249

EIA Report Urmila Chemopharma Pvt. Ltd.
S. No
Contents Details
For PM control, provided cyclone separator followed by bag filter
Process gas emission control
Two stage scrubbers installed for process gas emissions
Fugitive emission control Vent condensers to the storage tanks and reactors. Solvents and chemicals are handling in closed system
Hazardous waste management
All the hazardous waste will be collected, stored, handled, transported and disposed to TSDF as per the Hazardous Waste (Management, Handling and Transboundary Movement) Rules, 2016, amended time to time etc are major Act/rules/notification applicable to industry.
11 Expenditure for CSR activities
Rs. 5.0 Lakhs
12 Expenditure for CER activities
Rs. 5.0 Lakhs
11.2 CONCLUSIONS
It can be concluded on a positive note that due to the adequate provision and efficient
operation of Environmental Management Systems and after the implementation of the
proposed mitigation measures and environmental management plans, the project
activities during the construction and operation phase would have manageable & largely
have reversible impacts on the environment, and on balance the project would be
beneficial to surrounding communities and the region.
Prepared By Rightsource Industrial Solutions Pvt. Ltd. Chapter -XI Page 250

ENCLOSURES

LAND DOCUMENT
ENCLOSURE - I
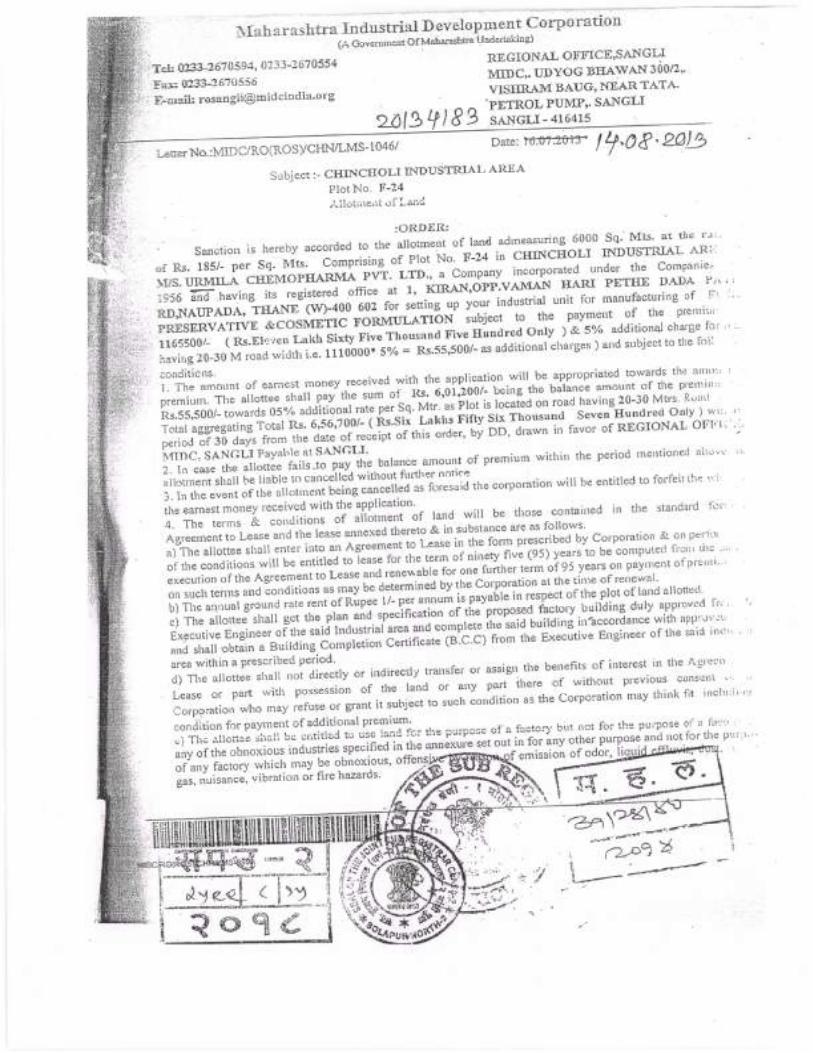


INDUSTRIAL GO
ENCLOSURE - II
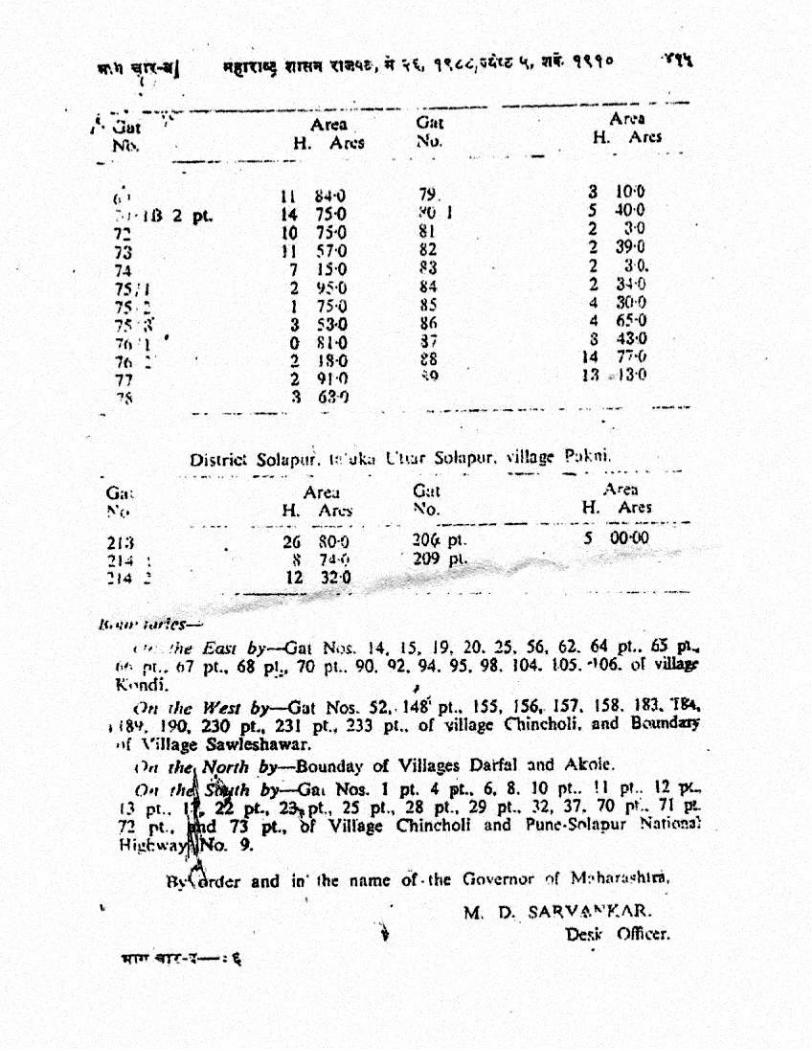
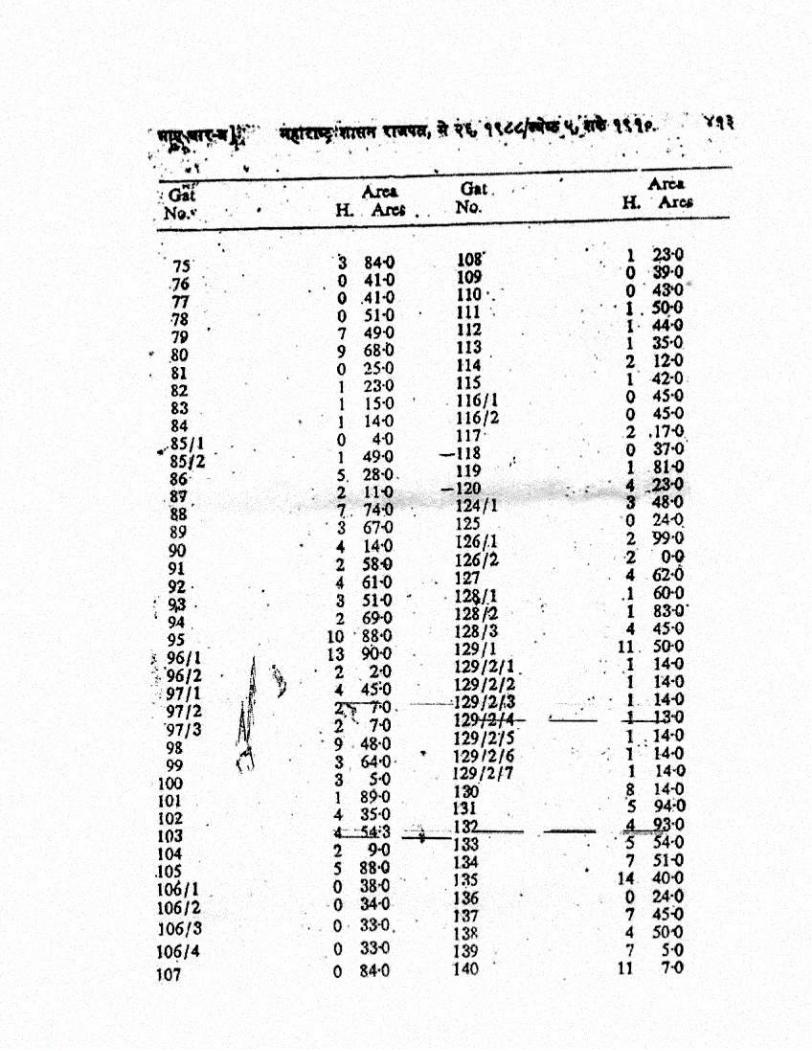

GIB DISTANCE LETTER
ENCLOSURE - III


WILDLIFE REPORT SUBMITTED TO STANDING
COMMITTEE OF NBWL/ SBWL
ENCLOSURE - IV
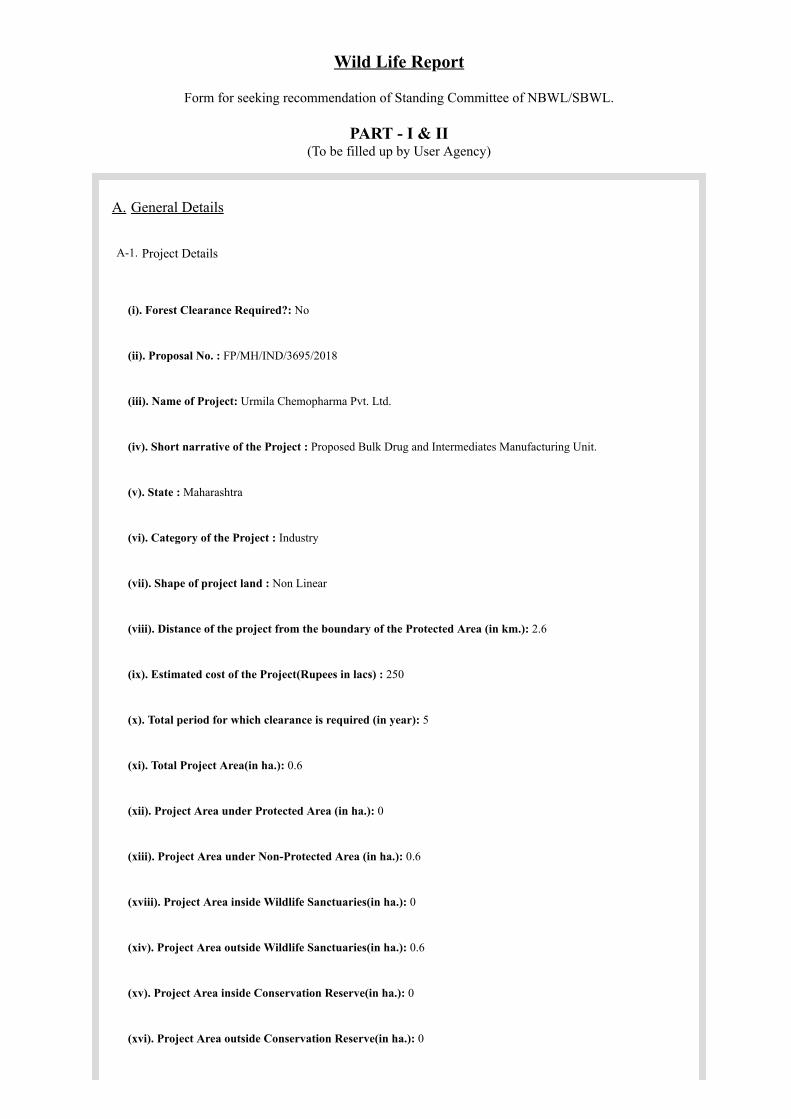
General DetailsA.
Project DetailsA-1.
(i). Forest Clearance Required?: No
(ii). Proposal No. : FP/MH/IND/3695/2018
(iii). Name of Project: Urmila Chemopharma Pvt. Ltd.
(iv). Short narrative of the Project : Proposed Bulk Drug and Intermediates Manufacturing Unit.
(v). State : Maharashtra
(vi). Category of the Project : Industry
(vii). Shape of project land : Non Linear
(viii). Distance of the project from the boundary of the Protected Area (in km.): 2.6
(ix). Estimated cost of the Project(Rupees in lacs) : 250
(x). Total period for which clearance is required (in year): 5
(xi). Total Project Area(in ha.): 0.6
(xii). Project Area under Protected Area (in ha.): 0
(xiii). Project Area under Non-Protected Area (in ha.): 0.6
(xviii). Project Area inside Wildlife Sanctuaries(in ha.): 0
(xiv). Project Area outside Wildlife Sanctuaries(in ha.): 0.6
(xv). Project Area inside Conservation Reserve(in ha.): 0
(xvi). Project Area outside Conservation Reserve(in ha.): 0
Wild Life Report
Form for seeking recommendation of Standing Committee of NBWL/SBWL.
PART - I & II(To be filled up by User Agency)

(xvii). Project Area inside National Park(in ha.): 0
(xviii). Project Area outside National Park(in ha.): 0
(xix). Project Area inside Ecologically Sensitive Zone(in ha.): 0
(xx). Project Area outside Ecologically Sensitive Zone(in ha.): 0
Details of User AgencyA-2.
(i). Name : URMILA CHEMOPHARMA PRIVATE LIMITED
(ii). Address1 : Plot No.: F-24, MIDC Chincholi Industrial area, Chincholi village, Mohal Taluk
(iii). Address2 : Solapur District, Maharashtra state
(iv). State : Maharashtra
(v). District : Solapur
(vi). Pin : 413255
(vii). Landmark : MIDC Chincholi
(viii). Email address : [email protected]
(ix). Landline Telephone No. : 447101
(x). Fax No. : NIL
(xi). Mobile No. : 9885560011
(xii). Website (if any) : NIL
(xiii). Legal status of User Agency : Private
Details of Person Making ApplicationA-3.
(i). First Name: Chinnabutchiraju
(ii). Middle Name: NIL
(iii). Last Name: Shriramarajulolabhattu
(iv). Gender: Male
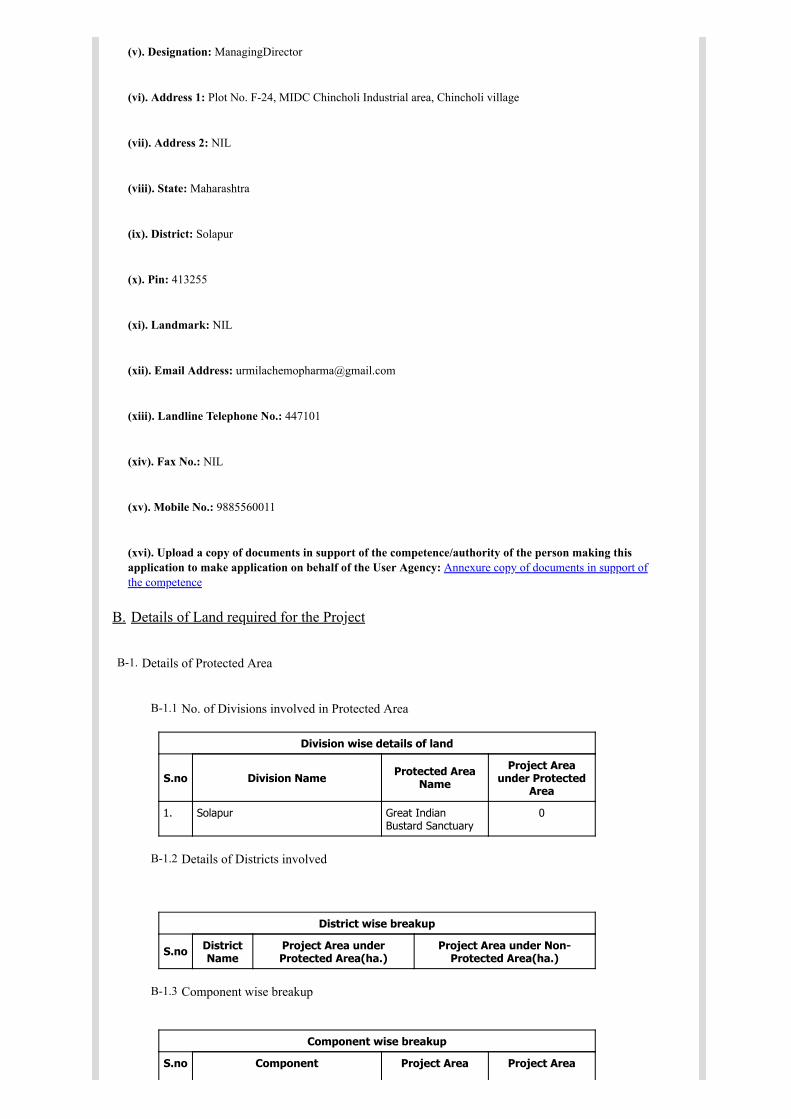
(v). Designation: ManagingDirector
(vi). Address 1: Plot No. F-24, MIDC Chincholi Industrial area, Chincholi village
(vii). Address 2: NIL
(viii). State: Maharashtra
(ix). District: Solapur
(x). Pin: 413255
(xi). Landmark: NIL
(xii). Email Address: [email protected]
(xiii). Landline Telephone No.: 447101
(xiv). Fax No.: NIL
(xv). Mobile No.: 9885560011
(xvi). Upload a copy of documents in support of the competence/authority of the person making thisapplication to make application on behalf of the User Agency: Annexure copy of documents in support ofthe competence
Details of Land required for the ProjectB.
Details of Protected AreaB-1.
No. of Divisions involved in Protected AreaB-1.1
Division wise details of land
S.no Division Name Protected AreaName
Project Areaunder Protected
Area
1. Solapur Great IndianBustard Sanctuary
0
Details of Districts involvedB-1.2
District wise breakup
S.no DistrictName
Project Area underProtected Area(ha.)
Project Area under Non-Protected Area(ha.)
Component wise breakupB-1.3
Component wise breakup
S.no Component Project Area Project Area

under ProtectedArea(ha.)
under Non-ProtectedArea(ha.)
1 Plot No. F-24 0 0.6
Maps of protected areaC.
Division 1. : Solapur
(i). Project Area under Protected Area (in ha.) : NIL
(ii). Nature of the Project : Non Linear
(a). No. of patches : NIL
Patch wise details
Patch No. Area of Patch(in ha.) Kml File of Patches
(iv). copy of Survey of India Toposheet indicating boundary of protected area:Annexure Survey of India Toposheet
(v). scanned copy of the Geo-referenced map of the protected area prepared byusing DGPS or Total Station: Annexure scanned copy of the Geo-referenced map
Justification for locating the Project in protected area and details of alternatesexamined :D.
(i). copy of note containing justification for locating the Project in protected area: Annexure Justification
Employment likely to be generatedE.
(i). Whether project is likely to generate employment ?: Yes
(a). Permanent/Regular Employment(Number of persons): 60
(b). Temporary Employment(Number of person-days): 20
Displacement of People due to the project, if anyF.
(i). Whether project involve displacement?: No
Status of Environmental clearanceG.
(i). Whether the Project requires Clearance under the Environment (Protection) Act 1986 ? : Yes
(a). Status of the Environmental Clearance to the Project : EC under process
(ii).Environmental Clearance File No.: IA/MH/IND2/83027/2018
Whether proposal is for investigation/surveyH.

Details of the Bio diversity Impact Assessment report in case the proposal involves use of morethan 50 ha. NP/WLS.
(H-2).
(a).Copy of the Bio diversity Impact Assessment report: Annexure Copy of Bio diversity ImpactAssessment report
Information on the projects undertaken by the proponent agency in the past in Protected Areas(H-3).
(a).Upload file: Annexure Information on the projects undertaken by the proponent agency in the past inProtected Areas
Details regarding compliance of the conditions on each proposal(H-4).
(a).Upload file: Annexure Details regarding compliance of the conditions on each proposal
(H-5).Whether any matter related to the project is sub judice in any court of law?: No
Documents
S.No Uploaded Additional Info. Files Remarks
1 Additional Info. Part I and II
2 Additional Info. Plot Allotment
3 Additional Info. Project Note
4 Additional Info. Mudra Shulk
5 Additional Info. Environmental ClearanceForm I
6 Additional Info. Google Image
7 Additional Info. Plot Layout, Products,Raw Materials &
Manufacturing Process
8 Additional Info. MIDC Layout
Print page
NABET ACCREDITATION CERTIFICATE
ENCLOSURE - V
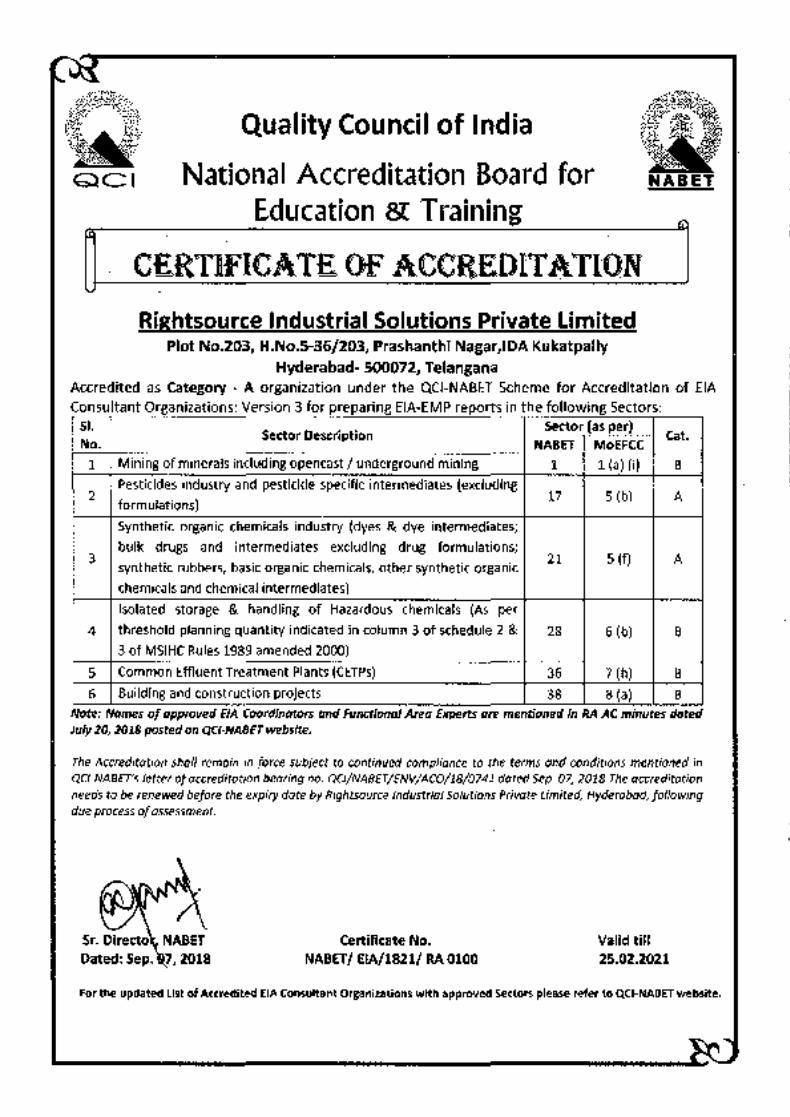
Quality Council of India
QCI National Accreditation Board for Education & Training
· .. · ... . . ....... ·.·.. .
. <Gt!llTIFIC.AIE OF A<GCREDITATIQN ... Rightsource Industrial Solutions Private limited
Plot No.203, H.No.S-36/203, Prashanthi Nagar, IDA Kukatpally Hyderabad- 500072, Telangana
Accredited as Category c A organization under the QCI-NABET Scheme for Accreditation of EIA
Consultant Organizations· Version 3 for preparing EIA-EMP reports in the following Sectors· 51.
Sector Description Sector (as per)
Cat. No. NABET MoE FCC
1 Mining of minerals including opencast I underground mining 1 1 (a) (i) B
2 Pesticides industry and pesticide specific intermediates (excluding
17 5 (b) A formulations)
Synthetic organic chemicals industry (dyes & dye intermediates;
bulk drugs and intermediates excluding drug formulations; 3
synthetic rubbers; basic organic chemicals, other synthetic organic 21 5 (f) A
chemicals and chemical intermediates)
Isolated storage & handling of Hazardous chemicals. (As per
4 threshold planning quantity indicated in column 3 of schedule 2 & 28 6 (b) B 3 of MSIHC Rules 1989 amended 2000)
5 Common Effluent Treatment Plants (CETPs) 36 7 (h) B
6 Building and construction projects 38 8 (a) B Note: Names of approved EIA Coordmators and Functional Area Experts are mf!ntlonf!d m RA AC mmutf!s dated July 20, 2018 posted on QCI-NABET website.
The Accreditation shall remain in force subject to continued compliance to the terms and conditions mentioned in QCI-NABET's letter of accreditation bearing no. QCI/NABET/ENV/AC0/18/0741 dated Sep. 07, 2018. The accreditation needs to be renewed before the expiry date by Rightsource Industrial Solutions Private Limited, Hyderabad, following due process of assessment.
Certificate No. NABET/ EIA/1821/ RA 0100
Valid till 25.02.2021
For the updated list of Accredited EIA Consultant Organizations with approved Sectors please refer to QCI-NABET website.