urbanization development in china and japan - 財務省 · 1 urbanization development in china and...
TRANSCRIPT

1
Urbanization Development in China and Japan
Wang Li, Visiting Scholar, China
Policy Research Institute, Ministry of Finance, Japan
Aug 2, 2007

2
OutlineChapterⅠ: BackgroundChapterⅡ: Urbanization Development in the
WorldChapterⅢ: Metropolitan Regions: New
Trends of the Urbanization in China ChapterⅣ: Good Experiences and Useful
lessons from Japan ChapterⅤ: Policy Options for China

3
1.Background1.1 Definition of Urbanization
1.2 Urbanization is a By-product of the Economic and Social Development
1.3 Some Useful Issues about the Urbanization Development

4
1.1 Definition of UrbanizationCity in the World: the population moving from the rural area to the urban area and working in the non-agricultural industry; the living style transferring from the rural mode to the urban mode.Karl Marx pointed that the recent world history is the history of the urbanization in rural area, which represents the population centralizing into the urban areas.The Standard Glossary of City Planning, PRC urbanization is the historical process, and represents the ruralpopulation migrating to the urban areas, in which the people’s living and producing style increasingly changing into the urban form the rural forms.

5
My View
Urbanization is progress in which people migratesfrom the rural area into the urban area, and their producing, living style changes greatly. It is not only a simply structural change of population, but also, the improvement of the industrial structure and site location. As a regular rule, we use the percentage of the urban population in the total population to evaluate the urbanization level of a country/region.
6
1.2 Urbanization Accompanies with Economic and Social Development
1.2.1 Industrialization Promotes Urbanization Development
1.2.2 Developing Service Industry Needs Urbanization Development

7
1.3 Some Useful Rules
1.3.1 The Basic Rule of Urbanization: the Urbanization Stages
1.3.2 Large City Domination
1.3.3 Urbanization Approach
8
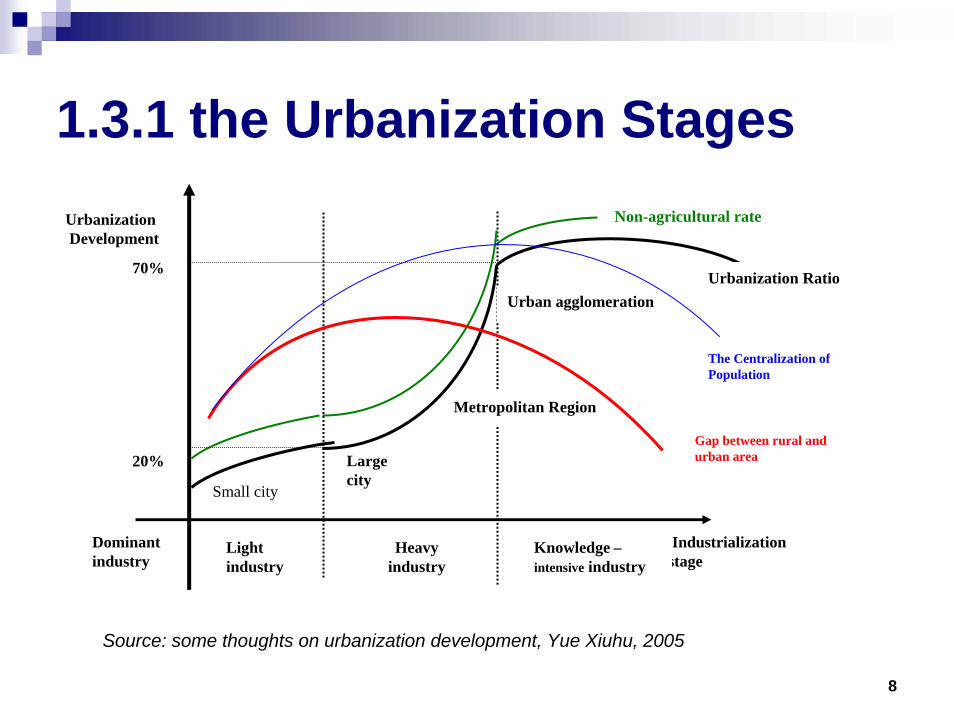
1.3.1 the Urbanization Stages
20%
70%
Gap between rural and urban area
The Centralization of Population
Small city
Large city
Metropolitan Region
Urban agglomeration
Industrialization stage
UrbanizationDevelopment
Dominant industry
Urbanization Ratio
Non-agricultural rate
Light industry
Heavy industry
Knowledge –intensive industry
Source: some thoughts on urbanization development, Yue Xiuhu, 2005
9
1.3.2 Large City Domination
From 1920 to 1960, the population enhanced 1.3 times in cities with 20,000-100,000 populations, while increased 1.9 times in cities with 100,000-500,000, the figure doubled in the cities with 500,000-2,500,000 populations, and nearly four timed in the cities over 2,500,000.
In 1950, the average population of the largest cities was 2,100,000, which reached to 5,000,000 in 1990.
Source: the statistic of UN

10
1.3.3 Urbanization Approach
In most countries, the urbanization progress appears as below:Urban Agglomeration(decentralization)
Metropolitan Region(centralization)
Single city(decentralization)
Source: some thoughts on urbanization development, Yue Xiuhu, 2005

11
2. Urbanization in the World2.1 Urbanization Process in the World2.2 Urbanization Development in East Asia2.3 Urbanization Progress in Japan2.4 Urbanization Development in China

12
2.1 Urbanization Process in the World
population, billionsAverage annual rate of
change, (percentage)
World 1950 1975 2000 2005 2030 1950-2005 2005-2030
Total 2.52 4.07 6.09 6.46 8.2 1.71 0.95
Urban. 0.73 1.52 2.84 3.15 4.91 2.65 1.78
Rural 1.79 2.56 3.24 3.31 3.29 1.12 -0.03
Percentage urbanRate of urbanization
(percentage)29 37.2 46.7 48.7 59.9 0.94 0.83

13
May 23 2007, the urban population exceeded the rural population for the first time
Source: United Nations, Department of Economic and Social Affairs, Population Division (2006). World Urbanization Prospects: The 2005 Revision. Working Paper No. ESA/P/WP/200.
14
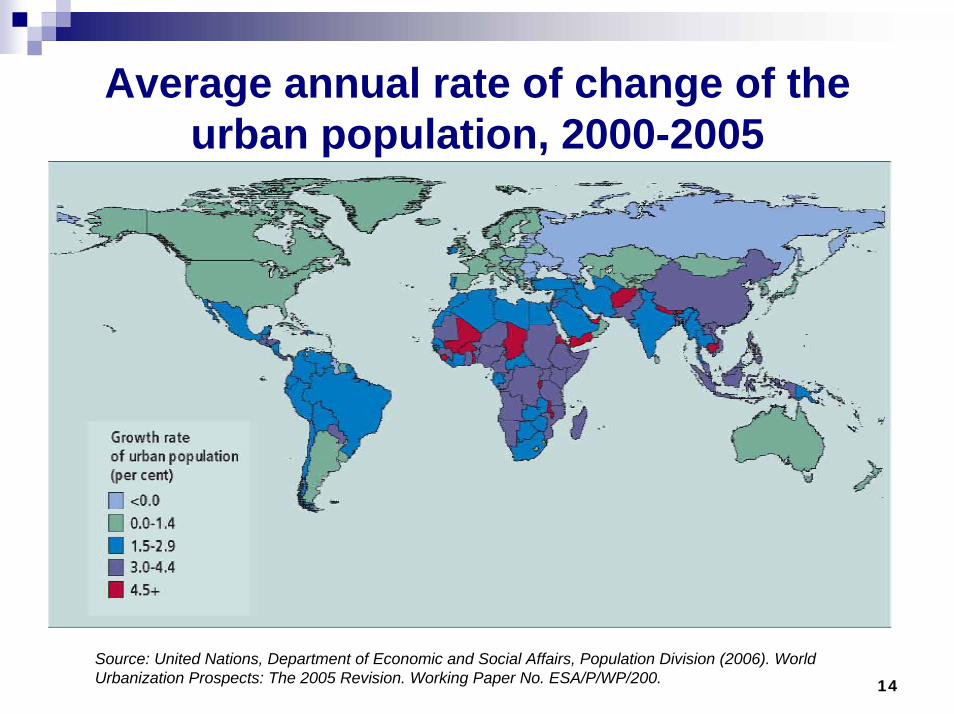
Average annual rate of change of the urban population, 2000-2005
Source: United Nations, Department of Economic and Social Affairs, Population Division (2006). World Urbanization Prospects: The 2005 Revision. Working Paper No. ESA/P/WP/200.

15
2.2 Urbanization Development in East Asia
With the repaid economic and social development, urbanization becomes a mega-trend in East Asia. Between 2000 and 2025, the urban population of East Asia (including South East Asia) is expected to increase by 500 million or 65%; in comparison, the total population increase will be only 17%.

16Source: UN, World Urbanization Prospects: The 2003 Revision; and World Bank.
Cambodia 380 14.5 2.4 19 5.5
China 1,740 1,313.30 0.7 39 3.2
Indonesia 1,270 222.6 1.3 46 3.9
Lao PDR 440 5.8 2.3 21 4.6
Malaysia 4,960 24.9 1.9 64 3
Mongolia 670 2.6 1.3 57 1.4
Myanmar NA 50.1 1.1 30 3.1
Papua and New Guinea 660 5.8 2.2 13 2.3
Phillipines 1,250 81.4 1.8 61 3.1
Thailand 2,750 63.5 1 32 1.9
Vietnam 620 82.5 1.3 26 3.2
East Asia & Pacific Region 1,610 1,869 50.8 41 3.1
Hong Kong SAR 26,810 7.1 1.1 100 1.1
Korea 15,810 48 0.6 80 0.9
Sinagpore 24,220 4.3 1.7 100 1.7
Developing East Asia 1,680 5,360.80 1.3 43 2.5
Urban Population Growth in East AsiaPopulation Urban Population
Country/ Region GNI per capita 2005
($)
Total (millions)
2004
Growth Rate % (2000-
2005)
Proportion of Total (% )
Growth Rate %
(2000-2005)
17
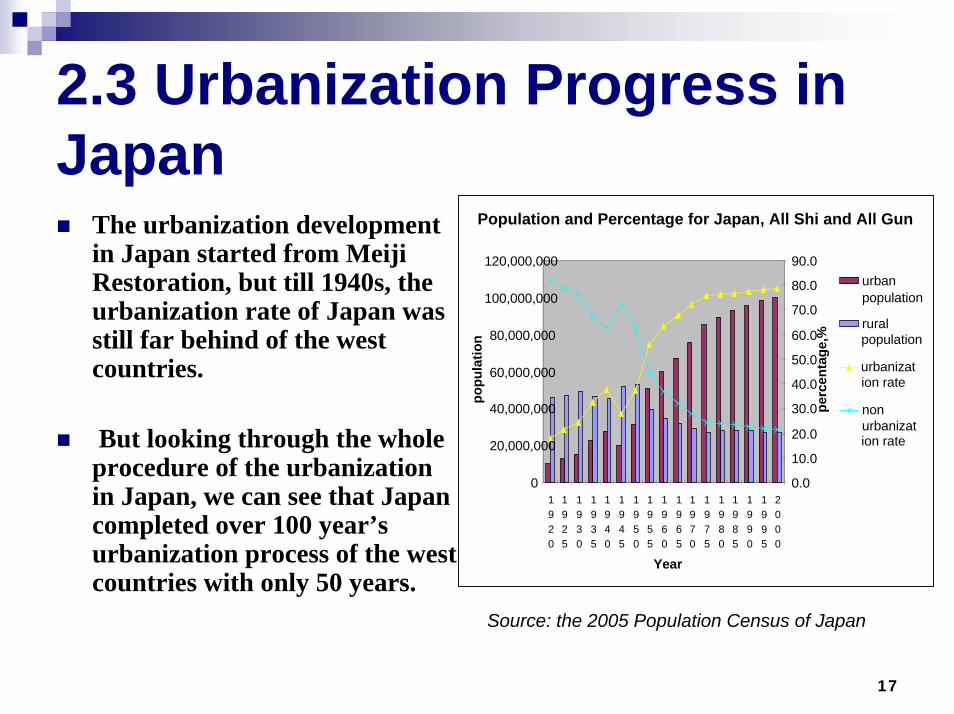
2.3 Urbanization Progress in Japan
The urbanization development in Japan started from Meiji Restoration, but till 1940s, the urbanization rate of Japan was still far behind of the west countries.
But looking through the whole procedure of the urbanization in Japan, we can see that Japan completed over 100 year’s urbanization process of the west countries with only 50 years.
Source: the 2005 Population Census of Japan
Population and Percentage for Japan, All Shi and All Gun
0
20,000,000
40,000,000
60,000,000
80,000,000
100,000,000
120,000,000
1920
1925
1930
1935
1940
1945
1950
1955
1960
1965
1970
1975
1980
1985
1990
1995
2000
Year
popu
latio
n0.0
10.0
20.0
30.0
40.0
50.0
60.0
70.0
80.0
90.0
perc
enta
ge,%
urbanpopulation
ruralpopulation
urbanization rate
nonurbanization rate

18
Some Unique Characters:
Government leaded the urbanization process
Industrialization promoted the urbanization
Heavy compacted urbanization model
19
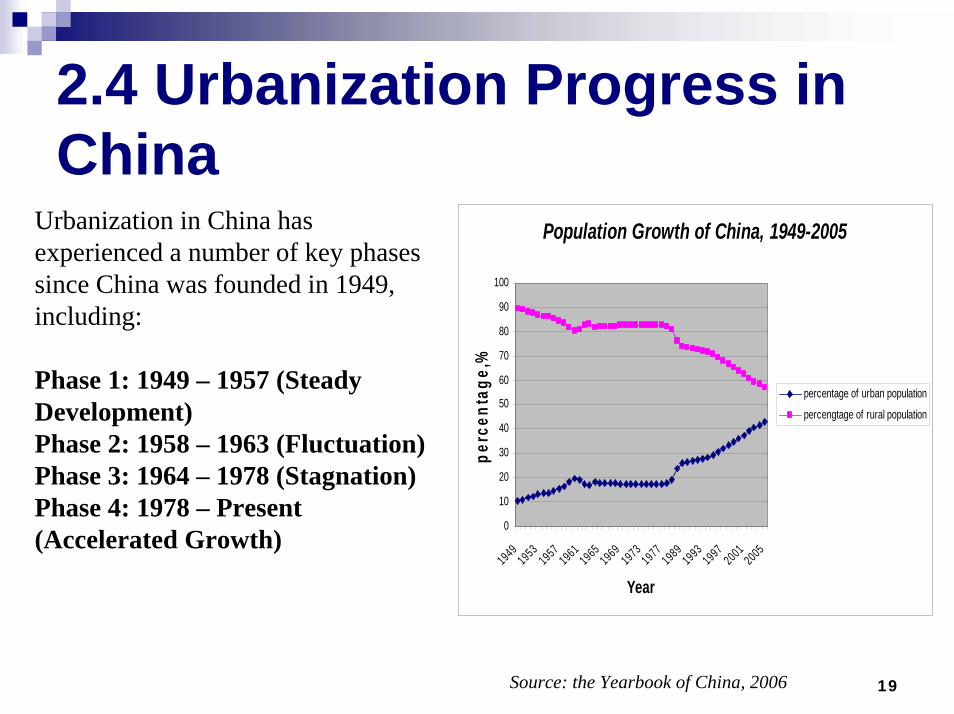
2.4 Urbanization Progress in China
Urbanization in China has experienced a number of key phases since China was founded in 1949, including:
Phase 1: 1949 – 1957 (Steady Development) Phase 2: 1958 – 1963 (Fluctuation)Phase 3: 1964 – 1978 (Stagnation) Phase 4: 1978 – Present (Accelerated Growth)
Population Growth of China, 1949-2005
0
10
20
30
40
50
60
70
80
90
100
1949195319571961196519691973197719891993199720012005
Year
perc
enta
ge,%
percentage of urban population
percengtage of rural population
Source: the Yearbook of China, 2006

20
The urbanization rate comparison with other countries
the world average; China; undeveloped countries; less developed countries; developed coutries
0%
10%
20%
30%
40%
50%
60%
70%
80%
1980 1985 1990 1995 2000 2005
21
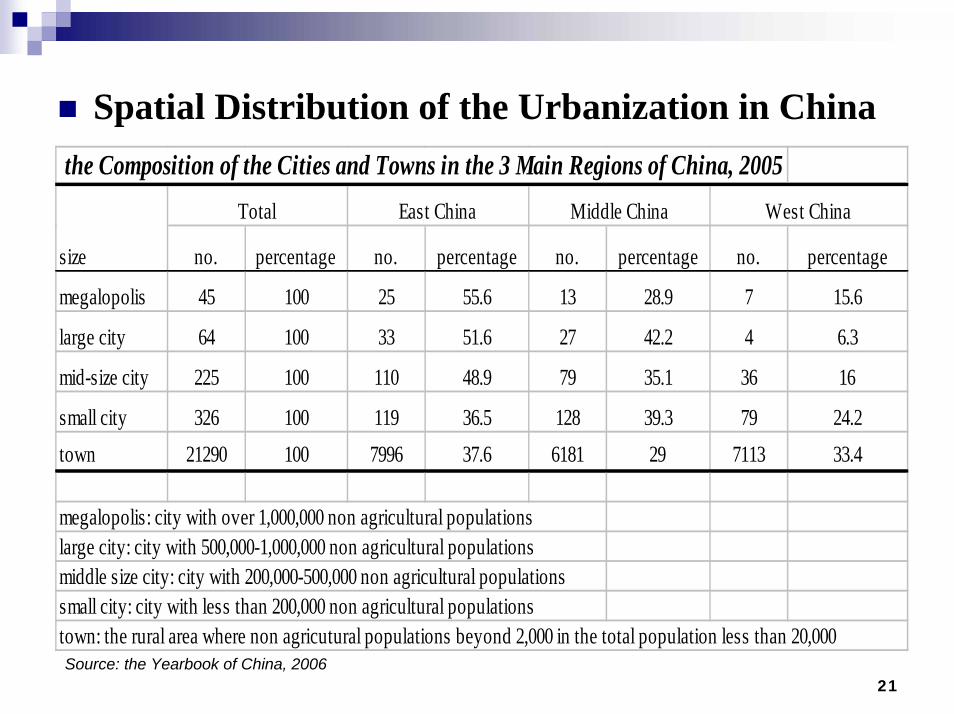
Spatial Distribution of the Urbanization in China the Composition of the Cities and Towns in the 3 Main Regions of China, 2005
no. percentage no. percentage no. percentage no. percentage
megalopolis 45 100 25 55.6 13 28.9 7 15.6
large city 64 100 33 51.6 27 42.2 4 6.3
mid-size city 225 100 110 48.9 79 35.1 36 16
small city 326 100 119 36.5 128 39.3 79 24.2town 21290 100 7996 37.6 6181 29 7113 33.4
megalopolis: city with over 1,000,000 non agricultural populationslarge city: city with 500,000-1,000,000 non agricultural populations middle size city: city with 200,000-500,000 non agricultural populations small city: city with less than 200,000 non agricultural populationstown: the rural area where non agricutural populations beyond 2,000 in the total population less than 20,000
West China
size
Total East China Middle China
Source: the Yearbook of China, 2006

22
3. Metropolitan Regions: New Trends of China
3.1 Urbanization Scenarios3.2 New Metropolitan Regions in China3.3 The Future Metropolitan Regions in China3.4 Policies to match the development of Metropolitan Region3.5 Key Challenges facing China’s Metropolitan Regions

23
Year Scenarios TP (Billion)
UP (Billion)
UR %
Key Assumptions
2005 1.31 0.56 43Average annual urbanization rate of 0.5 percentage pointPer capital GDP growth rate 5.5%Newly-increased jobs 8,000,000-10,000,000Economical use and conservation of landAverage annual urbanization rate of 0.7 percentage pointPer capital GDP growth rate 7.5%Newly-increased jobs 10,000,000-15,000,000Economical use and conservation of landAverage annual urbanization rate of 1.4 percentage pointPer capital GDP growth rate >10%Newly-increased jobs 15,000,000-20,000,000Extensive use of landAverage annual urbanization rate of 0.5 percentage pointPer capital GDP growth rate 5.5%Newly-increased jobs 8,000,000-10,000,000Economical use of landAverage annual urbanization rate of 0.7 percentage pointPer capital GDP growth rate 7.5%Newly-increased jobs 10,000,000-15,000,000Economical use of landAverage annual urbanization rate of 1.4 percentage pointPer capital GDP growth rate >10%Newly-increased jobs 15,000,000-20,000,000Extensive use of land
471.36 0.64
Low 1.33 0.61 46
0.78 54
2010
High 1.5 0.96
Low 1.42 0.72
Medium
2020
National Urbanization Scenarios, 2010-2020
51
High 1.39 0.7 50
64
Medium 1.45
Source: the ADB Research Report on The Sustainable Development of the Metropolitan Region in China, 2006
3.1 Urbanization Scenarios
24
Key Assumptions:The medium scenarios (baseline) assume the international economic environment will be relatively stable and China’s economy will continually maintain a relatively rapid yet more sustainable developing tendency.It assumes China will achieve the economic goals promoted in the 11th FYP. GDP grows 7.5 percent annually to double the per capita GDP in 2000 by 2010 and quadruple it by 2020. It assumes China continually maintains the past average overall urbanisation rate, that is, 0.7 percent increase annually in urbanization growth rate.

25
3.2 New Metropolitan Regions in China
With the implementation of the open-up policy, Chinese cities experienced over twenty years quick growth, which demonstrates a lot percentage of population and economic centralizing in cities and occurring some large metropolitan regions.
According to one of my essays published in 2004, there are 13 main metropolitan regions in China: the Yangtze Delta and Pearl river Delta, Beijing-Tianjin, Zhenzhou, Chengdu-Chongqing, Shenyang Metropolitan Regions, etc.

26
The Recent Metropolitan Regions-1

27
The Recent Metropolitan Regions-2
28
3.3 The Future Metropolitan Regions in China
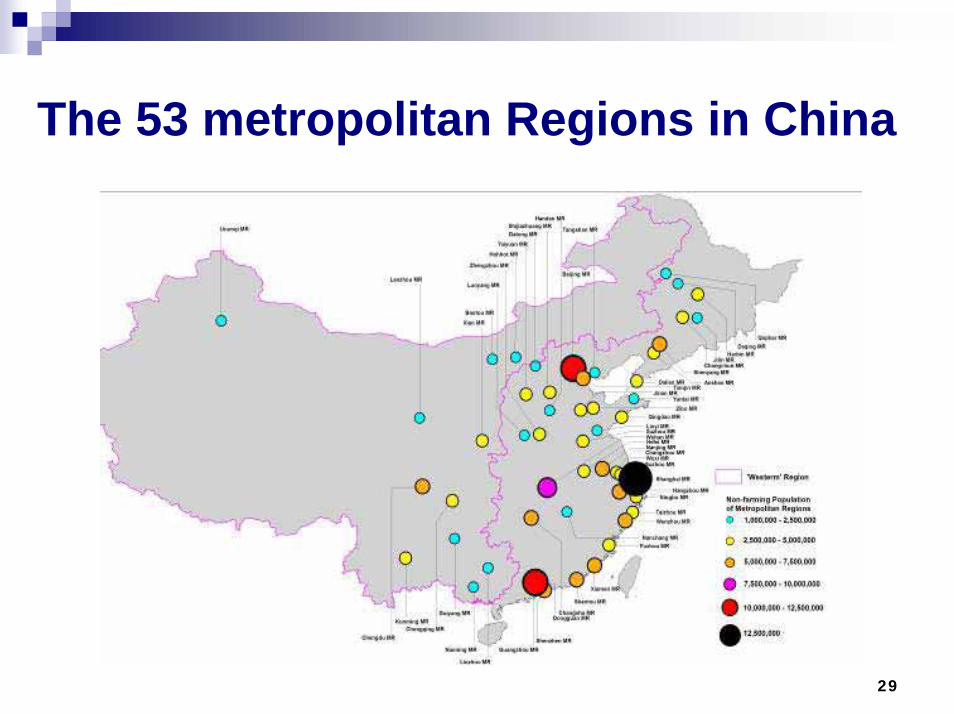
According a recent Study on the Metropolitan Region in China conducted by the World Bank, there are 53 metropolitan regions in China anchored on cities with over 1 million non-farming residents and encompassing selected adjacent counties. These appear to be China’s main economic engines. They hold almost 370 million people, or 29% of the country’s population, but produce 53% of China’s GDP and 62.3% of all non-farming GDP from manufacturing, construction and services.
29
The 53 metropolitan Regions in China

30
3.4 Policies to match the development of Metropolitan Region3.4.1 Promoting Balanced Development among Regions
Development-Optimized Zone: regions with high density of land development and declining resource and environment bearing endowmentDevelopment-Prioritized Zone: regions with relatively strong resource and environment bearing endowment, as well as favourable gathering conditions of economy and populationDevelopment-Restricted Zone: regions with weak resource and environment bearing endowment, poor gathering conditions of economy and population, which are crucial to ecological safety in a wider area or across the countryDevelopment-Prohibited Zone: natural reserves of all kinds established in accordance with law

31
3.4.2 Promoting the sound progress of urbanization
in current MRs, especially the Yangtze Delta, Beijing-Tianjin Corridor, improve the quality of the economic and social development, replacing the quantity orientation.in future MRs as listed before, accelerate the growth speed. It is not only possible but also necessary to cultivate more MRs in order to centralize the population and economy. in Non-MRs, just develop the current cities and towns under the severely protection of the environment. in the west part of China, it is better to develop the current cities/towns in order to supply the public services, and move population and industry out of this area.

32
3.5 Key Challenges facing China’s Metropolitan RegionsWhile China has consistently enjoyed high economic growth rates over the last 25 years, there are more and more important problems facing China, I outline FOUR issues that need to be quickly addressed in China’s metropolitan regions:
Rapid Urbanization and Land Supply Developing Disparity between Urban and Rural
Population Environmental degradation (e.g. air, soil, and
water) Governing and Managing
33
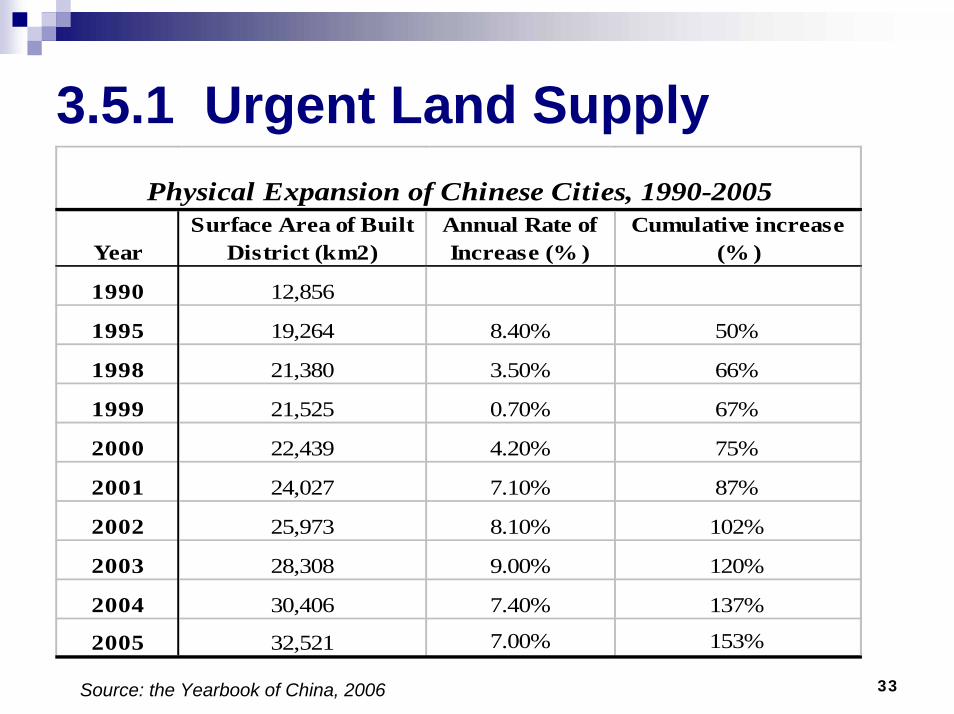
3.5.1 Urgent Land Supply
Source: the Yearbook of China, 2006
YearSurface Area of Built
District (km2)Annual Rate of Increase (% )
Cumulative increase (% )
1990 12,856
1995 19,264 8.40% 50%
1998 21,380 3.50% 66%
1999 21,525 0.70% 67%
2000 22,439 4.20% 75%
2001 24,027 7.10% 87%
2002 25,973 8.10% 102%
2003 28,308 9.00% 120%
2004 30,406 7.40% 137%
2005 32,521 7.00% 153%
Physical Expansion of Chinese Cities, 1990-2005
34
Former table provides an overview of the increase in the total built-up areas of China’s urban areas between 1990 and 2005, over this time the area of built up land increasing by 153%. Chinese cities now cover more than two and a half times the area they covered in 1990. The last few years show an accelerated rate of expansion, the result of major redevelopment projects particularly involving population relocation. Lands for housing and public transportation is a big problem for China.

35
4.5.2 Developing Disparity between Urban and Rural Population
Rural migrants lack affordable access to good housing, safe and secure employment, and are rarely included in any formalized social welfare system.
Urban welfare systems and rural land arrangements are the main institutional barriers to labour mobility. High costs of child-care and schooling also hinder rural families migrating to the urban areas.

36
3.5.3 Environmental degradation
China is the world's most populous country and the fourth largest in area. Its economy, already huge, is growing at the fastest rate of any major nation. Its environmental problems are among the most severe of any major country, and are mostly getting worse.

37

38
3.5.4 Governing and Managing in Metropolitan Regions
There is no real Metropolitan Regional Government in China.Just some local cities and counties established some coordination institute to deal with the regional issues occurring in Metropolitan Region, eg, the Wuhan Metropolitan Region promoting office.

39
4. Good Experiences from Japan4.1 the Background of the Three Metropolitan Regions in Japan4.2 the National Capital Metropolitan Regional Plans4.3 New Trends and Challenges of the National Capital Metropolitan Region

40
4.1 the Background of the Three Metropolitan Regions in Japan
The National Capital Metropolitan Regionincludes: Tokyo Metropolitans and 7 surrounding prefectures, they are: Chiba, Saitama, Kanagawa, Ibaraki, Tochigi, Gunma, Yamanashi prefecture. The Kinki Metropolitan Region is comprised by 9 prefectures and cities: Fukui, Mie, Shiga, Kyoto, Osaka, Hyogo, Nara, Wakayama prefecture. The Chubu Metropolitan Region covers 9 prefectures, including: Toyama, Ishikawa, Fukui, Nagano, Gifu, Shizuoka, Aichi, Mie, Shiga prefecture.

41
Three Main Metropolitan Regions in Japan
Tokyo Metropolis and National Capital MR

42
Main statistic figures of the three Metropolitan Regions in Japan
Area, Km2 2005
population 2005
GDP, million Yen 2005
Employees 2000
Enterprises 2001
National 377,914.78 127,768,000 495,772,222 62,978,000 6,350,101
NCMR 36,889.27 42,379,000 183,376,277 20,963,000 1,909,422
Kinki MR 37,302.69 23,582,000 89,322,396 11,171,000 1,198,373
Chubu MR 59,543.59 21,705,000 89,648,591 11,199,000 1,165,135
Non-MR 244,179.23 44,171,000 133,424,958 21,611,000 2,285,259
Source: the 2005 Population Census of Japan
43
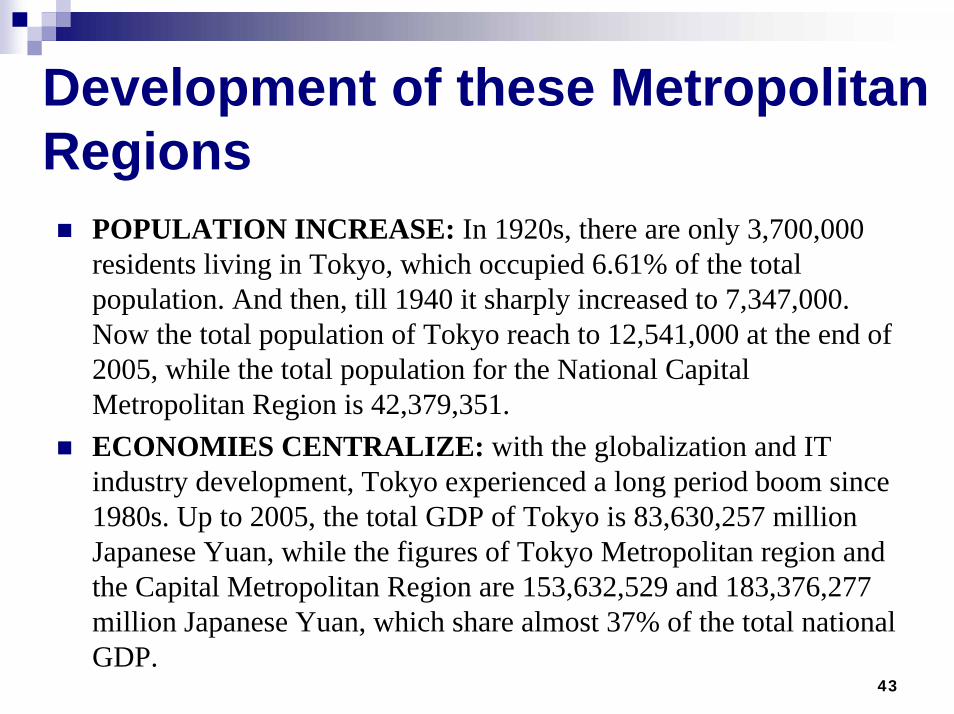
Development of these Metropolitan Regions
POPULATION INCREASE: In 1920s, there are only 3,700,000 residents living in Tokyo, which occupied 6.61% of the total population. And then, till 1940 it sharply increased to 7,347,000. Now the total population of Tokyo reach to 12,541,000 at the end of 2005, while the total population for the National Capital Metropolitan Region is 42,379,351. ECONOMIES CENTRALIZE: with the globalization and IT industry development, Tokyo experienced a long period boom since1980s. Up to 2005, the total GDP of Tokyo is 83,630,257 million Japanese Yuan, while the figures of Tokyo Metropolitan region and the Capital Metropolitan Region are 153,632,529 and 183,376,277million Japanese Yuan, which share almost 37% of the total national GDP.

44
NCMR, 9.76%Kinki MR,9.87%
Chubu MR,15.76%Non-MR,
64.61%
NCMRKinki MRChubu MRNon-MR
NCMR,33.17%
Kinki MR,18.46%
Chubu MR,16.99%
Non-MR,34.57%
NCMRKinki MRChubu MRNon-MR
Land Area share between Regions, 2005
Source: the 2005 Population Census of Japan
Population Shares of Regions, 2005

45
NCMR,36.99%
Kinki MR,18.02%
Chubu MR,18.08%
Non-MR,26.91% NCMR
Kinki MRChubu MRNon-MR
Employment Shares of regions, 2005
Source: the 2005 Population Census of Japan
Regional GDP shares of Japan, 2005
NCMR,33.29%
Kinki MR,17.74%
Chubu MR,17.78%
Non-MR,34.32%
NCMRKinki MRChubu MRNon-MR

46
4.2 the National Capital Metropolitan Regional Plans
In 1958, the first National Capital Metropolitan Regional Plan designed a 5-10 kilometre green-belt along the construction district of Tokyo and located the satellite towns outside of the green-belt in order to prevent the urban expansion of Tokyo. The second National Capital Metropolitan Regional Plan in 1968 suggested constructing Tokyo as the main backbone of Japanese great growth. According to the reaction to the single-polar of the National Land and the reorganization about the growth limitation, the central government made the third National Capital Metropolitan Regional Plan in 1976.

47
ContinuedIn 1986,the government published the Fourth National Capital Metropolitan Regional Plan to continued the main thoughts of the third Plan, and just made some adjustment on the city location of the surrounding areas.
The Fifth National Capital Metropolitan Regional Plan was published in 1998, which submit to control and decentralize the function concentration in Tokyo and build a regional structure to balance the living and working.

48
Table 8 the main contexts of National Capital Metropolitan Regional Plans Project first CMRP second CMRP third CMRP forth CMRP fifth CMRP
date Jul, 1958 Oct, 1968 Nov, 1976 Jun, 1986 Mar, 1999
planning period 1975 1975 1976-1986 1986- 15 years 2000-2015
planning background
to face the centralization to the CMR due to the economical Revitalize after WWII, and to construct the political, economic and cultural centre of Japan: new CMR
the fast economic growth causes the deeply changes in the whole society, which requires to rethink about the Green-Belt thought.
oil crisis happened this period
to face globalization, informationization in the world, and the low birth rate, aging society in Japan
the economic and social development grows into the steady increasing stage from the fast growth stage
planning area about 100 km2 around the centre of Tokyo
eight prefectures: Tokyo, Chiba, Saitama, Kanagawa, Ibaraki, Tochigi, Gunma, Yamanashi prefecture
eight prefectures: Tokyo, Chiba, Saitama, Kanagawa, Ibaraki, Tochigi, Gunma, Yamanashi prefecture
eight prefectures:Tokyo, Chiba, Saitama, Kanagawa, Ibaraki, Tochigi, Gunma, Yamanashi prefecture
eight prefectures: Tokyo, Chiba, Saitama, Kanagawa, Ibaraki, Tochigi, Gunma, Yamanashi prefecture
population 26,600,000 till 1975 33,100,000 till 1975 as expected
control the population within 38,000,000 till 1985
low population growth, as expected 40,900,000 in 2000
the population will flow down after reaching 41,900,000 in 2011, till 2015, the population will drop to 41,800,000
objectives 1. to build the Green-Belt around Tokyo in order to control the urban expansion;2. to design and construct many satellite towns to decentralize the industry and populations of Tokyo
1. to enforce the main function of Tokyo as the backbone, and reconstruct the urban space; 2.to designate the areas 50 km2 from the centre as the suburban promotion area and construct the new-planned street. 3. to continue the satellite town construction.
1. to decentralize the population and economy of the CMR, 2. and to built a comprehensive region with many sub-cities inside; 3. to enforce the cultural function in the suburban area on the basis of the agricultural and industrial function.
1. to correct the single-polar dependence to Tokyo, and to form the more cores and more circles within the CMR, 2. in the suburban area, to promote the centralization in the core city and construct the rural, fisher villages, 3.then improve the collaboration and independence between regions
1. to correct the single-polar dependence to Tokyo, and to form the more cores and more circles within the NCMR, 2. to develop and construct the wide-area cooperation on the basis of Tokyo

49
Main Contents of the Fifth Capital Metropolitan Regional plan
The main objectives of this fifth NCMRP are as following:
Supporting Joyful Life in NCMR.Enhancing Global Competitiveness. Ensuring the National Safety. Preserving and Creating a Beautiful and Benign
Environment. Creating a nice area for offspring’s.
50
In order to avoid the large city problems and fulfil the objectives above, the newest plan put forward:
To decrease the single-polar dependence to Tokyo city, and to form the decentralized city-network, this requires cultivating more cores and more circles within NCMR. Every city will has its own centre and surrounding area, main industry and residents, which makes them independent and also can take different responsibility within NCMR.
To develop and construct the wide-area cooperation on the basis of the centre cities in Tokyo Metropolis, north part of Guandong, and west part of Inland, and strengthen the collaboration and communication between regions.
51
The Regional Promotion Thoughtthe fifth NCMRP divided the whole area into SIX different sub-areas, they are:
Tokyo Metropolitan Region: Finish the ring public transportation; New settlement areas inside the inner Tokyo; Build more neighbourhoods that can prevent the disasters
Suburb areas: Appear the independent business, cultural, and living area; The ring transportation connection with the inner city ; the conversation of the green open space near the city; Create the beautiful and competitive area around the Tokyo Bay

52
the east and north part of Kanto area: Search for the ring connection with the Tokyo Metropolitan Region and promote the wide-area cooperation in the CMR; Development coexists with the nice environment in the well environmental areas. the west part of Nairiku area: the ring promoting axis with the last two areas; to strengthen the communication and collaboration between Tokyo MR, Kinki MR and the urban cluster along the Japanese ocean.the island areas: to push the transportation and IT infrastructure construction, and improve the living standards there.
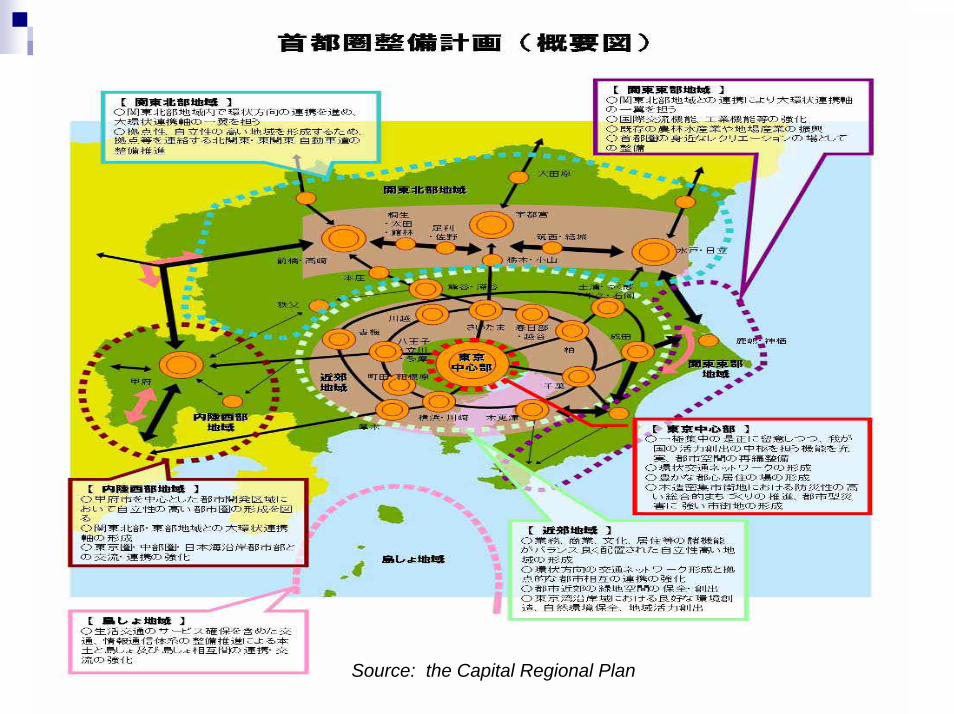
53Source: the Capital Regional Plan

54
4.3 New Trends and Challenges
4.3.1 Changes in population trends Between 2000 and 2005, population has not
increased at the outer edge of the suburban Development and Redevelopment Area, while it has been on a strong increasing trend in the inner-city area of Tokyo.

55
4.3.2 Trends of site location of the industry and university
Both the amount of planned equipment investment in the Tokyo region and its share to the nationwide in fiscal year 2005 significantly increased.
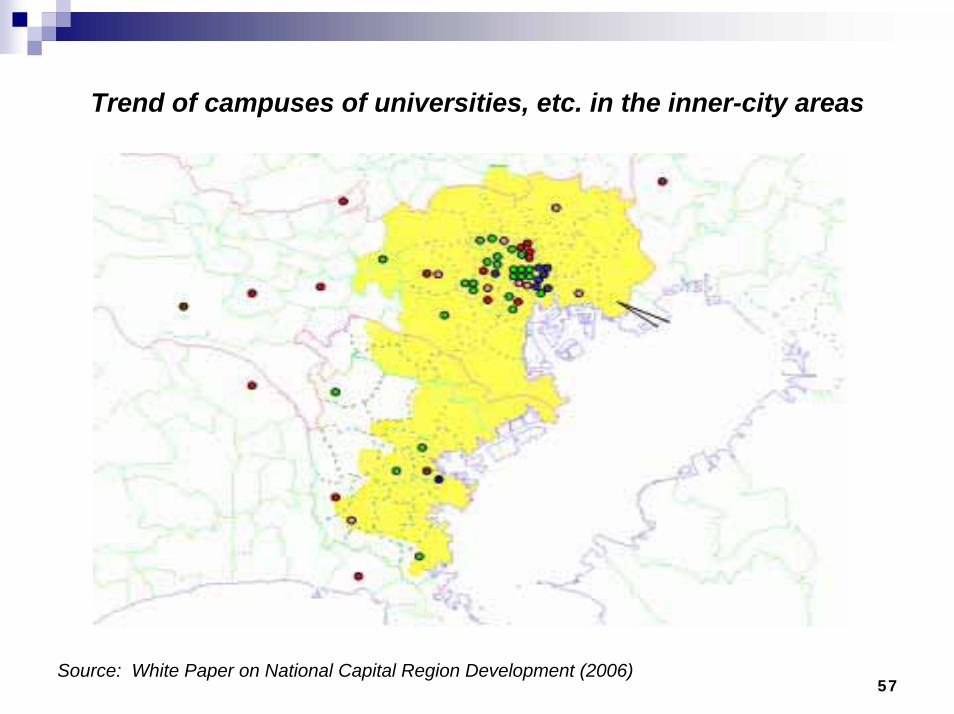
Recently, universities in Tokyo region have tended to be relocated from the suburbs to the inner-city area and reinforce their function in the inner-city area
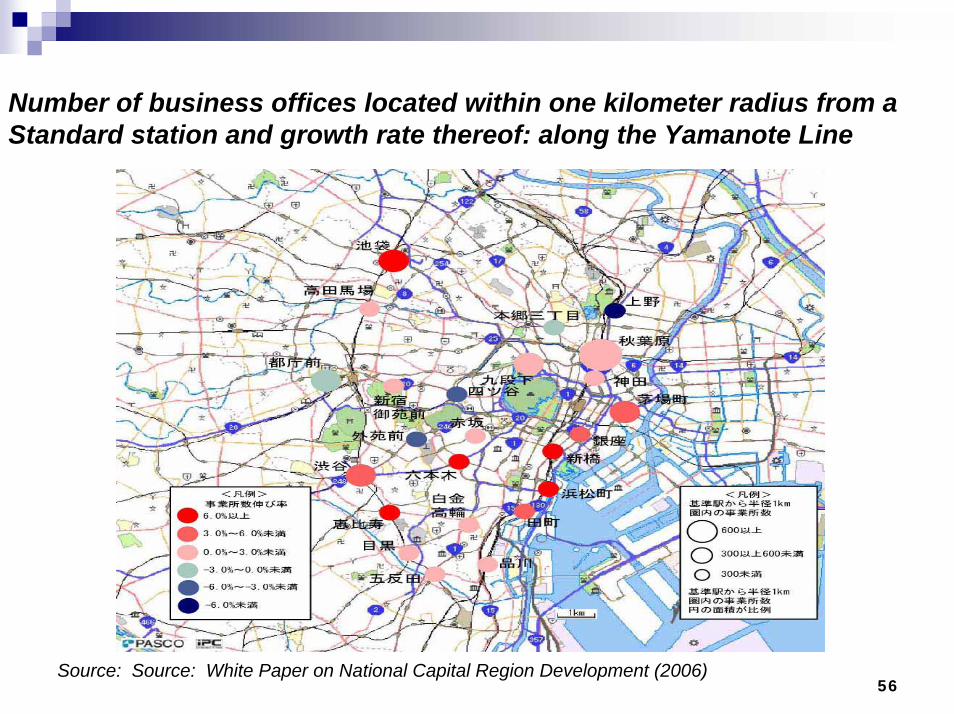
56
Number of business offices located within one kilometer radius from aStandard station and growth rate thereof: along the Yamanote Line
Source: Source: White Paper on National Capital Region Development (2006)
57
Trend of campuses of universities, etc. in the inner-city areas
Source: White Paper on National Capital Region Development (2006)

58
4.3.3 Coexistence with the EnvironmentWith the aim of building a network of water and green in the National Capital Region to enrich urban areas, the “Grand Design for Urban Environmental Infrastructure in the National Capital Region” was formulated in March 2004.Based on the Grand Design, various bodies, such as the government, citizens and NPOs, are advancing efforts, including consideration on the designation of new Suburban Green Zone Preservation Areas.

59
Future of urban environmental infrastructure in the National Capital Metropolitan Region
Source: White Paper on National Metropolitan Region, 2006

60
5. Policy Options for China5.1 Formulating the Comprehensive Metropolitan Regional Plans from the national level5.2 Public Transportation is very important for Metropolitan Regions5.3 Coexistence with the Environment5.4 Metropolitan Government is a good way to manage and control the development of Metropolitan Regions

61
5.1 Formulating the Comprehensive Metropolitan Regional Plans from the national level
Now the Chinese central government agencies, especially National Development Reform Commission are busy formulating the Metropolitan Regional Plans of the Capital Region and the Yangtze Delta, with the cooperation with many other department agencies, local governments and research institutes. But unfortunately, we have no national plans for the rest Metropolitan Regions. So it’s better for China to make the comprehensive Metropolitan Regional Plans from the country level.

62
Two Metropolitan Regions we are making plans now, but we need more….
63
Explore the experiences and lessons form the foreign countries, and then draw the draft plans according to the Chinese unique situation. Enforce the territorial division and market orientation of different cities, and then control the city size and the resources allocation accordingly. Separate the different roles of the government and the market. Pay more attention on the regional communication and cooperation.

64
5.2 Public Transportation is very important for Metropolitan Regions

65
Yangtze Delta Express Railway
Pearl River Delta Express Railway
Beijing-Tianjin Express Railway
Total length of the express railway in these three Metropolitan regions is about 2100 KM
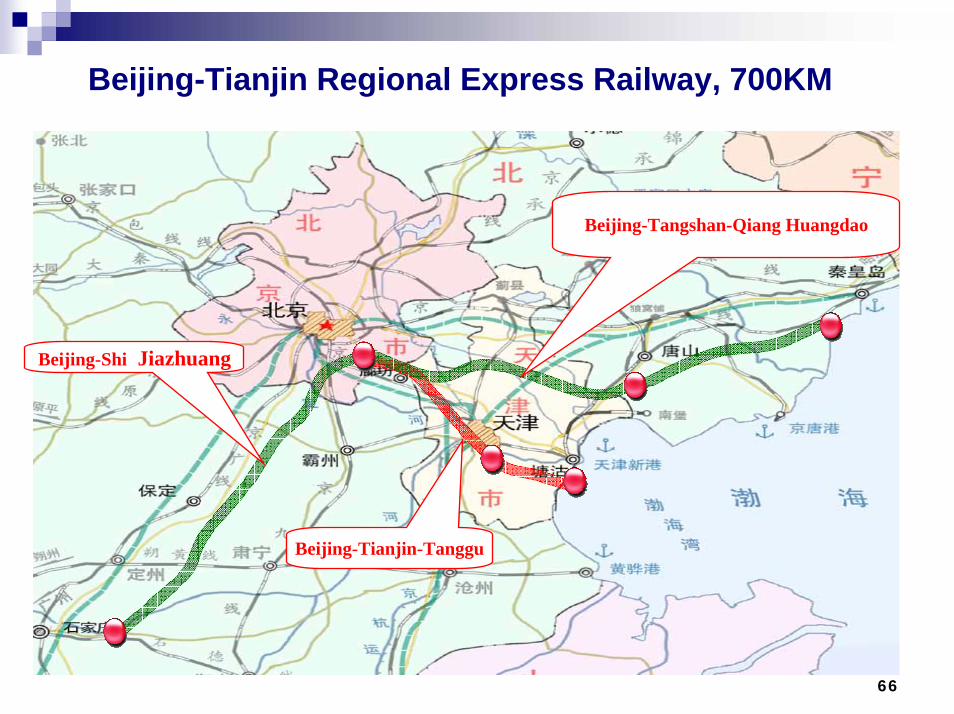
66
Beijing-Tianjin Regional Express Railway, 700KM
Beijing-Tianjin-Tanggu
Beijing-Shi Jiazhuang
Beijing-Tangshan-Qiang Huangdao

67
Yangtze Delta Regional Express Railway, 800KM
Shanghai-Hangzhou Hangzhou-Ningbo
Changzhou-Jiangyin-Changshu-Suzhou
Suzhou-Jiaxing
Shanghai-Nanjing

68
Pearl River Delta Regional Express Pearl River Delta Regional Express Railway, Railway, 6600KM
Guangzhou Stat.
Guangzhou-Shenzhen
Guangzhou-Zhuhai
Guangzhou-Foshan
Guangzhou-ZhaoqingDongguang-Huizhou
Xiaogan-Humen
Jiangmen-Xiaogan

69
5.3 Coexistence with the EnvironmentChanges in Environmental Indicators, 1981-2004
Sources: Chinese National Statistics and Consultants’ analysis
Indicator Unit Increase 1991-2004 Comment
GDP At constant prices 223% 58% increase since 1997
Total amount of wastewater discharged 100 million tons 44% Industrial discharges are decreasing
COD emissions 10,000 tons 76% 1997-2004
Total amount of SO2
emission 10,000 tons 39%
Total amount of flue dust emission 10,000 tons -17% Absolute decrease
Generation of industrial solid wastes total 10,000 tons 104%
Recycling of industrial solid wastes 10,000 tons 204% This is a positive indicator
Investment in pollution treatment 100 million yuan 190%
Estimated so as to be comparable toreal GDP.
Number of enterprise fined for pollutant discharges
10,000 unit 259% Significant 2004 decrease over 2003.
Protected areas % of national area 5.6% - 14.8% 1991 and 2004 respectively

70
More investment in pollution prevention
Total Investments in Pollution Control, 1991 – 2003
Sources: Chinese National Statistics and Consultants’ analysis

71
Our PoliciesIn the national 11th Five Year Plan, there are two outstanding improvements regarding environmental protection. First, the national territory is requested to be divided into four functioning zones, mentioned in Chapter 3. Different development strategy and environmental practices should be invented and implemented for these different zones. Second, the national plan distinguishes the voluntary/anticipated indicators that mainly represent official expectations of economic growth, and the obligatory/restricted indicators that mainly devote to environmental issues.

72
ContinuedIn the national environmental 11th Five Year Plan, three measures are highlighted among others:
strategic environmental assessment (SEA), responsibility system and total amount control of pollutant emission.
This implies an intention of integrating environment into decision making, and strengthening enforcement of environmental regulation.

73
5.4 Metropolitan GovernmentThe Tokyo Metropolitan Government manages the Tokyo Metropolitan region, capital of the world’s second-largest national economy, and the world’s largest contiguous urban agglomeration, with a population (2005) in excess of 35 million people. The TMG was established in 1991 as a prefecture level public entity encompassing 23 special wards that constitute central Tokyo, 26 cities (shi), with populations in excess of 300,000, and 13 smaller entities, towns (cho) and villages (son).But in china, we don’t have such kind of Metropolitan Government, so we can try to establish in the future.

74
Thank you very much for your attention!