urban%20transport%20med synthesis%202010 2011%20(eng)
DESCRIPTION
http://beta.cmimarseille.org/sites/default/files/AFD/sut/Urban%20Transport%20Med_Synthesis%202010-2011%20(eng).pdfTRANSCRIPT
1
Provisional version (November 2012)
If you have any feedback, please contact:
Julien Allaire, Technical Director, CODATU ([email protected])
Part 1
Part 1
Sustainable urban transport
in the Mediterranean region
Summary of 2010-2011 seminars

2
ACKNOWLEDGEMENTS
The following people took part in orienting, devising, writing and rewriting this publication
FRENCH DEVELOPMENT AGENCY (AFD):
Mr. Xavier Hoang, Transport Project Manager CODATU (COOPERATION FOR URBAN MOBILITY IN THE DEVELOPING WORLD):
Mr. Julien Allaire, Technical Director Ms. Laurie Maldera, Ms. Camille Martinet and Mr. Charles Simon, Project Managers
CERTU (CENTRE FOR STUDIES ON URBAN PLANNING, TRANSPORT AND PUBLIC FACILITIES):
Mr. Thierry Gouin, International Project Manager CETE MÉDITERRANÉE (TECHNICAL STUDY AND ENGINEERING CENTRE):
Ms. Marine Millot, Head of Urban Planning, Safety & Lighting (AUSE) Department Mr. Benjamin Fouchard, Urban Integration Project Manager
PLAN BLEU:
Mr. Sylvain Houpin, Cities Project Manager MEDCITIES:
Mr. Gabriel Jodar, FormaPlan Consultant We also extend special thanks to the following people, who, through their constant involvement, have contributed to the UD4 cycle (in alphabetical order):
Mr. Xavier Godard (expert); Mr. Alexis Jovignot (CODATU); Ms. Vanessa Kuzay (City of Marseille); Mr. Olivier Lavinal (CMI); Mr. Jacques Legaignoux (ex-CETE); Mr. Joan Parpal (MedCities); Ms. Chantal Picard (CODATU); Ms. Florence Saint-Paul (ex-CETE); Ms. Jocelyne Vauquelin (AFD); Mr. Bernard Videau (French Ministry of Ecology, Sustainable Development and Energy)
Thanks also to the many speakers, participants and partners who have helped make a success of each meeting in the “Sustainable Urban Transport in the Mediterranean” cycle held by the Marseille Center for Mediterranean Integration (CMI).

3
This publication summarises the work produced as part of the “Sustainable Urban Transport” programme of the Marseille Center for Mediterranean Integration (CMI). The purpose of the programme is to develop a comprehensive, integrated approach with a view to planning, managing and developing policies and systems for efficient, sustainable urban transport.
It has been compiled not only to strengthen the Mediterranean network of expertise in this field but also to help create a toolkit with concrete and methodological instruments suited to Mediterranean cities. The programme has also been designed to foster a common sustainable mobility culture in the Mediterranean basin, to develop international partnerships, and to disseminate best practices [CMI, 2011].1
The “Sustainable Urban Transport” programme is steered by the French Development Agency (AFD), which organises, seeks funding and implements it with support from CODATU and the specialist expertise centres of the scientific and technical network of the French Ministry of Ecology (CERTU, CETE Méditerranée et Sud-ouest) and of the Plan Bleu. The AFD’s other partners in this programme have been the World Bank, the European Investment Bank (EIB) and the cities and countries that have hosted the various events.
Within this framework, several workshops were held between 2010 and 2012. A first conference to kick off the programme was held in Damascus on 11-13 April 2010 on the theme “Urban mobility and sustainable development”. The second meeting was held in Marseille from 29 November to 1 December 2010. It focused on “travel to and in the old town centres and medinas”. Then, on 17-20 October 2011, participants gathered in Barcelona to work on “tools to support changes of sustainable urban mobility in the Mediterranean”.
This publication therefore draws on the many scientific contributions, case studies and expert dossiers presented during the events, and purposely devotes much space to the experiences presented during the various workshops.
Unfortunately, this document cannot reproduce all of the presentations and discussions that nourished discussion between experts from the various Mediterranean countries. To make it more interactive, all of the presentations in the workshop cycle are directly accessible via the internet links in the footnotes.
Greater detail is available in the following guides:
CODATU, French Ministry of Ecology, the World Bank, KNA-MENA, MedCities: “Les déplacements urbains en Méditerranée. Guide de Recommandations. Travaux issus du Séminaire Régional sur les Déplacements Urbains en Méditerranée – Skhirat, janvier 2008” (Urban transport in the Mediterranean region. Guidance and recommendations. Product of the Regional Seminar on Urban Transport in the Mediterranean Region – Skhirat, January 2008).
AFD, French Ministry Of Ecology, CODATU: “Qui paie quoi en matière de transports urbains? Guide de bonne pratiques”, (Who pays what for urban transport? A handbook of good practices). November 2009.
AFD, French Ministry of Ecology, French Ministry of Foreign and European Affairs, CODATU: “L’action internationale des collectivités territoriales en matière de déplacements urbains.
1 See: http://www.cmimarseille.org/FR/Urban-transport.php
PREAMBLE

4
Guide Méthodologique” (International action by territorial authorities in the field of urban mobility. Guide to methodology). October 2010.
CMI, AFD, BEI, the World Bank, CODATU, Transitec – Urbaplan: “Accessibilité des Médinas. Guide des bonnes pratiques à l’intention des décideurs” (Medina accessibility. Best practice guide for decision-makers). To be released soon.
5
In the coming decades, the cities on the southern and eastern rim of the Mediterranean will witness
a demographic boom. Driven by strong demographic growth, Turkey and the countries of North
Africa and the Middle East will see their urban populations double, and even triple. This
“urban transition” will likely be fed by an economic-growth dynamic that is already under way in
certain countries bordering the Mediterranean.
These prospects for urban development raise many economic, social and environmental questions:
- What urban economic activities will there be (jobs, trade, asset creation, etc.)?
- What living conditions will people have (homes, access to essential services, quality of life,
etc.)?
- What environmental consequences will there be (preservation of farmland around urbanised
centres, energy consumption, air quality, etc.)?
At the intersection of all these questions are the issues of transport, accessibility and mobility.
Economic development and improved social conditions generate flows of goods and people. The
outlook for cities on the southern and eastern rim of the Mediterranean heralds an explosion in
urban mobility. However, this is particularly tricky to forecast and organise.
Urban mobility is a complex system comprising simple elements, but these evolve quickly and simultaneously. According to Xavier Hoang (AFD), the system can be broken down into seven sub-systems: multi-space, multi-function, multi-modal, multi-stakeholder, multi-funding, multi-effect and multi-time.2 Each city and country must find a system to fit its own context and specific features.
Following the same pattern as many northern rim countries, populations with rising incomes aspire
to own their own car; indeed, this wish is sometimes facilitated by certain public policies to promote
mass car ownership. But this ownership dynamic generates congestion, road-safety and pollution
phenomena counter to the community’s common interest.
In the cities in the south and east of the Mediterranean region, car ownership rates are currently
below 150 per 1,000 inhabitants, i.e. three to four times lower than in the north.
The history of car ownership in northern rim cities is highly instructive. After a phase of rapid car
development, local governments sought to control use of this transport mode in favour of public
transport and active modes. In recent years, public policies have included measures that seem
perfectly applicable in southern rim countries.
Indeed, the lesser car ownership rates of developing cities seems to be an asset in helping structure
urban areas around public-transport modes and in developing multimodal practices among
inhabitants.
Here, we therefore propose to survey the situation of southern and eastern rim cities and to study
whether they can adapt public policies to their area without recourse to a predominance of private
vehicles.
2 Comments made at the closing session of the Barcelona workshop in October 2011.
INTRODUCTION

6
In Part One, we propose a survey of the situation in the Mediterranean rim countries and of the core trends in public policies to establish sustainable mobility. None of the solutions mentioned here is intended to fit every situation, but they can all be adapted to the local context.
In Part Two, we present the experiences of the various metropolitan areas in the north, south and
east of the Mediterranean region. These were all presented during the workshops, and address
various themes listed in the table.
7
PART ONE: CONTEXTUAL ELEMENTS FRENCH DEVELOPMENT AGENCY (AFD): ................................................................................................ 2
CODATU (COOPERATION FOR URBAN MOBILITY IN THE DEVELOPING WORLD): ......................................... 2
CERTU (CENTRE FOR STUDIES ON URBAN PLANNING, TRANSPORT AND PUBLIC FACILITIES): ......................... 2
CETE MÉDITERRANÉE (TECHNICAL STUDY AND ENGINEERING CENTRE): ...................................................... 2
PLAN BLEU: ........................................................................................................................................ 2
MEDCITIES: ........................................................................................................................................ 2
CHAPTER I DYNAMICS OF URBAN DEVELOPMENT, CAR OWNERSHIP AND MOBILITY ........ 10
1. URBAN DEVELOPMENT IN THE MEDITERRANEAN REGION ..................................................................... 10
1.1. STRONG URBANISATION DYNAMIC IN SOUTHERN RIM COUNTRIES ................................................. 10
1.2. METROPOLISATION DYNAMIC AROUND THE MEDITERRANEAN RIM ............................................... 12
1.3. STRONG ECONOMIC GROWTH .................................................................................................. 13
1.4. CAR OWNERSHIP ON THE RISE .................................................................................................. 15
2. TRANSFORMATION OF PERSONAL MOBILITY ....................................................................................... 17
2.1. A DECLINE IN WALKING ........................................................................................................... 18
2.2. PUBLIC TRANSPORT IN CRISIS ................................................................................................... 18
2.3. OWNER-DRIVER TRANSPORT ON THE RISE ................................................................................. 18
3. GROWTH IN GOODS TRAFFIC ........................................................................................................... 19
4. CONSEQUENCES OF CAR OWNERSHIP ................................................................................................ 19
4.1. CONGESTION: A SYMPTOM OF RAPID RISE IN NUMBER OF CARS .................................................... 19
4.2. ROAD SAFETY ........................................................................................................................ 20
4.3. ENVIRONMENTAL IMPACTS ..................................................................................................... 22
5. NEED FOR TRANSPORT POLICIES TO REDUCE CAR DEPENDENCY AND ITS CONSEQUENCES ........................... 22
CHAPTER II GOVERNANCE AND PLANNING FOR SUSTAINABLE MOBILITY ......................... 24
1. GOVERNANCE MODELS APPARENTLY UNABLE TO MEET THE REQUIREMENTS OF SUSTAINABLE URBAN
MANAGEMENT ...................................................................................................................................... 25
1.1. GOVERNANCE TO PROMOTE SUSTAINABLE URBAN TRAVEL, AND AUTHORITIES TO LEAD URBAN
TRANSPORT POLICIES .......................................................................................................................... 25
1.2. LONG-TERM FUNDING TO ENSURE PROPER OPERATION OF SUSTAINABLE URBAN TRANSPORT POLICIES 26
2. DEFINING PLANNING AND OBJECTIVES .............................................................................................. 30
2.1. CHANGES NEEDED IN URBAN MOBILITY PLANNING ...................................................................... 31
2.2. CITIZEN PARTICIPATION: INVOLVING THE PUBLIC IN THE DESIGN AND IMPLEMENTATION OF URBAN
TRANSPORT POLICIES .......................................................................................................................... 31
CONTENTS
8
2.3. GENERAL COMMUNICATION TO THE PUBLIC TO RAISE AWARENESS ON SUSTAINABLE MOBILITY ......... 32
2.4. MONITORING PLANNING DOCUMENTS ...................................................................................... 34
3. GUIDELINES FOR URBAN STRATEGIES ................................................................................................ 35
3.1. THE ROLE OF MASS TRANSPORT PROJECTS IN MOBILITY PLANNING ................................................ 35
3.2. OPTIONS FOR URBAN MOBILITY PLANS ...................................................................................... 36
4. TOOL KIT ...................................................................................................................................... 37
CHAPTER III HOW TO ORGANISE AND MANAGE TRANSPORT SYSTEMS ............................. 40
1. THE REGULATION OF CAR USE .......................................................................................................... 40
1.1. TIERED ROAD NETWORK BASED ON FUNCTIONALITIES .................................................................. 40
1.2. PARKING POLICY ADAPTED TO TYPES OF USE .............................................................................. 41
1.3. TRAFFIC RESTRICTIONS IN THE CITY-CENTRE TO ENCOURAGE USE OF OTHER MODES ......................... 41
2. MORE EFFICIENT PUBLIC TRANSPORT ................................................................................................ 42
2.1. TIERED COVERAGE OF THE TRANSPORT SYSTEM .......................................................................... 42
2.2. AN INTEGRATED OFFER THROUGH PRICING POLICY, INFORMATION AND TRANSIT HUBS .................... 42
2.3. INTEGRATION OF OWNER-DRIVER TRANSPORT IN THE MULTIMODAL MIX ....................................... 43
3. PROMOTION OF WALKING AND CYCLING ........................................................................................... 44
4. ORGANISATION OF URBAN LOGISTICS ............................................................................................... 45
5. TOOL KIT ...................................................................................................................................... 47
PART TWO: FEEDBACK
AMMAN : TRANSPORT AND MOBILITY PLANNING .................................................................................. 50
ALEPPO: URBAN MOBILITY PLANNING PROJECT .................................................................................... 54
ATHENS: RESTRUCTURING THE TRANSPORT NETWORK FOR THE OLYMPIC GAMES ........................................ 59
DAMASCUS : PROVIDING SAFE AND EASY ACCESS TO THE MEDINA ............................................................ 66
ESKISEHIR : REDUCING TRAFFIC AND DEVELOPING ALTERNATIVES IN A CONSTRICTED CITY CENTER .................. 71
FERRARA: A COMPREHENSIVE POLICY TO PROMOTE CYCLING ................................................................... 75
ISTANBUL: URBAN PLANNING IN A MEGACITY ....................................................................................... 80
IZMIR: AN EFFICIENT, INTEGRATED TRANSPORT SYSTEM ......................................................................... 85
CAIRO : RENWING THE TAXI FLEET TO FIGHT AIR POLLUTION ................................................................... 91
MILAN: IMPLEMENTING AN ENVIRONMENTAL URBAN TOLL SCHEME ......................................................... 96
9
Part 1
CONTEXTUAL ELEMENTS

10
The demographic growth and economic development of the cities on the southern and eastern rim
of the Mediterranean are causing an explosion in mobility needs. Following the same pattern as
many northern rim countries, populations with rising incomes aspire to own their own car; indeed,
this wish is sometimes facilitated by certain public policies to promote mass car ownership.
The car population is therefore expanding strongly because of markets opening up, a limited modal
offering, more widespread access to driving licences, rising incomes in some segments of the
population, etc.
But this ownership dynamic generates congestion, road-safety and pollution phenomena counter to
the community’s common interest. It is therefore becoming necessary to develop mobility policies
that make it possible to regulate, organise and plan urban transport.
1. URBAN DEVELOPMENT IN THE MEDITERRANEAN REGION
1.1. STRONG URBANISATION DYNAMIC IN SOUTHERN RIM COUNTRIES
Although some southern and eastern rim countries have urbanisation rates similar to those of
countries in the southern European Union, the urban transition is not complete in most countries. On
the one hand, there is often high demographic growth in urban areas; and in some countries, such as
Egypt, Syria and Morocco, the urbanisation rate is still very low.
Figure 1 - Annual rate of urban population growth (UN data).
CHAPTER I DYNAMICS OF URBAN DEVELOPMENT, CAR OWNERSHIP AND MOBILITY
11
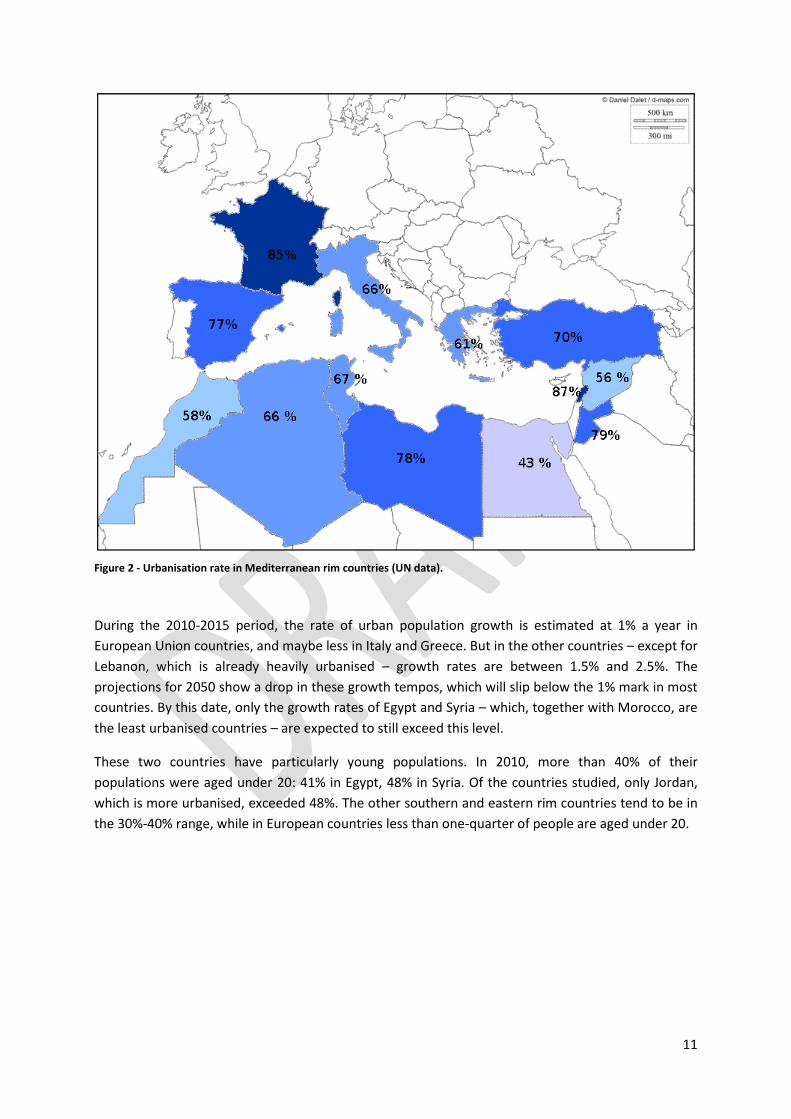
Figure 2 - Urbanisation rate in Mediterranean rim countries (UN data).
During the 2010-2015 period, the rate of urban population growth is estimated at 1% a year in
European Union countries, and maybe less in Italy and Greece. But in the other countries – except for
Lebanon, which is already heavily urbanised – growth rates are between 1.5% and 2.5%. The
projections for 2050 show a drop in these growth tempos, which will slip below the 1% mark in most
countries. By this date, only the growth rates of Egypt and Syria – which, together with Morocco, are
the least urbanised countries – are expected to still exceed this level.
These two countries have particularly young populations. In 2010, more than 40% of their
populations were aged under 20: 41% in Egypt, 48% in Syria. Of the countries studied, only Jordan,
which is more urbanised, exceeded 48%. The other southern and eastern rim countries tend to be in
the 30%-40% range, while in European countries less than one-quarter of people are aged under 20.

12
Figure 3 - Percentage of urban population and forecast in 2009 (UN data).
Between 2000 and 2050, the number of urban inhabitants in most southern and eastern rim
countries is expected to double, and even triple in the cases of Egypt and Syria. Whereas the
northern rim cities will total 170 million people, the urban population on the other rims will be about
300 million.
1.2. METROPOLISATION DYNAMIC AROUND THE MEDITERRANEAN RIM
Urban growth in the countries on the Mediterranean’s southern and eastern rims is occurring as a
process of metropolisation. Metropolisation combines two inseparable processes: on the one hand,
conurbations are becoming part of a global network of metropolises; and on the other hand, they are
restructuring themselves and also extending their perimeter. The outskirts of large conurbations are
becoming urbanised, and thus absorbing the towns near the metropolitan centre.
This process, which is directly linked to globalisation, is characterised by the rising influence of the
largest conurbations in every country’s urban hierarchy; at the same time, these areas are enlarging
their urbanised area. The United Nations forecasts that, by 2025, there will be more than 25
metropolitan areas with a million or more inhabitants on the southern and eastern rims.
13
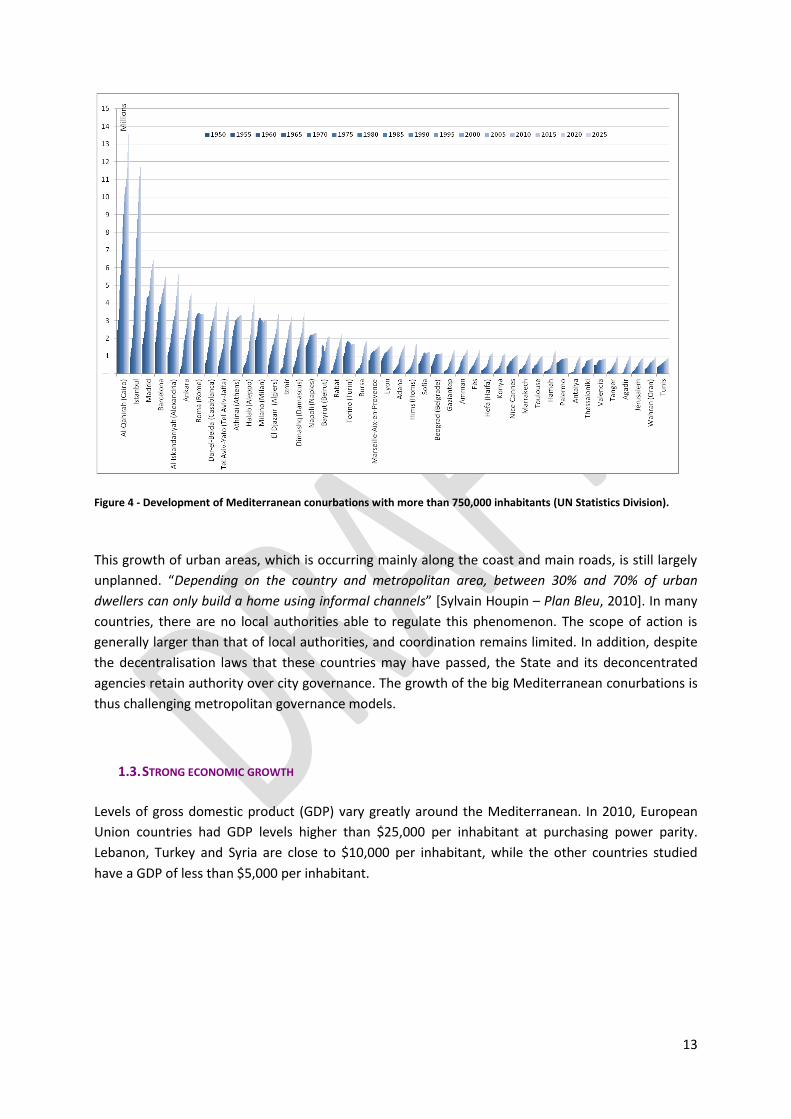
Figure 4 - Development of Mediterranean conurbations with more than 750,000 inhabitants (UN Statistics Division).
This growth of urban areas, which is occurring mainly along the coast and main roads, is still largely
unplanned. “Depending on the country and metropolitan area, between 30% and 70% of urban
dwellers can only build a home using informal channels” [Sylvain Houpin – Plan Bleu, 2010]. In many
countries, there are no local authorities able to regulate this phenomenon. The scope of action is
generally larger than that of local authorities, and coordination remains limited. In addition, despite
the decentralisation laws that these countries may have passed, the State and its deconcentrated
agencies retain authority over city governance. The growth of the big Mediterranean conurbations is
thus challenging metropolitan governance models.
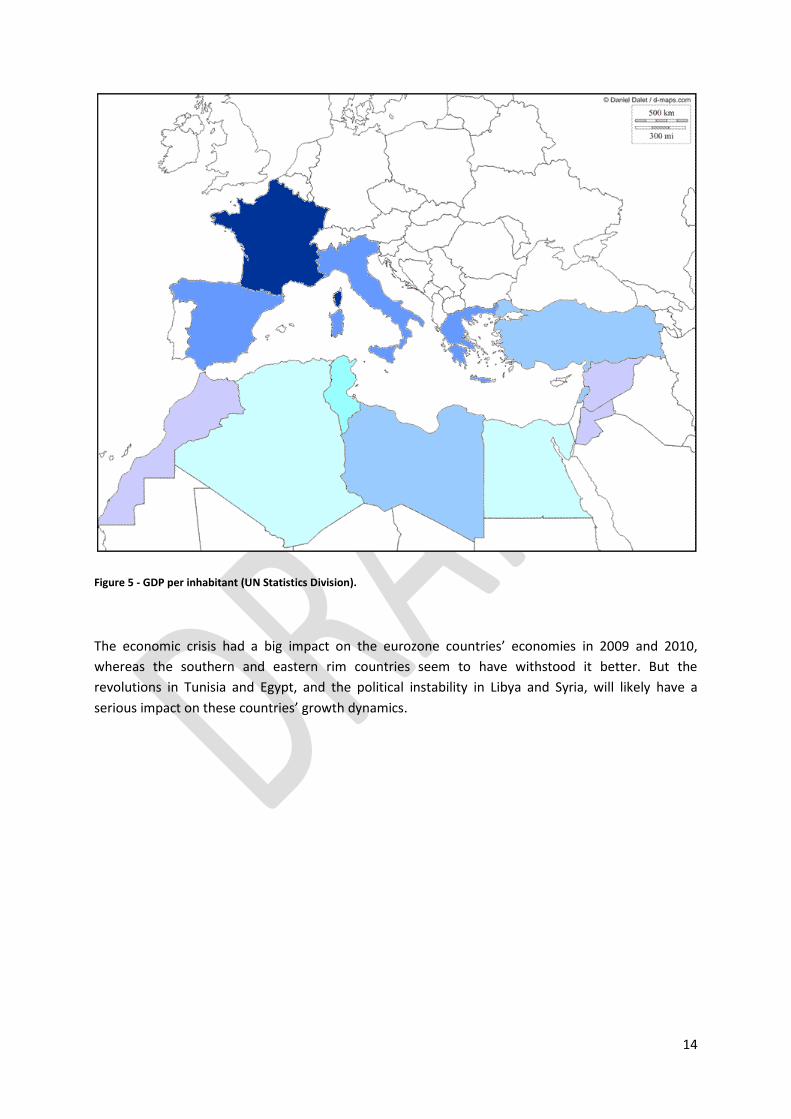
1.3. STRONG ECONOMIC GROWTH
Levels of gross domestic product (GDP) vary greatly around the Mediterranean. In 2010, European
Union countries had GDP levels higher than $25,000 per inhabitant at purchasing power parity.
Lebanon, Turkey and Syria are close to $10,000 per inhabitant, while the other countries studied
have a GDP of less than $5,000 per inhabitant.
14
Figure 5 - GDP per inhabitant (UN Statistics Division).
The economic crisis had a big impact on the eurozone countries’ economies in 2009 and 2010,
whereas the southern and eastern rim countries seem to have withstood it better. But the
revolutions in Tunisia and Egypt, and the political instability in Libya and Syria, will likely have a
serious impact on these countries’ growth dynamics.

15
Figure 6 – GDP per inhabitant (UN Statistics Division).
1.4. CAR OWNERSHIP ON THE RISE
Road construction is commonly viewed as a development driver. On the one hand, it helps to open
up areas, and offers new economic opportunities by improving accessibility. On the other hand, it is
viewed as an economic growth engine because of its weight in terms of investment and
consumption.
In many countries, there are political initiatives to support consumption (and therefore economic
growth) by promoting the acquisition of consumer durables (access to credit, control of fuel prices,
etc.). One example is the “cars for the people” programmes launched in Tunisia and Morocco in the
1990s.
The correlation between GDP per inhabitant and car ownership is shown in the graph below. The
issue of economic development in southern and eastern Mediterranean rim countries prompts a
question about this dynamic: will they catch up with the European Union countries?

16
Figure 7 - Car ownership and GDP per inhabitant (UN data, 2009).
Fuel prices play an important role in car ownership growth. Several countries in the region are oil
producers: Algeria, Libya, Egypt and Syria. They keep prices low, which encourages the use of
motorised vehicles. Some importing countries, meanwhile, can actually subsidise fuel prices to
reduce the impact of rising international prices on purchasing power.
Figure 8 – Fuel prices in the Mediterranean region (source: http://gasoline-germany.com, 2011 data).

17
On this subject, Turkey’s policy is worth emphasising. Its pump prices are the highest in the region,
but the level of taxation, which is higher than in European Union countries, does not seem to be
impairing the country’s economic impetus. This policy decision automatically makes alternative
modes more attractive. It is probably a factor in explaining why Turkey sits below the GDP-car
ownership correlation curve shown above (figure 7).
Figure 9 - Car ownership in Mediterranean countries in 2009.
2. TRANSFORMATION OF PERSONAL MOBILITY
Demographic growth, urban development and economic growth generate a big rise in the number of
urban journeys. In developing cities, each person makes 0.6-1.2 journeys a day. This is a particularly
low level compared to European cities, where the average is more than three. Too few studies are
being conducted in southern and eastern rim conurbations to be able to assess the trends, but the
economic outlook suggests an increase in reasons to travel. Furthermore, car ownership and
expanding public transport service are creating more opportunities.
In addition, the metropolisation dynamic is producing a delinkage of employment and living areas,
which is significantly lengthening journey distances. This phenomenon is giving an advantage to
flexible, motorised transport modes. Cars and minibuses are thus establishing themselves in the new
urban configurations.

18
2.1. A DECLINE IN WALKING
In all southern and eastern rim cities, walking is still the dominant travel mode among urban
populations. Its modal share is 30%-50% depending on the conurbation. However, it is being hit hard
by motorisation. Firstly, pedestrian accessibility is being reduced by increasing journey distances
caused by metropolisation. Secondly, active modes are often overlooked by the public authorities in
charge of urban transport. Newly-built routes rarely have secure crossings, and few crossroads give
pedestrians right of way.
Pedestrians are therefore simply left to adapt to motorised vehicle flows – at their own risk. The
concentrated flows in built-up areas increase the risk of road accidents. The most common casualties
are people with the lowest incomes, who travel long distances on foot to save money.
2.2. PUBLIC TRANSPORT IN CRISIS
In many Mediterranean cities, the quality of urban public transport is not high enough to attract city
dwellers. The institutional public transport systems are unable to meet mobility demand that is far
more dispersed, owing to urban expansion and fragmentation. On some routes, public transport
capacity is becoming inadequate because of demographic growth. Overcrowded vehicles are
reducing the appeal of networks that are typically used by travellers with no alternative.
In peripheral areas, public transport cannot develop a sufficiently flexible offering to meet residents’
needs. In addition, buses are the mode hit hardest by congestion. Stuck in traffic, they can offer no
guarantee in terms of journey time or frequency of service. In this context, bus companies’ finances
are constantly worsening. Some of them, unable to manage the change, have simply closed down.
Public transport therefore has a negative image, and its use is limited to captive populations.
2.3. OWNER-DRIVER TRANSPORT ON THE RISE
The deficient public transport service and “spontaneous” urbanisation observed on the outskirts of
southern and eastern rim cities have fostered the development of owner-driver collective transport.
According to Xavier Godard, “Owner-driver transport refers to the operation of public transport on an
individual vehicle scale, with fragmented ownership, i.e. shared between numerous owners.
Operation can adhere to collective rules of varying restrictiveness, drawn up by trade bodies. There
may be a certain concentration of ownership, so that the core of the definition must be based on the
modalities of operation of the vehicles, responsibility for which is largely assigned to the driver, who
thus appears as a field manager in the many cases where the driver is not the owner.”
This private-sector transport mode is typically run with low-capacity vehicles: cars used as individual taxis, motorbike taxis (1-2 seats), tricycles (3-8 seats), collective taxis (4-6 seats), microbuses (9-15 seats), minibuses (16-25 seats), midibuses (25-45 seats).
19
However, given the number of vehicles involved, this mode represents a very large offering in developing conurbations. It meets the mobility needs of people who cannot afford to buy a vehicle. In some cities, it provides more than 50% of motorised journeys. Owner-driver transport is defined mainly by the mode of operation of the vehicles for which the driver is assigned responsibility. Vehicle ownership is often fragmented, whereas coordination between drivers can be handled through trade bodies.3
For cities, this activity is a key socio-economic sector. But it contributes to rising traffic and to congestion. These vehicles, which are often decrepit, also produce a substantial share of pollutant emissions.
3. GROWTH IN GOODS TRAFFIC
Economic development mechanically generates the movement of goods, which is part of a logistics chain comprising operations that vary in number and in degree of codification: transfer of information, stock management, product packaging, transport from A to B, consolidation and splitting, removal of residual waste, etc.
The motorisation of goods transport contributes to economic growth, but the urban environment constrains journeys and causes congestion and pollution problems. According to Daniel Boudouin, Director Jonction / CRET-LOG,4 “vehicles that carry goods (including privately-owned vehicles) represent about 20% of road occupancy”. Any increase in constraints boosts this proportion, and weakens shops in old city centres.
In total, activities related to goods movement account for 6%-8% of jobs. These are a big factor in urban vitality, and a quarter of them are linked directly to serving dense areas.
Traffic due to goods transport is a major issue for Mediterranean cities. In most large conurbations, port activity heightens the challenge of organising urban logistics, particularly in historic centres. Any flow organisation scheme must take account of goods transport.
4. CONSEQUENCES OF CAR OWNERSHIP
4.1. CONGESTION: A SYMPTOM OF RAPID RISE IN NUMBER OF CARS
Growth in the motorised vehicle population very quickly generates congestion phenomena.
Congestion is a symptom of the mismatch between road supply and road use. The urgent response is
generally to build new infrastructure that relieves the saturated routes for a time. But these, in turn,
soon suffer traffic jams.
As shown in the graph below, high car density is not the only cause of chronic congestion. Of the
featured cities, Barcelona has a car density six times higher than in Algiers or Istanbul, but its traffic
jams are not six times worse.
3 Xavier Godard (2008).
4 Daniel Boudouin, Director of Jonction / CRET-LOG, “Quelle prise en compte de la question de la logistique
urbaine ?” (Taking account of urban logistics issues), Marseille workshop.

20
Figure 10 – Car density: comparison of seven Mediterranean cities
Congestion results from inefficient road management, which can have multiple causes: a poorly-
structured street network, which produces bottlenecks; poor management of car traffic; poorly
organised road sharing between modes; drivers who do not respect traffic laws; an absence of traffic
laws; owner-driver taxis that stop in a chaotic manner; poor accident management, etc.
Some large conurbations are seeing a double digit rate of vehicle population growth. At national
level, in the period 2005-2010, every country in the south and east of the Mediterranean region saw
its car population grow by more than 6% a year; in Syria, the growth rate was actually 16%. The
soaring number of vehicles on the roads requires traffic organisation and a wider management of
mobility.
4.2. ROAD SAFETY
The graph below presents the road safety data collected by the United Nations. It shows that the
southern and eastern rim countries which have the lowest rates of car ownership, have the highest
rates of fatal accidents relative to vehicles on the roads. On this point it is noteworthy that, in
European countries, alcohol consumption plays an important role in fatal accidents (in 27% of cases
in France); this is not the case in the southern and eastern rim countries.
Other factors are therefore implicated: speed, traffic organisation, compliance with the highway
code, and wearing a helmet on two-wheeled vehicles and a safety belt in other vehicles.

21
Figure 11 – Accident rate and motorisation rate (2007 data: “UN Global Overview on Road Safety”).
The most vulnerable street users, i.e. pedestrians and riders of bikes (motorised or not) are the main
casualties of accidents. “The absence of appropriate infrastructure for these users, and non-
compliance with traffic laws by drivers as much as by pedestrians and riders of two-wheeled vehicles,
are among the most significant factors” (CODATU and partners, 2008).5
Non-compliance by unmotorised street users establishes a vicious circle: people take their car to
travel safely, thus increasing traffic and reducing road safety, which prompts more and more people
to take their car.
Safe travel is a major concern that cannot be neglected.6 It is one of the major components of a
sustainable mobility policy: continuous secure infrastructure for active modes promotes a preference
for them in a context of modal choice. Choosing public transport is also made easier by creating
routes to stops and stations, where travellers’ waiting areas must also be safe.
In addition, for the community, a lack of safety entails:
- An economic cost: medical costs (healthcare-transport and first-aid service, cost of care,
funeral costs, etc.); material costs (damage to vehicles, damage to the public domain,
material damage, etc.), additional fuel costs, policing and judicial costs, loss of current or
future production by those killed or incapacitated, loss of productivity, etc.
- An environmental cost: damage to the environment, pollution due to traffic congestion
following an accident.
- A time cost: dealing with an accident can slow or stop road traffic or dedicated-lane mass 5 CODATU, French Ministry of Ecology, The World Bank, KNA-MENA, MedCities: “Les déplacements urbains en
Méditerranée. Guide de Recommandations. Travaux issus du Séminaire Régional sur les Déplacements Urbains en Méditerranée – Skhirat, janvier 2008” (Urban Transport in the Mediterranean Region. Guidance and Recommendations. Product of the Regional Seminar on Urban Transport in the Mediterranean Region – Skhirat,
January 2008) 6
The various costs due to poor road safety come from: http://www.val-de-marne.equipement.gouv.fr/IMG/pdf/cout_SR_cle2193cd.pdf

22
transport (congestion, impaired service, claims to be processed by the relevant authorities,
etc.).
- A social cost: emotional distress, loss of household income, unemployment, etc.
Simple solutions can be implemented to improve safety. The first is to reduce traffic speed (the
speed limit in built-up areas is 60 km/h in Morocco and Egypt; and 50 km/h in the other countries).
Next, part of the public space must be dedicated to pedestrians by creating pavements; but also to
cyclists, by developing a network of bike lanes. Lastly, traffic management requires giving pedestrians
right of way over other transport modes, which makes all traffic flows smoother.
4.3. ENVIRONMENTAL IMPACTS
The spatial conditions of the Mediterranean region present a set of factors that favour ozone
formation (land relief, hot dry climate, proximity to desert, calm anticyclonic weather liable to create
a pollution dome, etc.) and aggravate local pollution.
Over the long term, numerous health problems may arise in populations not previously considered
fragile (onset of allergies, increase in incidence of asthma, etc.) and may aggravate problems in
already fragile populations: hospitalisation for respiratory and cardiovascular causes, bronchitis,
asthma attacks, etc. The impacts on health increase according to pollutant concentrations and
exposure time. However, awareness of the health issues related to air quality and the concentration
of fine particulate – emitted by fossile fuel engines – is still limited in southern and eastern rim cities.
The decrepit car, bus and collective-taxi fleets in Mediterranean cities are aggravating factors in
pollutant emissions. Improvements are being observed through the gradual replacement of vehicle
fleets, notably through the adoption of strict standards (examples: Istanbul has adopted the
European EURO emission standards; Cairo is encouraging taxis to run on natural gas; Algeria’s buses
are slowly switching to LPG, etc.). Nevertheless, technological progress cannot be the only lever used
in public policies to reduce pollution caused by urban transport.
Besides local pollution, fuel consumption contributes to climate disruption. To date, only the
industrialised countries have committed to reductions as part of the international climate
agreements. But this issue is increasingly topical for decision-makers and funding agencies. In many
countries, transport is becoming one of the most worrying sectors, and the expected impacts in the
Mediterranean region should be a wake-up call for populations and public authorities.
But cities are faced with a lack of available data on greenhouse gas emissions. If the data exist, they
often do not cover the entire relevant area; nor are they produced regularly. It has been noted that
local practitioners typically lack the core elements of knowledge when designing and evaluating
sector-specific plans and programmes.
5. NEED FOR TRANSPORT POLICIES TO REDUCE CAR DEPENDENCY AND ITS CONSEQUENCES

23
As explained by Marc Le Tourneur during the Marseille workshop,7 from the 1950s to the 1970s
there were attempts to adapt European cities to the private car, with heavy investment in the name
of progress and economic development (urban motorways through the city centre, ring roads, car
parks, etc.). Deteriorated public transport systems were “abandoned” in favour of cars; others were
removed by vast closure and dismantling operations. In France and Spain, practically all tramway
networks had disappeared by the end of the 1970s; only a few big Italian cities have kept theirs.
Since the 1980s the same cities, which had abandoned their public systems, have been reversing
their decisions and redesigning their urban fabric to incorporate high-capacity lines (tramways, Bus
Rapid Transit) and infrastructure for eco-friendly modes, again with heavy investment. Sustainable
development policies are continuing this trend, by giving ever greater space to unmotorised modes
and public transport, while regulating car use as best possible, particularly in urban centres, where
mobility policies often mesh with those for heritage conservation. These policies are slowly bearing
fruit in conurbations, especially in those that initiated this shift in direction.
As in the recent history of northern rim conurbations, the motorisation dynamic could trap southern
and eastern rim cities in a vicious circle of car dependence: the city is structured through the dynamic
of mass motorisation; the urban area becomes dispersed and areas undergo pro-car development;
the appeal of public transport and active modes is reduced.
Conversely, sustainable mobility policies aim to permit efficient urban organisation and a certain
balance in the use of travel modes. These policies make it possible to structure the city around
sustainable transport modes and to regulate car traffic. From an economic perspective, the challenge
for developing cities is to optimise their investments in the coming decades by avoiding a phase of
excessive motorisation as seen in Europe.
Northern rim cities have long since been applying mobility policies that are now of interest to their
southern counterparts. Cultural and geographic proximity in the Mediterranean region must facilitate
the transfer of knowledge, so that southern cities can develop their own sustainable mobility
approach. Furthermore, some experiments by southern cities demonstrate the feasibility of
implementing a transport policy tailored to local contexts.
7 Marc Le Tourneur: “Évolution des transports urbains dans le cœurs des villes françaises des années 1950 à nos
jours”, (Development of urban transport in French city centres from the 1950s to the present day). 2010.
24
Public policies on mobility thus raise many questions touch on all the challenges of sustainable
development: how can cities be made more accessible and less congested? How can pollutant
emissions and pressure on natural resources be reduced? How can public health and quality of life be
protected? How can social-cohesion questions be taken into account? How can public space be
improved?
But before seeking answers, it is necessary to define the conditions under which urban mobility can
be properly governed. Which is the competent authority for governing urban travel, and what
therefore is the correct scope of public action? What travel modes are involved, and what relations
should be maintained with the multitude of stakeholders? What resources are made available and
what powers should the authority possess, particularly in the field of town planning?
The success of Mediterranean countries’ urban mobility policies depends on the governance models
thus put in place to meet the challenges of sustainable urban development.
The strategic planning approach that combines long term outlook and medium term objectives
presupposes the existence of a recognised institutional entity to lead it. Moreover, coordination is
required between the territorial tiers (city, conurbation, region) to ensure effective transport
planning in accordance with local remits. Big public transport projects are essential in the
implementation of planning. However, their development must be aligned with the urban
development strategy and fit into a comprehensive scheme to develop the public transport system.
CHAPTER II GOVERNANCE AND PLANNING FOR SUSTAINABLE MOBILITY
25
1. GOVERNANCE MODELS APPARENTLY UNABLE TO MEET THE REQUIREMENTS OF SUSTAINABLE URBAN
MANAGEMENT
The governance models of southern and eastern rim cities and their urban area, like some on the
northern rim, do not always seem able to meet the requirements for managing sustainable urban
mobility. In many conurbations, there is no institution able to execute a transport policy that makes
it possible to plan the development of a transport system and to organise metropolitan-scale travel.
The explanatory factors, which vary from case to case, are:
Central government intervention is still too high in Mediterranean cities, despite a gradual
process of decentralisation.
The administrative organisation is disconnected from how the area actually operates.
There is a multiplicity of public or private institutions whose remits sometimes overlap,
resulting in poor regulation of the sector. This generates conflicts beween professional
cultures, leading to divergences in intervention and competition strategies.
A lack of inter-municipality cooperation to form a metropolitan political unit, although urban
sprawl overreaches the boundaries of the central municipality.
Coordination bodies with no or inadequate powers to exercise their authority.
In some instances, no urban transport perimeter.
Transport infrastructure is dominated by operational and technical approaches on a micro-
local scale, and not by a territory-wide and pro-integration approach to promote sustainable
urban management.
Most Mediterranean conurbations need to set up an urban transport authority. In the region’s cities,
urban transport clearly needs to be organised and regulated.
1.1. GOVERNANCE TO PROMOTE SUSTAINABLE URBAN TRAVEL, AND AUTHORITIES TO LEAD URBAN TRANSPORT
POLICIES
Restructuring existing governance models and/or creating a new transport authority may prove
difficult and encounter a number of serious political, institutional or judicial obstacles. “Decision-
makers must consider many questions if they wish to create an effective transport authority with a
well-defined mission that is compatible with the local historical and socio-economic context of the
city, region or country in question,” says Mohamed Mezghani (UITP).8 “Autonomy is a prerequisite for
the effective handling of local or regional problems, and is obtained through a sufficient degree of
decentralisation. The transfer of powers and responsibilities in local or regional matters from central
government to local or regional authorities will promote understanding and assimilation of the
situation, while instilling a sense of responsibility in local or regional stakeholders, who are naturally
the most concerned with mobility in their area. At the local level, it is important to endow the
transport authority with the requisite autonomy and power to protect it against major political and
structural shifts, and to perpetuate it.”
8 Mohamed Mezghani (UITP): “Quelles autorités pour porter les politiques de transports urbains ?” (Defining
authorities to lead urban transport policies). 2011.

26
According to Safak Hengirmen (SUMPA-MED) and Bernard Cornut (ADEME),9 having a transport
authority make it possible to:
Develop a comprehensive long-term vision of mobility.
Conduct metropolitan-scale planning that reaches beyond basic administrative boundaries.
Coordinate actions between the various administrative levels.
Develop an integrated transport system or the coordination of bus, tram, metro, rail service,
etc. to permit fare integration and multimodal information.
Implement an appropriate parking policy.
Develop balanced service across the metropolitan area.
Create a linkage between travel policy and urban development policy.
Develop legitimate project ownership, with sufficient and long-term financial resources to
achieve a good level of technical expertise in-house and to enjoy authoritative status in the
eyes of private partners.
The diagram below shows the various transport related issues. All of these different responsibilities
can be assigned to a transport authority. A public authority can thus be set up simply to regulate
public transport service; this can be extended to the coordination of the entire metropolitan-scale
service. But this institution can also be given a role in managing all mobility; and, beyond that, the
function of planning mobility and creating the linkage with urban development policy.
Figure 12 – Areas of responsibility for transport authorities (Mohamed Mezghani - UITP).10
Some countries have recently set up institutions to govern urban mobility. In Lebanon, several
parliamentary bills have been drafted with a view to creating a national transport authority, with
branches in the big conurbations. But these branches have limited and controlled autonomy. In
Jordan, a Public Transport Regulatory Commission has been set up, based on a law enacted to
organise urban and inter city transport.
1.2. LONG-TERM FUNDING TO ENSURE PROPER OPERATION OF SUSTAINABLE URBAN TRANSPORT POLICIES
9 Safak Hengirmen (SUMPA-MED) and Bernard Cornut (ADEME): “Local transport authorities in Turkey, Jordan
and Syria: situations & perspectives”. 2011. 10
Mohamed Mezghani (UITP): “Testimonials from International Association of Public Transport (UITP)”. 2011.

27
A transport authority must have substantial resources to acquire a good level of expertise in order to
plan transport policy, coordinate stakeholders and govern transport systems.
A public transport system requires substantial investment to meet demand for travel (investment
policy) and sufficient financial capability to fund the operation, maintenance and replacement of
infrastructure and rolling stock. It is therefore essential to guarantee a long term funding model.
According to Rami Semaan (LEB),11 a lack of allocated resources leads to a chronic funding imbalance
that favours individual modes and to a lack of investment in long-term structural projects.
Also, in the cities of the southern and eastern Mediterranean rim, fare revenue does not cover the
operating costs of public transport operators. This operating deficit is due primarily to inappropriate
pricing, coupled with business sectors making no financial contribution, and to inefficient
management. Subsidies typically serve to balance operating budgets, but they are presented as social
spending, which reinforces the negative image of public transport. Lastly, private operators run the
profitable lines, thus further complicating the development of a metropolitan-scale “network” logic.
The example of the northern rim countries gives the public authorities the role of an essential
contributor in funding urban public transport. But this funding, through a tax on households and
businesses, must not be the only financial resource for transport authorities. Mateu Turro
(Polytechnic University of Catalonia) and Géraldine Bonnet (CERTU)12 have proposed various funding
options for Mediterranean transport authorities. For more details, please refer to the CODATU
publication.13
Firstly, the contribution paid by public transport users is essential in funding the system. This means
having a pricing policy that can incorporate a social dimension (with reductions for low-income
households, the disabled, the elderly, students, large families, etc.), and a commercial dimension (to
attract new customers by its quality of service and by developing the service, etc.). To be effective,
the pricing policy must be coupled with a fight against ticket fraud. The examples of certain Latin
American cities presented by Jorge Rebelo of the World Bank14 show that system operating costs can
be covered solely by users’ contributions.
By soliciting employers to fund their employees’ travel, it is possible to enhance the system’s
financial accessibility. In France, companies must reimburse 50% of their staff’s public transport
passes. In Brazil, the “Vale Transporte” vouchers used in public mass transport are paid for by
companies for their lowest-paid employees (see box 1).
11
Rami Semaan (LEB): “Planification des Transports Urbains” (Urban transport planning). 2011. 12
Mateu Turro (Polytechnic University of Catalonia) and Géraldine Bonnet (CERTU): “Comment financer le transport public urbain ? Quelles nouvelles sources de financement mobiliser ?” (Urban public transport funding and deploying new sources). 2011. 13
CODATU: “Qui paie quoi en matière de transports urbains ? Guide de bonnes pratiques” (“Who pays what for urban transport? A handbook of good practices”). 2009. 14
Jorge Rebelo (World Bank): “Financing with new taxes on car use: The Latin America Experience”. 2011.

28
BOX 1: “VALE TRANSPORTE” VOUCHERS IN BRAZIL
Introduced in 1975, these vouchers are a benefit provided by employers to their poorest employees,
i.e. whose home-to-work journey costs more than 6% of their gross basic pay. There is no minimum
distance above which the employer is bound to provide the Vale Transporte. The employee’s sole
obligation is to use urban, inter-city or inter-state public transport of any form. This excludes
selective and special transport.
A recent survey by Brazil’s national federation of urban transport operators (NTU - Associação
Nacional das Empresas de Transportes Urbanos) shows that these vouchers are used to pay for 39%
of journeys on public transport. However, only 20% of the population uses them. An estimated two-
thirds of the survey respondents do not receive this support because of their precarious situation
(unemployment or informal job) or because employers are in breach of the law.
For employers, the advantages are reduced absenteeism and thus higher employee productivity; the
vouchers are not part of salary, so there is no extra tax on salary.
For employees, the advantages are guaranteed home-to-work transport that does not impact on pay;
their purchasing power is not affected by rising public transport fares; and if their Vale Transporte
smart card is stolen, damaged or lost, they can recover their credit.
Furthermore, using the public transport system can be promoted to other economic stakeholders.
Advertising (at stations and stops, and on vehicles) can generate extra revenue.
Next, public transport systems can be funded by users of individual motorised transport modes.
Introducing taxes can help contribute to the development of public-transport systems while
dissuading people from using their car. Such taxes can be based on fuel consumption (the option
adopted in Syria, where a 5% tax on fuel is devoted to funding public transport). In Asia, there are
other options: taxes on car registration and on the import, purchase and ownership of vehicles.
Another source of funding could be infrastructure or urban tolls (see the Milan example). Parking
policy can also be harnessed to fund networks. Parking revenue can amount to a significant resource
(in Montpellier, a portion of parking revenue goes to fund its public transport system). In Paris, the
regional transport authority (STIF) actually receives the revenue from parking fines.
29
BOX 2: FRANCE’S TRANSPORT TAX ON EMPLOYERS15
The Versement Transport (transport tax) was introduced in 1971 in the Paris region to fund public
transport. Two years later, it was extended to big cities elsewhere in France.
The VT is a tax based on gross wage bill, paid by public and private employers with more than nine
employees, located within an urban transport perimeter. When the taxe professionnelle, a local
business tax, was reformed, the VT became one of the main locally-levied tax resources. VT rates
vary according to a conurbation’s size and whether or not it has a project for dedicated-site public
transport (i.e. metro, tramway or bus with high level of service). Transport authorities with fewer
than 100,000 inhabitants can levy up to 1.1% of the wage bill; those with more than 100,000, up to
2.6%.
Since the VT was introduced, it has helped strong development of local public transport systems and
ensured a certain level of service quality, particularly through investment in new transport modes
and the maintaining of attractive fares. But in all big cities, it no longer suffices to cover system-
operation deficits.
Transport authorities can benefit from a rise in land values in the vicinity of public transport routes.
The simplest method is to anticipate the acquisition of land plots; the authorities can then plan these
out and have utilities installed before selling them to property developers.
The Greater Amman Municipality, for example, generates most of its resources from building-permit
fees. In addition, leasing business premises in stations can be a resource for transport authorities or
network operators. In Istanbul, the metro maintenance centre was funded by the construction of a
shopping centre. Mechanisms to levy taxes on property capital gains can also provide substantial
resources. The “Grenelle 2” law in France implemented such a mechanism.
15
Based on Christian Bourget (French Ministry of Ecology): “Le ‘modèle’ français d’organisation des transports urbains – caractéristiques et limites” (The French model of urban transport organisation: its characteristics and limitations). 2011.

30
Figure 23 – Organisation and possible funding resources
Combining several funding sources can make it possible to keep fares at an affordable level while
also developing new mass transport projects. Having a dedicated resource, as with the VT
contribution in France, is a major asset for transport policy (see box 2). The transport authority
enjoys a guaranteed level of funding, which avoids “either/or” budget decisions whose consequences
on the transport system could lead to a project being dropped or services being closed.
2. DEFINING PLANNING AND OBJECTIVES
Transport is an important component in the workings of urban areas, but not the only one. Urban planning covers environmental, economic and social issues that are wider than those related to transport alone.
A strong linkage between transport planning and urban planning is thus necessary. Transport systems shape cities’ development. Transport system performance depends on the form of cities.
Since the 2000s, “strategic planning” has appeared in developing cities. This approach is embodied, for example, in the City Development Strategies drafted by Cities Alliance to help cities define economic and urban strategies in concert with all local stakeholders.
Strategic planning enables metropolitan scale coordination of a city’s stakeholders. It seeks to set clear objectives that serve as a reference; it must ensure that these are not compromised by a profusion of contradictory local actions; and lastly, it must enable the coordination of operational projects.
“Strategic planning prefers schemes that are simply structured and comprehensible, in order to achieve a consensus on objectives and resources between public and socio-economic stakeholders. Through concrete action plans, it can then target sites and projects with the greatest possible leverage for the convergence of public and private investment. But the ‘urban projects’ approach

31
should not replace the strategic approach, which must be the true urban backbone that justifies and expresses them.”16
Although the guidelines for territorial development over a long timescale must be clearly defined, schemes must also retain some flexibility between intangible objectives and those adaptable to the current context. To do this, it is necessary to establish indicators and periodic appraisals with a view to adjusting and implementing policy documents.
With strategic planning, the challenge is to create a linkage between the political project, strategy and its execution, not forgetting monitoring and appraisal. It fits into a continuous process of adaptation and of ongoing consultation with all metropolitan stakeholders.
2.1. CHANGES NEEDED IN URBAN MOBILITY PLANNING
Given the rapid growth in the Mediterranean region, anticipating the future is a crucial challenge. Although there are planning initiatives in most large conurbations, they have often been conducted without incorporating financial constraints, and are therefore projected over the long term.
Within the scope of strategic planning, the objective is to articulate long term planning: this is necessary to align actions requiring long term investment with actions executed over shorter timeframes of 5-10 years, whose funding is assured.
Urban planning in North Africa differs from country to country; mobility plans are not always coordinated with urban planning schemes: in Algeria, planning is led by the central government, with various plans and schemes depending on territorial scale. In Tunisia, power is more decentralised; there are urban transport plans, urban planning regulations and strategic projects. In Morocco, regional schemes co-exist with Wilayah (province) master plans, strategic projects, urban planning regulations and transport plans.
According to Éric Huybrechts, planning in Mediterranean cities is evolving from emergency planning to integrated planning of transport, as per the following typology:
“Emergency” planning to resolve a “crisis”, with spontaneous construction of transport infrastructure at the risk of creating urban disconnects.
“Catch-up” planning with major infrastructure driven by land development opportunities and existing infrastructure.
Anticipatory planning (urban extensions and transformations) with transport planning that guides urbanisation (densification, centrality, urban extensions).
Integrated and participative planning, with a process of drawing up urban mobility plans that incorporates the promotion of active modes, parking, a tiered road system and management, public transport, pricing and intermodality, goods transport and delivery, road safety, and mobility management.
2.2. CITIZEN PARTICIPATION: INVOLVING THE PUBLIC IN THE DESIGN AND IMPLEMENTATION OF URBAN
TRANSPORT POLICIES
What is the current state of citizen participation in developing and executing urban mobility policies
and projects? How can the public be involved? What kind of communication is required? (based on
16
http://www.fnau.org/file/news/FNAUfran%C3%A7aiscomplet.pdf

32
questions by Thierry Gouin, CERTU).17
To quote Jean-Charles Crochet (World Bank),18 “experience shows that consulting the general public
and involving them in the design and implementation of urban mobility policies is a necessity”. This is
because, although quantitative surveys are useful in providing knowledge of current situations, such
surveys poorly address the qualitative dimension of urban travel. City dwellers, who deal with the
reality on a daily basis, can provide knowledge that is lacking in urban mobility policies.
“Nevertheless, consultation and participation are difficult and can easily fail,” warns Crochet. This is
because there will always be divergences between situations and the various groups of the
population (retailers, residents of a neighbourhood, an association of disabled people, etc.). These
groups will seek to defend their own interests before the common interest.
Another cause of failure may arise from proponents of urban mobility projects themselves, by giving
the general public inadequate information on urban transport.
Consequently, projects and issues are most often poorly understood and assimilated: protests
against projects, complaints, criticisms, etc. It is therefore preferable to communicate on the project
cost / benefit ratio in order to raise general awareness, and on the technical analysis to provide an
overview which is more comprehensible for the public.
2.3. GENERAL COMMUNICATION TO THE PUBLIC TO RAISE AWARENESS ON SUSTAINABLE MOBILITY
Communicating after urban mobility projects have been executed is also essential to present new
arrangements (new organisation of parking, opening of green routes, new transport lines, etc.) and
to raise awareness among potential but unconvinced users.
Communication and awareness-raising can take various forms (poster campaign, workshops, etc.)
and be deployed in various locations (schools, workplaces, in the street…). Several agencies have
concluded that children assimilate messages better than adults, and can lead them to adopt best
practices.
17
Thierry Gouin (CERTU): “Citizen, taxpayer, user, customer: How to involve the people in the definition and implementation of urban transport policies?”. 2011. 18
Jean-Charles Crochet (World Bank): “Citoyen, contribuable, usager, client, opérateur: comment associer la population à l’élaboration et à la mise en oeuvre des politiques de transport urbain ?” (Citizen, taxpayer, customer, operator: how to involve the people in the definition and implementation of urban transport policies). 2011.

33
Figure 34 – Poster from the "Autopatch" campaign (STAR, Greater Roanne, ADEME)
But to ensure the public retains the message, it is advisable to raise awareness with “hard-hitting”
communication that could involve a campaign of violent images, as seen in road-safety operations, or
by light-hearted awareness-raising, as in the “Autopatch” campaign.
This campaign is inspired by the claims of nicotine-patch advertising. It “aims to humorously raise
drivers’ awareness of public transport use, and to highlight the benefits they can expect. […]
Throughout the campaign, Autopatch nurses and doctors handed out free packs of ‘Autopatch
chewing-gum’. The list of ingredients were ‘savings, serenity and ecology’, to be taken as a
supplement to the bus-based medication” (ADEME, 2011).19
BOX 3: QUITO: INFORMING CITIZENS AND INVOLVING THEM IN FUN ACTIONS TO PROMOTE
BETTER URBAN MOBILITY20
Quito, the capital of Ecuador, is located at 2,850 metres altitude and has nearly two million
inhabitants. Urban growth is based on an expansionist model, heavily influenced by the constraints
of the mountainous terrain, which means that Quito has low population density of 100 inhabitants /
hectare and a very uneven distribution of services across the conurbation.
“Three north-south BRT lines serve the city, with a feeder network of urban and inter-city buses
centred on the multimodal hubs. Despite the efforts made, […] there are difficulties achieving
accessibility for disadvantaged users in a city which, apart from its historic centre, is geared to the
needs of car users,” explains Sandra Bonilla. “It was in this context, in 2007, that the municipality
revised its Transport Master Plan, which dated from 2002. The focus now is no longer transport but
mobility. The planning process incorporates environmental and citizen-participation issues when
considering the transport of people and goods.”
Besides citizen participation via consultation, participatory management of the mobility plan, and
19
Source: http://observatoire.pcet-ademe.fr/action/fiche/49 20
Source: Sandra Bonilla, Quito Metropolitan District (DMQ).

34
participation in public debates, Quito offers its residents events on mobility alternatives to the car:
for example, the “mobility week” in 2009 or the “car-free day” in 2005, when the curious could take
part in workshops.
In addition, every Sunday the main north-south road is dedicated to eco-friendly traffic with activities
for cyclists, rollerskaters, etc. open to children and adults. These activities are supplemented by
cycling lessons for children from the age of five; courses aimed at secondary school and university
students; and home-to-work cycling caravans for employees. The objective is to encourage a modal
switch through guided practice.
These concrete actions are backed by a policy to raise public awareness through flyers, posters, etc.
2.4. MONITORING PLANNING DOCUMENTS
Once planning has been implemented, it is advisable to conduct evaluations to understand the results in relation to the stated goals. To quote Benjamin Fouchard – CETE Méditerranée,21 “Evaluation means setting goals and measuring progress towards those goals.” By monitoring the effects of a public policy, we can measure the results, judge its worth and compare forecasts with reality.
Figure 15 - "What should be evaluated?" (diagram B. Fouchard – CETE Méditerranée)
For an evaluation to be meaningful, it must be backed by reliable statistics to measure quantifiable elements. Qualitative elements should not however be neglected. To achieve this, the evaluation must be done in partnership with stakeholders. It is also important to communicate about the evaluation in order to capitalise on both the planning tool and on the evaluation process.
21
Benjamin Fouchard – CETE Méditerranée: « Évaluer pour évoluer : comment suivre et évaluer les documents de planification » (Evaluate in order to evolve: how to monitor and assess planning documents) and « Conclusions de la session » (Session conclusions). 2011
35
3. GUIDELINES FOR URBAN STRATEGIES
3.1. THE ROLE OF MASS TRANSPORT PROJECTS IN MOBILITY PLANNING
Many cities of the Mediterranean basin have launched mass transport projects to meet ever-growing
demand for mobility, to reduce congestion and improve the urban environment.
According to Alicia Casart,22 mass transport means a commitment to the quality of life; it is a tool for
urban planning and a source of pride from a technological perspective. It is also a key element in
restructuring the urban transport system. Investment in a mass transport network serves as a
catalyst for other processes of innovation and improvement (greater frequency, price integration,
new technologies, etc.). Each mode must however be adaptable to the type of demand, topography,
urban context, etc.
With a fixed budget amount, a city cannot build as many kilometres of a metro line as it can a
tramway or BRT line. Furthermore, the various modes differ in passenger capacities and operating
costs. To avoid over- or under-investment, it is important to calibrate transport supply with demand
by assessing the situation beforehand and coordinating urban development plans with the roll-out of
these transport networks.
Given their symbolic importance, these major projects weigh heavily on the political scene. But it is
important to consider them as projects within the broader framework of urban planning. Sometimes,
mass transport lines are absolutely necessary in a master plan for mobility but this may engender
significant difficulties in terms of integration and complementarity with existing networks.
Building a tram, metro or BRT line can nonetheless facilitate and accelerate the implementation of
certain measures included in the urban mobility plan, which might not have been accepted without
the mass transport project.
The mass transport line is thus part of a more comprehensive goal to link the periphery to the centre,
the urban hubs to newly developed areas (offices, housing, universities, stadiums, etc.), and to
improve the living environment by redesigning public spaces and landscaping, while reducing the
space allocated to cars.
Major transport projects contribute to preserving the city and keeping cars away from the centre,
thanks to coordinated redevelopment and planning: traffic plans, bypasses, ring roads, traffic
restrictions (reduced-speed zones, pedestrian zones, gathering points, restricted-access zones, etc.).
Frédérique Hernandez - IUAR Aix-Marseille University,23 warns that mass transport is not a virtue in
and of itself. In France, the tramway is often associated with the catchwords “modern”, “eco-
friendly”, “urban”, etc. But a mass transport network must be integrated with other projects in the
framework of comprehensive mobility planning.
22
Alicia Casart – ALG-EP: « Le point de vue du consultant: Quels besoins vis-à-vis des documents de planification pour les projets de transport de masse ? » (Consultant perspective: what is needed in planning documents for mass transit projects). 2011 23
Frédérique Hernandez – IUAR Aix-Marseille University: « Le tramway : projet de transport de masse et outil stratégique de la planification urbaine » (Tramway: mass transit project and strategy for urban planning). 2011

36
3.2. OPTIONS FOR URBAN MOBILITY PLANS
For Mediterranean cities with remarkable heritage assets, the revitalisation of city centres is a
genuine challenge. Creating a sustainable urban transport system contributes to preserving the city’s
heritage and developing the economy in that part of town. There are however certain risks. If the mix
of populations and functions is not preserved, mobility policies may produce unwanted
transformations such as the flight of people and jobs to the periphery, worsening the urban sprawl
already driven by the growth in population and car ownership. They can also be detrimental to
alternative modes of transport. The transformations include:
Gentrification: the economic and social make-up of city centres evolves in favour of higher
classes than those currently in place (rising living standards). As has already occurred in
certain cities of the northern rim, the tendancy is for the lower classes of the population in
southern and eastern-rim cities to migrate to the periphery.
Or, on the contrary, neighbourhood decay: low-quality housing becomes dominant. City
centres of the southern and eastern rim have in recent years suffered from economic and
social decline which leads to marginalisation and loss of attractiveness. This occurred in the
historic centres of northern-rim cities after WWII. Contrary to gentrification, it is the higher
classes of the population who flee from the centre.
Specialisation of activities: “museum-city” specialised in tourism, dominance of retail
activities tending towards up-scale or specialised shops and the classic trio of culture / leisure
/ restaurant businesses).
According to Patrice Berger – URBALYON,24 if a city is experiencing a spread of the urban population,
it is still possible to organise the periphery into poly-centric hubs (large secondary centres) and to
connect them to the main urban centre with one or more mass transport corridors.
Marc Le Tourneur of Greater Montpellier25 explains that the priorities of local urban mobility
planning are:
The densification of housing and essential activities along the main public transport routes, in
dedicated lanes (control urban development and give priority to transport alternatives,
rather than to the private car).
A pricing policy for parking which is advantageous for residents but discourages commuting
by car, while favouring fast rotation (in shopping areas, reduced space for cars, etc.).
The development of active modes of mobility by creating pedestrian zones in historic
centres, bike-sharing programmes (free of charge for public transport pass-holders;
attractive prices for non pass-holders, etc.), long-term bike rental for students and
companies, and guarded bike pens in car parks.
Addressing the issue of goods transport. The business activities of a city create transport
needs (urban logistics): tradesmen at work, delivery of supplies to companies, construction
sites, delivery of purchases to customers, etc. not to mention emergency vehicles
24
Patrice Berger – URBALYON: “Comment décongestionner le centre ancien ?” (Reducing congestion in historic centres). 2010 25
Marc Le Tourneur: “Les transports à Montpellier : planification et cadre institutionnel” (Transport in Montpellier : planning and institutional framework). 2010
37
(ambulances, fire engines, police, utilities) and trash collection.
Organising urban logistics is a huge challenge for cities due to the large number of stakeholders in
the private sector (transporters, warehouses, industries, retailers, etc.), public sector (elected
officials, agents, police, chamber of commerce and trades, etc.), as well as local residents affected by
deliveries (availability of goods, home deliveries, noise, etc.).
4. TOOL KIT
To conclude this section on urban governance and transport planning, we propose a method to help
decision-makers in southern-rim cities to adapt these policies to their territory. The two diagrams
below and the list of key questions can help them in the preparation of their transport policy.
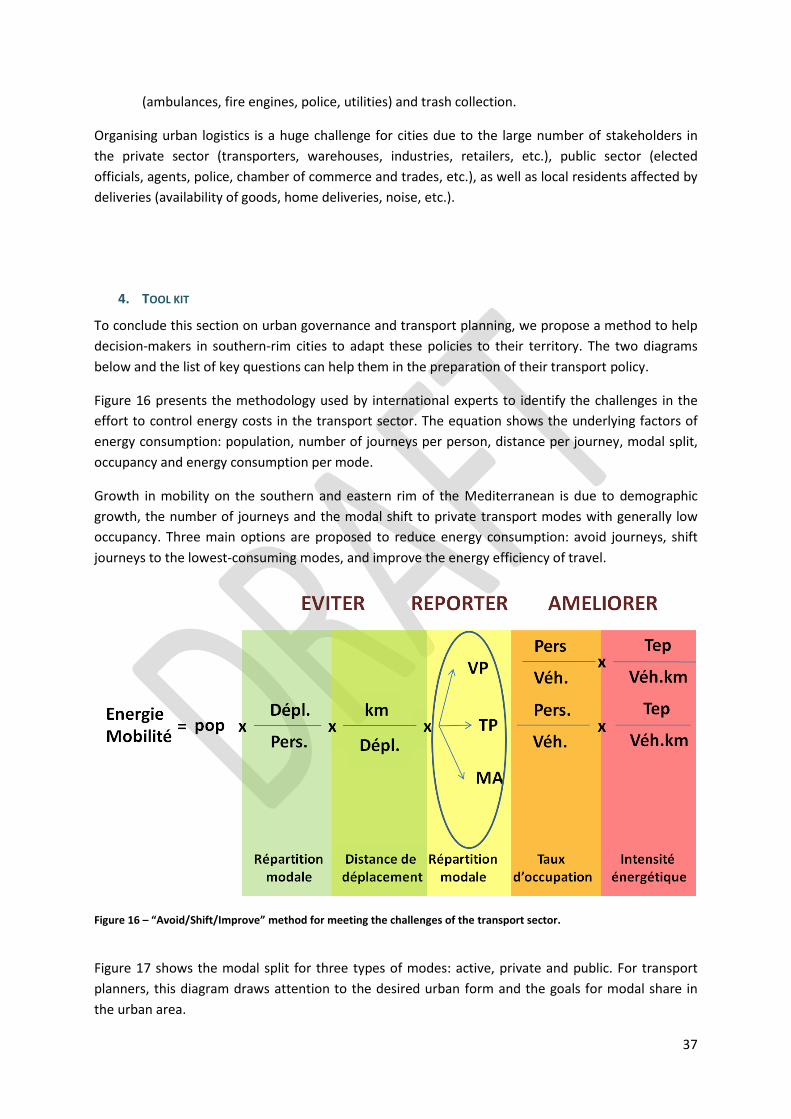
Figure 16 presents the methodology used by international experts to identify the challenges in the
effort to control energy costs in the transport sector. The equation shows the underlying factors of
energy consumption: population, number of journeys per person, distance per journey, modal split,
occupancy and energy consumption per mode.
Growth in mobility on the southern and eastern rim of the Mediterranean is due to demographic
growth, the number of journeys and the modal shift to private transport modes with generally low
occupancy. Three main options are proposed to reduce energy consumption: avoid journeys, shift
journeys to the lowest-consuming modes, and improve the energy efficiency of travel.
Figure 16 – “Avoid/Shift/Improve” method for meeting the challenges of the transport sector.
Figure 17 shows the modal split for three types of modes: active, private and public. For transport
planners, this diagram draws attention to the desired urban form and the goals for modal share in
the urban area.

38
Figure 17 – Urban form according to modal share (M. Replogle, 1992)
In addition, we suggest this list of questions to help those in charge of transport to evaluate the
situation in their territory in view of developing areas for action.
KEY QUESTIONS ON GOVERNANCE AND TRANSPORT PLANNING
1. Who has authority for managing transport systems and in which territory? Which
institutions, for which systems, in which territory?
2. What human resources are devoted to each area of authority? Political steering? Technical
departments? Sufficient local expertise? Outsourcing?
3. What financial resources are devoted to each area of authority (taxes and duties, subsidies,
ticket revenue)?
4. How is coherence between transport networks ensured?
5. Who has authority for mobility planning? For which territories? For what timescale?
6. How are major transport projects prepared? How do they fit in with the planning process?
Do they lead planning? Are they drivers or obstacles?
7. Who has authority for urban planning? For which territories? For what timescale?
8. What is the link between mobility planning and urban planning?

39
9. What is the extent of policy evaluation in the field of urban mobility? Are studies conducted
before and after policy implementation? Is there a monitoring system? How are issues of sustainable
mobility integrated in policies?
10. Is there a structure for pooling or capitalising on knowledge, data and expertise in the field
of urban mobility? At the local or national level?
40
In addition to coordinating town planning and transport, sustainable mobility policies implemented
in countries on the northern rim of the Mediterranean are generally built on four pillars:
The regulation of private car use: by reducing accessibility to certain zones, slowing traffic
speed, strengthening parking policy, rendering the cost of use higher, etc.
The development of attractive transport alternatives to the private car: lower cost of use,
rapid modes, accessibility, guaranteed journey time, high frequency of service, long opening
hours, etc.
The development of multimodal transport: by creating park & ride facilities, improving
pedestrian accessibility and pro-pedestrian urban design, developing cycling infrastructure
and bicycle services, etc.
The organisation of urban logistics: this fourth pillar is less developed and yet the
organisation of deliveries and utility vehicle traffic is a key element for ensuring sustainable
mobility.
The first three policy pillars need to be coordinated to foster multimodal mobility among residents.
The fourth pillar is essential to ensuring better usage of the road and to reduce traffic congestion, air
pollution and accidents in the city.
1. THE REGULATION OF CAR USE
Regulating private car use is the first challenge to move towards sustainable mobility. The first stage
for cities on the southern rim of the Mediterranean is to organise traffic and parking so as to restrict
them to defined portions of the public space. In addition to measures for organising traffic, it may
also be necessary to find ways to slow the development of car use in order to reduce congestion, air
and noise pollution and to save on investments. These measures require strong political commitment
on the part of the city authorities.
1.1. TIERED ROAD NETWORK BASED ON FUNCTIONALITIES
The aim of a tiered road network is to facilitate overall traffic management in order to improve urban
traffic conditions. Traffic management plans define the priority routes for the various modes of
transport. This generally consists of three types of flows:
Transit flow: crossing the metropolitan area without any connection to sectors of the city.
Exchange flow: connections between the metropolitan area and outlying areas.
Internal flow: within the metropolitan area, connecting to industrial zones, preservation of
local life, etc.
Structuring the road network in tiers is therefore based on the functions one wishes to assign to the
different parts of the urban area. The road types and traffic speeds can be adapted according to the
CHAPTER III HOW TO ORGANISE AND MANAGE TRANSPORT SYSTEMS

41
types of flow desired, favouring motorised or non-motorised modes of transport as the case may be.
A mix of transport modes is most suited to areas where streets are designed to favour local life and
where space is limited, such as historic centres. This cannot be achieved without lowering the speed
limit for motorists. In dense traffic areas, road space must be shared, with each mode having a
defined corridor. As a general rule, in urban areas, the allocation of space requires reducing car
traffic lanes to make room for alternative transport modes.
It is important, however, to take into account certain points: managing the interface between the
different modal corridors; enforcing proper use of the corridors; setting aside reserved delivery
zones.
1.2. PARKING POLICY ADAPTED TO TYPES OF USE
The ease or difficulty of parking one’s car at destination is an important criterion for choosing one’s
mode of transport. Studies have shown that offering free parking at the work place is the main
contributor to private car usage by commuters.
On the northern rim, in urban centres, parking policies generally distinguish three types of users:
Residents who need to park their car for the night (and perhaps day) near their home.
Employees who come to work by car and need parking during the day.
Visitors, especially shoppers who want to park as close as possible to their destination, for a
short or medium-length stay.
When there is a credible public transport alternative, the authorities offer attractive prices for passes
so that residents can leave their cars at home and take the bus, metro or tram. Parking rates are
designed to allow visitors to do their shopping for a limited time but they discourage employees from
parking in the centre all day, inciting them, rather, to take public transport.
For such a parking policy to be efficient there must be appropriate enforcement and fines. It also
requires the creation of park & ride facilities to allow intermodality for commuters.
1.3. TRAFFIC RESTRICTIONS IN THE CITY-CENTRE TO ENCOURAGE USE OF OTHER MODES
The concept of Limited Traffic Zones (LTZ) started in Italy in 1987, with the aim of protecting urban
heritage assets from pollution caused by a growing number of vehicles, while maintaining the
commercial activity in the historic centre. The zone must cover several hundred hectares to provide
proper conditions for active and public modes of transport. In this zone, motorised vehicles are not
totally prohibited. A permit is issued for traffic deemed vital to activities in the historic centre:
residents in the zone, emergency vehicles, public services, transport for the disabled, etc.
This type of regulation does not require specific redevelopment of public spaces. Access points and
restrictions must be clearly identified by markings and signs (authorised vehicles, times, etc.).
42
Maurizio Tira of the University of Brescia26 advises, however, the installation of electronic access
control systems. For example, in Padua, the Zona Blu (LTZ) was implemented in 1988 and, since 2008,
has been equipped with video surveillance cameras at each access point. They read the license plates
of entering vehicles and a software system checks the status of the vehicle’s authorisation. Some 250
infringements are detected daily and the vehicle owner is fined €90. The amount of fines collected
quickly paid for the cost of the equipment and now constitutes revenue for the city. The automated
system requires monitoring by only two people. Thanks to this traffic-limiting measure, the modal
share of active transport has grown significantly: 20% of travel is now done by bicycle.
Implementing such measures must be accompanied by the development of other modes of
transport. It has been noted in certain cities of the northern rim, where public transport was
insufficient, that car restriction measures resulted in more use of two-wheel motorised vehicles
(more prone to the risk of traffic accidents), as demonstrated in the paper by Angel Lopez of the City
of Barcelona.27
2. MORE EFFICIENT PUBLIC TRANSPORT
Public transport service is most efficient when designed as a network of hubs connected to each
other by links. This means that all modes of public transport (rail modes, buses, owner-driver
transport, etc.) must be coordinated in relation to their zone of operation in order to offer service
which is as comprehensive, coherent and optimised as possible for the territory.
2.1. TIERED COVERAGE OF THE TRANSPORT SYSTEM
Improvements to the public transport system should be organised around the creation of one or
several main routes with the highest level of service. Located on the most-travelled routes, these
main service lines must be designed in synergy with the other lines of the system. Connections to
these main routes are handled by lower-capacity lines feeding in from less densely-occupied areas.
Depending on the size of the urban area, there may be up to six tiers in the structure of the systems
found in the northern rim countries (ranging from regional trains to ring & ride transport). A system
structured in this manner allows for greater coverage, serving the entire territory in an economically
efficient way.
2.2. AN INTEGRATED OFFER THROUGH PRICING POLICY, INFORMATION AND TRANSIT HUBS
An integrated pricing policy for urban public transport helps to reduce transfer time and cost by
avoiding the need for passengers to pay again when they change lines. This savings of time and
26
Maurizio Tira – University of Brescia: "Italian experience of the Restricted Traffic Zone (ZTL).” 2010. 27
Angel Lopez – City of Barcelona: “Les deux roues motorisées – Défis et opportunités” (Two-wheeled motorised vehicles: challenges and opportunities). 2010

43
money means greater perceived comfort for passengers. According to Xavier Rosellò of ATM,28 this
perception can lead to growth in ridership for public transport by attracting new users. However,
integrated tickets must be limited to a set duration and/or number of trips (this does not include
unlimited-use passes) to ensure sufficient revenue for the transport authority. For example, thanks
to the integrated pricing implemented in 2001, ATM (Barcelona transport authority) saw 24% growth
in ridership between 2001 and 2008.
In addition to a comprehensive pricing policy to promote access for all to the urban transport system,
providing a good level of information for users helps attract new passengers and thereby strengthens
the system thanks to growth in revenue and a better image. Information needs to be available for
users to prepare their trip and in the course of the journey (name of the stop, waiting time, technical
incidents, etc.). This may be combined with campaigns to raise awareness among potential users:
presentations in schools, in companies, etc.
An integrated service also requires the creation of multimodal transit hubs. A hub can serve three
functions:
Transport function with connections to other modes. Depending on how it is designed, a
transit hub can be perceived as an advantage or a constraint.
Urban function in which the transit hub is a gateway to the urban area.
Service function by grouping companies and administrations accessible to passengers and
residents of the district: shops, medical services, post office, etc.
The proper organisation of transit hubs is essential to ensure that public transport users can make
their transfers in the shortest and easiest manner.
2.3. INTEGRATION OF OWNER-DRIVER TRANSPORT IN THE MULTIMODAL MIX
Owner-driver transport offers mobility for many segments of the population who can’t use mass
public transport. This form of transport accounts for a large number of jobs in economies with high
unemployment.29 In this respect, any initiative aiming to regulate and integrate owner-driver
transport into an organised urban transport system, must take into account the considerable
economic, social and political challenges.
What methods can help reform transport systems without excluding local operators? In answer to
this question, Alain Descamps – Veolia Transdev – proposes six types of methods:30
There are multiple ways of integrating local operators. This requires understanding the goals
28
Xavier Rosellò – ATM : “Présentation de l’ATM, Autorité du Transport Métropolitain de Barcelone” (Presentation of ATM, the transport authority of Barcelona). 2011 29
Xavier Godard : “Transport artisanal, esquisse de bilan pour la mobilité durable” (Owner-driver transport: a partial assessment for sustainable mobility). 2008 30
Alain Descamps – Veolia Transdev: “Point de vue de l’opérateur Améliorer l’efficience des Transports Urbains au Sud de la Méditerranée avec les opérateurs locaux - Veolia” (Operator’s perspective on ways to improve the efficiency of urban transport in the South Mediterranean, with local operators). 2011

44
of the operators and their ability to adapt, based on their operational resources (according to
the level of service desired) and financial capacity. With this information, the transport
authority must then make the choice of a single operator or multiple operators.
The transport authority must define the degree of regulation and monitoring in proportion
with the authority’s genuine operational capability and in line with the policy aims. However,
the more complex the system, the more complicated and time-consuming its management.
The transport authority is therefore advised to fully inform its potential partners of the
authority’s requirements so that these elements may be contractualised with the chosen
operators.
The owner-driver sector can represent an opportunity and not an obstacle, on the condition
that the number of owner-drivers is limited by means of incentives to consolidate (economic
interest group) and encouraging the weaker ones to cease operations by offering a
termination bonus. Once the consolidation is complete, work should be allotted among the
groups based on operational capacity and geography (batches of routes) or type of service
(zone-based, feeder line, etc.). It remains essential however to impose specifications and
monitor service to ensure proper functioning of the system. Other complementary measures
include a bonus mechanism to reward good service (by means of financial aid, for example),
“progress contracts,” aid for vocational training, etc.
The contract sets out the relationship between the operator and the regulator. It must
respect certain principles, in particular: the contract must be adapted to the mission and the
assigned targets, while allowing for changes over time, in the framework of genuine
negotiations. In general, if the starting situation is of poor quality, it is advisable to
implement modular contracts which take into account progress achieved by the operator,
rather than setting overly ambitious targets. These contracts should be monitored with a
view to implementing corrective measures (to make progress), rather than imposing
sanctions.
Monitoring performance not only helps to evaluate progress, it also helps improve
management (indicators, evaluation meetings, integration of IT systems, etc.).
The modernisation of a transport system is a long process requiring specialised skills
developed thanks to the training of staff employed by the authority and by the operators.
Integrating owner-driver transport in the overall system is a policy choice which requires a stringent
methodology on the part of the transport authority to assist operators through this transition and to
improve the quality of service.
Like cities of the northern rim seeking to develop transport-on-demand service to connect peripheral
zones with the urban transport system, cities such as Cairo have developed ways of using owner-
driver transport to offer better coverage throughout the territory, with a good match between
supply and demand, and an efficient organisation to feed into the main transit lines.
3. PROMOTION OF WALKING AND CYCLING
45
Cities of the north rim of the Mediterranean have noted that redesigning public spaces for the
benefit of non-motorised modes serves to boost their usage. This strategy must be part of a tiered
urban road system to best determine the proper balance between public space, buildings and the
various modes of transport. According to Martin Stucki – Transitec,31 there are several phases to
redesign urban spaces:
Analyse the current situation in order to set out clear objectives.
Decide on the sharing of space and time for different users, depending on the tier of the
roadway (shared roadway, priority at traffic lights for public transport, restricted zones, two-
way bike lanes, etc.).
Prioritise optimised functioning of existing infrastructures.
Aim for a multimodal approach to integrate all modes of transport, in particular the most
vulnerable.
Ensure coherence between development and operation.
This type of approach has resulted in improved accessibility, mobility and safety, a positive impact on
air, noise and visual pollution, as well as a better allocation of resources for projects to redesign
traffic flows. In addition, improved urban spaces and more attractive landscaping encourage the
choice of active modes of transport when possible.
Opportunities to redesign public spaces in the city-centre may however be rare (lack of space, high
cost, etc.). But walking and cycling do not entirely depend on the requalification of urban spaces.
Curtailing motorised traffic is also an important factor. Other measures include:
A communication campaign about sharing the road among the different transport modes,
road safety, etc.
Signs and markers for pedestrians indicating walking time, rather than distance (less
discouraging?).32
Signs for walking and cycling routes for visitors to encourage sustainable tourism.
Bike-sharing stations such as those found in Lyon (Vélo’V) and Ferrara (Bike Bus Key).
Parking for individual bicycles in locked pens near transit hubs.
4. ORGANISATION OF URBAN LOGISTICS
Studies on urban travel practices often focus on individuals. However, urban logistics represents a
31
Martin Stucki – Transitec: “Les déplacements dans les cœurs de ville : quel traitement de l’espace urbain ? – Illustrations à travers le guide d’aménagement et d’exploitation de l’espace public urbain au Maroc” (Mobility in city centres: the role of urban space design – examples from the Moroccan plan for urban space development and operation). 2010. He also gives recommendations on redesigning public spaces. 32
Example of a city map showing walking times, for an average speed of 5 km/hr: http://www.ville-geneve.ch/fileadmin/public/Departement_2/Plans_pietons/carte-marcher-geneve-2011.pdf

46
serious challenge for all aspects of urban life:33
Travel modes: merchandise transport vehicles (professional and individual) represent on
average 20% of road usage and therefore must be included in plans to organise traffic.
Economy: urban logistics alone represents 3% of the cost of the product. Any additional
constraints will raise this percentage and weaken the position of retailers in city centres.
Environment: one third of transport pollution emissions in town comes from urban logistics.
Development: urban logistics requires space for loading and unloading which facilitates the
process.
Social aspects: logistics accounts for 6 to 8% of jobs and contributes to urban vitality. One
fourth of these jobs are directly linked to serving densely-occupied zones.
Most cities of the northern rim have understood the importance of urban logistics for preserving an
attractive and dynamic centre. This requires an efficient system for handling goods so as to avoid
dissatisfaction among stakeholders who might be tempted to transfer business, jobs and housing to
outlying areas. Two actions have proved useful, when deployed jointly:
One action is based on constraints to manage city roads, parking areas and delivery points,
backed by regulations: authorised hours of operation, types of vehicles allowed in the city,
parking reserved for deliveries, etc. For this to work, it requires consultation, information and
monitoring.
The other entails the creation of urban logistics facilities to organise loading/unloading
points, managed either by the public sector or the private sector, or by a joint action of the
two.
New ideas have been developed in some cities. One example is the use of traditional passenger
transport vehicles to carry goods (e.g. Amsterdam, in which warehouses outside the city load
palettes onto trams to be taken into the city-centre near the shops); the creation of logistics centres
combining the logistics function with other urban functions); the use of delivery tricycles for
packages and purchases;34 animal-drawn vehicles for trash collection (e.g. the medina of Fes); etc.
33
Daniel Boudouin – CRET-LOG: “La circulation des marchandises dans les centres anciens” (Merchandise transport in historic centres). Undated 34
Example of FREE’DOM: customers purchasing goods from shops on Lyon’s peninsula can have them delivered to their home for a small fee. The deliveries are made by bicycle.
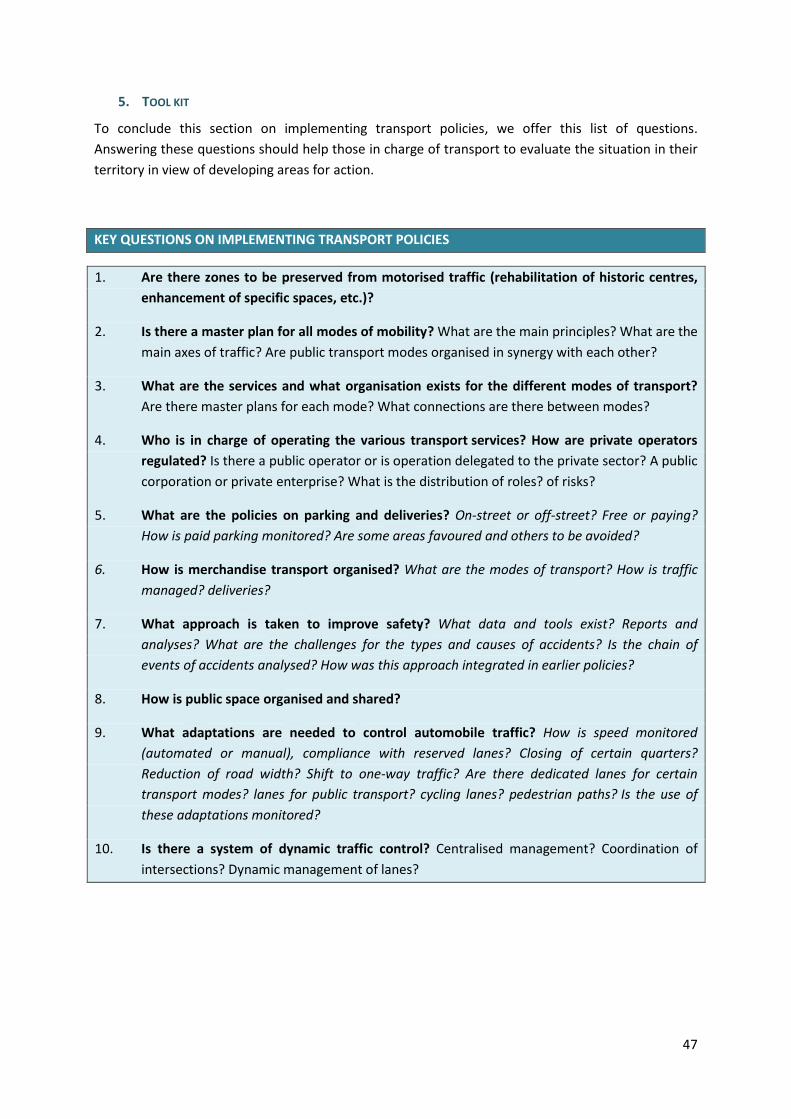
47
5. TOOL KIT
To conclude this section on implementing transport policies, we offer this list of questions.
Answering these questions should help those in charge of transport to evaluate the situation in their
territory in view of developing areas for action.
KEY QUESTIONS ON IMPLEMENTING TRANSPORT POLICIES
1. Are there zones to be preserved from motorised traffic (rehabilitation of historic centres,
enhancement of specific spaces, etc.)?
2. Is there a master plan for all modes of mobility? What are the main principles? What are the
main axes of traffic? Are public transport modes organised in synergy with each other?
3. What are the services and what organisation exists for the different modes of transport?
Are there master plans for each mode? What connections are there between modes?
4. Who is in charge of operating the various transport services? How are private operators
regulated? Is there a public operator or is operation delegated to the private sector? A public
corporation or private enterprise? What is the distribution of roles? of risks?
5. What are the policies on parking and deliveries? On-street or off-street? Free or paying?
How is paid parking monitored? Are some areas favoured and others to be avoided?
6. How is merchandise transport organised? What are the modes of transport? How is traffic
managed? deliveries?
7. What approach is taken to improve safety? What data and tools exist? Reports and
analyses? What are the challenges for the types and causes of accidents? Is the chain of
events of accidents analysed? How was this approach integrated in earlier policies?
8. How is public space organised and shared?
9. What adaptations are needed to control automobile traffic? How is speed monitored
(automated or manual), compliance with reserved lanes? Closing of certain quarters?
Reduction of road width? Shift to one-way traffic? Are there dedicated lanes for certain
transport modes? lanes for public transport? cycling lanes? pedestrian paths? Is the use of
these adaptations monitored?
10. Is there a system of dynamic traffic control? Centralised management? Coordination of
intersections? Dynamic management of lanes?

48
Part 2
Focus on different practice
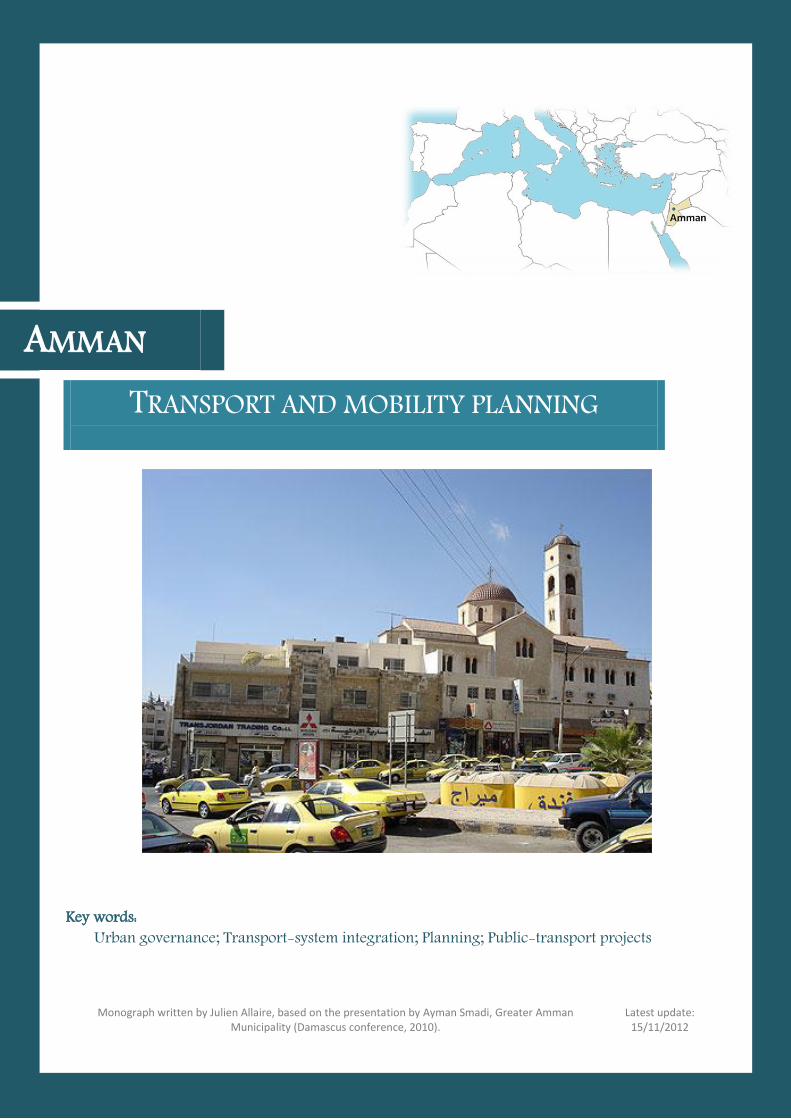
49
AMMAN
Key words: Urban governance; Transport-system integration; Planning; Public-transport projects
TRANSPORT AND MOBILITY PLANNING
Monograph written by Julien Allaire, based on the presentation by Ayman Smadi, Greater Amman Municipality (Damascus conference, 2010).
Latest update: 15/11/2012
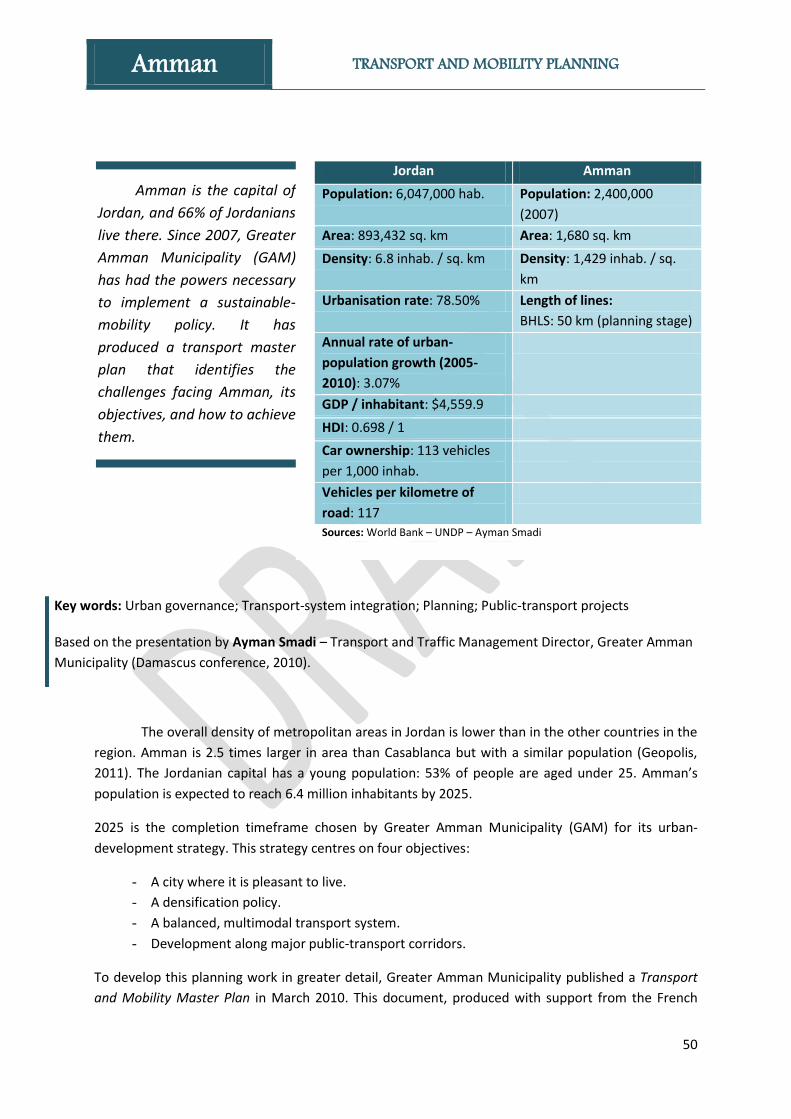
50
Key words: Urban governance; Transport-system integration; Planning; Public-transport projects
Based on the presentation by Ayman Smadi – Transport and Traffic Management Director, Greater Amman
Municipality (Damascus conference, 2010).
The overall density of metropolitan areas in Jordan is lower than in the other countries in the
region. Amman is 2.5 times larger in area than Casablanca but with a similar population (Geopolis,
2011). The Jordanian capital has a young population: 53% of people are aged under 25. Amman’s
population is expected to reach 6.4 million inhabitants by 2025.
2025 is the completion timeframe chosen by Greater Amman Municipality (GAM) for its urban-
development strategy. This strategy centres on four objectives:
- A city where it is pleasant to live.
- A densification policy.
- A balanced, multimodal transport system.
- Development along major public-transport corridors.
To develop this planning work in greater detail, Greater Amman Municipality published a Transport
and Mobility Master Plan in March 2010. This document, produced with support from the French
Amman TRANSPORT AND MOBILITY PLANNING
Amman is the capital of
Jordan, and 66% of Jordanians
live there. Since 2007, Greater
Amman Municipality (GAM)
has had the powers necessary
to implement a sustainable-
mobility policy. It has
produced a transport master
plan that identifies the
challenges facing Amman, its
objectives, and how to achieve
them.
Jordan Amman
Population: 6,047,000 hab. Population: 2,400,000
(2007)
Area: 893,432 sq. km Area: 1,680 sq. km
Density: 6.8 inhab. / sq. km Density: 1,429 inhab. / sq.
km
Urbanisation rate: 78.50% Length of lines:
BHLS: 50 km (planning stage)
Annual rate of urban-
population growth (2005-
2010): 3.07%
GDP / inhabitant: $4,559.9
HDI: 0.698 / 1
Car ownership: 113 vehicles
per 1,000 inhab.
Vehicles per kilometre of
road: 117
Sources: World Bank – UNDP – Ayman Smadi

51
Development Agency (AFD), is based on the study of journeys made by residents of the Jordanian
capital (10,000 households were surveyed). It proposes modal-mix targets to be reached by 2025,
and lists the public-transport investments required in order to achieve them.
Traditionally, investment focused mainly on roads. As the
price of fuel was relatively low, car ownership is rising
very quickly. The vehicle stock in Amman is growing by
10% a year.
Public transport is characterised by a fairly mediocre
quality of service. It represents only a 15% share (taxis
included) of the modal mix. The largely captive customer
base must accept many transfers. Most public transport
is provided by the owner-driver sector.
To achieve its targets, GAM wants to develop a structured and integrated transport system based on:
- Rail infrastructure: 40 km of metro and suburban-train lines.
- An efficient bus system built around three main routes: three lines totalling 50 km of BRT.
- A multimodal network offering integrated fares and a good quality of service.
These networks will be developed in two phases. From 2009 to 2015, $1.5 billion is allocated for
construction of BRT and rail networks and upgrading of the bus network. In phase two (2015-2025),
$1.1 billion will be invested to supplement the network.
The stated objectives are:
- To increase public transport’s modal share to 40% by 2025, by limiting journey times to 30
minutes. This objective must be supported by suitable urban organisation. By 2025, 40% of
jobs must be located less than 2 km from a network station.
- To maintain pedestrians’ modal share at its current level, by making walking safer. In 2008,
more than 200 people died on the streets of Amman; 60% were pedestrians. Echoing the
national road-safety programme, GAM named 2010 pedestrian safety year.
- To reduce greenhouse-gas emissions (currently estimated at 600 kg of CO2 per inhabitant)
and energy consumption. The transport sector represents 38% of the country’s energy bill.
In Amman, $750 million is spent on fuel yearly.
- To fight congestion, which represents an estimated annual cost of $850 million.
This planning is primarily based on a new institutional organisation. The November 2007 transport
law gave GAM the necessary powers to create a suitable organisation; develop effective regulations
and policies; assess mobility-related problems and needs; improve the quality of services; develop
mass-transport networks; and restructure the network. GAM is responsible for urban planning and
spatial usage; traffic control and management; parking; roads and other transport infrastructure. A
transport department with all these powers was set up in 2009.

52
GAM has its own budget, funded mainly by revenues from building permits and property
development. The plan is to delegate transport services to private companies under contractual
mechanisms, while subsidising the system to ensure affordable fares.
The main challenges are:
- From an institutional perspective: secure the requisite resources and the processes.
- From the stakeholders’ perspective: coordinate the respective services and departments.
- From a technical perspective: successfully integrate the infrastructure into the built
environment.
- From a financial perspective: cover infrastructure costs and provide for public contributions
to the transport companies’ budget.
- From a social and political perspective: give public transport a positive image.
Ayman Smadi’s conclusions: “The plans are good, but they must be practical in order to be
implemented. Having accurate data and forecasting models helps win the trust of decision-makers.
We must then quickly offer improvements to travellers in order to show the projects’ utility. We must
find the right message to convey to the public, and adapt it to the various stakeholders. Lastly, a plan
must be reassessed and revised constantly.”
53
ALEPPO
Key words: Planning; City-centre regeneration
URBAN MOBILITY PLANNING PROJECT
Monograph written by Camille MARTINET et Julien ALLAIRE
Latest update:
15/11/2012
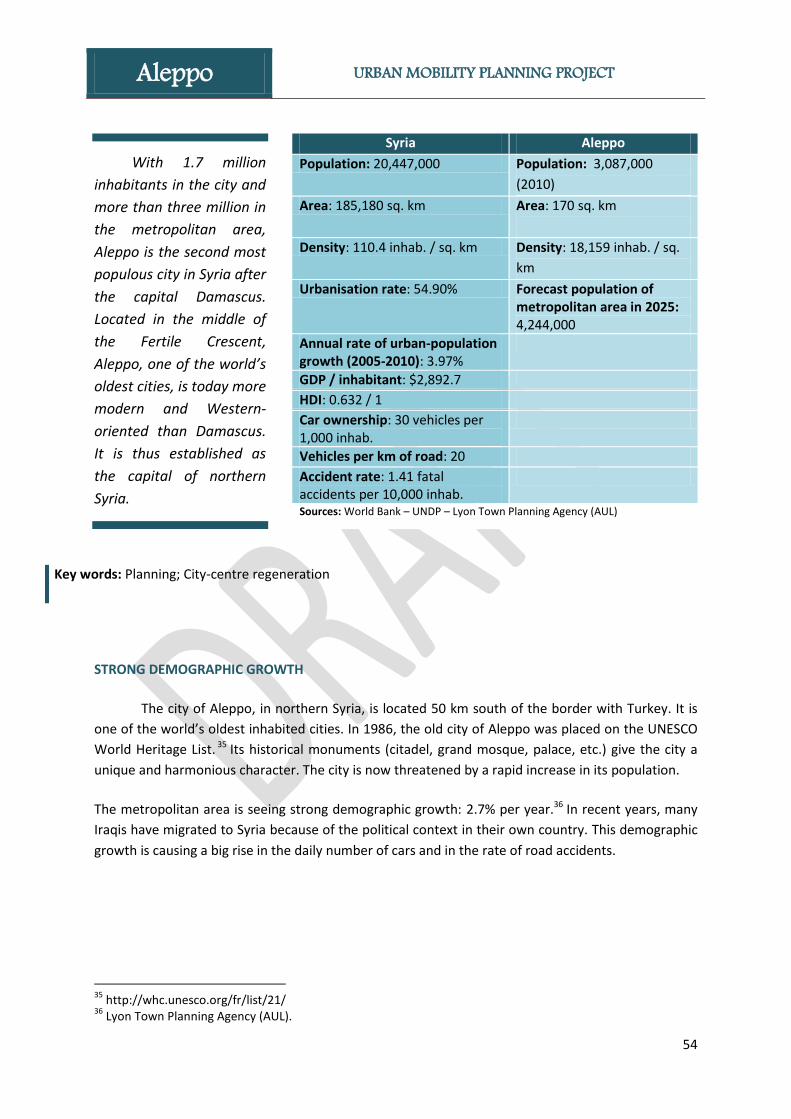
54
With 1.7 million
inhabitants in the city and
more than three million in
the metropolitan area,
Aleppo is the second most
populous city in Syria after
the capital Damascus.
Located in the middle of
the Fertile Crescent,
Aleppo, one of the world’s
oldest cities, is today more
modern and Western-
oriented than Damascus.
It is thus established as
the capital of northern
Syria.
Syria Aleppo
Population: 20,447,000 Population: 3,087,000
(2010)
Area: 185,180 sq. km Area: 170 sq. km
Density: 110.4 inhab. / sq. km Density: 18,159 inhab. / sq.
km
Urbanisation rate: 54.90% Forecast population of metropolitan area in 2025: 4,244,000
Annual rate of urban-population growth (2005-2010): 3.97%
GDP / inhabitant: $2,892.7
HDI: 0.632 / 1
Car ownership: 30 vehicles per 1,000 inhab.
Vehicles per km of road: 20
Accident rate: 1.41 fatal accidents per 10,000 inhab.
Sources: World Bank – UNDP – Lyon Town Planning Agency (AUL)
Key words: Planning; City-centre regeneration
STRONG DEMOGRAPHIC GROWTH
The city of Aleppo, in northern Syria, is located 50 km south of the border with Turkey. It is
one of the world’s oldest inhabited cities. In 1986, the old city of Aleppo was placed on the UNESCO
World Heritage List. 35 Its historical monuments (citadel, grand mosque, palace, etc.) give the city a
unique and harmonious character. The city is now threatened by a rapid increase in its population.
The metropolitan area is seeing strong demographic growth: 2.7% per year.36 In recent years, many
Iraqis have migrated to Syria because of the political context in their own country. This demographic
growth is causing a big rise in the daily number of cars and in the rate of road accidents.
35
http://whc.unesco.org/fr/list/21/ 36
Lyon Town Planning Agency (AUL).
Aleppo URBAN MOBILITY PLANNING PROJECT
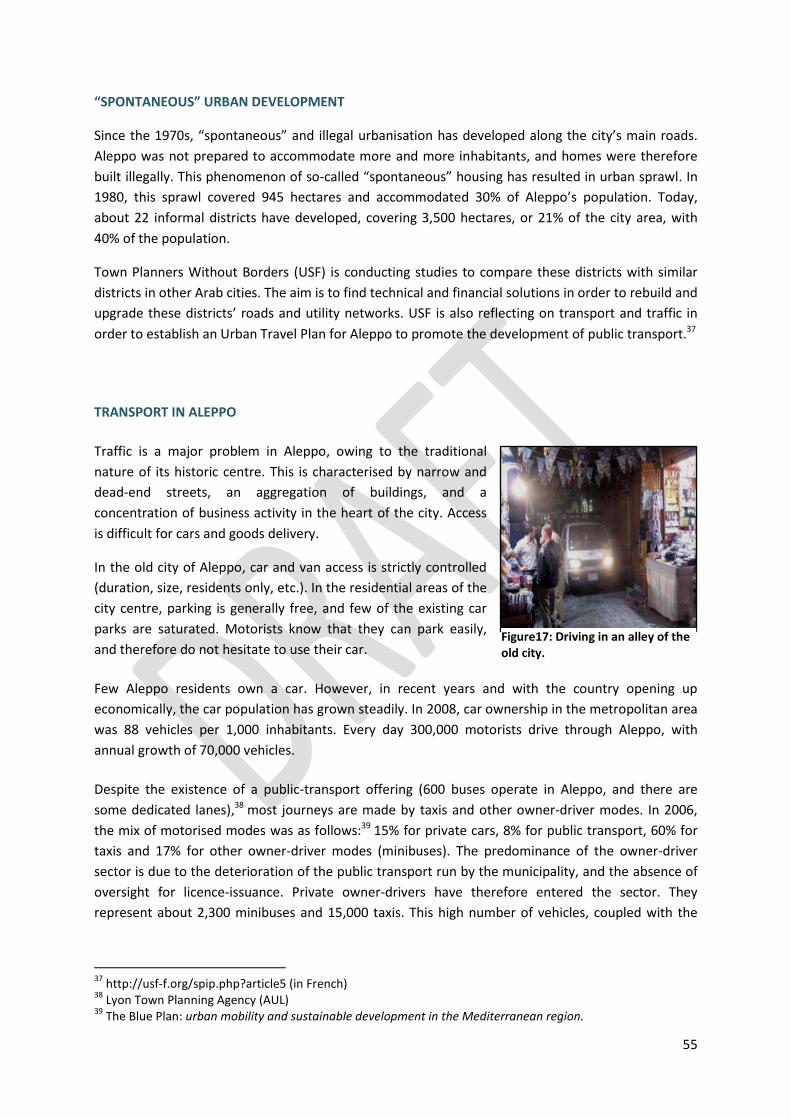
55
“SPONTANEOUS” URBAN DEVELOPMENT
Since the 1970s, “spontaneous” and illegal urbanisation has developed along the city’s main roads.
Aleppo was not prepared to accommodate more and more inhabitants, and homes were therefore
built illegally. This phenomenon of so-called “spontaneous” housing has resulted in urban sprawl. In
1980, this sprawl covered 945 hectares and accommodated 30% of Aleppo’s population. Today,
about 22 informal districts have developed, covering 3,500 hectares, or 21% of the city area, with
40% of the population.
Town Planners Without Borders (USF) is conducting studies to compare these districts with similar
districts in other Arab cities. The aim is to find technical and financial solutions in order to rebuild and
upgrade these districts’ roads and utility networks. USF is also reflecting on transport and traffic in
order to establish an Urban Travel Plan for Aleppo to promote the development of public transport.37
TRANSPORT IN ALEPPO
Traffic is a major problem in Aleppo, owing to the traditional
nature of its historic centre. This is characterised by narrow and
dead-end streets, an aggregation of buildings, and a
concentration of business activity in the heart of the city. Access
is difficult for cars and goods delivery.
In the old city of Aleppo, car and van access is strictly controlled
(duration, size, residents only, etc.). In the residential areas of the
city centre, parking is generally free, and few of the existing car
parks are saturated. Motorists know that they can park easily,
and therefore do not hesitate to use their car.
Few Aleppo residents own a car. However, in recent years and with the country opening up
economically, the car population has grown steadily. In 2008, car ownership in the metropolitan area
was 88 vehicles per 1,000 inhabitants. Every day 300,000 motorists drive through Aleppo, with
annual growth of 70,000 vehicles.
Despite the existence of a public-transport offering (600 buses operate in Aleppo, and there are
some dedicated lanes),38 most journeys are made by taxis and other owner-driver modes. In 2006,
the mix of motorised modes was as follows:39 15% for private cars, 8% for public transport, 60% for
taxis and 17% for other owner-driver modes (minibuses). The predominance of the owner-driver
sector is due to the deterioration of the public transport run by the municipality, and the absence of
oversight for licence-issuance. Private owner-drivers have therefore entered the sector. They
represent about 2,300 minibuses and 15,000 taxis. This high number of vehicles, coupled with the
37
http://usf-f.org/spip.php?article5 (in French) 38
Lyon Town Planning Agency (AUL) 39
The Blue Plan: urban mobility and sustainable development in the Mediterranean region.
Figure17: Driving in an alley of the old city.
56
growth of individual car ownership, is causing congestion problems, a fall in the speed of public
transport, and more accidents.
The traffic plan currently in force aims to ease flows and promote car traffic by: creating crossroads,
building bridges and tunnels, introducing traffic lights, widening the road portion of certain routes,
and building paid parking structures. At first glance, car use is therefore favoured over public
transport, and no sustainable-mobility policy has been implemented. Four bus lines are currently
delegated to the private sector, and there is no integrated fare policy across the various companies.
However, the municipality wants to develop public transport in order to reduce congestion, improve
residents’ quality of life by cutting environmental and sound nuisance, and meeting the needs of
people with no access to a private car. A study funded by the EU-backed Municipal Administration
Modernisation (MAM) project is currently being conducted on the main public-transport routes. This
project consists of laying the foundations of a process to decentralise powers to the local level and to
strengthen capabilities in various urban processes.40
A project for sustainable urban-mobility planning adapted to the Mediterranean countries (SUMPA-
MED) has been set up as part of the EU’s CIUDAD project. Syria, and Aleppo in particular, will receive
funding to develop integrated transport that better respects the environment.
SUMPA-MED PROJECT
The SUMPA-MED project aims to promote sustainable urban-mobility policies in Jordan and Syria.
It is funded as part of the EU’s Cooperation in Urban Development and Dialogue (CIUDAD)
programme. The programme was signed in Gaziantep, Turkey, on 25 December 2009 for a three-year
term (2010-2012).
The project’s eventual goal is the creation of a network of professionals to discuss their respective
experiences on sustainable transport modes and organisational systems.
For Aleppo, the project’s main long-term measure is to “introduce public transport systems to relieve
growing congestion. These will need to be well-organised and environmentally-friendly. Clear
timeframes and detailed planning will be required”.41 The main challenge is to make the old city
cleaner: its narrow streets are much visited, and it contains many archaeological sites and business
and tourist activities. An old-city mobility plan must be drawn up: a pedestrian route, car parks
outside the old town, and creation of connections with the city’s other districts, while maintaining
the old town’s appeal and accessibility.
To successfully execute this project, there are plans to:
- Help Aleppo to assess current transport conditions, to define its needs and to implement
long-term solutions.
- Develop the municipality’s capability to analyse data, model traffic, and enable the planners
40
www.eurojar.org 41
www.ciudad-programme.eu
57
to assimilate best practices, etc.
- Hold training workshops and improve the skills of selected experts.
- Update the authorities’ legal status and role.
CONCLUSION
In Aleppo, the deterioration of public transport, the steady increase in the number of vehicles and
the predominance of the owner-driver sector are all factors contributing to congestion, which is
reducing air quality and increasing noise pollution and journey times. The Syrian city needs transport-
system strategies in order to find long-term solutions.
This is why Aleppo has joined the SUMPA-MED project (planning of urban mobility adapted to
Mediterranean countries) in order to receive funding to develop integrated transport systems that
better respect the environment.

58
Key words: Transport-system integration; Planning; Environmental politics; Public-transport projects
ATHENS RESTRUCTURING THE TRANSPORT NETWORK
FOR THE OLYMPIC GAMES
Monograph written by Camille MARTINET and Julien ALLAIRE, based on the presentation by Zoï CHRISTOFOROU, OASA / UNTA (Damascus conference, 2010).
Latest update: 15/11/2012

59
Athens hosted
the 2004 Olympics. The
Games’ return to
Greece, cradle of the
ancient Olympics and
of the first modern
Games, enabled the
metropolitan area of
Athens, which produces
nearly half of national
GDP, to implement an
urban requalification
project.
Greece Athens
Population: 11,316,000 inhab. Population: 4,000,000 inhab.
Area: 131,957 sq. km Area: 400 sq. km
Density: 85.8 inhab. / sq. km Density: 10,000 inhab. / sq. km
Urbanisation rate: 61.40% Length of lines: (2010)
Metro: 55 km
Tramway: 27 km
Annual rate of urban-population
growth (2005-2010): 0.56%
Modal mix:
Private cars: 53%
Public transport: 37%
Active modes: 10%
GDP / habitant: $26,606.9
HDI: 0.861 / 1
Car ownership: 455 vehicles per
1,000 inhab.
Vehicles per km of road: 55
Accident rate: 1.49 fatal
accidents per 10,000 inhab.
Sources: World Bank – UNDP – Zoï Christoforou – UrbanRail.net – EPOMM
Key words: Transport-system integration; Planning; Environmental politics; Public-transport projects
Based on the presentation by Zoï Christoforou – OASA / UNTA (Damascus conference, 2010).
In 2004, during a 16-day period, 301 events were held in the Greek capital and 3.6 million
spectators attended the Olympic Games. To host this occasion, the city implemented a vast urban-
requalification programme: housing construction and refurbishment, heritage enhancement,
transport-infrastructure development, and the creation of new sporting amenities.
Urban-infrastructure issues were central to preparations for the Olympics. The success of the major
sporting events depended on the construction and reliability of the infrastructure. The Games
therefore served as an ultimatum for the Athens authorities.
Athens saw very rapid urban growth in the second half of the 20th century. Since the 1960s, the
metropolitan area had extended to the north and south without reference to any planning
document, and often illegally. It is estimated that one-quarter of the buildings in Athens were built
illegally. Until the second half of the 1990s, and Athens’ decision to host the Olympics, planning
documents were generally unsuccessful.
Athens RESTRUCTURING THE TRANSPORT NETWORK FOR THE OLYMPIC GAMES

60
Since 1970, car ownership has risen strongly in this capital city. In 2009, according to Eurostat,42 the
rate in the Athens area was 650 vehicles per 1,000 inhabitants. Very early on, the national and local
authorities tried to fight the atmospheric pollution caused by car traffic. The Nefos – a cloud of
sulphur dioxide, carbon monoxide and ozone that hangs over the city, which is located between sea
and mountains – makes the metropolitan area one of the most polluted in Europe.
To reduce pollutant emissions, an alternate traffic scheme called dactylio was introduced in 1982. In
a 23 sq. km area of the city centre, cars could only be driven on odd or even dates depending on their
registration plate. However, this measure did not have the expected results in terms of improving
traffic flows and air quality, owing to: a sharp rise in the number of taxis and two-wheeled vehicles
authorised to drive in the area; a fast increase in car ownership in households located in the area, so
as to have two cars with “odd” and “even” plates; inadequate public-transport provision; and
practically no parking controls.43
Figure 48: Modal mix in Athens.
ORGANISATION OF THE PUBLIC TRANSPORT SYSTEM
In Athens, the public transport system comprises seven transport modes: suburban bus, taxi,
suburban train, fuel-engine bus, trolleybus, metro and tramway. The suburban buses and the taxis
are operated by the private sector; the other modes are attached to the Ministry of Infrastructure,
Transport and Networks via Hellenic Railways and the Athens Urban Transport Organization (AUTO).
AUTO has the power to plan, organise, oversee and provide services of all public-transport modes,
above and under ground.
The improvement and modernisation of Athens’ public transport for the Olympics was conducted
under the “Attica SOS” plan launched in 1994 by the Ministry of the Environment. The ministry
implemented many measures to improve air quality: creating bus lanes, opening 17 km of metro line,
42
http://epp.eurostat.ec.europa.eu/statistics_explained/index.php/Vehicle_fleet_statistics_at_regional_level/fr 43
http://www.cairn.info/article.php?ID_ARTICLE=ECOPO_029_0053

61
renewing the bus fleet, developing trolleybus lines, controlling car traffic, etc. The transport-
modernisation programme was expected to reduce atmospheric pollution, increase road safety, and
introduce new travel habits.44
The transport infrastructure required to host the Games was therefore incorporated into the
restructuring of the transport system of the whole of Attica (the region including Athens).
UNPRECEDENTED DEVELOPMENT OF TRANSPORT INFRASTRUCTURE
Public transport development, though a core element of planning projects for more than 50 years,
had never actually materialised until Athens was chosen to host the Games. The summer 2004
Olympics were the biggest-ever challenge faced by the Athens transport system.
The entire transport system was modernised: 9.6 km of new metro lines, 23 km of tramway lines
(two new lines) and 32 km of suburban-rail network entered service for the occasion. At the same
time, 120 km of new roads were opened and 90 km of existing roads were upgraded.3
Development of the metro network
Athens’ metro network comprised three lines, the first of which had been built in 1869 and only
served a small part of the city. The metro network had to be upgraded for the Games. A vast
programme was launched, aiming to: increase speed, upgrade the signalling system on the busiest
routes, upgrade the safety and telecommunications systems, and refurbish the stations.
In addition, extension projects to link the city centre with the Olympic sites north of the capital were
essential. These satisfied the Games’ needs by serving the entire Attica region as well as Athens
International Airport.
Building the extensions was problematic: archaeological sites were discovered, and it was also
necessary to destroy many illegal constructions, a move that prompted legal action by residents. All
of this continually slowed down the works, which cost about €2 billion.
The lines opened before 2004 carried about 530,000 users per working day. The extensions added
150,000 extra daily users. Public transport users saved considerable travel time. Launched in 1991,
the works continued until 2007, when the final line extensions entered service. The network is
currently 55 km long and has 52 stations.
44
http://thema.univ-fcomte.fr/IMG/pdf/These_Adeline.pdf
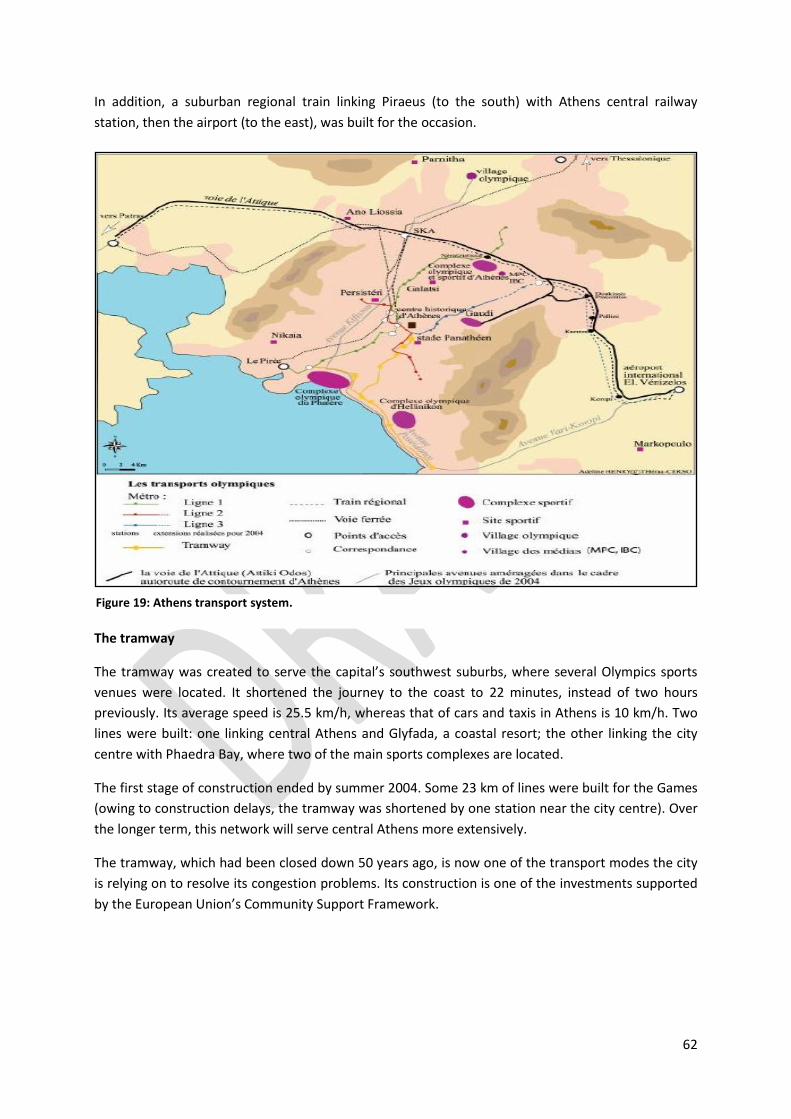
62
In addition, a suburban regional train linking Piraeus (to the south) with Athens central railway
station, then the airport (to the east), was built for the occasion.
The tramway
The tramway was created to serve the capital’s southwest suburbs, where several Olympics sports
venues were located. It shortened the journey to the coast to 22 minutes, instead of two hours
previously. Its average speed is 25.5 km/h, whereas that of cars and taxis in Athens is 10 km/h. Two
lines were built: one linking central Athens and Glyfada, a coastal resort; the other linking the city
centre with Phaedra Bay, where two of the main sports complexes are located.
The first stage of construction ended by summer 2004. Some 23 km of lines were built for the Games
(owing to construction delays, the tramway was shortened by one station near the city centre). Over
the longer term, this network will serve central Athens more extensively.
The tramway, which had been closed down 50 years ago, is now one of the transport modes the city
is relying on to resolve its congestion problems. Its construction is one of the investments supported
by the European Union’s Community Support Framework.
Figure 19: Athens transport system.
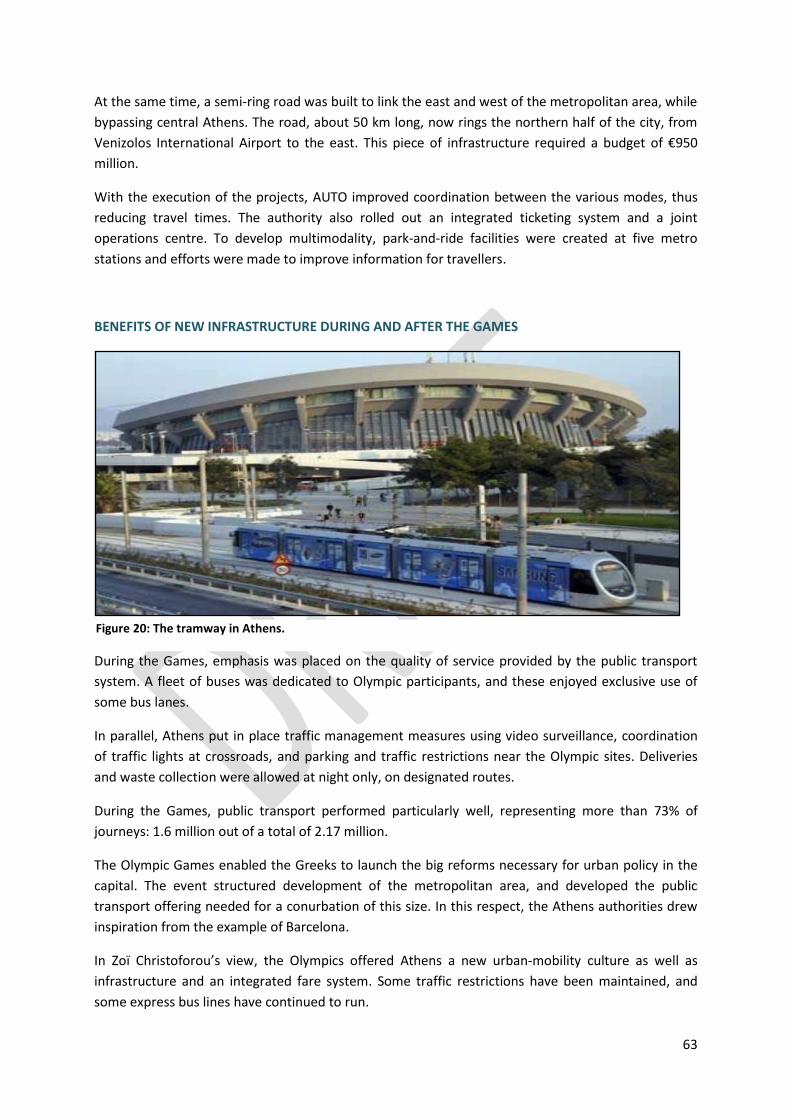
63
At the same time, a semi-ring road was built to link the east and west of the metropolitan area, while
bypassing central Athens. The road, about 50 km long, now rings the northern half of the city, from
Venizolos International Airport to the east. This piece of infrastructure required a budget of €950
million.
With the execution of the projects, AUTO improved coordination between the various modes, thus
reducing travel times. The authority also rolled out an integrated ticketing system and a joint
operations centre. To develop multimodality, park-and-ride facilities were created at five metro
stations and efforts were made to improve information for travellers.
BENEFITS OF NEW INFRASTRUCTURE DURING AND AFTER THE GAMES
During the Games, emphasis was placed on the quality of service provided by the public transport
system. A fleet of buses was dedicated to Olympic participants, and these enjoyed exclusive use of
some bus lanes.
In parallel, Athens put in place traffic management measures using video surveillance, coordination
of traffic lights at crossroads, and parking and traffic restrictions near the Olympic sites. Deliveries
and waste collection were allowed at night only, on designated routes.
During the Games, public transport performed particularly well, representing more than 73% of
journeys: 1.6 million out of a total of 2.17 million.
The Olympic Games enabled the Greeks to launch the big reforms necessary for urban policy in the
capital. The event structured development of the metropolitan area, and developed the public
transport offering needed for a conurbation of this size. In this respect, the Athens authorities drew
inspiration from the example of Barcelona.
In Zoï Christoforou’s view, the Olympics offered Athens a new urban-mobility culture as well as
infrastructure and an integrated fare system. Some traffic restrictions have been maintained, and
some express bus lines have continued to run.
Figure 20: The tramway in Athens.
64
Between 2003 and 2006, urban public transport gained 10% modal share, exceeding 35% in 2006.
Since 2004, the metropolitan area has continued to develop projects: extending dedicated bus lanes,
city-centre tramway lines, and metro lines to the suburbs. The bus fleet was renewed, and the
implementation of a zonal fare system was explored.
The Games were therefore a positive catalyst for the Greek capital, making it more functional for
residents and more attractive to tourists. The development of a transport offering for the 16-day
event gave a structure to long-term urban planning.
Transport infrastructure improvement, modernisation and construction created a new organisation,
which in turn influenced the urban area by improving services and accessibility for certain areas of
Athens, thus giving a new structure to the Attica region.
According to Greek writer Alexis Stamatis, “the Olympic Games were a godsend: a unique opportunity
for the city to change its face … and the Greeks did not miss their chance.”
65
DAMASCUS
Key words: Planning; Public-transport projects; City-centre regeneration
PROVIDING SAFE AND EASY ACCESS TO THE MEDINA
Monograph written by Charles SIMON and Julien ALLAIRE, based on the presentation by Abdullah ABOUD and Amal HADDAD, City of Damascus (Marseille
conference, 2010).
Latest update: 15/11/2012
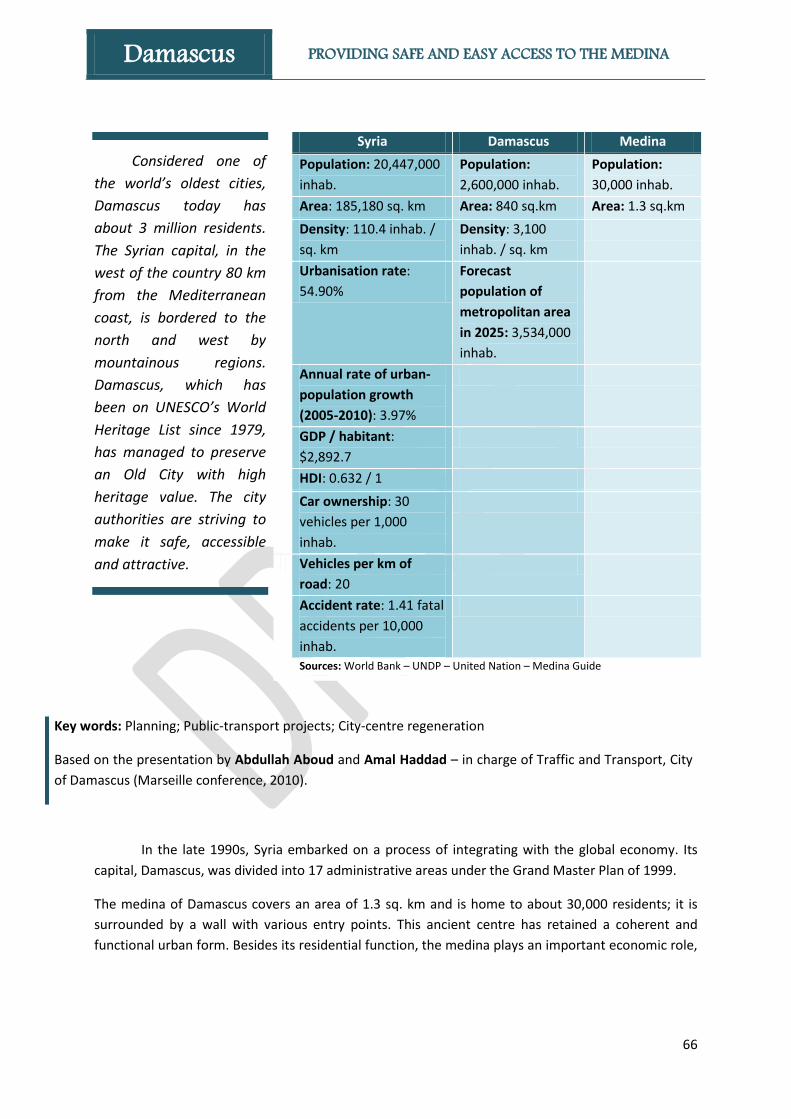
66
Key words: Planning; Public-transport projects; City-centre regeneration
Based on the presentation by Abdullah Aboud and Amal Haddad – in charge of Traffic and Transport, City
of Damascus (Marseille conference, 2010).
In the late 1990s, Syria embarked on a process of integrating with the global economy. Its
capital, Damascus, was divided into 17 administrative areas under the Grand Master Plan of 1999.
The medina of Damascus covers an area of 1.3 sq. km and is home to about 30,000 residents; it is
surrounded by a wall with various entry points. This ancient centre has retained a coherent and
functional urban form. Besides its residential function, the medina plays an important economic role,
Considered one of
the world’s oldest cities,
Damascus today has
about 3 million residents.
The Syrian capital, in the
west of the country 80 km
from the Mediterranean
coast, is bordered to the
north and west by
mountainous regions.
Damascus, which has
been on UNESCO’s World
Heritage List since 1979,
has managed to preserve
an Old City with high
heritage value. The city
authorities are striving to
make it safe, accessible
and attractive.
Syria Damascus Medina
Population: 20,447,000
inhab.
Population:
2,600,000 inhab.
Population:
30,000 inhab.
Area: 185,180 sq. km Area: 840 sq.km Area: 1.3 sq.km
Density: 110.4 inhab. /
sq. km
Density: 3,100
inhab. / sq. km
Urbanisation rate:
54.90%
Forecast
population of
metropolitan area
in 2025: 3,534,000
inhab.
Annual rate of urban-
population growth
(2005-2010): 3.97%
GDP / habitant:
$2,892.7
HDI: 0.632 / 1
Car ownership: 30
vehicles per 1,000
inhab.
Vehicles per km of
road: 20
Accident rate: 1.41 fatal
accidents per 10,000
inhab.
Sources: World Bank – UNDP – United Nation – Medina Guide
Damascus PROVIDING SAFE AND EASY ACCESS TO THE MEDINA
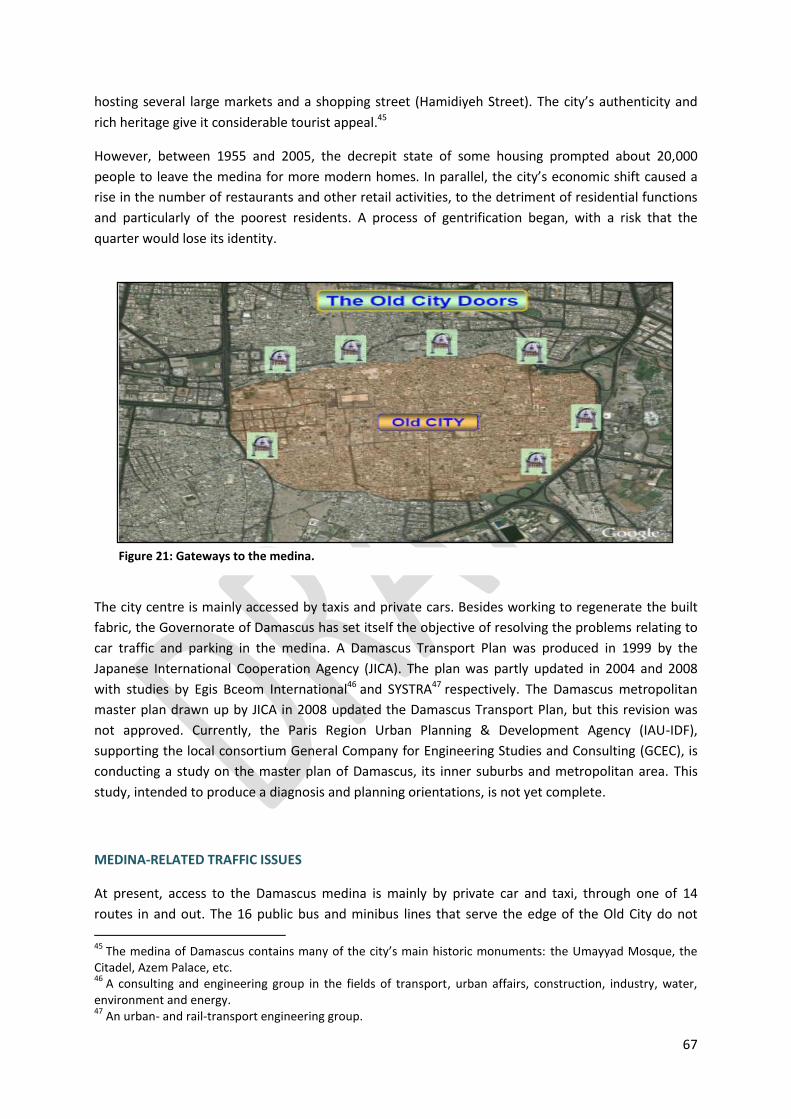
67
hosting several large markets and a shopping street (Hamidiyeh Street). The city’s authenticity and
rich heritage give it considerable tourist appeal.45
However, between 1955 and 2005, the decrepit state of some housing prompted about 20,000
people to leave the medina for more modern homes. In parallel, the city’s economic shift caused a
rise in the number of restaurants and other retail activities, to the detriment of residential functions
and particularly of the poorest residents. A process of gentrification began, with a risk that the
quarter would lose its identity.
The city centre is mainly accessed by taxis and private cars. Besides working to regenerate the built
fabric, the Governorate of Damascus has set itself the objective of resolving the problems relating to
car traffic and parking in the medina. A Damascus Transport Plan was produced in 1999 by the
Japanese International Cooperation Agency (JICA). The plan was partly updated in 2004 and 2008
with studies by Egis Bceom International46 and SYSTRA47 respectively. The Damascus metropolitan
master plan drawn up by JICA in 2008 updated the Damascus Transport Plan, but this revision was
not approved. Currently, the Paris Region Urban Planning & Development Agency (IAU-IDF),
supporting the local consortium General Company for Engineering Studies and Consulting (GCEC), is
conducting a study on the master plan of Damascus, its inner suburbs and metropolitan area. This
study, intended to produce a diagnosis and planning orientations, is not yet complete.
MEDINA-RELATED TRAFFIC ISSUES
At present, access to the Damascus medina is mainly by private car and taxi, through one of 14
routes in and out. The 16 public bus and minibus lines that serve the edge of the Old City do not
45
The medina of Damascus contains many of the city’s main historic monuments: the Umayyad Mosque, the Citadel, Azem Palace, etc. 46
A consulting and engineering group in the fields of transport, urban affairs, construction, industry, water, environment and energy. 47
An urban- and rail-transport engineering group.
Figure 21: Gateways to the medina.

68
adequately meet users’ needs. Furthermore, the only transport line through the Old City, from east
to west, was recently discontinued.
The situation as described above poses traffic and safety issues inside the medina. The flows of taxis
and private vehicles congest the Old City, and generate conflict between pedestrians and drivers,
who currently share the roads in the medina. Car parking is not regulated, and is therefore random,
to say the least. Congestion is further exacerbated by the fact that this area is a transit zone for
motorised vehicles. Pedestrians thus face very real difficulties in moving around.
PROGRAMME OF ACTION
To better serve the Old City, the Public Transport Master Plan being prepared includes creating four
new high-capacity bus lines to link the medina with the rest of the metropolitan area. These lines will
also be connected by a circular boulevard. The governorate also plans to build a metro line (in green
on the map) about 17 km long. Two of its 17 stations will be near the medina, again promoting links
with the rest of the conurbation.
However, construction of the metro line is proving problematic. The project was halted when the
new five-year plan (2011-2015) was adopted, because of funding difficulties.
The stated objective is to substantially reduce traffic jams and nuisance caused by chaotic parking.
The Public Transport Master Plan also covers traffic management in the medina:
- Ban on motorised vehicles entering the medina.
- Creation of dedicated pedestrian routes.
Figure 22: The future transport system.
69
- Creation of six car parks near the medina (three are already open, with capacity for 1,000
cars). This scheme will be supplemented by the development of regulated road parking.
- For medina access, vehicles must be electric. Charging stations are due to be located near
the medina (in car parks, on roadsides).
- Creation of a circular transport line (bus or tramway) linking the medina gates.
The religious and commercial dimension of the Old City is compelling the governorate to make
certain exceptions, to avoid conflict with the residents:
- Loading/unloading for the markets will be restricted to 5-7am and 8-10am every morning.
- Deliveries to hotels and restaurants, and of fuel, gas and construction materials, etc. will be
made from 5-7am daily.
- School buses must stop at medina gates.
CURRENT SITUATION
The decision to ban motorised vehicles and to provide electric vehicles, due in April 2011, was finally
not implemented.
As for the metro line, it appears that funding from the sale of public land on a BOT (Build Operate
Transfer) basis is being considered. This solution will not please certain transport professionals, who
think the operator is running too big a risk. Another solution, further to the studies done for the
Governorate of Damascus, would be to create a Bus Rapid Transit (BRT) prior to construction of the
metro line.
However, given the current Syrian context, infrastructure projects are not a priority.

70
ESKISEHIR
Key words: Transport-system integration; Non-motorised modes; Planning; Public-transport projects; City-centre regeneration
REDUCING TRAFFIC AND DEVELOPING ALTERNATIVES IN A CONSTRICTED CITY CENTRE
Monograph written by Camille MARTINET and Julien ALLAIRE based on the presentation by Erhan ENBATAN, ESTRAM (Marseille conference, 2010).
Latest update: 15/11/2012
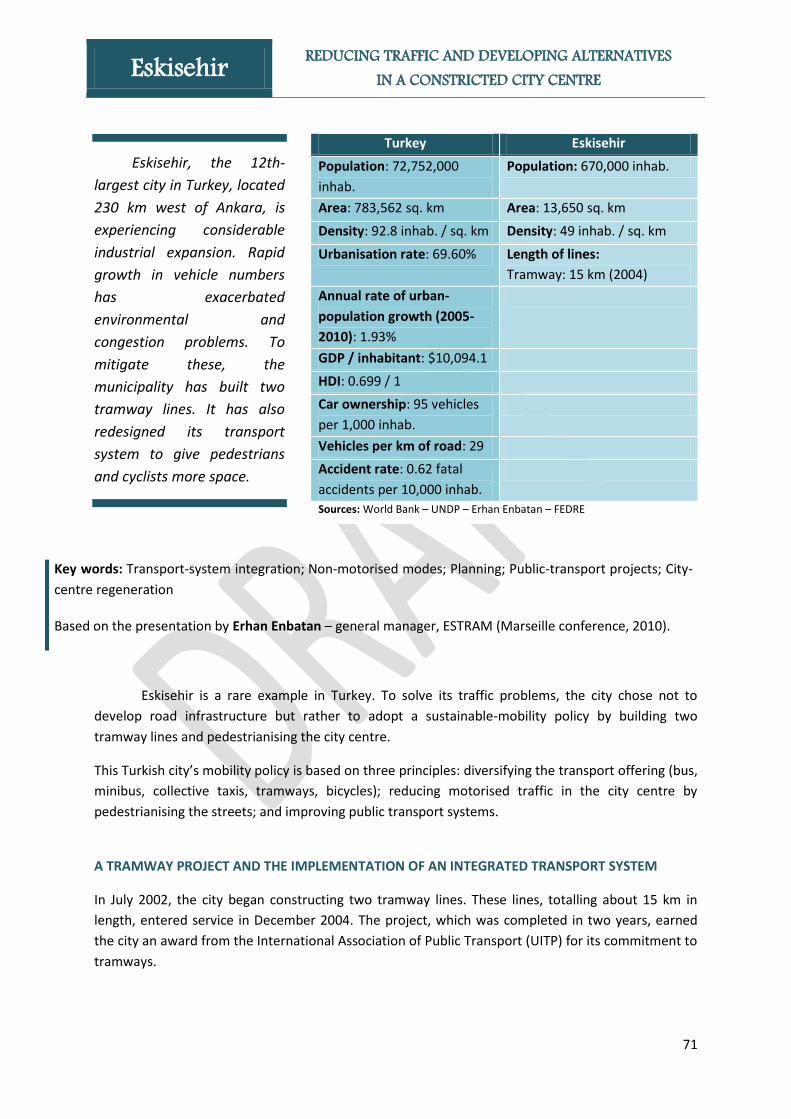
71
Eskisehir, the 12th-
largest city in Turkey, located
230 km west of Ankara, is
experiencing considerable
industrial expansion. Rapid
growth in vehicle numbers
has exacerbated
environmental and
congestion problems. To
mitigate these, the
municipality has built two
tramway lines. It has also
redesigned its transport
system to give pedestrians
and cyclists more space.
Turkey Eskisehir
Population: 72,752,000
inhab.
Population: 670,000 inhab.
Area: 783,562 sq. km Area: 13,650 sq. km
Density: 92.8 inhab. / sq. km Density: 49 inhab. / sq. km
Urbanisation rate: 69.60% Length of lines:
Tramway: 15 km (2004)
Annual rate of urban-
population growth (2005-
2010): 1.93%
GDP / inhabitant: $10,094.1
HDI: 0.699 / 1
Car ownership: 95 vehicles
per 1,000 inhab.
Vehicles per km of road: 29
Accident rate: 0.62 fatal
accidents per 10,000 inhab.
Sources: World Bank – UNDP – Erhan Enbatan – FEDRE
Key words: Transport-system integration; Non-motorised modes; Planning; Public-transport projects; City-
centre regeneration
Based on the presentation by Erhan Enbatan – general manager, ESTRAM (Marseille conference, 2010).
Eskisehir is a rare example in Turkey. To solve its traffic problems, the city chose not to
develop road infrastructure but rather to adopt a sustainable-mobility policy by building two
tramway lines and pedestrianising the city centre.
This Turkish city’s mobility policy is based on three principles: diversifying the transport offering (bus,
minibus, collective taxis, tramways, bicycles); reducing motorised traffic in the city centre by
pedestrianising the streets; and improving public transport systems.
A TRAMWAY PROJECT AND THE IMPLEMENTATION OF AN INTEGRATED TRANSPORT SYSTEM
In July 2002, the city began constructing two tramway lines. These lines, totalling about 15 km in
length, entered service in December 2004. The project, which was completed in two years, earned
the city an award from the International Association of Public Transport (UITP) for its commitment to
tramways.
Eskisehir REDUCING TRAFFIC AND DEVELOPING ALTERNATIVES IN A CONSTRICTED CITY CENTRE
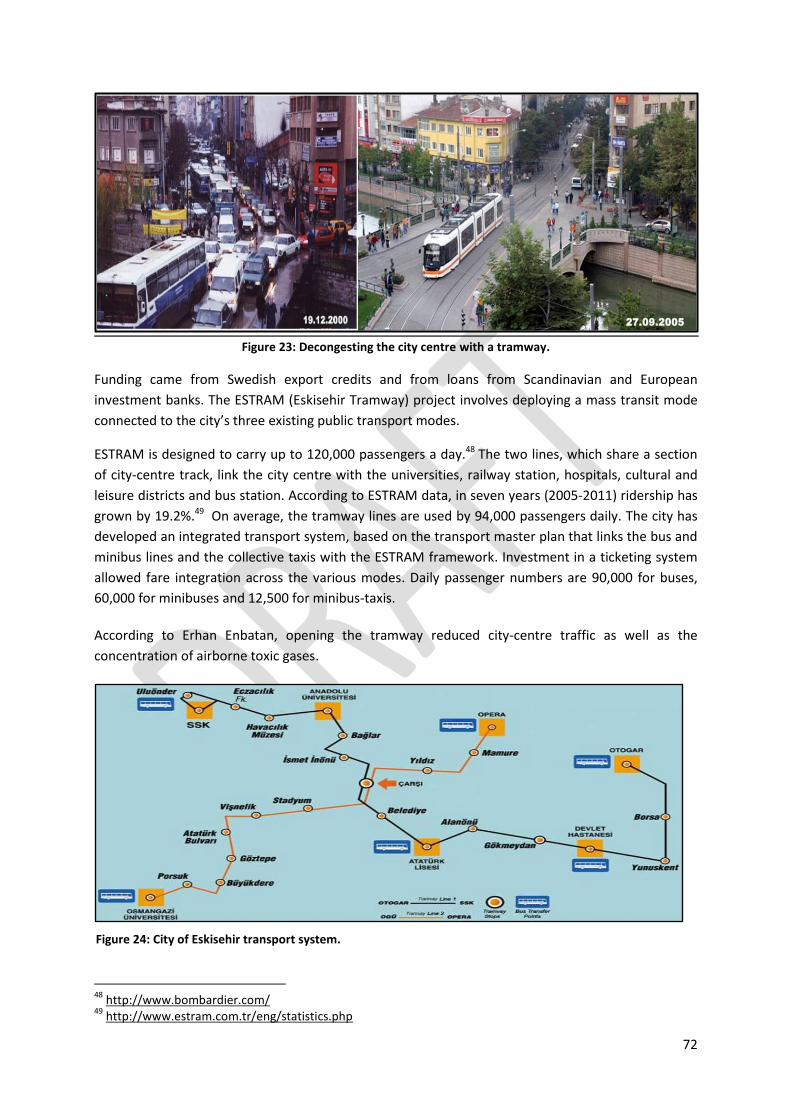
72
Figure 23: Decongesting the city centre with a tramway.
Funding came from Swedish export credits and from loans from Scandinavian and European
investment banks. The ESTRAM (Eskisehir Tramway) project involves deploying a mass transit mode
connected to the city’s three existing public transport modes.
ESTRAM is designed to carry up to 120,000 passengers a day.48 The two lines, which share a section
of city-centre track, link the city centre with the universities, railway station, hospitals, cultural and
leisure districts and bus station. According to ESTRAM data, in seven years (2005-2011) ridership has
grown by 19.2%.49 On average, the tramway lines are used by 94,000 passengers daily. The city has
developed an integrated transport system, based on the transport master plan that links the bus and
minibus lines and the collective taxis with the ESTRAM framework. Investment in a ticketing system
allowed fare integration across the various modes. Daily passenger numbers are 90,000 for buses,
60,000 for minibuses and 12,500 for minibus-taxis.
According to Erhan Enbatan, opening the tramway reduced city-centre traffic as well as the
concentration of airborne toxic gases.
48
http://www.bombardier.com/ 49
http://www.estram.com.tr/eng/statistics.php
Figure 24: City of Eskisehir transport system.
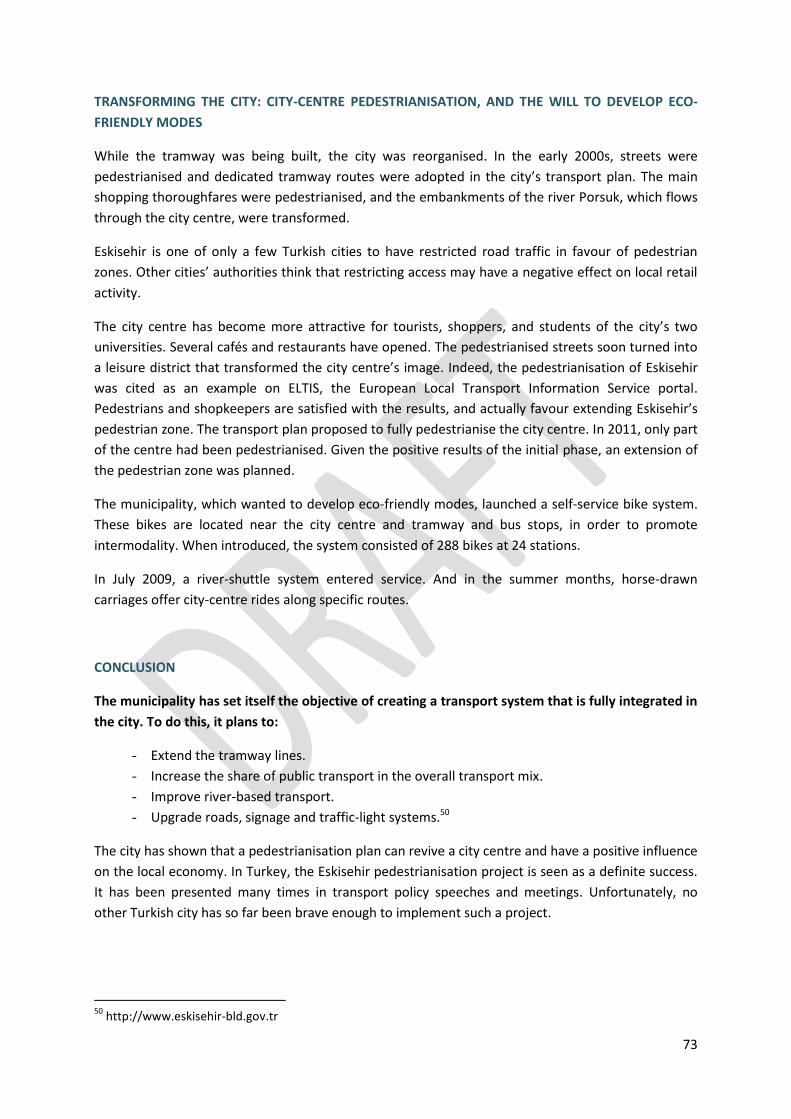
73
TRANSFORMING THE CITY: CITY-CENTRE PEDESTRIANISATION, AND THE WILL TO DEVELOP ECO-
FRIENDLY MODES
While the tramway was being built, the city was reorganised. In the early 2000s, streets were
pedestrianised and dedicated tramway routes were adopted in the city’s transport plan. The main
shopping thoroughfares were pedestrianised, and the embankments of the river Porsuk, which flows
through the city centre, were transformed.
Eskisehir is one of only a few Turkish cities to have restricted road traffic in favour of pedestrian
zones. Other cities’ authorities think that restricting access may have a negative effect on local retail
activity.
The city centre has become more attractive for tourists, shoppers, and students of the city’s two
universities. Several cafés and restaurants have opened. The pedestrianised streets soon turned into
a leisure district that transformed the city centre’s image. Indeed, the pedestrianisation of Eskisehir
was cited as an example on ELTIS, the European Local Transport Information Service portal.
Pedestrians and shopkeepers are satisfied with the results, and actually favour extending Eskisehir’s
pedestrian zone. The transport plan proposed to fully pedestrianise the city centre. In 2011, only part
of the centre had been pedestrianised. Given the positive results of the initial phase, an extension of
the pedestrian zone was planned.
The municipality, which wanted to develop eco-friendly modes, launched a self-service bike system.
These bikes are located near the city centre and tramway and bus stops, in order to promote
intermodality. When introduced, the system consisted of 288 bikes at 24 stations.
In July 2009, a river-shuttle system entered service. And in the summer months, horse-drawn
carriages offer city-centre rides along specific routes.
CONCLUSION
The municipality has set itself the objective of creating a transport system that is fully integrated in
the city. To do this, it plans to:
- Extend the tramway lines.
- Increase the share of public transport in the overall transport mix.
- Improve river-based transport.
- Upgrade roads, signage and traffic-light systems.50
The city has shown that a pedestrianisation plan can revive a city centre and have a positive influence
on the local economy. In Turkey, the Eskisehir pedestrianisation project is seen as a definite success.
It has been presented many times in transport policy speeches and meetings. Unfortunately, no
other Turkish city has so far been brave enough to implement such a project.
50
http://www.eskisehir-bld.gov.tr

74
FERRARA
Key words: Non-motorised modes; Planning; City-centre regeneration
A COMPREHENSIVE POLICY TO PROMOTE CYCLING
Monograph written by Camille MARTINET and Julien ALLAIRE based on the presentation by Alberto CROCE, City of Ferrara (Marseille conference, 2010).
Latest update: 15/11/2012

75
Ferrara is an Italian city
located halfway between Florence
and Venice. In the mid-1990s, two
factors prompted the municipality
to rethink its transport policy: the
city was placed on UNESCO’s
World Heritage List, and Italian
cities with more than 30,000
inhabitants were required to
introduce an urban travel plan. The
municipality wanted to increase
accessibility in order to preserve its
heritage and develop tourism. The
policies adopted by Ferrara have
made this city a Mediterranean
model for cycling policies.
Italy Ferrara
Population: 60,483,000
inhab.
Population: 135,000
inhab.
Area: 301,336 sq. km Area: 405 sq. km
Density: 200.7 inhab. / sq.
km
Density: 330 inhab. / sq.
km
Urbanisation rate: 68.40% Bike paths: 86.1 km
(2007)
Annual rate of urban-
population growth (2005-
2010): 0.71%
Modal mix:
Private cars: 56%
Public transport: 5%
Active modes: 39%
GDP / inhabitant: $34,075.1
HDI: 0.874 / 1
Car ownership: 596 vehicles
per 1,000 inhab.
Vehicles per km of road: 80
Accident rate: 0.96 fatal
accidents per 10,000 inhab.
Sources: World Bank – UNDP – Albert Croce – Pietro Osti – EPOMM
Key words: Non-motorised modes; Planning; City-centre regeneration
Based on:
- A presentation by Alberto Croce – consultant and former City of Ferrara transport director
(Marseille conference, 2010).
- The 2010 brochure by Pietro Osti – “Ferrara by bike”.
The municipality of Ferrara consists of a medieval centre, where two-thirds of its population
live, and 42 surrounding villages of widely varying size. To enhance its tourist appeal, Ferrara
restricted motorised-vehicle traffic back in the late 1960s. The old city was closed to cars and
motorbikes in favour of pedestrians and cyclists51. Car traffic was allowed outside this pedestrian
zone (about 6.5 ha), but with many restrictions, within a 130 hectares area.
In Italy, under the revised 1992 version of the Highway Code, cities with more than 30,000
inhabitants were required to implement an urban transport plan. Starting in the mid-1990s, Ferrara
devised a comprehensive strategy to reduce car traffic in the city and promote a switch to active
modes of transport. The Limited Traffic Zone, a central zone subject to access control for motorised
vehicles, was extended and LTZ access rules were hardened to favour cleaner vehicles:
51
http://ec.europa.eu/environment/archives/cycling/cycling_en.pdf
Ferrara A COMPREHENSIVE POLICY TO PROMOTE CYCLING
76
- A charging access through a pre-paid “admission permit” was introduced. The fee varies
according to the type of vehicle, level of emissions, and profile of the permit-holder
(resident, owner of an off-street parking place, visitor, small shopkeeper, delivery driver).
- A more efficient system to enforce the access to the LTZ (encompassing 16 “gates” on the
LTZ boundary) was introduced in April 2011, based on ANPR (automatic number plate
recognition) technology, pioneered in Italy since 1995 in the neighboring town of Bologna
with electronic scanning of the registration plate of vehicles entering the city centre.
In addition to this LTZ, extensive on street parking charging was applied throughout the city centre,
and 8 parking facilities were built on the edge of the old city (by the ramparts) for a total amount of
2.530 car places (880 are free of charge). High-frequency shuttle services were launched to provide a
link with the city centre. In addition, about 80% of the urban bus fleet was converted to natural gas.
Next, company travel plans were drawn up for public establishments, the hospital, city council
departments, etc.
But the city’s flagship policy in terms of sustainable mobility is the promotion of bicycle use. Today,
Ferrara is a Mediterranean model in terms of the modal share of cycling. The topographical
characteristics of the city, which is situated in the plain of the river Po, are not the only reason for the
popularity of biking. Its development stems from several local initiatives and policies to encourage
this mean of transport.
THE BICYCLE’S PLACE IN THE CITY
- In 1995, the municipality introduced the BICI Card, which lets tourists leave their cars in a
car park and borrow a bike and visit museums, all free of charge, enjoying discounts in the
city’s hotels, restaurants and shops.
- In 1996, a special office (“Ufficio biciclette”) was set up to promote bike use. It was the first
of its kind in Italy. Since 2005, as part of Local Agenda 21 initiative, this Office does the work
of coordinating the network of the Italian cities that have created a similar office and now
has grown up to include 30 cities.
- In 2000, a Biciplan was rolled out. This is the operational planning instrument for the
development of bike use in the Ferrara metropolitan area. It was incorporated in the Urban
Traffic Plan (PUT, 2004) and forms an essential pillar of the mobility policy adopted by the
city of Ferrara within its newly released PUM Piano della Mobiltà Urbana (PUM, 2009), with
the following main goals:
o Create optimal conditions for bike riding in the dense urban zones. To increase the
appeal of biking and walking in the old town, the former cobbles have been replaced
by flatter and wider paving stones.
o Create a number of reserved bike paths – running alongside trunk roads connecting
the city with the other regional poles – in order to offer an improved and safer
accessibility from the majority of the 42 villages located in the outskirts of Ferrara.
o Guarantee a high level of operation of the cycle paths network, sustained over time.
o Ensure maximum safety of all routes, to convince all user categories to cycle. For
example, to reduce the risk of accidents were introduced bicycle reserved routes
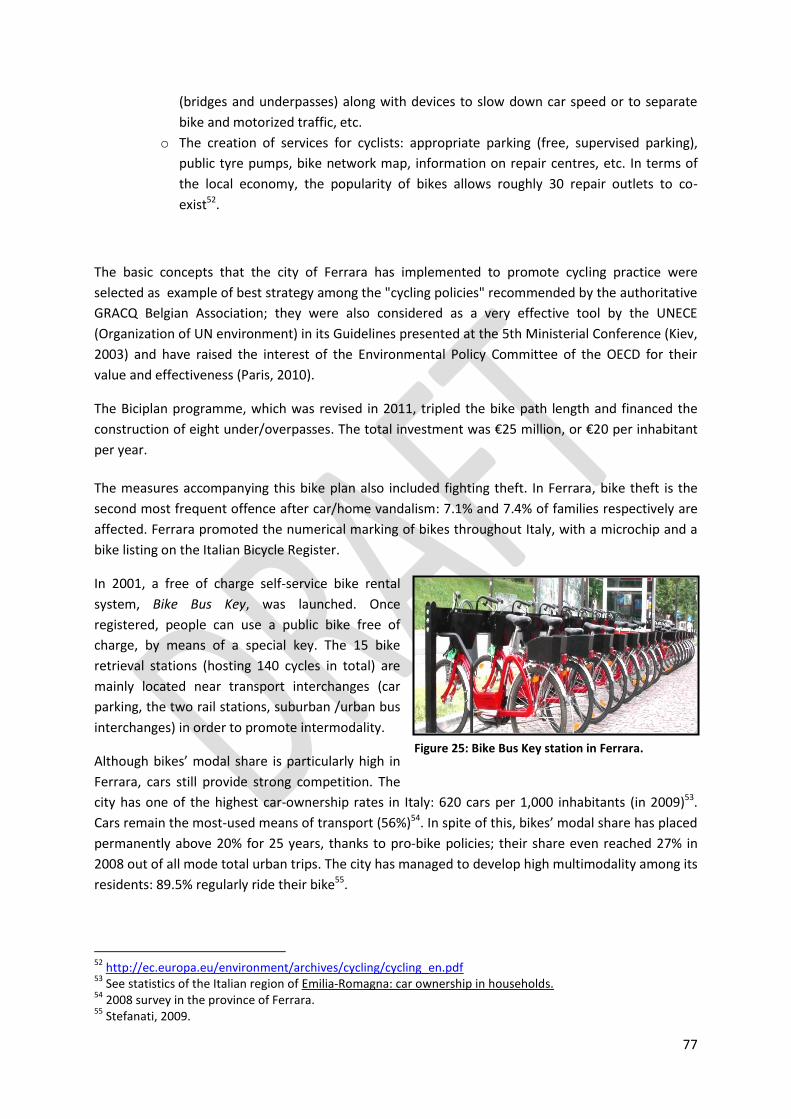
77
(bridges and underpasses) along with devices to slow down car speed or to separate
bike and motorized traffic, etc.
o The creation of services for cyclists: appropriate parking (free, supervised parking),
public tyre pumps, bike network map, information on repair centres, etc. In terms of
the local economy, the popularity of bikes allows roughly 30 repair outlets to co-
exist52.
The basic concepts that the city of Ferrara has implemented to promote cycling practice were
selected as example of best strategy among the "cycling policies" recommended by the authoritative
GRACQ Belgian Association; they were also considered as a very effective tool by the UNECE
(Organization of UN environment) in its Guidelines presented at the 5th Ministerial Conference (Kiev,
2003) and have raised the interest of the Environmental Policy Committee of the OECD for their
value and effectiveness (Paris, 2010).
The Biciplan programme, which was revised in 2011, tripled the bike path length and financed the
construction of eight under/overpasses. The total investment was €25 million, or €20 per inhabitant
per year.
The measures accompanying this bike plan also included fighting theft. In Ferrara, bike theft is the
second most frequent offence after car/home vandalism: 7.1% and 7.4% of families respectively are
affected. Ferrara promoted the numerical marking of bikes throughout Italy, with a microchip and a
bike listing on the Italian Bicycle Register.
In 2001, a free of charge self-service bike rental
system, Bike Bus Key, was launched. Once
registered, people can use a public bike free of
charge, by means of a special key. The 15 bike
retrieval stations (hosting 140 cycles in total) are
mainly located near transport interchanges (car
parking, the two rail stations, suburban /urban bus
interchanges) in order to promote intermodality.
Although bikes’ modal share is particularly high in
Ferrara, cars still provide strong competition. The
city has one of the highest car-ownership rates in Italy: 620 cars per 1,000 inhabitants (in 2009)53.
Cars remain the most-used means of transport (56%)54. In spite of this, bikes’ modal share has placed
permanently above 20% for 25 years, thanks to pro-bike policies; their share even reached 27% in
2008 out of all mode total urban trips. The city has managed to develop high multimodality among its
residents: 89.5% regularly ride their bike55.
52
http://ec.europa.eu/environment/archives/cycling/cycling_en.pdf 53
See statistics of the Italian region of Emilia-Romagna: car ownership in households. 54
2008 survey in the province of Ferrara. 55
Stefanati, 2009.
Figure 25: Bike Bus Key station in Ferrara.

78
As a conclusion, Ferrara has designed a holistic strategy to organise the city’s traffic; it aims to
integrate the various modes of transport, so as to ensure and increase city-centre accessibility. The
municipality applies measures to encourage bike use, but also measures to restrict personal car use
in the core of city centre. According to Alberto Croce, “Bike use is not a residual form of transport. It
plays an efficient role in reducing the negative impacts of car use; it drives improvements in health
and quality of life; and lastly, it makes savings for both the municipality and households.”

79
ISTANBUL
Key words: Transport-system integration; Management modes; Public-transport projects
URBAN PLANNING IN A MEGACITY
Monograph written by Charles SIMON and Julien ALLAIRE based on the presentation by Mustafa ILICALI, Istanbul Metropolitan Municipality (Barcelona conference,
2011).
Latest update: 15/11/2012

80
Istanbul, a megacity
with more than 12 million
inhabitants, is definitely
Turkey’s engine: its political,
business and demographic
capital. Straddling Europe and
Asia, Istanbul has developed
along 100 km of the Marmara
Sea coast. This international-
class metropolitan area is now
highly congested. To address
these problems, several
projects have been undertaken
to develop the city’s urban rail
system.
Turkey Istanbul
Population: 72,752,000 inhab. Population:
Metropolitan area:
12,600,000 inhab. (2007)
Area: 783,562 sq. km Area: 5,390 sq. km
Density: 92.8 inhab. / sq. km Density: 2,338 inhab. / sq.
km
Urbanisation rate: 69.60% Length of lines:
Metro: 20 km
Tramway: 22.3 km
Annual rate of urban-
population growth (2005-
2010): 1.93%
Modal mix:
Private cars: 15.7%
Public transport: 35%
Active modes: 49.3%
GDP / inhabitant: $10,094.1
HDI: 0.699 / 1
Car ownership: 95 vehicles
per 1,000 inhab.
Vehicles per km of road: 29
Accident rate: 0.62 fatal
accidents per 10,000 inhab.
Sources: World Bank – UNDP – Blue Plan – UrbanRail.net
Key words: Transport-system integration; Management modes; Public-transport projects
Based on the presentation by Mustafa Ilicali – Istanbul Metropolitan Municipality (Barcelona conference,
2011).
Since the 1950s, Istanbul has witnessed particularly strong demographic growth: its
population has tripled in 30 years. Its urban growth has now stabilised at about 3.3% a year, but this
rate is nevertheless the highest in the metropolitan areas of OECD countries.
To cope with this demographic growth, Istanbul has had to manage a discontinuous space (uneven
land, split in two by the Bosphorus Strait). This geographical complexity has prompted the spatial
planners to arrange the city polycentrically.
In economic terms, Istanbul is now fully integrated in the global economy and is an urban centre of
top international rank. At national level, Istanbul is unquestionably the country’s premier city.
Istanbul URBAN PLANNING IN A MEGACITY
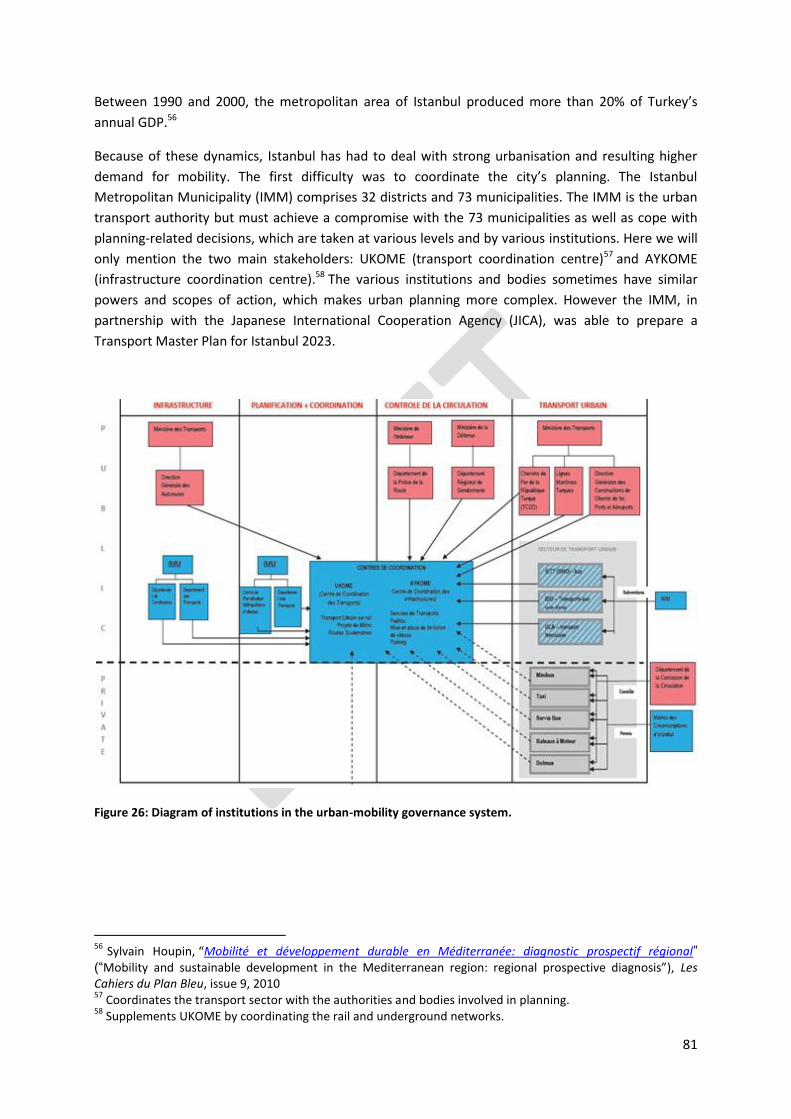
81
Between 1990 and 2000, the metropolitan area of Istanbul produced more than 20% of Turkey’s
annual GDP.56
Because of these dynamics, Istanbul has had to deal with strong urbanisation and resulting higher
demand for mobility. The first difficulty was to coordinate the city’s planning. The Istanbul
Metropolitan Municipality (IMM) comprises 32 districts and 73 municipalities. The IMM is the urban
transport authority but must achieve a compromise with the 73 municipalities as well as cope with
planning-related decisions, which are taken at various levels and by various institutions. Here we will
only mention the two main stakeholders: UKOME (transport coordination centre)57 and AYKOME
(infrastructure coordination centre).58 The various institutions and bodies sometimes have similar
powers and scopes of action, which makes urban planning more complex. However the IMM, in
partnership with the Japanese International Cooperation Agency (JICA), was able to prepare a
Transport Master Plan for Istanbul 2023.
Figure 26: Diagram of institutions in the urban-mobility governance system.
56
Sylvain Houpin, “Mobilité et développement durable en Méditerranée: diagnostic prospectif régional” (“Mobility and sustainable development in the Mediterranean region: regional prospective diagnosis”), Les Cahiers du Plan Bleu, issue 9, 2010 57
Coordinates the transport sector with the authorities and bodies involved in planning. 58
Supplements UKOME by coordinating the rail and underground networks.

82
ISTANBUL’S TRANSPORT OFFERING
Demand for mobility has risen considerably: in 2004 there were 11 million journeys daily; in 2011, 23
million. This explosion in mobility entailed a big increase in the number of private vehicles. Mustafa
Ilicali, of the IMM, estimates that 600 more cars join Istanbul’s streets every day. Residents’ high
dependency on cars, and more widely on the road network, causes near-permanent congestion in
central Istanbul.
Even so, the Turkish capital has an extensive and varied public transport system. The rapid
development of this system has increased passenger numbers while reducing average journey time,
which between 2004 and 2010 shortened from 53 to 49 minutes.
The bus and minibus offering is particularly well developed, with 591 bus lines and 123 minibus lines.
These services are operated by the public company IETT and several private operators. They are now
the most-used public-transport mode, with 83% of all system journeys in 2010. Istanbul’s Bus Rapid
Transit (BRT) project (phase one launched in September 2007) helped to improve bus service. In 2011
– when phase three, extending BRT network length to 41 km, was completed – passenger numbers
rose to 700,000 a day. Journey times for all users have shortened significantly.
The rail network (total length: 138 km) comprises a metro (8.5 km), a light metro (19.3 km), five
tramways (36 km), two funiculars (1.2 km) and a suburban railway (72 km). The rail network currently
represents 13% of daily journeys. Ridership on the rail network has been growing fast: in 2004 it
accounted for only 8.6%, a share expected to rise to 31% by 2014, to the detriment of buses.

83
The Transport Master Plan for Istanbul 2023 focused mainly on developing this transport mode in
order to begin decongesting Istanbul.
Some 52 km of metro lines are under construction, and the rail network will total more than 230 km.
A 13.5 km rail tunnel is being built to make crossing the Bosphorus easier: the Marmaray project,
costing about $2.8 billion. This project, totalling 77 km, will connect to the rail network at 10 points.
In addition, eight monorail lines (total length: 48 km) are planned.
The sea-transport offering amounts to 3% of daily journeys, and is trending downward. This mode is
mainly used to cross the Bosphorus.
From a financial perspective, the projects presented here are economically viable and well-rated by
the international ratings agencies. Istanbul has received substantial funding from various institutions.
The Levent – Ayazaga – Haciosman metro line project is a perfect example: it is funded by the French
Development Agency (AFD) and the European Investment Bank (EIB) for a total of €340 million. But
Mustafa Ilicali points out that several contraints may apply to projects: respect for the environment,
respect for heritage (requirements are tougher if it is listed by UNESCO), etc. These constraints may
lengthen the credit-approval process, and even cause contract cancellations (if, for example, credits
are not used within the negotiated timeframes).
Figure 275: Seyrantepe multimodal hub.
To secure its transport infrastructure funding model over the long term, the municipality of
Istanbul conducted valuations of land and property around the stations. The Seyrantepe multimodal
hub, which serves the Galatasaray stadium and a hospital, is expected to host many activities,
including a maintenance centre (42,000 sq. m) and a depot (44,000 sq. m). In addition, the hub,
which is near a motorway, will offer 136,000 sq. m of parking. Furthermore, there are plans to build
retail and office space above the hub. Leasing this space should earn substantial revenue for the
transport authority.

84
IZMIR
Key words:
Urban governance; Transport-system integration
AN EFFICIENT, INTEGRATED TRANSPORT SYSTEM
Monograph written by Camille MARTINET and Julien ALLAIRE, based on the presentation by Aysin NALÂN YETMEN, Izmir Metropolitan Municipality (Barcelona
conference, 2011).
Latest update: 15/11/2012

85
Izmir, located in western
Turkey on the Aegean Sea
coast, is the country’s third-
largest metropolitan area by
population. Served by several
railway lines, it is the country’s
second-largest port after
Istanbul. To relieve road
congestion in this fast-growing
city, the municipality has
decided to implement a major
project to integrate its
transport systems.
Turkey Izmir
Population: 72,752,000 inhab. Population: 4,000,000
inhab. (2010)
Area: 783,562 sq. km Area: 11,810 sq. km
Density: 92.8 inhab. / sq. km Density: 340 inhab. / sq.
km
Urbanisation rate: 69.60% Length of lines: Metro: 14.2 km
Annual rate of urban-population growth (2005-2010): 1.93%
GDP / inhabitant: $10,094.1
HDI: 0.699 / 1
Car ownership: 95 vehicles per 1,000 inhab.
Vehicles per km of road: 29
Accident rate: 0.62 fatal accidents per 10,000 inhab.
Sources: World Bank – UNDP – Aysin Nalân Yetmen – Urbanrail.net
Key words: Urban governance; Transport-system integration
Based on the presentation by Aysin Nalân Yetmen, Head of Transport Planning Department, Izmir Metropolitan Municipality (Barcelona conference, 2011)59.
In Turkey, there is no national agency in charge of coordinating urban transport.60 Each
municipality has its own development and management responsibilities. Frequently, the same public
agency is both the direct operator of public transport and the authority that oversees private-sector
transport.
AN EARLY FARE-INTEGRATION PROCESS
Since the early 1990s, Izmir’s strategy has been to put in place a fully-integrated transport system.
This began in 1991, when private minibuses were restricted to serving rural areas only.
The ticketing system did not integrate the various modes of transport and was inefficient: users had
to buy single-use paper tickets for bus journeys, and tokens for ferry journeys. This meant a high cost
for users; there was no fraud prevention; and journey data could not be collected. In 1999, a system
59
Integrated public transport in Izmir – Aysin Nalân Yetmen. 60
Economic affairs office of the French embassy in Ankara – 2008.
Izmir AN EFFICIENT, INTEGRATED TRANSPORT SYSTEM

86
for electronic payment of transport services was introduced. This is controlled by ESHOT (Izmir’s
public agency for transport) and the general management of Izmir Metropolitan Municipality.
Once operational, the “Kentkart” card allowed users to travel by bus and ferry with preferential fares
compared to those of paper-ticket users. Most passengers used it to receive discounts on multi-stage
journeys. This fare integration preceded the launch of a vast programme to transform the transport
offering, which coincided with the opening of a new metro line.
TRANSPORT TRANSFORMATION PROGRAMME
In 2000, the municipality of Izmir launched its “transport transformation” programme, geared to
restructuring public-transport service and thus increasing use. Over the past 10 years, private cars
have taken up increasing space in this Turkish city: between 1998 and 2005, the number of
motorised vehicles grew by 52%.61 Car ownership in Izmir is higher than the Turkish average: 126 cars
per 1,000 inhabitants in 2008, compared to 95 nationally.62 This has obviously exacerbated
congestion.
The programme aimed to improve integration between the various transport modes and to make
public transport – particularly by rail and sea – attractive in order to relieve the road network.
In phase one of the programme, buses and ferries were integrated into Izmir’s public transport
system. The Kentkart also covered these two modes. In addition, bus fares were revised. The price is
no longer fixed, but based on the distance travelled across up to four zones (long-, mid- and short-
distance bus, and connection buses). The connection buses offer a low-cost journey and link the
transit hubs between the centres of activity, universities, shopping centre, new metro stations and
ferries. In the sea-transport sector, the ferry fleet was expanded, and new wharfs and park-and-ride
facilities were built.
These reforms heralded the entry into service of a first light-metro line in May 2000. This section,
11.5 km long, is the first phase of the project being run by the city, which wants to build 50 km of
lines.63 This first line, which can carry up to 17,700 passengers an hour in each direction, soon beat
the initial forecast of 40,000 journeys a day. In April 2011, the metro was used for 53,000 journeys
daily. The project was funded by export credits from the United Kingdom, Sweden and Germany, and
by commercial loans from international banking consortia. When the metro entered service, it was
immediately covered by the Kentkart.
In 2004, the paper bus tickets used by occasional travellers were discontinued permanently and were
replaced by the “onboard card”. But this card created other problems. Because the bus driver was
handling money, vehicle operation speed and safety were reduced.
In the same year, ESHOT’s scope was extended. More Kentkart retail outlets were opened across the
61
www.turkstat.gov.tr 62
Tüik Izmir, Directorate of Izmir Region. 63
Bombardier designed and built tunnels, viaducts and stations; and installed and commissioned the entire system. http://www.bombardier.com/fr/transport/produits-et-services/systemes-de-transport/systemes-de-vehicules-legers-sur-rail/izmir--turquie?docID=0901260d80014594

87
city, and on/in bus platforms and terminals. Users entitled to free travel (the elderly, public-sector
workers, disabled people, etc.) must also use an electronic Kentkart so that their travel data are
processed.
In October 2008, a new fare policy was introduced. After a first journey at the full rate, connecting
journeys cost half-price for 90 minutes. In August 2012, a single ticket is enough, the fare policy
changed again: city-centre travellers, having initially punched their ticket, enjoy unlimited use of the
whole system for 90 minutes. However, if transferring to a provincial bus, after paying a provincial
ticket price, they pay less then provincial ticket price and they did not pay city center.
In 2010, suburban trains were integrated into the system and joined the Kentkart scheme. This
meant the entire public-transport system of Izmir was now unified. Multimodal hubs have since
multiplied. There are five connecting stations for ferry/bus, four for bus/metro, and 16 for
bus/suburban train.
On 30 March 2012, the metro-line extension (2.3 km) entered service. This has enabled the launch of
phase two of the “transport transformation” project. The bus network has again been redesigned in
order to optimise integration of all modes.
In parallel to these operations, ESHOT regularly runs campaigns to communicate on the benefits of
public transport.
Aysin Nalân Yetmen lists the advantages of an integrated public transport system:
- Less bus traffic, so less urban pollution.
- Cheaper transport.
- A faster, higher-quality service.
- Shorter waiting times for passengers.
- Savings for citizens, thanks to distance-based fares.
- Higher productivity and rising operation speed.

88
- Far more efficient transport and more intense mobility.
- Increased revenue (+47%).
- The Kentkart allows us to collect travel data and, once they have been processed, to
provide statistics that are useful for the future planning of the whole system.64
PROJECTS
According to the metropolitan transport master plan for the period up to 2030,65 Izmir plans to
extend its suburban train network by 108 km and then to connect all industrial and all tourist sites.
The upgrade of a suburban train line running from north to south of the conurbation is also under
study.66 This line will be integrated into the future urban express network. The line already in
operation, which carries some 550,000 travellers daily, is scheduled for extension – at present, there
is only one suburban train line (see network map).
The municipality also plans to develop a modern tramway in order to reduce the number of buses on
the roads. New embarkations will also be created to make the ferries more efficient.
In addition, the municipality plans to upgrade bus stops with smart systems; integrate minibuses (in
2012) and the tramway (2015); and integrate taxis into the whole system.
As shown in the table below, the rail network is set to become one of the main modes of motorised
travel, by winning customers from urban buses and minibuses. In addition, the municipality is also
aiming to reduce the share of cars in the modal mix.
64
Eltis – Faciliter les transports publics à Izmir: la carte de transport « Kentkart » (“Facilitating public transport in Izmir: the ‘Kentkart’ travel card”). 65
http://www.izmir.bel.tr/en/projelerb.asp?pID=84&psID=0 66
The European Investment Bank provided €150 million of project finance – Economic affairs office of the French embassy in Ankara – 2008.
Figure 28: The modal mix of transport in 2005, and the modal shares targeted by the “Transport transformation” project.
89
CONCLUSION
The development of an integrated transport system and an appropriate fare policy increased the
number of public transport users by 14% between 1999 and 2003. In 2003, 36 million people used
the metropolitan system.67 Except for buses, which saw a temporary drop in use due to intensive
network restructuring, the number of passengers in other modes has seen steady growth.
67
Eltis – “Transformation in transportation” in Izmir.

90
CAIRO
Key words:
Planning; Environmental policy; Owner-driver transport systems
RENEWING THE TAXI FLEET TO FIGHT AIR POLLUTION
Monograph written by Charles SIMON and Julien ALLAIRE based on the presentation by Kawthar HEFNY, EEAA (Damascus conference, 2010).
Latest update: 15/11/2012

91
Located by the river Nile,
the metropolitan area of
Cairo, more commonly
called Greater Cairo, has a
population of more than 16
million inhabitants and a
total area of 1,492 sq. km.
The Egyptian capital is the
fourth most densely
populated city in the
developing countries.
Pollution levels due to
traffic are particularly high.
A programme to renew the
taxi fleet has begun.
Egypt Cairo
Population: 81,121,000 inhab. Population: 11,001,000
inhab.
Area: 1,002,000 sq. km Area: 290 sq. km
Density: 81 inhab. / sq. km Density: 37,934 inhab. / sq.
km
Urbanisation rate: 42.80% Forecast population of
metropolitan area in 2025:
13,531,000 inhab.
Annual rate of urban-
population growth (2005-
2010): 1.99%
Length of lines: (2012)
Metro: 70 km
GDP / inhabitant: $2,698.4
HDI: 0.644 / 1
Car ownership: 33 vehicles per
1,000 inhab.
Vehicles per km of road: 37
Accident rate: 1.63 fatal
accidents per 10,000 inhab.
Sources: World Bank – UNDP – Sylvain Houpin: Les cahiers du plan bleu 9 –
UrbanRail.net
Key words: Planning; Environmental policy; Owner-driver transport systems
Based on the presentation by Kawthar Hefny – General Manager, Egyptian Environmental Affairs Agency
(EEAA), (Damascus conference, 2010).
Cairo is the biggest conurbation in Africa. And with nearly 39,000 inhabitants/sq. km, it is one
of the world’s most densely populated cities.
From the 1980s onwards, the Greater Cairo area wanted to restrict demographic pressure in the
centre of the metropolitan area by developing business zones in the peripheral governorates and by
building new towns. These towns, which were intended to create new urban poles, had limited
success. Cairo has remained one of the world’s most densely populated cities, with a rate 10 times
higher than the Paris region. However, this spatial reorganisation increased the number and distance
of commuter journeys.
Cairo generates nearly 20 million motorised journeys a day; two-thirds are on public transport.
Cairo RENEWING THE TAXI FLEET TO FIGHT AIR POLLUTION
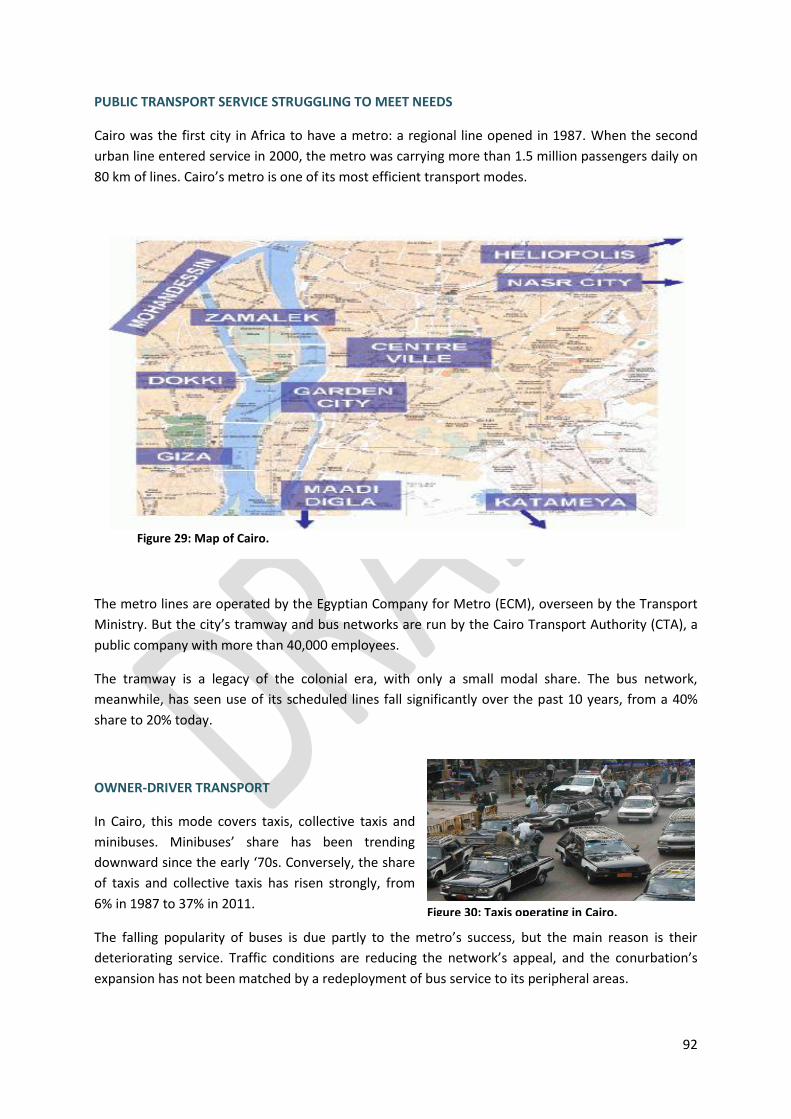
92
PUBLIC TRANSPORT SERVICE STRUGGLING TO MEET NEEDS
Cairo was the first city in Africa to have a metro: a regional line opened in 1987. When the second
urban line entered service in 2000, the metro was carrying more than 1.5 million passengers daily on
80 km of lines. Cairo’s metro is one of its most efficient transport modes.
The metro lines are operated by the Egyptian Company for Metro (ECM), overseen by the Transport
Ministry. But the city’s tramway and bus networks are run by the Cairo Transport Authority (CTA), a
public company with more than 40,000 employees.
The tramway is a legacy of the colonial era, with only a small modal share. The bus network,
meanwhile, has seen use of its scheduled lines fall significantly over the past 10 years, from a 40%
share to 20% today.
OWNER-DRIVER TRANSPORT
In Cairo, this mode covers taxis, collective taxis and
minibuses. Minibuses’ share has been trending
downward since the early ‘70s. Conversely, the share
of taxis and collective taxis has risen strongly, from
6% in 1987 to 37% in 2011.
The falling popularity of buses is due partly to the metro’s success, but the main reason is their
deteriorating service. Traffic conditions are reducing the network’s appeal, and the conurbation’s
expansion has not been matched by a redeployment of bus service to its peripheral areas.
Figure 29: Map of Cairo.
Figure 30: Taxis operating in Cairo.
93
Taxis have capitalised on the deficiencies of over-ground public transport in order to grow their
modal share. Their adaptability makes them faster than buses and allows them to serve peripheral
areas.
However, taxis are largely responsible for traffic congestion, and are a big factor in the deterioration
of air quality.
CHRONIC CONGESTION AND AIR POLLUTION
The number of motorised vehicles in Greater Cairo has been growing constantly since the ‘70s. More
than 1.5 million vehicles are currently driven in the Egyptian capital. Although car ownership is still
low, at 84 vehicles/1,000 inhabitants, traffic conditions are considered the world’s worst owing to an
absence of traffic management. The average traffic speed is 11 km/h. Walking remains the dominant
mode of travel, but is suffering from this situation. It is increasingly dangerous to walk in the city.
The pollution caused by Cairo’s dense traffic is problematic. Motorised vehicles produce 90% of
particulate emissions, 90% of carbon-monoxide emissions and 50% of nitrogen oxide. The health and
environmental risks have prompted the national authorities to monitor air quality more closely, and
to adopt policies to cut pollutant emissions by meeting the following objectives:
- Renew the fleet of old taxis in Greater Cairo.
- Cut emissions from motorcycles.
- Ban two-stroke engines.
- Run public transport buses on natural gas.
NATIONAL CAMPAIGN TO LIMIT THE ENVIRONMENTAL IMPACT OF BUSES AND OWNER-DRIVER
TRANSPORT
In 2008 a traffic law stipulated a ban, starting in July 2011, on operating any public transport vehicle
or taxi more than 20 years old. A National Taxi Replacement Scheme (NTRS) was immediately started
to help taxi drivers comply. In 2011, the authorities conducted a census and recorded 85,000 taxis
and 30,000 minibuses, half of which were more than 25 years old.
To promote the purchase of a new natural gas vehicle (NGV), economic incentives were introduced:68
- Exemption from sales tax on vehicle purchases.
- Payment of a subsidy if the owner handed over the old vehicle to a recycling centre.
- Exemption from taxi-licence fees for several years.
- Free public transport pass for one or two years.
- 25% of the vehicle price is paid by the owner, who receives a six-year loan with an annual
interest rate of 7.5%.
68
Natural gas fuel for cars. Containing 97% methane, it produces 25% less CO2 emissions than petrol and practically no particulate emissions.

94
The Cairo authorities thus planned to replace 13,500 taxis and 4,500 minibuses a year for three
years. This was expected to cut annual emissions by 4,926 tons of nitrogen oxide, 30,359 tons of
carbon monoxide, and 244 tons of particulate. Although the total cost of the programme is estimated
at E£1.2 billion, the expected benefits are valued at E£638 million.
ONGOING RESULTS
In the first eight months of 2012, 14,000 taxis out of 37,000 were replaced. The new, white taxis are
relatively recent models and manufactured locally. They have a meter and air conditioning. These
results are satisfactory, especially as the context is particularly difficult. However, these good results
do not apply to minibuses.

95
MILAN
Key words: Environmental policy; City-centre regeneration
IMPLEMENTING AN ENVIRONMENTAL URBAN TOLL SCHEME
Monograph written by Camille MARTINET and Julien ALLAIRE, based on the presentation by Edoardo CROCI, IEFE, Bocconi University (Damascus conference, 2010).
Latest update: 15/11/2012

96
Milan is the
economic capital of
northern Italy and one
of the country’s most
densely populated
cities. Car ownership
even if lower than
Italian average is very
high compared to other
European cities: 570
vehicles per 1,000
inhabitants. 69 Poor air
quality and congestion
problems have
prompted the
authorities to adopt a
policy of sustainable
mobility. In this
context, the city
introduced its
environmental toll
scheme, Ecopass, in
January 2008.
Italy Milan
Population: 60,483,000 inhab. Population:
Municipality: 1,308,000
inhab.
Metropolitan area:
3,900,000 inhab.
Area: 301,336 sq. km Area:
Municipality: 182 sq. km
Metropolitan area: 2,000 sq.
km
Density: 200.7 inhab. / sq. km Density:
Municipality: 7,190 inhab. /
sq. km
Metropolitan area: 1,950
inhab. / sq. km
Urbanisation rate: 68.40% Length of lines:
Metro: 75.5 km
Tramway: 211.4 km
Annual rate of urban-population
growth (2005-2010): 0.71%
Modal mix:
Private cars: 41%
Public transport: 27.5%
Active modes: 31.5%
GDP / inhabitant: $34,075.1
HDI: 0.874 / 1
Car ownership: 596 vehicles per
1,000 inhab.
Vehicles per km of road: 80
Accident rate: 0.96 fatal accidents
per 10,000 inhab.
Sources: World Bank – UNDP – Edoardo Croci – Paris Region Urban Planning &
Development Agency (IAU-IdF) – Milan agency for mobility and environment (AMA)
Key words: Environmental policy; City-centre regeneration
Based on the presentation by Edoardo Croci – Centre for Research on Energy and Environmental
Politics and Policy (IEFE), Bocconi University (Damascus conference, 2010). 70
69
IAU-IdF. 70
Edoardo Croci – IEFE: “Sustainable mobility in Milan: the pollution charge case”, 2010.
Milan IMPLEMENTING AN ENVIRONMENTAL URBAN TOLL SCHEME

97
Lombardy is among the European regions with the poorest air quality. Life expectancy in this
part of Italy is thought to be reduced by 9-36 months owing to a high concentration of PM10 and
PM2.5, according to the European Environment Agency. This particulate is thought to cause 10-30
premature deaths per year per 10,000 inhabitants. In the Milan conurbation, thresholds for nitrogen
dioxide (NO2) and ozone (O3) are also often exceeded. The city’s location, in the Po valley surrounded
by mountains, adversely affects particulate dispersion. Road traffic is responsible for 69% of PM10
emissions.
Every day, more than a million people enter the city and 250,000 leave it. The municipality of Milan
contains two million inhabitants during working hours.
Every day, more than five million journeys are made in this area:
- 50.3% of them are between the city and periphery. In this case, 67% of journeys are made
by car or motorcycle, and 33% by public transport.
- 49.7% of journeys are made within the city. In this case, the modal shares are 36% for cars
and motorcycles, 35% for public transport, 24% for pedestrians, and 5% for bikes.
Given the air quality challenges facing Milan, the city wanted to go further in regulating car traffic
and fighting air pollution, specifically the concentration of fine particulates.
In 1992, Italian law introduced Limited Traffic Zones (LTZ) to allow municipalities to better regulate
traffic. The access and circulation in ZTL can be limited to the payment of a toll.
ECOPASS: IMPLEMENTING AN ENVIRONMENTAL URBAN TOLL SCHEME
Figure 36: “Less traffic, more clean air”.
Since January 2008, an urban toll ring called Ecopass has restricted access by the most polluting
vehicles to the historical heart of Milan. The 8.2 sq. km zone is about 5% of the city’s total area.
Restrictions apply from 7.30am to 7.30pm, Monday to Friday. The zone was defined according to the
high level of congestion and the existence of alternatives to private car use. The zone has a high
concentration of public transport services, with 28 overground and three underground lines.
Milan is the first Italian city to introduce such a toll scheme. Its objective is to reduce congestion,
discourage the use of most polluting vehicles and to encourage citizens and commuters to travel by
public transport, bike or foot.
Where Ecopass differs from the toll schemes of London and Stockholm is its pricing policy. The cost
of entering the zone varies according to the level of pollutant emissions. Low-polluting vehicles
(Ecopass class I and II), corresponding to half of circulating vehicles, can enter the zone free of
charge; the others pay a daily rate ranging from €2-€10. City-centre residents – about 80,000 people
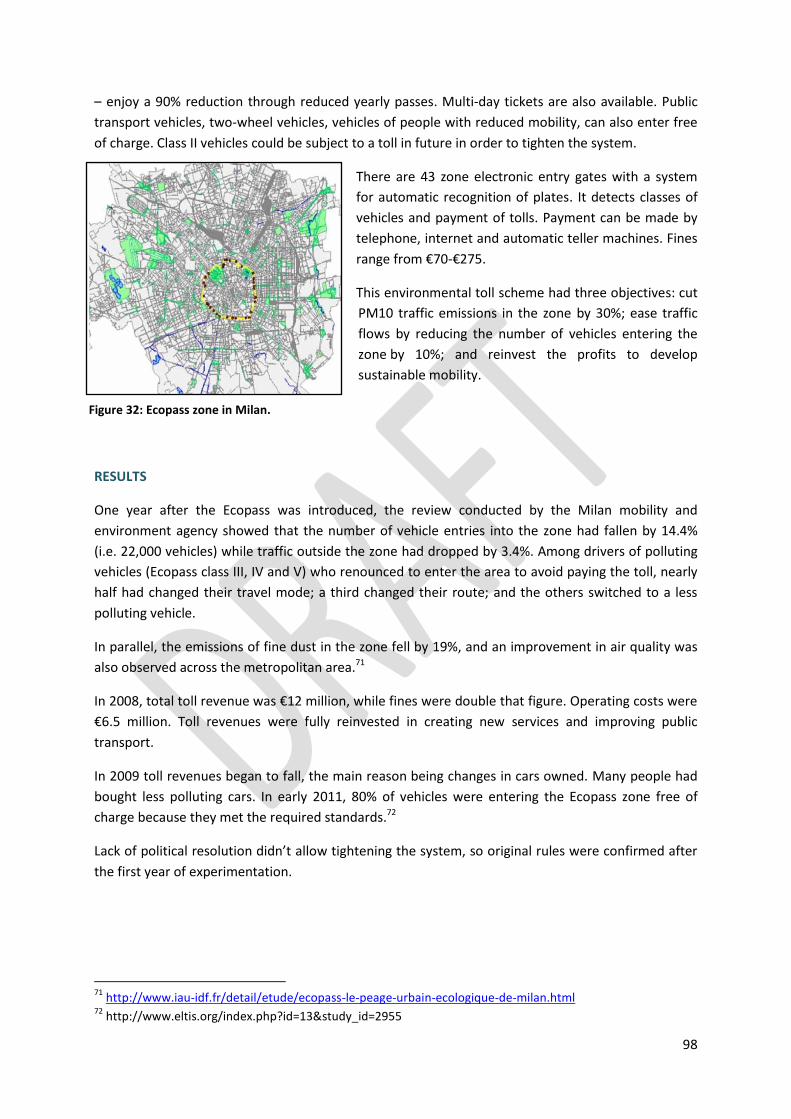
98
– enjoy a 90% reduction through reduced yearly passes. Multi-day tickets are also available. Public
transport vehicles, two-wheel vehicles, vehicles of people with reduced mobility, can also enter free
of charge. Class II vehicles could be subject to a toll in future in order to tighten the system.
There are 43 zone electronic entry gates with a system
for automatic recognition of plates. It detects classes of
vehicles and payment of tolls. Payment can be made by
telephone, internet and automatic teller machines. Fines
range from €70-€275.
This environmental toll scheme had three objectives: cut
PM10 traffic emissions in the zone by 30%; ease traffic
flows by reducing the number of vehicles entering the
zone by 10%; and reinvest the profits to develop
sustainable mobility.
RESULTS
One year after the Ecopass was introduced, the review conducted by the Milan mobility and
environment agency showed that the number of vehicle entries into the zone had fallen by 14.4%
(i.e. 22,000 vehicles) while traffic outside the zone had dropped by 3.4%. Among drivers of polluting
vehicles (Ecopass class III, IV and V) who renounced to enter the area to avoid paying the toll, nearly
half had changed their travel mode; a third changed their route; and the others switched to a less
polluting vehicle.
In parallel, the emissions of fine dust in the zone fell by 19%, and an improvement in air quality was
also observed across the metropolitan area.71
In 2008, total toll revenue was €12 million, while fines were double that figure. Operating costs were
€6.5 million. Toll revenues were fully reinvested in creating new services and improving public
transport.
In 2009 toll revenues began to fall, the main reason being changes in cars owned. Many people had
bought less polluting cars. In early 2011, 80% of vehicles were entering the Ecopass zone free of
charge because they met the required standards.72
Lack of political resolution didn’t allow tightening the system, so original rules were confirmed after
the first year of experimentation.
71
http://www.iau-idf.fr/detail/etude/ecopass-le-peage-urbain-ecologique-de-milan.html 72
http://www.eltis.org/index.php?id=13&study_id=2955
Figure 32: Ecopass zone in Milan.

99
CONCLUSION
Although the benefits in terms of reduced social costs were below forecast, implementing Ecopass
resulted in the first year in:
- Reduced congestion: the congestion index fell by 4.7%.73
- Improved road safety: a 10.5% drop in accidents and a 13.5% drop in accidents with injuries
in the toll zone.
- Higher bus operation speed: +0.5 km/h on average.
- More people using public transport: since the toll was launched, public transport has
carried 6% more passengers into the zone.
- Reduced polluting emissions and improved air quality: in 2008, there were 111 days when
the PM10 concentration threshold was exceeded, whereas the annual average during the
2002-2007 periods was 148. European standards accept a maximum of 35 days beyond
threshold limits.
The main success of Ecopass has been to change the profile of vehicles entering the zone. Before
Ecopass, nearly half were in the most polluting Ecopass categories III, IV and V (i.e. paying fees); in
2009, they only represented 14% of traffic in the zone. The average PM10 emissions per vehicle
passed from 32 mg/km in 2008 to 18.6 in 2009.
Ecopass was also cited as a best practice by the World Bank and OECD in 2009. Milan’s urban toll
won an honourable mention at the 2009 Sustainable Transport Awards held by the Institute for
Transportation & Development Policy (ITDP), and was selected as a best practice by UN Habitat in
2008.
The application of Ecopass has prompted intense public and political debate. Even if it was in the
program of Mayor Letizia Moratti, opposition to the measure came from parties of her coalition and
from part of retailers.
At the end of 2009 Deputy Major for mobility and environment, Edoardo Croci, who had conceived
the system and asked for its reinforcement, resigned and promoted a public referendum under
municipal rules to extend the toll to all vehicles, excluding zero emission ones, and to progressively
enlarge the toll area. The proposal was approved by a large majority (80%) of voters in June 2011 and
applied from January 2012. Its application by the new administration halved traffic in comparison
with pre-Ecopass baseline74.
Pollution remains an important political issue in Milan and a main concern for public health despite
relevant progress. Further improvements depend also on coordinated action with regional and
national policies.
73
Vehicle flow / road capacity ratio. 74
www.milanosimuove.it

100
AASQA : Associations Agréées pour la Surveillance de la Qualité de l'Air (France)
ADEME : Agence de l’Environnement et de la Maîtrise de l’Énergie (France)
ADERE Fès : Agence pour la Dédensification et la Réhabilitation de la médina de Fès
AFD : Agence Française de Développement
AGAM : Agence d’urbanisme de l’agglomération marseillaise
ALG-EP : Transportation, Infrastructure & Logistic – Europraxis
AMB : Aire Métropolitaine de Barcelone
AMT : Azienda Municipale di Trasporto (Italie)
AO (TU) : Autorité Organisatrice (des Transports Urbains)
ATM : Autoritat del Transport Metropolità
AUAT : Agence d’urbanisme de l’Agglomération de Toulouse
AYKOME : Altyapı Koordinasyon Merkezi (Infrastructural Coordination Department of Istanbul)
BEI : Banque Européenne d’Investissement
BRT : Bus Rapid Transit (Bus à Haut Niveau de Service – BHNS)
CERTU : Centre d'études sur les réseaux, les transports, l'urbanisme et les constructions publiques
(France)
CETE : Centre d'Études Techniques de l'Équipement (France)
CMI : Centre de Marseille pour l’Intégration en Méditerranée
CNRS : Centre National de la Recherche Scientifique (France)
CO2 : Dioxyde de carbone
CODATU : Coopération pour le développement et l’amélioration des transports urbains et
périurbains (France)
CRET-LOG : Laboratoire Universitaire de Recherche en Sciences de Gestion spécialisé en Logistique
(France)
DCE : Dossier de Consultation des entreprises
DMQ : Municipio del Distrito Metropolitano de Quito
DSP : Délégation de service public
LIST OF ACRONYMS AND WEBSITES

101
EEAA : Egyptian Environmental Affairs Agency
EMT : Entitat Metropolitana del Transport
ENTPE : École Nationale des Travaux Publics de l’État (France)
EPAU : École Polytechnique d’Architecture et d’Urbanisme (Alger)
ESTRAM : Eskişehir Light Rail Transportation System (Turquie)
ETUSA : Établissement de Transport Urbain et Suburbain d’Alger
FGC : Ferrocarrils de la Generalitat de Catalunya
FUBicy : Fédération française des usagers de la bicyclette
GES : Gaz à Effet de Serre
GPL : Gaz de Pétrole Liquéfié
IEFE : Centre for Research on Energy and Environmental Economics and Policy (Italie)
IETT : Istanbul Electricity, Tramway and Tunnel
IEVP CT-MED: Instrument européen de voisinage et de partenariat pour a Méditerranée
IMM : Municipalité Métropolitaine d’Istanbul
INRETS : Institut National de Recherche sur les Transports et leur Sécurité (France)
ISTAT : Istituto nazionale di statistica (Italie)
IUAR : Institut d'Urbanisme et d'Aménagement Régional (Aix-Marseille Université)
KNA-MENA : Knowledge Networks Agency for the Middle East and North Africa
LAURE : Loi sur l’Aire et l’Utilisation Rationnelle de l’Énergie (France)
LOTI : Loi d’Orientation sur les Transports Intérieurs (France)
MEDDTL : Ministère de l’Écologie, du Développement Durable, des Transports et du Logement
(France)
NTU : Associação Nacional das Empresas de Transportes Urbanos (Brésil)
OASA : Athens Urban Transport Organisation
P+R : Park and Ride ou parking-relais
PACA : Région Provence-Alpes-Côte d’Azur
PDU : Plan de Déplacements Urbains
PIB : Produit Intérieur Brut

102
PLU : Plan Local d’Urbanisme
PM10 : Particulate matter 10
PMR : Personnes à Mobilité Réduite
PPA : Plan de protection de l’atmosphère (France)
PPP : Partenariat-Public-Privé
PRQA : Plans régionaux pour la qualité de l’air (France)
PTU : Périmètre des Transports Urbains
PUM : Plan Urbain de Mobilité
RATP : Régie Autonome des Transports de Paris
RER : Réseau Express Régional (d’Île-de-France)
RFR : Réseau Ferroviaire Rapide de Tunis
RSS : Rich Site Summary (Flux)
SCoT : Schéma de Cohérence Territoriale
SF : Secrétariat des Finances (Colombie)
SNCF : Société Nationale des Chemins de Fer (France)
SNCFT : Société Nationale des Chemins de Fer Tunisiens
SNTF : Société nationale des Transports Ferroviaires
TAD : Transport à la demande
TAM : Transports de l’Agglomération de Montpellier
TAN : Transports de l’Agglomération de Nantes
TCSP : Transport Collectif en Site Propre
TCU : Transport Collectif Urbain
TGM : Tunis-Goulette-Marsa (ligne ferroviaire)
TGV : Train à Grande Vitesse
TMB : Transports Metropolitans de Barcelona
TRANSTU : Société des transports de Tunis
TRANSUB (entreprise publique de transport collectif public à Alger)
103
UITP : Union Internationale des Transports Publics
UKOME : Centre de coordination des transports pour Istanbul
UNESCO : United Nations Educational, Scientific and Cultural Organization
ZTL : Zone à Trafic Limité
104
ABOUD Abdullah and HADDAD Amal – City of Damascus: “The accessibility of the Old City of
Damascus.” 2010
AGARWAL O.P. – World Bank: “Structuring the Transit System – Examples from India.” 2010
AIT MHAND Aicha – City of Casablanca: “Politique des déplacements et intégration urbaine – cas de
Casablanca” (Mobility policy and urban integration in Casablanca). 2010
AWADA Fouad – Urbamed and CHALLITA Charbel– Egis: “Pour une accessibilité apaisée – Cas de la
Médina de Tripoli – Lybie” (Restoring accessibility: the medina of Tripoli, Libya). 2010
BAOUNI Tahar – ENSA Alger: “Perspectives de la multimodalité à Alger” (Outlook for multi-modality in
Algiers). 2010
BEN YOUSSEF Chibeb – TRANSTU: “Quelle desserte du centre-ville de Tunis par les transports publics,
quelle connexion entre réseau TP et portes de la vieille ville ?” (Options for transport service in the
city-centre of Tunis, PT connections with the gates to the old city). 2010
BONILLA Sandra - DMQ: “QUITO, EQUATEUR : La prise en compte des circulations douces” (Quito,
Ecuador: integrating sustainable transport). 2011
BOUDOUIN Daniel – CRET-LOG: “La circulation des marchandises dans les centres anciens”
(Merchandise transport in historic centres). Undated.
BOUHRIZ Nadia – Casa Tramway: “Transport Planning in Casablanca.” 2011
BOURGET Christian – French Ministry of Ecology: “Le ‘modèle’ français d’organisation des transports
urbains – caractéristiques et limites” (The French model of urban transport organisation: its
characteristics and limitations). 2011
BRUNNER Christian – AGAM: “Semi-piétonisation du Vieux port” (Semi-pedestrianisation of the old
port). 2010
CARLES Patrick – SARECO: “Métropoles émergentes et stationnement – La limitation des flux
automobiles vers les centralités” (Emerging metropolitan areas and parking: limiting car flow to main
centres). 2010
CASART Alicia – ALG-EP: “Le point de vue du consultant: Quels besoins vis-à-vis des documents de
planification pour les projets de transport de masse ?” (Consultant perspective: what is needed in
planning documents for mass transit projects). 2011
CERTU: “Plans de Déplacements Urbains : présentation générale” (An over view of urban mobility
plans). 2003
CHRISTOFOROU Zoï – OASA/UNTA: “Urban transport performance and lessons learned from the
Athens Olympic Games.” 2010
CORNUT Bernard – ADEME: “Back to Sustainable Urban Mobility? A few images as a practical
introduction”. 2010
LIST OF PRESENTATIONS

105
CROCE Alberto – City of Ferrara: “Une politique globale pour promouvoir la pratique du vélo en ville –
15 ans de planification de la mobilité à Ferrara” (A comprehensive policy to promote bicycle use in
town: 15 years of mobility planning in Ferrara). 2010
CROCHET Jean-Charles – World Bank: “Citoyen, contribuable, usager, client, opérateur : comment
associer la population à l’élaboration et à la mise en oeuvre des politiques de transport urbain ?”
(Citizen, taxpayer, user, customer: How to involve the people in the definition and implementation of
urban transport policies). 2011
CROCI Edoardo – IEFE: “Sustainable mobility in Milan: the pollution charge case.” 2010
DE LA FOURNIERE Nathalie – Greater Toulouse Town Planning Agency: “Évaluation et suivi du PDU
l’exemple de l’Observatoire du PDU de l’agglomération toulousaine” (Evaluation and monitoring of
the urban mobility plan: the Toulouse Observatory). 2011
DE YZAGUIRRE Clara – Municipality of Barcelona: “Le Pacte pour la Mobilité de Barcelone comme
instrument de participation citoyenne dans la gestion de la mobilité” (Mobility Agreement of
Barcelona: an instrument for citizen participation in mobility management). 2011
DESCAMPS Alain – Veolia Transdev: “Point de vue de l’opérateur Améliorer l’efficience des Transports
Urbains au Sud de la Méditerranée avec les opérateurs locaux - Veolia » (Operator’s perspective on
ways to improve the efficiency of urban transport in the South Mediterranean, with local operators).
2011
ENBATAN Erhan – ESTRAM: “Sustainable urban transport in Eskisehir / Turkey.” 2010
FOUCHARD Benjamin – CETE Méditerranée: “Évaluer pour évoluer : comment suivre et évaluer les
documents de planification” (Evaluate in order to evolve: how to monitor and assess planning
documents) and “Conclusions de la session” (Session conclusions). 2011
GODARD Xavier: “Transport artisanal, esquisse de bilan pour la mobilité durable” (Owner-driver
transport: a partial assessment for sustainable mobility). 2008
GOUIN Thierry – CERTU: “Citizen, taxpayer, user, customer: How to involve the people in the
definition and implementation of urban transport policies?.” 2011
GUERIN Pierre-Dominique – Greater Lyon: “Plan Presqu’île” (Presqu’île peninsula plan). 2010
HEFNY Kawsar – EEAA: “National project for old Taxi replacement.” 2010
HENGIRMEN Safak – SUMPA-MED and CORNUT Bernard – ADEME: “Local transport authorities in
Turkey, Jordan and Syria: situations & perspectives". 2011
HERNANDEZ Frédérique – IUAR Aix-Marseille University: “Le tramway : projet de transport de masse
et outil stratégique de la planification urbaine” (Tramway: mass transit project and strategy for urban
planning). 2011
HOUPIN Sylvain – Plan Bleu: “Les déplacements dans les cœurs de villes : Quel traitement de l’espace
public ?” (Mobility in city centres: adapting public spaces). 2010

106
HOUPIN Sylvain: “Mobilité et développement durable en Méditerranée : diagnostic prospectif
régional” (Mobility and sustainable development in the Mediterranean region: regional prospective
diagnosis). Les Cahiers du Plan Bleu, issue 9, 2010
HUYBRECHTS Éric – Institut d’Aménagement et d’Urbanisme d’Ile-de-France: “Planification urbaine et
transport dans les métropoles du Maghreb méditerranéen” (Urban planning and transport in
Mediterranean Maghreb cities). 2011
ILICALI Mustafa – Istanbul Metropolitan Municipality: “Example of financing an infrastructure of
urban transport by land value : The case of Istanbul.” 2011
JODAR Gabriel – FormaPlan / MedCités: “Traits de la politique multimodale des déplacements urbains
de la ville de Barcelone : enjeux et résultats” (Characteristics of urban multimodal mobility policy in
Barcelona: challenges and results). 2010
KHATOUI Nawel: “Les Autorités Organisatrices de Transports publics Urbains en Algérie, analyse et
perspectives d’évolution” (Urban transport authorities in Algeria: analysis and outlook). ENTPE, 2011
LARIA Silvia – Plan Bleu: “Urban Mobility and Sustainable Development challenges in the
Mediterranean Countries”. Workshop on Urban Mobility in Istanbul, 2008
LASSALLE Christine – TAN: “Les transports nantais exemples d’interaction entre le public et les
acteurs” (Transport in Nantes: examples of interaction between the public and the authorities). 2011
LE TOURNEUR Marc: “Évolution des transports urbains dans le cœurs des villes françaises des années
1950 à nos jours” (Development of urban transport in French city centres from the 1950s to the
present day). 2010
LE TOURNEUR Marc: “Les transports à Montpellier : planification et cadre institutionnel” (Transport in
Montpellier : planning and institutional framework). 2010
LOPEZ Angel – City of Barcelona: “Les deux roues motorisées – Défis et opportunités” (Two-wheeled
motorised vehicles: challenges and opportunities). 2010
MARTI ESCURSELL Josep-Maria – Moventis: “Presentation of MOVENTIS.” 2011
MARTINEZ Pelayo – AMB: “Planificación y gestión del transporte dentro de un área metropolitana: el
caso de Barcelona” (Transport planning and management in a metropolitan area: the case of
Barcelona). 2011
METEYER-ZELDINE Françoise – French Ministry of Sustainable Development: “Qui paie quoi en
matière de transports urbains ? Guide de bonnes pratiques” (Who pays what for urban transport? A
handbook of good practices). 2009
MEYER Vincent – City of Montpellier: “L’accès au centre-ville de Montpellier” (Access to the city-
centre of Montpellier). 2010
MEZGHANI Mohamed – UITP: “Testimonials from International Association of Public Transport
(UITP).” 2011
107
MEZGHANI Mohamed – UITP: “Quelles autorités pour porter les politiques de transports urbains ?”
(Defining authorities to lead urban transport policies). 2011
MILLOT Marine – CETE Méditerranée: “Multimodal organization.” 2010. “Technical monographs”.
2010
NALAN YETMEN Aysin – Municipality of Izmir: “Integrated Public Transport in Izmir (TUR)”. 2011
NEHDI Yosr – Autonomous Region of Sardinia: “Presentation of the cross-border cooperation program
in Mediterranean IEVP CT MED of the EU”. 2011
NOUHA Hassan – Moroccan Ministry of the Interior & Jean-Charles CROCHET – World Bank:
“Transports publics urbains : l’expérience du Maroc” (Urban public transport: the experience in
Morocco). 2011
PELAEZ DE LOÑO Luis – TMB: “TMB, Transports Metropolitans de Barcelona : Vers un nouveau réseau
de bus à Barcelone (Bus à Haute Niveau de Service – BHNS)” (TMB, transport authority of Barcelona:
creating a BRT network). 2011
Plan Bleu: “Enjeux de développement durable en Méditerranée. Les perspectives du Plan Bleu à 2015”
(Challenges for sustainable development in the Mediterranean: forecasts by Plan Bleu for 2015). 2009
REBELO Jorge – World Bank: “Financing with new taxes on car use: The Latin America Experience”.
2011
RIVALTA Bernard – Sytral: “Face à des opérateurs en évolution, comment assurer une exécution
efficace et cohérente du service de transport public ?” (Ensuring efficient and coherent public
transport service in a context of change among operating companies). 2011
ROBIN Dominique – Atmo PACA: “Modélisation de la qualité de l’air, pour l’intégration de nouveaux
outils d’aide à la décision sur les aires métropolitaines marseillaises et niçoises” (Modelling air quality
to integrate new decision-making tools for the Marseille and Nice metropolitan areas). 2010
ROSELLÒ Xavier – ATM: “Présentation de l’ATM, Autorité du Transport Métropolitain de Barcelone”
(Presentation of ATM, the transport authority of Barcelona). 2011
ROUSSET Jacques – BEI et partenaires: “MEDINAS 2030 – Étude documentaire préliminaire” (Medinas
2030 – preliminary review of documentation). 2010
SAINT-PAUL Florance – CETE Sud-Ouest: “Planification des déplacements, Expérience des villes
européennes du bassin méditerranéen” (Mobility planning: the experience of European cities of the
Mediterranean basin). 2011
SAUVANT Alain – École des Ponts Paris Tech: “Le partenariat public privé dans les projets de
transports” (Public-private partnerships for transport projects). 2008
SEMAAN Rami – LEB: “Planification des Transports Urbains” (Urban transport planning). 2011
SERRHINI Fouad – ADER Fès: “L’organisation de la circulation dans la Médina de Fès entre nécessités
et possibilités” (Traffic organisation in the medina of Fes, balancing necessity with feasibility). 2010
108
SMADI Ayman – City of Amman: “Amman Transportation Strategy from Planning to Implementation”.
2010
STUCKI Martin – TRANSITEC: “Les déplacements dans les cœurs de ville : quel traitement de l’espace
urbain ? – Illustrations à travers le guide d’aménagement et d’exploitation de l’espace public urbain
au Maroc” (Mobility in city centres: the role of urban space design – examples from the Moroccan
plan for urban space development and operation). 2010
TIRA Maurizio – University of Brescia: “Italian experience of the Restricted Traffic Zone (ZTL).” 2010
TURRO Mateu – Polytechnic University of Catalonia, and Géraldine BONNET – CERTU: “Comment
financer le transport public urbain ? Quelles nouvelles sources de financement mobiliser ?” (Financing
urban public transport: new sources and options). 2011
VIZCAINO Francisco Javier – Barcelona Tram: “The conditions for the private sector participation to
finance infrastructure in urban transport. The case of the Tramway of Barcelona”. 2011

109
Part 1