urban inequities report: addis ababa - un-habitat.:....
TRANSCRIPT

2
Urban Inequities Report: Addis Ababa

Ababa
Contents
1.0 Background 2.0 Methods 3.0 Urbanization in Ethiopia
3.1 The City of Addis Ababa 4.0 Access to Safe Water 5.0 Access to Adequate Sanitation 6.0 Secure Tenure 7.0 Durability 8.0 Sufficient Living Area 9.0 Monetary Poverty 10.0 Information and Communication 11.0 Social Capital 12.0 Crime and Violence 13.0 Homelessness in Addis Ababa 14.0 Policy Implications and Recommendations
2

List of Figures Figure 1: Surveyed Kebeles of Addis Ababa, 2003 Figure 2: Landsat image of Addis Ababa and the boundaries of the 10 sub-cities, 2003 Figure 3: A photograph of Addis Ababa, 2003 Figure 4: Proportion of slum and non-slum households in Addis Ababa, 2003 Figure 5: School children in Addis Ababa, 2003 Figure 6: Sources of water in Addis Ababa, 2003 Figure 7: Improved, affordable and sufficient water Figure 8: Water disruptions in Addis Ababa, 2003 Figure 9: Adequate sanitation in Addis Ababa Figure 10: Security of tenure in Addis Ababa, 2003 Figure 11: A mud and wattle wall house in Addis Ababa, 2003 Figure 12: Distribution of households with durable housing in Addis Ababa, 2003 Figure 13: Overcrowding in Addis Ababa, 2003 Figure 14: Telephone connections in Addis Ababa, 2003 Figure 15: Crime and violence in Addis Ababa, 2003 Figure 16: Child being washed in a street, Addis Ababa, 2003
3

List of Tables Table 1: Summary indication on access to safe water in Addis Ababa Table 2: Toilet facilities in Addis Ababa, 2003 Table 3: Security of tenure, Addis Ababa, 2003 Table 4: Distribution of households by any type of income, Addis Ababa, 2003 Table 5: Distribution of households by saving and economic self-assessment, Addis Ababa, 2003 Table 6: Percentage of households with radio, television and telephone, Addis Ababa, 2003 Table 7: Percentage of households belonging to association or groups, Addis Ababa, 2003 List of Boxes Box 1: Improved quality water sources Box 2: Components of adequate sanitation Box 3: Documentary evidence of ownership Box 4: Quality of construction indicators Box 5: Social support in poor urban communities Box 6: Origins of homelessness in Addis Ababa
4
Abbreviations AD Anno Domino AIDS Acquired Immune-Deficiency Syndrome APHRC African Population and Health Research Center CSA Central Statistical Authority DHS Demographic Health Survey EAs Enumeration Areas EGM Expert Group Meeting Fafo- AIS Institute for Applied International Studies in Norway GUO Global Urban Observatory HA Habitat Agenda HIPS Hierarchical Iterative Parallel Solver HIV Human Immune Virus ID Identification IDIR is a burial association for mutual support in relation to deaths and funerals IDP Internally Displaced Persons IQUIB is a rotating saving and credit LPG Liquefied Petroleum Gas MDG Millennium Development Goals MICS Multiple Indicator Cluster Survey PHC Population and Housing Census PSU Primary Sampling Units QSA Quaternary Sampling Units SSU Secondary Sampling Units TSU Tertiary Sampling Units UIG Urban Indicators Guidelines UIS Urban Inequity Survey UN-Habitat United Nations Human Settlements Programme WB World Bank WSSD World summit on Sustainable Development
5
1.0 Background
UN-Habitat is responsible for monitoring Millennium Development Goal 7 (MDG7) Target 11, which is “to improve the lives of 100 million slum dwellers by 2020”. During 2002, UN-Habitat developed a methodology that allows it to make regional and global estimates of slum dwellers. Task Force 8 of the Millennium Project focuses on improving the lives of at least 100 million slum dwellers. UN-Habitat is responsible for the provision of revised estimates at the global and regional level as well as estimates at the country level to facilitate the formulation of an action plan that will ensure the achievement of this goal. The Global Urban Observatory (GUO) of UN-Habitat has, therefore, embarked on an extensive work programme to extend and improve data collection as a precursor to monitoring the MDG7 Target 11. An Expert Group Meeting (EGM) held in October 2002 endorsed the work programme and provided revised definitions for slums and secure tenure that are key components to the estimation methodology. Pursuing a two-tiered approach to data collection, analysis and capacity building in this area, the UN-Habitat has developed guidelines and questionnaires to carry out full-fledged surveys as part of the Agency’s drive to include the slum settlements as an estimation domain. These guidelines offer not only the definitions, but also a hierarchy of indicators at the operational level, and the specific questions to measure them. UN-Habitat is also establishing working relationships with institutions conducting household surveys in different parts of the world on a regular basis, in order to add-on some questions on sub-city differentials in their mainstream survey instruments. This consultation is being developed with the aim of conducting household surveys in selected cities of the world. Addis Ababa is one of these cities where such an Urban Inequity Survey (UIS) has been conducted. A manual has been developed to guide and assist UN-Habitat staff, in their work with national and local counterparts and other partners, in measuring progress towards the implementation of the UN-Habitat Agenda (HA), the MDG7 Target 11 and the implementation plan from the World Summit on Sustainable Development (WSSD)1 through the use of household surveys. The objective of UIS is to inform local policy so that global aspirations expressed in these global programmes are localized. To this end, model questionnaires have also been developed drawing heavily on experiences with the Multiple Indicator Cluster Survey (MICS) and Demographic and Health Survey (DHS), on expert advice, and from various surveys conducted by Fafo-AIS, African Population and Health Research Centre (APHRC), HIPS and the World Bank (Integrated Questionnaire for the Measurement of Social Capital). A broad-based technical advisory group helped coordinate and advice on the consolidation of inputs from the diverse sources. In particular, close-working relations with the DHS programme not only improved the commonality and consistency of indicators between the UIS and DHS, but also resulted in an agreement to work together at city level so as to maximize the benefits of the two organizations’ survey activities.2
1 The Johannesburg Declaration on Sustainable Development emanated from the World Summit on Sustainable Development in Johannesburg, South Africa from 2-4 September 2002, it reinforces both the Habitat Agenda and the Millennium Development Goals. 2 UN Habitat Manual.
6

2.0 Methodology The Addis Ababa UIS collected demographic, social, economic and some health information from a representative sample of 1,500 households in Addis Ababa. The primary focus of this UIS was to provide data of slum dwellers as a means of meeting the MDG7 Target 11. In addition, the sample was designed to provide estimates of key variables for the ten sub-cities of Addis Ababa. The Addis Ababa UIS was based on a sampling frame comprised of a list of census enumeration areas (EAs) with population and household information from the 1994 Population and Housing Census (PHC). However, as major changes have occurred in the administrative layout of Addis Ababa, the same sampling frame could not be used in its original form and had to be adapted to these changes. The sample for the survey was based on a four-stage, stratified, city wide representative sample of households. Originally it was decided that a final selection of between 35 and 37 clusters would prove sufficient from which the sample of respondents could be drawn. However, following further consultation this was increased to 52 clusters, to which a further four clusters were added to cover for non-responses. The following outlines the four-stage sample selection process. At the first stage of sampling the 56 Kebeles were allocated proportionally to the ten sub-cities based on the proportional division of the population in each of these sub-cities. The primary sampling units (PSU’s) are therefore the Sub-Cities. Once this process was completed, the population for all the Old Kebeles in each sub-city was calculated and from this the total number of Old Kebeles within each of the 10 sub-cities was subjected to second-stage stratification process and was proportionally selected from all the Kebeles in each sub-city. The secondary sampling units (SSU’s) are therefore the New Kebeles. It should be noted, that because as Central Statistical Authority (CSA) records stood at the time, EAs were organised under the Old Kebeles. Hence, after mapping Old Kebeles under each sub-city, Old Kebeles in each sub-city were selected using systematic sampling with probability proportional to size. The selected Old Kebeles were then traced into the New Kebeles after the completion of the sampling. Selecting EAs from New Kebeles would have been problematic since some Old Kebeles had been fragmented into more than one New Kabele. The third-stage stratification resulted in the selection of one EA from each of the Old Kebeles using systematic sampling with probability proportional to size. The tertiary sampling units (TSU’s) are therefore the EAs. This process was then followed by a complete household listing operation, which was carried out in all the 56 selected EAs to provide a sampling frame for the fourth-stage selection of households. The quaternary sampling units (QSU’s) are therefore the EAs. Sketch maps, considered an important component of the UIS, were composed to ascertain the relative position of all infrastructures, including all habitable dwellings (or household units) within an EA to ensure that the enumerators could correctly identify each of the selected households during the fieldwork. These maps were also used during the fourth-stage of sampling; a systematic sample of 28 households in each EA was selected in all the EAs to provide statistically reliable estimates of the key demographic, economic, social and health variables. The survey was designed to eventually obtain completed interviews of one respondent from a minimum of 1,400 households. In addition, one woman of reproductive age from each of the households was also
7

interviewed on a number of child reproduction and mortality issues. In order to take non-response into account, a total of 1,568 households were selected. Mapping Once all the EAs were selected, maps were secured from the CSA. These maps have two attached papers that contain descriptive information on each of the EAs, the Weredas it is located in, the old Kebele administrative details, and a diagram of the boundaries with all the buildings within and some external to these boundaries. Information had to be collected in which new Kebeles the EAs were located following the administrative restructuring of Addis Ababa. For the overwhelming majority of cases, old Kebeles were simply merged into new Kebeles, however, in some instances old Kebeles were broken down into two or more new Kebeles. This information was obtained from the Addis Ababa Policy Study and Planning Commission. In all but three EAs identifying the boundaries of each was relatively simple and in those EAs where the diagrammatic information was difficult to follow, a combination of the locally hired facilitator knowledge and a narrative description of each maps’ boundaries contained in the CSA documents helped complete the task. Once the mapping team had identified the peripheral boundaries of each EA, all roads, commercial and public buildings, religious places and graveyards were sketched on the maps to serve as reference for the entry of residential dwellings. The final task was the systematic listing of all domestic structures and wherever possible the family name of the principal family or household identification (ID) within that structure. On the maps, households were represented often using a box having the household ID in it. Vacant houses were also listed but not included in the listing from which the sample was drawn. With the exception of two EAs, it took the mapping teams an average of three days to map and list each EA. On completion of each of the mapping and listing exercises, the team manager would re-visit the area and randomly check on the location and/or household information of 10 structures that were not marked along the boundaries and a further 30 to 40 structures within the boundaries. In total, Addis Ababa is divided into 203 Kebeles. The UIS study was conducted in 53 Kebeles as shown in Figure 1.
8
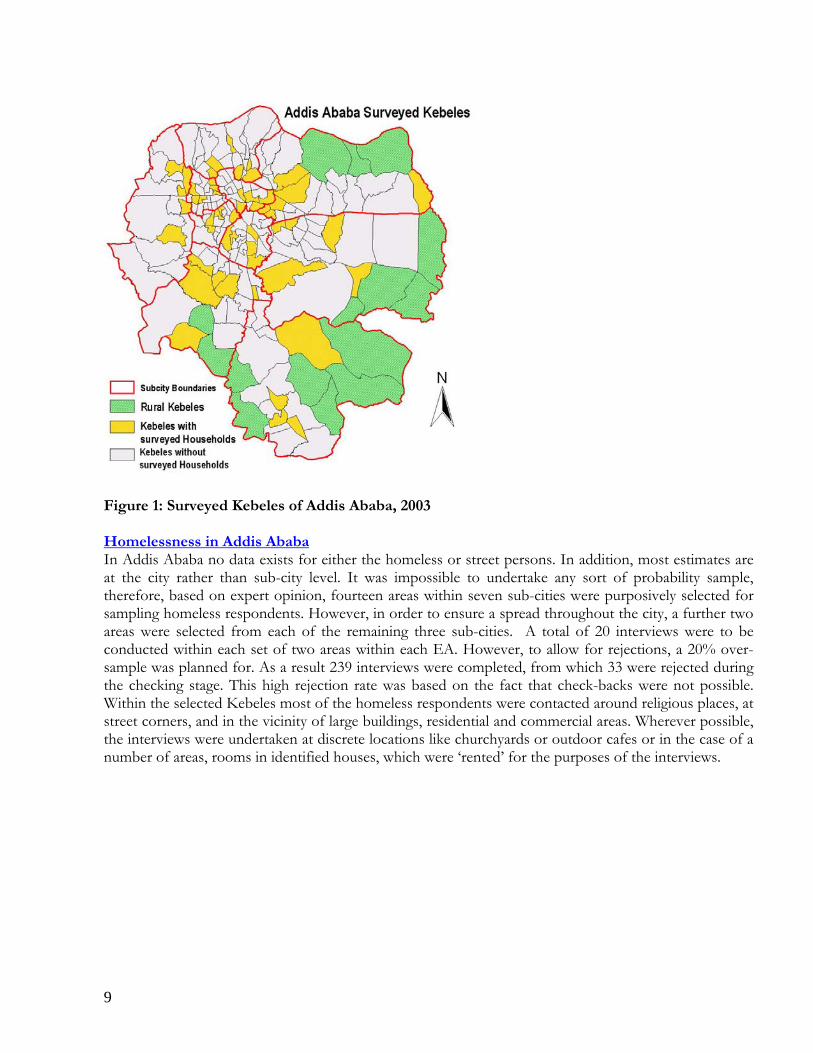
Figure 1: Surveyed Kebeles of Addis Ababa, 2003 Homelessness in Addis Ababa In Addis Ababa no data exists for either the homeless or street persons. In addition, most estimates are at the city rather than sub-city level. It was impossible to undertake any sort of probability sample, therefore, based on expert opinion, fourteen areas within seven sub-cities were purposively selected for sampling homeless respondents. However, in order to ensure a spread throughout the city, a further two areas were selected from each of the remaining three sub-cities. A total of 20 interviews were to be conducted within each set of two areas within each EA. However, to allow for rejections, a 20% over-sample was planned for. As a result 239 interviews were completed, from which 33 were rejected during the checking stage. This high rejection rate was based on the fact that check-backs were not possible. Within the selected Kebeles most of the homeless respondents were contacted around religious places, at street corners, and in the vicinity of large buildings, residential and commercial areas. Wherever possible, the interviews were undertaken at discrete locations like churchyards or outdoor cafes or in the case of a number of areas, rooms in identified houses, which were ‘rented’ for the purposes of the interviews.
9
3.0 Urbanization in Ethiopia
Ethiopia has one of the lowest levels of urbanization in Africa; mainly due to lack of peace and stability that has characterized its past and current history3. In this country war has affected the continuity in the growth of established urban centres, has led to constant shifts of capital towns and has limited external influence on urbanization. The country’s ancient cities and towns developed as indigenous administrative capitals of kingdoms, although some of them served as religious and trading centres. There were three main capitals – Aksum, Lalibela and Gonder and later Harer that emerged and served as trading centres.
Aksum was the first ancient city, which flourished in the first to the seventh century AD. However, when its civilization and influence declined, the towns of Lalibela, Gonder and Harer were founded in different parts of the country. The impact of civil strife saw the rise and fall of many towns of Ethiopia. For instance, Adwa, which emerged as the capital of Tigray, is a famous battleground that saw the defeat of the Italians in 1896 and is now a medium provincial capital. Most of the important urban centres of Ethiopia were founded during the latter part of the nineteenth century and the early part of the twentieth century. These modern centres include Addis Ababa founded by Emperor Menelik II in 1888, Asmara in 1889, Desie founded in the second half of the nineteenth century, Mekele in 1871-89, Dire Dawa in 1904; and Nazereth, Debre Zeit, and Akaki in the first half of the twentieth century. Industrial developments, the growth of commercial activities, and road, rail, and air services greatly contributed to the development of modern major urban areas. This is the case in the growth of Addis Ababa, Asmara, and Dire Dawa, where most of the country’s manufacturing activities are located. These towns flourished mainly after 1950 due to the disproportionate concentration of manufacturing, trade, and service activities; infrastructural and social services; and administrative services. There is limited information about historical population estimates of the ancient towns. However, there are indications that the population growth of modern towns has been rapid compared to the old ones. There was a rapid growth in the number of urban areas and their population between 1970 and 1984. The urban population is concentrated in Addis Ababa, which accounted for 48% in 1970 and 51% in 1984 of the urban population living in localities of over 20,000 people.
3.1 The city of Addis Ababa Addis Ababa is situated on a plateau at an altitude of 2,408 meters covering an area of 222 square kilometres. It has an annual rainfall of 1,161 millimetres. It boasts of many international bodies and embassies including the United Nations. The city is inhabited by numerous nationalities with foreigners constituting less than 1% of the population. The major ethnic group is the Amaras (49% of the population), followed by Gurages (18%) and Oromos (17%). Most of the people (89%) use the official language, Amharic at home, which is the language of Amaras. Figure 2 is an image of the 10 sub-cities of Addis Ababa.
3 Tesfaghiorghis, H. 1994. Ethiopia in Tarver (ed) Urbanization in Africa, a Handbook. Greenwood Press Westport, Connecticut, London.
10

Figure 2: Landsat image of Addis Ababa and the boundaries of the 10 sub-cities (blue colour indicates built up areas, red is vegetation). Addis Ababa is mainly an administrative, service and commercial city. Its total employment from manufacturing was only 13%, compared to 65% in the major industrial towns of Akaki, Dire Dawa and Bahr Dar in 1984 (could we get more up-dated information). About 40% of Addis Ababa’s workforce is government employees, 31% private organization employees, 25% own-account workers, 2% employers and 2% unpaid family workers and others. There is a substantial engagement in the informal sector. Women accounted for only 27% of the total self-employed population. Until recently and certainly during the previous census (1994), Addis Ababa was comprised of six major administrative zones that were further divided into political regions called Weredas which were 28, these in turn were further divided into administrative (and political) entities called Kebeles (345). For census purposes, Kebeles were comprised of relevant numbers of EAs that reflected population and spatial characteristics. However, since the year 2000, administrative changes have resulted in the creation of new administrative areas and the scrapping of both the Weredas and the Old Kebeles. The new
11

administrative structure of Addis Ababa is based on the creation of 10 sub-cities, and 203 New Kebeles4. Figure 3: A photograph of Addis Ababa, 2003 A significant characteristic of Addis Ababa is the distribution of households. Typically, an area that contains ultra-modern buildings has a slum adjacent to it, as illustrated in Figure 3. This could explain partly the characterization of most of the households in all the sub-cities into slum. This could also indicate that most of the sub-cities have a substantial proportion of households bereft of any one of the five key slum indicators: (i) access to improved water; (ii) access to improved sanitation; (iii) sufficient living area, (iv) durability of housing; and (v) access to secure tenure. The proportion of the distribution of the slum population in Addis Ababa is illustrated in Figure4. Figure 4: Proportion of slum and non-slum households in Addis Ababa
0
25
50
75
100
Arada
Addis
Ketema
Lideta
Cherkos
Yeka
Bole
Akaki
Kaliti
Nefas Silk
Kolfe Kera
nio
Gulele
Sub-cities
Per
cent
Slum Non-slum
4 Actual numbers still need to be verified.
12

Population distribution Females account for 54.2% of Addis Ababa population. One-quarter of the population is below the age of 15 years, suggesting a population with a high fertility rate. Just 5.4% of the population fell above the age of 60 years, which implies that almost seven out of ten of the population is within the economically active age range of between 15 years and 59 years of age. The youth (15-24 years) account for 30% of the population. A number of factors, including HIV and AIDS, migration and a generally high mortality rate, have increased the number of orphans and children with only one living parent throughout Ethiopia. In such situations, the burden of care for orphans is placed on extended family, or other community members. Figure 5: School children in Addis Ababa, 2003 EducationOne in four women have no education. A total of 24.6% of women in Addis Ababa have no education, while another quarter has only completed primary schooling. A slightly higher proportion of men (50.2%) have completed secondary schooling compared to 43.1% of women. Only 7% of women, as opposed to 12% of men in Addis Ababa, have completed higher education. School attendance is higher amongst female children aged 7 to 12 years, with more than three-fifths (61.4%) attending school, compared to 57.8% males. These disparities are important especially in understanding the reasons that lead to school drop-out and low education attainment among females who start off very well.
13

4.0 Access to Safe Water
An important aspect of water is that it should be accessible, available without excessive physical effort and time. Obtaining water should take less than one hour per day for the minimum sufficient quantity of at least 20 litres per person per day. The water must be affordable, implying that it should take less than 10% of the household income.
Water is one of the great necessities of human life, which is often taken for granted in the developed world. A supply of clean water is absolutely necessary for life and health, yet almost 2 billion people lack access to adequate water supply or can only obtain it at high prices. In many cities, households in informal settlements are rarely connected to the network and can only rely on water from vendors at up to 200 times the tap price. Improving access to safe water implies fewer burdens on people, mostly women, to collect water from available sources. It also means reducing the global burden of water-related diseases and the improvement in the quality of life. (Urban Indicators Guidelines).
Quality of water This indicator monitors access to improved water sources based on the assumption that improved water sources are likely to provide safe water. Unsafe water is the direct cause of many diseases in developing countries. Most (88.5%) of the residents in Addis Ababa have access to improved water mainly from piped water either into the dwelling or into the yard (67.2%). There are, however, large disparities between the sub-cities with Bole having the highest access to improved water (98.9%) and Akaki Kaliti having the least (67.8%), as shown in Figure 6. Many households in Yeka, Akaki Kaliti and Nefas Silk depend on unprotected wells and springs for their water supply, which exposes them to health risks. This risk is compounded by the fact that most households (91.5%) do not treat their water before consumption.
Box 1 Improved quality water sources • Direct connection (piped water)
to dwelling or plot • Access to public stand pipe
shared by a maximum of two households
• Access to non-piped water: o bore dug well o protected spring o rain water collection
14

Figure 6: Sources of Water in Addis Ababa, 2003
Sub city
YekaNefas Silk
LidetaKolfe Keranio
GuleleCherkos
BoleArada
Akaki Kaliti
Addis Ketema
Mea
n
120
100
80
60
40
20
0
Other
Unprotected w ell/spr
ing
Public tap
Piped into yard
Piped into dw elling
Water accessibility and affordability Almost all the households (98.8%) obtain their water within one hour, a substantial proportion of them (90.5%) collect their water within 15 minutes. A very small proportion of the households (1.2%) require more than 60 minutes to collect water. However, most households in Addis Ababa (89.1%) pay for water. Almost all the households (96.2 %) with improved water pay for it on a monthly basis. About one in five households spend more than 10% of their income to access improved water, which indicates that the water is too expensive for some of them. In other terms, less than three quarters (73%) of households have access to improved water. Furthermore, when the quantity of water is taken into consideration, less than 50% of the households have access to sufficient and affordable improved water. The sub-city of Bole has the highest level (69%) of access to improved water, while Akaki Kaliti has the least (25%). Figure 7 shows people’s access to improved water at the sub-city level when both cost and sufficiency of water supply are taken into account.
15

Figure 7: Map on improved, affordable and sufficient water, Addis Ababa, 2003 Water disruption Although disruption is not one of the water indicators, information was collected in Addis Ababa because it emerged as a critical problem. UIS shows that 28.6% of the households experienced disruptions in water supply during the last two weeks. Water disruptions affect mainly households that relied on public tap (34.1%), followed by water piped into yard or plot (31.6%) and water piped into dwelling (24.8%). Water disruptions impact negatively on the time spent accessing water and the quality of water acquired for use by households. In addition, water disruptions affect women more than men because the latter are the main water collectors. Inhabitants in poor households spend more money on water, therefore when disruptions occur in service provision they are the most affected because the alternatives sources may to be too costly, both in terms of cost and time. It would be useful for studies in informal settlements to assess the frequency of disruption of water services because such information may compel city authorities to ensure consistency in supply.
16

Figure 8: Map on water disruptions in Addis Ababa, 2003 Gender and water The burden of water is mainly borne by women and this was evident in Addis Ababa. In total women are responsible for water collection in over 90% of the households. In 45% of the households girls are the primary water collectors. The fact that young girls are the primary water collectors has implications on their ability to pursue education and on their career development. Women and young girls in the poorest households are more affected by water collection while richer households have the possibility of engaging servants to undertake this activity. For example, in Bole 29% of the water collectors are domestic servants while none of the households in Akaki Kaliti reported this. Conclusion Although residents of Addis Ababa appear to have high access to improved water sources, this changes when cost, availability and time are looked at together. Table 1 presents a summary on access to safe water in Addis Ababa.
17

Table 1: Summary indicators on access to safe water in Addis Ababa, 2003 Sub-city Improved
water Accessible improved water
Affordable and accessible improved water
Sufficient affordable and accessible improved water
Arada Addis Ketema Lideta Cherkos Yeka Bole Akaki Kaliti Nefas Silk Kolfe Keranio Gulele Total
18

5.0 Access to Adequate Sanitation A household is considered to have adequate access to sanitation if an excreta disposal system, either in the form of a private toilet or a public toilet shared with a reasonable number of people, is available to household members.
Lack of sanitation is a major public health problem that causes disease, sickness and death. Highly infectious, excreta-related diseases such as cholera still affect whole communities in developing countries. Diarrhoea, which is spread easily in an environment of poor hygiene and inadequate sanitation, kills about 2.2 million people each year, most of them children under five. Inadequate sanitation, through its impact on health and environment, has considerable implications for economic development. People miss days at work due to sickness resulting from excreta-related diseases. Moreover, lack of excreta management poses a fundamental threat to global water resources. Good sanitation is important for urban and rural populations, but the risks are greater in slum areas where it is more difficult to avoid contact with waste (Urban Indicators Guidelines).
Access to toilet Facilities
To determine people’s access to sanitary facilities it is important to characterise the various types of facilities available. Inadequate sanitation includes service or bucket latrines (where excreta are manually removed), public latrines, and latrines with open pits. In Addis Ababa dug pit latrines that can be emptied are by far the most common toilet facilities (68.3%) while 7.3% of the households use the traditional pit latrine (not emptied). Flush to sewage system or septic tank is used by only 4% of the households while 10% use non-flush toilet to sewer system. Most of these toilets are in Bole (50%) compared to less than 20% in the other sub-cities. A substantial proportion of households (8.9%) use the bush as a toilet facility. Another indicator of adequate sanitation is sharing of toilet facilities with not more than two households. Most of the households (61.4) in Addis Ababa share toilet facilities. The majority of households (51%) share toilets with more than two households. One-third (33.6%) of the households share the toilet facility with six or more households. If you consider that toilet facilities shared by more than 2 households are inadequate, then only 28.8% of the households would be considered to have adequate sanitation in Addis Ababa. However, sharing of toilet facilities in the sub-city of Bole is less common (24%) compared to other sub-cities and in particular Addis Ketema where 85.6% of households share facilities. While the situation of Bole may be explained by its wealth, the situation of Addis Ketema could be explained by overcrowding as discussed further below.
Box 2 Components of adequate sanitation • Direct private connection (to
dwelling or plot) o To the public sewer o To septic system (with
sufficient capacity) • A pour flash latrine, private or
shared (not public) • A ventilated improved pit latrine,
private or shared (not public)
In terms of public and private facilities, most of the shared facilities are private or semi-private, with only 30% being public facilities. Most (91%) of the facilities can be used day and night. Slightly over 10% of households pay to use toilet facilities which limits access for the poor people who may
19
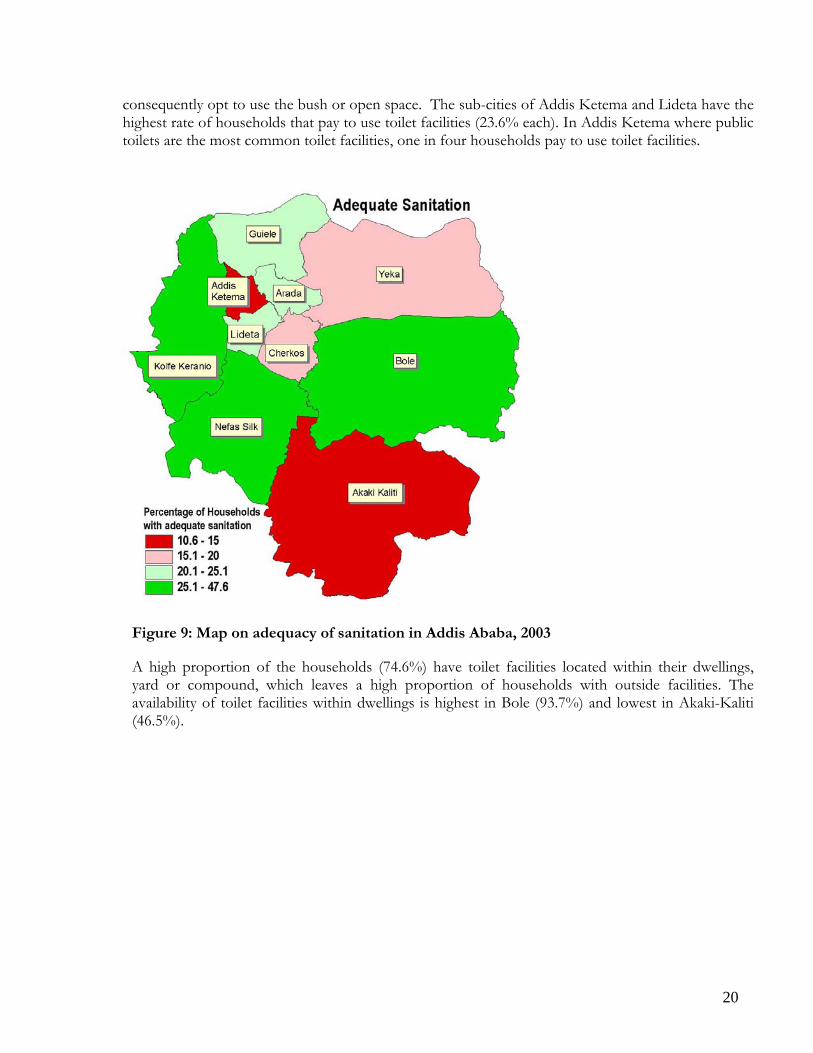
consequently opt to use the bush or open space. The sub-cities of Addis Ketema and Lideta have the highest rate of households that pay to use toilet facilities (23.6% each). In Addis Ketema where public toilets are the most common toilet facilities, one in four households pay to use toilet facilities.
Figure 9: Map on adequacy of sanitation in Addis Ababa, 2003
A high proportion of the households (74.6%) have toilet facilities located within their dwellings, yard or compound, which leaves a high proportion of households with outside facilities. The availability of toilet facilities within dwellings is highest in Bole (93.7%) and lowest in Akaki-Kaliti (46.5%).
20
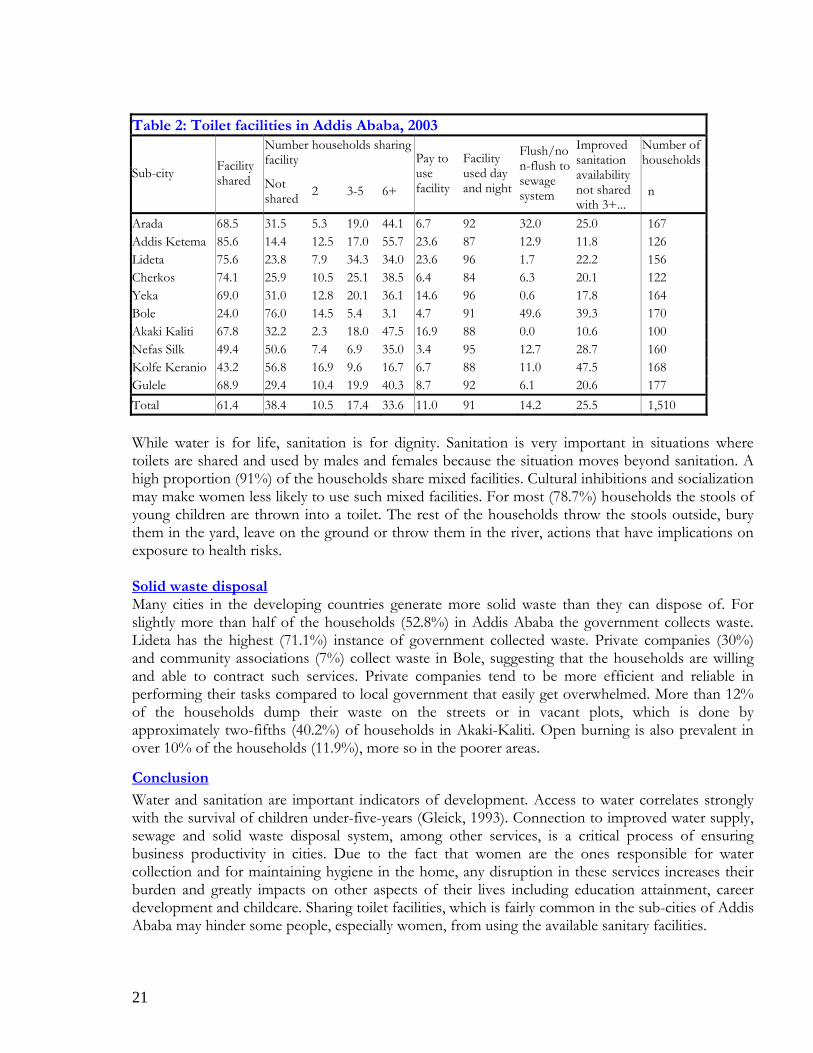
Table 2: Toilet facilities in Addis Ababa, 2003
Number households sharing facility
Number of households
Sub-city Facility shared Not
shared 2 3-5 6+
Pay to use facility
Facility used day and night
Flush/non-flush to sewage system
Improved sanitation availability not shared with 3+...
n
Arada 68.5 31.5 5.3 19.0 44.1 6.7 92 32.0 25.0 167 Addis Ketema 85.6 14.4 12.5 17.0 55.7 23.6 87 12.9 11.8 126 Lideta 75.6 23.8 7.9 34.3 34.0 23.6 96 1.7 22.2 156 Cherkos 74.1 25.9 10.5 25.1 38.5 6.4 84 6.3 20.1 122 Yeka 69.0 31.0 12.8 20.1 36.1 14.6 96 0.6 17.8 164 Bole 24.0 76.0 14.5 5.4 3.1 4.7 91 49.6 39.3 170 Akaki Kaliti 67.8 32.2 2.3 18.0 47.5 16.9 88 0.0 10.6 100 Nefas Silk 49.4 50.6 7.4 6.9 35.0 3.4 95 12.7 28.7 160 Kolfe Keranio 43.2 56.8 16.9 9.6 16.7 6.7 88 11.0 47.5 168 Gulele 68.9 29.4 10.4 19.9 40.3 8.7 92 6.1 20.6 177 Total 61.4 38.4 10.5 17.4 33.6 11.0 91 14.2 25.5 1,510 While water is for life, sanitation is for dignity. Sanitation is very important in situations where toilets are shared and used by males and females because the situation moves beyond sanitation. A high proportion (91%) of the households share mixed facilities. Cultural inhibitions and socialization may make women less likely to use such mixed facilities. For most (78.7%) households the stools of young children are thrown into a toilet. The rest of the households throw the stools outside, bury them in the yard, leave on the ground or throw them in the river, actions that have implications on exposure to health risks. Solid waste disposal Many cities in the developing countries generate more solid waste than they can dispose of. For slightly more than half of the households (52.8%) in Addis Ababa the government collects waste. Lideta has the highest (71.1%) instance of government collected waste. Private companies (30%) and community associations (7%) collect waste in Bole, suggesting that the households are willing and able to contract such services. Private companies tend to be more efficient and reliable in performing their tasks compared to local government that easily get overwhelmed. More than 12% of the households dump their waste on the streets or in vacant plots, which is done by approximately two-fifths (40.2%) of households in Akaki-Kaliti. Open burning is also prevalent in over 10% of the households (11.9%), more so in the poorer areas.
Conclusion
Water and sanitation are important indicators of development. Access to water correlates strongly with the survival of children under-five-years (Gleick, 1993). Connection to improved water supply, sewage and solid waste disposal system, among other services, is a critical process of ensuring business productivity in cities. Due to the fact that women are the ones responsible for water collection and for maintaining hygiene in the home, any disruption in these services increases their burden and greatly impacts on other aspects of their lives including education attainment, career development and childcare. Sharing toilet facilities, which is fairly common in the sub-cities of Addis Ababa may hinder some people, especially women, from using the available sanitary facilities.
21
6.0. Secure Tenure Secure tenure is the right of all individuals and groups to effective protection by the state against forced evictions. People have secure tenure when there is evidence of documentation that can be used as proof of tenure status; and when there is either de facto or perceived protection from forced eviction.
Secure tenure can be considered as the first component of the progressive realization to the right of housing. The granting of secure tenure will not, in and of itself solve the problem of homelessness, poverty and unsafe living environments and inadequate housing. However, secure tenure is one of the most essential elements of a successful shelter strategy. A high risk of eviction in many circumstances constitutes an indicator of poor tenure security. Eviction should be enshrined in the law, which should be enforced (Urban Indicators Guidelines).
The process of determining secure tenure The process of determining whether households had security of tenure in Addis Ababa began with separating households that rented their premises from those that owned or had a long-term lease on both the land and/or the dwellings within which they resided. Internally displaced persons (IDP) resided in one particular cluster and were deemed not to have security of tenure. Tenants of rental households were deemed not to have security of tenure if their rental lease agreements were not legally registered. Owners of dwellings and/or land were deemed to have security of tenure if they held land registration certificate, title deeds to dwelling, title deeds to lease land, purchase agreement for dwelling and lease agreement for the land. However, owners and tenants who had adequate documentation but felt there was a chance of eviction or that eviction was likely, were deemed not to have secure tenure.
Box 3 Documentary evidence of ownership • Formal title deeds to both land and
residence • Formal title deeds to either land or
residence • Enforceable agreements or any
document as proof of a tenure arrangement agreement only
• Formal rental contracts (tenant households)
• Customary tenure or irregular occupants with tax payment documents (property tax, municipality tax, etc) only
• Customary tenure or irregular occupants who possess utility bills
Occupancy status and ownership documents The rate of home ownership in Addis Ababa is fairly low with only 43.3% of the households owning or renting the properties they occupy on a long-term basis. There are contrasts across cities in terms of ownership. For instance, while in Nefas Silk (86.9%) and Kolfe Keranio (68.7%) the majority of households own their properties, in the other sub-cities the majority (over 70%) are renters, particularly in Cherkos, Arada, Addis Ketema and Lideta. A high proportion (80%) of the household owners hold certificates and title deeds as documentary evidence of ownership and occupancy. Households without title deeds rely on property tax certificates (9.2%). Very few households rely on adjudication certificates.
22

Perceived eviction To enjoy security of tenure as indicated above, one has to perceive himself/herself less likely to be evicted. Many owners (77%) feel less likely to be evicted from their property while 95% of the renters feel less likely to be evicted. This proportion of perceived eviction is higher among the owners, a fact that contradicts the traditional belief that that ownership provides more security. This discrepancy is mainly due to the fact that renters have the freedom to move unless they default in their rent payments. The situation is different for owners who in most cases are not in a position to move, therefore if they feel they do not have the appropriate documentation, they may vie themselves less secure. Security of tenure If the ownership of documents and perceived evictions are combined, only 6 in 10 households enjoy security of tenure in Addis Ababa. In other terms, in Addis Ababa about 2 households out of 5 lack secure tenure due to a combination of absence of documentation and perceived possibility of eviction, as shown in Table 3.
Table 3: Security of tenure, Addis Ababa, 2003
Had secure tenure Number of households
Arada 65.5 167 Addis Ketema 68.1 126 Lideta 58.5 156 Cherkos 48.6 122 Yeka 53.0 164 Bole 65.5 170 Akaki Kaliti 64.6 100 Nefas Silk 56.2 160 Kolfe Keranio 57.1 168 Gulele 76.5 177 Slum 56.6 1,336 Non-slum 100.0 174 Total 61.6 1,510
The situation of secure tenure in Addis Ababa is also presented in Figure 10, which is a map showing sub-city variations.
23
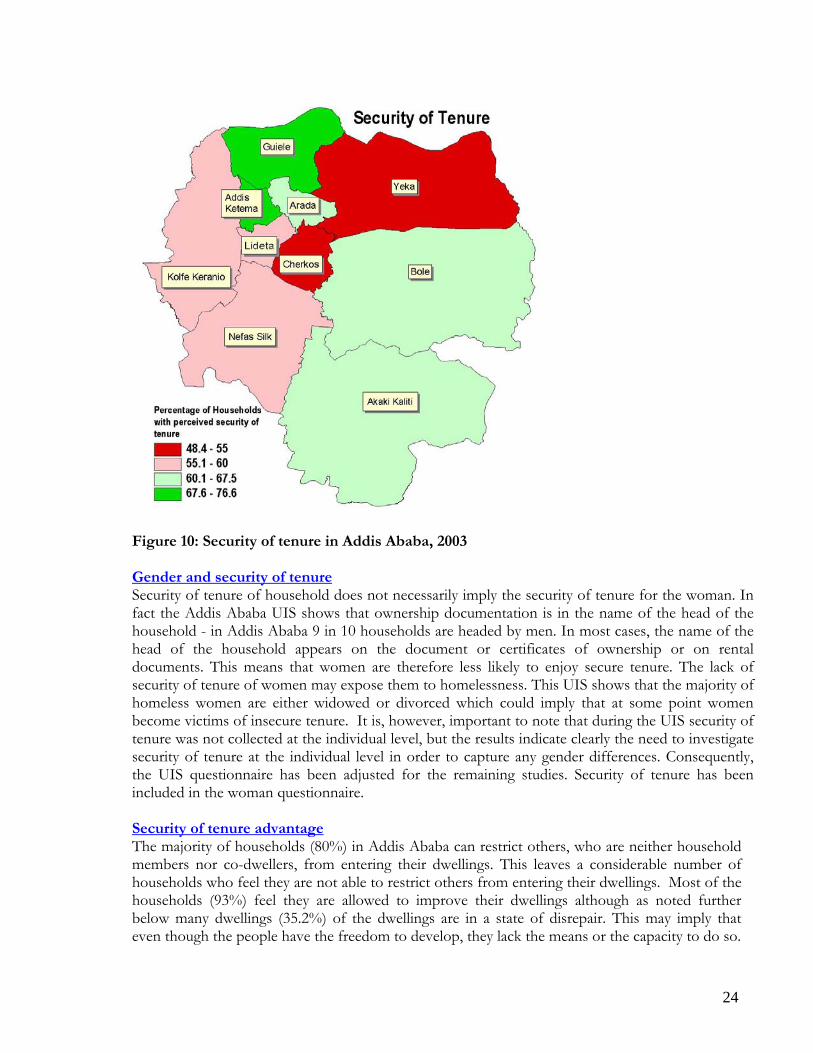
Figure 10: Security of tenure in Addis Ababa, 2003 Gender and security of tenure Security of tenure of household does not necessarily imply the security of tenure for the woman. In fact the Addis Ababa UIS shows that ownership documentation is in the name of the head of the household - in Addis Ababa 9 in 10 households are headed by men. In most cases, the name of the head of the household appears on the document or certificates of ownership or on rental documents. This means that women are therefore less likely to enjoy secure tenure. The lack of security of tenure of women may expose them to homelessness. This UIS shows that the majority of homeless women are either widowed or divorced which could imply that at some point women become victims of insecure tenure. It is, however, important to note that during the UIS security of tenure was not collected at the individual level, but the results indicate clearly the need to investigate security of tenure at the individual level in order to capture any gender differences. Consequently, the UIS questionnaire has been adjusted for the remaining studies. Security of tenure has been included in the woman questionnaire. Security of tenure advantage The majority of households (80%) in Addis Ababa can restrict others, who are neither household members nor co-dwellers, from entering their dwellings. This leaves a considerable number of households who feel they are not able to restrict others from entering their dwellings. Most of the households (93%) feel they are allowed to improve their dwellings although as noted further below many dwellings (35.2%) of the dwellings are in a state of disrepair. This may imply that even though the people have the freedom to develop, they lack the means or the capacity to do so.
24

Conclusion In terms of security of tenure, a high proportion of the households (77%) that own or have a long-term lease on land felt they were secure. Although not able to capture gender differences in terms of secure tenure, women tend to enjoy less security as inferred from the higher proportions of homeless female-headed families (discussed separately in this report). Security of tenure is difficult to measure because of the differences in perceptions of “security” among the residents of any particular country or city. However, security of tenure is an important measurement due to four main factors: (1) the rapid expansion of urban areas in developing countries; (2) the development of urban regions (mega-polis); (3) transformation of secondary cities; and (4) increasing levels in urban poverty. Government and city authorities have therefore to consider security of tenure as an important component of development. UN-Habitat is in the process of developing a separate questionnaire to assess security of tenure for households focusing on women.
25

7.0 Durability of Housing A house is considered durable if it is built on a non-hazardous location and has a structure permanent and adequate enough to protect its inhabitants from the extremes of climatic conditions such as rain, heat, cold and humidity.
Households in slum areas usually occupy non-durable dwelling units that expose them to high morbidity and mortality risks. Generally, a housing structure is considered durable when certain strong building materials are used for the roof, walls and floor. Even though some houses may be built with materials classified as durable, the dwellers may still not enjoy adequate protection against weather and climate due to the overall state of a dwelling. Alternatively, a material may not look durable, in the modern sense, but is in the traditional sense, when combined with skills of repair. (Urban Indicators Guidelines).
It is important to acknowledge from the outset that the two indicators used to measure durability of housing cannot be easily observed because they need specific knowledge on legal conditions and land use plan as well as skills to determine hazardous areas. Dwellings in the semi-urban outskirts of cities in developing countries often follow rural construction patterns by using materials, which can be considered non-durable under urban conditions. Compliance with local regulations and the quality of the location form part of the definition because a house is also considered “durable” when it is built on a non-hazardous location.
Quality of construction The materials used for construction were, for the purpose of this study, classified into three distinct groups, natural or traditional, rudimentary and formal commercial materials for the purpose of this study. Natural materials used for flooring in Addis Ababa are a mixture of earth/sand/mud, and mud mixed with dung. Rudimentary materials include coarse wood planks, palm/bamboo and cement (not polished) while formal commercial building materials include parquet or polished wood, linoleum, ceramic tiles, cement (polished), carpet and terrazzo. The majority (45.6%) of floors are constructed using natural traditional materials while 12.5% are of rudimentary materials. The remaining (41.8%) of the floors are done using formal commercial materials. The most common commercial material used is polished cement (32.1%). Earth, sand and mud are mainly used in Akaki Kaliti (52.3%) and least in Bole (20.2 %).
Box 4 Quality of Construction Indicators Durability factors • Quality of construction (e.g.
materials used for wall, floor and roof)
• Compliance with local building codes, standards and bye-laws
Hazardous locations for houses • Geologically hazardous zones
(landslide/earthquake and flood areas;
• Garbage-mountains; • High-industrial pollution areas; • Other high risk zones, e.g.
railroads, airports, energy transmission lines.
The vast majority (84.5%) of households in Addis Ababa use corrugated iron for roofing – a material classified as formal commercial building material. Majority of households in Bole (96.2 %) use this material while it is used least in Nefas Silk (51.9%). Grass thatch is mostly used in Nefas Silk
26

(16.3%) and Yeka (14.5%) while discarded recycled materials and plastics were mainly used in Nefas Silk (17.8%).
Figure 11: A mud and wattle wall house in Addis Ababa, 2003
Almost three quarters (72.8%) of all households in Addis Ababa have mud and wattle walls. This is mainly the case in Akaki Kaliti (96.4%), followed by Addis Ketema (90.7%), with the least reported in Bole (29.1%). The only other material used by a significant proportion of households is cement blocks (14.2%) whose use is highest in Bole (59.2%) and lowest in Akaki Kaliti (1.9%). This further indicates the differences between sub-cities in terms of income, an issue that is dicussed in more detail further below.
Housing maintenance status
Many houses (60.9%) do not require any repairs, while 35.2% are in need of major repairs. The need for major repairs is most prevalent in Akaki Kaliti (59.7%) and Addis Ketema (48.1%), and least in Bole (13.3%). Most of the dwellings (66%) are considered by the inhabitants to be below living standards. Most of these (94.8%) are in Akaki Kaliti, Addis Ketema (88%) and Yeka (88%) while the least are in Bole (52.3%).
A durable housing indicator has been developed by combining an assessment of the materials used for construction and the state of a dwelling’s state repair. In total, 58% of the dwellings in Addis Ababa are non-durable. While in Bole only 28% of the houses are considered not durable, the majority of houses in the other sub-cities are considered not durable as shown in Figure 12.
27

Figure 12: Distribution of households with durable housing in Addis Ababa, 2003
Conclusion
The predominant use of mud and wattle in the construction of housing walls and floors calls for frequent repairs, which tend to be expensive in the long run. The households that have the highest use of these materials are in Akaki Kaliti and Addis Ketema where the highest need for repairs was also apparent. In addition, dust from the mud and earth used for the floors and walls leads to increased susceptibility of the dwellers to respiratory diseases, especially among children. It is clear from this study that the government and the city authority need to enforce the building by-laws to protect the residents. It is would be useful for future surveys to assess the location of houses in slum areas in view of hazardous locations and their possible consequences.
28
8.0 Sufficient Living Area A house is considered to provide a sufficient living area for the household members if not more than two people share the same room.
This is a key indicator measuring the adequacy of the basic human need for shelter. Reduced space per person is often associated with certain categories of health risks and therefore considered as key criteria to define the slum. Overcrowding is associated with a low number of square meters per person, high occupancy rates – number of persons sharing one room – and a high number of single room units. Examples of slums worldwide show that dwelling units are often overcrowded with five and more persons sharing a one-room unit used for cooking, sleeping, and other household activities. Several local definitions of slums include minimum thresholds concerning the size of the area, the number of structures in a settlement cluster, the number of households or people or the density of dwelling units in an area (Urban Indicators Guidelines).
Overcrowding Overcrowding has implications on the health of the people especially in terms of transmission of infectious diseases. It also infringes on people’s privacy, including sexual privacy for the adults within the households. Addis Ketema has the highest mean number of people per room (3.3), followed by Akaki Kaliti (3.0). The least mean is in Bole (1.9) followed by Kolfe Keranio (2.0). By measuring the amount of habitable rooms that each of the households has, and by cross referencing this figure with the number of people living in that dwelling, a measure of whether a household is overcrowded or not has been developed. Overcrowding is a problem in all sub-cities of Addis Ababa. In total, 24.8% of all households are overcrowded. Most of these are in Addis Ketema (38.7%), followed by Akaki Kaliti (32.2%) and then Arada (30.8%). The least crowded area is Bole, which is a problem in only 6% of the households. Figure 13 provides a summary of the distribution of overcrowding across the sub-cities.
29

Figure 13: Overcrowding in Addis Ababa, 2003 Living space and energy resources As part of the UIS an assessment was done to establish whether the dwellings had a separate room for cooking and food preparation, and whether or not this room was properly ventilated. The importance of this was to determine whether the main living area was exposed to too much smoke from the burning of fossil fuels while cooking. Preparation of meals using open wood/charcoal/dung fires inside a living area can lead to a build up of excessive smoke in a room. If the room is not well ventilated, acute respiratory problems can develop overtime, especially amongst women because they primarily prepare the food for consumption and also among children who spend a lot of time at home around their mothers.
Separate cooking area
Most of the households (70.9%) in Addis Ababa have separate rooms for cooking and food preparation. The highest proportion is in Kolfe Keranio (88%) and Bole (84.1%) while the lowest are in Lideta (53.7%) and Nefas Silk (61.9%).
In terms of cooking energy, the most common is gas (53%), followed by wood (19.5%) and electricity (14.1%). Paraffin and charcoal are used to a less extent, 6.5% and 6.0 %, respectively. In terms of the different stoves used for cooking, LPG gas is the most common (57.4%), followed by charcoal/wood/dung without chimney (15.8%), electricity (9.8%) and charcoal/wood/dung with chimney (9.6%). Charcoal/wood/dung without chimney is the main type of stove in Akaki Kaliti (44.8%), which further indicates the high levels of poverty in this sub-city.
30

Conclusion One in every four households in Addis Ababa is overcrowded. Further, a high proportion of households do not have separate cooking areas. When overcrowding is combined with inadequate ventilation, risks to infections, especially among women and children are heightened. There seems to be a relationship between dissatisfaction with dwellings, overcrowding and lack of cooking space, given that higher proportions of households in Akaki Kaliti (94.8%), Addis Ketema (88%) and Yeka (88%) expressed dissatisfaction with their dwelling places.
31

9.0 Monetary Poverty The right to development and the right to a life free from poverty are basic human rights. The UN Charter, the Universal Declaration on Human Rights, the World Summit on Social Development and many other multilateral declarations and conferences have recognized and reconfirmed economic, social, political and cultural rights with the goal of eradicating poverty and its consequences. Among these are an adequate standard of living, food, housing, education, health, work, social security and a share in the benefits of social progress. The number of poor, measured through the number of households living below the poverty line, provides a traditional measure of the general poverty. It indicates the relative number of people in poverty, which constitute the major part of disadvantaged groups. Reduced poverty is also a guarantee to improved social integration and inclusion (Urban Indicators Guidelines). Household income The main objective of this section is to assess the level of incomes in Addis Ababa, the main sources of income and the ability of households to generate income and to share it amongst themselves. The results show that residents of Addis Ababa receive income from a wide range of sources including salary, self-employment, transfers and from own property as shown in Table 4. Table 4: Distribution of households by any type of income, Addis Ababa, 2003
Sub-City Received any type of income
Income from salary
Income from self-employment
Had received any kind of transfer
Received any property income
Other income
Number of people
Arada 97.2 70.9 27.5 30.6 6.4 4.1 847 Addis Ketema 99.4 54.6 41.6 28.5 12.8 5.9 774
Lideta 97.6 59.3 43.9 37.1 9.4 12.4 888 Cherkos 98.1 71.2 23.6 29.1 11.8 4.2 614 Yeka 100.0 64.2 39.2 23.2 12.9 0.9 855 Bole 98.6 75.1 32.4 40.4 12.1 2.5 931 Akaki-Kaliti 98.5 43.8 50.0 28.7 6.5 0.6 510 Nefas Silk 99.3 58.5 52.4 15.7 14.1 3.9 838 Kolfe Keranio 95.0 55.0 40.7 28.2 13.2 0.0 956
Gulele 100.0 61.2 52.7 34.6 10.6 13.1 970 Total 98.3 61.9 40.6 29.9 11.2 5.0 8,182
Most of the households (98.1%) have some form of income, however, salaried income is highest in Bole (75.1%) and lowest in Akaki Kaliti (43.8%), a difference that has been reflected in the earlier section of this report. Income from self-employment accounts for 40.6% and is highest in Nefas Silk (52.4%) and lowest in Arada (27.5%) which has higher income from salaries (70.9%). Transfers, which are not usually a reliable source of income, are most prevalent in Bole (40.4%) and lowest in Nefas Silk (15.7%) where households mainly depend on self-employment for income generation. The high levels of transfers in Bole may be a result of migrant labour within and outside Ethiopia.
32

Household Savings
While the vast majority (98.3%) of households within the city have some form of income, the availability of sufficient income to channel to savings or to invest in alternative assets, is very limited as summarized in Table 5. Table 5: Distribution of households by savings and economic self assessment, Addis Ababa, 2003
Sub-City Have saving account
Own land in rural areas or somewhere else
Own dwelling in rural areas or somewhere else
Own a business
Number of people
Arada 20.7 2.8 3.0 1.4 847 Addis Ketema 13.2 3.8 2.5 3.5 774 Lideta 6.2 0.8 1.7 0.5 888 Cherkos 21.2 3.8 1.4 0.8 614 Yeka 11.5 2.5 0.0 0.0 855 Bole 27.5 4.0 1.9 0.7 931 Akaki-Kaliti 5.3 0.0 0.0 0.0 510 Nefas Silk 5.1 0.0 1.5 2.1 838 Kolfe Keranio 9.1 6.8 5.7 0.3 956 Gulele 9.8 1.2 0.8 0.9 970 Total 13.1 2.7 2.0 1.0 8,182
Only 13.1% of the households have savings accounts, while in total only 2.7% own land in rural areas or elsewhere, and only 2% own dwellings elsewhere. Reflecting the generally higher income profile in Bole, this sub-city is home to the highest proportion of households with savings accounts (27.5%), as well as being the sub-city second most likely to include households with land elsewhere, and third most likely to include households who own dwellings elsewhere. Households in Nefas Silk and Akaki Kaliti have the lowest capacity to make any savings from their incomes (5.1% and 5.3%, respectively).
Household expenditures
Average monthly expenditure on food for all sub-cities is 311.2 Birr, followed by school fees (189 Birr) and then energy (102 Birr). The household expenditures are commensurate with the wealth of an area – Bole has the highest expenditure on all items while Akaki Kaliti has the lowest. This correlates with the profile already presented of Akaki Kaliti the as the poorest sub-city in terms of household income. Conclusion The distribution of monetary poverty provides a good insight into access to services within and among the sub-cities. People with limited access to water and sanitation facilities, who live in overcrowded dwellings and in houses constructed with materials that are not durable, are more likely to experience higher levels of monetary poverty. This could partly explain the disparities between the sub-cities whereby Bole has, on average, high income levels and invariably more access to services compared to Akaki Kaliti that is characterized by households that are generally dissatisfied with their living conditions. These differences can also be linked to access to education, career development and health outcomes.
33

10.0 Information and communication Amenities such as radio, television and telephone can be used to measure wealth, but they could also indicate the potential of communication and information sharing with the outside world. Access to information and proper use of information communication technology can contribute to an individual’s and/or a community’s development and growth. Examples of such growth include increased community awareness and involvement, employment, greater knowledge about public services such as healthcare and education and opportunities for future growth and prosperity. Access to a telephone is used to monitor MDG8, Target 18, Indicator 47 (Urban Indicators Guidelines).
Access to postal services
For most inhabitants of Addis Ababa (85.2%) it takes them no more than one hour to get to the nearest working post office. Access to a post office is important because unlike in developed countries where people use physical addresses, in Addis Ababa letters are delivered to a central post office. Long distances to post office would invariably hinder communication among people within and out of Addis Ababa.
Access to radio, television and telephone
Most of the residents of Addis Ababa (89.1%) own radios. Slightly more than one half (51.4%) own televisions in their homes - most of them in Bole (75.1%) and the least in Akaki Kaliti (16.1%). Only 35.2% of all households have telephones in their dwellings. Mobile telephones are owned by very few (10%) of the households. Few (5.9%) of the households use the Internet. The distribution of communication tools in Addis Ababa follows the pattern observed in the section on monetary poverty.
Table 6: Percentage of households with radio, television and telephone, Addis Ababa,2003
Sub-city
Does your household have a radio?
Does your household have a television?
Does your household have a telephone?
Does your household have a mobile telephone?
Number of households
Arada 94.3 61.6 43.7 10.8 167 Addis Ketema 92.2 47.5 14.6 5.7 126 Lideta 92.2 51.4 26.2 8.0 156 Cherkos 92.9 56.6 49.8 6.7 122 Yeka 84.6 41.2 36.4 5.6 164 Bole 96.6 75.1 66.1 22.1 170 Akaki Kaliti 75.0 16.1 14.9 0.0 100 Nefas Silk 79.7 41.5 35.6 16.7 160 Kolfe Keranio 89.6 58.8 19.8 8.9 168 Gulele 89.5 49.3 34.6 9.1 177 Slum 87.9 47.5 32.0 9.0 1,336 Non-slum 98.0 81.4 59.6 17.0 174 Total 89.1 51.4 35.2 10.0 1,510
34

Figure 14: Telephone connections in Addis Ababa, 2003 In terms of use of radio and television facilities, slightly over one-half of the respondents (56.6%) listened to radio and 41.9% watch television daily. Owners of radio and television sets are more likely to watch them regularly due to availability compared to those who have to go out of their dwellings to get access. Main source of information Relatives, friends and neighbours are the most important sources of information on government activities such as HIV and AIDS, housing, security and service provision. In terms of market information (i.e. information related to finding jobs, accessing education, gaining information on development), relatives, friends and neighbours are the most important sources (39.4%), followed by the local market (17.6%) and radio (16.5%). Conclusion Although radio is readily available, relatives, friends and neighbours are the main sources of information on most development issues. Telephone access is still very low yet in the current development context the internet is an important communication tool. Limited access to postal services for some households is also an impediment to communication and may lead to isolation of some segments of the society.
35

11.0 Social Capital Social capital is assessed through building an overall picture of how strong ties and bonds are within a community, the feeling of closeness and togetherness that exists within neighbourhoods, the diversity of the population within the sample areas and how the differences may affect social integration and interaction. Involvement in community development projects/associations is also used as a measure of how well individuals interact in a community to create a common good that can benefit its members. Social networks Networks of interaction such as personal relationships in families, workplaces, neighbourhoods, local associations, and a range of informal and formal meeting places are part of social capital5. These networks are community-based infrastructures or institutions that facilitate social interaction and enable collective action i.e. local people coming together in an effort to improve their own standard of living, and as a net result, benefit the wider community. Over 8 in 10 people (85.4%) in Addis Ababa belong to social groups. Membership is highest in Akaki Kaliti (92.7%) and lowest in Nefas Silk (77.4%), as illustrated in Table 7.
Box 5 Social support in poor urban communities It has been observed that traditional support mechanisms provided by the extended family may be non-existent and where they exist they may become easily overwhelmed in poor urban areas. Community adjustment to economic crises depends on its material well being and coping ability and that communities have a certain threshold beyond which they break down.
Table 7: Percentage of households belonging to associations or groups, Addis Ababa, 2003
Sub City Self help association - IDIR
Microfinance
Political parties
Religious group
Family, parent or community
Any association
Number of households
Arada 81.6 8.2 1.7 25.4 22.2 87.4 167 Addis Ketema 89.7 7.4 0.7 9.1 4.1 90.7 126 Lideta 77.4 6.5 0.8 8.0 3.8 80.8 156 Cherkos 79.8 4.4 1.5 4.4 8.1 83.3 122 Yeka 85.8 11.3 0.0 10.1 6.8 87.4 164 Bole 81.6 9.7 2.3 18.6 16.1 82.3 170 Akaki Kaliti 91.8 8.6 0.0 20.4 6.3 92.7 100 Nefas Silk 76.0 12.0 0.0 17.9 13.7 77.4 160 Kolfe Keranio 78.6 8.1 0.0 13.9 10.8 84.1 168 Gulele 88.1 11.7 0.6 22.1 11.8 90.4 177 Slum 81.5 8.6 0.8 14.6 10.1 84.3 1336 Non-slum 91.3 11.7 0.7 20.8 17.0 94.0 174 Total 82.6 9.0 0.8 15.3 10.9 85.4 1510
5 Australian Bureau of Statistics 2000
36

Most people (82.6%) in Addis Ababa belong to IDIR, which is a non-profit membership organization that helps its members or their families during bereavement. Members make monthly contributions and in return IDIR provides financial and social support during funerals. Religious groups account for 15.5% while microfinance associations account for 9% of the association membership. IQUIB, a microfinance association, is the most important source of credit for the poor who are unable to secure loans from formal institutions. Assistance from people The ability to get help and to help other people provides an indication of the cohesiveness of a community. Half of the inhabitants of Addis Ababa (50.2%) can count on someone for assistance who is not a family member. A high proportion (57%) of the inhabitants, however, do not know if they are able to turn to anyone outside their family for help when faced with long-term emergencies. Conclusion Membership to informal groups follows the trend in monetary poverty, whereby those disadvantaged are more likely to belong to associations to gain access to assistance during hard times (such as death) or gain access to financial assistance in the form of cheap loans. Assistance from neighbours cannot be relied upon, which is an indication of loose social networks. In addition, many people do not feel comfortable with the notion of leaving their children with their neighbours. These observations indicate the need for the local authorities to design and provide services to address the plight of the poor. There are indications that when people have too many needs, assistance from neighbours is mainly confined to major shocks, mainly death and major illnesses6. Investment in a public support system will bridge the gap in access to services.
6 Amuyunzu-Nyamongo, M. and Ezeh, A. (in press) A qualitative assessment of support mechanisms in informal settlements of Nairobi, Kenya. Journal of Poverty.
37

12.0 Crime and violence Synopsis on crime and violence There can be no pursuit of meaningful sustainable development in a situation marked by uncontrolled and uncontrollable crime because it breeds and accompanies insecurity. Crime is an index of lawlessness and disintegration of social order. A UN report states that crime “impairs the overall development of nations, undermines spiritual and material well being, compromises human dignity and creates a climate of fear and violence, which endangers personal security and erodes the quality of life. There are two types of crimes: covert, which includes corruption, embezzling public funds, filling false information (addressed under corruption and service delivery); and overt crime. The latter involves physical and psychological injury to other people – homicide, armed robbery, car jacking, attempted murder, manslaughter, rape, etc.
Crime rates provide useful information on the level of security in a city. However, the number of reported murders represents the apparent crime. Since crime rates provide only a partial picture of the level of urban violence, there is need to collect complementary information at the city level. Whether or not the city has areas considered dangerous or inaccessible to the police and children experience violence at school, are good indications of the level of urban violence. Major policies and programmes against crimes and violence include official policy against domestic violence, crime and weapon control prevention policy and victim of violence assistance programmes. (Urban Indicators Guidelines).
Reported crime and violence This study shows that most of the inhabitants (87.4%) of Addis Ababa feel that their neighbourhoods are generally peaceful while only 6.5% feel there is violence. Few of the respondents (18.7%) perceive the violence as caused by social differences that exist within their communities. A fraction less then 6% (5.9%) felt that their neighbourhoods are neither peaceful nor violent. Over two-fifths (40.8%) of the people believe that the level of violence within their neighbourhood has stayed the same over the last five years. Two thirds of the inhabitants (66.7 %) who believe that their neighbourhoods are “very violent” perceive a high increase in violence over the last five years.
38

Figure 15: Crime and violence in Addis Ababa, 2003 Feelings of safety Almost all people in Addis Ababa (90%) feel safe at home when they are alone. There seems to be a linear relationship between how safe one feels in their home and how peaceful their neighbourhood is considered to be. The people who believe their neighbourhood is safe also feel within their homes Very few people (3.4 %) do not feel safe when home alone, while 6.4% feel neither safe nor unsafe. A little less than two-thirds of respondents (64.7 %) feel safe when they walk down the street alone after dark, 2.8 % feel neither safe nor unsafe, and 22.4 % fee unsafe. Experience of crime and violence The vast majority of respondents (94.9%) have never been the victims of a violent crime. Very few (3.3%) have been victims of violent crime on two occasions and even fewer (1.7%) have experienced it once. A small proportion of the people (3%) have experienced burglary at their homes. Consequently, few of the respondents (5.4%) feel that crime is so bad that they want to leave their neighbourhoods. Although it is not possible to assess the impact of violence on women, there is evidence from studies in other cities that they are more vulnerable to muggings, rape and other forms of crime but these may often go unreported.7
7 UN-Habitat. (2001) Nairobi Crime Survey
39

Conclusion Violence undermines the chances of social cohesion and inclusion, consequently decreasing the possibilities of establishing development projects being established within the communities. Communities that are marked by violence often do not have proper infrastructure in place, including public transport, proper communication technology to facilitate growth and development. Although the reported crime levels are relatively low in Addis Ababa compared to other cities in Africa, there is need to address the feelings of increasing levels of crime in some of the sub-cities. Crime and violence undermine social capital through preventing social integration mainly as a result of fear. If people within a neighbourhood fear for themselves or for their families, there is likelihood of higher levels of mistrust towards neighbours and other community members, thus decreasing the overall level of social integration and participation in community development projects. This may contribute to the feelings of fear expressed in the discussion of social capital whereby people are not sure whether they can entrust their children to their neighbours even during an emergency.
40

13.0 Homelessness in Addis Ababa Demographic characteristics of the respondents A total of 203 homeless people were interviewed, 61% of them males. One in every four respondents were aged 13 – 19 years while 38% were aged 20 – 29 years, which indicates a higher rate of homelessness among young people. Slightly over half (52.2 %) of the respondents had never been married. Among the rest, 15% were married or cohabiting at the time of the study while 13% were widowed. Single men characterized the majority (69.4%) of the homeless population. There are gender disparities in education completion and attainment among the homeless - primary school attendance is higher among the males (46.8%) compared to 32.9% of the females; and at the secondary school or higher level (25.0% males compared to 10.1 % females). Literacy levels are higher among males (58.1 %) compared to 26.6% among females. Of the female homeless aged between 15 and 49 years, 39.2% have never had a live birth. A high proportion of females aged 15-19 years (23.8%) have had one child, which is an indication of high levels of early pregnancy among homeless young women. Living arrangements A high proportion of homeless people live alone (62.1%), most of them males (74.2%). Most homeless people (79.8%) have either one or both of their parents dead. Over one-fifth of the 13-19 year-olds are orphans while a high proportion (76.9%) have one of their parents was dead. Although many 13-19 year olds (71.2%) have their mothers alive only 3.8% live with them, and even fewer live with their fathers. Six in 10 of the homeless (60.6%) get their drinking water from a public tap while 20.2% of them obtain it from a private tap piped to a house or yard. Men were more successful in obtaining drinking water compared to females. Over two-fifths (44.3%) of the homeless people pay for water. Women tend to pay for water more than men (50.6% compared to 40.3%, respectively). It is important to consider issues of cost, distance and the safety of such water, especially storage for people who live on the streets. (replace photo)
Box 6 Origins of homelessness in Addis Ababa Homeless is a result of rural-urban migration that is occasioned by the centralization of most of Ethiopia’s services in Addis Ababa. A majority (72.4%) of those on the streets are originally from Amhara regional state. The average age at which people migrate to Addis Ababa is 17 years. There is a striking gender difference in reasons for migrating to the city: for women (33.3%) migrate with their families compared to only 8.3% of the men while for the latter the (63.5%) migrate for work and cash income. A total of 41.8% have maintained the same location due to its suitability to begging.
Figure 16: Child being washed in a street, Addis Ababa, 2003
41
Over one-fifth of the homeless (23.2%) use flush/non-flush to sewage toilet facilities. Many of them use public places such as the streets, bushes and streams. For almost half (45.3%) of them the toilet facilities are too far from where they sleep, especially for the women (49.4%). The distant toilet facilities pose a problem for the elderly who cannot walk far seeking this service. This could be a factor of culture and socialization with its emphasis on privacy that makes older people and women more cautious in their use of toilet facilities, an act largely considered private. Many of the homeless (52.7%) sleep on street pavements and a high proportion of them (62.6%) stay in the same areas for long periods. Women are more likely to remain in the same sleeping space compared to men, 70.9% and 57.3%, respectively. In deed, younger respondents are more likely to move around in groups than those in older age cohorts. A small proportion of the homeless (28.6%) cook their food, more than half (51.9%) of these females compared to 13.7% males. This may be due to the fact that women who live on the streets have families to care for while men can get away with scavenging for food, especially the younger age group. Social capital for the homeless A negligible number of homeless people belong to any form of social group (6 people out of 203). In addition, they tend to have very few friends - on average a fraction over two friends each. A high proportion (39.3%) of the homeless people have no close friends and 57.1% live alone. A higher proportion (41.3%) of them have between one and three friends. Women have less close friends than men, while many of the young people aged 13-19 (43.1%) have no friends. Almost 7 out of 10 homeless people (67.5%) have no one to turn to when they need help, most of these live alone. This is surprising given that under normal circumstances, women and youth usually involve themselves in social activities and have more friends than adult men. This is a clear indication that many people on the streets are isolated, especially the young people. This isolation may be a survival tactic because it minimizes dependency and increases mobility, however it also increases the vulnerability of those on the streets especially during illness and death. The most important sources of information on development activities are friends and relatives (32.3%), more so among women (41.9%) compared to men (26.4%). The second most important source is the radio followed by the national newspaper. Many of those aged 20-29 years rely on information from friends and relatives, while those aged 13-19 get it from the radio. This may be due to the fact that the younger people are able to hung around shops and other places where they can listen to the radio. Women may have limited access to radio because they have to look for water, prepare food and generally care for their families. Conclusion Many of the homeless people go to Addis Ababa in search of employment or they accompany their family members, more so in the case of women. Most have at least primary level education with some having secondary and even higher education, which implies that from the beginning they people have the potential to secure better, lives for themselves. However, in reality most of them live alone and significant proportions do not have friends or family to rely on or to turn to in times of need. It is clear that the homeless of Addis Ababa are extremely vulnerable and isolated. While they are subject to similar hardships facing residents of the city, they have the added misfortune of not having shelter. The homeless are trapped in a cycle of poverty which appears to demobilize them and increase their susceptibility to crime and violence as they struggle to make a living while on the streets.
42
14.0 Policy Implications and Recommendations This study clearly shows that the methodology developed by UN-Habitat for slum estimation has the potential to provide a better understanding of the conditions in urban cities around the world, and therefore enhance the ability of governments to monitor MDG 7, Target 11. There are several recommendations from this study, as indicated below. • Data gathered on slum populations should be disaggregated by gender, mainly because women
experience and cope with situations differently from men. These differences cut across access to services, security of tenure and the types of dwellings they live in. Disaggregating data ensures that the needs of men and women are addressed in a targeted manner.
• Access to safe water should be measured comprehensively taking into considering cost, time and access. People may have water in close proximity but they may fail to acquire it due to cost and time requirements. Disruptions in water services should also be explored because it interrupts other aspects of the people’s lives, such as education among girls and women, who are responsible for acquiring water.
• Access to services, for instance safe water and adequate sanitation, are critical to the health and well being of urban dwellers. There is need for city and local authorities to formulate and implement policies in view of ensuring that all people have access to these services. The poor are often forced to pay exorbitant costs for services well beyond their income levels.
• Measurement of secure tenure is complex given the varied types of documents used for ownership and lease. In addition, differences in perceptions of “security” held by individuals in any city makes this indicator difficult to measure. Gender differences in secure tenure should be established in view of their limited control over property mainly as a result of cultural and legal biases.
• The location of dwellings in hazardous locations is an important component of durability of housing although it is difficult to measure. There is need do develop measurable indicators of hazardousness to allow comparability of data across cities.
• Although there are only five slum indicators, it is important for studies to include other aspects of the people’s livelihood including income poverty, social capital, information and communication, and crime and violence. These conditions are the driving forces behind the availability and accessibility to services. For instance, crime and violence discourages investments, increases fear and mistrust among people and essentially isolates communities that are already marginalized. When poor households are forced to pay exorbitantly for services other aspects of their lives, such as education and health, get affected. City and local authorities therefore need to approach urban poverty as a development issue rather than a problem for a small segment of the society.
• Homelessness is a growing problem in most urban areas because of the increasing urban populations without commensurate growth in service provision. There is need for comprehensive investigations on homelessness as opposed to the traditional studies that focus on specific aspects of the homeless missing the broader picture of the social life of those on the streets. Homelessness provides a challenge to local authorities and governments in terms of unemployment, lack of shelter and the need to develop rural areas in order to slow the influx of people into urban areas.
43