urban green spaces and health - who/ · pdf filecharacteristics of urban green spaces ......
TRANSCRIPT

Urban green spaces
and health


Urban green spaces
and health
A review of evidence

ABSTRACT
This report summarizes the available evidence of beneficial effects of urban green spaces, such as improved mental health, reduced cardiovascular morbidity and mortality, obesity and risk of type 2 diabetes, and improved pregnancy outcomes. Mechanisms leading to these health benefits include psychological relaxation and stress alleviation, increased physical activity, reduced exposure to air pollutants, noise and excess heat. Characteristics of urban green spaces that are associated with specific mechanisms leading to health benefits, and measures or indicators of green space availability, accessibility and use that have been used in previous surveys are discussed from the perspective of their public health relevance and applicability for monitoring progress towards goals set in international commitments, such as the Parma Declaration in the WHO European Region and the global Sustainable Development Goals. The report also presents a suggested indicator of accessibility of green spaces with examples of its application in three European cities and a detailed methodological tool kit for GIS analysis of land use and population data.
Keywords Urban Health Cities Environment
Address requests about publications of the WHO Regional Office for Europe to: Publications WHO Regional Office for Europe UN City, Marmorvej 51 DK‐2100 Copenhagen Ø, Denmark Alternatively, complete an online request form for documentation, health information, or for permission to quote or translate, on the Regional Office web site (http://www.euro.who.int/pubrequest).
Citation advice: Urban green spaces and health. Copenhagen: WHO Regional Office for Europe, 2016.
© World Health Organization 2016
All rights reserved. The Regional Office for Europe of the World Health Organization welcomes requests for permission to reproduce or translate its publications, in part or in full.
The designations employed and the presentation of the material in this publication do not imply the expression of any opinion whatsoever on the part of the World Health Organization concerning the legal status of any country, territory, city or area or of its authorities, or concerning the delimitation of its frontiers or boundaries. Dotted lines on maps represent approximate border lines for which there may not yet be full agreement.
The mention of specific companies or of certain manufacturers’ products does not imply that they are endorsed or recommended by the World Health Organization in preference to others of a similar nature that are not mentioned. Errors and omissions excepted, the names of proprietary products are distinguished by initial capital letters.
All reasonable precautions have been taken by the World Health Organization to verify the information contained in this publication. However, the published material is being distributed without warranty of any kind, either express or implied. The responsibility for the interpretation and use of the material lies with the reader. In no event shall the World Health Organization be liable for damages arising from its use. The views expressed by authors, editors, or expert groups do not necessarily represent the decisions or the stated policy of the World Health Organization.
Cover photo: OPENspace Research Centre

iii
Editors
Andrey I. Egorov 1, 2 *, Pierpaolo Mudu 1, Matthias Braubach 1 and Marco Martuzzi 1
1 World Health Organization, European Centre for Environment and Health, Bonn, Germany
2 United States Environmental Protection Agency, National Health and Environmental Effects Research Laboratory, Chapel Hill, North Carolina, the United States
* AIE contributed to the report working at WHO and then at US EPA.
Primary authors
Section 2: Catharine Ward Thompson and Eva Silveirinha de Oliveira OPENspace Research Centre, University of Edinburgh, United Kingdom Section 3: Benedict W. Wheeler and Michael H. Depledge European Centre for Environment and Human Health, University of Exeter Medical School, United Kingdom Section 4: Matilda Annerstedt van den Bosch Swedish University of Agricultural Sciences, SLU, Alnarp, and Lund University, Sweden
Other contributors
The following individuals contributed their expertise to the development of recommendations on health‐relevant WHO indicators of urban green space and commented on the draft report:
Mark Nieuwenhuijsen, Center for Research in Environmental Epidemiology (CREAL), Barcelona, Spain
Sjerp De Vries, Research Institute Alterra, Wageningen University, Wageningen, The Netherlands
Thomas Claßen, University of Bielefeld School of Public Health, Bielefeld, Germany
Jenny Roe, University of Virginia School of Architecture, Charlottesville, Virginia, the United States
Hanneke Kruize, Dutch National Institute for Public Health and the Environment (RIVM), Bilthoven, The Netherlands
Francesca Racioppi, WHO Regional Office for Europe, Copenhagen, Denmark
Tanja Wolf, WHO Regional Office for Europe, Bonn, Germany
Kristen Scott, Intern at the WHO Regional Office for Europe, Bonn, Germany
Anne Cleary, Intern at the WHO Regional Office for Europe, Bonn, Germany.
Acknowledgement
Glenn Rice, US Environmental Protection Agency, reviewed the report and made valuable comments.

iv
Disclaimer
The views expressed in this report are those of the authors and do not necessarily reflect the views or policies of the U.S. Environmental Protection Agency. Mention of trade names or commercial products does not constitute endorsement or recommendation for use.

v
List of abbreviations
ADHD Attention Deficit Hyperactivity Disorder
BME (groups) black and minority ethnic (groups)
CORINE Coordination of Information on the Environment
EEA European Environment Agency
EEG Electroencephalography
EU European Union
GIS Geographic Information System
GPS Global Positioning System
NDVI Normalized Difference Vegetation Index
UV (light) ultraviolet (light)
US EPA United States Environmental Protection Agency
WHO World Health Organization

vi
Table of contents
1. INTRODUCTION .................................................................................................................................. 1 2. EVIDENCE ON HEALTH BENEFITS OF URBAN GREEN SPACES ............................................................. 3 2.1 Definitions of urban green space ................................................................................................. 3 2.2 Pathways linking urban green space to improved health and well‐being .................................... 3 2.2.1 Overview of pathways to health ........................................................................................... 3 2.2.2 Improved relaxation and restoration .................................................................................... 4 2.2.3 Improved social capital ......................................................................................................... 5 2.2.4 Improved functioning of the immune system ....................................................................... 5 2.2.5 Enhanced physical activity, improved fitness and reduced obesity ...................................... 5 2.2.6 Anthropogenic noise buffering and production of natural sounds ....................................... 7 2.2.7 Reduced exposure to air pollution ........................................................................................ 8 2.2.8 Reduction of the urban heat island effect ............................................................................. 8 2.2.9 Enhanced pro‐environmental behaviour .............................................................................. 8 2.2.10 Optimized exposure to sunlight and improved sleep .......................................................... 9
2.3 Evidence of health benefits of green spaces ................................................................................ 9 2.3.1 Improved mental health and cognitive function ................................................................... 9 2.3.2 Reduced cardiovascular morbidity ...................................................................................... 10 2.3.3 Reduced prevalence of type 2 diabetes .............................................................................. 11 2.3.4 Improved pregnancy outcomes .......................................................................................... 11 2.3.5 Reduced mortality ............................................................................................................... 11
2.4 Mechanisms of potential pathogenic effects of green spaces ................................................... 12 2.4.1 Increased exposure to air pollutants ................................................................................... 12 2.4.2 Risk of allergies and asthma ................................................................................................ 12 2.4.3 Exposure to pesticides and herbicides ................................................................................ 12 2.4.4 Exposure to disease vectors and zoonotic infections .......................................................... 13 2.4.5 Accidental injuries ............................................................................................................... 13 2.4.6 Excessive exposure to UV radiation .................................................................................... 13 2.4.7 Vulnerability to crime .......................................................................................................... 13
2.5 Characteristics of urban green space associated with specific health benefits or hazards ........ 14 2.5.1 Perceptions of green space accessibility and quality .......................................................... 14 2.5.2 Size of green space .............................................................................................................. 15 2.5.3 Presence of specific facilities for certain activities .............................................................. 15 2.5.4 Tree cover and canopy density ........................................................................................... 15
2.6 Differential health benefits of green spaces in specific population groups ............................... 16 2.6.1 Women ................................................................................................................................ 16 2.6.2 Children and adolescents .................................................................................................... 17 2.6.3 Older adults ......................................................................................................................... 17 2.6.4 Deprived subpopulations and minority groups ................................................................... 18 2.6.5 Populations of various countries and geographic regions ................................................... 19
2.7 Co‐benefits of urban green spaces unrelated to health effects ................................................. 19 3. INDICATORS OF URBAN GREEN SPACE AVAILABILITY, ACCESSIBILITY AND USAGE, ............................. AND ASSESSMENT OF THEIR HEALTH RELEVANCE ............................................................................... 21 3.1 Classification of urban green space indicators ........................................................................... 21

vii
3.2 Green space characteristics that can be incorporated in definitions of indicators .................... 21 3.3 Indicators of green space availability ......................................................................................... 22 3.3.1 Greenness, measured by Normalised Difference Vegetation Index (NDVI) ........................ 22 3.3.2 Density or percentage of green space by area .................................................................... 23 3.3.3 Measures of street trees and other streetscape greenery .................................................. 24
3.4 Indicators of green space accessibility ....................................................................................... 25 3.4.1 Proximity to an urban park or geographically defined green space .................................... 25 3.4.2 Proportion of green space or greenness within a certain distance from residence ............ 26 3.4.3 Perception‐based measures of green space accessibility ................................................... 27
3.5 Indicators of green space usage ................................................................................................. 28 3.6 Summary and recommendations for a health‐relevant approach to selecting .............................. and using indicators of urban green space ...................................................................................... 29 3.6.1 Summary of considerations for selecting indicators ........................................................... 29 3.6.2 Recommendations for a primary indicator ......................................................................... 30 3.6.3 Recommendations for secondary indicators ....................................................................... 31
4. PROPOSED INDICATOR AND A DATA ANALYSIS TOOL KIT ................................................................ 32 4.1. Summary of indicator development and evaluation ................................................................. 32 4.2. Data requirements for a WHO Urban Green Space Indicator ................................................... 33 4.2.1. Land use data for EU countries .......................................................................................... 33 4.2.2. Land cover/use data for non‐EU countries ......................................................................... 34 4.2.3 Population data ................................................................................................................... 34
4.3. Methodology ............................................................................................................................. 34 4.3.1 General overview ................................................................................................................ 34 4.3.2 Basic method ....................................................................................................................... 36 4.3.3. Complex method ................................................................................................................ 38
4.4 Summary of the proposed indicator .......................................................................................... 39 5. CONCLUSIONS .................................................................................................................................. 40 6. LITERATURE ...................................................................................................................................... 42 APPENDIX 1. Examples of definitions related to assessing green space availability or accessibility .... 64 APPENDIX 2. The availability of key urban land use data for the Member States of ............................... the WHO European Region .................................................................................................................. 65 APPENDIX 3: A tool kit for assessing green space accessibility – detailed step‐by‐step procedure ..... 67

viii

1
1.INTRODUCTIONThere is a recent revival of interest in the importance of green space to support healthy living in urban areas. Links between green space and health have been recognized throughout history, and were one of the driving forces behind the urban parks movement of the 19th century in Europe and North America (Schuyler, 1988).
However, many of the mechanisms behind such links were poorly understood or lacked rigorous scientific evidence. In the 21st century, new research techniques provide opportunities to study the mechanisms behind associations between green space and health with increasing sophistication and help satisfy contemporary scientific standards of evidence demanded to inform policy and practice. This refined understanding of the health promotion potential of urban green spaces can contribute to addressing major public health issues related to noncommunicable diseases. Across Europe and beyond, preventable noncommunicable diseases, such as mental illness, obesity, cardiovascular diseases, type 2 diabetes and cancer, remain major factors not only affecting health and well‐being, but also driving up the cost of health care and reducing the productivity of the workforce. Many such illnesses are linked to chronic stress and lifestyle factors, such as insufficient physical activity (Shortt et al., 2014). Urban green spaces, as part of a wider environmental context, have the potential to help address problems ‘upstream’, in a preventative way – considered a more efficient approach than simply dealing with the ‘downstream’ consequences of ill health (Morris et al., 2006).
At the Fifth Ministerial Conference on Environment and Health in Parma, Italy (2010), the Member States of the WHO European Region made a commitment “…to provide each child by 2020 with access to healthy and safe environments and settings of daily life in which they can walk and cycle to kindergartens and schools, and to green spaces in which to play and undertake physical activity” (WHO, 2010b). Improving access to green spaces in cities is also included in the United Nations Sustainable Development Goal 11.7, which aims to achieve the following: “By 2030, provide universal access to safe, inclusive and accessible, green and public spaces, in particular for women and children, older persons and persons with disabilities” (United Nations Department of Economic and Social Affairs, 2014). Finally, the WHO Action Plan for the implementation of the European Strategy for the Prevention and Control of Noncommunicable Diseases in 2012−2016 includes a call to create health‐supporting urban environments (WHO, 2012).
Previous WHO reports have already contributed evidence and guidance on access to green space in relation to public health benefits. A WHO report on urban planning, environment and health published in 2010 states that green spaces can positively affect physical activity, social and psychological well‐being, improve air quality and reduce exposure to noise; however, they can also be associated with an increased risk of injury due to increased recreational and sport‐related use (WHO, 2010d). Another WHO report evaluated the effects of green spaces on physical activity and their potential to reduce public health inequalities. It states that “… access to public open space and green areas with appropriate recreation facilities for all age groups is needed to support active recreation”, but recognizes that multidisciplinary and intersectoral interventions may be needed to support disadvantaged groups where physical activity levels are lowest (WHO, 2013).
Recent studies have provided evidence of multiple benefits from urban green space, through various mechanisms, and with potentially differential impacts in various populations. Epidemiological studies have used a multitude of approaches to measure the effects of urban green space availability and accessibility on the health outcomes of study participants. Given the potential of urban green spaces to act as settings for health promotion it is therefore necessary to summarize the existing evidence identifying, where possible, the underlying mechanisms contributing to both the negative and positive health outcomes of urban green space. There is also a need to summarize existing understandings of the characteristics of urban green space that may differentially be associated with

2
health outcomes, and to understand how different populations may be affected and benefit in different ways.
This report offers a review of the existing evidence on the health effects of green space in urban areas alongside a summary of health‐relevant measures of green space availability, accessibility and usage. The report also presents a toolkit outlining an example of a Geographic Information System (GIS)‐based approach to measuring urban green space that WHO has recently applied in three European cities (Annerstedt van den Bosch et al., 2016). The review is not systematic but, rather, an overview of previous WHO reports and other previously published reviews as well as selected recent research publications. The main objectives of this report are to inform public health specialists and policy‐makers on the benefits of providing urban residents with green space access, and to provide cities with systematic approaches to quantifying and monitoring their green space access. In doing so this report advocates the implementation and evaluation of targeted, evidence‐based green space interventions for the health promotion of urban residents.

3
2.EVIDENCEONHEALTHBENEFITSOFURBANGREENSPACESThis section summarizes the evidence of pathways to health and health benefits of urban green space focusing particularly on research published over the last 10 years. Potential mechanisms by which green space may affect public health are discussed first, followed by specific health benefits demonstrated by epidemiological studies and, finally, potential detrimental effects.
2.1DefinitionsofurbangreenspaceCurrently, there is no universally accepted definition of urban green space, with regard to its health and well‐being impacts. Urban green spaces may include places with ‘natural surfaces’ or ‘natural settings’, but may also include specific types of urban greenery, such as street trees, and may also include ‘blue space’ which represents water elements ranging from ponds to coastal zones. Typical green spaces in urban areas are public parks; other definitions may also include private gardens, woodlands, children’s play areas, non‐amenity areas (such as roadside verges), riverside footpaths, beaches, and so on. The definitions are nuanced and context‐specific. For example, they can depend on particular environment‐health pathways under consideration. Examples of green space definitions are presented in Appendix 1.
The following review of health benefits as well as discussion of green space measures and indicators in Section 3 of the report summarize all available evidence and experience based on various definitions of urban green space, reflecting varying ways in which it is described and defined in different studies.
Consideration of urban green space in different research usually includes public parks and gardens, but may or may not also include a range of other areas, such as other public open space, street trees, sports pitches and recreational facilities such as golf courses, private and semi‐private gardens and other residential open space, roof gardens, urban agriculture, commercial forests, vegetated waste land, indeed any place where there is a natural surface or where trees are growing.
The most common definition of urban green space that has been used in studies in Europe is based on the definition from the European Urban Atlas (European Union, 2011). The Green Urban Areas as defined by Urban Atlas code 14100 include public green areas used predominantly for recreation such as gardens, zoos, parks, and suburban natural areas and forests, or green areas bordered by urban areas that are managed or used for recreational purposes. In policy terms, it is important to focus on urban green space that is open to the public particularly when considering universal green space access for all urban residents, regardless of socioeconomic circumstances. However, where relevant the overview includes studies that have used wider or more inclusive definitions of urban green space.
While the Urban Atlas excludes bodies of water from the definition of Green Urban Areas, we recognize that water is often part of urban green space and that the water edge, whether, for example, along a river or lake, a sea beach or a cliff, is often an important and attractive feature for people to use and enjoy. For this reason, we might consider the working definition for urban green space used in this overview to include ‘green/blue’ space which may be of benefit in its entirety, and where the riparian zone and access to water may be particularly valued and used by urban dwellers. This overview does not, however, include studies that are explicitly focused on the health benefits of water‐based sports and recreation.
2.2Pathwayslinkingurbangreenspacetoimprovedhealthandwell‐being
2.2.1Overviewofpathwaystohealth
The mechanisms underlying links between green space access and health are likely to be complex and interacting. Access to green space may produce health benefits through various pathways (mechanisms leading to health effects), some of which may have a synergistic effect. Various models

4
have been proposed to explain the observed relationship between green space and health. Hartig et al. (2014) suggested four principal and interacting pathways through which nature or green space may contribute to health: improved air quality, enhanced physical activity, stress reduction and greater social cohesion. Lachowycz & Jones (2013) emphasized physical activity, engagement with nature and relaxation, and social activities and interactions as major pathways to health. Villanueva et al. (2015) proposed a model that emphasizes respiratory health and resilience to heat‐related illness, social capital and cohesion, and physical activity. Kuo (2015) suggests a central role for enhanced immune functioning as a pathway between nature and health, recognizing that there may be multiple pathways, some of which may interact and offer both direct and indirect benefits. Hartig et al. (2014) summarized the existing strong evidence for restorative psychological effects from interaction with green space or natural environments.
2.2.2Improvedrelaxationandrestoration
It has been recognized for centuries that contact with nature can be restorative and evidence of mental health benefits from having contact with nature and green spaces is well documented (Hartig, 2007; Hartig et al., 1991). There are two main theories that attempt to explain this:
a) Psycho‐physiological stress reduction theory proposes that contact with nature (e.g. views of natural settings) can have a positive effect for those with high levels of stress, by shifting them to a more positive emotional state (Ulrich, 1983; Ulrich et al., 1991). As people are innately predisposed to find non‐threatening natural stimuli relaxing, exposure to these stimuli triggers a parasympathetic nervous system response leading to feelings of enhanced well‐being and relaxation.
b) Attention Restoration Theory suggests that involuntary attention given to interesting and rich stimuli in natural settings helps to improve performance in cognitively demanding tasks (Kaplan and Kaplan, 1989; Kaplan, 1995; Kaplan, 2001; Kaplan and Kaplan, 2011). People have two types of attention: directed attention, which requires effort and, therefore, is a limited resource, and fascination or effortless involuntary attention. Working on specific tasks requiring direct attention depletes this limited resource while involuntary attention, which is facilitated in natural environments, restores it and, therefore, improves cognitive performance.
Both are psycho‐evolutionary theories, based on the biophilia hypothesis, which postulates that humans have an innate need to affiliate with the natural environment within which they have evolved (Wilson, 1984). Both theories suggest that interaction with the natural environment serve a restorative function but through different mechanisms (reviewed by Clatworthy et al., 2013).
Support for these theories has been provided by studies that demonstrate restorative physiological responses associated with viewing or being in green space, including reduced blood pressure (Hartig et al., 2003, Ottosson & Grahn, 2005, Ulrich et al., 1991), heart rate (Ottosson & Grahn, 2005, Ulrich et al., 1991), skin conductance and muscle tension (Ulrich et al., 1991). Evidence of psychoneuroendocrine responses to woodland environments are based on observed associations with lower concentrations of cortisol, lower pulse rate, lower blood pressure, greater parasympathetic nerve activity and lower sympathetic nerve activity when compared to city environments (Lee et al., 2011; Park et al., 2007).
Hartig et al. (2014) noted that “substantial evidence speaks to the potential benefits of contact with nature for avoiding health problems traceable to chronic stress and attentional fatigue”, but also pointed out that most previously conducted studies demonstrated only short‐term restorative benefits of an episode of experiencing nature. For example, a study in the United Kingdom used wearable electroencephalography (EEG) devices to demonstrate the effects of a short walk in a green space on brain activity that might be associated with enhanced relaxation and restoration (Aspinall et al., 2015). It was also shown that walking in natural environments produces stronger short‐term cognitive benefits than walking in the residential urban environment (Gidlow et al., 2016a). Using the diurnal cortisol pattern as a biomarker of chronic stress is an innovative approach that was applied in
5
the United Kingdom to demonstrate that exposure to green space reduces chronic stress in adults living in deprived urban neighbourhoods (Roe et al., 2013, Ward Thompson et al., 2012; Beil & Hanes 2013). Similar relationships between green space and stress reduction have been shown using hair cortisol as a biomarker of chronic stress (Honold et al., 2016; Gidlow et al., 2016b). Cortisol measures have also demonstrated the stress reducing effects of gardening (van den Berg & Custer, 2011) suggesting that such activities in green space may be particularly restorative. It has also been demonstrated that exposure to green spaces reduces neural activity in the subgenual prefrontal cortex and alleviates depression symptoms (Bratman et al., 2015).
2.2.3Improvedsocialcapital
There is a well‐known protective effect of social relationships on health and well‐being, while social isolation is a known predictor of morbidity and mortality (Nieminen et al., 2010; Pantell et al., 2013; Yang et al, 2016). Green space can play an important role in fostering social interactions and promoting a sense of community (Kim and Kaplan, 2004). In a recent study in the Netherlands, de Vries et al. (2013) found an association between the quantity and, even more strongly, the quality of streetscape greenery and perceived social cohesion at the neighbourhood scale. In that study, social cohesion was defined as a sense of community, with a focus on trust, shared norms and values, positive and friendly relationships, and feelings of being accepted and belonging. The researchers developed an indicator of social cohesion based on questionnaire data. Conversely, a shortage of green space in the environment has been linked to feelings of loneliness and lack of social support (Maas et al., 2009a, Ward Thompson et al., 2016). Various types of urban green space have been shown to facilitate social networking and promote social inclusion in children and adolescents (Seeland et al., 2009).
Neuroscience has provided evidence that place constitutes a distinct dimension in neuronal processing and so ´sense of place´ and ´place identity´, in which the social and natural environment have particular roles, are important dimensions for human health (Lengen & Kistemann, 2012). Hartig et al. (2014) underlined that the relationships between social well‐being and green space are complex and, while observational research may reveal associations, the underlying mechanisms are not easy to explore. Social well‐being may not be beneficially affected by green and open space that is perceived as unsafe or where people engage in antisocial behaviour, although these problems can be addressed by proper management and maintenance. There is also some evidence that provision of new green spaces in disadvantaged neighbourhoods (e.g. greening of vacant lots) can reduce crime (Branas et al., 2011; Chong et al., 2013).
2.2.4Improvedfunctioningoftheimmunesystem
Japanese studies have demonstrated associations between visiting forests and beneficial immune responses, including expression of anti‐cancer proteins (Li et al., 2008). This suggests that immune systems may benefit from relaxation provided by the natural environment or through contact with certain physical or chemical factors in the green space. It has been shown that children with the highest exposure to specific allergens and bacteria during their first year were least likely to have recurrent wheeze and allergic sensitization (Lynch et al., 2014). Another suggested immunological pathway is through exposure to diverse microorganisms in the natural environments (Rook, 2013), which can play an immunoregulatory role. Kuo (2015) suggested a central role for enhanced immune functioning in the pathway between nature and health.
2.2.5Enhancedphysicalactivity,improvedfitnessandreducedobesity
Physical inactivity is identified as the fourth leading risk factor for global mortality (WHO, 2010a). Physical inactivity is becoming increasingly common in many countries with major implications for the prevalence of noncommunicable diseases and the general health of the population worldwide (WHO, 2012). Several environmental factors are recognized as contributing to physical inactivity in

6
cities, such as high traffic volumes and lack of parks and footpaths. Hartig et al. (2014) found some evidence for an association between green space and levels of physical activity, suggesting that the relationship may vary considerably between population subgroups; they underline how walking for recreation may be supported by green environments in a different way than walking as a means of transport.
Several studies in various countries have demonstrated that recreational walking, increased physical activity and reduced sedentary time were associated with access to, and use of, green spaces in working age adults, children and senior citizens (Wendel‐Vos et al., 2004; Epstein et al., 2006; Kaczynski & Henderson, 2007; Kaczynski et al., 2008; Sugiyama & Ward Thompson, 2008; Sugiyama et al., 2009; Cochrane et al., 2009; Astell‐Burt et al., 2013; Schipperijn et al., 2013; Lachowycz and Jones, 2014; Sugiyama et al., 2014; Gardsjord et al., 2014; James et al., 2015).
Almanza et al. (2012) used satellite images coupled with Global Positioning System (GPS) and accelerometer data from children in the United States to demonstrate that exposure to green space measured by Normalized Difference Vegetation Index (NDVI), which reflects the light‐absorbing capacity of vegetation derived from satellite data, was positively associated with moderate to vigorous physical activity (MVPA).
Björk et al. (2008) and De Jong et al. (2012) found a positive association between high quality green spaces in the neighbourhood and higher levels of physical activity, as well as improved self‐assessed health. High quality green space was defined as having a comparatively high number of recreational attributes, out of a total of five assessed by experts, including qualities associated with historical and cultural associations, spaciousness, richness of natural species, peaceful qualities and wildness. In a United Kingdom study of children aged 10‐11 years, Lachowycz et al. (2012) showed that time spent in green space contributed over a third of all outdoor MVPA occurring during weekday evenings, over 40% on Saturdays and almost 60% on Sundays. Furthermore, links between green space use and MVPA were consistent in all seasons. In a Spanish study, Dadvand et al. (2014a) found that living in greener residential areas and proximity to forests was associated with less sedentary time and reduced risks of children being overweight or obese.
One way in which green space may be linked to health is through the enhanced benefits of physical activity in green or natural places, as opposed to other contexts. ‘Green exercise’, defined as physical activity undertaken in green or natural environments (Barton & Pretty, 2010), has been suggested as being more beneficial than other types of exercise (Marselle et al., 2013). For example, running in a park is associated with a more restorative experience when compared to the same exercise in an urban environment (Bodin and Hartig, 2003). Barton & Pretty’s (2010) analysis of ten United Kingdom studies showed multiple mental health benefits from physical activity in green environments. Mitchell’s (2013) study of the Scottish population showed an association between physical activity in natural environments and reduced risk of poor mental health, while activity in other types of environment was not linked to the same health benefit.
Interest in associations between green space and physical activity has also focused on behaviour change, with certain green spaces potentially encouraging greater levels of physical activity. In an Australian context, Sugiyama et al. (2013) found that the presence of and proximity to neighbourhood green spaces helps to maintain recreational walking over time.
Physical activity has been shown to improve cardiovascular health, mental health, neurocognitive development, and general well‐being and to prevent obesity, cancer, and osteoporosis (Owen et al., 2010). Providing attractive urban green space may encourage people to spend more time outdoors and facilitate physical activity (Bedimo‐Rung et al., 2005). In particular, many older people find it very difficult to maintain moderate levels of physical activity; therefore, providing green spaces that encourage older people to be active, even if it is only at a light level, is important for public health. The quality of the urban green space and its proper maintenance may be important factors in green space usage by older adults (Aspinall et al., 2010). Sugiyama & Ward Thompson (2008) demonstrated

7
an association between the quality of neighbourhood open space and increased walking in older people in the United Kingdom. For people with mental illness living in urban areas, physical activity in green space may be particularly beneficial (Roe and Aspinall, 2011). Other populations or subgroups may benefit, in a similar way, from green space that makes outdoor activity enjoyable and easy, hence encouraging less sedentary lifestyles.
A systematic review of 60 studies from the United States, Canada, Australia, New Zealand and Europe on the relationships between green spaces and obesity indicators found that the majority (68%) of papers showed that green space is associated with reduced obesity; the relationships could be modified by age and socioeconomic status (Lachowycz & Jones, 2011).
There is some evidence that using green space for growing food may influence physical activity, social well‐being and encourage a healthy diet, thereby reducing obesity. A pilot intervention study using community gardening and education in nutrition in the United States found that obese and overweight children had improved their Body Mass Index status by the end of the seven‐week‐long programme (Castro et al., 2013).
2.2.6Anthropogenicnoisebufferingandproductionofnaturalsounds
Noise pollution is a major and increasing threat to human health, due to continuing urbanization, rising traffic volumes, industrial activities, and a decreasing availability of quiet places in cities. The range of disease burden from noise pollution is estimated at 1.0 – 1.6 million Disability Adjusted Life Years in the European Region (WHO, 2011). Evidence suggests that a well‐designed urban green space can buffer the noise, or the negative perception of noise, emanating from non‐natural sources, such as traffic, and provide relief from city noise (González‐Oreja et al., 2010; Irvine et al., 2009).
Vegetation has been considered as a means to reduce outdoor noise pollution, mainly in areas with high volumes of traffic. A study in Uttar Pradesh, India (Pathak et al., 2008) showed significant reductions in traffic noise pollution from vegetation belts of 1.5 – 3 m width and a similar height range, with greater noise reduction as noise frequency increased (peak attenuation occurred between 2.5–5 KHz). This reinforces findings from a number of earlier studies in Europe and North America, indicating that a combination of land form and vegetation were most effective in attenuating traffic noise. For example, Huddart (1990) in the United Kingdom showed the effectiveness of 10 m wide tree belts. However, Yang et al. (2011) undertook experiments using EEG and showed that over half their participants overrated the ability of roadside vegetation to attenuate noise. The researchers suggest that, because almost all participants believed that a vegetation barrier could reduce noise, the plants affect people’s emotional processing and that there is therefore a psychological mechanism at work in perceived noise reduction, and especially in the level of noise attenuation that vegetation effects. In a Swedish study, Gidlöf‐Gunnarsson & Öhrström (2010) also showed that vegetated courtyards moderate the negative effects of traffic noise.
A different but not unrelated effect of green and blue space in relation to noise perception is the effect of other natural noises in masking noise pollution such as from traffic. In a Belgian study, Coensel et al. (2011) explored perceived loudness, pleasantness, and eventfulness of stimuli that combined road traffic noise with fountain or bird sound at different sound levels. Adding a fountain sound reduced the perceived loudness of road traffic noise only if the latter had low temporal variability. Conversely, adding bird sound significantly enhanced soundscape pleasantness and eventfulness, more so than for the fountain sound. The authors conclude that soundscape quality is influenced heavily by the meaning associated with the different sounds that are heard. Galbrun & Ali (2013) subsequently explored the perception of water sounds to mitigate road traffic noise and found that, to be effective, water sounds should be similar to, or not less than 3 dB below, the road traffic noise level (confirming previous research), and that stream sounds tend to be preferred to fountain sounds, which are in turn preferred to waterfall sounds.

8
2.2.7 Reduced exposure to air pollution
Evidence of mitigating effects of urban green space on exposure to anthropogenic air pollutants in cities has been reviewed by various scholars. Vegetation (trees, shrubs, herbs and grass) can dampen the impacts of road traffic and industries and improve air quality in urban residential areas providing benefits for public health. Urban residents in different countries (Portugal and France) have recognized the role of green space in improving perception of air quality (Madureira et al., 2015). Trees and other vegetation can decrease levels of air pollutants and reduce atmospheric carbon dioxide through carbon storage and sequestration (Liu and Li, 2012, Nowak et al., 2006, Vailshery et al., 2013, Baró et al., 2014, Nowak et al., 2013, Calfapietra et al., 2016, Manes et al., 2012). Therefore, green spaces provide indirect health benefits in addition to those associated with direct contacts with greenery (Dadvand et al., 2012a). (Potential detrimental effects of green spaces due to trapping air pollutants are discussed in Section 2.4 below.)
2.2.8 Reduction of the urban heat island effect
Heat related morbidity in cities is a major public health concern (WHO and WMO, 2015). The Urban Heat Island effect can be a serious health hazard during heat waves and extreme heat events. It arises due to replacement of vegetation with impervious heat-absorbing surfaces in urban areas. Exposure to excessive heat is linked to increased morbidity and mortality, especially in vulnerable subpopulations, such as the elderly (Smargiassi et al., 2009; Basagaña et al., 2011). A systematic review and meta-analysis of literature on how urban parks affect the air temperature in urban areas showed an average cooling effect of approximately 1o C (Bowler et al., 2010a). The study also suggested that parks may mitigate urban heat in wider surrounding urban areas, with data suggesting an effect up to 1 km from the park boundary. The inclusion of water bodies within the green space may offer greater cooling effects (Völker et al., 2013). Another review indicated that urban greenery, including parks, street trees and green roofs, mitigate Urban Heat Island effects (Shisegar 2014). In the United States, Harlan et al. (2006) showed that densely populated areas, sparse vegetation, and low levels of open space in the neighbourhood were significantly linked to higher temperatures and urban heat islands in Phoenix, Arizona. During warmer weather, trees can provide shade and reduce the demand for air conditioning and, especially, in warmer countries, they can provide comfortable outdoor settings and allow people to avoid heat stress (Lafortezza et al., 2009). Jenerette et al. (2011) emphasized the role that vegetation and green space play in reducing surface temperature in Phoenix and how more equitable access to urban green areas and vegetation would reduce income-associated inequality in exposure to extreme heat and protect vulnerable groups, such as elderly individuals. In cooler climates, trees can also provide shelter from wind and thereby reduce heating demand in the cold season.
2.2.9 Enhanced pro-environmental behaviour
Pro-environmental behaviour can be defined as “behaviour that consciously seeks to minimize the negative impact of one’s actions on the natural and built world” (Kollmuss & Agyeman, 2002). In the face of climate change, which is projected to have serious detrimental effects on health, an upstream approach to minimizing and mitigating its effects is to promote pro-environmental behaviour (Annerstedt van den Bosch & Depledge, 2015). The authors suggested that, as with many social behaviours, pro-environmental behaviour can be induced by external stimuli, particularly by experiencing natural environments. Recent research has supported this, showing that exposure to nature may increase cooperation and, when considering environmental problems as social dilemmas, sustainable intentions and behaviour (Zelenski et al., 2015). There is also evidence that childhood experiences in nature appear to enhance adult environmentalism (Wells and Lekies, 2006). If pro-environmental actions are widely adopted, people can contribute to substantially reducing carbon emissions (Dietz et al., 2009) thereby potentially preventing detrimental effects of climate change on health.
9
2.2.10Optimizedexposuretosunlightandimprovedsleep
If access to green space supports greater time spent outdoors among the population, it is likely to be accompanied by increased exposure to sunlight, which can have positive effects as well as negative effects (the latter are discussed in section 2.4). Humans get most of their vitamin D from exposure to sunlight, and optimum levels of vitamin D are important for overall health and well‐being, especially bone density, so access to green space may contribute to better levels of vitamin D and associated health benefits (Gillie, 2005). This may be especially important for northern Europeans whose environment lacks high level sunlight for significant parts of the year, and for older people, since the ability to synthesise Vitamin D decreases with age. However, there is lack of studies looking at the role of green space and levels of vitamin D. De Rui et al. (2014) explored how different pastimes influenced the levels of Vitamin D in older people. The authors found that vitamin D levels were significantly higher in those who engaged in outdoor activities, rather than for those who did not. The levels were particularly high for those who cycled or partook in gardening.
Natural light also contains a spectrum of light wavelengths, some of which may be beneficial or detrimental. Access to sunlight brings the risk of exposure to dangerous levels of ultraviolet (UV) light, especially in southern hemisphere countries such as Australia, as reported in section 2.4. However, recent research also suggests that UV‐induced release of nitric oxide from skin may have unexpected health benefits, including lowering the incidence of hypertension and cardiovascular disease (CVD) that is particularly associated with lower latitudes and winter months (Liu et al., 2014).
Light exposure, particularly to blue light, is also recognized as way to stimulate alertness and cognition, and to promote healthy sleep. Exposure to blue light is implicated in metabolism and circadian rhythms, where naturally occurring patterns of daylight support healthy circadian rhythms but exposure to blue light at inappropriate times (e.g. at night) may suppress the secretion of hormones that influence such rhythms. However, there is some evidence that the beneficial effect of natural light on cognition may diminish with age (Daneault et al., 2014).
Adequate sleep is crucial for good health, while sleep deprivation has been linked to adverse health outcomes, such as metabolic syndrome, cardiovascular morbidity and mortality, and neurocognitive disorders, such as dementia (Schmid et al., 2015; Kohansieh & Makaryus, 2015; Miller, 2015). An Australian study showed that those living in a greener neighbourhood had lower risk of insufficient sleep (less than six hours) (Astell‐Burt et al., 2013). In the United States, Grigsby‐Toussaint et al. (2015) found that access to natural environments reduced the prevalence of self‐reported insufficient sleep in adults, especially men. Therefore, green space access may benefit health through increasing people’s exposure to natural patterns of daylight, hence helping to maintain circadian rhythms.
2.3Evidenceofhealthbenefitsofgreenspaces
2.3.1Improvedmentalhealthandcognitivefunction
Studies of green spaces and health have demonstrated stronger evidence for mental health benefits, and for stress reduction, compared with other potential pathways to health (reviewed by de Vries, 2010; Gascon et al., 2015). An Australian study has shown perceived neighbourhood greenness to be more strongly associated with mental health than with physical health (Sugiyama et al., 2008) while a study in Spain (Triguero‐Mas et al., 2015) found that greater exposure to green space was linked to improved physical and mental health across all socioeconomic strata and genders. The associations were stronger for surrounding greenness (measured by NDVI) than for distance to green space. Further analysis demonstrated that this association was not mediated by physical activity. Moving to greener areas has been associated with mental health improvements in the United Kingdom (Alcock et al., 2014). Individuals living in urban areas with more green space have been shown to have a reduced level of stress and improved well‐being compared to controls with poorer availability of green space (White et al., 2013a). A study in the United States found that higher levels of

10
neighbourhood greenery were linked to lower levels of depression, anxiety and stress (Beyer et al., 2014), while a German study found mental well‐being in city dwellers to be particularly associated with blue space (Völker & Kistemann, 2015). In a longitudinal study, researchers in Sweden found a significant association between gained access to ‘serene’ green space and improved mental health in women (van den Bosch et al., 2015). A cross‐sectional study in England linked the quality of, and access to, green space with reduced psychological distress (Pope et al., 2015). Another recent cross‐sectional study in Lithuania demonstrated that, among individuals who regularly use parks, closer proximity of their home to the nearest park was associated with reduced odds of self‐reported symptoms of depression (Reklaitiene et al., 2014). In a study in four European cities, van den Berg et al. (2016) demonstrated that more time spent in green space is associated with improved mental health and vitality independent of cultural and climatic contexts. General therapeutic benefits of nature engagement among people with autism have also been demonstrated (Faber Taylor & Kuo, 2006).
There is accumulating evidence for the beneficial effects of green space on mental health and cognitive development in children, although some studies produced inconsistent results. In a Lithuanian study, Balseviciene et al. (2014) found that living closer to city parks was associated with improved mental health in children whose mothers had a lower education level; however, more residential greenness was associated with worse mental health in children whose mothers had a higher education level.
Greater usage of green and blue spaces, and greater residential surrounding greenness, have been linked with improved behavioural development (reduced difficulties, emotional symptoms and peer relationship problems) and reduced rate of Attention Deficit Hyperactivity Disorder (ADHD) in children (Amoly et al., 2014). Annual time spent at the beach was negatively associated with behavioural difficulties, in particular peer relationship problems, but positively associated with strength in prosocial behaviour. Dadvand et al. (2015) demonstrated that greater surrounding greenness at home and school was associated with improved cognitive development (better progress in working memory and reduced inattentiveness) in schoolchildren. The association was partly mediated by reduced exposure to air pollution. A number of other studies have demonstrated the positive impact of green space exposure on ADHD and related symptoms (Faber Taylor & Kuo, 2011; van den Berg and van den Berg, 2011; Markevych et al., 2014).
2.3.2Reducedcardiovascularmorbidity
A study in the United Kingdom (Mitchell and Popham, 2008) found an association between low quantities of neighbourhood green space and elevated risk of circulatory disease. A study in Lithuania found that distance to green spaces has little or no influence on levels of known cardiovascular risk factors or the prevalence of coronary heart disease and stroke. However, there were significant associations between a more intense use of green space and reduced risk of cardiovascular disease (Tamosiunas et al., 2014). In a Lithuanian intervention study, Grazuleviciene et al. (2015b) found that walking in the park had a greater effect on reducing heart rate and diastolic blood pressure than walking in a busy urban street. They suggest that walking in a green space (such as a park) could be encouraged as rehabilitation from coronary artery disease.
Pereira et al. (2012) also found an inverse association between the levels and variability of neighbourhood greenness, which was assessed using NDVI data, and coronary heart disease or stroke in Australia. The odds of hospitalization and self–reported heart disease were lower for those living in neighbourhoods with highly variable greenness, compared to those with low variability in greenness. This effect was independent of the absolute levels of neighbourhood greenness. There was weaker evidence for associations with the mean level of neighbourhood greenness. The authors hypothesized that greater variability in neighbourhood greenness reflects two potential promoters of physical activity – an aesthetically pleasing natural environment and access to urban destinations.

11
2.3.3Reducedprevalenceoftype2diabetes
It is well‐known that type 2 diabetes mellitus can be prevented by life‐style interventions that improve physical activity and reduce obesity. Therefore, it is plausible that access to green spaces can prevent diabetes by promoting more active lifestyles. Cross‐sectional observational studies in The Netherlands, Australia and the United Kingdom demonstrated significant associations between neighbourhood greenness and reduced odds of having type 2 diabetes mellitus (Astell‐Burt et al., 2014a; Maas et al., 2009b; Bodicoat et al., 2014). A study in Germany demonstrated an inverse association between neighbourhood greenness (measured by NDVI) and insulin resistance in adolescents (Thiering et al., 2016). The authors concluded that this apparent protective effect was due to vegetation reducing exposure to traffic‐related air pollutants.
2.3.4Improvedpregnancyoutcomes
A systematic review and meta‐analysis (Dzhambov et al., 2014) showed that access to green space in close proximity to the homes of pregnant women was positively associated with birth weight. Birth weight is a useful indicator of health in early life: low birth weight is one of the major predictors of neonatal and infant mortality, as well as long‐term adverse effects in childhood and beyond. Recent studies in Israel, Germany and England (Agay‐Shay et al., 2014; Markevych et al., 2014; Dadvand et al., 2014b) also found a positive association between residential greenness measured by NDVI and birth weight. A study in Lithuania demonstrated that a larger distance to a city park from the homes of pregnant women was associated with increased risk of preterm birth and reduced gestational age at birth (Grazuleviciene et al., 2015a). However, a study in southern California in the United States showed only a weak relationship between green space and preterm births (Laurent et al., 2013). No association was found between greenness and preeclampsia (Agay‐Shay et al., 2014; Laurent et al., 2013).
2.3.5Reducedmortality
Evidence that exposure to urban green space is linked to reduced mortality rates is accumulating (reviewed by Gascon et al., 2016). Studies in Japan have shown that the five‐year survival rate in individuals aged over 70 was positively associated with having access to more space for walking and with parks and tree‐lined streets near the residence (Takano et al., 2002). Another study of pre‐retirement age population in England showed evidence of the influence of the amount of green space in the neighbourhood on all‐cause mortality (Mitchell and Popham, 2008). The study reinforced earlier findings based on the 2001 census population of England, which found that a higher proportion of green space in an area was associated with better self‐reported health (Mitchell & Popham, 2007).
A recent longitudinal study of approximately 575,000 adults in Canada found that increased residential green space was associated with a reduction in mortality (Villeneuve et al., 2012); the strongest effect was on mortality from respiratory diseases. It should be noted that such findings may also reflect the type of urban development and availability of public transport or walkable streets. In Spain, Xu et al. (2013) showed that perceived greenness of neighbourhoods was associated with lower mortality risk during heat waves.
A recent systematic review demonstrated that the majority of previously conducted studies showed a reduction of the risk of cardiovascular disease (CVD) mortality in areas with higher residential greenness; results of meta‐analysis supported the hypothesis that living in areas with higher amounts of green space reduces CVD mortality, while evidence of a reduction of all‐cause mortality is more limited (Gascon et al., 2016). In the United States, residential proximity to green space has been associated with a reduced risk of stroke mortality (Hu et al., 2008) and with higher survival rates after ischemic stroke (Wilker et al., 2014). In contrast to the above findings, Richardson et al. (2012) did not find an association between availability of green spaces and overall mortality in the 49 largest US

12
cities. The authors suggested this might be due to the sprawling nature of US cities and higher levels of car dependency than in most European cities.
2.4MechanismsofpotentialpathogeniceffectsofgreenspacesThe evidence on adverse effects of urban green space or neighbourhood greenery on health is scarcer in comparison to the evidence of beneficial effects. An overview of some of these detrimental effects and their mechanisms is provided below (Lõhmus & Balbus, 2015).
2.4.1Increasedexposuretoairpollutants
The interaction between trees, airflow and pollution is complex. While trees and vegetation may be effective in buffering airborne pollutants, in some cases, trees may trap and contain air pollution near busy roads when a closed canopy impedes the localized dispersion of vehicular emissions (Jin et al., 2014). However, it is possible to optimise urban greenery in order to avoid air pollution trapping by urban street trees (Jin et al., 2014).
Attractive nearby parks and open spaces may be associated with increased levels of physical exercise such as walking, as studies in England (Foster et al., 2004) and Australia (Giles‐Corti & Donovan, 2003) have shown. However, where green space is adjacent to sources of pollution such as heavily trafficked roads, physical activity can be associated with elevated exposure to particulate matter, ozone, nitrogen dioxide, sulphur dioxide and other pollutants, especially under certain weather conditions (Carlisle & Sharp, 2001). Nonetheless, depending on urban air pollution levels, the benefits of physical exercise may still outweigh detrimental effects of exposure to pollutants. A study in more than 50,000 people aged 50‐65 years, living in Denmark, showed that exposure to high levels of traffic‐related air pollution did not modify associations between activity levels and mortality, demonstrating beneficial effects of physical activity on mortality even in the presence of air pollution (Andersen et al., 2015).
2.4.2Riskofallergiesandasthma
Evidence of associations between urban greenery, allergies and asthma is rather inconclusive. Lovasi et al. (2008) found that children living in areas with more street trees in New York City had lower asthma prevalence. A later cohort study involving minority children in New York City failed to show a hypothesized protective effect and, in fact, demonstrated a positive association between tree cover and allergic sensitization to tree pollen and asthma in children (Lovasi et al., 2013). Another study conducted in the United States reported that pollen associated with urban parks and trees was listed among the self‐reported triggers of asthma in Philadelphia (Keddem et al., 2015). A study in Sabadell, Spain has not found an association between residential greenness and asthma; however, the same study showed that closer proximity to parks was linked with elevated prevalence of asthma (Dadvand et al., 2014a). Fuertes et al. (2014) used two birth cohorts (followed from birth to 10 years) in northern and southern Germany, and found that the relationship between greenness and allergies differed across their two study areas. In the urban south area, greenness was positively associated with allergic rhinitis and eyes and nose symptoms while in the rural north area, greenness appeared to have a protective effect.
2.4.3Exposuretopesticidesandherbicides
Living close to green spaces may be associated with elevated exposure to pesticides and herbicides especially if they are used in inappropriate ways and at excessive levels. The insecticides malathion and diazinon and the herbicide glyphosate, which is used to control weeds in urban parks, may be carcinogenic in humans (Guyton et al., 2015). The International Agency for Research on Cancer classified these compounds as probably carcinogenic to humans (IARC, 2015).

13
2.4.4Exposuretodiseasevectorsandzoonoticinfections
Health risks from green space include vector‐borne diseases, which are transmitted by arthropods, such as ticks (e.g. tick‐borne encephalitis, Lyme disease), mosquitoes (e.g. Chikungunya fever, Dengue fever), or sandflies (e.g. visceral leishmaniasis). Lyme disease in particular has increased in Europe in the 21st century, and this has been associated with urban green space and increased animal hosts populations, such as deer, as well as with climate change and milder winters in northern Europe (Medlock and Leach, 2015).
Another health concern that often gains public attention is the contamination of urban green space with dog or cat faeces. Ingestion of dog faeces by young children can lead to toxocariasis (infections with Toxocara canis), with serious illness and blindness possible in rare circumstances. While well‐managed parks and green space encourage dog walkers to remove dog faeces, limiting dog access to children’s play areas is also important in order to control this disease (Despommier, 2003). Users of poorly maintained green spaces and playgrounds may also be exposed to Toxoplasma gondii in soil contaminated with cat faeces (Du et al., 2012; Afonso et al., 2008). This protozoan parasite of felines can also infect humans (as dead‐end intermediate hosts) and cause severe neurological damage in children born to mothers who were infected for the first time during pregnancy.
2.4.5Accidentalinjuries
Although physical activity in green spaces can have many positive benefits, as have been described earlier, it can also be associated with an increased risk of accidents and injuries, such as falls and drowning (Laosee et al., 2012). A study in the United Kingdom (Kendrick et al., 2005) showed that Accident and Emergency hospital admission rates were higher in wards with a greater number of parks and play areas per child under five years of age. Ball (2004) conducted a retrospective analysis of injury and fatality statistics associated with playgrounds in the United Kingdom. Most playground equipment related injuries occur in public urban green space, but the risk of serious injury in United Kingdom playgrounds is small, perhaps helped by the introduction of artificial, impact‐absorbing surfaces.
2.4.6ExcessiveexposuretoUVradiation
While optimal levels of exposure to sun light are linked to health benefits (see section 2.2.10), greater time spent outdoors in green and open spaces may result in excessive exposure to sunlight and elevated risk of skin cancer. Astell‐Burt et al. (2014b) showed that, in Australia, the odds of having skin cancer were higher for those living in a greener environment. The balance of risks or benefits for different levels of sunlight exposure is difficult to assess for various subpopulations. It should be noted that optimally designed green spaces and tree canopies can also provide protection against excessive exposure to UV radiation (Boldemann et al., 2006; Boldemann et al., 2011). In addition, the negative effects can largely be avoided or mitigated by simple means such as appropriate clothing, hats and sun block creams.
2.4.7Vulnerabilitytocrime
Crime against the person and anti‐social behaviour are perceived risks from green spaces, as reported in some studies. However, this does not necessarily reflect recorded crime incidence (Bogar & Beyer, 2015). In a systematic review of fear of crime in urban green spaces, Sreetheran and van den Bosch (2014) found that the majority of the studies highlighted individual factors (such as gender and past experience) as more influential than social and physical factors in evoking fear of crime. They state that certain groups of people, particularly older people, women and ethnic minorities, tend to be more fearful because of their vulnerability or past experiences of crime.
There are varying relationships between green space and recorded crime found in reports from the United States. Groff and McCord’s (2012) study in Philadelphia showed that neighbourhood parks were associated with increased levels of crime. However, certain characteristics of parks (such as the

14
presence of playing fields and courts) were associated with lower crime levels. In contrast, Troy et al. (2012), in a study of Baltimore, found a strong inverse relationship between urban tree canopy and violent crime.
2.5 Characteristics of urban green space associated with specific healthbenefitsorhazardsDespite the growing research in this area, there is comparatively little evidence demonstrating differential health benefits associated with specific characteristics of green space. Varying configurations of green space, built environment and topographical features near a person’s residence may offer different opportunities for physical activities and mental restoration, depending on the person’s age, gender and individual preferences. An urban green space may have varying qualities that offer different opportunities for quiet relaxation, engagement with the natural environment, children’s play, physical exercise and athletic activities or getting away from unpleasant aspects of the urban environment, such as noise or heat. More research is needed to identify attributes of green space that are associated with specific health benefits (Wheeler et al., 2015).
2.5.1Perceptionsofgreenspaceaccessibilityandquality
Research on the quality of green space associated with health benefits has often focussed on the physical activity mechanism (Giles‐Corti et al., 2005; Hillsdon et al., 2006). A qualitative analysis (McCormack et al., 2010) revealed that attributes of green spaces, such as safety, aesthetics, amenities, maintenance and proximity to home, are important for supporting physical activity outdoors. Aspects such as concerns over safety, violence, graffiti, vandalism, litter, noise, pollution, and dog fouling had negative associations with park use and physical activity.
An Australian study suggested that higher levels of walking were associated with access to attractive, large public open spaces (Giles‐Corti et al., 2005). A Dutch study (Van Dillen et al., 2012) assessed the quantity and quality of green space and their links to self‐rated health. The quality, measured using characteristics such as accessibility, maintenance, absence of litter and safety, was positively associated with general health. The authors suggested that the quality of green space predicted health outcomes independently of the quantity of the greenspace. Sugiyama et al. (2013), in an Australian study, found no associations between initiation of walking and green space quality (defined as “pleasant natural features”) and proximity. However, proximity of green spaces, and access to a comparatively large sized green space within 1.6 km of a person’s home, were associated with maintenance of walking. The attractiveness of green space has also been associated with increased recreational walking (Sugiyama et al., 2010).
Also working in Australia, Wang et al. (2015) found that positive attitudes to the experience of visiting green space and perceptions of its accessibility appear to matter more than independently measured geographic attributes in predicting green space use.
In Sabadell, Spain, Dadvand et al. (2014a) found greener residential areas, as measured by NDVI, and proximity to forests were associated with lower prevalence of being overweight or obese in children. As noted in section 2.3.2, Pereira et al. (2012), working in Australia, found that a greater variability in greenness has a protective effect on coronary heart disease or stroke in adults. People living in neighbourhoods with greater variability in greenness are likely to have access to aesthetically pleasing natural environment and also to urban destinations – both factors stimulating walking.
The qualities of green space in terms of allowing relaxation and recreation have been described as important factors in improving mental well‐being (Pope et al., 2015). It was shown that the quality of public open spaces (including parks and gardens) in the neighbourhood is more relevant to mental health, than their quantity (Francis et al., 2012). Grahn & Stigsdotter (2010) identified eight perceived sensory dimensions of urban parks or urban open spaces: Serene, Space, Nature, Rich in Species, Refuge, Culture, Prospect and Social. Among these, the dimensions Refuge and Nature were

15
strongly negatively correlated with stress. Refuge was defined as a place surrounded by bushes and higher vegetation where people feel safe, play and can observe other people being active; Nature was defined by the feeling of “being in nature”. Two longitudinal studies (Annerstedt et al., 2012; Van den Bosch et al., 2015) have shown that access to the Serene dimension was associated with a significantly decreased risk of mental illness in women. Serene has been previously defined by Grahn & Stigsdotter (2010) as “a holy and safe place, which is a calm environment, undisturbed and silent” (p. 271).
2.5.2Sizeofgreenspace
The size of green space is likely to influence the levels and types of activity people undertake within it. Sugiyama et al. (2010) suggested that the attractiveness of a space and the options for activity that the space provides may be more relevant for physical activity than the number of open spaces available. This Australian study considered parks with a size range of approximately 1‐10 ha. The authors proposed that, when planning and designing green space to encourage physical activity, it might be better to consider provision of one large park in the neighbourhood rather than many smaller parks. A study of young people in the United States (Epstein et al., 2006) supported this view and showed substantial increases in estimated time in moderate to vigorous physical activity for youth who lived near large parks.
There is a need for more evidence on the effects of configuration and connectivity of green space on health outcomes. What green space offers in terms of facilities, programmes of events, formal game pitches, health trails, cycling, walking and jogging routes, opportunities to be used en route to daily destinations such as school, work or shops, etc. will be affected not only by design and management of green space but also by its size, shape, topography and/or configuration in relation to broader infrastructure and the distribution of different land uses in the urban area (Robertson et al., 2012).
2.5.3Presenceofspecificfacilitiesforcertainactivities
What the environment offers can enable or deter outdoor activities. A study in Ontario, Canada, (Kaczynski et al., 2008) found that park facilities such as a paved trail, water area, and playground were more important for physical activity than park amenities such as a drinking fountain, picnic area, and restroom; paved trails in particular were strongly associated with physical activity.
Schipperijn et al. (2013) reported that levels of physical activity in the nearest urban green space were positively related to features such as walking/cycling routes, wooded areas, water features, lights, pleasant views, a bike rack, and a parking lot. A study in the US (Oreskovic et al., 2015) demonstrated that playground use was associated with higher levels of physical activity among adolescents aged 11‐14 years.
In a study involving older women, Chastin et al. (2014) found that the lack of resting places outside the home strongly limited participants’ motivation or confidence to be active. Most said they would walk more if they could find resting places at staggered intervals in public spaces, enabling them to rest when needed and giving them increased confidence to venture further outside. This confirms other research that has identified the value of trees and greenery as attractors for older people to use the outdoor environment, but also the importance of seating and facilities such as toilets to enable older people’s access to and enjoyment of public green space (Aspinall et al., 2010).
2.5.4Treecoverandcanopydensity
It has been claimed that urban greenery can contribute to a substantial reduction in the urban heat island effect (Tan et al., 2015). However, in a study of all‐cause mortality during heat waves in Barcelona, Spain, greater percentage of tree cover was not associated with reduced mortality risk (Xu et al., 2013), although residents’ perception of little surrounding greenness was significantly associated with mortality.

16
In a laboratory environment in the United States, Jiang et al. (2014b) assessed the role of tree canopy density in self‐reported stress recovery by showing study participants 3‐D videos containing different levels of tree canopy in an urban environment. The authors found a positive linear association, indicating that higher levels of tree density were associated with greater self‐reported stress reduction. By measuring the participants’ physiological stress reaction by salivary cortisol and skin conductance, Jiang et al. (2014a) found that men had a greater stress reduction from moderate tree density cover, rather than high or low levels; the same was not found for women.
The presence of nearby trees and grass visible from apartment buildings has been shown to lower levels of aggression and mental fatigue in residents, in comparison to those living in buildings overlooking barren vistas (Kuo and Sullivan, 2001). Also, the absence of green elements near housing has been shown to impact negatively on the management of major life issues (Kuo, 2001). However, some qualities of green spaces associated with tree cover, especially when overgrown or unmanaged, may increase levels of anxiety due to fear of crime, resulting in a negative impact on people’s well‐being (Kuo et al., 1998). In Baltimore, tree canopy has also been identified as having a potential beneficial effect towards increased social capital (Holtan et al., 2015).
2.6DifferentialhealthbenefitsofgreenspacesinspecificpopulationgroupsWhile the studies described above have shown that urban green spaces provide health benefits for a variety of populations, many studies also showed differing health outcomes dependent on demographic factors, including gender, age, ethnicity and socioeconomic status (Charreire et al., 2012; Dadvand et al., 2012b; Lachowycz and Jones, 2011; Lachowycz and Jones, 2014; Maas et al., 2009b; Xu et al., 2013). The section below focuses on studies where particular subgroups have been shown to experience differential health benefits from green space.
2.6.1Women
As indicated in earlier sections, there is evidence that women and men experience and respond to urban green space in different ways. A systematic review (Sreetheran & van den Bosch, 2014) summarizing findings from many studies demonstrated that women, through perceiving themselves to be more vulnerable, were more fearful in urban green spaces than men. Conversely, Krenichyn’s (2006) study of women’s use of a large, green park in New York City found that they enjoyed exercise in the park compared to exercising in the street because of the beautiful scenery and its therapeutic or spiritual qualities. By contrast with the harassment (catcalls and male comments) experienced when exercising in the street, the park afforded a traffic‐free environment where women felt freer to dress comfortably and less susceptible to unwelcome remarks. Thus, appropriately managed green space may offer women opportunities to be more physically active than in other urban contexts.
Positive associations between green space and mental health have also been found for women differentially from men. For example, van den Bosch et al. (2015) found a significant relationship between access to ‘serene’ green space and improved mental health in women but not men. Using measures of diurnal salivary cortisol secretion as a biomarker of stress, Roe et al. (2013) found that effects of green space exposure on patterns and levels of cortisol were different in men and women. More green space in the residential area was associated with a steeper decline in salivary cortisol from three to nine hours post‐awakening (healthier diurnal cortisol pattern) in both genders. However, women with lower exposure to green space were found to have a higher rate of hypocortisolemia (low cortisol level at three hours post‐awakening), indicating long‐term dysregulation of the psychoneuroendochrine system. In men, post‐awakening cortisol levels were not associated with green space; instead, men living is less green areas had a shallower decline in cortisol level through the day, resulting in elevated cortisol levels at six and nine hours post‐awakening, also indicating psychoneuroendocrine dysregulation.
There is considerable evidence of beneficial effects of access to green space for the health of pregnant women. Specifically, studies in Europe showed positive associations between access to

17
nearby green space and both reduced blood pressure and reduced depression in pregnant women, with a stronger effect for reduced depression in disadvantaged groups (McEachan et al., 2016; Grazuleviciene et al., 2014).
Such findings suggest it is important to take gender into account when considering any associations between urban green space and health, since both physiological and psychological responses to green space may differ.
2.6.2Childrenandadolescents
It has been shown that exposure to green spaces during pregnancy has beneficial effects on in‐utero development. Studies in Israel, Germany and England (Agay‐Shay et al., 2014; Markevych et al., 2014; Dadvand et al., 2014b) and a systematic review and meta‐analysis (Dzhambov et al., 2014) demonstrated links between better access to green space during pregnancy and increased birth weight.
Adequate exposure to green space in children may not only facilitate healthy development in childhood but also provide long‐term health benefits through adulthood. It has been shown that socio‐environmental risk factors in prenatal life, infancy and childhood also have an effect over the entire life‐course (Gluckman and Pinal, 2001; Gluckman, 2012; Gluckman et al., 2007). In general terms, if access to green space can stimulate the development of gross and fine motor skills as well as cognitive, emotional, social and physical development in children (Strife & Downey, 2009), then these may lead to better health and better ability to maintain healthy lifestyles in adulthood.
There is some evidence that exposure to green space can influence cognitive development in children. Dadvand et al. (2015) showed a beneficial association between exposure to green space (surrounding greenness at home and school and during commuting) and measures of cognitive development in primary schoolchildren. This association was partly mediated by reduction in exposure to air pollution. Other studies have also demonstrated that green spaces are linked to improved development, reduced problematic behaviour and reduced risk of ADHD (Amoly et al., 2014; Faber Taylor & Kuo, 2011; van den Berg & van den Berg, 2011; Markevych et al., 2014).
According to research in Switzerland, public urban green spaces play an important role in children’s and young people’s social networks, including friendships across cultures, promoting social inclusion (Seeland et al., 2009).
More generally, understanding links between green space and children’s health includes consideration of risks and the importance of learning to manage risk as children develop into adults. Research in the United Kingdom has shown that there is a great attraction in risky and adventurous activity, especially for adolescent boys. Wild or natural environments that offer challenge within an accessible context can help satisfy this need for risky and adventurous behaviour among adolescents (Natural England, 2010b). Opportunities to develop skills in risk management and coping with uncertainty, important attributes for adulthood, are often unavailable to teenagers and young people unless they are introduced to wilder areas and risky situations (Natural England, 2010b). Green space of certain types can offer this even in an urban environment and may be the only accessible option for many.
2.6.3Olderadults
A positive relationship between the amount of green space and self‐reported health in senior adults was demonstrated in the Netherlands (de Vries et al., 2003). The beneficial effect of green space was stronger in senior citizens and in housewives than in the general population, perhaps due to these groups’ greater dependence on the local living environment.
Toussaint et al. (2015) explored the role of green spaces in sleep deficiency and found a stronger protective effect for people aged 65 and older, compared to younger adults.
18
Sedentary behaviour is an important health hazard in older adults, who are often the most sedentary segment of society. A recent systematic review found that, when measured objectively, 67% of adults aged 60 years and over spent more than 8.5 hours of their waking day sedentary (Harvey et al., 2013). Evidence of beneficial effects of green spaces on physical activity in individuals aged 60 years or older is summarized by Broekhuizen et al. (2013).
Older adults living in inner‐city neighbourhoods also benefit from the presence and use of green spaces, which appears to promote social ties and a sense of community (Kweon et al., 1998). Social contact is known to be important for health and well‐being, especially for older people, where social isolation has been significantly associated with increased mortality (Steptoe et al., 2013).
2.6.4Deprivedsubpopulationsandminoritygroups
There is accumulating evidence showing that urban green space may be ‘equigenic’ (Mitchell et al., 2015), i.e. that the health benefits linked with access to green space may be strongest among the lowest socioeconomic groups, including minority ethnic groups.
Mitchell & Popham’s (2008) study of the association between green space and mortality rates in England found that populations exposed to the greenest environments had the lowest level of health inequality related to income deprivation.
Lachowycz & Jones’s (2014) study in the United Kingdom confirmed an association between green space access and reduced cardiovascular mortality found previously (Mitchell and Popham, 2008; Villeneuve et al., 2012) but only amongst the most socioeconomically deprived groups. Pope et al. (2015) identified significant associations between reported access to, and better quality of, green space and reduced psychological distress in a deprived urban population in the US. In a large European epidemiological study, Mitchell et al. (2015) found that socioeconomic inequality in mental well‐being was 40% narrower among respondents reporting good access to green space, compared with those with poorer access.
One way in which good access to green space may contribute to reduced health inequalities in income‐deprived communities is through frequency of and/or time spent in outdoor activities. As stated earlier, evidence suggests that activities in green space may offer psychological, physical and social health benefits. Improvements in access to woodland green space near deprived urban communities in Scotland, United Kingdom, positively impacted on green space use and may have contributed to improvements in activity levels and perceived quality of life (Ward Thompson et al., 2013).
There is a common tendency for the most deprived urban communities to experience the poorest air quality, as has been shown for the United Kingdom (Grant et al., 2012) and Norway (Naess et al., 2007). This can contribute to excess mortality in deprived neighbourhoods. Thus, urban green space in deprived areas may reduce health disparities by mitigating air pollution.
In the United States, Harlan et al. (2006) showed that individuals of lower socioeconomic status and minority groups in Phoenix, Arizona, were more likely to live in neighbourhoods with greater exposure to heat stress. Jenerette et al. (2011) suggest that such lower income populations have less means to cope with extreme temperatures. While wealthier people may have access to cooling systems, the low income population relies more on what is publicly available. Therefore, the role of vegetation in cooling urban areas may be especially important for the urban poor.
Sreetheran and van den Bosch (2014), in a systematic review of English language literature, found that being an ethnic minority and living in low income neighbourhoods affects feelings of security in urban green spaces. It seems that those minority respondents who feared visiting parks or playgrounds had experienced previous direct or indirect victimization in their local urban green spaces. Dadvand et al. (2014b) found a positive association between levels of surrounding greenness during pregnancy and babies’ birth weight in a white British population but not for those of Pakistani
19
origin, suggesting a difference between ethnic groups that may reflect wider perceptions and use of green space.
Many minority ethnic groups living in European cities suffer socioeconomic deprivation and comparatively poor health. One study on black and minority ethnic (BME) groups in England (CABE 2010a) showed that many BME people live in the most deprived census wards in the United Kingdom and that such wards had, on average, only a fifth of the area of green space that is available to the most affluent wards. The study also showed that in areas most densely populated by BME groups (i.e. comprising 40% plus of population), the available green space is of poorer quality. A second study (CABE 2010b) found that the quality of, access to, and use of urban green space was a significant predictor of general health for African Caribbean, Bangladeshi, Pakistani and other BME groups, who were also those with the poorest health (Roe et al., 2016). Thus, provision and maintenance of appropriate green space in urban areas may make an important contribution to reducing health inequalities.
2.6.5Populationsofvariouscountriesandgeographicregions
Some findings, such as the stress reduction opportunities that urban green space affords, have been replicated in multiple studies conducted in different countries. However, most of the epidemiological studies cited above have been conducted in high income countries (mainly in western and northern Europe, as well as in North America, Australia and Japan). There is a need for more research on urban green space and health in the eastern parts of the WHO European Region. Such research is essential for assessing health benefits of urban green spaces in middle and low income countries and in cities with different urban design characteristics.
2.7Co‐benefitsofurbangreenspacesunrelatedtohealtheffectsThere are many co‐benefits that may arise from good planning, design and management of urban green spaces in addition to improved public health. While this review focuses on health benefits of urban green spaces, potential additional benefits are briefly summarized below.
The European Commission (European Union, 2015) calls for attention to ensuring sustainable urbanization through promoting nature‐based solutions including provision of accessible green spaces. The economic importance of, and return on, investment in urban green space is a budgetary issue for urban planners, social services, and other professionals. Co‐benefits of investment in green space may include enhanced economic competitiveness of cities, where quality of life is important for attracting and retaining a skilled workforce (KPMG, 2012a). An attractive and usable green environment near residential areas is likely to increase property values (Wachter & Bucchianeri, 2008) and create ‘liveable’ urban areas that attract new residents and investment, and facilitate economic sustainability (KPMG, 2012b). Equally urban green space has been shown to benefit economically deprived urban communities more than others, creating more equal socioeconomic conditions (CABE, 2004). A recent study concluded that investing in green infrastructure in cities, might not only be ecologically and socially desirable, but also quite often, economically advantageous (Elmqvist et al., 2015).
A green urban environment that supports health in general may also produce healthier workforces, enhancing people’s quality of life as well as their productivity and earning potential. Losses of productivity due to obesity and depression are major cost factors affecting businesses. Thus, improving access to green space can improve mental and physical health and produce major economic benefits through reduced absenteeism and improved productivity. Also, investment in green space may also create green jobs and offer the potential to enhance tourism (Cianga & Popescu, 2013).
A recent review showed that urban parks function as biodiversity hotspots (Busse‐Nielsen, 2013). Well‐designed urban green space can also benefit hydrological systems and enhance sustainable

20
urban drainage, help prevent and mitigate flooding and create and extend new habitats for plant and animal species (Gill et al., 2007). Green space may also offer opportunities for environmental education and engagement with nature at every age category, from young children to senior adults (Dadvand et al., 2015; Natural England, 2010b; Sugiyama et al., 2009).
Green spaces can also improve urban ecosystem health by reducing the effects of weather extremes and air pollution (LRTAP Working Group on Effects, 2013). Similarly, noise reduction by green space may benefit species other than human (Francis et al., 2009).
The use of urban green space for low‐carbon commuting, e.g. by walking or cycling to school or to work, can reduce greenhouse gas emissions and contribute to mitigating global climate change. Urban green space can make active travel attractive and thereby encourage and support new, environmentally friendly behaviours (Scottish Government, 2016).
In addition to general opportunities for social cohesion, urban green space may also offer the chance to develop individual and community capital. Public green places, for example, offer opportunities for bigger groups to gather than is possible in the home. Urban green spaces that can also be adapted for different temporary uses, such as festivals and cultural events. Finally, urban green space may play an important role in enhancing community resilience and helping communities cope with natural disasters and extreme weather events (Tidball & Krasny, 2014).

21
3. INDICATORS OF URBAN GREEN SPACE AVAILABILITY,ACCESSIBILITY AND USAGE, AND ASSESSMENT OF THEIR HEALTHRELEVANCE
3.1ClassificationofurbangreenspaceindicatorsA key aspect of understanding links between green space and health is understanding how people’s exposure to green space is conceptualised and measured. As with consideration of any health outcomes associated with an environmental exposure, how the exposure is measured is important in determining what relationships are apparent, and what causal pathways and mechanisms can be inferred (Nieuwenhuijsen, 2015). Studies of green space and health to date have used a variety of measures and indicators. This section of the report summarizes in brief key measures which have been reported in the literature, and used in some exemplar national governmental policies. It describes and discusses possible data sources for a health‐related green space indicator for the WHO European Region, and discusses challenges around the application of such an indicator.
A key defining feature of green space measures used in health research and policy is whether they consider the availability, accessibility or usage of green spaces. These types of measures are not always mutually exclusive; for example, some measures could be described as indicating availability or accessibility, and usage is always related to the quantity, quality and characteristics of green space. Definitions of indicators of availability and accessibility can also incorporate specific characteristics of green spaces (e.g. accessibility of green space of at least 1 ha size). Availability measures quantify neighbourhood green space without distinguishing between that which is publicly accessible and that which is not, and without any consideration of the proximity of specific areas of green space to individual residences or communities.
Measures of accessibility may consider any or all of:
a) the proximity of specific green spaces to residences or communities (using either linear distance or walking distance);
b) green spaces that are publicly accessible (with or without entry fee); and c) specific points of access to green spaces (e.g. gateways, paths, car parks).
Usage measures go beyond these considerations to reflect actual use of green space by individuals or communities. Measures of usage might be objective (e.g. observed park use, or location tracking of individuals) or self‐reported (e.g. based on visit surveys).
Examples of these different types of measures and how they are relevant to public health and well‐being are presented in Section 3.3 to 3.5.
3.2Green space characteristics that canbe incorporated indefinitionsofindicatorsGreen space characteristics refer to type, size and quality of green spaces and the use functions that they allow. It has been demonstrated that different health effects can be linked to different characteristics of green spaces, and that specific characteristics can be linked with health benefits in specific population groups (Wheeler et al., 2015, de Vries et al., 2003, Annerstedt et al., 2012; White et al., 2013b; White et al., 2014; Elliott et al., 2015). Key green space characteristics that have been considered in the literature include:
• size of green space (Giles‐Corti et al., 2005; Nordh et al., 2009); • land cover type e.g. grass or woodland (Wheeler et al., 2015; Alcock et al., 2015; Votsi et al.,
2013); • presence of water or coastline (blue space) (White et al., 2010; Völker and Kistemann, 2011);

22
• recreational types e.g. open sports area, children’s play areas, ‘natural’, formal gardens (Lachowycz et al., 2012; Mitchell, 2013); and
• environmental qualities e.g. biodiversity, ‘wildness’ (Annerstedt et al., 2012; Dallimer et al., 2012; Lovell et al., 2014).
There is also evidence on the role of ‘social qualities’ of public green space such as amenities (e.g. the presence of benches, car parks, public lavatories) and environmental incivilities (e.g. the presence of litter, graffiti, dog waste). Data on these characteristics are in general not readily available, but have to be collected through specially designed environmental audits using a range of tools (Gidlow et al., 2012; Rosenberg et al., 2009).
A study of green space ‘quantity and quality’ and health in the Netherlands used a green space audit tool to measure various facets of green space quality, such as litter, naturalness, maintenance and safety. This study found positive associations between both quantity measures of green space and the composite quality indicator, with general self‐reported health, a mental health inventory and selected acute health complaints (van Dillen et al., 2012).
Whilst it is increasingly recognized that qualities and characteristics of green space are important, the majority of the existing evidence on green space and health does not consider these aspects (Hartig et al., 2014; Bowler et al., 2010b; Jorgensen & Gobster, 2010). Given the lack of a substantive, consistent evidence base, the focus here is therefore on a more generic conceptualization of green space; the potential value of more nuanced consideration of natural environments in urban areas is discussed in Section 3.6..
As described above, this report is not based on an exhaustive, systematic review of the literature, but on expert knowledge and assessment of the evidence base. This section outlines the key measures or indicators of urban green space that have been used to assess association of green space exposure with health and well‐being. For each indicator we consider the potential mechanisms at play; examples of studies that have implemented the indicator; and the data requirements and applicability as a WHO indicator.
3.3Indicatorsofgreenspaceavailability
3.3.1Greenness,measuredbyNormalisedDifferenceVegetationIndex(NDVI)
DescriptionThe Normalised Difference Vegetation Index (NDVI) is a measure of how much live, green vegetation is present in an area – an indicator of an area’s ‘greenness’. It is derived through remote sensing, usually from satellite imagery, and is based on estimating the proportion of photosynthetically active wavelengths of light (i.e. that are absorbed by chlorophyll in plants) that is absorbed by the ground cover (Pettorelli et al., 2005; Myneni & Hall, 1995). The NDVI is a ratio of a difference and a sum of the spectral reflectance measurements acquired in the visible red and near‐infrared regions. These measurements are themselves ratios of the reflected radiation over the incoming radiation in each spectral band which can vary between 0 and 1. Thus, the NDVI can range from ‐1 to +1. Values of approximately zero indicate barren areas with very sparse or no vegetation; more positive values indicate more living vegetation; more negative values generally indicate the presence of free‐standing water, clouds or snow. As a measure of living green vegetation, NDVI is very sensitive to the time of year and weather conditions at the time of imagery, which must be taken into account when using satellite data to calculate NDVI.
ExamplesofapplicationinresearchandsurveillanceA number of studies have investigated relationships between measures of NDVI and health and well‐being outcomes. Typically the mean NDVI for an area is calculated based on high resolution imagery, and is used as an indicator of the average ‘greenness’. The area may be either a statistical or

23
administrative area, or the “buffer” zone of set distance from an individual’s residence location, or the centroid of a geographical area.
Studies have linked NDVI with a wide range of other health and well‐being outcomes including: increased walking (Sarkar et al., 2015); lower Body Mass Index in children (Bell et al., 2008); lower rates of depression, anxiety and stress symptomology (Beyer et al., 2014); and lower mortality due to causes such as respiratory diseases and cardiovascular disease (Villeneuve et al., 2012).
DatarequirementsandapplicabilityasaWHOindicatorSatellite imagery enabling calculation of NDVI at a relatively high resolution is readily available on a global basis from various sources. A key source that has been used in previous research is Landsat 7 Enhanced Thematic Mapper Plus1 available from NASA/US Geological Survey2. These data are at 30 m x 30 m resolution, sufficient for most applications in this area, and are available for relatively frequent time series, permitting selection of most relevant times of year (e.g. the ‘greenest’ period (Dadvand et al., 2012b)). A key advantage of these data is their global availability and frequency of update, permitting geographically consistent indicators and monitoring of change over time. NDVI may be most relevant to considering the green space and health pathways that are related to psychological processes (stress reduction, attention restoration), and wider ecosystem services such as urban heat island mitigation (Bowler et al., 2010a).
3.3.2Densityorpercentageofgreenspacebyarea
DescriptionIndicators of green space based on area density have also been widely used in epidemiological studies. As with NDVI, these indicators are also usually calculated for statistical areas (e.g. census output areas), or within buffers around residential locations or centroids of postal areas. Various geographical data sources have been used to define green space density. Indicator values can be based on remotely‐sensed satellite imagery or aerial photography classified to indicate land cover types, or may be derived from cartographic databases of land parcels, classified by land use or land cover. The land use or land cover data are overlaid with the statistical boundaries or buffer zones, and the proportion of the area covered with green space (however defined) is calculated.
ExamplesofapplicationinresearchandsurveillanceA range of health and well‐being outcomes have been studied using green space density measures. For example, Mitchell & Popham (2007) used a small area green space indicator based on the English Generalised Land Use Database (a high resolution cartographic land parcel classification) to investigate the association between green space density and mortality. This study indicated that areas with a higher percentage of green space land use tended to have lower mortality rates, and also suggested that the socioeconomic disparities in mortality were lower in greener areas, suggesting a potentially ‘equigenic’ effect (Mitchell et al., 2015). This same land use based green space indicator for England has been used in studies of mental health (Alcock et al., 2014), physical activity (Mytton et al., 2012), general self‐reported health (Mitchell & Popham, 2007) and childhood obesity (Cetateanu & Jones, 2014).
In representing the general quantity of available green space, availability indicators may be relevant to health effect pathways including provision of opportunity and motivation for physical activity; opportunity for stress recovery and attention restoration; and provision of other ecosystem services such as air pollution amelioration.
1 http://landsat.gsfc.nasa.gov/?p=3225 2 http://landsatlook.usgs.gov/

24
DatarequirementsandapplicabilityasaWHOindicatorMany studies using indicators of green space density have done so using national or local land use/land cover datasets, which are not applicable for use as a consistent WHO indicator. However, some have used international data, such as the Coordination of Information on the Environment (CORINE) Land Cover data, which classifies land cover using satellite imagery, and is available across Europe (see Appendix 2 for coverage across the WHO European Region), at resolution down to 100 m grid cells3. CORINE has some limitations in that it only includes larger green spaces (those at least 25 hectares), so misses many of the smaller green spaces in urban areas. However, some research has indicated that a green space measure based on CORINE data is fairly strongly correlated with a measure based on a more detailed national cartographic database (Mitchell et al., 2011).
Other international data sources that could be used to develop indicators of urban green space density include:
• Global Land Cover dataset: 30 m resolution land cover map data for years 2000 and 2010 released by the Chinese government4.
• Urban Atlas: European urban land cover map data, for urban zones with population greater than 100,0005 (see Appendix 2 for coverage across the WHO European Region).
• Cartographical data sources: Open Street Map6 is a global, open cartographic database derived from citizen contributors and open licence data sources. It could be used to extract green space geographical data, with the proviso that data quality and definition is potentially geographically variable due to the nature of the data.
An important aspect of using any of these datasets to derive a green space indicator is that it is necessary to consider a definition of what is included (and excluded) as ‘green space’ in order to select the relevant land use/land cover classes. For example, Urban Atlas includes a class named “green urban areas”, as well as several other potentially relevant categories, such as “sport and leisure facilities”, “agricultural areas, semi‐natural areas and wetlands” and “forests” (these are further discussed in Section 4). Another consideration is the statistical unit to which the data are allocated for integration with population and health data. Ideally these units should be at a fairly high resolution (i.e. small area), but may be defined according to some criteria.
3.3.3Measuresofstreettreesandotherstreetscapegreenery
The indicators of green space availability described above generally reflect all types of greenery in a specific area. Specifically, NDVI is a measure of total greenery including isolated elements of vegetation. At the same time, there is merit in considering other specific aspects of urban nature, such as street trees, green walls and roofs and other types of streetscape greenery. Trees planted along streets and roads may dampen noise and air pollution levels in residential houses, and mitigate adverse health effects of proximity to busy roads. These aspects may form an important part of urban ecosystems, and there is some evidence of health and well‐being benefit. For example, one ecological study of London Boroughs found that those with higher street tree density had lower rates of antidepressant prescriptions (Taylor et al., 2015). Experimental, laboratory studies using 3D imagery of street scenes have suggested that urban trees may promote stress‐recovery (self‐reported) and positive impacts on stress as measured by salivary cortisol (Jiang et al., 2014a; Jiang et al., 2014b). Another study in the Netherlands has investigated the quantity and quality of streetscape greenery based on a street audit, and found associations with perceived general health, mental health, and acute health complaints (de Vries et al., 2013).
3 http://www.eea.europa.eu/data‐and‐maps/data/corine‐land‐cover‐2006‐raster‐3 4 http://www.globallandcover.com 5 http://www.eea.europa.eu/data‐and‐maps/data/urban‐atlas 6 http://www.openstreetmap.org

25
3.4IndicatorsofgreenspaceaccessibilityIndicators of green space accessibility take into account the distribution of the population (individuals, households or communities) in terms of their proximity to green space. They may also include consideration of whether the green space is publicly accessible, and if so, where access points and routes are located.
3.4.1Proximitytoanurbanparkorgeographicallydefinedgreenspace
DescriptionA key indicator of accessibility is proximity to green space from a residence or neighbourhood to the nearest green space. The distance may be expressed as simple linear (straight line) distance, travel distance (by road/path network) or converted into estimated travel time. At the population level, these types of indicators can be summarized, for example to assess the percentage of a population living within a certain distance of a green space (of some minimum size or other selection criteria). These indicators may still include proximity to green space that is not publicly accessible, depending on the nature of the data available. An array of distances has been used in the literature considering access to urban green spaces, and there is no universally accepted guidance on a distance threshold that defines ‘accessible’. Another consideration is using distance to a boundary of green space vs. distance to a defined entrance or trail head.
These types of indicators can be used to establish national or subnational green space accessibility standards. For example, Natural England set an Accessible Natural Greenspace Standard for England (Natural England, 2010a). This recommends that everyone, wherever they live, should have an accessible green space:
• of at least 2 hectares in size, no more than 300 m linear distance (5 minutes’ walk) from home;
• at least one accessible 20 hectare (ha) site within two kilometres of home; • one accessible 100 ha site within five kilometres of home; • one accessible 500 ha site within ten kilometres of home; and • a minimum of one ha of statutory Local Nature Reserves per thousand population.
The European Common Indicator of local public open areas does not set a target and is not specifically focused on green space, but is based on a similar metric – the percentage of citizens living within 300 m from a public open area of minimum size 0.5 hectares (Ambiente Italia Research Institute, 2003). There is no clear agreement on the use of a distance that represents accessibility – while the Natural England standard suggests 300 m to be a 5 minute walk, the European Common Indicators suggest this distance to approximate a 15 minute walk.7 The Natural England and European Common Indicator definitions of accessible green space are given in Appendix 1 for reference.
The online tool EnviroAtlas 8 provided by the US Environmental Protection Agency (US EPA) includes various indicators of green space availability and accessibility, such as green space per capita, total residential population within 500 m walking distance along walkable roads and pathways of a park entrance and percentage of residential population within 500 m walking distance of a park entrance at a census block level (Pickard et al., 2015).
7 “The European Environment Agency, DG Regional Policy and ISTAT (Italian Istituto Nazionale di Statistica) all use the concept ‘within 15 minutes’ walk’ to define accessibility. It may reasonably be assumed that this corresponds to around 500 m walking distance along roads or pathways on foot for an elderly person, which in turn may be equivalent to 300 m linear distance used in the European Common Indicators (Ambiente Italia Research Institute, 2003. Pages 79 and 185.). 8 https://www.epa.gov/enviroatlas

26
ExamplesofapplicationinresearchandsurveillanceMany studies of green space and health have used proximity metrics to estimate accessibility of green spaces. For example, a study in Tel Aviv, Israel used residence within 300 m of the boundary of a green space of at least 0.5 ha as an indicator of proximity to demonstrate beneficial effect of green spaces on birth outcomes (Agay‐Shay et al., 2014). The same study also used NDVI as a neighbourhood greenness or green space availability measure. The authors hypothesised that greenness would be more indicative of mechanisms involving reduction of psychophysiological stress, and modifying the impact of air pollution, noise and temperature, while proximity to a major green space would be more indicative of mechanisms involving physical activity.
One study of physical activity and proximity to green space in Bristol, United Kingdom used a minimum green space area of 2 ha, defined by the authors as a minimum to support physical activity. The study suggested that people living closer to green spaces were more likely to engage in levels of physical activity that met government recommendations (Coombes et al., 2010). An ecological study of mortality in Florida in the United States calculated a county‐level measure of green space accessibility based on average constituent census tract proximity to nearest green space (without apparent size threshold). This study suggested no association between a simple average distance to green space and mortality, but did find an association with a more complex proximity‐based measure of accessibility based on “cumulative opportunity” (Coutts et al., 2010).
DatarequirementsandapplicabilityasaWHOindicatorAt population scale, an indicator of green space accessibility requires both a geographical green space dataset (with the inclusion criteria for green spaces clearly defined), and a population dataset with appropriate geographical resolution. Most commonly, population data are available for small geographical areas, such as postal districts or census data reporting areas. The two datasets should be approximately comparable in terms of time period covered. There are some suggestions that size of green space may influence the type of usage and health and well‐being outcomes afforded. Whilst there is no conclusive evidence on a critical size threshold for specific health and well‐being outcomes, it is suggested here that international indicators should measure small size green spaces, as these may be more amenable to local and national policy interventions.
A number of green space datasets are available that could theoretically be used for this type of indicator in the region, as described in Section 3.3.2.2. NDVI, Global Land Cover and CORINE datasets do not include delineation of specific parcels of land, but could theoretically be configured and analysed to approximate defined ‘green spaces’. However, CORINE only includes land parcels greater than 25 ha, making it unsuitable to use for a health‐related indicator which should include smaller neighbourhood green spaces. Urban Atlas covers urban areas in the European Union but does not include countries in the eastern part of the WHO European Region. It does delineate specific green spaces, and identify publicly accessible spaces. This is described further in Section 4.
3.4.2Proportionofgreenspaceorgreennesswithinacertaindistancefromresidence
DescriptionThe proportion of overall greenness or green space within a certain radius around a residence can be a useful measure in research projects addressing specific health outcome pathways. These indicators have been widely used in epidemiological studies. Indicator values can be estimated for a range of buffer zones to explore the strength of associations with specific health effects.
ExamplesofapplicationinresearchandsurveillanceA longitudinal study of green space and childhood obesity in California used municipality data on land use to calculate an indicator of park acreage within a 500 m buffer of study participants’ homes (Wolch et al., 2011). Higher availability of green space according to this density measure was
27
associated with reduced risk of obesity and being overweight by the time the study participants reached the age of 18.
Remotely sensed land cover data have been used in similar studies. An example in the Netherlands used the National Land Cover Classification database, which classifies the land use of 25 m grid cells across the country (Maas et al., 2009b). These data were used to calculate green space area density within 1 km and 3 km buffers of home postal code locations of individuals included on primary care databases. The study demonstrated a strong protective effect of green space on depression and anxiety.
Several recent studies have also investigated the relationship between birth outcomes and neighbourhood greenness using NDVI. Dadvand et al. (2012b) used data from four Spanish cohorts, and calculated average NDVI for three buffer zones at 100 m, 250 m and 500 m from the residence address location of mothers at time of delivery. The findings suggested that those living in greener areas were more likely to have heavier babies (lower likelihood of Low Birth Weight). Studies using similar methods have been carried out in the United States and Israel (Hystad et al., 2014; Agay‐Shay et al., 2014) and have shown links between surrounding greenness and positive pregnancy outcomes.
DatarequirementsandapplicabilityasaWHOindicatorNDVI is useful in determining general greenness within a defined distance from home, and has the advantage of global availability and frequent update. Global Land Cover is another potentially useful database. European Urban Atlas can also be used to calculate the proportion of geographically defined green space within a buffer zone around each residence. National or municipal high resolution land use databases can also be used in combination with geocoded population data. The application of this type of indicator usually requires high resolution geocoded data on individual residences. In the context of a WHO indicator, data analysis can be computationally intensive while requirements for high resolution data would limit the applicability of these indicators.
3.4.3Perception‐basedmeasuresofgreenspaceaccessibility
DescriptionPerceived accessibility can also be a useful measure supplementing distance‐based accessibility. One issue for consideration is the potential mismatch between perceived and objectively measured accessibility. It is possible that perceived proximity may be an important driver of use especially if objectively measured proximity is not consistently related to perceived proximity across population subgroups. There is limited evidence of this, but one study in Glasgow, United Kingdom compared participants’ perception of the distance to their nearest park and the actual distance measured via both a road network and as straight line distance (Macintyre et al., 2008). The study found limited agreement between perceived and objective measures, and importantly suggested that this agreement was poorer amongst people of lower social class and in more deprived areas.
ExamplesofapplicationinresearchandsurveillanceOne study used data from the European Quality of Life Survey to investigate associations between self‐reported green space accessibility and mental health inequalities. The question used to assess perceived accessibility was “Thinking of physical access, distance, opening hours and the like, how would you describe your access to the following service? [recreational/green areas]” (Mitchell et al., 2015). The study found socioeconomic inequalities in mental health to be substantially lower amongst people reporting good access to recreational/green areas compared to those with poorer access.
DatarequirementsandapplicabilityasaWHOindicatorPerception‐based green space accessibility indicators can be useful as broad measures of quality of life or in local investigations in support of targeted policy measures. The European Quality of Life Survey is conducted every four years in the European Union countries (other European countries may

28
also participate)9. The data are collected from randomly selected individuals across each participating country and may not be sufficient for characterizing green space accessibility at municipal level. Local data are not readily available and needs to be collected using specially designed survey tools. This would make a broad and sustained international application of an indicator based on perception‐based measures in the WHO European Region rather problematic.
3.5Indicatorsofgreenspaceusage
DescriptionHealth and well‐being benefit may be gained without actual physical use of green space; for example, there may be psychological effects of simply viewing green space, even if it is not publicly accessible (e.g. private gardens). However, several of the pathways from green space to health and well‐being require that individuals actually spend time in the green space in order to gain benefit (e.g. through physical activity). Indicators of green space usage are useful in terms of a) understanding relationships with health and well‐being outcomes and b) understanding how and to what extent green spaces are actually used by local resident and visiting populations. These indicators may help to provide information on, for example, green spaces that are underutilized or that have potential for diversification of use and users. There are several ways in which usage might be measured.
• From the population perspective, surveys can establish how often individuals visit their local green spaces, which ones they visit and which characteristics attract visits, on a self‐reported basis.
• From an individual perspective, mobility tracking using Global Positioning System technology can be used to assess exactly which green spaces are used, duration of visits, and so on.
• From the green space point of view, observation, gate count and survey data can be used to establish how much a specific space is used, and what it is used for. This method focuses on the contribution of a single area. Therefore, it is difficult to link it with health benefits. However, this approach can be helpful for assessing effects of policy measures aimed at improving green space use.
These methods can potentially be used in combination to build understanding of how, when and by whom green spaces are used, and to assess health and well‐being outcomes related to usage.
ExamplesofapplicationinresearchandsurveillanceGreen space usage may be physically active or passive, and could lead to health and well‐being benefits through various mechanisms described above, depending on the type of space and the activities afforded. For example, one study in the Netherlands established usage extent and characteristics through a postal questionnaire survey. The ‘Vitamin G’ study developed a series of questions to establish patterns and experience of green space use. These survey questions ask about various aspects of use of local green areas: “distance from home, frequency of visitation, duration of visits, activities performed during visits, accompanying persons, interactions with other people during visits” (Groenewegen et al., 2006; Groenewegen et al., 2012). Other studies have used data on self‐reported visits to natural environments (including urban green space), relating the characteristics of the individuals, the environment visited and the nature of the visit to perceived stress reduction, mental restoration and physical activity (White et al., 2013b; White et al., 2014; Elliott et al., 2015).
A number of studies have used GPS receivers to track individuals’ movements and to map and analyse their use of green spaces. For example, a study of around 1,300 schoolchildren in Bristol, United Kingdom used GPS data in combination with accelerometry (measuring physical activity). The study found that children (especially boys) were more likely to be physically active at the level above the Moderate‐Vigorous Physical Activity thresholds in green spaces compared to other types of urban environments (Wheeler et al., 2010). 9 https://www.eurofound.europa.eu/surveys/european‐quality‐of‐life‐surveys
29
A study in the United States used a standardised observation tool (the System for Observing Play and Recreation in Communities) to observe physical activity behaviour in eight parks; the authors concluded that visitors to rural parks tended to be less physically active than visitors to urban parks (Shores and West, 2010).
DatarequirementsandapplicabilityasaWHOindicatorGreen space usage data are not collected on an international basis, with the exception of self‐reported measures included in the European Quality of Life Survey, mentioned above, and some Eurobarometer surveys. For example, Eurobarometer data were used to compare the quality of life in 79 cities, including an indicator of “satisfaction with green spaces such as parks and gardens” (European Commission, 2013). These data may help to inform nations or localities about public perceptions and usage of their green spaces, but are dependent on the geographical areas covered by the surveys.
3.6 Summary and recommendations for a health‐relevant approach toselectingandusingindicatorsofurbangreenspace
3.6.1Summaryofconsiderationsforselectingindicators
Little research has directly compared different indicators of green space. Some research (Mitchell et al., 2011) has compared green space measures based on detailed cartographic databases and coarser data from CORINE, and suggested that they are broadly comparable, but with some important differences (especially due CORINE’s exclusion of smaller green spaces). A recent systematic review of the mental health benefits of long‐term exposure to green and blue spaces suggested some differentials between relationships with measures of: surrounding greenness; access to green spaces; quality of green spaces; and blue spaces (Gascon et al., 2015). However, the evidence base was highlighted as being limited or inadequate, and further research is required to establish whether there are true differences between these conceptualizations of local urban green space. Various studies have highlighted the importance of:
• nuanced consideration of different types and qualities of green space; • the various mechanisms through which a wide range of health and well‐being outcomes
could arise; and • the likelihood that there will be variation in response to any particular green space ‘exposure’
according to population and individual characteristics including age, sex, socioeconomic status, local/regional cultural norms, life course experience and so on (Bell et al., 2014; Mitchell and Popham, 2008; Gascon et al., 2015; Hartig et al., 2014; Annerstedt et al., 2012).
It is therefore worth summarizing some of key questions and uncertainties. These could be considered by those implementing and using the indicators to give context, and to promote opportunities to develop more bespoke indicators based on locally available data sources:
• What are the most important/relevant potential exposure pathways and health outcomes (see Section 1)?
• Does size of green space matter? Different sized patches of green space may be important for pathways leading to different health benefits.
• Does land cover type of the green space matter? What about water (blue space) or other locally relevant land cover types?
• What is the degree of ‘wild’ or ‘tamed’ nature in the green space? What is the actual and perceived biodiversity value of the green space? Culture and context – Is urban green space different in different cities and regions, does it mean different things in different cultures, and does it have connections with health via different pathways?
• Are any of the following characteristics particularly relevant to the locality/region? - perceptions of environmental quality

30
- safety issues (such as lighting) - attractiveness - maintenance - cleanliness - diversity of environments - diversity of user groups and potential conflicts of use - biodiversity, wildlife, vegetation - facilities e.g. catering, lavatories, car parking - dog ownership/restrictions on access for dogs - identity, culture and community significance - land ownership - pesticide use and other potential hazards - tree species, especially with regard to allergen levels.
In conclusion, while there is a rapidly growing evidence base regarding the potential health and well‐being benefits of urban green space, the effects are heterogeneous and, therefore, they cannot be summarized in a simple fashion as a straightforward exposure‐outcome relationship. A single green space measure is unlikely to be able to capture and summarize all of these complexities. However, there is considerable merit in developing comparable, general indicators of health‐relevant urban green space across the European Region for a variety of purposes, with utility at local, national and international scales.
Alongside reasonable evidence that the indicator represents a health‐relevant measure of urban green space, a number of other factors need to be taken into consideration for pragmatic implementation and use:
• Are the data readily available?; • How frequently will the data be updated? It should be noted that any future changes in the
way the green space or population data are produced or applied could influence the indicator, and therefore impact on capacity to monitor change over time;
• At what spatial scale and resolution are data available?; and • Is there comparable data coverage internationally across the European Region?
A balanced, health‐relevant approach to a WHO urban green space indicator for the European Region should be based on consideration of these factors and the evidence and approaches described above. It should utilize existing data that are readily available and should not require new data collection.
3.6.2Recommendationsforaprimaryindicator
A proximity‐based indicator of green space accessibility, using the European Urban Atlas as the most appropriate and feasible international source of urban green space data in the EU Member States (all EU Member States contribute data for cities with more than 100 000 inhabitants) or comparable sources of land use data in other countries of the WHO European Region is a realistic approach which would produce data pertinent to the Parma Declaration commitment “…to provide each child with… green spaces to play and undertake physical activity” (WHO, 2010b). The focus on physical activity calls for an indicator reflecting accessibility to green spaces suitable for this purpose.
Based on the existing evidence and the rationale presented above, the following approach is suggested:
1. Type of indicator: Accessibility indicator based on residential proximity to green spaces (defined green spaces combined with population distribution data).
2. Green space data source: European Urban Atlas because of its level of spatial detail, its availability in a majority of European Member States and appropriate spatial resolution. Comparable national or municipal data sources would need to be identified outside the Urban Atlas coverage area.

31
3. Green space definition: As per Urban Atlas Class 1.4.1 Green Urban Areas (see Box 2.1), with two minimum sizes of 0.5 ha (core indicator) or 1.0 ha (additional indicator to allow flexibility). Recommend reporting results for both minimum sizes. Testing of even larger minimum green space sizes can be recommended to facilitate more in‐depth policy analysis and provide data in support of interventions.
4. Population data: To be obtained at the finest spatial resolution possible (variable source according to location). European population estimates are available for 100 m grid, which is an appropriate intra‐city scale (e.g. the Eurostat 2006 grid10 is appropriate for combination with the 2006 Urban Atlas data). Future updates could use updated population grids, or local census small area data.
5. To measure proximity, population unit (e.g. census area) centroid linear distance from green space edge is a reasonable proxy for the walking distance to the park entrance. Network distance may be more accurate and reflect variation in local access routes but is also more complex to calculate; linear distance is an appropriate proxy.
6. A linear distance of 300 m is reasonable as it corresponds to approximately 5 min walking distance along walkable roads or pathways. Testing of different linear distances may be recommended to facilitate more in‐depth policy analysis and provide data in support of interventions. However, meaningful analysis at small distances requires high resolution land use and population data.
7. Depending on the availability of data at a city level, local public health authorities may be advised to conduct further analyses based on the proposed proximity‐based indicator – for example calculating accessibility measures for specific population subgroups.
Section 4 of this report presents a detailed methodological approach to a proximity based indicator and an analysis tool kit.
3.6.3Recommendationsforsecondaryindicators
Other indicators addressing availability of overall greenness should also be considered in order to address other pathways to health, such as psychological relaxation. Further indicators would also provide additional context and information for informed policy analysis. Key indicators considered to be of merit are:
• Green space availability indicator based on NDVI – mean value to indicate average ‘greenness’ at city scale, or for small areas within a city to indicate distribution across the population. To enable inter‐city and temporal comparisons, the seasonal nature of this measure has to be taken in account (e.g. timing of measurements standardized).
• Perception‐based indicator based on local/national surveys to establish green space usage and perceptions. Such surveys could implement questions such as those used in the European Quality of Life Surveys 11 and in the regular European Union’s public opinion survey EuroBarometer (European Commission, 2013) for consistency and comparability.
10 http://ec.europa.eu/eurostat/statistics‐explained/index.php/Population_grids 11 https://www.eurofound.europa.eu/surveys/european‐quality‐of‐life‐surveys

32
4.PROPOSEDINDICATORANDADATAANALYSISTOOLKIT
4.1.SummaryofindicatordevelopmentandevaluationIn order to monitor progress towards the commitment “…to provide each child by 2020 with access to healthy and safe environments and settings of daily life in which they can walk and cycle to kindergartens and schools, and green spaces in which to play and undertake physical activity” (WHO, 2010b) which the Member States of the WHO European Region made at the 5th Ministerial Conference on Environment and Health in Parma, Italy (2010), an indicator tool, which can be applied on a municipal level in the European Region, is required. At a WHO technical meeting in 2010 a preliminary indicator definition and method was suggested (WHO, 2010c). The recommendation was to develop an indicator based on analysis of GIS data on land use and population reflecting proximity of population to urban green spaces. The linear distance of 300 m was suggested as corresponding to approximately 5 min walk along walkable pathways. It should be noted that while 300 m is a commonly used distance cut‐off, currently there is no consensus on the residential proximity to green space that is linked with physical activity and relaxation‐related health benefits (reviewed by Ekkel & de Vries, 2017). Future epidemiological studies are expected to provide new insights on the spatial shapes of associations between proximity to green space and specific health effects in certain population groups.
In order to test the suggested indicator and further develop its methodology, three case studies have been conducted in Utrecht (the Netherlands), Kaunas (Lithuania), and Malmö (Sweden). An initial outline of indicator methodology was developed by The National Institute for Public Health and the Environment (RIVM), the Netherlands, including two alternative methods for estimating the indicator value. The case studies used European Urban Atlas data on land use, as well as local data on land use and population (Annerstedt van den Bosch et al., 2016). The case studies involved testing various definitions of green spaces based on Urban Atlas classifications, minimum sizes of green spaces ranging from 0.25 ha to 5 ha, and buffer zones from 100 m to 500 m. The case studies also compared results produced using spatially aggregated population data and high resolution population data on individual houses.
The lessons learned highlighted potential challenges with acquiring house‐level population data in the context of an international study. The results also showed that using a buffer zone (linear distance to a park) which is comparable to the grid size of land use or population data resulted in statistical instability of indicator values. On the other hand, using greater distances produced estimates of population proportion residing within the buffer zone close to 100% and lower inter‐city variability of the indicator values.
This section presents a revised indicator definition and fully developed methodology for estimating the indicator value based on results of the pilot surveys and addresses recommendations from international experts who attended the WHO meeting on green spaces and health in Bonn, Germany in May 2015. It starts with describing the data requirements for a WHO Urban Green Space Indicator in section 4.2 before and then outlines two methods for estimating the indicator value. These methods, hereafter called “basic” and “complex” method, have been tested in three case studies (Annerstedt van den Bosch et al., 2016). Both methods use the same kind of land use data. The basic method uses population data aggregated at the census block level and is discussed further in Section 4.3.2. The complex (and more precise) method requires geocoded data on individual residences and is discussed further in Section 4.3.3. A detailed, step‐to‐step guide with instructions on how to conduct the analysis is provided in Appendix 3.

33
4.2.DatarequirementsforaWHOUrbanGreenSpaceIndicator
4.2.1.LandusedataforEUcountries
The application of an Urban Green Space Indicator requires harmonised and comparable land use data available at an international level. Urban Atlas is currently the most up‐to‐date land use database for cities in the Member States of the EU (European Union, 2011). It is the biggest international database in the WHO European Region currently covering 27 EU countries representing over half of the 53 regional Member States. Urban Atlas data are freely available through the European Environment Agency (EEA) 12 and are delivered in vector format in topologically correct GIS‐files. The update frequency is to be determined.
Urban Atlas has a high thematic resolution with a classification system focusing on interurban areas. In total, the classification system contains four major units: (1) Artificial surfaces, (2) Agricultural areas, semi‐natural areas and wetlands, (3) Forests, and (4) Water. The minimum overall thematic accuracy for unit 1 is 85% and the geometric resolution is 0.25 ha. For the remaining units the thematic accuracy is 80%, while the geometric resolution is 1 ha. The position pixel accuracy is less than 5 m for all units.
Unit 1, artificial surfaces, is further subdivided into subunits, defining specific artificial urban land use types, such as roads, green urban areas, sports and leisure facilities and residential areas of various density. For the indicator, the subunits “green urban areas” (Urban Atlas code 14100) and “sports and leisure facilities” (code 14200) could be considered, as well as the non‐artificial units “agricultural areas, semi‐natural areas and wetlands” (code 20000) and “forests” (code 30000). The conclusion after case studies and consultations with WHO technical experts was to use the subunit “green urban areas” for the indicator’s definition of urban green spaces. More detailed information on the definition is provided in Box 4.1.
Box 4.1 European Urban Atlas Class 1.4.1 (vector data code 14100): Green Urban Areas (European Commission, 2011)
Minimum mapping resolution 0.25 ha, Minimum width: 10 m
Included:
• Public green areas for predominantly recreational use such as gardens, zoos, parks, castle parks. • Suburban natural areas that have become and are managed as urban parks. • Forests or green areas extending from the surroundings into urban areas are mapped as green
urban areas when at least two sides are bordered by urban areas and structures, and traces of recreational use are visible.
Not included:
• Private gardens within housing areas • Cemeteries • Buildings within parks, such as castles or museums • Patches of natural vegetation or agricultural areas enclosed by built‐up areas without being
managed as green urban areas
12 http://www.eea.europa.eu/data‐and‐maps/data/urban‐atlas; http://dataservice.eea.europa.eu/map/UrbanAtlasbeta/

34
4.2.2.Landcover/usedatafornon‐EUcountries
Detailed urban land use data for non‐EU countries are currently not systematically mapped and not freely available internationally. However, varied global map services are developed or under development for open access, such as Global Land Cover dataset and Open Street Map. These data, or local or regional equivalents, are recommended to be used where Urban Atlas data are not available. The same methodology, as outlined in this section, should be applicable. In addition the urban green space definition used should aim to be as similar as possible to that of the Urban Atlas definition.
Various land use data sources are described and discussed in Section 3 of this report.
4.2.3Populationdata
Local scale population data about place of residence in GIS layers are needed. Population distribution data are usually freely available from local sources, such as municipalities. These data may be on individual or, for example, census block level. The finest spatial resolution possible should be obtained. While the proposed indicator is designed to measure the overall accessibility of green spaces, additional information on socioeconomic and demographic characteristics of census blocks or other spatial units can be used to stratify the population, to estimate indicator values for specific population strata, and assess potential inequality in access to green space.
Comparable European population estimates are available for 100 m grids, which is an appropriate intra‐city scale. For example, the Eurostat 2006 grid13 is appropriate for combination with the 2006 Urban Atlas data.
For EU countries, another possible option is the Population density disaggregated dataset, provided by EEA14 (Gallego, 2010). These are raster data on population density using CORINE land cover data from 2000, and is available free of charge EU‐wide. For non‐EU countries, input data from local sources would be an option.
Due to factors like data protection, non‐synchronised data collection, or financial costs, it is not expected that harmonised, individual residential data will be easily and freely available across the member countries of the WHO European Region.
For the basic version of the indicator method, census block population distribution data or similar spatial resolution scale are adequate. EU countries should use local data or EU‐synchronised population data from, for example, Eurostat or EEA. Non‐EU countries will have to rely on data from local sources.
To conduct the complex version, individual population data are required. Therefore, the basic version is the general recommendation to use for reporting the Urban Green Space Indicator, but when individual population data are available the complex version may be tested.
4.3.Methodology
4.3.1Generaloverview
A spatial analysis tool is required for estimating values of the indicator. Several alternative methods are possible, all relying on GIS data. A common GIS software (ArcGIS for Desktop15) was used for analysis of data from case studies. ArcMap, the primary component of ArcGIS, was applied to estimate values of the indicator. This report describes the application of ArcGIS software version 10.1.
13 http://ec.europa.eu/eurostat/statistics‐explained/index.php/Population_grids 14 http://www.eea.europa.eu/data‐and‐maps/data/population‐density‐disaggregated‐with‐corine‐land‐cover‐2000‐2 15 http://www.esri.com/software/arcgis/arcgis‐for‐desktop/index.html

It ap
Mexsta
Thspdeacanind
Thpu
U
NoNTO
wit
Thdifdabo
Thbuspspste
Fig
Th(coda
I
O
T
is ppply
ain xpreand
he Uaceescrcesnalydica
he inublic
Urb
ote: OTAL=thin
he tfferata oth
he fuffeatiaecifep‐t
g. 4
he correata,
Inpu
Outp
Tool
presy in
toessidard
Urbes, wribessibysis ato
ndic ur
an
NAC
=tot300
tworentandme
feater toal sfiedto‐s
4.1 G
comespin t
ut da
put
l for
sentoth
ols onsd St
ban whed iilityskir im
catrba
Gre
CC=nal n0 m
o dit wd thetho
tureool,eled distep
GIS
mplondthis
ata
data
r ana
tedher
uss setruc
Grich in y, mlls ampli
or dn g
een
umbumbfrom
iffeayshe pods
e‐ba, whctiostap an
flo
ex dings ca
a
alysi
d hesof
ed elecctur
reenareSecmayas wicat
defree
n Sp
ber ber m ne
rens (bproxare
asehichon tncenaly
w c
meg toase
is
ere ftwa
in ct ared
n Se asctioy beweltion
fineen s
pace
of of ineare
nt auffexime ou
d th ptooe toysis
char
etho ththe
as are
thea suQu
pacssun 3e ml asn.
s thspac
e In
inhanhabest U
alteer a
mity utli
oolrodls (o ths‐ou
rt fo
od he de ind
an op
e Aubseuery
ce me3 oores ad
he pce,
dica
abitabitaUrba
rnaanatooned
s vducesuce butlin
or t
is distdivi
exaptio
ArcMet oy La
Indd tof te acddit
proacc
ato
antsnts n Gr
ativelysiol isd in
aryes pch aordne o
the
batancidua
ampns,
Mapof fangu
icato othisccurion
oporcord
or =
s livwithreen
es is os ve Fig
y in polyas “dersof t
bas
asedce al r
ple suc
p arfeauag
tor offe reratenal,
rtioding
N
−⎯
Nving hin tn Sp
of or inectogure
theygo“Sels ofthe
sic
d obetesid
onch a
re fturge.
wir a epoe todet
on og to
NACC
⎯−
NTOTA
witthe ace
thendivor des 4
e tyon fectf a dbas
me
on tweden
ly. Tas t
fromes
ll bprort, o mtaile
of ao th
C
−⎯
TAL
th 3areaof s
e Gvidudata4.1
ypefeat Laydelisic m
etho
a ‘een nces
Thehe
m tand
be boxyne
meased
n ue fo
⎯−⎯
300 a of spec
IS mual a. Tand
es otureyerneame
od (
‘Neaeas.
e safree
the d ta
basy fotwosuredat
urbaollo
⎯ x
m inte
cified
medistThe d 4.
of oes or Byatedtho
Arc
ar’ch
3
ameely
Prable
sed r worke reta. T
an powin
100
fromeresd mi
thotanwo.2.
outpoutpy Lod god,
cGIS
tores
35
e mava
oxie re
onwalk
aneal The
popng f
0
m nt; Uinim
od bnce ork f
put putocatreeple
S)
ol ide
ethaila
miteco
n linkingnalywaeref
pulaform
nearrba
mum
botanaflow
thet to tionen sase
thaent
hodble
ty aords
neag disysislkinfore
atiomul
est n Gr size
th palysw d
ey pbe
n” inpace se
at aand
oloe Qu
ands. Q
ar dstan, inng de, it
on lila:
Urbreene.
perfsis).iag
proe usn Ace, e A
addd th
ogicuan
QuQue
distancencludistt is
ivin
ban n Sp
form. Foram
oducsed rcGin aAppe
ds ahe b
al ptum
uerry
ance toudintancnot
ng w
Greace
m aor bms f
ce. as
GIS)accoend
a dbor
prinmGI
y aexp
ce e thng ce. t re
with
een Ind
a pbothfor
Theinp. Thorddix 3
distarder
ncipIS (Q
apppres
estie broaHoecom
hin
Spaicat
proxh mthe
e bput he tanc3.
ancr of
ples QG
licassio
mabordads wevmm
a sp
ace or=p
ximethe an
basito tooce w
ce f gr
anIS).
atioons
tesder anver
men
pec
of perc
ity hodnaly
c movel crwith
mereen
nd s.
ns, in
s ofof nd r, thdab
cifie
specent
ans thysis
meterlareath th
easun sp
imi
whArc
f aca gothhis rble
ed d
ecifieage
alyshe ipro
hoday, otes he d
urempac
lar
hichcGIS
ccesgreeher reqat t
dist
ed mof r
sis, inpuoce
d is or aa bdefi
mene) t
exp
h byS a
ssiben sbauirethis
anc
miniresid
buut iess i
baaltebuffniti
nt to t
pre
y cdhe
ble spaarriees hs sta
ce f
imumdent
ut is fein G
asedernafer wion
attthe
ssio
hosere
grece. ers highage
from
m sts liv
n teatuGIS
d onativwit. Fo
ribu inp
ons
sen to
eenAsto
here of
m a
size;ving
wourefor
n avelyh aor a
uteput
r f
g
r
y

Fig
LaprpoLa
4.3
StThThse
W
StCrprdissp
BaWrem greanpo
StThbuas wiwopoin
g. 4
nd ojeopund
3.2
tephe Cherelect
hen
tepeateviostanace
asedHOcomlineennalyopu
tephe ‘Suffe“inll aouldolygtha
Inpu
Outp
Too
4.2.
usectiolatiuse
2Ba
1SClip eaftted
n U
2Ctingousncee ar
d oO mmmearn spysis lati
3SSeleer zonterll red ggon at p
ut da
put
l for
GIS
e aon on e da
asic
Seletooter, by
rba
Creag busly se to rea.
n thmeetendr dispacusion
Seleect onersecendive me
poly
ata
data
r ana
S flo
nd anddatata
cm
ectiol in dey an
an A
atinuffeselethe
he tingdatstane foing dat
ectiby
e. Inct”, der oveerelygo
a
alysi
ow
pod cta aare
meth
ingn Arepe an
Atla
nger zectee gr
resg oionnceor vata a
ingLo
n Ar“coapperely ton m
is
cha
pulcooare e de
hod
ofrcMendialy
s is
bufoneed gree
ultson g (We totheriouare
pocatrcGompproestimoucmay
art f
atiordinapperiv
d
f greMaping sis
s us
fferes agren sp
s ofgreeWHO the inus min p
oputionIS, pletoximmatchiny liv
for
on nateplicved
eenp Toontoo
ed,
rsaaroen pac
f caen O, 2e bdicmaxplac
ulatn’ tosevtelymatetionng ae o
the
date sablfro
nspoolbn wol in
“G
aroundspace b
ase spa
2010bounatoximce,
tionool veray wie vans oa grouts
e co
ta fsyste. Fm U
pacbox whatn th
Gree
ound gace bord
stuace0c) ndaor amumper
nwin Aal aithinalueof threenside
omp
fromtemFor Urb
cescant lae so
en U
ndgreeattder
udiees ato
ary are m dirfor
withArcltern”, es ohe n spe th
plex
m am. Fthe
ban
n beandoftw
Urba
green stribcan
es (anddefof 0.5istarmin
hinbcGISrnaor of tUrbpace b
x m
pprFor e coAtl
e us uswar
an A
enspacuten he
Annd hefinegre5 hanceng a
bufS cative“cethe bane bbuff
eth
ropthe
ompas o
sedse dre.
Are
spaces e asere
nerealte theen a anes (add
fferan bes fentrpo
n Grbordfer
hod
priate bplexor e
d to datIn A
eas”
aceca inpafte
rsteth he ispand (forditio
rbe ufor roidpulreender zon
3
te sbasix veequ
getta aArcG
”, c
eson bput er b
edt in ndiace1 hr exona
usespad. Uation Swilne a
36
souc versiuiva
t thare GIS
ode
ofdbe ddabe c
vanMacat. Twha. xamal an
ed tatiasingon spacll beand
rceverson,len
he laus, th
e 14
defindonta. cho
n deay 2tor wo It
mplenaly
to idl seg cesizece Ie in th
es ssion indnt fo
anded,he ‘S
410
nedne bThe
osen
en 201as precis ae 20yses
denelecense wndincluus a
houn bdivior n
d us apSele
00, s
dsiby pe bn as
Bos15, procomalso00 ms re
ntifyctiosus ithicatudedat a
uld bothduanon
se dpproect
sho
izeperuffes we
sch is
opormmeo rem aequ
y thn oblon tor, d, aa la
beh inal le‐EU
dataoprby A
ould
rforer sell a
et wartioendecomandires
he sf pock ohe as althrge
acndiveveU co
a wriateAtt
d be
rminsizeas t
al.,s don odedmmd 50s lit
sizeopuor dbufthe
houger d
cquividul poount
ithie utribu
e se
ng anthe
, 20decof p alt
men00 mttle
e ofulatdisaffere engh dista
iredual oputrie
n thunitutes
lect
a bd cmi
016idepoputerndedm). ext
f thtionaggr zontirlarganc
d anlev
ulates.
he ts fs’ t
ted
buffcorrnim
) and tulatnatid toOntra
e pn layregone.re pge pe th
nd vel ion
mufor ool
d.
fer respmum
nd to tionive o pnceeffo
popyergate. Thpopparthan
set an da
nicgre ca
anaponm si
discuphn livmi
perftheort.
ulatare
ed phe inulatts on w
intd cta a
ipaeen n b
alysndinze o
cusholdvingnimforme la.
tione atpopntetionof thhat
to tcenare
lityspe u
sis ung mof t
ssiod thg wmumm aand
n wt haulaersen whe t is
the susreq
y bopacesed
usinmaxthe
ns he
withim siaddid us
withandtionct o
withresspe
sas lequir
ordees ad.
ng tximgre
at tinitin 3izesitiose a
in td, sun doptin aideecif
meevelred
ers.are
theumeen
thetial300s ofnaland
theuchataionanyntsfied
.
f
y

37
(Fig. 4.3). The completely within option provides underestimations, as residents in the polygons that are not entirely within the buffer will be omitted, although parts of the polygon’s population may, in fact, be within the buffer (Fig. 4.4).
The centroid option should also give an approximation. However, theoretically it may be closer to the individual data result and the real situation, since it will include the population of polygons with the centroid within the buffer zone, while still not including every polygon, and corresponding population, touching the buffer border (Fig. 4.5).
The centroid option, or equivalent, should be applied for the indicator.
Fig. 4.3. Inclusive option (“intersect the source layer feature” in the GIS‐selection)
Fig. 4.4. Exclusive option (“completely with the source layer feature” in the GIS‐selection)

38
Fig. 4.5. Centroid option (“centroid in the source layer feature” in GIS‐selection)
Step4EstimatingtotalpopulationwithinthebufferzoneIn ArcGIS, the ‘Statistic’ tool can be used to sum the population within the buffer.
Step5CalculatingtheindicatorvalueApply the formula from section 4.3.1 to estimate the Urban Green Space Indicator value as the ratio of the number of people who live within 300 m from the nearest green space to the total number of residents of the city or area of interest, multiplied by 100%.
4.3.3.Complexmethod
Step1SelectinggreenspacesThe selection of green spaces is made by the same procedure as in the basic method. The selection should then be exported to a new layer by the selection option Create Layer of Selected Feature in ArcGIS. The Dissolve tool is used to dissolve the boundaries in between the polygons. Equivalent tools shall be selected in alternative GIS software.
Step2SelectingpopulationinstudyareaPopulation data at individual level are selected as input data.
Step3CalculatingindividualdistancetonearestgreenareaTo estimate the number of inhabitants living at a certain distance to nearest urban green space, the proximity tool Near, or equivalent, can be used. The tool can measure the distance between each feature and its nearest neighbourhoods’ location, in the Urban Atlas case the selected “Green Urban Areas”. A distance measurement attribute (300 m) is added to the input features attribute table.
Step4EstimatingthetotalpopulationwithinthebufferzoneThe ‘Statistic’ tool can be used to sum the population within the buffer.
Step5CalculatingtheUrbanGreenSpaceIndicatorApply the formula from section 4.3.1 to estimate the Urban Green Space Indicator value as the ratio of the number of people who live within 300 m from the nearest green space to the total number of residents of the city or area of interest, multiplied by 100%.

39
Step6ProcessingoutputinstatisticalprogrammeThe distance measurement fields that are added to the attribute table can be exported to a general statistical programme, such as SPSS, SAS, or the freely available R. This allows for deepened statistical explorations, for example relating a city’s green space accessibility to socioeconomic conditions or other social indicators and potential relation to health outcomes.
4.4SummaryoftheproposedindicatorThe indicator approach outlined above was developed in collaboration between WHO and several research institutes. Case studies to test the initially suggested definitions and analysis methods were performed in three middle‐sized European cities in the Netherlands, Lithuania, and Sweden. Based on these case studies and discussions and agreements by participants at a WHO expert meeting, the method described in this section and in Appendix 3 was established for defining public green space accessibility in the cities of the Member States of the WHO European Region.
Specific requirements and recommendations for the core indicator are as follows.
• Land use data are derived from Urban Atlas or equivalent database with classified GIS‐data of urban areas, including delineation of green spaces.
• Population data shall be obtained from local sources at finest spatial resolution possible, or from EU‐wide aggregated population density datasets.
• Urban green spaces are defined in accordance with the Urban Atlas definition of green urban areas and with a minimum size of 0.5 ha. It is recommended to perform additional analysis for a minimum green space size of 1.0 ha. The Urban Atlas definition will serve as a template for defining urban green spaces in other land use databases
• The maximum distance to the border of green spaces is 300 m, measured as linear distance.
• The GIS‐method is based on a proximity‐analysis, where the size of a city’s population living within a buffer zone of 300 m around green spaces of at least 0.5 ha is calculated. This provides a number for estimating the proportion of a city’s total population with recommended access to green spaces.
40
5.CONCLUSIONSUrban planners, managers and policy‐makers face conflicting demands to promote more compact cities with greater population density in order to create critical mass to support and justify public and private service provision, and, on the other hand, to provide green space and to improve urban ecosystem services. Built form may create difficult environments, with poor or turbulent airflows, heat island effects and increased surface water runoff. Increasing densification of cities may also result in removal or degradation of existing green space in ways that will be difficult to reverse. Loss and degradation of urban green space can contribute to the burden of disease exacerbating the effects of other adverse factors in the urban environment, such as inequalities, air pollution, noise, chronic stress and insufficient physical activity. Reducing the health risks as well as promoting health benefits of urban living requires stronger interactions and collaborations between urban planners and public health workers.
The informed work of landscape architects, planners and urban designers is important in contributing professional expertise to ensure that health benefits as well as environmental and economic co‐benefits of green spaces are maximized and future opportunities are not lost through short‐sighted urban development decisions.
The evidence shows that urban green space has health benefits, particularly for economically deprived communities, children, pregnant women and senior citizens. It is therefore essential that all populations have adequate access to green space, with particular priority placed on provision for disadvantaged communities. While details of urban green space design and management have to be sensitive to local geographical and cultural conditions, the need for green space and its value for health and well‐being is universal.
The importance of green spaces for health is recognized in the Parma Declaration (WHO 2010b) with a commitment “…to provide each child by 2020 with access to healthy and safe environments and settings of daily life in which they can walk and cycle to kindergartens and schools, and to green spaces in which to play and undertake physical activity”. Similar visions are expressed in the United Nations Sustainable Development Goal 11.7 and the WHO Action Plan for the implementation of the European Strategy for the Prevention and Control of Noncommunicable Diseases in 2012−2016 (WHO, 2012).
To put these visions into practice and make a green urban environment an asset for all populations, policy‐makers need to rely on objective and comparable measures and indicators reflecting urban green space provision across multiple communities and countries, and helping to identify areas where targeted interventions are necessary. The application of harmonized indicators to measure green space provision may also help to evaluate the effects of targeted policy interventions. Such indicators shall be evidence‐based, unanimously defined, and universally applicable across various populations and environmental conditions. The implementation of such indicators requires the development of harmonized definitions, data collection methods and analytical tool kits, which are suitable for local public health specialists and municipal agencies with limited experience in GIS data analysis.
This report summarized the existing evidence of health effects of urban green spaces to conclude that there are many public health benefits through diverse pathways, such as psychological relaxation and stress reduction, enhanced physical activity, and mitigation of exposure to air pollution, excessive heat, and noise as well as other harmful factors in the urban environment. These numerous benefits strongly outweigh potential detrimental effects of green spaces such as exposure to allergenic pollen and to infections carried by insect vectors. In addition, most detrimental effects are associated with poorly maintained green spaces; they can be reduced or prevented through proper planning, organization and maintenance of green urban areas.
41
The report also evaluated and compared previously developed indicators of green space availability, accessibility and usage from the point of view of their public health relevance and practical applicability. The report identifies urban green space indicators which are suitable for wide‐scale application in the European Region and proposes an indicator definition and data analysis tool kit for universal use. The proposed indicator is based on previous work conducted by WHO in selected countries. It involves measuring the proportion of city population living within 300 m of a green space with a defined minimum size. The indicator is intended for monitoring the implementation of Parma commitment “to provide each child… with access to… green spaces to play and undertake physical activity.”
The proposed indicator measures accessibility of green spaces of defined minimum sizes suitable for physical activity as well as mental relaxation. The available evidence suggests that there is also a need for small, local green spaces very close to where people live and spend their day, as well as large green spaces, offering formal provisions such as playing fields, and opportunities to experience contact with nature and relative solitude.
Further development and application of urban green space indicators that reflect various known mechanisms of beneficial health effects, such as viewing greenery, is warranted in order to provide city planners with broader information that can support the development of targeted interventions aimed at specific population subgroups.
A city of well‐connected, attractive green spaces that offer safe opportunities for urban residents for active mobility and sports as well as for stress recovery, recreation and social contact, is likely to be more resilient to extreme environmental events, such as heat waves (due to the mitigation of urban heat island effect) and extreme rainfall (due to reduced surface run‐off). Such a city is also likely to have healthier citizens, reducing demands on health services and contributing to a stronger economy.

42
6.LITERATUREAFONSO, E., LEMOINE, M., POULLE, M., RAVAT, M., ROMAND, S., THULLIEZ, P., VILLENA, I., AUBERT, D., RABILLOUD, M., RICHE, B. & GILOT‐FROMONT, E. 2008. Spatial distribution of soil contamination by Toxoplasma gondii in relation to cat defecation behaviour in an urban area. International Journal for Parasitology, 38, 1017‐1023.
AGAY‐SHAY, K., PELED, A., CRESPO, A. V., PERETZ, C., AMITAI, Y., LINN, S., FRIGER, M. & NIEUWENHUIJSEN, M. J. 2014. Green spaces and adverse pregnancy outcomes. Occupational & Environmental Medicine, 71, 562‐569.
ALCOCK, I., WHITE, M. P., WHEELER, B. W., FLEMING, L. E. & DEPLEDGE, M. H. 2014. Longitudinal effects on mental health of moving to greener and less green urban areas. Environmental Science & Technology, 48, 1247‐1255.
ALCOCK, I., WHITE, M. P., LOVELL, R., HIGGINS, S. L., OSBORNE, N. J., HUSK, K. & WHEELER, B. W. 2015. What accounts for ‘England’s green and pleasant land’? A panel data analysis of mental health and land cover types in rural England. Landscape and Urban Planning, 142, 38‐46.
ALMANZA, E., JERRETT, M., DUNTON, G., SETO, E. & ANN PENTZ, M. 2012. A study of community design, greenness, and physical activity in children using satellite, GPS and accelerometer data. Health & Place, 18, 46–54.
AMBIENTE ITALIA RESEARCH INSTITUTE. 2003. European Common Indicators: Towards a Local Sustainability Profile. Final Report. Milano, Italy. Available at: http://www.cityindicators.org/Deliverables/eci_final_report_12‐4‐2007‐1024955.pdf (accessed on 19 May 2016).
AMOLY, E., DADVAND, P., FORNS, J., LOPEZ‐VICENTE, M., BASAGANA, X., JULVEZ, J., ALVAREZ‐PEDREROL, M., NIEUWENHUIJSEN, M. J. & SUNYER, J. 2014. Green and blue spaces and behavioral development in Barcelona schoolchildren: the BREATHE project. Environmental Health Perspectives, 122, 1351‐1358.
ANDERSEN, Z. J., DE NAZELLE, A., MENDEZ, M. A., GARCIA‐AYMERICH, J., HERTEL, O., TJØNNELAND, A., OVERVAD, K., RAASCHOU‐NIELSEN, O. & NIEUWENHUIJSEN, M. J. 2015. A study of the combined effects of physical activity and air pollution on mortality in elderly urban residents: the Danish diet, cancer, and health cohort. Environmental Health Perspectives, 123, 557‐563.
ANNERSTEDT, M., ÖSTERGREN, P.‐O., BJORK, J., GRAHN, P., SKÄRBÄCK, E. & WÄHRBORG, P. 2012. Green qualities in the neighbourhood and mental health – results from a longitudinal cohort study in Southern Sweden. BMC Public Health, 12, 337.
ANNERSTEDT VAN DEN BOSCH, M. & DEPLEDGE, M. 2015. Healthy people with nature in mind. BMC Public Health, 15, 1232.
ANNERSTEDT VAN DEN BOSCH, M., MUDU, P., USCILA, V., BARRDAHL, M., KULINKINA, A., STAATSEN, B., SWART, W., KRUIZE, H., ZURLYTE, I. & EGOROV, A.I. 2016. Development of an urban green space indicator and the public health rationale. Scandinavian Journal of Public Health, 44, 159‐167.
ASPINALL, P., MAVROS, P., COYNE, R. & ROE, J. 2015. The urban brain: analysing outdoor physical activity with mobile EEG. British Journal of Sports Medicine, 49, 272‐276.

43
ASPINALL, P. A., THOMPSON, C. W., ALVES, S., SUGIYAMA, T., BRICE, R. & VICKERS, A. 2010. Preference and relative importance for environmental attributes of neighbourhood open space in older people. Environment and Planning B: Planning and Design, 37, 1022‐1039.
ASTELL‐BURT, T., FENG, X. & KOLT, G. S. 2013. Does access to neighbourhood green space promote a healthy duration of sleep? Novel findings from a cross‐sectional study of 259 319 Australians. British Medical Journal Open, 3.
ASTELL‐BURT, T., FENG, X. & KOLT, G. S. 2014a. Is neighborhood green space associated with a lower risk of type 2 diabetes? Evidence from 267,072 Australians. Diabetes Care, 37, 197‐201.
ASTELL‐BURT, T., FENG, X. & KOLT, G. S. 2014b. Neighbourhood green space and the odds of having skin cancer: multilevel evidence of survey data from 267072 Australians. Journal of Epidemiology & Community Health, 68, 370‐374.
BALL, D. J. 2004. Policy issues and risk‐benefit trade‐offs of ‘safer surfacing’ for children’s playgrounds. Accident Analysis & Prevention, 36, 661‐670.
BALSEVICIENE, B., SINKARIOVA, L., GRAZULEVICIENE, R., ANDRUSAITYTE, S., UZDANAVICIUTE, I., DEDELE, A. & NIEUWENHUIJSEN, M. 2014. Impact of residential greenness on preschoolchildren’s emotional and behavioral problems. International Journal of Environmental Research and Public Health, 11, 6757.
BARÓ, F., CHAPARRO, L., GÓMEZ‐BAGGETHUN, E., LANGEMEYER, J., NOWAK, D. J. & TERRADAS, J. 2014. Contribution of ecosystem services to air quality and climate change mitigation policies: the case of urban forests in Barcelona, Spain. AMBIO, 43, 466‐479.
BARTON, J. & PRETTY, J. 2010. What is the best dose of nature and green exercise for improving mental health? A Multi‐Study Analysis. Environmental Science & Technology, 44, 3947‐3955.
BASAGAÑA, X., SARTINI, C., BARRERA‐GÓMEZ, J., DADVAND, P., CUNILLERA, J., OSTRO, B., SUNYER, J. & MEDINA‐RAMÒN, M. 2011. Heat waves and cause‐specific mortality at all ages. Epidemiology, 2, 765‐772.
BEDIMO‐RUNG, A. L., MOWEN, A. J. & COHEN, D. A. 2005. The significance of parks to physical activity and public health: a conceptual model. American Journal of Preventive Medicine, 28, 159‐168.
BEIL, K. & HANES, D. 2013. The influence of urban natural and built environments on physiological and psychological measures of stress—a pilot study. International Journal of Environmental Research & Public Health, 10, 1250‐1267.
BELL, J. F., WILSON, J. S. & LIU, G. C. 2008. Neighborhood greenness and 2‐year changes in body mass index of children and youth. American Journal of Preventive Medicine, 35, 547‐553.
BELL, S. L., PHOENIX, C., LOVELL, R. & WHEELER, B. W. 2014. Green space, health and wellbeing: making space for individual agency. Health & Place, 30, 287‐292.

44
BEYER, K. M., KALTENBACH, A., SZABO, A., BOGAR, S., NIETO, F. J. & MALECKI, K. M. 2014. Exposure to neighborhood green space and mental health: evidence from the survey of the health of Wisconsin. International Journal of Environmental Research & Public Health, 11, 3453‐72.
BJORK, J., ALBIN, M., GRAHN, P., JACOBSSON, H., ARDO, J., WADBRO, J., OSTERGREN, P.‐O. & SKARBACK, E. 2008. Recreational values of the natural environment in relation to neighbourhood satisfaction, physical activity, obesity and wellbeing. Journal of Epidemiology & Community Health, 62(4), e2‐e2.
BODICOAT, D.H., O’DONOVAN, G., DALTON, A.M., GRAY, L.J., YATES, T., EDWARDSON, C., HILL, S., WEBB, D.R., KHUNTI, K., DAVIES, M.J. & JONES, A.P. 2014. The association between neighbourhood greenspace and type 2 diabetes in a large cross‐sectional study. British Medical Journal Open, 4, e006076.
BODIN, M. & HARTIG, T. 2003. Does the outdoor environment matter for psychological restoration gained through running? Psychology of Sport and Exercise, 4, 141‐153.
BOGAR, S. & BEYER, K.M. 2015. Green space, violence, and crime: A systematic review. Trauma, Violence & Abuse, 17, 160‐171.
BOLDEMANN, C., BLENNOW, M., DAL, H., MÅRTENSSON, F., RAUSTORP, A., YUEN, K. & WESTER, U. 2006. Impact of preschool environment upon children’s physical activity and sun exposure. Preventive Medicine, 42, 301‐308.
BOLDEMANN, C., DAL, H., MÅRTENSSON, F., COSCO, N., MOORE, R., BLENNOW, M., PAGELS, P., RAUSTORP, A., WESTER, U. & SÖDERSTRÖM, M. 2011. Preschool outdoor play environment may combine promotion of children´s physical activity and sun protection: Further evidence from Southern Sweden and North Carolina. Science & Sports 26, 72‐82.
BOWLER, D. E., BUYUNG‐ALI, L., KNIGHT, T. M. & PULLIN, A. S. 2010a. Urban greening to cool towns and cities: A systematic review of the empirical evidence. Landscape and Urban Planning, 97, 147‐155.
BOWLER, D. E., BUYUNG‐ALI, L. M., KNIGHT, T. M. & PULLIN, A. S. 2010b. A systematic review of evidence for the added benefits to health of exposure to natural environments. BMC Public Health, 10, 456.
BRANAS, C. C., CHENEY, R. A., MACDONALD, J. M., TAM, V. W., JACKSON, T. D. & TEN HAVE, T. R. 2011. A difference‐in‐differences analysis of health, safety, and greening vacant urban space. American Journal of Epidemiology, 174, 1296‐1306.
BRATMAN, G.N., HAMILTON, J.P., HAHN, K.S., DAILY, G.C. & GROSS, J.J. 2015. Nature experience reduces rumination and subgenual prefrontal cortex activation. Proceedings of the National Academy of Sciences USA, 112, 8567‐8572.
BROEKHUIZEN, K., DE VRIES, S. & PIERIK, F. 2013. Healthy aging in a green living environment: a systematic review of the literature. TNO Leiden. Available at: https://www.tno.nl/media/1647/2013‐tno‐r10154‐healthy‐aging‐in‐a‐green‐living‐environment‐def‐samenvatting‐2.pdf (accessed on 19 May 2016).

45
BUSSE‐NIELSEN, A., ANNERSTEDT, M., MARUTHAVEERAN, S. & KONIJNENDIJK VAN DEN BOSCH, C. 2013. Species richness in urban parks and its drivers: A review of empirical evidence. Urban Ecosystems, 16.
CABE. 2010a. Urban green nation: Building the evidence base. London: Commission for Architecture and the Built Environment (CABE).
CABE. 2010b. Community Green: Using Local Spaces to Tackle Inequality and Improve Health. London: Commission for Architecture and the Built Environment (CABE).
CABE. 2004. The value of public space: how high quality parks and public spaces create economic, social and environmental value. London: Commission for Architecture and the Built Environment (CABE).
CALFAPIETRA, C., MORANI, A., SGRIGNA, G., DI GIOVANNI, S., MUZZINI, V., PALLOZZI, E., GUIDOLOTTI, G., NOWAK, D. & FARES, S. 2016. Removal of ozone by urban and peri‐urban forests: evidence from laboratory, field, and modeling approaches. Journal of Environmental Quality, 45, 224–233.
CARLISLE, A.J. & SHARP, N.C.C. 2001. Exercise and outdoor ambient air pollution. British Journal of Sports, 35, 214‐222.
CASTRO, D. C., SAMUELS, M. & HARMAN, A. E. 2013. Growing healthy kids: a community garden‐based obesity prevention program. American Journal of Preventive Medicine, 44, S193‐9.
CETATEANU, A. & JONES, A. 2014. Understanding the relationship between food environments, deprivation and childhood overweight and obesity: Evidence from a cross sectional England‐wide study. Health & Place, 27, 68‐76.
CHARREIRE, H., WEBER, C., CHAIX, B., SALZE, P., CASEY, R., BANOS, A., BADARIOTTI, D., KESSE‐GUYOT, E., HERCBERG, S. & SIMON, C. 2012. Identifying built environmental patterns using cluster analysis and GIS: Relationships with walking, cycling and body mass index in French adults. International Journal of Behavioral Nutrition and Physical Activity, 9, 59.
CHASTIN, S. F. M., FITZPATRICK, N., ANDREWS, M. & DICROCE, N. 2014. Determinants of sedentary behavior, motivation, barriers and strategies to reduce sitting time in older women: a qualitative investigation. International Journal of Environmental Research & Public Health, 11, 773‐791.
CHONG, S., LOBB, E., KHAN, R., ABU‐RAYYA, H., BYUN, R. & JALALUDIN, B. 2013. Neighbourhood safety and area deprivation modify the associations between parkland and psychological distress in Sydney, Australia. BMC Public Health, 13, 422.
CIANGA, N. & POPESCU, A.C. 2013. Green spaces and urban tourism development in Craiova municipality in Romania. European Journal of Geography, 4, 34‐45.
CLATWORTHY, J., HINDS J. M. & CAMIC, P. M. 2013. Gardening as a mental health intervention: a review. Mental Health Review Journal, 18, 214‐225.
COCHRANE, T., DAVEY, R. C., GIDLOW, C., SMITH, G. R., FAIRBURN, J., ARMITAGE, C. J., STEPHANSEN, H. & SPEIGHT, S. 2009. Small area and individual level predictors of physical activity in urban communities: A multi‐level study in Stoke‐on‐Trent, England. International Journal of Environmental Research and Public Health, 6, 654‐677.

46
COENSEL, B. D., VANWETSWINKEL, S. & BOTTELDOOREN, D. 2011. Effects of natural sounds on the perception of road traffic noise. The Journal of the Acoustical Society of America, 129, EL148‐EL153.
COOMBES, E., JONES, A. P. & HILLSDON, M. 2010. The relationship of physical activity and overweight to objectively measured green space accessibility and use. Social Science & Medicine, 70, 816‐822.
COUTTS, C., HORNER, M. & CHAPIN, T. 2010. Using geographical information system to model the effects of green space accessibility on mortality in Florida. Geocarto International, 25, 471‐484.
DADVAND, P., DE NAZELLE, A., TRIGUERO‐MAS, M., SCHEMBARI, A., CIRACH, M., AMOLY, E., FIGUERAS, F., BASAGANA, X., OSTRO, B. & NIEUWENHUIJSEN, M. 2012a. Surrounding greenness and exposure to air pollution during pregnancy: an analysis of personal monitoring data. Environmental Health Perspectives, 120, 1286‐1290.
DADVAND, P., SUNYER, J., BASAGANA, X., BALLESTER, F., LERTXUNDI, A., FERNANDEZ‐SOMOANO, A., ESTARLICH, M., GARCIA‐ESTEBAN, R., MENDEZ, M. A. & NIEUWENHUIJSEN, M. J. 2012b. Surrounding greenness and pregnancy outcomes in four Spanish birth cohorts. Environmental Health Perspectives, 120, 1481‐1487.
DADVAND, P., VILLANUEVA, C. M., FONT‐RIBERA, L., MARTINEZ, D., BASAGANA, X., BELMONTE, J., VRIJHEID, M., GRAZULEVICIENE, R., KOGEVINAS, M. & NIEUWENHUIJSEN, M. J. 2014a. Risks and benefits of green spaces for children: a cross‐sectional study of associations with sedentary behavior, obesity, asthma, and allergy. Environmental Health Perspectives, 122, 1329‐1335.
DADVAND, P., WRIGHT, J., MARTINEZ, D., BASAGAÑA, X., MCEACHAN, R. R. C., CIRACH, M., GIDLOW, C. J., DE HOOGH, K., GRAŽULEVIČIENĖ, R. & NIEUWENHUIJSEN, M. J. 2014b. Inequality, green spaces, and pregnant women: Roles of ethnicity and individual and neighbourhood socioeconomic status. Environment International, 71, 101‐108.
DADVAND, P., NIEUWENHUIJSEN, M. J., ESNAOLA, M., FORNS, J., BASAGANA, X., ALVAREZ‐PEDREROL, M., RIVAS, I., LOPEZ‐VICENTE, M., DE CASTRO PASCUAL, M., SU, J., JERRETT, M., QUEROL, X. & SUNYER, J. 2015. Green spaces and cognitive development in primary schoolchildren. Proceedings of the National Academy of Sciences USA, 112, 7937‐7942.
DALLIMER, M., IRVINE, K. N., SKINNER, A. M. J., DAVIES, Z. G., ROUQUETTE, J. R., MALTBY, L. L., WARREN, P. H., ARMSWORTH, P. R. & GASTON, K. J. 2012. Biodiversity and the Feel‐Good Factor: Understanding Associations between Self‐Reported Human Well‐being and Species Richness. Bioscience, 62, 47‐55.
DANEAULT, V., HÉBERT, M., ALBOUY, G., DOYON, J., DUMONT, M., CARRIER, J. & VANDEWALLE, G. 2014. Aging reduces the stimulating effect of blue light on cognitive brain functions. Sleep, 37, 85‐96.
DE JONG, K., ALBIN, M., SKÄRBÄCK, E., GRAHN, P. & BJÖRK, J. 2012. Perceived green qualities were associated with neighborhood satisfaction, physical activity, and general health: Results from a cross‐sectional study in suburban and rural Scania, southern Sweden. Health & Place, 18: 1374‐1380.
DE RUI, M., TOFFANELLO, E. D., VERONESE, N., ZAMBON, S., BOLZETTA, F., SARTORI, L., MUSACCHIO, E., CORTI, M. C., BAGGIO, G., CREPALDI, G., PERISSINOTTO, E., MANZATO, E. & SERGI, G. 2014.
47
Vitamin D deficiency and leisure time activities in the elderly: are all pastimes the same? PLoS One, 9, e94805.
DE VRIES, S. 2010. Nearby nature and human health: Looking at the mechanisms and their implications. In: WARD THOMPSON, C., ASPINALL, P. & BELL, S. (eds.) Innovative Approaches to Researching Landscape and Health. Abingdon: Routledge.
DE VRIES, S., VERHEIJ, R. A., GROENEWEGEN, P. P. & SPREEUWENBERG, P. 2003. Natural environments – healthy environments? An exploratory analysis of the relationship between greenspace and health. Environment and Planning A, 35, 1717‐1731.
DE VRIES, S., VAN DILLEN, S. M. E., GROENEWEGEN, P. P. & SPREEUWENBERG, P. 2013. Streetscape greenery and health: Stress, social cohesion and physical activity as mediators. Social Science and Medicine, 94, 26‐33.
DESPOMMIER, D. 2003. Toxocariasis: clinical aspects, epidemiology, medical ecology, and molecular aspects. Clinical Microbiology Reviews, 16, 265‐272.
DIETZ, T., GARDNER, G. T., GILLIGAN, J., STERN, P. C. & VANDENBERGH, M. P. 2009. Household actions can provide a behavioral wedge to rapidly reduce US carbon emissions. Proceedings of the National Academy of Sciences, 106, 18452‐18456.
DU, F., FENG, H. L., NIE, H., TU, P., ZHANG, Q. L., HU, M., ZHOU, Y. Q. & ZHAO, J. L. 2012. Survey on the contamination of Toxoplasma gondii oocysts in the soil of public parks of Wuhan, China. Veterinary Parasitology, 184, 2–4, 141–146.
DZHAMBOV A.M., DIMITROVA, D.D. & DIMITRAKOVA, E.D. 2014. Association between residential greenness and birth weight: Systematic review and meta‐analysis. Urban Forestry & Urban Greening 13, 621‐629.
EDWARDS, B., GRAY, M. & HUNTER, B. 2015. The Impact of Drought on Mental Health in Rural and Regional Australia. Social Indicators Research, 121, 177‐194.
EKKEL, E. D. & DE VRIES, S. 2017. Nearby green space and human health: Evaluating accessibility metrics. Landscape and Urban Planning, 157, 214‐220.
ELLIOTT, L. R., WHITE, M. P., TAYLOR, A. H. & HERBERT, S. 2015. Energy expenditure on recreational visits to different natural environments. Social Science & Medicine, 139, 53‐60.
ELMQVIST, T., SETÄLÄ, H., HANDEL, S. N., VAN DER PLOEG, S., ARONSON, J., BLIGNAUT, J. N., GÓMEZ‐BAGGETHUN, E., NOWAK, D. J., KRONENBERG, J. & DE GROOT, R. 2015. Benefits of restoring ecosystem services in urban areas. Current Opinion in Environmental Sustainability, 14, 101‐108.
EPSTEIN, L. H., RAJA, S., GOLD, S. S., PALUCH, R. A., PAK, Y. & ROEMMICH, J. N. 2006. Reducing Sedentary Behavior: The relationship between park area and the physical activity of youth. Psychological Science, 17, 654‐659
EUROPEAN CENTRE FOR DISEASE PREVENTION AND CONTROL. No date. Climate change [Online]. Available at: http://ecdc.europa.eu/en/healthtopics/climate_change/pages/index.aspx (accessed on 19 May 2016). EUROPEAN COMMISSION. 2011. Mapping guide for a European Urban Atlas. Available at: http://www.eea.europa.eu/data‐and‐maps/data/urban‐atlas (accessed on 19 May 2016).

48
EUROPEAN COMMISSION. 2013. Flash Eurobarometer 366: “Quality of life in Cities: Perception survey in 79 European cities”. Luxembourg: Publications Office of the European Union. Available at: http://ec.europa.eu/regional_policy/sources/docgener/studies/pdf/urban/survey2013_en.pdf (accessed on 19 May 2016).
EUROPEAN UNION. 2011. Mapping Guide for a European Urban Atlas. European Environment Agency, EEA, Copenhagen, Denmark.
EUROPEAN UNION. 2015. Towards an EU Research and Innovation policy agenda for Nature‐Based Solutions & Re‐Naturing Cities. Final Report of the Horizon 2020 Expert Group on ‘Nature‐Based Solutions and Re‐Naturing Cities’. Luxembourg: Directorate‐General for Research and Innovation.
FABER TAYLOR, A. F. & KUO, F. E. M. 2011. Could exposure to everyday green spaces help treat ADHD? Evidence from children’s play settings. Applied Psychology: Health and Well‐Bring, 3, 281‐303.
FABER TAYLOR, A. & KUO, F.E. 2006. “Is contact with nature important for healthy child development? State of the evidence”. In Children and their environments: learning, using and designing spaces, Edited by: Spencer, C. and Blades, M. 124–140. Cambridge: Cambridge University Press.
FERNANDEZ, A., BLACK, J., JONES, M., WILSON, L., SALVADOR‐CARULLA, L., ASTELL‐BURT, T. & BLACK, D. 2015. Flooding and mental health: a systematic mapping review. PLoS ONE, 10, e0119929. doi:10.1371/journal.pone.0119929.
FLOYD, M. F., SPENGLER, J. O., MADDOCK, J. E., GOBSTER, P. H. & SUAU, L. J. 2008. Park‐based physical activity in diverse communities of two U.S. cities. An observational study. American Journal of Preventive Medicine, 34, 299‐305.
FOSTER, C., HILLSDON, M. & THOROGOOD, M. 2004. Environmental perceptions and walking in English adults. Journal of Epidemiology & Community Health, 58, 924‐928.
FRANCIS, J., WOOD, L. J., KNUIMAN, M. & GILES‐CORTI, B. 2012. Quality or quantity? Exploring the relationship between Public Open Space attributes and mental health in Perth, Western Australia. Social Science & Medicine, 74, 1570‐1577.
FRANCIS, C.D., ORTEGA, C.P. & CRUZ, A. 2009. Noise pollution changes avian communities and species interactions. Current Biology, 19, 1415–1419.
FUERTES, E., MARKEVYCH, I., VON BERG, A., BAUER, C. P., BERDEL, D., KOLETZKO, S., SUGIRI, D. & HEINRICH, J. 2014. Greenness and allergies: evidence of differential associations in two areas in Germany. Journal of Epidemiology and Community Health, 68, 787‐790.
GALBRUN, L. & ALI, T. T. 2013. Acoustical and perceptual assessment of water sounds and their use over road traffic noise). The Journal of the Acoustical Society of America, 133, 227‐237.
GALLEGO, F. J. 2010. A population density grid of the European Union. Population and Environment, 31, 460‐473.
GARDSJORD, H. S., TVEIT, M. S. & NORDH, H. 2014. Promoting Youth’s Physical Activity through Park Design: Linking Theory and Practice in a Public Health Perspective. Landscape Research, 39, 70‐81.

49
GASCON, M., TRIGUERO‐MAS, M., MARTÍNEZ, D., DADVAND, P., ROJAS‐RUEDA, D., PLASÈNCIA, A. & NIEUWENHUIJSEN, M.J. 2016. Residential green spaces and mortality: a systematic review. Environment International, 86, 60‐67.
GASCON, M., TRIGUERO‐MAS, M., MARTINEZ, D., DADVAND, P., FORNS, J., PLASENCIA, A. & NIEUWENHUIJSEN, M. J. 2015. Mental health benefits of long‐term exposure to residential green and blue spaces: a systematic review. International Journal of Environmental Research and Public Health, 12, 4354‐4379.
GIDLÖF‐GUNNARSSON, A. & ÖHRSTRÖM, E. (2010). Attractive “Quiet” Courtyards: A Potential Modifier of Urban Residents’ Responses to Road Traffic Noise? International Journal of Environmental Research and Public Health, 7, 3359–3375.
GIDLOW, C. J., JONES, M. V., HURST, G., MASTERSON, D., CLARK‐CARTER, D., TARVAINEN, M. P., SMITH, G. & NIEUWENHUIJSEN, M. 2016a. Where to put your best foot forward: Psycho‐physiological responses to walking in natural and urban environments. Journal of Environmental Psychology, 45, 22–29.
GIDLOW, C. J., RANDALL, J., GILLMAN, J., SMITH, G.R. & JONES, M.V. 2016b. Natural environments and chronic stress measured by hair cortisol. Landscape and Urban Planning, 148, 61‐67.
GIDLOW, C. J., ELLIS, N. J. & BOSTOCK, S. 2012. Development of the Neighbourhood Green Space Tool (NGST). Landscape and Urban Planning, 106, 347‐358.
GILES‐CORTI, B., BROOMHALL, M. H., KNUIMAN, M., COLLINS, C., DOUGLAS, K., NG, K., LANGE, A. & DONOVAN, R. J. 2005. Increasing walking: how important is distance to, attractiveness, and size of public open space? American Journal of Preventive Medicine, 28, 169‐76.
GILES‐CORTI, B. & DONOVAN, R. J. 2003. Relative influences of individual, social environmental, and physical environmental correlates of walking. American Journal of Public Health, 93, 1583‐1589.
GILL S.E., HANDLEY J.F., ENNOS A.R. & PAULEIT S. 2007. Adapting cities for climate change: the role of the green infrastructure. Built Environment 33, 115‐133.
GILLIE, O. (Editor). 2005. Sunlight, Vitamin D and Health. Health Research Forum occasional reports no. 2, London, UK. Available at: http://www.stjornusol.is/hfj/images/stories/greinar/sunbook.pdf (accessed on 19 May 2016).
GONZÁLEZ‐OREJA, J. A., BONACHE‐REGIDOR, C. & DE LA FUENTE‐DÍAZ‐ORDAZ, A. A. 2010. Far from the noisy world? Modelling the relationships between park size, tree cover and noise levels in urban green spaces of the city of Puebla, Mexico. Interciencia, 35, 486‐492
GRAHN, P. & STIGSDOTTER, U. K. 2010. The relation between perceived sensory dimensions of urban green space and stress restoration. Landscape and Urban Planning, 94, 264‐275.
GRANT, M., BIRD, C. & MARNO, P. 2012. Health inequalities and determinants in the physical urban environment: Evidence briefing. Bristol: WHO Collaborating Centre for Healthy Urban Environments, University of the West of England.

50
GRAZULEVICIENE, R., DANILEVICIUTE, A., DEDELE, A., VENCLOVIENE, J., ANDRUSAITYTE, S., UZDANAVICIUTE, I. & NIEUWENHUIJSEN, M. J. 2015a. Surrounding greenness, proximity to city parks and pregnancy outcomes in Kaunas cohort study. International Journal of Hygiene and Environmental Health, 218, 358‐365.
GRAZULEVICIENE, R., VENCLOVIENE, J., KUBILIUS, R., GRIZAS, V., DEDELE, A., GRAZULEVICIUS, T., CEPONIENE, I., TAMULEVICIUTE‐PRASCIENE, E., NIEUWENHUIJSEN, M. J., JONES, M. & GIDLOW, C. 2015b. The Effect of Park and Urban Environments on Coronary Artery Disease Patients: A Randomized Trial. BioMed Research International, 2015, 9.
GRAZULEVICIENE, R., DEDELE, A., DANILEVICIUTE, A., VENCLOVIENE, J., GRAZULEVICIUS, T., ANDRUSAITYTE, S., UZDANAVICIUTE, I. & NIEUWENHUIJSEN, M.J. 2014. The Influence of Proximity to City Parks on Blood Pressure in Early Pregnancy. International Journal of Environmental Research and Public Health, 11, 2958‐2972
GRIGSBY‐TOUSSAINT, D. S., TURI, K. N., KRUPA, M., WILLIAMS, N. J., PANDI‐PERUMAL, S. K. & JEAN‐LOUIS, G. 2015. Sleep insufficiency and the natural environment: Results from the US Behavioral Risk Factor Surveillance System Survey. Preventive Medicine, 78, 78‐84.
GROENEWEGEN, P. P., VAN DEN BERG, A. E., DE VRIES, S. & VERHEIJ, R. A. 2006. Vitamin G: effects of green space on health, well‐being, and social safety. BMC Public Health, 6, 149.
GROENEWEGEN, P. P., VAN DEN BERG, A. E., MAAS, J., VERHEIJ, R. A. & DE VRIES, S. 2012. Is a Green Residential Environment Better for Health? If So, Why? Annals of the Association of American Geographers, 102, 996‐1003.
GROFF, E. & MCCORD, E. S. 2012. The role of neighborhood parks as crime generators. Security Journal, 25, 1‐24.
GUYTON, K. Z., LOOMIS, D., GROSSE, Y., EL GHISSASSI, F., BENBRAHIM‐TALLAA, L., GUHA, N., SCOCCIANTI, C., MATTOCK, H. & STRAIF, K. 2015. Carcinogenicity of tetrachlorvinphos, parathion, malathion, diazinon, and glyphosate. The Lancet Oncology, 16, 490‐491.
HARLAN, S. L., BRAZEL, A. J., PRASHAD, L., STEFANOV, W. L. & LARSEN, L. 2006. Neighborhood microclimates and vulnerability to heat stress. Social Science & Medicine, 63, 2847‐63.
HARTIG, T. 2007. Three steps to understanding restorative environments as health resources. In: THOMPSON, C. W. & TRAVLOU, P. (eds.) Open Space: People Space. Abingdon: Taylor & Francis.
HARTIG, T., EVANS, G. W., JAMNER, L. D., DAVIS, D. S. & GÄRLING, T. 2003. Tracking restoration in natural and urban field settings. Journal of Environmental Psychology, 23, 109‐123.
HARTIG, T., MANG, M. & EVANS, G. W. 1991. Restorative Effects of Natural Environment Experiences. Environment and Behavior, 23, 3‐26.
HARTIG, T., MITCHELL, R., DE VRIES, S. & FRUMKIN, H. 2014. Nature and Health. Annual Review of Public Health, 35, 207‐228.

51
HARVEY, J. A., CHASTIN, S. F. M. & SKELTON, D. A. 2013. Prevalence of sedentary behavior in older adults: A systematic review. International Journal of Environmental Research and Public Health, 10, 6645‐6661.
HILLSDON, M., PANTER, J., FOSTER, C. & JONES, A. 2006. The relationship between access and quality of urban green space with population physical activity. Public Health, 120, 1127‐1132.
HOLTAN, M. T., DIETERLEN, S. L. & SULLIVAN, W. C. 2015. Social life under cover: Tree canopy and social capital in Baltimore, Maryland. Environment and Behavior, 47, 502‐525.
HONOLD, J., LAKES, T., BEYER, R. & VAN DER MEER, E. 2016. Restoration in urban spaces: Nature views from home, greenways, and public parks. Environment and Behavior, 48: 796‐825.
HU, Z., LIEBENS, J. & RAO, K. R. 2008. Linking stroke mortality with air pollution, income, and greenness in northwest Florida: an ecological geographical study. International Journal of Health Geographics, 7, 20.
HUDDART, L. 1990. The use of vegetation for traffic noise screening. Department of Transport, Vehicles and Environment Division, Vehicle Group, Transport and Road Research Laboratory. Crowthorne, United Kingdom.
HYSTAD, P., DAVIES, H. W., FRANK, L., VAN LOON, J., GEHRING, U., TAMBURIC, L. & BRAUER, M. 2014. Residential greenness and birth outcomes: evaluating the influence of spatially correlated built‐environment factors. Environmental Health Perspectives, 122, 1095‐102.
IARC. 2015. Some Organophosphate Insecticides and Herbicides: Diazinon, Glyphosate, Malathion, Parathion, and Tetrachlorvinphos. IARC Monograph Vol. 112. International Agency for Research on Cancer. Lyon, France. Available at: http://monographs.iarc.fr/ENG/Monographs/vol112/index.php (accessed on 19 May 2016).
IRVINE, K. N., DEVINE‐WRIGHT, P., PAYNE, S. R., FULLER, R. A., PAINTER, B. & GASTON, K. J. 2009. Green space, soundscape and urban sustainability: An interdisciplinary, empirical study. Local Environment, 14, 155‐172
JAMES, P., BANAY, R.F., HART, J.E. & LADEN, F. 2015. A review of the health benefits of greenness. Current Epidemiology Reports, 2, 131‐142.
JENERETTE, G. D., HARLAN, S. L., STEFANOV, W. L. & MARTIN, C. A. 2011. Ecosystem services and urban heat riskscape moderation: water, green spaces, and social inequality in Phoenix, USA. Ecological Applications, 21, 2637‐2651.
JIANG, B., CHANG, C.‐Y. & SULLIVAN, W. C. 2014a. A dose of nature: Tree cover, stress reduction, and gender differences. Landscape and Urban Planning, 132, 26‐36.
JIANG, B., LI, D., LARSEN, L. & SULLIVAN, W. C. 2014b. A dose‐response curve describing the relationship between urban tree cover density and self‐reported stress recovery. Environment and Behavior, 48, 607‐629.
JIN, S.J., GUO, J.K., WHEELER, S., KAN, L.Y. & CHE S.Q. 2014. Evaluation of impacts of trees on PM2.5

52
dispersion in urban streets. Atmospheric Environment, 99, 277–287.
JORGENSEN, A. & GOBSTER, P. H. 2010. Shades of Green: Measuring the ecology of urban green space in the context of human health and well‐being. Nature + Culture, 5, 338‐363.
KACZYNSKI, A. T. & HENDERSON, K. A. 2007. Environmental correlates of physical activity: A review of evidence about parks and recreation. Leisure Sciences, 29, 315‐354.
KACZYNSKI, A. T. & HENDERSON, K. A. 2008. Parks and recreation settings and active living: a review of associations with physical activity function and intensity. Journal of Physical Activity & Health, 5, 619.
KACZYNSKI, A. T., POTWARKA, L. R. & SAELENS, B. E. 2008. Association of park size, distance, and features with physical activity in neighborhood parks. American Journal of Public Health, 98, 1451‐1456.
KAPLAN, R. & KAPLAN, S. 1989. The experience of nature: A psychological perspective, Cambridge University Press.
KAPLAN, R. & KAPLAN, S. 2011. Well‐being, Reasonableness, and the Natural Environment. Applied Psychology: Health and Well‐Being, 3, 304‐321.
KAPLAN, S. 1995. The restorative benefits of nature: Toward an integrative framework. Journal of environmental psychology, 15, 169‐182.
KAPLAN S. 2001. Meditation, Restoration, and the Management of Mental Fatigue. Environment and Behavior, 33, 480‐506.
KEDDEM, S., BARG, F. K., GLANZ, K., JACKSON, T., GREEN, S. & GEORGE, M. 2015. Mapping the urban asthma experience: Using qualitative GIS to understand contextual factors affecting asthma control. Social Science & Medicine, 140, 9‐17.
KENDRICK, D., MULVANEY, C., BURTON, P. & WATSON, M. 2005. Relationships between child, family and neighbourhood characteristics and childhood injury: a cohort study. Social Science & Medicine, 61, 1905‐15.
KIM, J. & KAPLAN, R. 2004. Physical and psychological factors in sense of community: new urbanist kentlands and nearby orchard village. Environment and Behavior, 36, 313‐340.
KOHANSIEH, M. & MAKARYUS, A.N. 2015. Sleep deficiency and deprivation leading to cardiovascular disease. International Journal of Hypertension, Article ID 615681, 5 pp.
KOLLMUSS, A. & AGYEMAN, J. 2002. Mind the Gap: Why do people act environmentally and what are the barriers to pro‐environmental behavior? Environmental Education Research, 8, 239‐260.
KPMG. 2012a. The Economics of Ecosystems and Biodiversity for Business –The Netherlands. Ministry of Economic Affairs, Agriculture and Innovation, The Netherlands.
KPMG. 2012b. Green, healthy and productive, The Economics of Ecosystems and Biodiversity (TEEB NL), Green space and health. Ministry of Economic Affairs, Agriculture and Innovation, The Netherlands.

53
KRENICHYN, K. 2006. “The only place to go and be in the city”: women talk about exercise, being outdoors and the meanings of a large urban park. Health & Place, 12, 631–643.
KUO, F. E. 2001. Coping with Poverty: Impacts of Environment and Attention in the Inner City. Environment and Behavior, 33, 5‐34.
KUO M. 2015. How might contact with nature promote human health? Promising mechanisms and a possible central pathway. Frontiers of Psychology, 25, 1093.
KUO, F. E., BACAICOA, M. & SULLIVAN, W. C. 1998. Transforming Inner‐City Landscapes: Trees, Sense of Safety, and Preference. Environment and Behavior, 30, 28‐59.
KUO, F. E. & SULLIVAN, W. C. 2001. Aggression and Violence in the Inner City: Effects of Environment via Mental Fatigue. Environment and Behavior, 33, 543‐571.
KWEON, B.‐S., SULLIVAN, W. C. & WILEY, A. R. 1998. Green common spaces and the social integration of inner‐city older adults. Environment and Behavior, 30, 832‐858.
LACHOWYCZ, K. & JONES, A. P. 2011. Greenspace and obesity: a systematic review of the evidence. Obesity Reviews, 12, e183‐e189.
LACHOWYCZ, K. & JONES, A. P. 2013. Towards a better understanding of the relationship between greenspace and health: Development of a theoretical framework. Landscape and Urban Planning, 118, 62‐69.
LACHOWYCZ, K. & JONES, A. P. 2014. Does walking explain associations between access to greenspace and lower mortality? Social Science & Medicine, 107, 9‐17.
LACHOWYCZ, K., JONES, A. P., PAGE, A. S., WHEELER, B. W. & COOPER, A. R. 2012. What can global positioning systems tell us about the contribution of different types of urban greenspace to children’s physical activity? Health & Place, 18, 586‐594.
LAFORTEZZA, R., CARRUS, G., SANESI, G. & DAVIES, C. 2009. Benefits and well‐being perceived by people visiting green spaces in periods of heat stress. Urban Forestry & Urban Greening, 8, 97‐108.
LAOSEE, O.C., GILCHRIST, J. & RUDD, R. 2012. Drowning – Unites States, 2005‐2009. Morbidity and Mortality Weekly Report, 61, 344‐347. Available at: http://www.cdc.gov/mmwr/preview/mmwrhtml/mm6119a4.htm (accessed on 19 May 2016).
LAURENT, O., WU, J., LI, L. & MILESI, C. 2013. Green spaces and pregnancy outcomes in Southern California. Health & Place, 24, 190‐195.
LEE, J., PARK, B.‐J., TSUNETSUGU, Y., OHIRA, T., KAGAWA, T. & MIYAZAKI, Y. 2011. Effect of forest bathing on physiological and psychological responses in young Japanese male subjects. Public Health, 125, 93‐100.
LENGEN, C. & KISTEMANN, T. 2012. Sense of place and place identity: review of neuroscientific evidence. Health & Place, 18, 1162‐1171.
LIU, D., FERNANDEZ, B.O., HAMILTON, A., LANG, N.N., GALLAGHER, J.M., NEWBY, D.E., FEELISCH, M. & WELLER, R.B. 2014. UVA irradiation of human skin vasodilates arterial vasculature and lowers

54
blood pressure independently of nitric oxide synthase. Journal of Investigative Dermatology, 134, 1839‐1846.
LI, Q., MORIMOTO, K., KOBAYASHI, M., INAGAKI, H., KATSUMATA, M., HIRATA, Y., HIRATA, K., SUZUKI, H., LI, Y. & WAKAYAMA, Y. 2008. Visiting a forest, but not a city, increases human natural killer activity and expression of anti‐cancer proteins. International Journal of Immunopathology and Pharmacology, 21, 117‐127.
LIU, C. & LI, X. 2012. Carbon storage and sequestration by urban forests in Shenyang, China. Urban Forestry & Urban Greening, 11, 121‐128.
LOHMUS M & BALBUS J. 2015. Making green infrastructure healthier infrastructure. Infection Ecology and Epidemiology 5: 30082
LOVASI, G. S., O’NEIL‐DUNNE, J. P., LU, J. W., SHEEHAN, D., PERZANOWSKI, M. S., MACFADEN, S. W., KING, K. L., MATTE, T., MILLER, R. L., HOEPNER, L. A., PERERA, F. P. & RUNDLE, A. 2013. Urban tree canopy and asthma, wheeze, rhinitis, and allergic sensitization to tree pollen in a New York City birth cohort. Environmental Health Perspectives, 121, 494‐500.
LOVASI, G. S., QUINN, J. W., NECKERMAN, K. M., PERZANOWSKI, M. S. & RUNDLE, A. 2008. Children living in areas with more street trees have lower asthma prevalence. Journal of Epidemiology and Community Health, 62, 647‐649.
LOVELL, R., WHEELER, B. W., HIGGINS, S. L., IRVINE, K. N. & DEPLEDGE, M. H. 2014. A Systematic Review of the Health and Well‐Being Benefits of Biodiverse Environments. Journal of Toxicology and Environmental Health, Part B, 17, 1‐20.
LRTAP Working Group on Effects (2013). Benefits of air pollution control for biodiversity and ecosystem services. Long‐range Transboundary Air Pollution (LRTAP) Working Group on Effects. Available at: http://www.syke.fi/download/noname/%7B62B1FBA0‐3047‐4985‐8353‐ACD85678A617%7D/75996 (accessed on 19 May 2016).
LYNCH, S. V., WOOD, R. A., BOUSHEY, H., BACHARIER, L. B., BLOOMBERG, G. R., KATTAN, M., O’CONNOR, G. T., SANDEL, M. T., CALATRONI, A., MATSUI, E., JOHNSON, C. C., LYNN, H., VISNESS, C. M., JAFFEE, K. F., GERGEN, P. J., GOLD, D. R., WRIGHT, R. J., FUJIMURA, K., RAUCH, M., BUSSE, W. W. & GERN, J. E. 2014. Effects of early‐life exposure to allergens and bacteria on recurrent wheeze and atopy in urban children. Journal of Allergy and Clinical Immunology, 134, 593‐601.e12.
MAAS, J., VAN DILLEN, S. M. E., VERHEIJ, R. A. & GROENEWEGEN, P. P. 2009a. Social contacts as a possible mechanism behind the relation between green space and health. Health & Place, 15, 586‐595.
MAAS, J., VERHEIJ, R. A., DE VRIES, S., SPREEUWENBERG, P., SCHELLEVIS, F. G. & GROENEWEGEN, P. P. 2009b. Morbidity is related to a green living environment. Journal of Epidemiology and Community Health, 63, 967‐973.
55
MACINTYRE, S., MACDONALD, L. & ELLAWAY, A. 2008. Lack of agreement between measured and self‐reported distance from public green parks in Glasgow, Scotland. International Journal of Behavioral Nutrition and Physical Activity, 5, 26.
MADUREIRA, H., NUNES, F., OLIVEIRA, J. V., CORMIER, L. & MADUREIRA, T. 2015. Urban residents’ beliefs concerning green space benefits in four cities in France and Portugal. Urban Forestry & Urban Greening, 14, 56‐64.
MANES, F., INCERTI, G., SALVATORI, E., VITALE, M., RICOTTA, C. & COSTANZA, R. 2012. Urban ecosystem services: tree diversity and stability of tropospheric ozone removal. Ecological Applications, 22, 349–360.
MARKEVYCH, I., FUERTES, E., TIESLER, C.M., BIRK, M., BAUER, C.P., KOLETZKO, S., VON BERG, A., BERDEL, D. & HEINRICH, J. 2014. Surrounding greenness and birth weight: results from the GINIplus and LISAplus birth cohorts in Munich. Health & Place, 26, 39‐46.
MARSELLE, M.R., IRVINE, K.N. & WARBER, S.L. 2013. Walking for well‐being: are group walks in certain types of natural environments better for well‐being than group walks in urban environments? International Journal of Environmental Research and Public Health, 10, 5603‐5628.
MCCORMACK, G. R., ROCK, M., TOOHEY, A. M. & HIGNELL, D. 2010. Characteristics of urban parks associated with park use and physical activity: a review of qualitative research. Health & Place, 16, 712‐726.
MCEACHAN, R.R., PRADY, S.L., SMITH, G., FAIRLEY, L., CABIESES, B., GIDLOW, C., WRIGHT, J., DADVAND, P., VAN GENT, D. & NIEUWENHUIJSEN, M.J. 2016. The association between green space and depressive symptoms in pregnant women: moderating roles of socioeconomic status and physical activity. Journal of Epidemiology and Community Health, 70, 253‐259.
MEDLOCK, J. M. & LEACH, S. A. 2015. Effect of climate change on vector‐borne disease risk in the United Kingdom. The Lancet Infectious Diseases, 15, 721‐730.
MILLER, M. A. 2015. The Role of Sleep and Sleep Disorders in the Development, Diagnosis, and Management of Neurocognitive Disorders. Frontiers in Neurology, 6, 224.
MITCHELL, R. 2013. Is physical activity in natural environments better for mental health than physical activity in other environments? Social Science and Medicine, 91, 130‐134.
MITCHELL, R., ASTELL‐BURT, T. & RICHARDSON, E. A. 2011. A comparison of green space indicators for epidemiological research. Journal of Epidemiology and Community Health, 65, 853‐858.
MITCHELL, R. & POPHAM, F. 2007. Greenspace, urbanity and health: relationships in England. Journal of Epidemiology and Community Health, 61, 681‐683.
MITCHELL, R. & POPHAM, F. 2008. Effect of exposure to natural environment on health inequalities: an observational population study. Lancet, 372, 1655‐1560.
MITCHELL, R. J., RICHARDSON, E. A., SHORTT, N. K. & PEARCE, J. R. 2015. Neighborhood Environments and Socioeconomic Inequalities in Mental Well‐Being. American Journal of Preventive Medicine, 49, 80‐84.

56
SHORTT, N. K., RIND, E., PEARCE, J. & MITCHELL, R. 2014. Integrating environmental justice and socioecological models of health to understand population‐level physical activity. Environment and Planning A, 46, 1479–1495.
MYNENI, R. B. & HALL, F. G. 1995. The interpretation of spectral vegetation indexes. Geoscience and Remote Sensing, IEEE Transactions on, 33, 481‐486.
MYTTON, O. T., TOWNSEND, N., RUTTER, H. & FOSTER, C. 2012. Green space and physical activity: An observational study using Health Survey for England data. Health & Place, 18, 1034‐1041.
NAESS, O., PIRO, F. N., NAFSTAD, P., SMITH, G. D. & LEYLAND, A. H. 2007. Air pollution, social deprivation, and mortality: a multilevel cohort study. Epidemiology, 18, 686‐94.
NATIONAL CAPITAL POISON CENTRE. No date. Poison Statistics, National Data 2013 [Online]. Available at: http://www.poison.org/poison‐statistics‐national (accessed on 19 May 2016).
NATURAL ENGLAND 2010a. Nature nearby: Accessible Natural Greenspace Guidance. Sheffield: Natural England.
NATURAL ENGLAND 2010b. Wild Adventure Space: Its Role in Teenagers’ Lives. Natural England Commissioned Report NECR025.
NIEMINEN, T., MARTELIN, T., KOSKINEN, S., ARO, H., ALANEN, E. & HYYPPÄ, M. 2010. Social capital as a determinant of self‐rated health and psychological well‐being. International Journal of Public Health, 55, 531‐542.
NIEUWENHUIJSEN, M. J. 2015. Exposure assessment in environmental epidemiology, Oxford; New York, Oxford University Press.
NORDH, H., HARTIG, T., HAGERHALL, C. M. & FRY, G. 2009. Components of small urban parks that predict the possibility for restoration. Urban Forestry and Urban Greening, 8, 225‐235.
NOWAK, D. J., CRANE, D. E. & STEVENS, J. C. 2006. Air pollution removal by urban trees and shrubs in the United States. Urban Forestry and Urban Greening, 4, 115‐123.
NOWAK, D. J., GREENFIELD, E. J., HOEHN, R. E. & LAPOINT, E. 2013. Carbon storage and sequestration by trees in urban and community areas of the United States. Environmental Pollution, 178, 229–236.
ORESKOVIC, N. M., PERRIN, J. M., ROBINSON, A. I., LOCASCIO, J. J., BLOSSOM, J., CHEN, M. L., WINICKOFF, J. P., FIELD, A. E., GREEN, C. & GOODMAN, E. 2015. Adolescents’ use of the built environment for physical activity. BMC Public Health, 15, 251.
OTTOSSON, J. & GRAHN, P. 2005. A comparison of leisure time spent in a garden with leisure time spent indoors: on measures of restoration in residents in geriatric care. Landscape Research, 30, 23‐55.
OWEN, N., HEALY, G. N., MATTHEWS, C. E. & DUNSTAN, D. W. 2010. Too much sitting: the population‐health science of sedentary behavior. Exercise and Sport Sciences Reviews, 38, 105‐113.

57
PANTELL, M., REHKOPF, D., JUTTE, D., SYME, S. L., BALMES, J. & ADLER, N. 2013. Social Isolation: A Predictor of Mortality Comparable to Traditional Clinical Risk Factors. American Journal of Public Health, 103, 2056–2062.
PARK, B.‐J., TSUNETSUGU, Y., KASETANI, T., HIRANO, H., KAGAWA, T., SATO, M. & MIYAZAKI, Y. 2007. Physiological effects of Shinrin‐yoku (taking in the atmosphere of the forest)‐using salivary cortisol and cerebral activity as indicators. Journal of Physiological Anthropology, 26, 123‐128.
PATHAK, V., TRIPATHI, B. D. & MISHRA, V. K. 2008. Dynamics of traffic noise in a tropical city Varanasi and its abatement through vegetation. Environmental Monitoring and Assessment, 146, 67‐75.
PEREIRA, G., FOSTER, S., MARTIN, K., CHRISTIAN, H., BORUFF, B. J., KNUIMAN, M. & GILES‐CORTI, B. 2012. The association between neighborhood greenness and cardiovascular disease: an observational study. BMC Public Health, 12, 466‐466.
PETTORELLI, N., VIK, J. O., MYSTERUD, A., GAILLARD, J.‐M., TUCKER, C. J. & STENSETH, N. C. 2005. Using the satellite‐derived NDVI to assess ecological responses to environmental change. Trends in Ecology & Evolution, 20, 503‐510.
PICKARD, B.R., DANIEL, J., MEHAFFEY, M., JACKSON, L.E. & NEALE, A. 2015. EnviroAtlas: A new geospatial tool to foster ecosystem services science and resource management. Ecosystem Services, 14, 45–55.
POPE, D., TISDALL, R., MIDDLETON, J., VERMA, A., VAN AMEIJDEN, E., BIRT, C. & BRUCE, N. G. 2015. Quality of and access to green space in relation to psychological distress: results from a population‐based cross‐sectional study as part of the EURO‐URHIS 2 project. European Journal of Public Health pii: ckv094 [Epub ahead of print].
REKLAITIENE, R., GRAZULEVICIENE, R., DEDELE, A., VIRVICIUTE, D., VENSLOVIENE, J., TAMOSIUNAS, A., BACEVICIENE, M., LUKSIENE, D., SAPRANAVICIUTE‐ZABAZLAJEVA, L., RADISAUSKAS, R., BERNOTIENE, G., BOBAK, M. & NIEUWENHUIJSEN, M.J. 2014. The relationship of green space, depressive symptoms and perceived general health in urban population. Scandinavian Journal of Public Health, 42, 669‐676.
RICHARDSON, E. A., MITCHELL, R., HARTIG, T., DE VRIES, S., ASTELL‐BURT, T. & FRUMKIN, H. 2012. Green cities and health: a question of scale? Journal of Epidemiology and Community Health, 66, 160‐165.
ROBERTSON, L. B., WARD THOMPSON, C., ASPINALL, P., MILLINGTON, C., MCADAM, C. & MUTRIE, N. 2012. The influence of the local neighbourhood environment on walking levels during the walking for wellbeing in the West: Pedometer‐based community intervention. Journal of Environmental and Public Health, 2012, 974786.
ROE, J. & ASPINALL, P. 2011. The restorative benefits of walking in urban and rural settings in adults with good and poor mental health. Health & Place 17, 103‐113.
ROE, J. J., ASPINALL, P. A., WARD THOMPSON, C. 2016. Understanding Relationships between Health, Ethnicity, Place and the Role of Urban Green Space in Deprived Urban Communities. Int. J. Environ. Res. Public Health, 13, 681.

58
ROE, J. J., THOMPSON, C. W., ASPINALL, P. A., BREWER, M. J., DUFF, E. I., MILLER, D., MITCHELL, R. & CLOW, A. 2013. Green space and stress: Evidence from cortisol measures in deprived urban communities. International Journal of Environmental Research and Public Health, 10, 4086‐4103.
ROOK, G. 2013. Regulation of the immune system by biodiversity from the natural environment: An ecosystem service essential to health. Proceedings of the National Academy of Sciences USA, 110, 18360‐18367.
ROSENBERG, D., DING, D., SALLIS, J. F., KERR, J., NORMAN, G. J., DURANT, N., HARRIS, S. K. & SAELENS, B. E. 2009. Neighborhood Environment Walkability Scale for Youth (NEWS‐Y): reliability and relationship with physical activity. Preventive Medicine, 49, 213‐218.
SARKAR, C., WEBSTER, C., PRYOR, M., TANG, D., MELBOURNE, S., ZHANG, X. & JIANZHENG, L. 2015. Exploring associations between urban green, street design and walking: Results from the Greater London boroughs. Landscape and Urban Planning, 143, 112‐125.
SCHIPPERIJN, J., BENTSEN, P., TROELSEN, J., TOFTAGER, M. & STIGSDOTTER, U. K. 2013. Associations between physical activity and characteristics of urban green space. Urban Forestry & Urban Greening, 12, 109‐116.
SCHMID, S.M., HALLSCHMID, M. & SCHULTES, B. 2015. The metabolic burden of sleep loss. The Lancet Diabetes and Endocrinology, 3, 52‐62.
SCHUYLER, D. 1988. The New Urban Landscape: The Redefinition of City Form in Nineteenth‐Century America. Johns Hopkins University Press, Baltimore, MD, United States.
SCOTTISH GOVERNMENT 2016. National Walking Strategy Overview. Paths for All on behalf of the National Walking Strategy Delivery Forum, Edinburgh: Scottish Government.
SEELAND, K., DÜBENDORFER, S. & HANSMANN, R. 2009. Making friends in Zurich’s urban forests and parks: The role of public green space for social inclusion of youths from different cultures. Forest Policy and Economics, 11, 10‐17.
SHISEGAR, N. 2014. The impact of green areas on mitigating urban heat island effect: A review. International Journal of Environmental Sustainability, 9, 119‐130.
SHORES, K. A. & WEST, S. T. 2010. Rural and urban park visits and park‐based physical activity. Preventive Medicine, 50 Suppl 1, S13‐S17.
SHORTT, N. K., RIND, E., PEARCE, J. & MITCHELL, R. 2014. Integrating environmental justice and socioecological models of health to understand population‐level physical activity. Environment and Planning A, 46, 1479–1495.
SMARGIASSI, A., GOLDBERG, M. S., PLANTE, C., FOURNIER, M., BAUDOUIN, Y. & KOSATSKY, T. 2009. Variation of daily warm season mortality as a function of micro‐urban heat islands. Journal of Epidemiology and Community Health, 63, 659‐664.
SREETHERAN, M. & VAN DEN BOSCH, C. C. K. 2014. A socio‐ecological exploration of fear of crime in urban green spaces – A systematic review. Urban Forestry & Urban Greening, 13, 1‐18.

59
STEPTOE, A., SHANKAR, A., DEMAKAKOS, P. & WARDLE, J. 2013. Social isolation, loneliness, and all‐cause mortality in older men and women. Proceedings of the National Academy of Sciences USA, 110, 5797‐5801.
STRIFE, S. & DOWNEY, L. 2009. Childhood Development and Access to Nature: A New Direction for Environmental Inequality Research. Organization & Environment, 22(1), 99–122
SUGIYAMA, T., CERIN, E., OWEN, N., OYEYEMI, A. L., CONWAY, T. L., VAN DYCK, D., SCHIPPERIJN, J., MACFARLANE, D. J., SALVO, D., REIS, R. S., MITÁŠ, J., SARMIENTO, O. L., DAVEY, R., SCHOFIELD, G., ORZANCO‐GARRALDA, R. & SALLIS, J. F. 2014. Perceived neighbourhood environmental attributes associated with adults [U+05F3] recreational walking: IPEN Adult study in 12 countries. Health and Place, 28, 22‐30
SUGIYAMA, T., FRANCIS, J., MIDDLETON, N. J., OWEN, N. & GILES‐CORTI, B. 2010. Associations between recreational walking and attractiveness, size, and proximity of neighborhood open spaces. American Journal of Public Health, 100, 1752‐1757.
SUGIYAMA, T., GILES‐CORTI, B., SUMMERS, J., DU TOIT, L., LESLIE, E. & OWEN, N. 2013. Initiating and maintaining recreational walking: A longitudinal study on the influence of neighborhood green space. Preventive Medicine, 57, 178‐182.
SUGIYAMA, T., LESLIE, E., GILES‐CORTI, B. & OWEN, N. 2008. Associations of neighbourhood greenness with physical and mental health: do walking, social coherence and local social interaction explain the relationships? Journal of Epidemiology and Community Health, 62, e9.
SUGIYAMA, T., THOMPSON, C. W. & ALVES, S. 2009. Associations between neighborhood open space attributes and quality of life for older people in Britain. Environment and Behavior, 41, 3‐21.
SUGIYAMA, T. & WARD THOMPSON, C. 2008. Associations between characteristics of neighbourhood open space and older people’s walking. Urban Forestry & Urban Greening, 7, 41‐51.
TAKANO, T., NAKAMURA, K. & WATANABE, M. 2002. Urban residential environments and senior citizens’ longevity in megacity areas: the importance of walkable green spaces. Journal of Epidemiology and Community Health, 56, 913‐918.
TAMOSIUNAS, A., GRAZULEVICIENE, R., LUKSIENE, D., DEDELE, A., REKLAITIENE, R., BACEVICIENE, M., VENCLOVIENE, J., BERNOTIENE, G., RADISAUSKAS, R., MALINAUSKIENE, V., MILINAVICIENE, E., BOBAK, M., PEASEY, A. & NIEUWENHUIJSEN, M. J. 2014. Accessibility and use of urban green spaces, and cardiovascular health: findings from a Kaunas cohort study. Environmental Health, 13, 20.
TAN, Z., LAU, K. K.‐L. & NG, E. 2015. Urban tree design approaches for mitigating daytime urban heat island effects in a high‐density urban environment. Energy and Buildings, 114, 265‐274.
TAYLOR, M. S., WHEELER, B. W., WHITE, M. P., ECONOMOU, T. & OSBORNE, N. J. 2015. Research note: Urban street tree density and antidepressant prescription rates—a cross‐sectional study in London, UK. Landscape and Urban Planning, 136, 174‐179.
THIERING, E., MARKEVYCH, I., BRÜSKE, I., FUERTES, E., KRATZSCH, J., SUGIRI, D., HOFFMANN, B., VON BERG, A., BAUER, C. P., KOLETZKO, S., BERDEL, D. & HEINRICH, J. 2016. Associations of residential

60
long‐term air pollution exposures and satellite‐derived greenness with insulin resistance in German adolescents. Environmental Health Perspectives, [Epub ahead of print].
TIDBALL, K.G. & KRASNY, M.E. 2014. Greening in the Red Zone: Disaster, Resilience and Community Greening. Springer Netherlands.
TRIGUERO‐MAS M., DADVAND P., CIRACH M., MARTÍNEZ D., MEDINA A., MOMPART A., BASAGAÑA X., GRAŽULEVIČIENĖ R. & NIEUWENHUIJSEN M. J. 2015. Natural outdoor environments and mental and physical health: relationships and mechanisms. Environment International, 77, 35‐41.
TROY, A., GROVE, J. M. & O’NEIL‐DUNNE, J. 2012. The relationship between tree canopy and crime rates across an urban–rural gradient in the greater Baltimore region. Landscape & Urban Planning, 106, 262‐270.
ULRICH, R. S. 1983. Aesthetic and Affective Response to Natural Environment. In: ALTMAN, I. & WOHLWILL, J. F. (eds.) Human Behavior & Environment: Advances in Theory & Research. New York: Plenum.
ULRICH, R. S., SIMONS, R. F., LOSITO, B. D., FIORITO, E., MILES, M. A. & ZELSON, M. 1991. Stress recovery during exposure to natural and urban environments. Journal of Environmental Psychology, 11, 201‐230.
UNITED NATIONS DEPARTMENT OF ECONOMIC AND SOCIAL AFFAIRS. 2014. Open Working Group proposal for Sustainable Development Goals [Online]. Available at: https://sustainabledevelopment.un.org/sdgsproposal.html (accessed on 19 May 2016).
VAILSHERY, L. S., JAGANMOHAN, M. & NAGENDRA, H. 2013. Effect of street trees on microclimate and air pollution in a tropical city. Urban Forestry & Urban Greening, 12, 408–415.
VAN DEN BERG, A.E. & CUSTERS, M.H.G. 2011. Gardening Promotes Neuroendocrine and Affective Restoration from Stress. Journal of Health Psychology, 16, 3‐11.
VAN DEN BERG, A. E. & VAN DEN BERG, C. G. 2011. A comparison of children with ADHD in a natural and built setting. Child Care Health and Development, 37, 430‐439.
VAN DEN BERG, M., VAN POPPEL, M., VAN KAMP, I., ANDRUSAITYTE, S., BALSEVICIENE, B., CIRACH M., DANILEVICIUTE A., ELLIS N., HURST G., MASTERSON D., SMITH G., TRIGUERO‐MAS M., UZDANAVICIUTE I., WIT P. D., MECHELEN W. V., GIDLOW C., GRAZULEVICIENE R., NIEUWENHUIJSEN M. J., KRUIZE H. & MAAS J. 2016. Visiting green space is associated with mental health and vitality: A cross‐sectional study in four European cities. Health Place, 38, 8‐15.
VAN DEN BOSCH, M. A., ÖSTERGREN, P. O., GRAHN, P., SKÄRBÄCK, E. & WÄHRBORG, P. 2015. Moving to serene nature may prevent poor mental health – results from a Swedish longitudinal cohort study. International Journal of Environmental Research and Public Health, 12, 7974‐7989.
VAN DILLEN, S. M., DE VRIES, S., GROENEWEGEN, P. P. & SPREEUWENBERG, P. 2012. Greenspace in urban neighbourhoods and residents’ health: adding quality to quantity. Journal of Epidemiology and Community Health, 66, e8.

61
VILLANUEVA, K., BADLAND, H., HOOPER, P., KOOHSARI, M. J., MAVOA, S., DAVERN, M., ROBERTS, R., GOLDFELD, S. & GILES‐CORTI, B. 2015. Developing indicators of public open space to promote health and wellbeing in communities. Applied Geography, 57, 112‐119.
VILLENEUVE, P. J., JERRETT, M., G. SU, J., BURNETT, R. T., CHEN, H., WHEELER, A. J. & GOLDBERG, M. S. 2012. A cohort study relating urban green space with mortality in Ontario, Canada. Environmental Research, 115, 51‐58.
VÖLKER, S. & KISTEMANN, T. 2011. The impact of blue space on human health and well‐being – Salutogenetic health effects of inland surface waters: a review. International Journal of Hygiene and Environmental Health, 214, 449‐60.
VÖLKER, S. & KISTEMANN, T. 2015. Developing the urban blue: Comparative health responses to blue and green urban open spaces in Germany. Health & Place, 35, 196–205.
VÖLKER, S., BAUMEISTER, H., CLASSEN, T., HORNBERG, C. & KISTEMANN, T. 2013. Evidence for the temperature‐mitigating capacity of urban blue space – a health geographic perspective. Erdkunde, 67, 355–371.
VOTSI, N.‐E. P., MAZARIS, A. D., KALLIMANIS, A. S., DRAKOU, E. G. & PANTIS, J. D. 2013. Landscape structure and diseases profile: associating land use type composition with disease distribution. International Journal of Environmental Health Research, 24, 176‐187.
WACHTER, S.M. & BUCCHIANERI, G.W. 2008. What is a Tree Worth? Green‐City Strategies, Signaling and Housing Prices. Real Estate Economics, 36, 213‐239.
WANG, D., BROWN, G., LIU, Y. & MATEO‐BABIANO, I. 2015. A comparison of perceived and geographic access to predict urban park use. Cities, 42, Part A, 85‐96.
WARD THOMPSON, C., ROE, J., ASPINALL, P., MITCHELL, R., CLOW, A. & MILLER, D. 2012. More green space is linked to less stress in deprived communities: Evidence from salivary cortisol patterns. Landscape and Urban Planning, 105, 221‐229.
WARD THOMPSON, C., ROE, J. & ASPINALL, P. 2013. Woodland improvements in deprived urban communities: What impact do they have on people’s activities and quality of life? Landscape and Urban Planning, 118, 79‐89.
WARD THOMPSON, C., ASPINALL, P., ROE, J., ROBERTSON L. & MILLER, D. 2016. Mitigating Stress and Supporting Health in Deprived Urban Communities: The Importance of Green Space and the Social Environment. International Journal of Environmental Research and Public Health, 13, 440.
WELLS, N. M. & LEKIES, K. S. 2006. Nature and the Life Course: Pathways from Childhood Nature Experiences to Adult Environmentalism. Children, Youth and Environments, 16, 1‐24.
WENDEL‐VOS, G. C., SCHUIT, A. J., DE NIET, R., BOSHUIZEN, H. C., SARIS, W. H. & KROMHOUT, D. 2004. Factors of the physical environment associated with walking and bicycling. Medicine & Science in Sports & Exercise, 36, 725‐730.
WHEELER, B., LOVELL, R., HIGGINS, S., WHITE, M., ALCOCK, I., OSBORNE, N., HUSK, K., SABEL, C. & DEPLEDGE, M. 2015. Beyond greenspace: an ecological study of population general health and

62
indicators of natural environment type and quality. International Journal of Health Geographics, 14, 17.
WHEELER, B. W., COOPER, A. R., PAGE, A. S. & JAGO, R. 2010. Greenspace and children’s physical activity: a GPS/GIS analysis of the PEACH project. Preventive Medicine, 51, 148‐52.
WHITE, M., SMITH, A., HUMPHRYES, K., PAHL, S., SNELLING, D. & DEPLEDGE, M. 2010. Blue space: The importance of water for preference, affect, and restorativeness ratings of natural and built scenes. Journal of Environmental Psychology, 30, 482‐493.
WHITE, M. P., ALCOCK, I., WHEELER, B. W. & DEPLEDGE, M. H. 2013a. Would you be happier living in a greener urban area? A fixed‐effects analysis of panel data. Psychology Science, 24, 920‐928.
WHITE, M. P., PAHL, S., ASHBULLBY, K., HERBERT, S. & DEPLEDGE, M. H. 2013b. Feelings of restoration from recent nature visits. Journal of Environmental Psychology, 35, 40‐51.
WHITE, M. P., WHEELER, B. W., HERBERT, S., ALCOCK, I. & DEPLEDGE, M. H. 2014. Coastal proximity and physical activity: Is the coast an under‐appreciated public health resource? Preventive Medicine, 69, 135‐140.
WILSON, E. O. 1984. Biophilia. Harvard University Press, Cambridge, MA.
WHO. 2010a. Global Recommendations on Physical Activity for Health. Geneva, Switzerland: World Health Organization. Available at: http://apps.who.int/iris/bitstream/10665/44399/1/9789241599979_eng.pdf (accessed on 19 May 2016).
WHO. 2010b. Parma declaration on Environment and Health. Fifth Ministerial Conference on Environment and Health “Protecting children’s health in a changing environment”. Copenhagen: WHO Regional Office for Europe.
WHO. 2010c. Tools for the monitoring of Parma Conference commitments. Report of the meeting 25‐26 November 2010, Bonn, Germany. Copenhagen, Denmark: WHO Regional Office for Europe.
WHO. 2010d. Urban Planning, Environment and Health: From Evidence to Policy Action. Meeting Report. Copenhagen, Denmark: WHO Regional Office for Europe.
WHO. 2011. Burden of disease from environmental noise. Quantification of healthy life years lost in Europe. Copenhagen: WHO Regional Office for Europe.
WHO. 2012. Action plan for implementation of the European strategy for the prevention and control of noncommunicable diseases 2012−2016. Copenhagen: WHO Regional Office for Europe.
WHO. 2013. Physical activity promotion in socially disadvantaged groups: principles for action (PHAN Work Package 4 Final Report). Copenhagen: WHO Regional Office for Europe. Available at: http://www.euro.who.int/__data/assets/pdf_file/0005/185954/E96817eng.pdf?ua=1 (accessed on 19 May 2016).
WHO & World Meteorological Organization (WMO). 2015. Heatwaves and Health: Guidance on Warning‐System Development. Geneva: World Meteorological Organization and World Health Organization.

63
WILKER, E. H., WU, C.‐D., MCNEELY, E., MOSTOFSKY, E., SPENGLER, J., WELLENIUS, G. A. & MITTLEMAN, M. A. 2014. Green space and mortality following ischemic stroke. Environmental Research, 133, 42‐48.
WOLCH, J., JERRETT, M., REYNOLDS, K., MCCONNELL, R., CHANG, R., DAHMANN, N., BRADY, K., GILLILAND, F., SU, J. G. & BERHANE, K. 2011. Childhood obesity and proximity to urban parks and recreational resources: A longitudinal cohort study. Health & Place, 17, 207‐214.
XU, Y., DADVAND, P., BARRERA‐GÓMEZ, J., SARTINI, C., MARÍ‐DELL’OLMO, M., BORRELL, C., MEDINA‐RAMÓN, M., SUNYER, J. & BASAGAÑA, X. 2013. Differences on the effect of heat waves on mortality by sociodemographic and urban landscape characteristics. Journal of Epidemiology and Community Health, 67, 519‐525.
YANG, F., BAO, Z. Y. & ZHU, Z. J. 2011. An assessment of psychological noise reduction by landscape plants. International Journal of Environmental Research & Public Health, 8, 1032‐48.
YANG, C.Y., BOEN, C., GERKEN, K., LI, T., SCHORPP, K. & HARRIS, K.M. 2016. Social relationships and physiological determinants of longevity across the human life span. Proceedings of the National Academy of Sciences USA, 113, 578–583.
ZELENSKI, J. M., DOPKO, R. L. & CAPALDI, C. A. 2015. Cooperation is in our nature: Nature exposure may promote cooperative and environmentally sustainable behavior. Journal of Environmental Psychology, 42, 24‐31.
64
APPENDIX1.Examplesofdefinitionsrelatedtoassessinggreenspaceavailabilityoraccessibility
EuropeanCommonIndicators–AvailabilityoflocalpublicopenareasandservicesPublic open areas are defined as:
• public parks, gardens or open spaces, for the exclusive use of pedestrians and cyclists, except green traffic islands or dividers, graveyards (unless the local authority recognizes their recreational function or natural, historical or cultural importance);
• open‐air sports facilities, accessible to the public free of charge; • private areas (agricultural areas, private parks), accessible to the public free of charge.
To allow a more complete data analysis, the indicator must be calculated twice: first, relating to areas greater than 5,000 m2, and second for all areas used by the public for leisure and open air activities, regardless of their dimension (Ambiente Italia Research Institute, 2003).
UrbanAtlasintheEuropeanUnionThe Green Urban Areas as defined by Urban Atlas (code 14100) include public green areas used predominantly for recreation such as gardens, zoos, parks, and suburban natural areas and forests, or green areas bordered by urban areas that are managed or used for recreational purposes (European Union, 2011). For more detailed information on the definition of green space in the Urban Atlas see Box 4.1 in Section 4.2.1.
NaturalEngland’sAccessibleNaturalGreenSpaceStandard16Accessible greenspace – places that are available for the general public to use free of charge and without time restrictions (although some sites may be closed to the public overnight and there may be fees for parking a vehicle). The places are available to all, meaning that every reasonable effort is made to comply with the requirements under the Disability Discrimination Act (DDA 1995). An accessible place will also be known to the target users, including potential users who live within the site catchment area.
Natural greenspace – Places where human control and activities are not intensive so that a feeling of naturalness is allowed to predominate. Natural and semi‐natural greenspace exists as a distinct typology but also as discrete areas within the majority of other greenspace typologies.
EuropeanEnvironmentAgency17Green space is defined as a plot of vegetated land separating or surrounding areas of intensive residential or industrial use and devoted to recreation or park uses.
UnitedStatesEnvironmentalProtectionAgency’s(USEPA)EnviroAtlas18US EPA’s EnviroAtlas (Pickard et al., 2015) defines green space as all vegetated land, including agriculture, lawns, forests, wetlands, and gardens. Barren land and impervious surfaces such as concrete and asphalt are excluded.
16 http://webarchive.nationalarchives.gov.uk/20160714000001/http://publications.naturalengland.org.uk/ publication/40004 17 http://glossary.eea.europa.eu/terminology/concept_html?term=green%20space 18 https://www.epa.gov/enviroatlas

65
APPENDIX 2. The availability of key urban land use data for theMemberStatesoftheWHOEuropeanRegion
WHO European Member European Urban Atlas (2006)*
CORINE Land Cover (2006)**
Albania Available
Andorra
Armenia
Austria Available Available
Azerbaijan
Belarus
Belgium Available Available
Bosnia and Herzegovina Available
Bulgaria Available Available
Croatia Available
Cyprus Available Available
Czech Republic Available Available
Denmark Available Available
Estonia Available Available
Finland Available Available
France Available Available
Georgia
Germany Available Available
Greece Available
Hungary Available Available
Iceland Available
Ireland Available Available
Israel
Italy Available Available
Kazakhstan
Kyrgyzstan
Latvia Available Available
Lithuania Available Available
Luxembourg Available Available
Malta Available Available
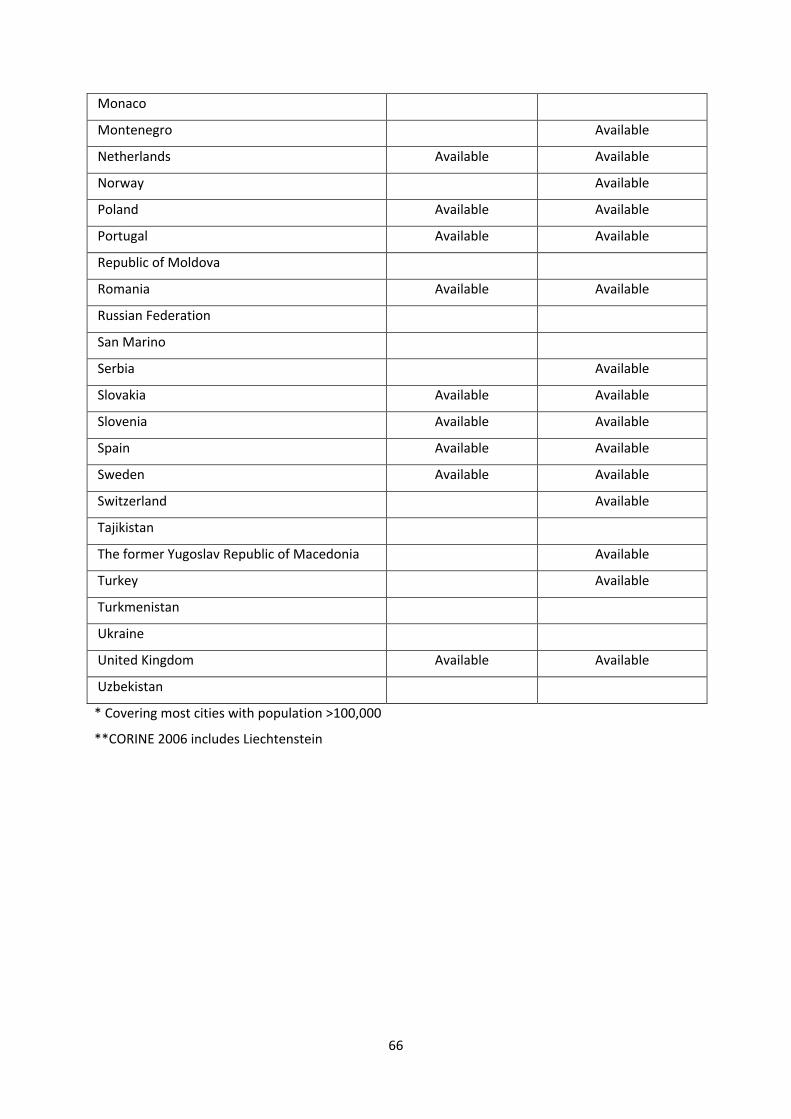
66
Monaco
Montenegro Available
Netherlands Available Available
Norway Available
Poland Available Available
Portugal Available Available
Republic of Moldova
Romania Available Available
Russian Federation
San Marino
Serbia Available
Slovakia Available Available
Slovenia Available Available
Spain Available Available
Sweden Available Available
Switzerland Available
Tajikistan
The former Yugoslav Republic of Macedonia Available
Turkey Available
Turkmenistan
Ukraine
United Kingdom Available Available
Uzbekistan
* Covering most cities with population >100,000
**CORINE 2006 includes Liechtenstein

APde
Thstudais so
Da
SeStadaM
Todo
Fig
Seco
PPeta
his gudyata apftw
ata
ettinart ata falm
o seown
g. A
elecoord
PENail
guidy peareplic
ware
a p
nga bfram
mö,
et tn to
A.3.1
t tdina
NDled
de perfoe loccabe.
pre
theblanme it is
he o pro
1.
he ate
DIXdst
provormcallle
pa
eprnk Ato s ET
proope
cosys
X 3tep
vided y ain
arat
rojeArctheTRS_
ojecertie
ordstem
3:p‐b
es ain tcquoth
tio
ectGISe pr_19
ctedes.
dinams (
Aby
an ethe uireher
on
tionS filroje989
d co
ate (Fig
A t‐st
exaSw
ed, aEu
nofe. Pecte9_LA
oor
sysg. A.
tootep
mpwedandurop
fthPrioed cAEA
rdin
stem.3.2
olpp
ple oish d thpea
edor tcooA.
nate
m t2).
kipro
of tmu
he Gan c
datao bordi
e sy
tab
itoce
the unicGIS‐citie
afrbrinnat
yste
an
foed
indcipa‐sofes
ramginte s
em
nd
orur
dicaalityftwawit
meg ayste
of
fin
asre
tory Mare th c
any em
the
d t
6
sse
r meMalm is Acor
lay typ
e da
the
67
ess
ethmö. Arcrres
yerspica
ata
ap
sin
odoLanGISspon
s intally
fra
ppro
ng
olognd S, vendi
to tuse
ame
opr
gr
gy. useersing
theed
e, r
riate
ree
Thee daion da
e filefor
igh
e c
en
e illata 10ta
e, sma
t cl
coor
n s
ustare.1. sup
set ap f
lick
rdin
spa
trate froThepply
thefiles
on
nate
ace
tionom e say, u
e cos in
n la
e s
e
ns aUrbameusin
oor th
ayer
syst
ac
re dbane png
dine a
rs (
tem
cce
drawn AtrincArc
aterea
Fig.
m un
ess
wn tlascipacGIS
e sya. In
. A.
nde
ib
fro, poal pS o
ysten th
.3.1
er P
ilit
om opurocor s
em e c
1) a
Proj
ty
a caulatcedusim
of tase
and
ject
–
aseionureilar
thee of
go
ted
r
f
d

Fig
Nothsoth
BrYowhsh
g. A
ow e smerou
ringou cherape
A.3.2
youametimugh
gincan e ye‐fi
2.
u cae c
mes bac
nginbriyoule b
an bcoorcomck u
nnng r laby r
brinrdinme up l
necein tayeigh
ng innatewitlite
essthers at cl
n the sythoratu
sary layare icki
he lysteout ure
ylayerssto
ing
ayeem a sp on
ayers byoreon
ers forpatn the
rsy goed. it,
necr spial e w
oingYougoi
cesspatirefe
web
g tou cang
saryal aeresite
o Fian to P
y foanaencee ab
le cheProp
or thalyse. Itbou
Aeckper
6
he is. Tt is ut t
Addk thrties
68
anaTheimphe
d dahe cs
alyse laporlaye
atacurr So
sis. And rtaner o
(Figrenourc
All use
nt toor t
g. At coce t
of te do fihro
A.3.oortab.
theatand oug
3) ardin.
se a, douth co
andnate
layeowt wont
d the sy
ers nlohattact
hen yste
neeadet thting
navem
ed ed fis sg Ur
vigaan
to bfrompatrban
atinnd p
be pm Utial n At
ng tproj
proUrbreftlas
to tject
ojecban feres.
he tion
tedAtl
ence
foldn o
d tolas,e is
derof a
r

Fig
PrWdaanprcofrabe
g. A
rojehenata nd tojeoordameeen
A.3.3
ectin thframtranct, dinae; ause
3.
inghe lmensfoch
ate alteed i
gthaye. Toormoossysrnain t
helaers o domatise stemativehe
ayeareo thionswhm (ely,file
erse in his, s ere(in X, yo an
thefin Fe
e yoXY ou cd s
e mnd teatou coocan ele
mapthe turewaordclicct it
fileArce ant inack ot fr
e, pc To Prtote on Lom
projoolroje sasysLay the
jectboxectave temyersere
t thx an(Figth
ms, , we).
6
emnd g. Ahe nyohic
69
m tonavA.3.newu ch li
theviga.4).w pan sts
e saate Thprojnavall
ameto Dhen ectvigathe
e coDatyo
ted ate e co
oorta mou cshto
oord
rdinmancan hapeit din
natenagsee‐fitheate
e sygemlectle, e we sys
ystement thanay ste
em t tohe ld syoums
youoolslayeseleu dtha
u prs er yect id fat h
roje Pryouthefor have
ecteroje wae othee a
ed tectioantoutpe dlrea
theonst toputataady
s t y

Fig
If prDacoth
Fig
g. A
theojeata oordis la
g. A
A.3.4
e Uct i
dinaaye
A.3.5
4.
rbat thEx
ate r to
5.
n Ahe wxporsyso be
Atlawayrt dsteme sa
as lay dedatam asaved
andescra (Fs thd an
d usribeFig. his lnd
se fed aA.3layeren
file abo3.5)er’snam
caove.) ans some t
me Fond urche
wir thleavce dfile
ith his lvingdatae.
an layeg tha (F
7
uner, fhe ig. A
70
ndeffirsdefA.3
finet exfau3.6).
ed sxpolt o. Th
spaort ioptihen
tialt byonsna
l rey rigs: Eviga
eferghtExpoate
enct cliort to
ce, ckinall the
young ofeae fo
u won tatuolde
will theres;er w
note lay; uswhe
t beyer,se tre y
e a, gothe you
bleoingsa
u wa
tog tomeant
e

Fig
NoXYA.3
Fig
Wth
ChToex
g. A
ow Y co3.7
g. A
hene p
heco texam
A.3.6
youoord7).
A.3.7
n alroje
kinest mple
6.
u cadina
7.
ll ofecte
ngtthae Op
an nate
f thed
theat tpen
navsys
he lcoo
inthe n Str
igatstem
ayeordi
tegmareet
te tm a
ers inat
grityap at M
to tand
arete s
yofalig
Map)
the d ch
e in syst
fthgns ) by
Archoo
thetem
hepcory go
c caose
e sam if i
projrrecoing
atalthe
ameit h
ojecctlyg to
og,e a
e coas c
ctioy, bo Fil
, finppr
oorcha
onbringle
nd trop
dinnge
g in A
7
the riat
nateed.
n aAdd
71
layte p
e syNo
badat
yer tproj
ysteow a
asemta
theject
em, all o
map A
ere, ted
go of th
p (fAdd
rig co
bahe
for d ba
ht coord
ck tlaye
citasem
clicdina
to ters
ies,map
k oate
thein y
, anp (F
n itsys
dayou
ny sFig.
t anste
ata fur m
streA.3
nd gm u
frammap
eet 3.8)
go tund
me p sh
ma).
o Pder
anoul
ap
PropLay
d rld a
is g
pertyers
esealign
goo
tiesrs (F
et itn.
od,
s Fig.
t to
for
r

72
Fig. A.3.8.
Scroll around the map to see that your land use data and population data line up logically with each other and with the base map.
Data analysis
SelectinggreenspacesThe land use data file comes with specific codes. In Urban Atlas, the code for Green Urban Areas is 14100. Green Urban Areas are the definition of urban green spaces for the indicator.
To export Green Urban Areas as a layer, go to Selection Select by attributes. In the drop down menu, select Land use (to manually name the layers to what you find the most convenient and recognisable just click on the layer in the table of contents and type in the name you desire). Next, double click on the field “CODE”, click the “=“ button and then the “Get unique values” button. A list of codes will appear. Double click on the 14100 code to complete the equation (Fig. A.3.9). Click OK. Now the areas defined as urban green spaces are selected.

Fig
ToSe
Fig
g. A
o exelec
g. A
A.3.9
xpotion
A.3.1
9.
rt tn
10.
them Crm area
as ate la laaye
yerer fr
r, gorom
o bm se
ackelec
k tocted
o thd fea
e taatu
ablures
7
e os (Fi
73
of coig. A
ontA.3.
tent.10
ts, r).
righht cclickk onn thhe LLannd uuse lay
yer, goo to

Th“Usimap
Fig
It pr
Fig
SeTh
Toyolay
his wUrbamplppea
g. A
is imoce
g. A
eleche 1
o seou hyer.
willan gy car (
A.3.1
mpoedu
A.3.1
ctin1 ha
elechave. Fr
sagreclickFig
11.
ortares
12
ngga siz
t gre crom
ve en k on. A.
ants fro
greze is
reelear
m th
thespan th3.1
t to om
eens pr
n sredhe d
ese aceshe s11).
clescr
sparese
pac thdrop
feas” asym
ear tatc
aceent
ces e pp d
aturandmbo
theh. T
esoed
of prevow
res seol u
e seTo d
ofaas a
a ceviouwn m
as lectnde
lectdo t
acean e
ertaus smen
a st a ern
tionthis
ertaexa
ain selenu s
sepcoleat
n afs yo
ainmp
sizectiosele
araourth t
fterou c
sizple.
e, gon ect
ate r ofthe
r yocan
zeSam
go aandSHA
layf yolay
ou aclic
me
agad crAPE
7
yer. our yer
are ck o
ste
in treatE_A
74
Yochonam
donon t
eps
to Ste aAREA
u coiceme
ne ehe
can
Selea neEA a
can e foan
exp“Cl
n be
ectioew and
ther thd a
portear
e pe
on seldo
en he la w
tingr sel
erfo
lectoub
renayeind
g it alect
orm
Seletionle c
namer. Tow
as ated
med
ect n froclick
me tTo c
w fo
a layfea
for
by omk. T
the char th
yeratur
r an
att thThen
layangehe s
r anres”
ny s
tribe “n c
yer e thsym
nd s” ic
size
bute“Urblick
to he cmbo
tarton
de
es. Mbank th
somcolool se
t ne(Fig
sire
Ma gre “
metourelec
ew g. A
ed.
ke een“≥”
thin, yoctio
seleA.3.1
surn spand
ng lou con w
ect12)
re thpaced ty
ikecanwill
ion.
hates”ype
t

75
10 000 to select the minimum green space size of 1 ha (or 5 000 to select the size of 0.5 ha), and complete the formula (Fig. A.3.13). Click OK.
Fig. A.3.13.
You have now selected the urban green spaces with an area of 1 ha or larger. To export them as a layer, follow the same procedure as previous; go back to the table of contents, right click on the Land use layer, go to Selection Create layer from selected features (Fig. A.3.10). You can then rename the layer to something like “Green spaces_1ha” and select a colour of your choice for the layer, as described earlier.
CreatingbufferaroundgreenspacesThe 300 meter buffer size around green spaces being 1 ha or larger is presented as an example. Same steps can be performed for any buffer distance desired and around any size limit.
To create the buffer, go to Geoprocessing Buffer. Select your previously created layer “Green spaces_1ha” from the drop down menu as the input feature. In the output feature class, click on the open folder icon on the right and navigate to the folder where all your shape files are stored. Give this layer a name such as “green spaces 1 ha_300m buffer”. Next, specify 300 Meters as the linear distance. Lastly, click OK (Fig. A.3.14).

76
Fig. A.3.14.
The programme will run for a couple of minutes and create a buffer layer that will appear in the Table of Contents. You can rename it here and edit the symbol as previously described. It is often nice to set the layer to be transparent so that you can see the features underneath. You can set the transparency by right clicking on the layer, going to Properties Display Transparency 40%.
For the Malmö example, the result of this could look like the following (Fig. A.3.15):
Fig. A.3.15.

77
To change the display, you can move the layers up and down. They layer in the order they appear in the table of contents. You can also de‐select some of the layers so they are not all displayed simultaneously.
DeterminingpercentofpopulationhavingaccesstogreenspacesThe next step is to determine what percentage of the population is within the 300 m buffer of green spaces with a minimum size of 1 ha (these are the criteria for the current analysis. The same procedure can be applied to any buffer distance and green space size.).
Make sure the previous selection has been cleared. Then go to Selection Select by location. The selection method should say “select features from”. If the previous selection has not been cleared, then you have the option to “add to current selection” or “select from currently selected”, etc. The target layer should be the population data layer. The source layer is the 300 m buffer around green spaces of 1 ha or more (named e.g. “green spaces 1 ha_300m buffer). In the last step you decide the “spatial selection method for target layer features”. Select “have their centroid in the source layer feature” (Fig. A.3.16).
Fig. A.3.16.
After the selection has been made, you can either export it as a new layer (as previously described) or summarize the selection by right clicking on the Population data layer and opening the attribute table (Fig. A.3.17).

78
Fig. A.3.17.
Here you have the option of viewing just the selected features by clicking on “show selected records” at the bottom of the screen (Fig. A.3.18).
Fig. A.3.18.
In the Malmö example, the data are divided by gender. Each cell is populated with the number of people indicated. The last column to the right is the summation of both genders (i.e. total population of the census tract). By right clicking on the title of the “SUMMA” column and going to Statistics, you will get the summary of the selection (Fig. A.3.19).

79
Fig. A.3.19.
The results will be demonstrated as a frequency distribution (Fig. A.3.20).
Fig. A.3.20.
The sum of 237, 936 indicates the number of people living within the 300 m buffer zone of green spaces with a minimum size of 1 ha. The percentage can be calculated by obtaining the total number of people living in Malmö. You can do this by clearing the selection (Fig. A.3.21), right clicking on the population layer and opening the attribute table again.
Fig. A.3.21

80
Make sure that all records are displayed by making the proper selection in the bottom left corner of the screen. Right click on the “SUMMA” column of the attribute table again and select it. The result indicates that the total population of Malmo is 297 616 people.
The last step is to calculate the% of people living within the 300 m buffer around green spaces with a minimum size of 1 ha using the following formula:
population living within 300 m buffer (1 ha)total population
= 237936297616
*100=79.9%
The urban green space indicator in Malmö for a linear distance of 300 m to the border of green spaces with an area of at least 1 ha is 79.9%.

The WHO Regional Office for Europe The World Health Organization (WHO) is a specialized agency of the United Nations created in 1948 with the primary responsibility for international health matters and public health. The WHO Regional Office for Europe is one of six regional offices throughout the world, each with its own programme geared to the particular health conditions of the countries it serves. Member States Albania Andorra Armenia Austria Azerbaijan Belarus Belgium Bosnia and Herzegovina Bulgaria Croatia Cyprus Czech Republic Denmark Estonia Finland France Georgia Germany Greece Hungary Iceland Ireland Israel Italy Kazakhstan Kyrgyzstan Latvia Lithuania Luxembourg Malta Monaco Montenegro Netherlands Norway Poland Portugal Republic of Moldova Romania Russian Federation San Marino Serbia Slovakia Slovenia Spain Sweden Switzerland Tajikistan The former Yugoslav Republic of Macedonia Turkey Turkmenistan Ukraine United Kingdom Uzbekistan Original: English
WHO European Centre for Environment and Health, Bonn, Germany
This report summarizes the available evidence of beneficial effects of urban green spaces, such as improved mental health, reduced cardiovascular morbidity and mortality, obesity and risk of type 2 diabetes, and improved pregnancy outcomes. Mechanisms leading to these health benefits include psychological relaxation and stress alleviation, increased physical activity, reduced exposure to air pollutants, noise and excess heat. Characteristics of urban green spaces that are associated with specific mechanisms leading to health benefits, and measures or indicators of green space availability, accessibility and use that have been used in previous surveys are discussed from the perspective of their public health relevance and applicability for monitoring progress towards goals set in international commitments, such as the Parma Declaration in the WHO European Region and the global Sustainable Development Goals. The report also presents a suggested indicator of accessibility of green spaces with examples of its application in three European cities and a detailed methodological tool kit for GIS analysis of land use and population data.
World Health OrganizationRegional Office for Europe UN City, Marmorvej 51 DK-2100 Copenhagen Ø, Denmark Tel.: +45 45 33 70 00 | Fax: +45 45 33 70 01 E-mail: [email protected] Web site: www.euro.who.int