urban air quality in mega cities: a case study of delhi city using vulnerability analysis
TRANSCRIPT
Urban air quality in mega cities: A case study of Delhi Cityusing vulnerability analysis
Suresh Jain & Mukesh Khare
Received: 1 December 2006 /Accepted: 28 February 2007 / Published online: 24 March 2007# Springer Science + Business Media B.V. 2007
Abstract Air pollution is one of the major environ-mental problems in India, affecting health of thousandsof ‘urban’ residents residing in mega cities. The needof the day is to evolve an ‘effective’ and ‘efficient’ airquality management plan (AQMP) encompassing theessential ‘key players’ and ‘stakeholders.’ This paperdescribes the formulation of an AQMP for mega citieslike Delhi in India taking into account the aforemen-tioned key ‘inputs.’ The AQMP formulation method-ology is based on past studies of Longhurst et al.,(Atmospheric Environment, 30, 3975–3985, 1996);Longhurst & Elsom, ((1997). Air Pollution-II, Vol. 2(pp. 525–532)) and Beatti et al., (AtmosphericEnvironment, 35, 1479–1490, 2001). Further, thevulnerability analysis (VA) has been carried out toevaluate the stresses due to air pollution in the studyarea. The VA has given the vulnerability index (VI) of‘medium to high’ and ‘low’ at urban roadways/intersections and residential areas, respectively.
Keywords Urban air pollution . Policy . Emissioninventory . Decisions . Vulnerability analysis
Introduction
Air quality management (AQM) includes monitoring,modelling and control of air emissions to eliminate orlimit its impact on surrounding environment. Airpollution consistently ranks as one of the majorenvironmental concerns and primary cause of adversehealth effects on human beings (Hall 1996; Elsom andLonghurst 2004; Marshall et al. 2005). In some of themega cities, such as Bombay, Calcutta, Delhi, Dhaka,and Karachi in South Asia, and Bangkok, Beijing,Shanghai, Jakarta and Manila in East Asia, thepollution levels often exceed the World HealthOrganization (WHO 2000) air quality guidelines bya factor of 3 or 4 (Faiz and Sturm 2000; WorldResources Institute 1992, 1998). In India, estimatedannual health damage of pre-euro vehicle emissions for25 Indian cities has been estimated between US $14million and US $191.6 million per city (MashelkarCommittee 2002). In general, the average cost amounts0.26% of income due to highly subsidized treatment.However, 5% of patients who suffer severe attacksmay pay as much as 19% of their income (Parikh andHadker 2003). As such, the ‘polluters’ need toeffectively manage their air discharges to protect thequality of their local environment, maintain good
Environ Monit Assess (2008) 136:257–265DOI 10.1007/s10661-007-9681-7
S. JainResearch Scholar, Civil Engineering Department,Indian Institute of Technology Delhi,New Delhi, Indiae-mail: [email protected]
M. Khare (*)Atlantic LNG Chair Professor in EnvironmentalEngineering, University of West Indies,St. Augustine, Trinidad and Tobagoe-mail: [email protected]
relations with neighboring land users and to ensurecompliance with air quality legislation and license limits(Weatherleya and Timmisb 2001). Thus, it is evidentthat enhancing the capability of key players to improvethe air quality of the megacities must take place in thecontext of an integrated and comprehensive policyframework. Only such a framework will make itpossible to achieve the desired environmental andrelated outcomes related to effective AQM system.
Air pollution in mega cities
In the past, major causes of environmental degrada-tion in mega cities have occurred ‘sequentially’ ratherthan ‘simultaneously.’ Presently, mega cities aresuffering intense pressure of a combination ofdifferent driving forces e.g. motorization, industriali-zation and an increase in urban population density.Over the last three decades, motor vehicle numbershave been doubling every 10 or fewer years in manyAsian countries, as against a 2–5% annual growth ratein Canada, the United States, the United Kingdom,and the Japan (Faiz et al. 1992; Walsh 1994). Twowheelers (motorcycles/scoters) are the most rapidlygrowing type vehicles in most of the developingcountries including India. In Delhi, two-wheelersrepresent around two-thirds of total motor vehicles(Table 1). Vehicular pollution contributes about 72%of total pollution load as shown in Fig. 1 (CPCB2001). Among the primary pollutants, the carbonmonoxide (CO) levels frequently remain higher
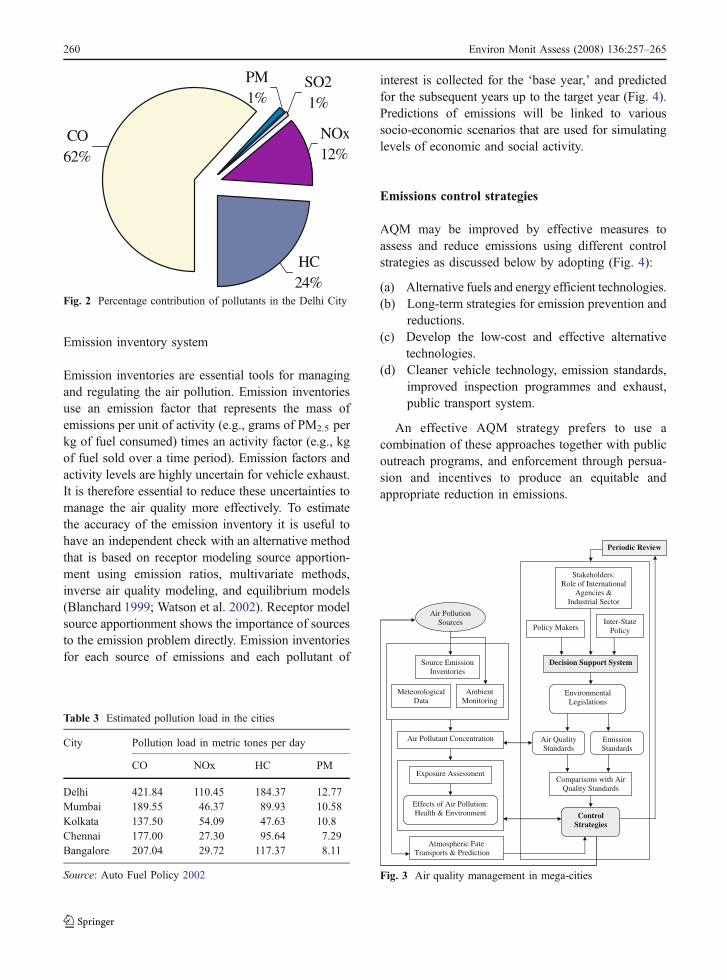
than the prescribed national ambient air qualitystandards NAAQS (Table 2, Fig. 2). The other majorsource of air pollution load in Delhi is the fuelcombustion by both large-scale and small-scaleindustries. Among the large-scale industries, thermalpower plants have been the most prominent contrib-utors to air pollution. Three coals based thermalpower plants, namely, Rajghat, Indra Prastha andBadarpur Power Plant, which have a total generationcapacity of 1,087 MW have been responsible for asmuch as approximately 10% of the air pollution load(CPCB 2001). By 1996, total number of small-scaleindustries in Delhi grew to a record number of 1,26,000. Most of the growth has been witnessed in thepollution intensive areas and sectors. In addition,significant pollution has been caused by a largenumber of diesel generating (DG) sets, which havebeen installed in various commercial and industrialestablishments (CPCB 2000). Emission load in Delhihas been much greater than the emission load in othermetropolitan cities such as Kolkata, Mumbai Chennaiand Bangalore (Table 3). It is due to cumulativeeffects of population growth, industrialization andincreased vehicular use. A series of policy measureshave been undertaken over the last decade to addressthe increasing vehicular air pollution problems inDelhi and other Indian mega cities, but without anyeffective improvements in the urban environment.Hence, it needs a well-coordinated and integratedapproach to address the fundamental problems ofurban air pollution and provide a basis for futureregional cooperation (Fig. 3).
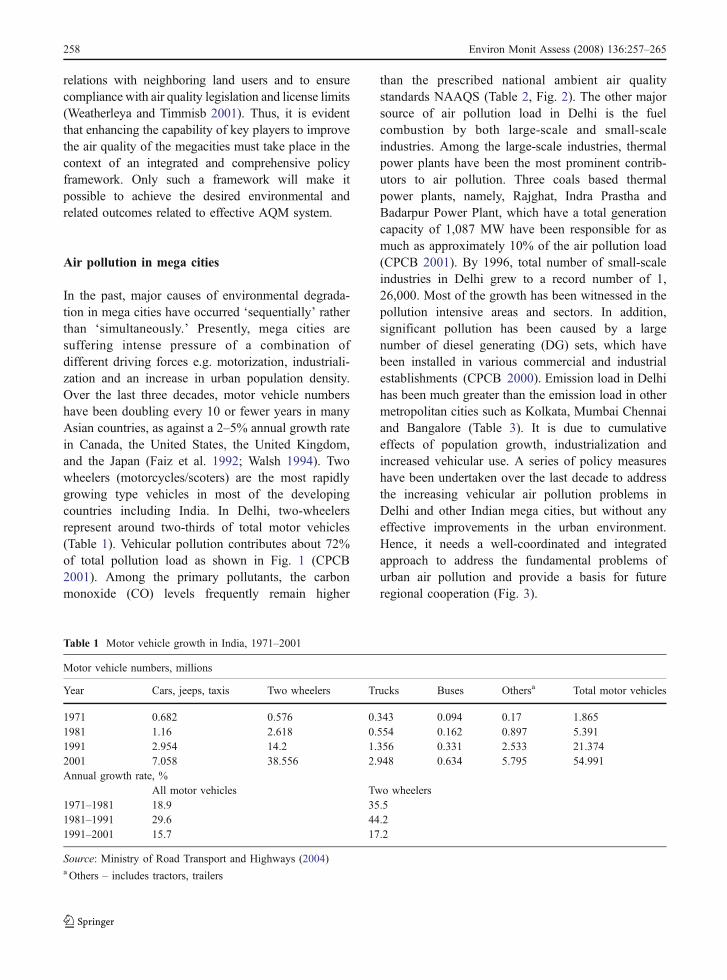
Table 1 Motor vehicle growth in India, 1971–2001
Motor vehicle numbers, millions
Year Cars, jeeps, taxis Two wheelers Trucks Buses Othersa Total motor vehicles
1971 0.682 0.576 0.343 0.094 0.17 1.8651981 1.16 2.618 0.554 0.162 0.897 5.3911991 2.954 14.2 1.356 0.331 2.533 21.3742001 7.058 38.556 2.948 0.634 5.795 54.991Annual growth rate, %
All motor vehicles Two wheelers1971–1981 18.9 35.51981–1991 29.6 44.21991–2001 15.7 17.2
Source: Ministry of Road Transport and Highways (2004)a Others – includes tractors, trailers
258 Environ Monit Assess (2008) 136:257–265

Environmental policy frame work
Environmental policy, supported by all responsibleministries in the government, may lead to sound andrational AQMP. An efficient policy framework includesareas like land-use planning, energy, transport andindustrial development. The formulation of such policyframework involves population of business community,academic scientists (universities), labour unions, nongov-ernmental organisations (NGOs) and the public. The
government, whether local, regional or national, becomea facilitator and cooperative partner (Sani 2002). Anintegrated AQM process can inform, educate and trainall stakeholders and strengthen their participation in allaspects related to AQMP. Several policy measures havebeen targeted for the city of Delhi, reflecting concern onthe deteriorating air pollution problems. These measures(pursuant to Supreme Court rulings in July 1998)include, supply of metered lubricating oil premixed withgasoline and a ban on the sale of loose lubricating oil,for motorized vehicles powered by two-stroke engines;phasing-out of commercial vehicles older than 15 yearsand the conversion of three wheelers, taxis, and buses tocompressed natural gas (CNG) (Kojima et al. 2000).Financial incentives have been provided to facilitate andsustain the conversion to alternate fuel like CNG. In thecase of three wheelers, for example, sales tax exemp-tions and subsidized loans have been provided toreplace old vehicles with those operated on CNG(Kojima et al. 2000). It is perhaps the first instance,after Brazil, of alternative transport fuels being imple-mented on such a large scale in a developing countrylike India. Delhi is certainly the only city in the world tohave converted its entire public vehicle fleet to run onan alternative fuel, the CNG.
0 10 20 30 40 50 60 70 80
1970-71
1980-81
1990-91
1999-00
2000-01
Yea
rs
Percentage pollution
Industrial
Vehicular
Domestic
Fig. 1 Sector-wise pollution in the Delhi City
Table 2 National Ambient Air quality Standards (NAAQS)
Pollutant Time weightedaverage
Concentration of Ambient Air
Industrial area Residential rural& other area
Sensitive area
Sulphur dioxide (SO2) Annuala 80 μg/m3 60 μg/m3 15 μg/m3
24 hb 120 μg/m3 80 μg/m3 30 μg/m3
Oxides of nitrogen (NO2) Annuala 80 μg/m3 60 μg/m3 15 μg/m3
24 hb 120 μg/m3 80 μg/m3 30 μg/m3
Suspended Particulate Matter (SPM) Annuala 360 μg/m3 140 μg/m3 70 μg/m3
24 hb 500 μg/m3 200 μg/m3 100 μg/m3
Respirable Particulate Matter(size Lessthan 10 μm) RPM
Annuala 120 μg/m3 60 μg/m3 50 μg/m3
24 hb 150 μg/m3 100 μg/m3 75 μg/m3
Lead as Pb Annuala 1.0 μg/m3 0.75 μg/m3 0.50 μg/m3
24 hb 1.5 μg/m3 1.0 μg/m3 0.75 μg/m3
Carbon monoxide 8 hb 5.0 mg/m3 2.0 mg/m3 1.0 mg/m3
1 h 10.0 mg/m3 4.0 mg/m3 2.0 mg/m3
Source: CPCB 2000a Annual Arithmetic Mean of minimum 104 measurements in a year taken twice a week 24-hourly at uniform interval.b 24-hourly/8-hourly values should be met 98% of the time in a year. However 2% of the time, it may exceed but not two consecutivedays.
Environ Monit Assess (2008) 136:257–265 259
Emission inventory system
Emission inventories are essential tools for managingand regulating the air pollution. Emission inventoriesuse an emission factor that represents the mass ofemissions per unit of activity (e.g., grams of PM2.5 perkg of fuel consumed) times an activity factor (e.g., kgof fuel sold over a time period). Emission factors andactivity levels are highly uncertain for vehicle exhaust.It is therefore essential to reduce these uncertainties tomanage the air quality more effectively. To estimatethe accuracy of the emission inventory it is useful tohave an independent check with an alternative methodthat is based on receptor modeling source apportion-ment using emission ratios, multivariate methods,inverse air quality modeling, and equilibrium models(Blanchard 1999; Watson et al. 2002). Receptor modelsource apportionment shows the importance of sourcesto the emission problem directly. Emission inventoriesfor each source of emissions and each pollutant of
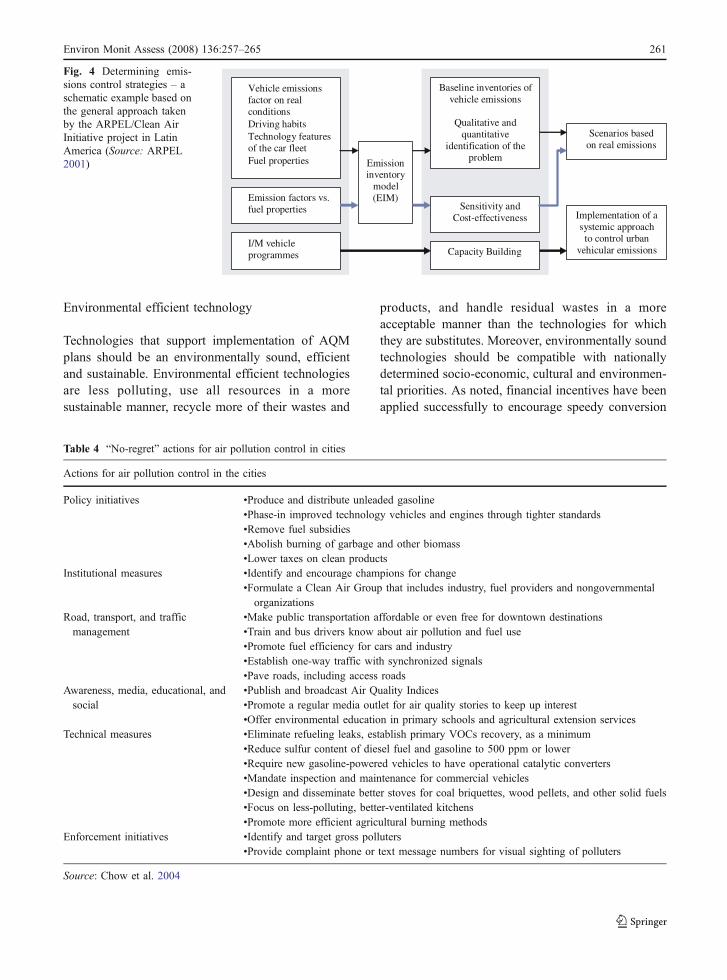
interest is collected for the ‘base year,’ and predictedfor the subsequent years up to the target year (Fig. 4).Predictions of emissions will be linked to varioussocio-economic scenarios that are used for simulatinglevels of economic and social activity.
Emissions control strategies
AQM may be improved by effective measures toassess and reduce emissions using different controlstrategies as discussed below by adopting (Fig. 4):
(a) Alternative fuels and energy efficient technologies.(b) Long-term strategies for emission prevention and
reductions.(c) Develop the low-cost and effective alternative
technologies.(d) Cleaner vehicle technology, emission standards,
improved inspection programmes and exhaust,public transport system.
An effective AQM strategy prefers to use acombination of these approaches together with publicoutreach programs, and enforcement through persua-sion and incentives to produce an equitable andappropriate reduction in emissions.
Comparisons with Air Quality Standards
Exposure Assessment
Atmospheric Fate Transports & Prediction
Ambient Monitoring
Meteorological Data
Air Pollution Sources
Environmental Legislations
Stakeholders: Role of International
Agencies & Industrial Sector
Policy Makers Inter-State
Policy
Decision Support System
Air Pollutant Concentration
Control Strategies
Source Emission Inventories
Effects of Air Pollution: Health & Environment
Air Quality Standards
Emission Standards
Periodic Review
Fig. 3 Air quality management in mega-cities
NOx12%
HC24%
CO62%
PM1%
SO21%
Fig. 2 Percentage contribution of pollutants in the Delhi City
Table 3 Estimated pollution load in the cities
City Pollution load in metric tones per day
CO NOx HC PM
Delhi 421.84 110.45 184.37 12.77Mumbai 189.55 46.37 89.93 10.58Kolkata 137.50 54.09 47.63 10.8Chennai 177.00 27.30 95.64 7.29Bangalore 207.04 29.72 117.37 8.11
Source: Auto Fuel Policy 2002
260 Environ Monit Assess (2008) 136:257–265
Environmental efficient technology
Technologies that support implementation of AQMplans should be an environmentally sound, efficientand sustainable. Environmental efficient technologiesare less polluting, use all resources in a moresustainable manner, recycle more of their wastes and
products, and handle residual wastes in a moreacceptable manner than the technologies for whichthey are substitutes. Moreover, environmentally soundtechnologies should be compatible with nationallydetermined socio-economic, cultural and environmen-tal priorities. As noted, financial incentives have beenapplied successfully to encourage speedy conversion
Table 4 “No-regret” actions for air pollution control in cities
Actions for air pollution control in the cities
Policy initiatives •Produce and distribute unleaded gasoline•Phase-in improved technology vehicles and engines through tighter standards•Remove fuel subsidies•Abolish burning of garbage and other biomass•Lower taxes on clean products
Institutional measures •Identify and encourage champions for change•Formulate a Clean Air Group that includes industry, fuel providers and nongovernmentalorganizations
Road, transport, and trafficmanagement
•Make public transportation affordable or even free for downtown destinations•Train and bus drivers know about air pollution and fuel use•Promote fuel efficiency for cars and industry•Establish one-way traffic with synchronized signals•Pave roads, including access roads
Awareness, media, educational, andsocial
•Publish and broadcast Air Quality Indices•Promote a regular media outlet for air quality stories to keep up interest•Offer environmental education in primary schools and agricultural extension services
Technical measures •Eliminate refueling leaks, establish primary VOCs recovery, as a minimum•Reduce sulfur content of diesel fuel and gasoline to 500 ppm or lower•Require new gasoline-powered vehicles to have operational catalytic converters•Mandate inspection and maintenance for commercial vehicles•Design and disseminate better stoves for coal briquettes, wood pellets, and other solid fuels•Focus on less-polluting, better-ventilated kitchens•Promote more efficient agricultural burning methods
Enforcement initiatives •Identify and target gross polluters•Provide complaint phone or text message numbers for visual sighting of polluters
Source: Chow et al. 2004
• Vehicle emissions
factor on real conditions
• Driving habits • Technology features
of the car fleet • Fuel properties
• Emission factors vs. fuel properties
• I/M vehicle programmes
Emission inventory
model (EIM)
Baseline inventories ofvehicle emissions
Qualitative and
quantitative identification of the
problem
Sensitivity and Cost-effectiveness
Capacity Building
Scenarios based on real emissions
Implementation of a systemic approach to control urban
vehicular emissions
Fig. 4 Determining emis-sions control strategies – aschematic example based onthe general approach takenby the ARPEL/Clean AirInitiative project in LatinAmerica (Source: ARPEL2001)
Environ Monit Assess (2008) 136:257–265 261
of three wheelers to CNG in Delhi. This demonstratesthe importance of coordinating technological, regula-tory, and economic policies. These policies aredetermined by or affect multiple actors – governmentsat various levels, vehicle and fuel manufacturers andretailers, the vehicle servicing industry, and vehicleusers – all of these actors should ideally be involved inpolicy development and implementation. Additionally,agencies responsible for public health, air quality andemissions monitoring, land use and transport planning,transport system management, traffic control, andvehicle registration, inspection, and maintenance arealso included, to effectively coordinate the action.However, beyond such coordination, it would bedesirable to explore efficient technologies to engagestakeholders and affected groups on an ongoing basis,
to integrate their diverse interests and concerns, anddesign policy packages that represent mutually bene-ficial compromises and that are both effective andequitable. Table 4, lists several solutions that arewidely accepted as beneficial.
Vulnerability analysis
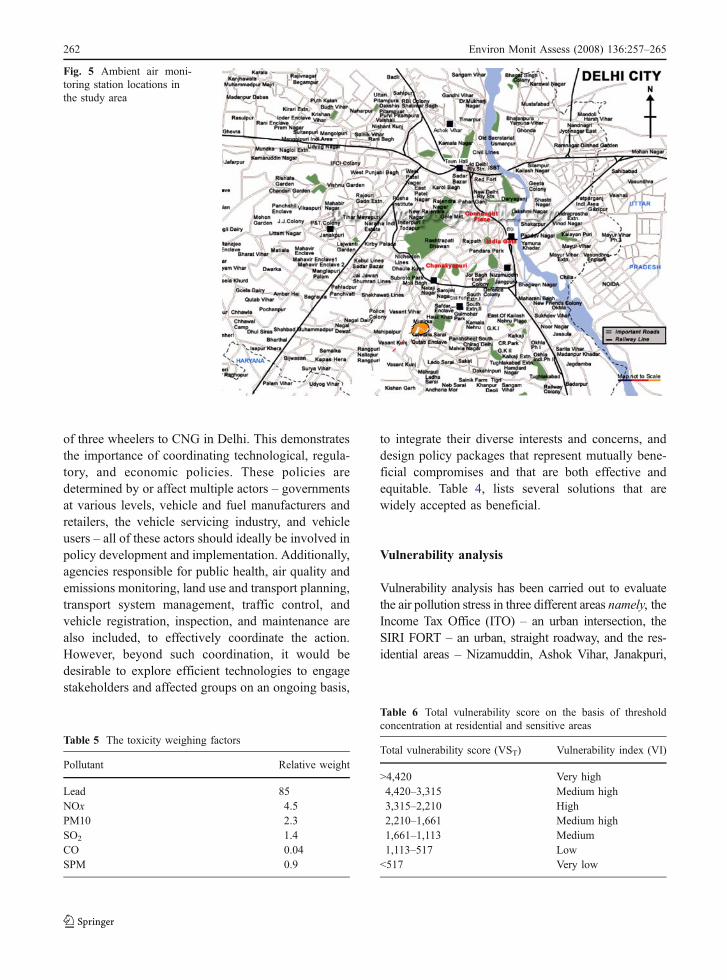
Vulnerability analysis has been carried out to evaluatethe air pollution stress in three different areas namely, theIncome Tax Office (ITO) – an urban intersection, theSIRI FORT – an urban, straight roadway, and the res-idential areas – Nizamuddin, Ashok Vihar, Janakpuri,
Table 5 The toxicity weighing factors
Pollutant Relative weight
Lead 85NOx 4.5PM10 2.3SO2 1.4CO 0.04SPM 0.9
Table 6 Total vulnerability score on the basis of thresholdconcentration at residential and sensitive areas
Total vulnerability score (VST) Vulnerability index (VI)
>4,420 Very high4,420–3,315 Medium high3,315–2,210 High2,210–1,661 Medium high1,661–1,113 Medium1,113–517 Low<517 Very low
Fig. 5 Ambient air moni-toring station locations inthe study area
262 Environ Monit Assess (2008) 136:257–265
Netaji Nagar, and Town Hall (Fig. 5). Air quality datahas been collected for the year 1997–2004 (CPCB2000, 2003, 2004; CRRI 2000). A fact-finding surveyhas been conducted to evaluate the status of urban airpollution at traffic intersections and residential areas
and vulnerability index (VI). The objective of develop-ing a vulnerability index is to identify zones in whichthe human population is exposed to stress due to airpollution. The information developed in VI providesthe basis to set priorities for planning for abatement
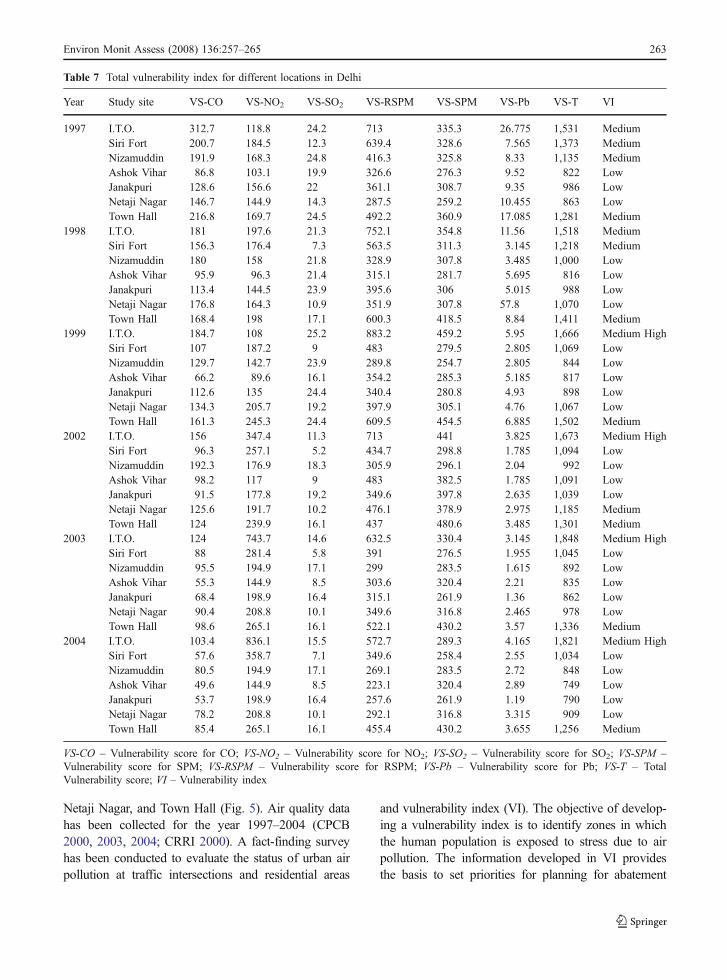
Table 7 Total vulnerability index for different locations in Delhi
Year Study site VS-CO VS-NO2 VS-SO2 VS-RSPM VS-SPM VS-Pb VS-T VI
1997 I.T.O. 312.7 118.8 24.2 713 335.3 26.775 1,531 MediumSiri Fort 200.7 184.5 12.3 639.4 328.6 7.565 1,373 MediumNizamuddin 191.9 168.3 24.8 416.3 325.8 8.33 1,135 MediumAshok Vihar 86.8 103.1 19.9 326.6 276.3 9.52 822 LowJanakpuri 128.6 156.6 22 361.1 308.7 9.35 986 LowNetaji Nagar 146.7 144.9 14.3 287.5 259.2 10.455 863 LowTown Hall 216.8 169.7 24.5 492.2 360.9 17.085 1,281 Medium
1998 I.T.O. 181 197.6 21.3 752.1 354.8 11.56 1,518 MediumSiri Fort 156.3 176.4 7.3 563.5 311.3 3.145 1,218 MediumNizamuddin 180 158 21.8 328.9 307.8 3.485 1,000 LowAshok Vihar 95.9 96.3 21.4 315.1 281.7 5.695 816 LowJanakpuri 113.4 144.5 23.9 395.6 306 5.015 988 LowNetaji Nagar 176.8 164.3 10.9 351.9 307.8 57.8 1,070 LowTown Hall 168.4 198 17.1 600.3 418.5 8.84 1,411 Medium
1999 I.T.O. 184.7 108 25.2 883.2 459.2 5.95 1,666 Medium HighSiri Fort 107 187.2 9 483 279.5 2.805 1,069 LowNizamuddin 129.7 142.7 23.9 289.8 254.7 2.805 844 LowAshok Vihar 66.2 89.6 16.1 354.2 285.3 5.185 817 LowJanakpuri 112.6 135 24.4 340.4 280.8 4.93 898 LowNetaji Nagar 134.3 205.7 19.2 397.9 305.1 4.76 1,067 LowTown Hall 161.3 245.3 24.4 609.5 454.5 6.885 1,502 Medium
2002 I.T.O. 156 347.4 11.3 713 441 3.825 1,673 Medium HighSiri Fort 96.3 257.1 5.2 434.7 298.8 1.785 1,094 LowNizamuddin 192.3 176.9 18.3 305.9 296.1 2.04 992 LowAshok Vihar 98.2 117 9 483 382.5 1.785 1,091 LowJanakpuri 91.5 177.8 19.2 349.6 397.8 2.635 1,039 LowNetaji Nagar 125.6 191.7 10.2 476.1 378.9 2.975 1,185 MediumTown Hall 124 239.9 16.1 437 480.6 3.485 1,301 Medium
2003 I.T.O. 124 743.7 14.6 632.5 330.4 3.145 1,848 Medium HighSiri Fort 88 281.4 5.8 391 276.5 1.955 1,045 LowNizamuddin 95.5 194.9 17.1 299 283.5 1.615 892 LowAshok Vihar 55.3 144.9 8.5 303.6 320.4 2.21 835 LowJanakpuri 68.4 198.9 16.4 315.1 261.9 1.36 862 LowNetaji Nagar 90.4 208.8 10.1 349.6 316.8 2.465 978 LowTown Hall 98.6 265.1 16.1 522.1 430.2 3.57 1,336 Medium
2004 I.T.O. 103.4 836.1 15.5 572.7 289.3 4.165 1,821 Medium HighSiri Fort 57.6 358.7 7.1 349.6 258.4 2.55 1,034 LowNizamuddin 80.5 194.9 17.1 269.1 283.5 2.72 848 LowAshok Vihar 49.6 144.9 8.5 223.1 320.4 2.89 749 LowJanakpuri 53.7 198.9 16.4 257.6 261.9 1.19 790 LowNetaji Nagar 78.2 208.8 10.1 292.1 316.8 3.315 909 LowTown Hall 85.4 265.1 16.1 455.4 430.2 3.655 1,256 Medium
VS-CO – Vulnerability score for CO; VS-NO2 – Vulnerability score for NO2; VS-SO2 – Vulnerability score for SO2; VS-SPM –Vulnerability score for SPM; VS-RSPM – Vulnerability score for RSPM; VS-Pb – Vulnerability score for Pb; VS-T – TotalVulnerability score; VI – Vulnerability index
Environ Monit Assess (2008) 136:257–265 263
measures. The total vulnerable score (VST) is obtainedfrom the following expression (Ghose et al. 2004):
VST ¼Xn
i¼1
XiTi
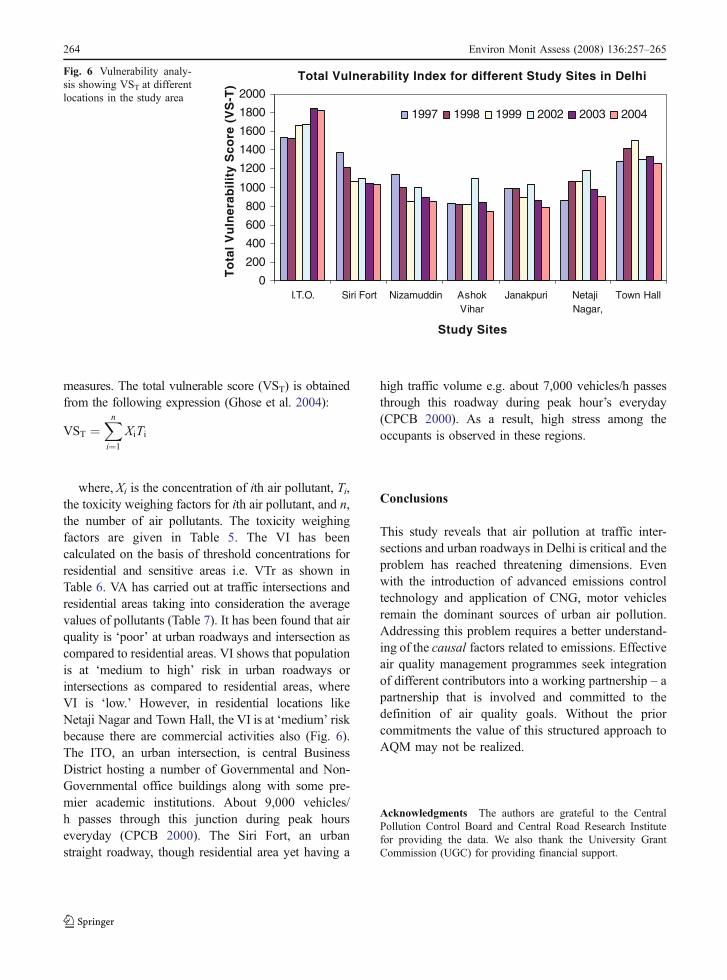
where, Xi is the concentration of ith air pollutant, Ti,the toxicity weighing factors for ith air pollutant, and n,the number of air pollutants. The toxicity weighingfactors are given in Table 5. The VI has beencalculated on the basis of threshold concentrations forresidential and sensitive areas i.e. VTr as shown inTable 6. VA has carried out at traffic intersections andresidential areas taking into consideration the averagevalues of pollutants (Table 7). It has been found that airquality is ‘poor’ at urban roadways and intersection ascompared to residential areas. VI shows that populationis at ‘medium to high’ risk in urban roadways orintersections as compared to residential areas, whereVI is ‘low.’ However, in residential locations likeNetaji Nagar and Town Hall, the VI is at ‘medium’ riskbecause there are commercial activities also (Fig. 6).The ITO, an urban intersection, is central BusinessDistrict hosting a number of Governmental and Non-Governmental office buildings along with some pre-mier academic institutions. About 9,000 vehicles/h passes through this junction during peak hourseveryday (CPCB 2000). The Siri Fort, an urbanstraight roadway, though residential area yet having a
high traffic volume e.g. about 7,000 vehicles/h passesthrough this roadway during peak hour’s everyday(CPCB 2000). As a result, high stress among theoccupants is observed in these regions.
Conclusions
This study reveals that air pollution at traffic inter-sections and urban roadways in Delhi is critical and theproblem has reached threatening dimensions. Evenwith the introduction of advanced emissions controltechnology and application of CNG, motor vehiclesremain the dominant sources of urban air pollution.Addressing this problem requires a better understand-ing of the causal factors related to emissions. Effectiveair quality management programmes seek integrationof different contributors into a working partnership – apartnership that is involved and committed to thedefinition of air quality goals. Without the priorcommitments the value of this structured approach toAQM may not be realized.
Acknowledgments The authors are grateful to the CentralPollution Control Board and Central Road Research Institutefor providing the data. We also thank the University GrantCommission (UGC) for providing financial support.
Total Vulnerability Index for different Study Sites in Delhi
0
200
400
600
800
1000
1200
1400
1600
1800
2000
I.T.O. Siri Fort Nizamuddin AshokVihar
Janakpuri NetajiNagar,
Town Hall
Study Sites
To
tal
Vu
lner
abil
ity
Sco
re (
VS
-T)
1997 1998 1999 2002 2003 2004
Fig. 6 Vulnerability analy-sis showing VST at differentlocations in the study area
264 Environ Monit Assess (2008) 136:257–265

References
ARPEL (2001). Systemic approach to vehicular emissioncontrol in Latin America and the Caribbean. ARPEL,Montevideo, Uruguay, May 2001. Available on line fromthe ARPEL library at: http://domino.arpel.org/aplicaciones/biblioteca/ML_lib.nsf.
Auto Fuel Policy (2002). Report of the Expert Committee onAuto Fuel Policy; Ministry of Petroleum and Gas, Govt. ofIndia, New Delhi.
Beatti, C. L., Longhurst, J. W. S., & Woodfield, N. K. (2001).Air quality management: evaluation of policy in the UK asexemplified by the experience of English local govern-ment. Atmospheric Environment, 35(8), 1479–1490.
Blanchard, C. L. (1999). Methods for attributing ambient airpollutants to emission. Annual Review of Energy and TheEnvironment, 24, 329–365.
Chow, J. C., Watson, J. G., Shah J. J., Kiang, C.S., Loh, C.,Lev-On, M., et al. (2004). Megacities and atmosphericpollution: Critical review discussion. Air and WasteManagement Association, 54, 1226–1235.
CPCB (2000). Air quality status and trend in India. PariveshNewsletter, vol. 4(3). Central Pollution Control Board,Parivesh Bhavan, Delhi, India.
CPCB (2001). National ambient air quality statistics of India.Central Pollution Control Board, Parivesh Bhavan, Delhi,India.
CPCB (2003). National Ambient Air Quality Status. CentralPollution Control Board, Parivesh Bhavan, Delhi, India.
CPCB (2004). National Ambient Air Quality Status. CentralPollution Control Board, Parivesh Bhavan, Delhi, India.
CRRI. (2000). Present trend in diurnal and seasonal variation oftraffic flow in Delhi city. personal communication with Dr.N.L. Bhatia, Scientist, Central Road Research Institute,Environment and Road Traffic Safety Division, New Delhi.
Elsom, D. M., & Loughurst, J. W. S. (2004). Local and regionalaspects of air quality management: An overview, regionaland local aspects of air quality management, 1st ed. In D. M.Elsom& J. S. M. Loughurst (Eds.) (pp. 1–13). Southampton,UK: WIT.
Faiz, A., & Sturm, P. J. (2000). New directions: Air pollutionand road traffic in developing countries. AtmosphericEnvironment, 34, 4745–4746.
Faiz, A., Weaver, C., Sinha, K., Walsh, M., & Carbajo, J.(1992). Air pollution from motor vehicles: Issues andoptions for developing countries (pp. 280). The WorldBank, Washington, DC.
Ghose, M. K., Paulb, R., & Banerjee, S. K. (2004). Assessmentof the impacts of vehicular emissions on urban air qualityand its management in Indian context: The case of Kolkata(Calcutta). Environmental Science & Policy, 7, 345–351.
Hall, J. V. (1996). Assessing health effects of air pollution.Atmospheric Environment, 30(5), 743–746.
Kojima, M., Brandon, C., & Shah, J. (2000). Improving urbanair quality in South Asia by reducing emissions from two
stroke engine vehicles (p. 46). Washington, DC: TheWorld Bank, South Asia Environment Unit.
Longhurst, J. W. S., & Elsom, D. M. (1997). A theoreticalperspective on air quality management in the UnitedKingdom. (In J. M. Baldasano, C. A. Brebbia, H. Power,P. Zannetti (Eds.), Air pollution-II, Vol. 2 (pp. 525–532).Southampton, Boston: Computational Mechanics.)
Longhurst, J. W. S., Lindley, S. J., Watson, A. F. R., & Conlan,D. E. (1996). The introduction of local air qualitymanagement in the United Kingdom: A review andtheoretical framework. Atmospheric Environment, 30(23),3975–3985.
Marshall, J. D., McKone, T. E., Deakin, E., & Nazaroff, W. W.(2005). Inhalation of motor vehicle emissions: Effects ofurban population and land area. Atmospheric Environment,39, 283–295.
Mashelkar Committee (2002). India Auto Fuel Policy Report,Mashelkar R.A. 2002. Report of the Expert Committee onAuto Fuel Policy, August 2002. India. Retrieved on 22ndMay 2006 from http://petroleum.nic.in/afp_con.htm.
Ministry of Road Transport and Highways (2004). Motortransport statistics, MORTH. Government of India, NewDelhi. Retrieved on 26th March 2006 from http://morth.nic.in/mts.htm.
Parikh, J. K., & Hadker, N. (2003). Economic impacts of urbanair pollution: Valuation for Mumbai, India. InternationalJournal of Environment and Pollution, 19(5), 498–515.
Sani, R. R. (2002). Newways to combat air pollution frommobilesources, Paper presented at Better Air Quality Workshop,Hong Kong. Retrieved on 25th march 2006 from http://www.cse.polyu.edu/hk/~activi /BAQ2002/ presentations.htm.
Walsh, M. P. (1994). Trends in automotive transport: implica-tions for environmental protection, energy efficiency andsustainable development. (March 28–30). Paper presentedat the international conference toward clean transport:Fuel efficient and clean motor vehicles, Mexico City.
Watson, J. G., Zhu, T., Chow, J. C., Engelbrecht, J. P., Fujita, E.M. & Wilson, W. E. (2002). Receptor modeling applica-tion framework for particle source apportionment. Chemo-sphere, 49(9), 1093–1136.
Weatherleya, N. S., & Timmisb, R. J. (2001). The atmospherein England and Wales: An environmental managementreview. Atmospheric Environment, 35, 5567–5580.
WHO (2000). Guidelines for air quality. WHO/SDE/OEH/00.02. World Health Organization, Geneva. Retrieved on12th June 2006 from http://www.who.int/peh/.
World Resources Institute WRI (1992). Urban air pollution inmega cities of the world (p. 39). Blackwell reference,Oxford, UK.
World Resources Institute WRI (1998). A guide to the globalenvironment. In collaboration with United Nations Envi-ronment Programme (UNEP), United Nations Develop-ment Programme (UNDP) and World Bank (IBRD), WorldResources (1998–99). Oxford University Press, New York.
Environ Monit Assess (2008) 136:257–265 265