uppsala center for fiscal studies
TRANSCRIPT

Uppsala Center for Fiscal StudiesDepartment of Economics
Working Paper 2013:10
After Apartheid: The Eects of ANC Power
Jonas Poulsen
Uppsala Center for Fiscal Studies Working paper 2013:10Department of Economics September 2013 Uppsala University P.O. Box 513 SE-751 20 UppsalaSwedenFax: +46 18 471 14 78
After ApArtheid: the eects of ANc power
JoNAs poulseN
Papers in the Working Paper Series are published on internet in PDF formats. Download from http://ucfs.nek.uu.se/

After Apartheid:
The Effects of ANC Power
Jonas Poulsen∗
Abstract
The African National Congress (ANC) can look back on eighty years of struggle which
resulted in the liberation of black Africans, the creation of a democratic constitution and free
elections. However, the last twenty years of ANC rule has been criticized for the failure to
bring higher living standards for the formerly oppressed. With the party’s dominance and the
challanges facing South Africa in mind, I estimate the effect of ANC power in municipalities
on economic, social and budgetary outcomes. To estimate the causal effect of the party, this
paper uses an instrumental variable approach developed by Freier & Odendahl (2012) and
a regression discontinuity design. Taken together, the results point to an adverse effect of
the party: less is spent on repairs and water provision which in turn may explain why ANC
power seems to lower the share of individuals who have access to piped water and electricity.
Further, more resources are used on municipal employees and the councillors themselves,
while I find suggestive evidence of an increase in the poverty rate due to the party. Lastly,
although being their major political support, we cannot conclude that the ANC affects black
African’s living standards. From the IV analysis, I find indications that oppositional parties
many times have a more positive impact on outcomes as they gain power at the expence of
the ANC.
Keywords: ANC, party effects, instrumental variable, regression discontinuity, South Africa
JEL: O12 H11 N47
∗Department of Economics, Uppsala University and Uppsala Center for Fiscal Studies. Address: Department
of Economics, Uppsala University, P.O. Box 513, SE-751 20 Uppsala. Email: [email protected]. I am par-
ticularly grateful to Eva Mork and Ronny Freier for their extensive help during the process of writing this paper.
In addition, without the many helpful staff members at Statistics South Africa, National Treasury and Electoral
Commission, this paper would not have been written. I am also indebted to Sebastian Axbard, Niklas Bengts-
son, Martina Bjorkman Nyqvist, Karin Edmark, Olle Folke, Eskil Forsell, Che-Yuan Liang, Andreas Madestam,
Mattias Nordin, Fabio Padovano, Alex Solis, David Stromberg, Jakob Svensson, Fredrik Savje, as well as seminar
and conference participants at Uppsala University, IIPF (Taormina) and EEA/ESEM (Goteborg). All mistakes
are my own.

1 Introduction
Few post-colonial countries can compare to South Africa’s highly successful transition to democ-
racy. In many instances, the transition can be attributed to the African National Congress’
reconsiliatory politics under Nelson Mandela.1 In the soon to be twenty years since the end of
apartheid, black Africans have gained their political freedom, many more have access to clean
water and electricity, a saluted constitution has been installed, and absolute poverty has gone
down. Indeed, the fact that the government has refrained from persuing retribution after F.W.
de Klerk left power in 1994 is a token of the willingness to change the country to the better
for all citizens. Nonetheless, as the Economist notes [9], the problems facing the country are
numerous:
”In the past decade Africa to the north of the Limpopo river has been growing
at an annual average clip of 6 per cent, whereas South Africa’s rate for the past few
years has slowed to barely 2 per cent./.../ Foreign investment is drying up. Protests
against the state’s failure to provide services are becoming angrier. Education is a
disgrace: according to the World Economic Forum, South Africa ranks 132nd out
of 144 countries for its primary education and 143rd in science and maths. The
unemployment rate, officially 25 per cent, is probably nearer 40 per cent; half of
South Africans under 24 looking for work have none. Of those who have jobs, a
third earn less than $2 a day. Inequality has grown since apartheid, and the gap
between rich and poor is now among the worlds largest.”
Due to its complete political dominance, these seemingly failures have all been under the
ANC’s watch. Celebrating its centenary in 2012 and twenty years with freedom in 2014, several
issues have recently been raised dealing with the ANC, the major one being how South Africa
will cope after Mandela. Also, facing a general election in 2014, it is not obvious that the
support for the party will be as strong as during the last twenty years; corruption charges
against President Zuma and increased political competition from the Democratic Alliance and
Mamphela Ramphele’s newly established party Agang put the ANC’s popularity under pressure.
This paper seeks to measure the effect of ANC power on economic and social outcomes in a
very broad sense. The party’s dominance and the challanges facing South Africa highlight the
importance of exploring how the ANC affects the country it governs. By exploiting close mu-
nicipal elections, I utilize an instrumental variable approach (IV) and a regression discontinuity
design (RDD) to measure the specific party effect on several municipal-budget outcomes, service
delivery, unemployment and poverty. All in all, my results point towards an adverse effect of
ANC power, although we should be careful when interpreting the results due to some robustness
issues, thoroughly discussed under Section 4.3.
Since the ANC represents a particular set of voters, an estimation where we simply compare
municipalities with an ANC majority to municipalities with an ANC minority would suffer
1For an excellent overview over South Africa and the ANC after apartheid, see Alec Russel’s After Mandela:The Battle for the Soul of South Africa (2009)
2

from an endogeneity problem; the results would probably say more about the voters than the
party. To control for this issue, I start out by following recent research using the RDD in
an election setting (these include Ferreira & Gyorko [15], Lee et al. [29], Pettersson-Lidbom
[42], Meyersson [38]) using data from the 2000 and 2006 municipal elections and outcomes from
municipal budgets from 2004/2005 and 2010/2011 as well as 2011 census data. Having a mixed-
member proportional representation system implies that municipalities where the ANC receives
more than 50 per cent of the seats are in effect governed by an ANC majority. Consequently,
if the party wants to implement a policy or alter the budget from last year in conflict with the
minority, they will do so by winning the vote in the municipal council. The idea is then to
use this fact and compare outcomes for municipalities where the ANC vote share or seat share
are just over 50 per cent to municipalities where they are just below 50 per cent, a comparison
which should be as good as random.
However, the RD approach hinges on the assumption that the winning threshold is 50 per
cent. In a proportional election system such as South Africa’s, there are no fixed thresholds.
Thus, I employ a novel method developed by Freier & Odendahl [17] that uses close election
outcomes as a source of exogenous variation to estimate the effect of parties on policy outcomes.
Following the authors, I am isolating close elections by repeatedly perturbing the vote vectors
of each party in each municipality, adding a random variable to the vectors. Subsequently,
new seat allocations are simulated for each party. Those observations for which seat allocations
changes often are considered close. These close seats - i.e. a seat that a party was close to
losing or winning, but did not - are then instrumented for. Since seat shares add up to one
by definition, I leave out the ANC from these IV regressions and estimate the effect of gains
in other parties’ seat shares at the expense of the ANC on outcomes. These other parties are
the Democratic Alliance and the Inkatha Freedom Party, for which I present a background in
Section 2. As to the comparability of the results from these two methods, for parties that are
true contenders to the ANC such as the DA in Western Cape and the IFP in KwaZulu-Natal, it
might be reasonable to expect opposite signs between the IV estimates and the RD estimates.
With the aforementioned specifications, this paper puts forward three sets of results. First,
by analyzing revenues and expenditure from municipal budgets, I find suggestive evidence that
property rates as a revenue source drop when the ANC loses seat shares, while an ANC-led
municipality receives less revenues from service charges. Looking at municipal expenditure,
it seems as if less is spent on employees and the councillors themselves when ANC loses seat
shares. Furthermore, being a highly debated subject in South Africa, I investigate the effect
of ANC power on three spending variables that have to do with service delivery. For spending
on infrastructural repairs and maintenance, the RD estimates are negative. Also, ANC power
seems to lead to less spending on water provision. No evidence is found of an effect on electricity
delivery. A rather puzzling result is that on inter-governmental grants which shows positive
estimates using both methods, i.e. an ANC majority leads to more revenues stemming from
grants (RDD), but grants as a revenue source also seem to increase as other parties gain seat
shares at the expense of the ANC (IV). I conclude that these conflicting results may be caused
3

by the local average treatment effects entailed by the RD approach.
Second, analyzing the effects of ANC power on social and economics outcomes, I find sugges-
tive evidence of a negative effect on the share of individuals with electricity. Since no conclusions
could be drawn regarding the ANC’s effect on spending on electricity, this result may instead
be explained by less repairs and maintenance. Likewise and in line with the finding that less
is spent on water provision, I find that a smaller share have access to piped water inside their
dwellings as a consequence of ANC power. From the IV estimates, one suggestion is that this
also is due to the Inkatha Freedom Party. Exploring two major economic outcomes, I find no
effect on unemployment and only suggestive evidence that ANC power leads to a higher poverty
rate.
Lastly, and noteworthy in light of ANC’s goals since the end of apartheid, it seems as if no
conclusive evidence of a causal effect of ANC on black African’s living standards can be discerned.
It is undoubtedly so that the ANC has been the main driving force behind the freedom that
black Africans enjoy in today’s South Africa. However, underlined by this paper, the causal
effect of today’s ANC is in many ways adverse, and it does not seem as if the party is better at
promoting living standards for black Africans than the political opposition. These findings are
yet more conspicuous in a country where such a party receives overwhelming electoral support.
However, I of course cannot say anything about living standards in the sense of living free
from oppression. Being the movement that brought this freedom to black Africans, it might be
understandable that the party receives vote shares as big as those we have seen up until now.
Below, Section 2 describes the institutional framework and Section 3 describes the IV and
RD approaches and the data used in the analysis. Section 4 goes through the empirical results
and examines the validity of those results. Section 5 concludes the paper.
2 Institutional Framework
2.1 Local Government and Elections
Having three tiers of government, South African voters elect representatives at the national,
provincial and local levels, of which this paper focuses on the local sphere. Local government
is made up of municipalities which in turn are subdivided into metropolitan municipalities and
(226) local municipalities nested within district municipalities.2 [46] The first municipal election
after the end of apartheid took place in 1995/1996 and was followed by elections in 2000, 2006
and 2011. Due to institutional remnants from the apartheid regime and demarcation disputes,
the 1995/1996 election was delayed in the provinces Western Cape and KwaZulu-Natal and thus
deemed not entirely democratic. [31] As a consequence, I exclude that election from the analysis
and focus on the 2000 and 2006 elections (the 2011 election is too close in time for obtaining
outcome data).
2Due to its inclusion of the local municipalities, the district municipalities (as defined in year 2000 and 2006)are dropped in the empirical analysis. There are however district management areas made up of scarcely populatedareas and nature reserves that are taken into account in the analysis.
4

Municipal elections follow a mixed-member proportional representation system (MMP) and
each municipality has a council consisting of elected members. The council successively elects
a mayor who have at her disposal a mayoral committee made up of councillors. Parts of the
council representation mirror the proportion of votes a party receives, i.e. 50 per cent of all seats
are given by proportional representation, while the other half is made up of ward councillors
elected through a first-past-the-post system by the residents of each ward. It is in this sense the
system is ”mixed”. In order to perform the necessary simulations for the estimations of the IV
regressions (presented in Section 3) as described in Freier & Odendahl [17], we need to have a
full understanding of the MMP system. The total number of seats for each party are allocated
by the largest remainder method, utilizing a modified Hare quota (or a modified Droop quota
to be more precise). The principle behind the largest remainder method is to first calculate the
number of votes required for a seat, resulting in a quota. Each party’s votes are then divided by
this quota and the integer of the resulting fraction gives the first allocation of seats. In the final
step, unallocated seats are distributed on the basis of the remaining decimals after subtracting
the integer (hence the name of the method). For example, if there are three seats left to allocate,
the three parties with the highest remaining fractions left after subtracting the integer will each
receive one more seat in the municipal council.
In the South African context, the quota is calculated as follows:
Q =V
S − I+ 1
where V is the total number of votes for all parties (including wards and excluding votes
on independents), S is all available seats in the municipal council (determined in terms of the
Local Government Structures Act of 1998), and I is the number of independent candidates (in-
dependents can only run in ward elections). The total number of seats allocated to party i is
then given by:
viQ
= si1 + si2
Here, vi is party i:s total number of votes. si1 is the integer of the fraction and thus the first
allocation of municipal-council seats. si2 is the remaining decimals after subtracting the integer
that determins whether party i receives one more seat in the second allocation. For clarity, the
method is best described by an example. A municipality has three parties: the African National
Congress, the Democratic Alliance, and the Inkatha Freedom Party. There are seven available
seats in this municipal council. We assume that sDA,1 + sDA,2 = 1.68, sIFP,1 + sIFP,2 = 1.47,
5

and sANC,1 + sANC,2 = 3.52. Thus, in the first allocation, the DA receives one seat, the IFP
receives one seat, and the ANC receives three seats. In the second allocation, the DA is ranked
first and the ANC is ranked second so that they both receive one more seat, while the IFP ends
up with one seat. [25]
The rudimentary functioning of the ward councillor - together with her maximum of ten
ward-committee members elected during constituency meetings - is to facilitate participatory
democracy on a local level. [39] The powers vested in the ward committee are mainly advisory,
and usually take the form of recommendations to the municipal council. There are however
instances when the municipal council delegates essentially any duties to the ward committees,
and it is up to the council to do so. [39] The most important thing to note about the ward
councillor is that she sits in the municipal council and has the same powers as those councillors
elected through proportional representation.
The council’s main duty is to pass a yearly budget that stipulates how to finance their
responsibilities. Examples of these responsibilities that are vital for this paper are electricity
and water delivery and the approval of a development plan. Of course, the council passes laws
that revolve around these duties, and they set rates and service fees. [13] Municipal governments
receive their funds from state government grants (these are mainly for infrastructure investments
such as water service projects), public and private partnerships, municipal revenues, internal and
external loans, and property rates, service charges, and fines. [12]
There are however multiple evidence of how local governments have failed to deliver services,
with whidespread protests as a consequence. Corruption has been said to be rife, and councillors
have been accused of living in excess while neglecting the delivery of services. In one instance,
in January 2006, a municipal manager resigned after granting a two million Rand loan to a
municipal colleauge without the approval of the municipal council. [21] In 2005, municipal
officials in the Mangaung Municipality were charged for defrauding their municipality of at least
100 million Rand. [30] Moreover, The New York Times has reported on lethal violence over
political posts, all the way down to the ward level. [41] The importance of service delivery, and
the seemingly failure of providing it, put the issue on top of priorities before every local election.
2.2 ANC and Its Opposition
With the RD approach I analyze the effect of ANC majorities in municipal councils on policy
outcomes and in the IV regressions (both approaches are described in the next section) I leave
out the ANC and analyze the effect of increases in the DA’s and IFP’s seat shares at the expense
of the ANC on policy outcomes. It is thus important to give an introduction not only to the
African National Congress, but also to the Democratic Alliance and the Inkatha Freedom Party.
In many ways, the ANC has led a succesful transition from white minority rule to a stable
political system, perhaps the most progressive constitution in the world, higher growth rates
than during the apartheid years, strong judicial courts, and free elections. However, as noted by
Jeffrey Herbst [22], today’s South Africa also encompasses a very dominant ANC that ”effectively
6

rules the country on its own, viewing any kind of opposition with suspicion”. The burden of
HIV and AIDS, growth rates that are far from lifting the black population out of poverty, and
one of the highest inequality rates in the world, lie heavy on the country. Due to its complete
political dominance, these problems are and have all been under the supervision of the ANC
government since apartheid ended, and the party has been torn between black emancipation
and white flight (c.f. [10]), macroeconomic stability and social demands [7], and ideological left
and right formations within the party [36].
Despite the aforementioned, the ANC enjoys an overwhelming electoral support in South
Africa, also on a local level. The party obtained vote shares in the 2000, 2006 and 2011 municipal
elections amounting to 59.4 per cent, 66.3 per cent and 62 per cent respectively. Parts of this
support come from a genuine appreciation of ANC performance, while others stem from the fact
that dissatisfied black voters who cannot identify with the ANC still have highly negative views
of all other parties [34]. As Mattes notes [33], this ANC hegemony has encouraged the party to
become more centralistic in the sense that the national party extends their powers to the local
level (Butler [6] also writes about the ANC’s internal organisational democracy). For example,
a local mayor is now nominated by a central committee instead of a local ANC branch.
Moreover, on a local level, widespread protests have been abundant, demanding better and
cheaper service delivery and housing. Many of these protests took place in municipalities run by
the ANC. Atkinson [3] tells the story of Phumelela Municipality (79 per cent ANC support in
the 2000 local election and 81 per cent in 2006): consumer debts had risen with 39 per cent from
2003 to 2004, reflecting popular alienation. 45 per cent of the operating expenditure were spent
on salaries, while the guideline from the National Treasury sets the maximum at 35 per cent.
The municipal manager had not entered a performance agreement with the council and in effect
broke South African law. When the council subsequently got dissatisfied with the leadership,
the manager was redeployed to another, malfunctioning municipality. At the same time, only 16
per cent of Phumelela Municipality’s population had access to sanitation, the roads were bad,
many had to use a bucket toilet system, and into the water reservoir poured water contaminated
by waste from another source. There are several potential explanations why problems similar to
this example may exist. One is the fact that almost 49 per cent of ANC branches are seasonal
[3], i.e. the councils only work a few months before major events such as an ANC conference.
Another is the trend that ANC councillors do not live in the poverty-stricken municipalities they
represent, but rather move to middle-class suburbs [3]. Lastly, and highlighted by the internal
ANC document Patronage and Criminalisation of the ANC [3], there is evidence and suspicion
of corruption among municipal councillors (see Section 2.1), taking the form of nepotism in
the appointment of municipal staff. Looking at actual outcomes, anechdotal evidence point to
several failures of the ANC government, such as a presumed deficit of more than 500,000 paying
jobs [45]. These qualitative evidences but also the lack thereof are all strong arguments for
exploring the causal effect of ANC power on the South African society.
Up until today, the only opposition that pose somewhat of an electoral threat to the ANC is
the Democratic Alliance. In the 2000 municipal election, the party received 22.1 per cent of the
7

votes, and 14.8 per cent in 2006. Their main support is found in the Western Cape. The party
traces back to the anti-apartheid movement and was known as the Progressive Party and later
the Democratic Party. Through its short-lived alliance with the New National Party (the former
ruler) it took on today’s name. Historically seen, the DP and the NNP have targeted Afrikaner
and English whites, Coloured and Indian voters, which has prompted the ANC to interpret
the alliance ”as a ganging up of white parties” [19]. Today’s DA is very different, however,
especially after the re-launch in November 2008 that sought to turn the party’s interest to all
South Africa’s people. [32] Yet, it should be noted that the DA only received five per cent of
the black vote in the 2011 municipal election [11].
Although the ANC has a huge electoral advantage, there has been a fierce competition
between the two parties the last couple of years. Often, this competition has taken the form of
attacks playing on racial and party stereotypes. For example, some ANC politicians have accused
the DA for ”taking the country back to the apartheid days of racial division, inequality and
oppression” [11]. Even President Jacob Zuma mentioned the DA’s supposedly white character
in the run up to the election. This apparent tention and the prevailing inequalities between
black Africans and whites that arose because of the apartheid system, permeat the social debate
in South Africa and many times spill over on the competition between the ANC and the DA.
The third largest party in South Africa is the Inkatha Freedom Party (it is however the fourth
largest party in the National Assembly today, following Congress of the People).3 The party
received 9.1 per cent of the local-election votes in 2000, 8.1 per cent in 2006, and 5.2 per cent
in 2011. The lion’s share of IFP’s political support comes from the province KwaZulu-Natal,
which can be explained by the fact that the party was established there in 1975 and has a clear
historical connection to the Zulu people. The often fierce debates between the ANC and the DA
seem to have much to do with today’s political competition. As for the relationship between
the ANC and the IFP, the situation can only be described as even harsher. This tension sprung
up in the later years of the apartheid system following the organizations’ differing views on
how to best bring down the white-led regime. Inkatha was a major anti-apartheid movement
with approximately 350,000 members around 1980, but the leaders of Inkatha also formed the
leadership of KwaZulu-Natal, a so called Homeland (also known under the name Bantustan),
which led them to have contacts with the apartheid regime. These contacts culminated in a
collaboration with the right-wing extremist Conservative Party and two other Homelands, who
together proposed federal solutions to ending apartheid rather than majority rule which was
what the ANC argued for. Thousands of people died in what can be described as outright
warfare between the two fractions and the conflict was only solved just in time for the first
democratic election. [44] The tension between the two parties remains until today and can be
traced in IFP goals such as preventing ”the consolidation of a one-party state”, found in the
party’s manifesto [26].
3Other important - although rather small - political parties in South Africa are for example National FreedomParty, United Democratic Movement, African Christian Democratic Party and Pan Africanist Congress. In theIV regressions, these and other parties form the variable Others.
8

The seemingly slow process of increasing the black population’s living standards and lower
the inequality between population groups in post-apartheid South Africa is an argument for
analyzing the causal effect of the ANC on black African’s living standards separately. Around
80 per cent of the South African population are black Africans, while slightly less than 10 per
cent are made up of whites.4 Looking at the summary statistics in Table 2 which are divided
between black Africans and whites to set living standards in proportion, it is clear that living
standards differ immensely between the two groups. For example, in this sample, 30 per cent
of black Africans have piped water inside their dwelling compared to 85 per cent of the white
population,5 and black Africans have an unemployment rate of 40 per cent compared to ten
per cent among whites. The demographical feutures of the black and white populations also
correspond to that of many less developed respectively developed countries: the share of black
Africans under the age of 19 years is more than 40 per cent while it is less than 25 per cent for
whites. Also, as is apparent from the summary statistics, poverty rates are high for both groups.
An official poverty line has long been discussed in South Africa (c.f. [49], [48] and [37]) and in
this paper I define poverty as monthly earnings below R400. This level is somewhat higher than
the famous $1.25 per day, but still very conservative.6
The question is then whether the ANC focuses on policies aimed towards the black population
to higher extent than the other parties, further investigated in the econometric analysis. One
such affirmative action policy is the Black Economic Empowerment (BEE). The policy aims
at coming to terms with the economic disparities created by apartheid, by promoting black
Africans to senior positions in corporations, shift equity ownership from whites to blacks, giving
black-owned companies an advantage in the bidding for public works contracts, and establishing
industry-specific racial targets of ownership. [22] Thus, I run the same regressions for black
Africans as I do for the entire population. Lastly, it should be noted that the DA’s position on
BEE is not far from the ANC’s [8].
3 Data and Empirical Strategy
3.1 The Causal Effect of ANC Power in Municipalities
The chance that the ANC represents a particular set of voters would make us draw the wrong
conclusions were we to estimate the effect of ANC rule with an OLS approach. To be more
precise, if we compare unemployment, income, service provision and municipal budgets where
the ANC has a majority of the council seats to all municipalities where the ANC has a minority
of the seats, it is very likely that we find unemployment, incomes, and degrees of access to piped
water and in-house electricity that reflect what may be specific to ANC voters. Such an analysis
would most likely not say much about the performance of the ANC, but rather that their voters
4Unlike during the apartheid system when government officials decided which individual belonged to whichracial group, today’s South Africans define themselves as either black, Indian, Coloured or white.
5As Mattes notes [33], it should be emphasized that two million more people now have access to electricityand seven million more to water since 1994.
6The national poverty line is $43 per month in current prices (July 2013)
9

encompass some common characteristics. Instead, this paper utilizes two different methods to
estimate the causal effect of ANC power. First, it follows several recent works (these include
Ferreira & Gyorko [15], Lee et al. [29], Pettersson-Lidbom [42], Meyersson [38]) in that it uses
the regression discontinuity design to identify the specific party effect on economic and social
outcomes. By utilizing the fact that the ANC’s control changes discontinuously at 50 per cent
of the power in the council, I am able to compare the treated municipalities (i.e. those that are
governed by a slight ANC majority) to municipalities that can be considered controls (i.e. those
that are just barely not governed by an ANC majority). One underlying assumption is that
the ANC could be seen as forming one block in South African politics, while ”the rest” forms
the other. I thus treat the electoral system as bipartisan, so when the treatment indicator, Di,
equals one we know that the ANC has a majority.
Assuming that the political landscape is bipartisan is highly problematic however since there
are examples of municipalities where the ANC receives less than 50 per cent of the vote share,
but still constitute the majority in the council. It could also be that the ANC attains, say, 46
per cent of the council seats, but create a coalition with a party that gives the parties more
than 50 per cent of the seats. Such a municipality would (wrongly) be treated as a control in
this estimation. Nevertheless, ANC’s former coalition partners the South African Communist
Party and the Congress of South African Trade Unions have been internalized via the Tripartite
Alliance, a fact that makes other coalition much less likely although not nonexistent. Accepting
the assumption of a bipartisan electoral system, we have:
Di =
1 if xi ≥ x0
0 if xi < x0.
where xi is the ANC’s power in municipality i and x0 is 50 per cent, i.e. our known threshold
for ANC to have the majority of power in the municipality council. This is the sharp RD design
(Hahn & Van der Klaauw [20], Imbens & Lemieux [23]) that exploits a rule-based discontinuity
in the forcing variable to measure the causal effect of treatment. In this setting, the forcing
variable is the ANC vote share or seat share and the cut-off value of 50 per cent solely deter-
mines the treatment assignment. If xi < x0, the ANC does not have the majority of power in
the municipal council. In such a case, those municipalities work as a control group. Looking at
the figure of the relationship between ANC’s vote share and seat share, it is clear that it is not
one-to-one. Thus, it is not obvious which one should be used as the running variable. On one
hand, using the seat share takes the institutional setting into account since a majority of seats
at least in theory reflects a majority of power and vice versa. On the other hand, using the vote
share respects the RDD assumption that we compare municipalities that, other than treatment,
are similar to each other (e.g. voters have similar preferences). To control for this discrepancy,
I show results using both the seat share and the vote share. The RDD specification used in this
10

paper can be described as follows:
Yi = α+ ρDi + f(xi) + ui (1)
∀xi ∈ (x0 −4, x0 +4)
where Yi is the outcome, Di is the treatment indicator, xi is the forcing variable, and4 is the
bandwidth around x0. The smooth function f(xi) usually takes on an n-order polynomial in the
forcing variable on each side of x0 and within 4. I follow recent work and use a nonparametric
approach in the local linear regression (Hahn et al. [20], Porter [43], Imbens & Lemieux [23])
and set an optimal bandwidth such as specified by Imbens & Kalyanaraman. [24] To test the
robustness of the estimates, I include estimations with a quadratic specification, utilizing all the
data.
As already stated, the above RD approach hinges on the assumption that the winning thresh-
old is 50 per cent. However, in a proportional election system with more than two parties such
as South Africa’s, there are no fixed thresholds. In essence, this fact means that the ANC’s seat
share not only depends on its vote share, but also on the vote shares of all other parties in the
council. A solution to this identification problem has been proposed by Freier & Odendahl [17],
which I use in this paper.7 To estimate the causal effect of political power on policy outcomes,
they use the fact that voting power in a council changes when parties barely lose or gain seats.
To isolate close elections, the vector of votes for each party is repeatedly perturbed by adding a
random variable. Using the specific seat-allocation function (South Africa’s is described in Sec-
tion 2.1), it is then possible to simulate new seat allocations. Municipal elections for which seat
allocations change often following the simulations are considered close. These close seats - i.e.
seats that a party were close to losing or winning, but did not - are subsequently instrumented
for.
In practice, for each observation i with vote vector vi and the known seat allocation, Freier
& Odendahl [17] add a vector ri of independently normally distributed random variables to the
vote vector. ri has expectation zero and variance (kvji )2. k per cent of the votes of party j is
thus the standard deviation of the random variables, ri. The seats for party j in municipality
i are then considered close if the allocation changes more than q per cent of the time following
repeated pertubations.8 Since approximately 13 of the probability mass lies outside the mean
7See their paper for a thorough explanation. In their main specification, they estimate how changes in votingpower of parties affect policies. The concept of voting power builds on how many times party i are critical in acoalition, i.e. if a coalition including party i is a winning one. Since the ANC will be critical in most coalitions, Iinstead use their estimation specification for seat shares, described in their appendix. That specification is similarin idea to what Folke (2012) has developed.
8In this paper, the vote vector is perturbed a 1000 times using three different values of k.
11

plus/minus one standard deviation for a normally distributed random variable, one more ob-
served seat for party j in municipality i in 16th of the perturbations should mean that around
one standard deviation in vote change was needed for this change in seat allocation. Thus, we
set q = 16 . Now we can define a closeness dummy that will ensure that the instrument (defined
below) only is such for the municipalities where party j was close to lose or gain a seat:
cji =
1 if seat allocation was close to change
0 otherwise.
Due to the identification issues mentioned under the discussion about the RDD, we need to
define a treatment variable that can be used as instrument for seat shares. Following Freier &
Odendahl, this treatment variable tji takes on the value +12/Zi in a council of size Zi if we find
that a party was close to losing a seat following repeated perturbations of the vote vector (the
authors call it positive treatment), and −12/Zi in the opposite case (negative treatment). The
treatment variable can thus be summarized as follows:
tji =
+1
2/Zi for positive treatment
−12/Zi for negative treatment
0 otherwise.
These values ensure that the difference between positive and negative treatment is measured
in terms of seat shares. The IV specification used in this paper can then be described in the
following way:
Yi = α+∑j
βjsji + f(vi) + Xiγ + cji + µi + ei (2)
where f(vi) is a flexible function taking on a second-degree polynomial of each party’s vote
share, cji is the closeness dummy described above, and µi is a municipality fixed effect. Xi
captures the size of each council, a year indicator and an indicator if the party received zero
votes. The seat shares of each party, sji , are instrumented for with the treatment variable tji .
In these estimations, I leave out the ANC since the seat shares add up to one. Doing so for
the ANC is not problematic since it is the biggest party and participates in almost all of the
local elections. We thus interpret the coefficient of interest, β, as the effect on policy outcomes
12

of an increase in party j’s seat share by one per cent at the expense of the ANC.
It is important to note that the results from the IV estimations are not directly comparable
to the results from the RD estimations, since the RDD measures the effect of an ANC majority
on policy outcomes. However, if we for example find that an increase in Democratic Alliance’s
seat share at the expense of the ANC leads to more resources being spent on repairs, we might
expect that an ANC majority would lead to less being spent on repairs. In other words, for
parties that are true contenders to the ANC, such as the DA in Western Cape and the IFP in
KwaZulu-Natal, it might be reasonable to expect opposite signs between the IV estimates and
the RD estimates.
3.2 Data Description
I utilize the 2000 and 2006 municipal election results provided by the Independent Electoral
Commission of South Africa. [25] The main issue contested revolved around service delivery,
in particular to townships, and widespread protests due to the failure of providing water and
electricity preceded both elections. [30]
This paper first presents results on the effect of ANC power on municipal budgets and subse-
quently analyze if these affect service-delivery outcomes and major economic outcomes, using the
same methods. Starting with the first estimations, I test the effect of ANC power on outcomes
from the municipal budgets set by the councils. The data comes from the National Treasury.
[40] I start out by looking at the revenue composition in the form of revenues coming from prop-
erty rates, service charges and government grants. Apparent from the summary statistics in
Table 1, the greatest revenue source is government grants, i.e. state-level grants from the ANC
government.9 Service charges stem from payments of services such as water and electricity, and
property rates are revenues from what is essentially a progressive tax on property values. [40]
From municipal expenditure I analyze the effect of ANC power on employee costs, councillor
remuneration, repairs and maintenance, and water and electricity expenditure. Looking at Table
1, more is spent on water than electricity, while employee costs make up the greatest part of
municipal expenditure. Due to better availability compared to the data mentioned below, I can
utilize both the 2000 and the 2006 local elections and analyze their effects on outcomes four
years later (2004/2005 and 2010/2011).10
In the second set of estimations, the dependent variables of interest are poverty, unemploy-
ment, and service delivery in the form of electricity and water provision. I have chosen to
analyze this set of outcome variables since they capture some of the most debated legacies of the
apartheid regime. Water and electricity provision are the outcomes among the aforementioned
9These grants could take many forms. For example, they can be either conditional (Municipal infrastructuregrant, National Electrification Programme, disaster relief, 2010 FIFA World Cup stadiums development grant etcetera) or unconditional. Due to the scope of this paper, I simply analyze the effect of ANC power on the bulkof grants, although some of these grants should not be affected by party politics. This however accrues to allmunicipalities across South Africa.
10Other possible budgetary variables include: regional service levies, investment revenue, public contributionsand donations, depreciation and amortisation, finance charges, materials and bulk purchases, grants and subsidies,external loans, housing costs, and roads and storm water expenditure.
13
that, ex ante, are most likely to be directly affected by the municipal council. In a second stage,
I analyze the effect of ANC power on black Africans’ living standards seperately since the ANC
has had the equalization of living standards between black Africans and whites as one of their
main goals since the liberation. [35]
After 2000 (the first possible election to utilize) there exist three data sets on the South
African population, collected by Statistics South Africa [47]: a population census conducted
in 2001, a community survey conducted in 2007 that took the place of the 2006 population
census, and another population census conducted in 2011. The timing of the elections and the
population data give me three possible estimation strategies, shown in Figure (c). First, I could
use variations in the 2000 election results matched to the 2001 census results and the 2006
election results matched to the 2007 survey results. Essentially, this would be an estimation
of the short-term effect of ANC power. Second, it would be possible to aggregate the 2000
election results on the 2007 survey and the 2006 election results on the 2011 survey. This would
however be problematic since the 2007 survey overlaps the 2006 election. Lastly, I could simply
estimate the effect of variation in the 2006 election on outcomes from the 2011 population census.
Although this strategy limits the sample size, it is more likely that a presumed effect of ANC
power has developed on this longer time period compared to the first strategy, and is thus used
here.
All data are on a municipality level and is divided into categories (e.g. ”Piped Water Inside
Dwelling”, ”Piped Water Inside Yard” and so on). I thus create the outcome variables by dividing
the number of individuals within the particular categorie by all individuals in the municipality
(the workforce in the case of unemployment), so that I get the share with piped water inside their
house in municipality i. Likewise, when analyzing the effect on black Africans’ living standards,
the outcome variable would for example be the share of black Africans among all black Africans
with water inside their dwelling. I have chosen how to construct variables according to ”worst”
or ”best”. That is, what is ”best” is to have electricity for the purpose of cooking or heating,
and water inside ones dwelling. What is ”worst” is to be unemployed or be under a poverty
line.11
4 Results
4.1 Municipal Budgets
The main tool that the municipal council has at its disposal is the yearly municipal budget. In
it they stipulate their revenues and expenditure. To get the broad picture of the workings of the
11Apart from those mentioned above, the variables provided by Statistics South Africa include phone service,household size, household goods (only for 2001), refuse or rubbish disposal, toilet facilities, disability, occupation,educational level, mode of travel to school or work, cellphone use, computer and internet use, post facilities, andsocial grants (only for 2007). Among these, I would have wanted to include household goods and social grantsinto the analysis, but they are only collected for one year. Educational level would also have been interesting toanalyze, but schools are foremost the responsibility of the provincial governments [27], not the municipalities.
14
councils, I include several outcomes in the analysis.12 Tables 3 to 10 display the results from the
IV and RD estimations of the effect of ANC power on municipal-budget outcomes, each table
giving the results for each seperate outcome variable. The tables are divided in two parts, one
for the IV results and one for the RD results. The first three columns in the IV part show the
results using three different values of the parameter k in the perturbations. Moving from k = 1%
to k = 2% or k = 5% expand the sample that is used for the estimations. The lower we set k,
the higher is the requirement for closeness. Thus, for causality claims, k = 1% is more reliable
than , say, k = 5%. However, with a sample size as small as in this paper, we might expect that
we need a less demanding size of k - such as k = 2% or k = 5% - for significance. In the RDD
part I display results using seat share and vote share as running variables. The regressions are
run with a specification using an optimal bandwidth and a quadratic polynomial specification.
Following recent work on RDD, I start out with a graphical analysis. Figure 1 illustrates
local averages for the budgetary outcomes plotted against the ANC seat share in bins of four per
cent. The thin gray lines are standard confidence intervals. Interesting in itself, and common to
all estimations throughout, it seems as if closer elections lead to better outcomes. This would be
logical if we believe that more cooperation within the council is good for the political process.
Looking at Figure 1, we cannot determine any clear jumps at the cut-off point for property
rates as a share of revenues, employee costs and spending on electricity delivery, and only weak
evidence of discontinuities for service charges as a share of revenues, councillor remuneration,
and repairs and maintenance. There is a more obvious positive jump for inter-governmental
grants and a negative jump for expenditure on water provision. Although these graphs give
quite weak evidence of an effect of ANC power,13 a general pattern can be disentangled looking
at observations close to the cut-off point: ANC power seems to lead to less revenues stemming
from service charges, more revenues stemming from grants, a higher expenditure on councillors,
and lower expenditure on repairs and water provision.
Since the redistribution of wealth is one of the ANC government’s main goals, I use the
amount received from property rates as a proxy for this.14 The property rate is an essential
instrument for redistribution and is independently set by the municipal council. If we believe
that the ANC cares more about the issue of racial inequality, we should expect a positive effect
of the party’s power on property rates as a share of revenue. As was evident from the graph,
we find no significant effects of ANC power on property rates in the RD estimations looking at
Table 3. The coefficents are negative, but the standard errors are quite large. However, looking
at the IV estimates, we find at least some evidence of less revenues from property rates when the
DA increases their seat share at the expense of the ANC. This finding is in line with the above
hypothesis that the ANC might care more about redestribution. Of course, it could also have
something to do with higher rates per se. For revenues stemming from service charges, we find no
reliable significant results from the IV estimations, while the RD results give that less revenues
12The outcome variables are property rates, service charges, government grants, employee costs, councillorremuneration, repairs, and water and electricity expenditure.
13If I instead use the vote share as running variable, the jumps are much more obvious.14I would rather have want to use the actual rate, but have not been able to collect that for each municipality.
15
come from service charges as a consequence of ANC power. This finding was indicated by the RD
graph and may be explained by less services delivered by ANC-run municipal councils, further
analyzed below. For the last revenue source - inter-governmental grants - the results are more
puzzling since the IV estimates and the RD estimates go in the same, positive direction. What
Table 5 says is that an ANC majority relies much more heavily on grants from the government,
amounting to around 20 percentage points more compared to municipal councils in the control
group. At the same time, the IV estimations give that as the Democratic Alliance and Others
increase their respective seat shares at the expense of the ANC, more revenues come from grants
in those municipalities where that happens. Since the DA, for example, often constitute a large
part of the control group in the RD estimations, it would be reasonable to expect opposite signs
here, at least for that party. These conflicting results might be explained by the potential bias
in the RD set up for this particular setting, as was discussed in Section 3.1. A more likely
explanation, however, is that the RD results are highly local, further discussed under Section
4.3.
Moving on to analyze municipal expenditure, we can first note from Table 6 that no sig-
nificant effects of ANC power on employee expenditure can be found in the RDD part of the
table, as was evident from the graph. The IV analysis nonetheless quite clearly shows that less
seem to be spent on municipal employees as DA and IFP gain seat shares at the expense of the
ANC. Likewise, as Inkatha Freedom Party gains seat shares at the expense of the ANC, less is
being spent on the councillors themselves. This finding is also somewhat supported by the RD
analysis, although we only have significant results with the vote share as running variable. The
estimations with seat share as running variable point in the same direction, but the results are
less precise.15
One less obvious variable to analyze is how much out of total expenditure is spent on repairs
and maintenance. Since service provision not only needs investments in new water pipes and
electricity lines et cetera, but also maintenance of what is already existing, this variable is
important to investigate. The RDD part of Table 8 display a negative effect of ANC power on
the expenditure on repairs. This effect was also indicated by the graph in Figure 1. Looking at
the IV results, we only find suggestive evidence of a positive effect on repairs expenditure when
the DA gains seat shares at the expense of the ANC. As for actual spending on water delivery,
the RD estimates are large and negative. Accordingly, we find that as Others increase their
seat share at the expense of the ANC, more is being spent on water provision, at least when
k = 2%. As was clearly stated by the RD graph, we find no conclusive evidence of an effect of
ANC power on electricity delivery.
15The discrepancy in significance levels between the seat share and the vote share as running variables is furtherdiscussed in Section 4.3. Some municipalities have differing treatment status depending on which running variableis used. If these municipalities are dropped from the analysis, the estimates and their significance levels becomemuch more comparable.
16
4.2 Economic and Social Outcomes
Having the above discussion in mind when we analyze actual water- and electricity provision,
unemployment and poverty, it seems reasonable to expect negative effects of ANC power at least
on service provision, and thus positive effects for some of the other parties. Looking at Figure 2,
we indeed find negative - although weak - jumps in the shares with electricity and piped water
inside their dwellings, and a weak positive jump in poverty. In general, these effects cannot be
discerned for black Africans.
Starting with an analysis of service provision, it seems as if ANC power leads to lower
electricity delivery, albeit the results are suggestive since we only have significant results using
vote share as running variable. The results using the seat share do however point in the same
direction. No significant effects of ANC power on the share of black Africans with electricity is
found, although the point estimates have negative signs. With some doubts cast by the weakly
significant negative result when k = 1%, we do find that as the IFP gains seat shares at the
expense of the ANC, the share with electricity in their dwelling increases. Trusting the results in
the column where k = 5%, it seems clear that this effect goes through an increased share of black
Africans with electricity as a consequence of increased IFP power. Since we could not conclude
that less is being spent on electricity provision when ANC power increases in the above analysis,
these results may instead be explained by less repairs and maintenance. A similar pattern can
be disentangled looking at the share with piped water inside their dwelling. The RD analysis
yields large, negative estimates that might be explained by Inkatha Freedom Party increasing the
share with piped water as they gain seat shares at the expence of the African National Congress.
Again, the positive βIFP seems to go through an increase in the share of black Africans with
piped water, while the RD results only give weak suggestive evidence of a negative effect of ANC
power on black Africans’ access to piped water. The results on water delivery are in line with
what we found on the effect of the ANC on expenditure on water provision.
Discussing the estimations of ANC power on unemployment and poverty, we can note that
the results are quite inconclusive compared to the aforementioned. As was obvious from the RD
graph, it does not seem as if we have any evidence of an effect of ANC power on unemployment.
Furthermore, half of the IV regressions fail the placebo test (discussed below). Looking at
poverty, we find suggestive evidence of an adverse effect of ANC power. Here, only the regressions
using the vote share as running variable yield significant results, although those using the seat
share again point in the same positive direction. Also, we only find one corresponding result in
the IV part of the table when k = 5%: as Others gain seat shares at the expense of the ANC,
the share who are poor seems to drop.
4.3 Robustness Checks and Placebo Tests
A major issue when performing an RD analysis is the possibility to manipulate the forcing
variable around the cut off so that observations on each side may not be comparable. As noted
by Angrist and Pischke [2], this also accrues to election studies in democratic countries, having
17

the 2000 U.S. presidential election and the recount in Florida in mind. The worry is, for example,
that the ANC has the power to change Di and thus create bunching just to the right of the
cut-off value of 50 per cent. To examine this possibility, Figure (a) shows the density of the ANC
vote share around the discontinuity. Indeed, the party’s density is highest somewhere between
75 to 80 per cent of the vote share, but there does not seem to be a bunching just to the right
of the 50 per cent threshold. This is reassuring and maybe not surprising considering the thus
far commended electoral process.16
As was stated under Section 3.1, I use both the ANC seat share and vote share as running
variables. From Figure (b), it is clear that we do not have a one-to-one relationship between
the two. However, under the notion that both variables capture important features of the
institutional setting and the RD approach, we want similar results from both specifications.
Looking at the tables, all point estimates have the same sign, but those using the vote share
as running variable are always larger. At the same time, the standard errors are very similar,
at least for the budgetary outcomes. That explains why we find more significant results using
the vote share. It is likely that the disparity between the two specifications when it comes to
the size of the point estimates is due to small-sample issues, outliers in either specification, or
a combination of both. The fact that we do not have a perfect mapping between vote shares
and seat shares is also an argument for why it may be problematic to use an RD approach to a
proportional election system. Nevertheless, it is reassuring that the directions of the coefficients
correspond to each other.
Another issue apparent from the tables is that as we move from k = 1% to k = 5% in the IV
regressions, it is not always the case that the estimates retain their signs. This is also true for
Freier & Odendahl’s [17] paper when they vary the definition of closeness, although to a lesser
extent. Again, in this paper, this issue most likely has to do with the rather small sample size.
That is, as we expand the sample that is used for the estimations, the ”new” municipalities have
enough weight to change the estimates to a higher extent than would the sample size have been
larger. It is then a question which definition of closeness is the most reasonable. On one hand,
as stated in Section 4, k = 1% is the most reliable value for causality claims. On the other
hand, with a small sample size, it might be reasonable to expand the sample at the cost of the
aforementioned.17 As noted by Freier & Odendahl [17], these sometimes noisy estimates could
also stem from the worry that a party’s seat share is an imprecise representation of voting power.
However, there is only one case where we have significant, conflicting results in this paper so it
should not be a major worry.
The last columns in the IV and RDD sections respectively, in each table, display the results
from a placebo test of the effects of ANC power measured from the election result from 2006,
16I have also performed similar election forensics on a ward level as those found in Beber & Scacco [4]. Inparticular, if we keep only the last digit in the vote count for the ANC and plot the distribution from 0 to 9, thedistribution should be uniform since these numbers should appear with equal frequency as if they were randomlydrawn. This seems to be the case in South Africa.
17This discussion is quite similar to the discussion on bandwidth choice in the RD setting, although the twoshould not be mixed up.
18

on outcomes from 2001 and 2004/2005. These pre-election outcomes should be unrelated to
variation from the 2006 election. A placebo test such as this is a version of testing whether
covariates are balanced by treatment status as in a randomized experiment. The first placebo
column runs an IV regression with k = 1% and the last column uses an RDD with a local linear
regression with full bandwidth on the seat share. Apart from the estimation of the effect of
ANC power on unemployment, this placebo test seems to confirm that those effects found are
actually due to party policy.
Lastly, when analyzing particular municipalities (”close” ones) as with the two approaches
in this paper, it is important to note that what we estimate is local average treatment effects
(LATE). In the presence of heterogenous effects, the LATE estimates might differ from the
average treatment effects. This fact could be problematic if close elections only take place in
certain provinces or if politicians in municipalities with a high competition act in a certain
way. Indeed, the two maps illustrating close-election municipalities for the RD and the IV
design confirm that we should be worried about these issues, looking at the distribution of close
municipalities. Starting with Figure (d), it is clear that closeness as defined in the RDD stands
out as most problematic; it more or less completely follows the strength of the Democratic
Alliance and the Inkatha Freedom Party. In other words, in the Western and Northern Cape
where the DA are strong we have many close elections. Here, the DA has a majority in several
municipalities and the ANC a plurality in some. Likewise, in KwaZulu-Natal where the IFP has
most of their support, we have many close elections. In effect, the RD LATE will come from
comparisons of municipalities where the ANC just gained a majority to municipalities where the
DA or the IFP just gained a majority. These are certainly highly specific municipalities. The
results from the RD estimations should thus be treated with caution and analyzed for what they
are. For example, the conflicting estimates on the effect of ANC power on inter-governmental
grants could perhaps be explained by LATE: since we in essence compare the ANC to the DA or
the IFP, we have to take into account that a municipality with a DA/IFP majority - in particular
- may make the ANC government reluctant to distribute grants. That does not however explain
the positive estimates from the IV regressions, that instead might stem from better project plans
or the like.
Looking at close-election municipalities as defined with the IV approach, they do not follow
the same pattern as above. Rather, the highest density of close municipalities seems to be in
areas where the ANC are highly dominant, such as the provinces Limpopo, North West and
Eastern Cape. Since the identification of treatment status obviously differs to a large extent, it
is reassuring that we in most of the cases receive comparable results (i.e. estimates that have
opposite signs between the IV and the RD specifications).
5 Concluding Remarks
This paper set out to evaluate the African National Congress’ effect on several economic and
social indicators. Taken together, the results point to an adverse effect of the party: less is spent
19

on repairs and water provision which in turn may explain why ANC power seems to lower the
share of individuals who have access to piped water and electricity. It is likely that this finding
is the underlying reason why ANC power leads to less revenues stemming from service charges.
Further, more resources are used on municipal employees and the councillors themselves, while I
find suggestive evidence that the poverty rate increases due to the party. Lastly, although being
their major political support, we cannot conclude that the ANC affects black African’s living
standards. Instead, the analysis in this paper indicates that oppositional parties many times
have a more positive impact on outcomes as they gain power at the expence of the ANC. These
findings are especially worrying in the South African context where there up until today have
been few signs of the party’s power being challanged.
Despite the above, as stated in the introduction, it is important to note that this exercise
does not elaborate on variables that are harder to measure. That is, I cannot say anything about
living standards in the sense of living free from oppression. Being the movement that brought
this freedom to black Africans, it might be understandable that the party receives vote shares
as big as those we have seen up until now. It is also possible that the transition from being a
freedom movement to act as a political party is very special and takes time. Indeed, few African
countries have managed this transition better than South Africa.
20

References
[1] ANGRIST, J. & V. LAVY (1999): ”Using Maimonides’ Rule to Estimate the Effect of
Class Size on Scholastic Achievement”, The Quarterly Journal of Economics, May, Vol.
114, No.2.
[2] ANGRIST, D. A. & J.-S. PISCHKE (2009): ”Mostly Harmless Econometrics”, Princeton
University Press.
[3] ATKINSON, D. (2007): ”Taking to the Streets: Has Developmental Local Government
Failed in South Africa?”, in ”State of the Nation - South Africa in 2007”, edited by Buh-
lungu, S., J. Daniel, Southall, R., J. Lutchman, HSRC Press.
[4] BEBER, B. & A. SCACCO (2012): ”What the Numbers Say: A Digit-Based Test for
Election Fraud”, Political Analysis, Vol. 20.
[5] BOOYSEN, S. (Ed.) (2012): ”Local Elections in South Africa: Parties, People, Politics”,
SUN MeDIA MeTRO, Bloemfontein.
[6] BUTLER, A. (2005): ”How Democratic is the African National Congress?”, Journal of
Southern African Studies, Vol. 31, No. 4.
[7] COULIBALY, B. & LOGAN L. D. (2009): ” South Africa’s Post-Apartheid Two-Step:
Social Demands versus Macro Stability”, The American Economic Review, Vol. 99, No.2.
[8] The Democratic Alliance Policy Document (August 29th 2012): ”Proposals to Help Broad-
Based Black Economic Empowerment Deliver on its Potential”.
[9] The Economist (October 20th 2012): ”Sad South Africa. Cry, the Beloved Country”.
[10] The Economist’s website, http://www.economist.com/node/12295535, retrived February
4th 2013.
[11] The Economist’s website, http://www.economist.com/node/18775977, retrived February
6th 2013.
[12] Education and Training Unit’s website, http://www.etu.org.za/toolbox/docs/
localgov/webmunfin.html, retrived November 4th 2012.
[13] Education and Training Unit’s website, http://www.etu.org.za/toolbox/docs/
localgov/webundrstdlocgov.html, retrived January 30th 2013.
[14] FERREE, E. K. (2006): ”Explaining South Africa’s Racial Census”, Journal of Politics,
Vol. 68, No. 4.
[15] FERREIRA, F., and J. GYORKO (2009): ”Do Political Parties Matter? Evidence from
U.S. Cities”, The Quarterly Journal of Economics, February, Vol. 124, No. 1.
21
[16] FOLKE, O. (2012): ”Shades of Brown and Green: Party Effects in Proportional Election
Systems”, Working Paper, SIPA,Columbia University.
[17] FREIER, R., and C. ODENDAHL (2012): ”Do Parties Matter? Estimating the Effect of
Political Power in Multi-Party Systems”, Unpublished manuscript.
[18] GRAHAM, P. (2012): ”Party Identification in South Africa: Profiles for the ANC and the
DA”, Afrobarometer Briefing Paper No. 108.
[19] HABIB, A. & R. TAYLOR (2001): ”Political Alliances and Parliamentary Opposition in
Post-Apartheid South Africa”, Democratization, Vol. 8, No.1.
[20] HAHN, J., TODD, P., VAN DER KLAAUW, W. (2001): ”Identification and estimation of
treatment effects with a regression discontinuity design”. Econometrica, Vol. 69.
[21] HARSANT, A. & BAUER, C. (2006): Northern Cape Province. Election Update South
Africa - Local Government Elections, EISA.
[22] HERBST, J. (2005): ”Mbeki’s South Africa”, Foreign Affairs, Nov-Dec, Vol. 84, No.6.
[23] IMBENS, G.W. & T. LEMIEUX (2008): ”Regression discontinuity designs: A guide to
practice”, Journal of Econometrics, Vol. 142.
[24] IMBENS, G.W. & K. KALYANARAMAN (2009): ”Optimal bandwidth choice for the
regression discontinuity estimator”.
[25] The Independent Electoral Commission’s website, http://www.elections.org.za/
content/, retrived October 15th 2012.
[26] The Inkatha Freedom Party’s website, www.ifp.org.za/Downloads/IFP%20Manifesto.
doc, retrived July 30th 2013.
[27] JOSIE, J. (2008): ”The Intergovernmental Context of Municipal Infrastructure Grants in
South Africa”, School of Government, University of the Western Cape.
[28] LEE, D.S. & T. LEMIEUX (2010): ”Regression Discontinuity Designs in Economics”,
Journal of Economic Lterature, Vol. 48.
[29] LEE, D.S., MORETTI, E., BUTLER, M. (2004): ”Do voters affect or elect policies? Evi-
dence from the U.S. house”, The Quarterly Journal of Economics, Vol. 119.
[30] LETSHOLO, S. (2006): Democratic Local Elections in South Africa: A Critical Review,
EISA.
[31] LOCAL GOVERNMENT ELECTIONS TASK GROUP 1996 ETG Report on Local Gov-
ernment Elections in South Africa 1995/1996, 230-232.
[32] Mail & Guardian (November 20th 2008): ”Zille, In For the Long Run”.
22
[33] MATTES, B. R. (2002): ” South Africa: Democracy Without the People”, Journal of
Democracy, Vol. 13, No.1.
[34] MATTES, B. R. & J. PIOMBO (1999): ”Opposition Parties and the Voters in South
Africa’s 1999 General Election”, Democratization, Vol. 8.
[35] MARAIS, H. (2001): ”South Africa, Limits to Change: The Political Economy of Transi-
tion”, University of Cape Town Press, Second Edition.
[36] MCKINLEY, T. D. (2001): ”Democracy, Power and Patronage: Debate and Opposition
within the African National Congress and the Tripartite Alliance since 1994”, Democrati-
zation, Vol. 8, No. 1.
[37] METH, C. (2010): ”What Do We Know? Professor Servas van der Berg’s Poverty Esti-
mates”, School of Development Studies Research Report No. 85.
[38] MEYERSSON, E. (2010): ”Islamic rule and the emancipation of the poor and pious”,
fothcoming Econometrica.
[39] MITH, T. (2008): The Role of Ward Commiittees in Enhancing Participatory Local Gover-
nance and Development in South Africa: Evidence from Six Ward Committee Case Studies,
Community Law Centre.
[40] The National Treasury’s website, http://www.treasury.gov.za/, retrived January 31st
2013.
[41] The New York Times (November 30th 2012): ”In South Africa, Lethal Battles for Even
Smallest of Political Posts.”
[42] PETTERSSON-LIDBOM, P. (2008): ”Do Parties Matter for Economic Outcomes? A
Regression-Discontinuity Approach”, Journal of the European Economic Association, Vol-
ume 6, Issue 5.
[43] PORTER, J. (2003): ”Estimation in the Regression Discontinuity Model”, Department of
Economics, University of Wisconsin.
[44] RYLANDER, S. (2012): ”Nelson Mandela - Tolerans och Ledarskap”, Historiska Media,
Lund.
[45] SILKE, D. (2006): ”The ANC in Trouble: Is This the Great Unravelling of South Africa’s
Liberation Movement?”, AQ: Australien Quarterly, Vol. 78, No.4.
[46] The South African Government’s website, http://www.info.gov.za, retrived February 1st
2013.
[47] Statistics South Africa’s website, http://www.statssa.gov.za/, retrived October 15th
2012.
23

[48] Statistics South Africa & National Treasury (2007): ”A National Poverty Line for South
Africa”.
[49] WOOLARD, I. & M. LEIBBRANDT (2006): ”Towards a Poverty Line for South Africa:
Background Note”, Southern Africa Labour and Development Research Unit, University of
Cape Town.
24

Table 1: SUMMARY STATISTICS ONBUDGET OUTCOMES
Mean S.D.REVENUESProperty Rates 0.114 0.086
Service Charges 0.319 0.225
Government Grants 0.429 0.286
EXPENDITUREEmployee Costs 0.338 0.104
Councillor Remuneration 0.037 0.039
Repairs 0.048 0.034
Water Expenditure 0.180 0.249
Electricity Expenditure 0.078 0.125
The variables are shares of operating rev-enue, operating expenditure and capitalexpenditure.
25

Table 2: SUMMARY STATISTICS ON SERVICES ANDECONOMIC OUTCOMES
All Black WhiteSERVICE PROVISIONElectricityMean 0.650 0.632 0.818S.D. 0.162 0.158 0.121Piped WaterMean 0.362 0.293 0.853S.D. 0.231 0.188 0.194MAJOR ECONOMIC OUTCOMESUnemploymentMean 0.344 0.385 0.096S.D. 0.169 0.207 0.108PovertyMean 0.631 0.654 0.383S.D. 0.130 0.143 0.120DEMOGRAPHYShare Under 19 YearsMean 0.419 0.416 0.244S.D. 0.071 0.083 0.061Share Over 65 YearsMean 0.060 0.050 0.149S.D. 0.017 0.021 0.061
The variable Electricity is a combination of the shares whoare using electricity for cooking, heating and lighting. Poorare those individuals who earn less than 400 Rand per month.
26

Tab
le3:
EF
FE
CT
SO
FA
NC
PO
WE
RO
NR
EV
EN
UE
SF
RO
MP
RO
PE
RT
YR
AT
ES
RD
DIV
Sea
tsh
are
Vote
share
k=
1%
k=
2%
k=
5%
Pla
ceb
oO
pti
mal
BW
Qu
ad
rati
cO
pti
mal
BW
Qu
ad
rati
cP
lace
bo
DA
-0.0
03-0
.016
***
-0.0
05*
-0.0
10
(0.0
12)
(0.0
06)
(0.0
03)
(0.0
14)
IFP
0.00
20.
008
-0.0
05-0
.036
(0.0
13)
(0.0
10)
(0.0
05)
(0.0
34)
Oth
ers
-0.0
02-0
.006
-0.0
020.
001
(0.0
05)
(0.0
04)
(0.0
02)
(0.0
07)
AN
CM
ajo
rity
-0.0
13
-0.0
16
-0.0
23
-0.0
31
0.0
32
(0.0
24)
(0.0
36)
(0.0
21)
(0.0
31)
(0.0
33)
Ban
dw
idth
11
11
0.3
51
0.37
11
Pol
yn
omia
lD
egre
e2
22
21
21
21
Mu
nic
ipal
FE
Yes
Yes
Yes
No
No
No
No
No
No
N46
846
846
8233
399
470
429
474
233
Sta
nd
ard
erro
rsin
par
enth
eses
.**
*p<
0.01
,**
p<
0.05
,*
p<
0.1.
Th
efi
rst
thre
eco
lum
ns
refe
rto
the
esti
mat
esof
IVre
gres
sion
sw
her
eea
chp
art
y’s
seats
hare
isin
stru
men
ted
by
seats
hare
shif
tsar
oun
da
thre
shol
din
clos
eel
ecti
ons,
asd
escr
ibed
inF
reie
r&
Od
end
ah
l(2
012).
Th
ein
stru
men
tis
base
don
1000
per
tub
ati
on
sof
the
vote
vect
orof
each
par
ty,
usi
ng
thre
ed
iffer
ent
vari
ance
sof
the
vote
cou
nt.
Th
ese
regre
ssio
ns
incl
ud
ea
contr
ol
for
the
mun
icip
al-
cou
nci
lsi
ze,
du
mm
ies
for
each
par
tyif
the
par
tyd
idn
otre
ceiv
eany
vote
s,an
da
year
du
mm
y.T
he
nex
ttw
oco
lum
ns
dis
pla
yth
ere
sult
sof
anR
Des
tim
atio
nu
sin
gth
eA
NC
’sse
atsh
are
as
runn
ing
vari
able
,w
hil
eth
ela
sttw
oco
lum
ns
use
the
vote
share
as
run
nin
gva
riab
le.
Th
eb
and
wid
ths
are
opti
mal
assp
ecifi
edby
Imb
ens
&K
aly
an
ara
man
(2009).
All
data
isu
tili
zed
inth
ees
tim
ati
on
of
the
qu
adra
tic
spec
ifica
tion
.T
he
outc
ome
vari
able
sar
esh
ares
of
op
erati
ng
reve
nu
e,op
erati
ng
exp
end
itu
rean
dca
pit
al
exp
end
itu
re.
Th
eb
ud
get
dat
ais
the
actu
alou
tcom
eof
the
2004
/200
5an
dth
e2010/2011
bud
get
s.T
he
firs
tpla
ceb
oco
lum
nru
ns
an
IVre
gre
ssio
nw
ithk=
1%
wit
hel
ecti
onre
sult
sfr
om20
06on
outc
ome
from
2004/2005.
Th
ese
con
dp
lace
bo
colu
mn
use
san
RD
Dw
ith
ali
nea
rre
gres
sion
wit
hfu
llb
and
wid
thon
the
seat
shar
e,u
sin
g20
06
elec
tion
resu
lts
on
2004/2005
ou
tcom
e.W
ew
ou
ldn
ot
exp
ect
sign
ifica
nt
resu
lts
inth
ese
two
colu
mn
s.
27

Tab
le4:
EF
FE
CT
SO
FA
NC
PO
WE
RO
NR
EV
EN
UE
SF
RO
MS
ER
VIC
EC
HA
RG
ES
RD
DIV
Sea
tsh
are
Vote
share
k=
1%
k=
2%
k=
5%
Pla
ceb
oO
pti
mal
BW
Qu
ad
rati
cO
pti
mal
BW
Qu
ad
rati
cP
lace
bo
DA
-0.0
070.
007
0.01
30.
007
(0.0
33)
(0.0
15)
(0.0
09)
(0.0
36)
IFP
-0.0
12-0
.026
0.00
80.
093
(0.0
36)
(0.0
24)
(0.0
14)
(0.0
85)
Oth
ers
-0.0
20-0
.013
-0.0
13**
0.030*
(0.0
13)
(0.0
10)
(0.0
07)
(0.0
18)
AN
CM
ajo
rity
-0.0
86
-0.1
44**
-0.1
08*
-0.1
85***
0.0
33
(0.0
54)
(0.0
65)
(0.0
59)
(0.0
61)
(0.0
75)
Ban
dw
idth
11
11
0.2
61
0.2
31
1P
olyn
omia
lD
egre
e2
22
21
21
21
Mu
nic
ipal
FE
Yes
Yes
Yes
No
No
No
No
No
No
N46
846
846
823
3276
470
236
474
233
Sta
nd
ard
erro
rsin
par
enth
eses
.**
*p<
0.01
,**
p<
0.05
,*
p<
0.1.
Th
efi
rst
thre
eco
lum
ns
refe
rto
the
esti
mat
esof
IVre
gres
sion
sw
her
eea
chp
art
y’s
seats
hare
isin
stru
men
ted
by
seats
hare
shif
tsar
oun
da
thre
shol
din
clos
eel
ecti
ons,
asd
escr
ibed
inF
reie
r&
Od
end
ah
l(2
012).
Th
ein
stru
men
tis
base
don
1000
per
tub
ati
on
sof
the
vote
vect
orof
each
par
ty,u
sin
gth
ree
diff
eren
tva
rian
ces
of
the
vote
cou
nt.
Th
ese
regre
ssio
ns
incl
ud
ea
contr
olfo
rth
em
un
icip
al-
cou
nci
lsi
ze,
du
mm
ies
for
each
par
tyif
the
par
tyd
idn
otre
ceiv
eany
vote
s,an
da
year
du
mm
y.T
he
nex
ttw
oco
lum
ns
dis
pla
yth
ere
sult
sof
anR
Des
tim
atio
nu
sin
gth
eA
NC
’sse
atsh
are
asru
nn
ing
vari
ab
le,
wh
ile
the
last
two
colu
mn
su
seth
evo
tesh
are
as
run
nin
gva
riab
le.
Th
eb
and
wid
ths
are
opti
mal
assp
ecifi
edby
Imb
ens
&K
aly
an
ara
man
(2009).
All
data
isu
tili
zed
inth
ees
tim
ati
on
of
the
qu
adra
tic
spec
ifica
tion
.T
he
outc
ome
vari
able
sar
esh
ares
of
op
erati
ng
reve
nu
e,op
erati
ng
exp
end
itu
rean
dca
pit
al
exp
end
itu
re.
Th
eb
ud
get
dat
ais
the
actu
alou
tcom
eof
the
2004
/200
5an
dth
e2010/2011
bu
dget
s.T
he
firs
tp
lace
bo
colu
mn
run
san
IVre
gre
ssio
nw
ithk=
1%
wit
hel
ecti
onre
sult
sfr
om20
06on
outc
ome
from
2004/2005.
Th
ese
con
dp
lace
bo
colu
mn
use
san
RD
Dw
ith
ali
nea
rre
gres
sion
wit
hfu
llb
and
wid
thon
the
seat
shar
e,u
sin
g20
06
elec
tion
resu
lts
on
2004/2005
ou
tcom
e.W
ew
ould
not
exp
ect
sign
ifica
nt
resu
lts
inth
ese
two
colu
mn
s.
28

Tab
le5:
EF
FE
CT
SO
FA
NC
PO
WE
RO
NR
EV
EN
UE
SF
RO
MG
OV
ER
NM
EN
TA
LG
RA
NT
S
RD
DIV
Sea
tshare
Vote
share
k=
1%
k=
2%
k=
5%
Pla
ceb
oO
pti
mal
BW
Qu
ad
rati
cO
pti
mal
BW
Qu
ad
rati
cP
lace
bo
DA
0.14
80.
056*
**0.
018*
0.046
(0.0
97)
(0.0
21)
(0.0
10)
(0.0
35)
IFP
-0.1
19-0
.013
-0.0
00-0
.031
(0.1
04)
(0.0
34)
(0.0
16)
(0.0
82)
Oth
ers
0.06
8*0.
031*
*0.
009
-0.0
05
(0.0
38)
(0.0
13)
(0.0
07)
(0.0
18)
AN
CM
ajo
rity
0.1
43*
0.2
26***
0.1
78**
0.2
78***
0.0
02
(0.0
74)
(0.0
84)
(0.0
77)
(0.0
80)
(0.0
90)
Ban
dw
idth
11
11
0.2
51
0.2
21
1P
olyn
omia
lD
egre
e2
22
21
21
21
Mu
nic
ipal
FE
Yes
Yes
Yes
No
No
No
No
No
No
N46
846
846
8233
251
470
231
474
233
Sta
nd
ard
erro
rsin
par
enth
eses
.**
*p<
0.01
,**
p<
0.05
,*
p<
0.1.
Th
efi
rst
thre
eco
lum
ns
refe
rto
the
esti
mat
esof
IVre
gre
ssio
ns
wh
ere
each
part
y’s
seats
hare
isin
stru
men
ted
by
seats
hare
shif
tsar
oun
da
thre
shol
din
clos
eel
ecti
ons,
asd
escr
ibed
inF
reie
r&
Od
end
ah
l(2
012).
Th
ein
stru
men
tis
base
don
1000
per
tub
ati
on
sof
the
vot
eve
ctor
ofea
chp
arty
,u
sin
gth
ree
diff
eren
tva
rian
ces
of
the
vote
cou
nt.
Th
ese
regre
ssio
ns
incl
ud
ea
contr
olfo
rth
em
un
icip
al-
cou
nci
lsi
ze,
du
mm
ies
for
each
par
tyif
the
par
tyd
idn
otre
ceiv
eany
vote
s,an
da
year
du
mm
y.T
he
nex
ttw
oco
lum
ns
dis
pla
yth
ere
sult
sof
anR
Des
tim
atio
nu
sing
the
AN
C’s
seat
shar
eas
run
nin
gva
riab
le,
wh
ile
the
last
two
colu
mn
su
seth
evote
share
as
run
nin
gva
riab
le.
Th
eb
and
wid
ths
are
opti
mal
assp
ecifi
edby
Imb
ens
&K
aly
an
ara
man
(2009).
All
data
isu
tili
zed
inth
ees
tim
ati
on
of
the
qu
adra
tic
spec
ifica
tion
.T
he
outc
ome
vari
able
sar
esh
ares
of
op
erati
ng
reven
ue,
op
erati
ng
exp
end
itu
rean
dca
pit
alex
pen
dit
ure
.T
he
bu
dge
td
ata
isth
eact
ual
outc
ome
ofth
e20
04/2
005
and
the
2010/2011
bu
dget
s.T
he
firs
tp
lace
bo
colu
mn
run
san
IVre
gre
ssio
nw
ithk=
1%
wit
hel
ecti
onre
sult
sfr
om20
06on
outc
ome
from
2004/2005.
Th
ese
con
dp
lace
bo
colu
mn
use
san
RD
Dw
ith
ali
nea
rre
gres
sion
wit
hfu
llb
and
wid
thon
the
seat
shar
e,u
sin
g20
06
elec
tion
resu
lts
on
2004/2005
ou
tcom
e.W
ew
ou
ldn
ot
exp
ect
sign
ifica
nt
resu
lts
inth
ese
two
colu
mn
s.
29

Tab
le6:
EF
FE
CT
SO
FA
NC
PO
WE
RO
NE
XP
EN
DIT
UR
EO
NE
MP
LO
YE
ES
RD
DIV
Sea
tsh
are
Vote
share
k=
1%
k=
2%
k=
5%
Pla
ceb
oO
pti
mal
BW
Qu
ad
rati
cO
pti
mal
BW
Qu
ad
rati
cP
lace
bo
DA
-0.0
59-0
.030
**-0
.013
**-0
.006
(0.0
51)
(0.0
12)
(0.0
06)
(0.0
20)
IFP
0.08
9-0
.038
*-0
.026
***
-0.0
52
(0.0
55)
(0.0
20)
(0.0
10)
(0.0
47)
Oth
ers
-0.0
32-0
.015
*-0
.005
0.016
(0.0
20)
(0.0
08)
(0.0
05)
(0.0
10)
AN
CM
ajo
rity
0.0
16
-0.0
04
0.011
-0.0
13
0.0
89**
(0.0
24)
(0.0
31)
(0.0
23)
(0.0
32)
(0.0
38)
Ban
dw
idth
11
11
0.3
21
0.33
11
Pol
yn
omia
lD
egre
e2
22
21
21
21
Mu
nic
ipal
FE
Yes
Yes
Yes
No
No
No
No
No
No
N46
846
846
8233
363
470
386
474
233
Sta
nd
ard
erro
rsin
par
enth
eses
.**
*p<
0.01
,**
p<
0.05
,*
p<
0.1.
Th
efi
rst
thre
eco
lum
ns
refe
rto
the
esti
mat
esof
IVre
gres
sion
sw
her
eea
chp
art
y’s
seats
hare
isin
stru
men
ted
by
seats
hare
shif
tsar
oun
da
thre
shol
din
clos
eel
ecti
ons,
asd
escr
ibed
inF
reie
r&
Od
end
ah
l(2
012).
Th
ein
stru
men
tis
base
don
1000
per
tub
ati
on
sof
the
vote
vect
orof
each
par
ty,
usi
ng
thre
ed
iffer
ent
vari
ance
sof
the
vote
cou
nt.
Th
ese
regre
ssio
ns
incl
ud
ea
contr
ol
for
the
mun
icip
al-
cou
nci
lsi
ze,
du
mm
ies
for
each
par
tyif
the
par
tyd
idn
otre
ceiv
eany
vote
s,an
da
year
du
mm
y.T
he
nex
ttw
oco
lum
ns
dis
pla
yth
ere
sult
sof
anR
Des
tim
atio
nu
sin
gth
eA
NC
’sse
atsh
are
as
runn
ing
vari
able
,w
hil
eth
ela
sttw
oco
lum
ns
use
the
vote
share
as
run
nin
gva
riab
le.
Th
eb
and
wid
ths
are
opti
mal
assp
ecifi
edby
Imb
ens
&K
aly
an
ara
man
(2009).
All
data
isu
tili
zed
inth
ees
tim
ati
on
of
the
qu
adra
tic
spec
ifica
tion
.T
he
outc
ome
vari
able
sar
esh
ares
of
op
erati
ng
reve
nu
e,op
erati
ng
exp
end
itu
rean
dca
pit
al
exp
end
itu
re.
Th
eb
ud
get
dat
ais
the
actu
alou
tcom
eof
the
2004
/200
5an
dth
e2010/2011
bud
get
s.T
he
firs
tpla
ceb
oco
lum
nru
ns
an
IVre
gre
ssio
nw
ithk=
1%
wit
hel
ecti
onre
sult
sfr
om20
06on
outc
ome
from
2004/2005.
Th
ese
con
dp
lace
bo
colu
mn
use
san
RD
Dw
ith
ali
nea
rre
gres
sion
wit
hfu
llb
and
wid
thon
the
seat
shar
e,u
sin
g20
06
elec
tion
resu
lts
on
2004/2005
ou
tcom
e.W
ew
ou
ldn
ot
exp
ect
sign
ifica
nt
resu
lts
inth
ese
two
colu
mn
s.
30
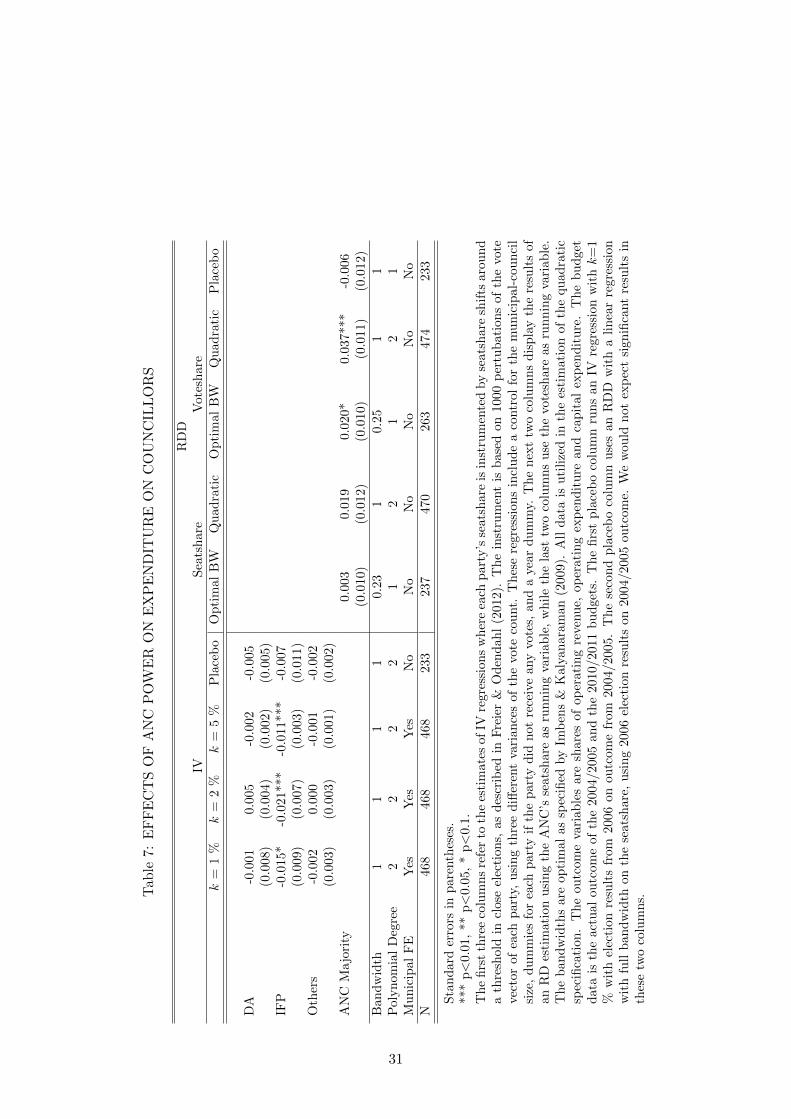
Tab
le7:
EF
FE
CT
SO
FA
NC
PO
WE
RO
NE
XP
EN
DIT
UR
EO
NC
OU
NC
ILL
OR
S
RD
DIV
Sea
tsh
are
Vote
share
k=
1%
k=
2%
k=
5%
Pla
ceb
oO
pti
mal
BW
Qu
ad
rati
cO
pti
mal
BW
Qu
ad
rati
cP
lace
bo
DA
-0.0
010.
005
-0.0
02-0
.005
(0.0
08)
(0.0
04)
(0.0
02)
(0.0
05)
IFP
-0.0
15*
-0.0
21**
*-0
.011
***
-0.0
07
(0.0
09)
(0.0
07)
(0.0
03)
(0.0
11)
Oth
ers
-0.0
020.
000
-0.0
01-0
.002
(0.0
03)
(0.0
03)
(0.0
01)
(0.0
02)
AN
CM
ajo
rity
0.0
03
0.0
19
0.0
20*
0.0
37***
-0.0
06
(0.0
10)
(0.0
12)
(0.0
10)
(0.0
11)
(0.0
12)
Ban
dw
idth
11
11
0.2
31
0.2
51
1P
olyn
omia
lD
egre
e2
22
21
21
21
Mu
nic
ipal
FE
Yes
Yes
Yes
No
No
No
No
No
No
N46
846
846
8233
237
470
263
474
233
Sta
nd
ard
erro
rsin
par
enth
eses
.**
*p<
0.01
,**
p<
0.05
,*
p<
0.1.
Th
efi
rst
thre
eco
lum
ns
refe
rto
the
esti
mat
esof
IVre
gres
sion
sw
her
eea
chp
art
y’s
seats
hare
isin
stru
men
ted
by
seats
hare
shif
tsaro
un
da
thre
shol
din
clos
eel
ecti
ons,
asd
escr
ibed
inF
reie
r&
Od
end
ah
l(2
012).
Th
ein
stru
men
tis
base
don
1000
per
tub
ati
on
sof
the
vote
vect
orof
each
par
ty,
usi
ng
thre
ed
iffer
ent
vari
ance
sof
the
vote
cou
nt.
Th
ese
regre
ssio
ns
incl
ud
ea
contr
ol
for
the
mu
nic
ipal-
cou
nci
lsi
ze,
du
mm
ies
for
each
par
tyif
the
par
tyd
idn
otre
ceiv
eany
vote
s,an
da
yea
rd
um
my.
Th
en
ext
two
colu
mn
sd
isp
lay
the
resu
lts
of
anR
Des
tim
atio
nu
sin
gth
eA
NC
’sse
atsh
are
asru
nn
ing
vari
ab
le,
wh
ile
the
last
two
colu
mn
su
seth
evo
tesh
are
as
run
nin
gva
riab
le.
Th
eb
and
wid
ths
are
opti
mal
assp
ecifi
edby
Imb
ens
&K
aly
an
ara
man
(2009).
All
data
isu
tili
zed
inth
ees
tim
ati
on
of
the
qu
ad
rati
csp
ecifi
cati
on.
Th
eou
tcom
eva
riab
les
are
shar
esof
oper
atin
gre
venu
e,op
erati
ng
exp
end
itu
rean
dca
pit
al
exp
end
itu
re.
Th
eb
ud
get
dat
ais
the
actu
alou
tcom
eof
the
2004
/200
5an
dth
e20
10/2011
bu
dget
s.T
he
firs
tp
lace
bo
colu
mn
run
san
IVre
gre
ssio
nw
ithk=
1%
wit
hel
ecti
onre
sult
sfr
om20
06on
outc
ome
from
2004/2005.
Th
ese
con
dp
lace
bo
colu
mn
use
san
RD
Dw
ith
ali
nea
rre
gre
ssio
nw
ith
full
ban
dw
idth
onth
ese
atsh
are,
usi
ng
2006
elec
tion
resu
lts
on
2004/2005
ou
tcom
e.W
ew
ou
ldn
ot
exp
ect
sign
ifica
nt
resu
lts
inth
ese
two
colu
mn
s.
31
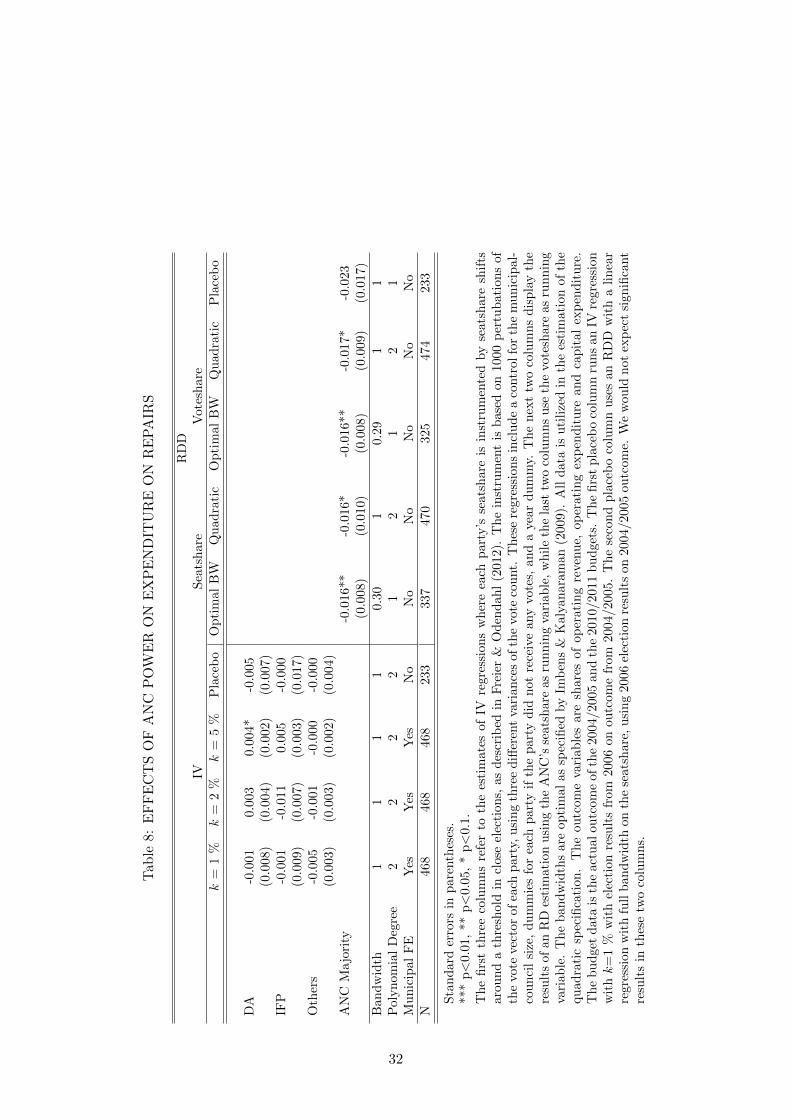
Tab
le8:
EF
FE
CT
SO
FA
NC
PO
WE
RO
NE
XP
EN
DIT
UR
EO
NR
EP
AIR
S
RD
DIV
Sea
tsh
are
Vote
share
k=
1%
k=
2%
k=
5%
Pla
ceb
oO
pti
mal
BW
Qu
ad
rati
cO
pti
mal
BW
Qu
ad
rati
cP
lace
bo
DA
-0.0
010.
003
0.00
4*-0
.005
(0.0
08)
(0.0
04)
(0.0
02)
(0.0
07)
IFP
-0.0
01-0
.011
0.00
5-0
.000
(0.0
09)
(0.0
07)
(0.0
03)
(0.0
17)
Oth
ers
-0.0
05-0
.001
-0.0
00-0
.000
(0.0
03)
(0.0
03)
(0.0
02)
(0.0
04)
AN
CM
ajo
rity
-0.0
16**
-0.0
16*
-0.0
16**
-0.0
17*
-0.0
23
(0.0
08)
(0.0
10)
(0.0
08)
(0.0
09)
(0.0
17)
Ban
dw
idth
11
11
0.3
01
0.2
91
1P
olyn
omia
lD
egre
e2
22
21
21
21
Mu
nic
ipal
FE
Yes
Yes
Yes
No
No
No
No
No
No
N46
846
846
823
3337
470
325
474
233
Sta
nd
ard
erro
rsin
par
enth
eses
.**
*p<
0.01
,**
p<
0.05
,*
p<
0.1.
Th
efi
rst
thre
eco
lum
ns
refe
rto
the
esti
mat
esof
IVre
gres
sion
sw
her
eea
chp
art
y’s
seats
hare
isin
stru
men
ted
by
seats
hare
shif
tsar
oun
da
thre
shol
din
clos
eel
ecti
ons,
asd
escr
ibed
inF
reie
r&
Od
end
ah
l(2
012).
Th
ein
stru
men
tis
base
don
1000
per
tub
ati
on
sof
the
vote
vect
orof
each
par
ty,u
sin
gth
ree
diff
eren
tva
rian
ces
of
the
vote
cou
nt.
Th
ese
regre
ssio
ns
incl
ud
ea
contr
olfo
rth
em
un
icip
al-
cou
nci
lsi
ze,
du
mm
ies
for
each
par
tyif
the
par
tyd
idn
otre
ceiv
eany
vote
s,an
da
year
du
mm
y.T
he
nex
ttw
oco
lum
ns
dis
pla
yth
ere
sult
sof
anR
Des
tim
atio
nu
sin
gth
eA
NC
’sse
atsh
are
asru
nn
ing
vari
ab
le,
wh
ile
the
last
two
colu
mn
su
seth
evo
tesh
are
as
run
nin
gva
riab
le.
Th
eb
and
wid
ths
are
opti
mal
assp
ecifi
edby
Imb
ens
&K
aly
an
ara
man
(2009).
All
data
isu
tili
zed
inth
ees
tim
ati
on
of
the
qu
adra
tic
spec
ifica
tion
.T
he
outc
ome
vari
able
sar
esh
ares
of
op
erati
ng
reve
nu
e,op
erati
ng
exp
end
itu
rean
dca
pit
al
exp
end
itu
re.
Th
eb
ud
get
dat
ais
the
actu
alou
tcom
eof
the
2004
/200
5an
dth
e2010/2011
bu
dget
s.T
he
firs
tp
lace
bo
colu
mn
run
san
IVre
gre
ssio
nw
ithk=
1%
wit
hel
ecti
onre
sult
sfr
om20
06on
outc
ome
from
2004/2005.
Th
ese
con
dp
lace
bo
colu
mn
use
san
RD
Dw
ith
ali
nea
rre
gres
sion
wit
hfu
llb
and
wid
thon
the
seat
shar
e,u
sin
g20
06
elec
tion
resu
lts
on
2004/2005
ou
tcom
e.W
ew
ould
not
exp
ect
sign
ifica
nt
resu
lts
inth
ese
two
colu
mn
s.
32
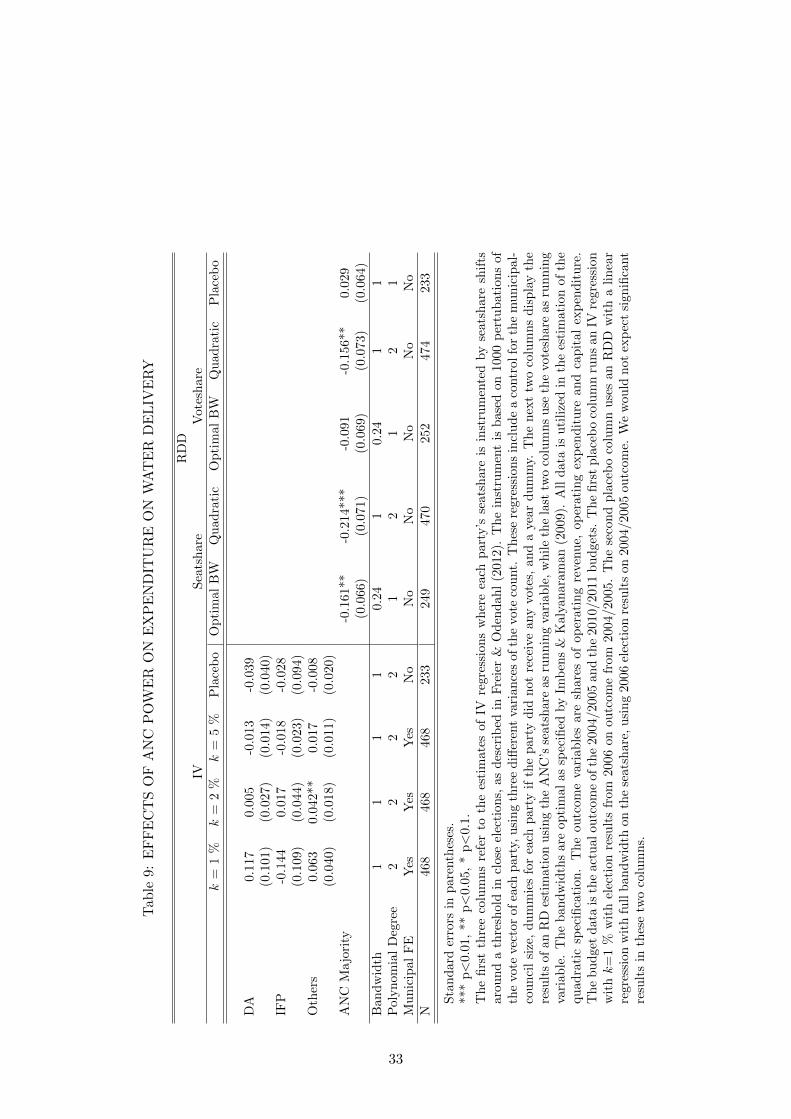
Tab
le9:
EF
FE
CT
SO
FA
NC
PO
WE
RO
NE
XP
EN
DIT
UR
EO
NW
AT
ER
DE
LIV
ER
Y
RD
DIV
Sea
tsh
are
Vote
share
k=
1%
k=
2%
k=
5%
Pla
ceb
oO
pti
mal
BW
Qu
ad
rati
cO
pti
mal
BW
Qu
ad
rati
cP
lace
bo
DA
0.11
70.
005
-0.0
13-0
.039
(0.1
01)
(0.0
27)
(0.0
14)
(0.0
40)
IFP
-0.1
440.
017
-0.0
18-0
.028
(0.1
09)
(0.0
44)
(0.0
23)
(0.0
94)
Oth
ers
0.06
30.
042*
*0.
017
-0.0
08
(0.0
40)
(0.0
18)
(0.0
11)
(0.0
20)
AN
CM
ajo
rity
-0.1
61**
-0.2
14***
-0.0
91
-0.1
56**
0.0
29
(0.0
66)
(0.0
71)
(0.0
69)
(0.0
73)
(0.0
64)
Ban
dw
idth
11
11
0.2
41
0.2
41
1P
olyn
omia
lD
egre
e2
22
21
21
21
Mu
nic
ipal
FE
Yes
Yes
Yes
No
No
No
No
No
No
N46
846
846
823
3249
470
252
474
233
Sta
nd
ard
erro
rsin
par
enth
eses
.**
*p<
0.01
,**
p<
0.05
,*
p<
0.1.
Th
efi
rst
thre
eco
lum
ns
refe
rto
the
esti
mat
esof
IVre
gres
sion
sw
her
eea
chp
art
y’s
seats
hare
isin
stru
men
ted
by
seats
hare
shif
tsar
oun
da
thre
shol
din
clos
eel
ecti
ons,
asd
escr
ibed
inF
reie
r&
Od
end
ah
l(2
012).
Th
ein
stru
men
tis
base
don
1000
per
tub
ati
on
sof
the
vote
vect
orof
each
par
ty,u
sin
gth
ree
diff
eren
tva
rian
ces
of
the
vote
cou
nt.
Th
ese
regre
ssio
ns
incl
ud
ea
contr
olfo
rth
em
un
icip
al-
cou
nci
lsi
ze,
du
mm
ies
for
each
par
tyif
the
par
tyd
idn
otre
ceiv
eany
vote
s,an
da
year
du
mm
y.T
he
nex
ttw
oco
lum
ns
dis
pla
yth
ere
sult
sof
anR
Des
tim
atio
nu
sin
gth
eA
NC
’sse
atsh
are
asru
nn
ing
vari
ab
le,
wh
ile
the
last
two
colu
mn
su
seth
evo
tesh
are
as
run
nin
gva
riab
le.
Th
eb
and
wid
ths
are
opti
mal
assp
ecifi
edby
Imb
ens
&K
aly
an
ara
man
(2009).
All
data
isu
tili
zed
inth
ees
tim
ati
on
of
the
qu
adra
tic
spec
ifica
tion
.T
he
outc
ome
vari
able
sar
esh
ares
of
op
erati
ng
reve
nu
e,op
erati
ng
exp
end
itu
rean
dca
pit
al
exp
end
itu
re.
Th
eb
ud
get
dat
ais
the
actu
alou
tcom
eof
the
2004
/200
5an
dth
e2010/2011
bu
dget
s.T
he
firs
tp
lace
bo
colu
mn
run
san
IVre
gre
ssio
nw
ithk=
1%
wit
hel
ecti
onre
sult
sfr
om20
06on
outc
ome
from
2004/2005.
Th
ese
con
dp
lace
bo
colu
mn
use
san
RD
Dw
ith
ali
nea
rre
gres
sion
wit
hfu
llb
and
wid
thon
the
seat
shar
e,u
sin
g20
06
elec
tion
resu
lts
on
2004/2005
ou
tcom
e.W
ew
ould
not
exp
ect
sign
ifica
nt
resu
lts
inth
ese
two
colu
mn
s.
33

Tab
le10
:E
FF
EC
TS
OF
AN
CP
OW
ER
ON
EX
PE
ND
ITU
RE
ON
EL
EC
TR
ICIT
YD
EL
IVE
RY
RD
DIV
Sea
tsh
are
Vote
share
k=
1%
k=
2%
k=
5%
Pla
ceb
oO
pti
mal
BW
Qu
ad
rati
cO
pti
mal
BW
Qu
ad
rati
cP
lace
bo
DA
0.02
1-0
.006
0.00
40.
001
(0.0
35)
(0.0
13)
(0.0
08)
(0.0
14)
IFP
-0.0
260.
006
-0.0
03-0
.012
(0.0
38)
(0.0
22)
(0.0
13)
(0.0
34)
Oth
ers
0.00
70.
002
0.00
10.
009
(0.0
14)
(0.0
09)
(0.0
06)
(0.0
07)
AN
CM
ajo
rity
0.0
17
0.0
04
0.0
33
0.0
24
-0.0
23
(0.0
35)
(0.0
35)
(0.0
32)
(0.0
41)
(0.0
23)
Ban
dw
idth
11
11
0.2
61
0.2
91
1P
olyn
omia
lD
egre
e2
22
21
21
21
Mu
nic
ipal
FE
Yes
Yes
Yes
No
No
No
No
No
No
N46
846
846
823
3267
470
333
474
233
Sta
nd
ard
erro
rsin
par
enth
eses
.**
*p<
0.01
,**
p<
0.05
,*
p<
0.1.
Th
efi
rst
thre
eco
lum
ns
refe
rto
the
esti
mat
esof
IVre
gres
sion
sw
her
eea
chp
art
y’s
seats
hare
isin
stru
men
ted
by
seats
hare
shif
tsar
oun
da
thre
shol
din
clos
eel
ecti
ons,
asd
escr
ibed
inF
reie
r&
Od
end
ah
l(2
012).
Th
ein
stru
men
tis
base
don
1000
per
tub
ati
on
sof
the
vote
vect
orof
each
par
ty,u
sin
gth
ree
diff
eren
tva
rian
ces
of
the
vote
cou
nt.
Th
ese
regre
ssio
ns
incl
ud
ea
contr
olfo
rth
em
un
icip
al-
cou
nci
lsi
ze,
du
mm
ies
for
each
par
tyif
the
par
tyd
idn
otre
ceiv
eany
vote
s,an
da
year
du
mm
y.T
he
nex
ttw
oco
lum
ns
dis
pla
yth
ere
sult
sof
anR
Des
tim
atio
nu
sin
gth
eA
NC
’sse
atsh
are
asru
nn
ing
vari
ab
le,
wh
ile
the
last
two
colu
mn
su
seth
evo
tesh
are
as
run
nin
gva
riab
le.
Th
eb
and
wid
ths
are
opti
mal
assp
ecifi
edby
Imb
ens
&K
aly
an
ara
man
(2009).
All
data
isu
tili
zed
inth
ees
tim
ati
on
of
the
qu
adra
tic
spec
ifica
tion
.T
he
outc
ome
vari
able
sar
esh
ares
of
op
erati
ng
reve
nu
e,op
erati
ng
exp
end
itu
rean
dca
pit
al
exp
end
itu
re.
Th
eb
ud
get
dat
ais
the
actu
alou
tcom
eof
the
2004
/200
5an
dth
e2010/2011
bu
dget
s.T
he
firs
tp
lace
bo
colu
mn
run
san
IVre
gre
ssio
nw
ithk=
1%
wit
hel
ecti
onre
sult
sfr
om20
06on
outc
ome
from
2004/2005.
Th
ese
con
dp
lace
bo
colu
mn
use
san
RD
Dw
ith
ali
nea
rre
gres
sion
wit
hfu
llb
and
wid
thon
the
seat
shar
e,u
sin
g20
06
elec
tion
resu
lts
on
2004/2005
ou
tcom
e.W
ew
ould
not
exp
ect
sign
ifica
nt
resu
lts
inth
ese
two
colu
mn
s.
34

Tab
le11:
EF
FE
CT
SO
FA
NC
PO
WE
RO
NT
HE
SH
AR
EW
ITH
EL
EC
TR
ICIT
Y
RD
DIV
Sea
tsh
are
Vote
share
k=
1%
k=
2%
k=
5%
Pla
ceb
oO
pti
mal
BW
Qu
ad
rati
cO
pti
mal
BW
Qu
ad
rati
cP
lace
bo
DA
All
-0.0
040.
006
-0.0
00-0
.007
(0.0
23)
(0.0
20)
(0.0
07)
(0.0
20)
Bla
ck-0
.003
0.00
50.
005
-0.0
00
(0.0
23)
(0.0
20)
(0.0
08)
(0.0
20)
IFP
All
-0.0
90*
-0.0
340.
039*
*-0
.056
(0.0
54)
(0.0
26)
(0.0
15)
(0.0
46)
Bla
ck-0
.089
-0.0
330.
039*
*-.
054
(0.0
55)
(0.0
26)
(0.0
16)
(0.0
47)
Oth
ers
All
0.00
70.
013
0.00
20.
008
(0.0
11)
(0.0
10)
(0.0
07)
(0.0
10)
Bla
ck0.
005
0.01
30.
004
0.003
(0.0
12)
(0.0
10)
(0.0
07)
(0.0
10)
AN
CM
ajo
rity
All
-0.0
81
-0.1
45
-0.1
61**
-0.1
63**
-0.0
44
(0.0
77)
(0.1
02)
(0.0
74)
(0.0
70)
(0.0
71)
Bla
ck-0
.011
-0.0
71
-0.0
82
-0.1
02
0.0
24
(0.0
74)
(0.0
94)
(0.0
76)
(0.0
70)
(0.0
56)
Ban
dw
idth
11
11
0.2
9/0.2
71
0.2
5/0.2
51
1P
olyn
omia
lD
egre
e2
22
21
21
21
N23
423
423
423
1149/134
234
123/121
234
231
Sta
nd
ard
erro
rsin
par
enth
eses
.**
*p<
0.01
,**
p<
0.05
,*
p<
0.1.
Th
efi
rst
thre
eco
lum
ns
refe
rto
the
esti
mat
esof
IVre
gres
sion
sw
her
eea
chp
art
y’s
seats
hare
isin
stru
men
ted
by
seats
hare
shif
tsar
oun
da
thre
shol
din
clos
eel
ecti
ons,
asd
escr
ibed
inF
reie
r&
Od
end
ah
l(2
012).
Th
ein
stru
men
tis
base
don
1000
per
tub
ati
on
sof
the
vote
vect
orof
each
par
ty,u
sin
gth
ree
diff
eren
tva
rian
ces
of
the
vote
cou
nt.
Th
ese
regre
ssio
ns
incl
ud
ea
contr
olfo
rth
em
un
icip
al-
cou
nci
lsi
ze,
du
mm
ies
for
each
par
tyif
the
par
tyd
idn
otre
ceiv
eany
vote
s,an
da
year
du
mm
y.T
he
nex
ttw
oco
lum
ns
dis
pla
yth
ere
sult
sof
anR
Des
tim
atio
nu
sin
gth
eA
NC
’sse
atsh
are
asru
nn
ing
vari
ab
le,
wh
ile
the
last
two
colu
mn
su
seth
evo
tesh
are
as
run
nin
gva
riab
le.
Th
eb
and
wid
ths
are
opti
mal
assp
ecifi
edby
Imb
ens
&K
aly
an
ara
man
(2009).
All
data
isu
tili
zed
inth
ees
tim
ati
on
of
the
qu
adra
tic
spec
ifica
tion
.T
he
outc
ome
vari
able
Ele
ctri
city
isa
com
bin
ati
on
of
the
share
sw
ho
are
usi
ng
elec
tric
ity
for
cookin
g,
hea
tin
gan
dli
ghti
ng.
Th
efi
rst
pla
ceb
oco
lum
nru
ns
anIV
regre
ssio
nw
ithk=
1%
wit
hel
ecti
on
resu
lts
from
2006
on
ou
tcom
efr
om
2001
.T
he
seco
nd
pla
ceb
oco
lum
nu
ses
anR
DD
wit
ha
lin
ear
regre
ssio
nw
ith
full
ban
dw
idth
on
the
seats
hare
,u
sin
g2006
elec
tion
resu
lts
on20
01ou
tcom
e.W
ew
ould
not
exp
ect
sign
ifica
nt
resu
lts
inth
ese
two
colu
mn
s.
35

Tab
le12
:E
FF
EC
TS
OF
AN
CP
OW
ER
ON
TH
ES
HA
RE
WIT
HP
IPE
DW
AT
ER
RD
DIV
Sea
tsh
are
Vote
share
k=
1%
k=
2%
k=
5%
Pla
ceb
oO
pti
mal
BW
Qu
ad
rati
cO
pti
mal
BW
Qu
ad
rati
cP
lace
bo
DA
All
-0.0
250.
012
0.00
8-0
.018
(0.0
20)
(0.0
18)
(0.0
08)
(0.0
17)
Bla
ck-0
.025
0.00
70.
013
-0.0
11
(0.0
20)
(0.0
18)
(0.0
08)
(0.0
15)
IFP
All
0.01
7-0
.026
0.04
0**
0.00
7(0
.047
)(0
.023
)(0
.017
)(0
.040)
Bla
ck0.
023
-0.0
240.
036*
*0.
010
(0.0
48)
(0.0
23)
(0.0
17)
(0.0
36)
Oth
ers
All
0.00
90.
012
0.00
50.
005
(0.0
10)
(0.0
09)
(0.0
07)
(0.0
09)
Bla
ck0.
003
0.00
40.
012
0.002
(0.0
10)
(0.0
09)
(0.0
07)
(0.0
08)
AN
CM
ajo
rity
All
-0.1
57*
-0.2
08
-0.2
63***
-0.2
34***
-0.0
52
(0.0
89)
(0.1
26)
(0.0
94)
(0.0
88)
(0.0
70)
Bla
ck-0
.069
-0.1
20
-0.1
35*
-0.1
23
0.0
10
(0.0
77)
(0.0
96)
(0.0
77)
(0.0
75)
(0.0
44)
Ban
dw
idth
11
11
0.3
0/0.2
81
0.2
6/0.2
61
1P
olyn
omia
lD
egre
e2
22
21
21
21
N23
423
423
423
1162/142
234
129/132
234
Sta
nd
ard
erro
rsin
par
enth
eses
.**
*p<
0.01
,**
p<
0.05
,*
p<
0.1.
Th
efi
rst
thre
eco
lum
ns
refe
rto
the
esti
mat
esof
IVre
gres
sion
sw
her
eea
chp
art
y’s
seats
hare
isin
stru
men
ted
by
seats
hare
shif
tsar
oun
da
thre
shol
din
clos
eel
ecti
ons,
asd
escr
ibed
inF
reie
r&
Od
end
ah
l(2
012).
Th
ein
stru
men
tis
base
don
1000
per
tub
ati
on
sof
the
vote
vect
orof
each
par
ty,u
sin
gth
ree
diff
eren
tva
rian
ces
of
the
vote
cou
nt.
Th
ese
regre
ssio
ns
incl
ud
ea
contr
olfo
rth
em
un
icip
al-
cou
nci
lsi
ze,
du
mm
ies
for
each
par
tyif
the
par
tyd
idn
otre
ceiv
eany
vote
s,an
da
year
du
mm
y.T
he
nex
ttw
oco
lum
ns
dis
pla
yth
ere
sult
sof
anR
Des
tim
atio
nu
sin
gth
eA
NC
’sse
atsh
are
asru
nn
ing
vari
ab
le,
wh
ile
the
last
two
colu
mn
su
seth
evo
tesh
are
as
run
nin
gva
riab
le.
Th
eb
and
wid
ths
are
opti
mal
assp
ecifi
edby
Imb
ens
&K
aly
an
ara
man
(2009).
All
data
isu
tili
zed
inth
ees
tim
ati
on
of
the
qu
adra
tic
spec
ifica
tion
.T
he
firs
tp
lace
bo
colu
mn
run
san
IVre
gre
ssio
nw
ithk=
1%
wit
hel
ecti
on
resu
lts
from
2006
on
ou
tcom
efr
om20
01.
Th
ese
con
dp
lace
bo
colu
mn
use
san
RD
Dw
ith
ali
nea
rre
gre
ssio
nw
ith
full
ban
dw
idth
on
the
seats
hare
,u
sin
g2006
elec
tion
resu
lts
on20
01ou
tcom
e.W
ew
ould
not
exp
ect
sign
ifica
nt
resu
lts
inth
ese
two
colu
mn
s.
36

Tab
le13:
EF
FE
CT
SO
FA
NC
PO
WE
RO
NU
NE
MP
LO
YM
EN
T
RD
DIV
Sea
tsh
are
Vote
share
k=
1%
k=
2%
k=
5%
Pla
ceb
oO
pti
mal
BW
Qu
ad
rati
cO
pti
mal
BW
Qu
ad
rati
cP
lace
bo
DA
All
-0.0
00-0
.009
-0.0
020.
005
(0.0
27)
(0.0
25)
(0.0
11)
(0.0
24)
Bla
ck-0
.005
-0.0
07-0
.012
0.006
(0.0
35)
(0.0
34)
(0.0
15)
(0.0
21)
IFP
All
0.06
6-0
.009
0.01
20.
095*
(0.0
64)
(0.0
33)
(0.0
23)
(0.0
57)
Bla
ck0.
102
-0.0
170.
017
0.056
(0.0
84)
(0.0
44)
(0.0
30)
(0.0
49)
Oth
ers
All
-0.0
18-0
.012
-0.0
12-0
.030**
(0.0
13)
(0.0
13)
(0.0
10)
(0.0
13)
Bla
ck-0
.020
-0.0
11-0
.020
-0.0
27**
(0.0
18)
(0.0
17)
(0.0
13)
(0.0
11)
AN
CM
ajo
rity
All
0.0
40
0.0
42
0.1
17
0.1
04
0.0
46
(0.0
67)
(0.0
93)
(0.0
73)
(0.0
66)
(0.0
55)
Bla
ck-0
.038
-0.0
29
0.0
59
0.0
66
-0.0
30
(0.0
83)
(0.0
98)
(0.0
87)
(0.0
76)
(0.0
51)
Ban
dw
idth
11
11
0.3
0/0.2
81
0.2
4/0.2
31
1P
olyn
omia
lD
egre
e2
22
21
21
21
N23
423
423
422
9161/139
234
119/
112
234
230
Sta
nd
ard
erro
rsin
par
enth
eses
.**
*p<
0.01
,**
p<
0.05
,*
p<
0.1.
Th
efi
rst
thre
eco
lum
ns
refe
rto
the
esti
mat
esof
IVre
gres
sion
sw
her
eea
chpart
y’s
seats
hare
isin
stru
men
ted
by
seats
hare
shif
tsar
oun
da
thre
shol
din
clos
eel
ecti
ons,
asd
escr
ibed
inF
reie
r&
Od
end
ah
l(2
012).
Th
ein
stru
men
tis
base
don
1000
per
tub
ati
on
sof
the
vote
vect
orof
each
par
ty,
usi
ng
thre
ed
iffer
ent
vari
ance
sof
the
vote
cou
nt.
Th
ese
regre
ssio
ns
incl
ud
ea
contr
olfo
rth
em
un
icip
al-
cou
nci
lsi
ze,
du
mm
ies
for
each
par
tyif
the
par
tyd
idn
otre
ceiv
eany
vote
s,an
da
year
du
mm
y.T
he
nex
ttw
oco
lum
ns
dis
pla
yth
ere
sult
sof
anR
Des
tim
atio
nu
sin
gth
eA
NC
’sse
atsh
are
asru
nn
ing
vari
ab
le,
wh
ile
the
last
two
colu
mn
su
seth
evo
tesh
are
as
run
nin
gva
riab
le.
Th
eb
and
wid
ths
are
opti
mal
assp
ecifi
edby
Imb
ens
&K
aly
an
ara
man
(2009).
All
data
isu
tili
zed
inth
ees
tim
ati
on
of
the
qu
adra
tic
spec
ifica
tion
.T
he
firs
tp
lace
bo
colu
mn
run
san
IVre
gre
ssio
nw
ithk=
1%
wit
hel
ecti
on
resu
lts
from
2006
on
ou
tcom
efr
om20
01.
Th
ese
con
dp
lace
bo
colu
mn
use
san
RD
Dw
ith
ali
nea
rre
gre
ssio
nw
ith
full
ban
dw
idth
on
the
seats
hare
,u
sin
g2006
elec
tion
resu
lts
on20
01ou
tcom
e.W
ew
ould
not
exp
ect
sign
ifica
nt
resu
lts
inth
ese
two
colu
mn
s.
37
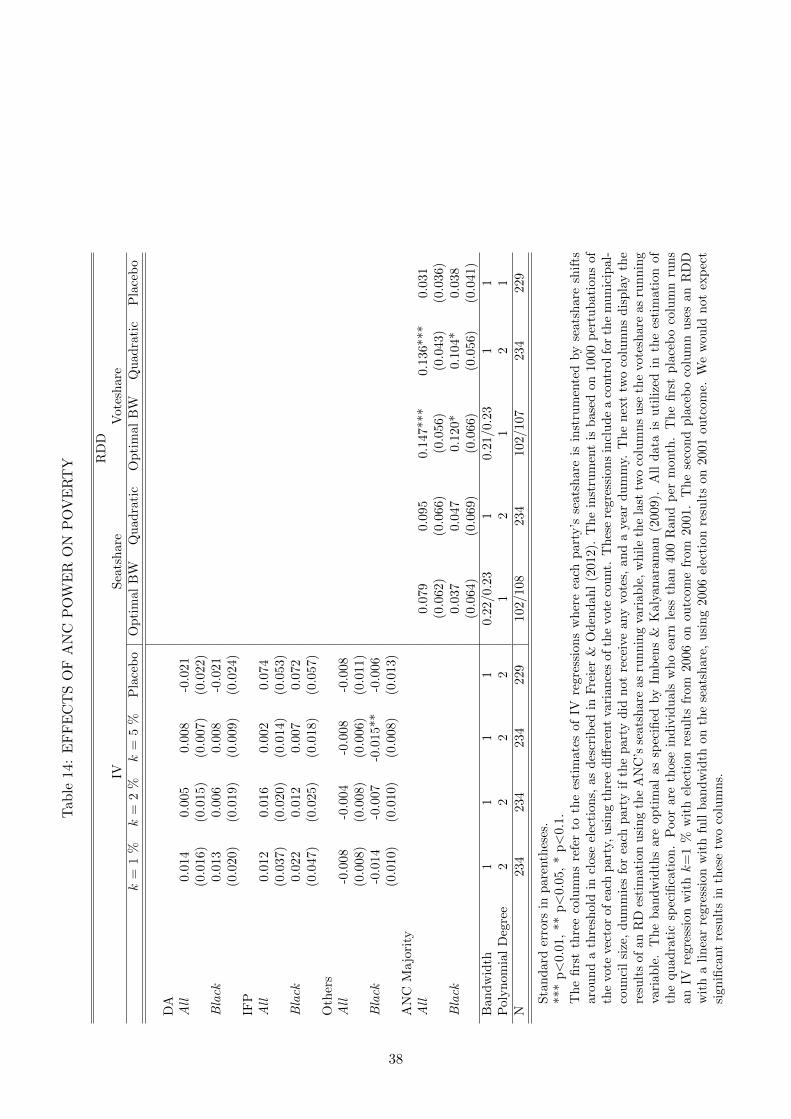
Tab
le14:
EF
FE
CT
SO
FA
NC
PO
WE
RO
NP
OV
ER
TY R
DD
IVS
eats
hare
Vote
share
k=
1%
k=
2%
k=
5%
Pla
ceb
oO
pti
mal
BW
Qu
ad
rati
cO
pti
mal
BW
Qu
ad
rati
cP
lace
bo
DA
All
0.01
40.
005
0.00
8-0
.021
(0.0
16)
(0.0
15)
(0.0
07)
(0.0
22)
Bla
ck0.
013
0.00
60.
008
-0.0
21
(0.0
20)
(0.0
19)
(0.0
09)
(0.0
24)
IFP
All
0.01
20.
016
0.00
20.
074
(0.0
37)
(0.0
20)
(0.0
14)
(0.0
53)
Bla
ck0.
022
0.01
20.
007
0.072
(0.0
47)
(0.0
25)
(0.0
18)
(0.0
57)
Oth
ers
All
-0.0
08-0
.004
-0.0
08-0
.008
(0.0
08)
(0.0
08)
(0.0
06)
(0.0
11)
Bla
ck-0
.014
-0.0
07-0
.015
**-0
.006
(0.0
10)
(0.0
10)
(0.0
08)
(0.0
13)
AN
CM
ajo
rity
All
0.0
79
0.0
95
0.1
47***
0.1
36***
0.0
31
(0.0
62)
(0.0
66)
(0.0
56)
(0.0
43)
(0.0
36)
Bla
ck0.0
37
0.0
47
0.1
20*
0.1
04*
0.0
38
(0.0
64)
(0.0
69)
(0.0
66)
(0.0
56)
(0.0
41)
Ban
dw
idth
11
11
0.2
2/0.2
31
0.2
1/0.2
31
1P
olyn
omia
lD
egre
e2
22
21
21
21
N23
423
423
422
9102/108
234
102/107
234
229
Sta
nd
ard
erro
rsin
par
enth
eses
.**
*p<
0.01
,**
p<
0.05
,*
p<
0.1.
Th
efi
rst
thre
eco
lum
ns
refe
rto
the
esti
mat
esof
IVre
gres
sion
sw
her
eea
chp
art
y’s
seats
hare
isin
stru
men
ted
by
seats
hare
shif
tsar
oun
da
thre
shol
din
clos
eel
ecti
ons,
asd
escr
ibed
inF
reie
r&
Od
end
ah
l(2
012).
Th
ein
stru
men
tis
base
don
1000
per
tub
ati
on
sof
the
vote
vect
orof
each
par
ty,u
sin
gth
ree
diff
eren
tva
rian
ces
of
the
vote
cou
nt.
Th
ese
regre
ssio
ns
incl
ud
ea
contr
olfo
rth
em
un
icip
al-
cou
nci
lsi
ze,
du
mm
ies
for
each
par
tyif
the
par
tyd
idn
otre
ceiv
eany
vote
s,an
da
year
du
mm
y.T
he
nex
ttw
oco
lum
ns
dis
pla
yth
ere
sult
sof
anR
Des
tim
atio
nu
sin
gth
eA
NC
’sse
atsh
are
asru
nn
ing
vari
ab
le,
wh
ile
the
last
two
colu
mn
su
seth
evo
tesh
are
as
run
nin
gva
riab
le.
Th
eb
and
wid
ths
are
opti
mal
assp
ecifi
edby
Imb
ens
&K
aly
an
ara
man
(2009).
All
data
isu
tili
zed
inth
ees
tim
ati
on
of
the
qu
adra
tic
spec
ifica
tion
.P
oor
are
thos
ein
div
idu
als
wh
oea
rnle
ssth
an
400
Ran
dp
erm
onth
.T
he
firs
tp
lace
bo
colu
mn
run
san
IVre
gres
sion
wit
hk=
1%
wit
hel
ecti
onre
sult
sfr
om2006
on
ou
tcom
efr
om
2001.
Th
ese
con
dp
lace
bo
colu
mn
use
san
RD
Dw
ith
ali
nea
rre
gres
sion
wit
hfu
llb
and
wid
thon
the
seat
share
,u
sin
g2006
elec
tion
resu
lts
on
2001
ou
tcom
e.W
ew
ou
ldn
ot
exp
ect
sign
ifica
nt
resu
lts
inth
ese
two
colu
mn
s.
38

Figure 1: THE RD DESIGN: MUNICIPAL BUDGET
(a) PROPERTY RATES (b) SERVICE CHARGES
(c) GOVERNMENT GRANTS (d) COUNCILLOR REMUNERATION
(e) EMPLOYEE COSTS (f) REPAIRS
(g) WATER EXPENDITURE (h) ELECTRICITY EXPENDITURE
39
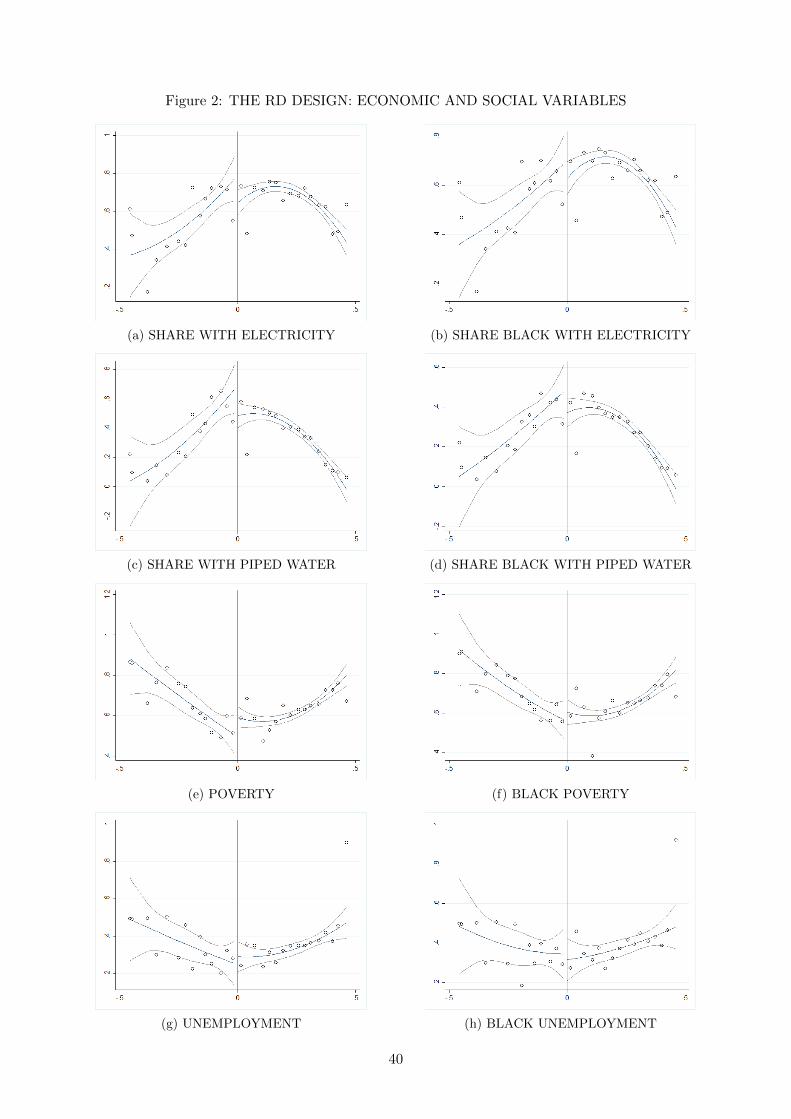
Figure 2: THE RD DESIGN: ECONOMIC AND SOCIAL VARIABLES
(a) SHARE WITH ELECTRICITY (b) SHARE BLACK WITH ELECTRICITY
(c) SHARE WITH PIPED WATER (d) SHARE BLACK WITH PIPED WATER
(e) POVERTY (f) BLACK POVERTY
(g) UNEMPLOYMENT (h) BLACK UNEMPLOYMENT
40

(a) DENSITY OF ANC VOTE SHARE
(b) RELATIONSHIP BETWEEN SEAT- AND VOTE SHARE
(c) CHOICE OF ECONOMIC OUTCOME DATA
41
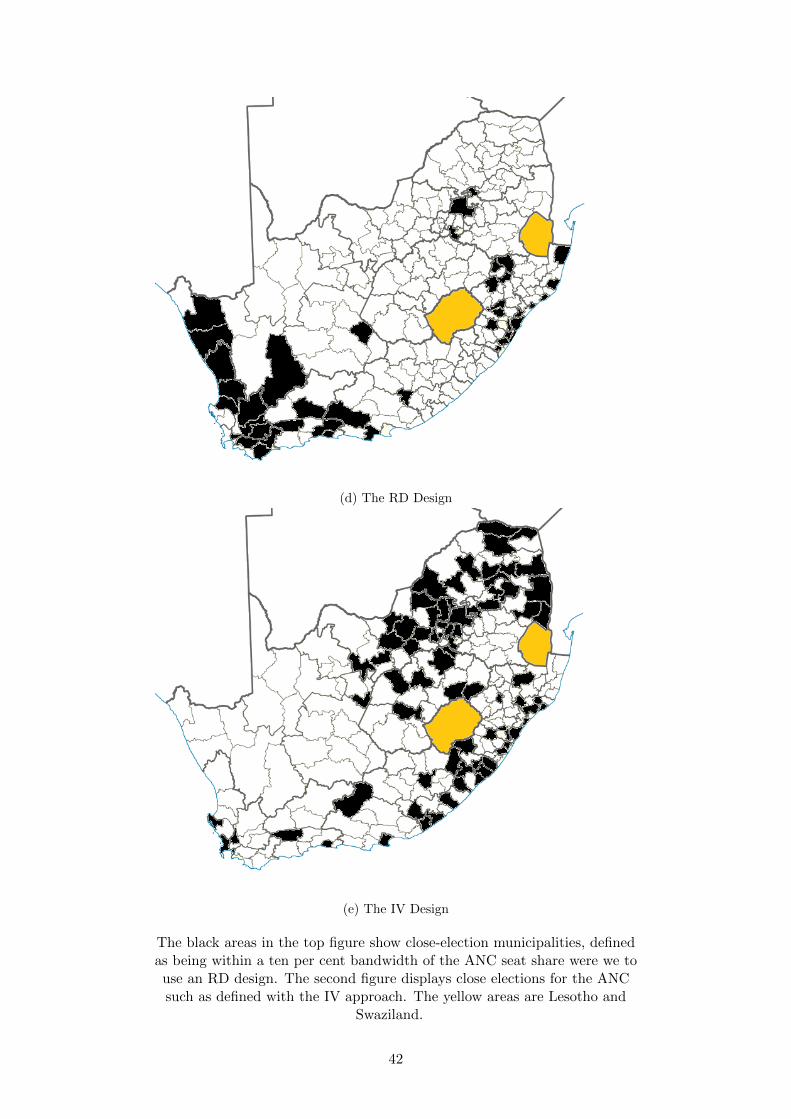
(d) The RD Design
(e) The IV Design
The black areas in the top figure show close-election municipalities, definedas being within a ten per cent bandwidth of the ANC seat share were we touse an RD design. The second figure displays close elections for the ANCsuch as defined with the IV approach. The yellow areas are Lesotho and
Swaziland.
42
WORKING PAPERS
Uppsala Center for Fiscal Studies
Editor: Håkan Selin
2009:1 Sören Blomquist and Håkan Selin, Hourly Wage Rate and Taxable Labor
Income Responsiveness to Changes in Marginal Tax Rates. 31 pp.
2009:2 Luca Micheletto, Optimal nonlinear redistributive taxation and public good
provision in an economy with Veblen effects. 26 pp.
2009:3 Håkan Selin, The Rise in Female Employment and the Role of Tax
Incentives. An Empirical Analysis of the Swedish Individual Tax Reform of
1971. 38 pp.
2009:4 Håkan Selin, Marginal tax rates and tax-favoured pension savings of the self-
employed Evidence from Sweden. 32 pp.
2009:5 Tobias Lindhe and Jan Södersten, Dividend taxation, share repurchases and
the equity trap. 27 pp.
2009:6 Che-Yan Liang, Nonparametric Structural Estimation of Labor Supply in
the Presence of Censoring. 48 pp.
2009:7 Sören Blomquist, Vidar Christiansen and Luca Micheletto, Public Provision of
Private Goods and Nondistortionary Marginal Tax Rates: Some further
Results. 42 pp.
2009:8 Laurent Simula and Alain Trannoy, Optimal Income Tax under the Threat of
Migration by Top-Income Earners. 26 pp.
2009:9 Laurent Simula and Alain Trannoy, Shall We Keep Highly Skilled at Home?
The Optimal Income Tax Perspective. 26 pp.
2009:10 Michael Neugart and Henry Ohlsson, Economic incentives and the timing of
births: Evidence from the German parental benefit reform 2007, 21 pp.
2009:11 Laurent Simula, Optimal Nonlinear Income Tax and Nonlinear Pricing:
Optimality Conditions and Comparative Static Properties, 25 pp.
2009:12 Ali Sina Onder and Herwig Schlunk, Elderly Migration, State Taxes, and What
They Reveal, 26 pp.
2009:13 Ohlsson, Henry, The legacy of the Swedish gift and inheritance tax, 1884-2004,
26 pp.
2009:14 Onder, Ali Sina, Capital Tax Competition When Monetary Competition is
Present, 29 pp.
2010:1 Sören Blomquist and Laurent Simula, Marginal Deadweight Loss when
the Income Tax is Nonlinear. 21 pp.
2010:2 Marcus Eliason and Henry Ohlsson, Timing of death and the repeal of the
Swedish inheritance tax. 29 pp.
2010:3 Mikael Elinder, Oscar Erixson and Henry Ohlsson, The Effect of Inheritance
Receipt on Labor and Capital Income: Evidence from Swedish Panel Data. 28
pp.
2010:4 Jan Södersten and Tobias Lindhe, The Norwegian Shareholder Tax
Reconsidered. 21 pp.
2010:5 Anna Persson and Ulrika Vikman, Dynamic effects of mandatory activation
of welfare participants. 37 pp.
2010:6 Ulrika Vikman, Does Providing Childcare to Unemployed Affect
Unemployment Duration? 43 pp.
2010:7 Per Engström, Bling Bling Taxation and the Fiscal Virtues of Hip Hop. 12 pp.
2010:8 Niclas Berggren and Mikael Elinder, Is tolerance good or bad for growth? 34 pp.
2010:9 Heléne Lundqvist, Matz Dahlberg and Eva Mörk, Stimulating Local Public
Employment: Do General Grants Work? 35pp.
2010:10 Marcus Jacob and Martin Jacob, Taxation, Dividends, and Share Repurchases:
Taking Evidence Global. 42 pp.
2010:11 Thomas Aronsson and Sören Blomquist, The Standard Deviation of Life-
Length, Retirement Incentives, and Optimal Pension Design. 24 pp.
2010:12 Spencer Bastani, Sören Blomquist and Luca Micheletto, The Welfare Gains of
Age Related Optimal Income Taxation. 48 pp.
2010:13 Adrian Adermon and Che-Yuan Liang, Piracy, Music, and Movies: A Natural
Experiment. 23 pp.
2010:14 Spencer Bastani, Sören Blomquist and Luca Micheletto, Public Provision of
Private Goods, Tagging and Optimal Income Taxation with Heterogeneity in
Needs. 47 pp.
2010:15 Mattias Nordin, Do voters vote in line with their policy preferences?
The role of information. 33 pp.
2011:1 Matz Dahlberg, Karin Edmark and Heléne Lundqvist, Ethnic Diversity and
Preferences for Redistribution. 43 pp.
2011:2 Tax Policy and Employment: How Does the Swedish System Fare? Jukka
Pirttilä and Håkan Selin. 73 pp.

2011:3 Alessandra Casarico, Luca Micheletto and Alessandro Sommacal,
Intergenerational transmission of skills during childhood and optimal public
policy. 48 pp.
2011:4 Jesper Roine and Daniel Waldenström, On the Role of Capital Gains in Swedish
Income Inequality. 32 pp.
2011:5 Matz Dahlberg, Eva Mörk and Pilar Sorribas-Navarro, Do Politicians’
Preferences Matter for Voters’ Voting Decisions?
2011:6 Sören Blomquist, Vidar Christiansen and Luca Micheletto, Public provision of
private goods, self-selection and income tax avoidance. 27 pp.
2011:7 Bas Jacobs, The Marginal Cost of Public Funds is One. 36 pp.
2011:8 Håkan Selin, What happens to the husband’s retirement decision when the
wife’s retirement incentives change? 37 pp.
2011:9 Martin Jacob, Tax Regimes and Capital Gains Realizations. 42 pp.
2011:10 Katarina Nordblom and Jovan Zamac, Endogenous Norm Formation Over the
Life Cycle – The Case of Tax Evasion. 30 pp.
2011:11 Per Engström, Katarina Nordblom, Henry Ohlsson and Annika Persson, Loss
evasion and tax aversion. 43 pp.
2011:12 Spencer Bastani and Håkan Selin, Bunching and Non-Bunching at Kink Points
of the Swedish Tax Schedule. 39 pp.
2011:13 Svetlana Pashchenko and Ponpoje Porapakkarm, Welfare costs of
reclassification risk in the health insurance market. 41 pp.
2011:14 Hans A Holter, Accounting for Cross-Country Differences in Intergenerational
Earnings Persistence: The Impact of Taxation and Public Education
Expenditure. 56 pp.
2012:1 Stefan Hochguertel and Henry Ohlsson, Who is at the top? Wealth mobility over
the life cycle. 52 pp.
2012:2 Karin Edmark, Che-Yuan Liang, Eva Mörk and Håkan Selin, Evaluation of the
Swedish earned income tax credit. 39 pp.
2012:3 Martin Jacob and Jan Södersten, Mitigating shareholder taxation in small open
economies? 15 pp.
2012:6 Spencer Bastani, Gender-Based and Couple-Based Taxation. 55 pp.
2012:7 Indraneel Chakraborty, Hans A. Holter and Serhiy Stepanchuk, Marriage
Stability, Taxation and Aggregate Labor Supply in the U.S. vs. Europe. 64 pp.

2012:8 Niklas Bengtsson, Bertil Holmlund and Daniel Waldenström, Lifetime versus
Annual Tax Progressivity: Sweden, 1968–2009. 56 pp.
2012:9 Firouz Gahvari and Luca Micheletto, The Friedman rule in a model with
nonlinear taxation and income misreporting. 36 pp.
2012:10 Che-Yuan Liang and Mattias Nordin, The Internet, News Consumption, and
Political Attitudes. 29 pp.
2012:11 Gunnar Du Rietz, Magnus Henrekson and Daniel Waldenström, The Swedish
Inheritance and Gift Taxation, 1885–2004. 50 pp.
2012:12 Thomas Aronsson, Luca Micheletto and Tomas Sjögren, Public Goods in a
Voluntary Federal Union: Implications of a Participation Constraint. 7 pp.
2013:1 Markus Jäntti, Jukka Pirttilä and Håkan Selin, Estimating labour supply
elasticities based on cross-country micro data: A bridge between micro and
macro estimates? 35pp.
2013:2 Matz Dahlberg, Karin Edmark and Heléne Lundqvist, Ethnic Diversity and
Preferences for Redistribution: Reply. 23 pp.
2013:3 Ali Sina Önder and Marko Terviö, Is Economics a House Divided? Analysis of
Citation Networks. 20 pp.
2013:4 Che-Yuan Liang, Optimal Inequality behind the Veil of Ignorance. 26 pp.
2013:5 Spencer Bastani, Sören Blomquist and Jukka Pirttilä, How Should Commodities
Be Taxed? A Counterargument to the Recommendation in the Mirrlees Review.
26 pp.
2013:6 Tobias Laun and Johanna Wallenius, Social Insurance and Retirement: A Cross-
Country Perspective. 37 pp.
2013:7 Johannes Hagen, A History of the Swedish Pension System. 140 pp.
2013:8 Etienne Lehmann, Laurent Simula and Alain Trannoy, Tax Me If You Can!
Optimal Nonlinear Income Tax between Competing Governments. 29 pp
2013:9 Tobias Lindhe and Jan Södersten, Distortive Effects of Dividend Taxation.
21 pp.
2013:10 Jonas Poulsen, After Apartheid: The Effects of ANC Power. 42 pp.